Embed Size (px)
Citation preview

University of Otago Digital Thesis
Copyright Statement
The digital copy of this thesis is protected by the Copyright Act 1994 (New Zealand).
This thesis may be consulted by you, provided you comply with the provisions of the
Act and the following conditions of use:
You will use the copy only for the purposes of research or private study.
You will recognise the author's right to be identified as the author of the thesis and
due acknowledgment will be made to the author where appropriate.
You will obtain the author's permission before publishing any material from the
thesis.

Characteristics and functional properties of green banana flour:
An opportunity for functional bread production
A Thesis submitted for the Degree of
Doctor of Philosophy in Food Science
At
University of Otago, New Zealand
By
Amir Amini Khoozani
August 2020

I
ماخوانواده به می تقد
داشت خواهم و دارم داشتم، چه هر که
1نهاست آ وجود لطف به
1“To my Family; Whom everything I had, have and will have is because of them”

II
Declaration
Most parts of this thesis have already been published in international peer review
journals.
Publications
1. AMINI KHOOZANI, A., BIRCH, J. & EL-DIN AHMED BEKHIT, A. 2019.
Resistant Starch Preparation Methods. In: MELTON, L., SHAHIDI, F. &
VARELIS, P. (eds.) Encyclopedia of Food Chemistry. Oxford: Academic Press.
2. AMINI KHOOZANI, A., BIRCH, J. & BEKHIT, A. E.-D. A. 2019. Production,
application and health effects of banana pulp and peel flour in the food
industry. Journal of Food Science and Technology, 56, 548-559.
3. AMINI KHOOZANI, A., BEKHIT, A. E.-D. A. & BIRCH, J. 2019. Effects of
different drying conditions on the starch content, thermal properties and some
of the physicochemical parameters of whole green banana flour. International
Journal of Biological Macromolecules, 130, 938-946.
4. AMINI KHOOZANI, A., BIRCH, J. & BEKHIT, A. E.-D. A. 2020. Textural
properties and characteristics of whole green banana flour produced by air-
oven and freeze-drying processing. Journal of Food Measurement and
Characterization, 14, 1533–1542.
5. AMINI KHOOZANI, A., KEBEDE, B., BIRCH, J. & EL-DIN AHMED BEKHIT,
A. 2020. The effect of bread fortification with whole green banana flour on its
physicochemical, nutritional and in vitro digestibility. Foods, 9.

III
6. AMINI KHOOZANI, A., KEBEDE, B. & EL-DIN AHMED BEKHIT, A. 2020.
Rheological, textural and structural changes in dough and bread partially
substituted with whole green banana flour. LWT - Food Science and Technology,
126, 109252.
Oral presentations
1. The effect of green banana flour fortification on bread quality. Annual Research
Day University of Otago, New Zealand (2019).
2. The effect of freeze drying and air oven drying on rheological, structural
properties and starch content of whole green banana flour. Student research
symposium. University of Otago, New Zealand (2019).
3. Green banana bread: the story of a functional food. Three-minute thesis
presentation. University of Otago, New Zealand (2019).
Awards
- University of Otago full PhD scholarship

IV
Abstract
Characteristics and functional properties of green banana flour:
An opportunity for functional bread production
By
Amir Amini Khoozani
The demand for functional food products has led to an increased interest in nutrients
such as minerals, vitamins, bioactive compounds, fibre and prebiotics to be present in
food formulations. Amongst the prebiotics, Resistant starch (RS) has gained more
attention in recent years, due to its acknowledged health benefits such as prevention
and control of colon cancer, diabetes, and obesity. Banana, the world’s most favourite
fruit, is one of the richest sources of RS at early stages of ripeness, when it is green
(unripe). According to some estimates, more than 100 billion bananas are consumed
globally each year, with an annual per capita consumption of 20 kg.
Green banana pulp is a rich source of essential phytonutrients, phenolic compounds,
vitamin B group, ascorbic acid and tocopherols, while the green banana peel is a rich
source of minerals, bioactive compounds and dietary fibre (DF) such as pectin,
cellulose, hemicelluloses and lignin. Considering the nutritional value of both pulp
and peel of green bananas, the production of green banana flour (GBF), which can be

V
obtained by proper drying techniques, provides a way to preserve the nutritional
benefits and increase the shelf-life of banana nutrients.
White bread is the most popular bread type in the world, however, there is a growing
research on fortifying bread with an array of different DF and functional compounds
to take advantage of bread as a carrier of health benefiting compounds. Very few
studies available that considered the effect of the GBF on technological properties,
nutritional aspects and volatile fingerprint.
The physicochemical and thermal properties of GBF obtained from air oven drying
(ODF) at three temperatures (50, 80 and 110 °C) and freeze-drying (FDF) were
compared to white wheat flour (WF). Lightness and yellowness were negatively
affected by the oven temperature increment. The FDF samples exhibited higher a* and
L* values and had the closest browning index to WF (P-value < 0.05). Also, the ODF50
samples had the highest emulsion activity, whereas FDF had the highest emulsion
stability (P-value < 0.05). The oil holding and water holding capacities of the FDF
samples were significantly higher than all other samples (P-value < 0.05). A higher RS
content was found in the FDF (46.72%) and ODF50 (44.58%) samples. Oven drying
significantly increased the gelatinization temperature drastically for all GBF samples.
Results from particle size separation indicated that drying at 50 °C generated smaller
flour particles compared to ODF80 and ODF110 treatments. Freeze-dried flour
samples had significantly higher bulk density, viscosity and firmness compared to the
oven-dried samples and the reference sample, WF (P-value < 0.05), but the

VI
cohesiveness, consistency, compressibility and Hausner Ratio were not different from
the ODF50 (P-value > 0.05). While the ODF110 presented the highest pasting
temperature (81.23 °C) and breakdown viscosity (7118.67 cp) amongst the GBF
samples, ODF50 were the only heat-treated samples that showed similar hold, final
and setback viscosity values to those found in the FDF. In terms of mineral contents,
all GBF samples had higher concentrations of K, Mg, Ca and Zn compared to the WF
which makes GBF as a better source of these nutrients (P-value < 0.05). The overall
results from both nutritional and technical aspects showed that amongst heat-treated
GBF, ODF50 (ODF) was the best flour to be compared to FDF for fortification in bread.
Three levels of FDF and ODF were used to substitute WF at three levels (10%, 20%
and 30%) in bread formulation. At 30% fortification level, elasticity, loss modulus and
complex viscosity of dough were significantly higher in the fortified samples
compared to the 100% WF bread. At 20% fortification level, cohesion was significantly
decreased in the fortified dough samples compared to control and FDF samples (P-
value < 0.05). The use of GBF resulted in a denser, harder and chewier bread with
increasing the fortification level. In terms of shelf life, the banana bread stored at -20
°C for one week had significantly lower firmness and water loss compared to 4 °C and
25 °C (P-value < 0.05).
A significant decrease in energy caloric value and an increase in moisture and total
dietary fibre at > 20% fortification level was observed. The ODF-fortified samples had
higher browning index compared to control and FDF ones. The addition of both GBF

VII
types improved macro minerals (Mg, Ca, Na, K and P) without a significant change in
micro minerals (Fe, Zn, and Mn). The use of FDF in bread resulted in a marked
increase in both resistant and slow digestible starch content in F30 compared to ODF-
fortified samples at their comparable fortification levels.
GC-MS-based chemical fingerprinting successfully detected more than 100 volatile
compounds in the GBF fortified bread samples. Chemometrics methods used to
compare the effect of GBF type in bread (FDF and ODF-fortified-bread), fortification
level (10%, 20% and 30%) and bread part (crumb and crust) on the formation of
volatile compounds. Furan (furfural, 2-furanmethanol), Strecker aldehydes (2-
methybutanal and 3-methylbutanal) and ketone (2-undecanone) were the most
abundant volatiles in crust while alcohol (1-hexanol and 1-heptanol) and ester (ester
butanoic acid ethyl) abundant in the breadcrumb. The level of fortification had a
significant impact on the formation of 3-methyl-butanal (P-value < 0.05). Furthermore,
bread made with freeze-dried GBF had more distinguished ‘banana-like’ flavour due
to the presence of ethyl ester butanoic acid and 2-undecanone, while bread made with
ODF represented more Maillard-related compounds which could signify a woody-
malty aroma impression.
It can be concluded that fortification of bread with the GBF achieved from freeze-
drying had a more desirable results from technological and nutritional points of view.
Although between 10% and 20% fortification level there was no clear difference, the
30% bread samples showed a high value nutritious bread with distinctive volatile

VIII
flavour. Overall, the type of the drying method of GBF preparation had an impact on
developing discriminant volatiles compared to bread part and fortification level.
Keywords: Aroma volatiles, banana, bread, digestibility, drying, chemical
fingerprinting, chemometrics, flour, green banana, GC-MS, nutritional, resistant
starch, rheology, textural, thermal properties, volatile.

IX
Prologue
To begin with, I would like to express my gratitude to my supervisors, Prof. Aladin
Bekhit, Dr. Biniam Kebede and late Prof. John Birch (May his soul rest in peace). John
was the reason of me being here, who made my dream come true. Before he resigns
university due to his medical conditions, he was my primary supervisor who accepted
my proposal and believed in my ideas. His continuous support and novel ideas kept
motivating me to have thirst for knowing more every day. I will be forever thankful
for the opportunity that I had to be his student and learn from him, God bless him.
After losing John, Aladin continued supporting me as my primary supervisor. Thank
you for all the supports, caring, life lessons and sharing your experience which I value
immensely. Without your continuous support, I couldn’t finish what I initiated. Thank
you Biniam for accepting to be a part of my project. You brought your skills and
expanded the scope of my project.
My sincere thanks also go to all food science staff members, ranging from
administrative ones to lab assistant: Joann Ayers, who gave me the very first feedback
on my banana bread trial. Sarah Johnson, who allowed me to work during the night
at laboratory number 2 when I was not getting the right result and always was there
ready to hear the concerns. Michelle Petrie and Michelle Leus who were so supportive
and generous about teaching everything I needed to know. Ian Ross, who was the first
line of approach when I was facing a hurdle regarding materials, chemicals and
equipment during my experiments. I am also grateful for my friends in Dunedin,

X
whom I call them my extended family. I knew no one here when I arrived but
gradually, I adopted myself to new lifestyle, language, culture and expectation and
could build strong bonds. Getting to know people from almost 40 different countries
was truly a highlight in my life.
However, beyond all those support that facilitated this journey, there was numerous
obstacles in addition to PhD challenges itself. This invisible mental pressure was with
me along the way: In addition to carry the burden of the loss of my primary
supervisor, whom I had planned everything in the beginning, homesickness,
insufficient ability to communicate in English, the language I started to learn here,
more dramatic occurring happened. As a Muslim, I was deeply affected by the
terroristic attacks happened in Christchurch, just less than a week from losing John.
Then, the revolutionary activities happened in my own home country. While people
were being arrested and killed in streets of Tehran, I was worried sick about my family
safety. Just a month later, the political tensions between Iran and the USA increased
after the second most important Iranian military leader was assassinated and Iranian
government’s retaliation afterwards made me more concerned about my people, my
family. With keeping all these to myself and dealing with PhD challenges, the year
2020 started and we all know that what happened. Suffice it to say that I had many
plans to go to conferences for presenting my work, and everything was cancelled due
to the COVID-19 pandemic, more mental pressure was added. In the meantime,
because I was a collegiate community leader at Abbey College, the University of Otago

XI
post-grad college, I was responsible for taking care of the residents, from both sides of
well-being and pastoral care. In fact, I had to paint a smile on my face, yet could not
hide the tear trace. And utterly, here I am: Completed my research within its period
despite everything happened. I learnt manifold things which I never take them for
granted in my life. I stood against all the hardships, fought consistently and kept
attaching to my believes and the one who’s my faith is in. I can say, now, I am ready
for the next chapter of my life.
Lastly, but not for least, surely, I dedicate this thesis to my family, my dad, mom and
my sister who has just finished her PhD. Those who shaped my personality, guided
me all the way through my hardships and life challenges. I would not have been here
without them and I do anything just to bring the smile on their faces and make them
proud.

XII
Table of Contents
Chapter 1 .................................................................................................................................. 2
1.1. The importance of project ............................................................................................... 3
1.2. Overview of project ......................................................................................................... 5
1.3. Thesis Format ................................................................................................................... 8
Chapter 2 .................................................................................................................................. 9
2.1. Introduction .................................................................................................................... 11
2.2. Composition of banana ................................................................................................. 13
2.3. Health effects of banana bioactive compounds ......................................................... 15
2.4. Methods for banana flour preparation ....................................................................... 19
2.5. Banana flour applications ............................................................................................. 26
2.5.1. Bread ......................................................................................................................... 26
2.5.1.1. Physicochemical properties ............................................................................. 26
2.5.1.2. Structural (textural) properties ....................................................................... 27
2.5.1.3. Nutritional and sensory attributes ................................................................. 30
2.5.2. Pasta .......................................................................................................................... 32
2.5.2.1. Physicochemical properties ............................................................................. 32

XIII
2.5.2.2. Structural (textural) properties ....................................................................... 33
2.5.2.3. Nutritional and sensory attributes ................................................................. 34
2.5.3. Confectionaries ........................................................................................................ 36
2.5.3.1. Physicochemical properties ............................................................................. 36
2.5.3.2. Structural (textural) properties ....................................................................... 36
2.5.3.3. Nutritional and sensory attributes ................................................................. 38
2.5.4. Gluten-free products ............................................................................................... 39
2.5.4.1. Physicochemical properties ............................................................................. 40
2.5.4.2. Structural (textural) properties ....................................................................... 40
2.5.4.3. Nutritional and sensory attributes ................................................................. 42
2.6. Conclusion ...................................................................................................................... 56
Chapter 3 ................................................................................................................................ 57
3.1. Research problem statement ........................................................................................ 59
3.1.1. Preparation of the whole green banana flour ..................................................... 59
3.1.2. Textural properties .................................................................................................. 60
3.1.3. Starch analysis ......................................................................................................... 61
3.1.3. Volatile compounds fingerprint ............................................................................ 61
3.2. Research strategy ........................................................................................................... 62

XIV
Chapter 4 ................................................................................................................................ 67
4.1. Introduction .................................................................................................................... 69
4.2. Materials and Methods ................................................................................................. 72
4.2.1. Sample preparation ................................................................................................. 72
4.2.2. Method optimisation .................................................................................................. 72
4.2.3. Sample characterization ......................................................................................... 75
4.2.4. Green banana flour production ............................................................................. 75
4.2.4.1. Air oven-drying method .................................................................................. 76
4.2.4.2. Freeze-drying method ...................................................................................... 76
4.2.5. Physicochemical properties of the banana flour ................................................. 76
4.2.5.1. Colour measurements ...................................................................................... 77
4.2.5.2. Oil and water holding properties ................................................................... 78
4.2.6. Relative Crystallinity .............................................................................................. 79
4.2.7. Starch analysis ......................................................................................................... 80
4.2.7.1. Resistant starch ................................................................................................. 80
4.2.7.2. Total Starch ........................................................................................................ 81
4.2.7.3. Amylose and amylopectin content ................................................................ 81
4.2.8. Diffraction scanning calorimetry ....................................................................... 81

XV
4.2.9. Statistical analysis .................................................................................................... 82
4.3. Results and discussion .................................................................................................. 82
4.3.1. Physicochemical properties ................................................................................... 82
4.3.1.1. Proximate composition .................................................................................... 83
4.3.1.2. Colour ................................................................................................................. 85
4.3.2. Hydration properties .............................................................................................. 87
4.3.3. Starch analysis ......................................................................................................... 92
4.3.4. Relative Crystallinity .............................................................................................. 95
4.4. Conclusion ...................................................................................................................... 99
Chapter 5 .............................................................................................................................. 102
5.1. Introduction .................................................................................................................. 104
5.2. Material and Methods ................................................................................................. 106
5.2.1. Green banana flour preparation .......................................................................... 106
5.2.2. Particle size separation ......................................................................................... 106
5.2.3. Bulking properties ................................................................................................. 106
5.2.4. Textural properties ................................................................................................ 107
5.2.5. Pasting properties .................................................................................................. 107
5.2.6. FTIR spectroscopy ................................................................................................. 108

XVI
5.2.7. Mineral analysis ..................................................................................................... 108
5.2.8. Statistical analysis .................................................................................................. 109
5.3. Results and discussion ................................................................................................ 110
5.3.1. Particle size separation ......................................................................................... 110
5.3.2. Bulking properties ................................................................................................. 112
5.3.3. Textural properties ................................................................................................ 114
5.3.4. Pasting properties .................................................................................................. 116
5.3.5. FTIR spectroscopy ................................................................................................. 120
5.3.6. Mineral content ...................................................................................................... 122
5.4. Conclusion .................................................................................................................... 125
5.5. Limitations .................................................................................................................... 126
Chapter 6 .............................................................................................................................. 127
6.1. Introduction .................................................................................................................. 129
6.2. Material and Methods ................................................................................................. 130
6.2.1. Green banana flour preparation .......................................................................... 130
6.2.2. Breadmaking process ............................................................................................ 130
6.2.3.1. Viscoelastic properties ................................................................................... 131
6.2.3.2 Large deformation mechanical properties of dough .................................. 132

XVII
6.2.4. Bread characteristics ............................................................................................. 133
6.2.4.1 Bread baking performance ............................................................................. 133
6.2.4.2. Textural properties of fresh breadcrumb .................................................... 134
6.2.4.3. Storage stability of bread ............................................................................... 134
6.2.6. Data analysis .......................................................................................................... 135
6.3. Results and Discussion ................................................................................................ 135
6.3.1. Dough rheological properties .............................................................................. 135
6.3.2. Dough mechanical properties ............................................................................. 137
6.3.5. Textural analysis of breadcrumb......................................................................... 141
6.4. Conclusion .................................................................................................................... 149
6.5. Limitations .................................................................................................................... 150
Chapter 7 .............................................................................................................................. 151
7.1. Introduction .................................................................................................................. 153
7.2. Materials and Methods ............................................................................................... 155
7.2.1. Green banana flour preparation .......................................................................... 155
7.2.2. Breadmaking process ............................................................................................ 155
7.2.3. Bread chemical composition ................................................................................ 156
7.2.4. Bread crust and crumb colour ............................................................................. 157

XVIII
7.2.5. Mineral profile ....................................................................................................... 158
7.2.6. In vitro starch digestibility of bread samples ..................................................... 158
7.2.7. Statistical analysis .................................................................................................. 161
7.3. Results and discussion ................................................................................................ 161
7.3.2. Bread colour analysis ............................................................................................ 163
7.3.3. Mineral profile ....................................................................................................... 165
7.3.4. Starch digestibility analysis ................................................................................. 167
7.4. Conclusion .................................................................................................................... 169
7.5. Limitations .................................................................................................................... 170
Chapter 8 .............................................................................................................................. 171
8.1. Introduction .................................................................................................................. 173
8.2. Materials and Methods ............................................................................................... 177
8.2.1. Green banana flour preparation .......................................................................... 177
8.2.2. Breadmaking process ............................................................................................ 177
8.2.3. Sample preparation ............................................................................................... 177
8.2.4. Headspace SPME GC-MS analysis ..................................................................... 178
8.2.5. Data pre-processing of total ion chromatograms ............................................. 181
8.2.6. Chemometrics .................................................................................................... 181

XIX
8.3. Result and discussion .................................................................................................. 183
8.3.1. Investigating the overall trend in all 14 bread samples: Including the effects
of bread part, GBF fortification and drying method .................................................. 186
8.3.2. Comparison of the volatile profiles between breadcrumb and breadcrust at
10%, 20% and 30% fortification levels .......................................................................... 190
8.3.3. Effect of fortification level on the volatile fraction of crumb and crust in each
GBF type ........................................................................................................................... 197
8.3.4. Effect of drying method on volatile fraction of GBF-fortified bread ............. 201
8.4. Changes of key volatile compounds in bread samples .......................................... 204
8.4.1. Furanic compounds .............................................................................................. 205
8.4.1.1. Furfural ............................................................................................................ 205
8.4.1.2. 2-Furanmethanol ............................................................................................. 207
8.4.2. Strecker aldehydes ................................................................................................ 208
8.4.3. Esters ....................................................................................................................... 210
8.4.4 Ketones ..................................................................................................................... 212
8.4. Conclusion .................................................................................................................... 213
8.5. Limitations .................................................................................................................... 214
Chapter 9 .............................................................................................................................. 216

XX
9.1. Introduction .................................................................................................................. 218
9.2. General conclusion ....................................................................................................... 219
9.3. Key outcomes ............................................................................................................... 220
9.3.1. Producing a gluten-free vegan flour from the whole banana fruit ................ 220
9.3.2. Introducing new drying methods ....................................................................... 220
9.3.3 Full characterization of green banana flour, dough and bread ....................... 221
9.3.4. Changes of bread quality during storage .......................................................... 222
9.3.5. Increased amount of resistant starch in bread .................................................. 222
9.3.6. Increased the availability of macro and micro minerals in bread .................. 223
9.4. Future recommendations ............................................................................................ 224
Appendix .............................................................................................................................. 226
List of References ................................................................................................................ 235

XXI
List of Figures
Chapter 1
Figure 1.1. Schematic outline of thesis content ................................................................... 7
Chapter 2
Figure 2.1. The process steps of banana flour preparation ............................................. 21
Figure 2.2. Bread crumb cross-sectional views (Ho et al., 2015) .................................... 29
Figure 2.3. The balady bread (Eshak, 2016) ....................................................................... 30
Chapter 4
Figure 4.1. Flow chart of green banana flour production by freeze-drying and oven-
drying……………………………………………………………………………………..…74
Figure 4.2. Starch analysis of green banana and wheat flour samples…………………94
Figure 4.3. Amylose and Amylopectin content of green banana and wheat flour
samples…………………...………………………………………………………………….95
Figure 4.4. X-Ray diffraction patterns of green banana and wheat flour samples…….97
Chapter 5
Figure 5.1. FTIR spectrum of green banana and wheat flour samples……………….121
Chapter 6
Figure 6.1. Textural properties of fresh bread crumb samples..................................... 143

XXII
Figure 6.2. Textural properties of fresh bread crumb samples………………………..144
Chapter 7
Figure 7.1. a) Macro minerals in bread samples b) Microminerals in bread samples
................................................................................................................................................ 166
Chapter 8
Figure 8.1. Examples of the typical breadcrumbs for GC-MS analysis ....................... 179
Figure 8.2. Gas chromatography mass spectroscopy setup……………………..……180
Figure 8.3. Examples of the typical breadcrust in vials for GC-MS analysis ............. 180
Figure 8.4. Total ion chromatogram of wheat flour……………………………..…….184
Figure 8.5. Total ion chromatogram of freeze-dried green banana flour ................... 185
Figure 8.6. Total ion chromatogram of oven-dried green banana flour ..................... 185
Figure 8.7. Total ion chromatograms of (a1) O10B, (a2) O10T, (b1) O20B, (b2) O20T, (c1)
O30B, (c2) O30T obtained with the headspace GC-MS fingerprinting method ......... 187
Figure 8.8. Total ion chromatograms of (a1) F10B, (a2) F10T, (b1) F20B, (b2) F20T, (c1)
F30B, (c2) F30T, (d1) WB, (d2) WT obtained with the headspace GC-MS fingerprinting
method .................................................................................................................................. 188
Figure 8.9. The Principal component biplot of bread samples, including the bread type,
level of fortification and drying methodsBread crust samples .................................... 189
Figure 8.10. The partial least squares-discriminant analysis biplot of bread samples,
showing a clear difference between the volatile profiles of the bread crust and crust
samples at each fortification levels ................................................................................... 193

XXIII
Figure 8.11. The partial least squares-discriminant analysis biplot of bread samples.
There is clear effect of the level of GBF fortification on the final bread volatile profile
................................................................................................................................................ 199
Figure 8.12. A PLS-DA bi-plot showing the difference in volatile profile of breadcrumb
and breadcrust based on the drying process .................................................................. 202
Figure 8.13. Furfural content in all bread samples ........ .Error! Bookmark not defined.
Figure 8.14. 2-Furanmethanol content in all bread samples………….....……………..208
Figure 8.15. 3-Methyl-butanal content in all bread samples……………..……………210
Figure 8.16. Butanoic acid ethyl ester content in all bread samples…………………..212
Figure 8.17. 2-Undecanone content in all bread samples……………..………………..213
Appendix Figures
Figure B 1. Fresh green banana slices (left) and dried ones (right) by oven drying . 229
Figure B 2. Green banana slices immersion in 0.5% (w/v) citric acid .......................... 229
Figure B 3. Green banana flour prepared at 110 °C (left), 80 °C (middle) and 50 °C
(right) ................................................................................................................................... 230
Figure B 4. Fresh frozen green banana slices (left) and freeze-dried slices (right) .... 230
Figure B 5. Freeze-dried green banana flour (left) and wheat flour (right) ................ 231
Figure B 6. Freeze-dried green banana flour (left) and oven-dried one at 50 °C (right)
................................................................................................................................................ 231
Figure B 7. First trial of bread dough making …………………………………………..232

XXIV
Figure B 8. First trial of non-fermented pan bread making ......................................... 232
Figure B 9. The first trial for green banana fortified bread at 30% level (left) and wheat
bread (right) ......................................................................................................................... 233
Figure B 10. Trials for other bakery product (cookie dough, left and baked one, right)
................................................................................................................................................ 233
Figure B 11. All the prepared bread samples ................................................................. 234
Figure B 12. Oven-dried banana flour (left) vs. freeze-dried samples (right) ………..235
List of Tables
Chapter 2
Table 2.1. Composition (g/ 100 g) of banana flour produced from different ripening
stage ........................................................................................................................................ 20
Table 2.2. The effect of different drying methods on banana flours .............................. 23
Table 2.3. banana flour application effect on different properties of food products .. 44
Chapter 4
Table 4.1. Characterisation of banana samples maturity using pH, total solid, firmness
and total acidity of green banana used in the present study compared to literature
findings ................................................................................................................................... 83
Table 4.2. The composition of green banana and wheat flour samples (g/ 100 g) ....... 85
Table 4.3. Colour analyses of green banana and wheat flour samples ......................... 87

XXV
Table 4.4. Hydration properties of green banana and wheat flour samples ................ 88
Table 4.5. Emulsifying properties of green banana and wheat flour samples ............. 91
Table 4.6. Thermal properties of green banana flour samples and wheat flour .......... 98
Chapter 5
Table 5.1. Particle size separation of green banana and wheat flour samples ........... 111
Table 5.2. Bulk properties of green banana and wheat flour samples ........................ 113
Table 5.3. Textural properties of green banana and wheat flour samples .................. 115
Table 5.4. Pasting properties of green banana and wheat flour samples ................... 118
Table 5.5. FTIR peaks for green banana and wheat flour samples .............................. 122
Table 5.6. Mineral composition of green banana and wheat flour samples (mg/100 g)
................................................................................................................................................ 124
Chapter 6
Table 6.1. Viscoelastic properties of bread dough determined at frequency of 1 Hz136
Table 6.2. Large mechanical properties of bread dough samples ................................ 139
Table 6.3. Baking performance of bread samples ........................................................... 141
Table 6.4. The moisture content of bread samples during different storage conditions
................................................................................................................................................ 147
Table 6.5. The firmness of bread samples during different storage conditions ......... 148
Chapter 7
XXVI
Table 7.1. Chemical composition properties of bread samples (g/ 100 g) ................... 162
Table 7.2. Colour parameters of bread crust and crumb ............................................... 164
Table 7.3. Starch digestibility of bread samples (g/ 100 g db) ...................................... 168
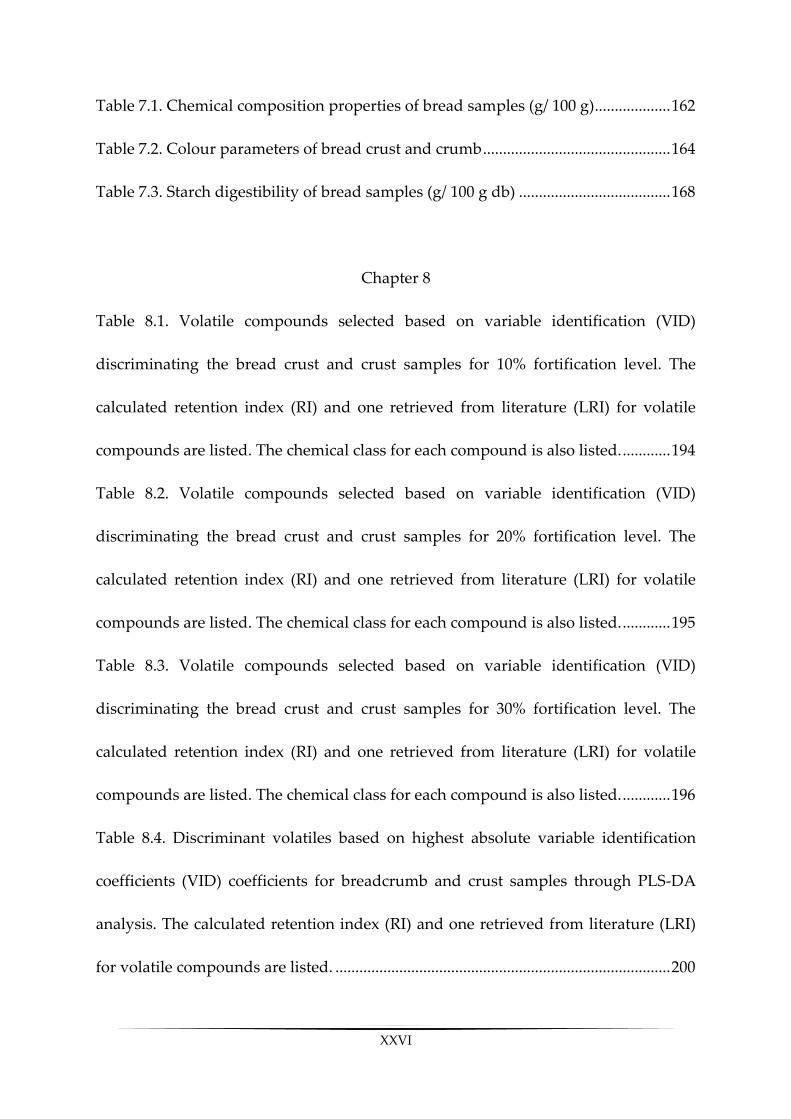
Chapter 8
Table 8.1. Volatile compounds selected based on variable identification (VID)
discriminating the bread crust and crust samples for 10% fortification level. The
calculated retention index (RI) and one retrieved from literature (LRI) for volatile
compounds are listed. The chemical class for each compound is also listed. ............ 194
Table 8.2. Volatile compounds selected based on variable identification (VID)
discriminating the bread crust and crust samples for 20% fortification level. The
calculated retention index (RI) and one retrieved from literature (LRI) for volatile
compounds are listed. The chemical class for each compound is also listed. ............ 195
Table 8.3. Volatile compounds selected based on variable identification (VID)
discriminating the bread crust and crust samples for 30% fortification level. The
calculated retention index (RI) and one retrieved from literature (LRI) for volatile
compounds are listed. The chemical class for each compound is also listed. ............ 196
Table 8.4. Discriminant volatiles based on highest absolute variable identification
coefficients (VID) coefficients for breadcrumb and crust samples through PLS-DA
analysis. The calculated retention index (RI) and one retrieved from literature (LRI)
for volatile compounds are listed. .................................................................................... 200

XXVII
Table 8.5. Discriminant volatiles based on highest absolute variable identification
coefficients (VID) coefficients for breadcrumb and crust samples through PLS-DA
analysis. The calculated retention index (RI) and one retrieved from literature (LRI)
for volatile compounds are listed. .................................................................................... 203
Appendix Tables
Table A1. The observations of the effect of different trial processes on green banana
samples ................................................................................................................................. 227

XXVIII
List of Abbreviations
AMG amyloglucosidase
ANOVA analysis of variance
aw water activity
BD breakdown viscosity
BF banana flour
BP banana pulp
BPe banana peel
DF dietary fibre
DS digestible starch
F firmness
FDF freeze-dried green banana flour
FAO food and agriculture organization
FTIR fourier-transform infrared spectroscopy
FV final viscosity
G* complex modulus
G′ storage modulus
G′′ loss modulus
GBF green banana flour
GBP green banana pulp

XXIX
GBPe green banana peel
GBPeF green banana peel flour
GBPF green banana pulp flour
GC-MS gas chromatography mass spectroscopy
GC-O gas chromatography olfactometry
GF gluten free
GOPOD glucose oxidase peroxidase reagent
HDL high density lipoprotein
HI hydrolysis Index
HR hausner ratio
HV hold viscosity
HS-SPME headspace-solid phase micro-extraction
ICP-MS inductively coupled plasma mass spectrometry
LDL low density lipoprotein
LV latent variables
MC moisture content
MVDA multivariate statistical data analysis
ɳ* complex viscosity
ODF oven-dried green banana flour
OHC oil holding capacity
PCA principal component analysis

XXX
pGI glycaemic Index
PLS-DA partial least squares-discriminant analysis
PT pasting temperature
PV peak viscosity
PTFE polytetrafluoroethylene
R gelatinization range
RC relative crystallinity
RDS rapidly digested starch
RI retention index
RS resistant starch
RVA rapid visco analyser
SB setback viscosity
SDS slow digestible starch
SD standard deviation
SI solubility index
SP swelling power
SPME solid-phase micro-extraction
SV specific volume
T0 onset temperature
tan δ loss tangent
TDF total dietary fibre

XXXI
TIF indigestible fraction
Tp gelatinization/ peak temperature
TPA texture profile analysis
TS total starch
VID variable identification coefficients
WB wheat bread
WF wheat flour
WHC water holding capacity
XRD x-ray diffraction
YBP yellow banana pulp
YBPe yellow banana peel
YBPeF yellow banana peel flour
YBPF yellow banana pulp flour
ΔH transition enthalpy

Chapter 1

CHAPTER 1: INTRODUCTION
2
Introduction
Chapter aim:
This chapter discusses the importance, objectives and scope of the research carried
out in this thesis.

CHAPTER 1: INTRODUCTION
3
1.1. The importance of project
Banana is one of the most consumed fruits in the world and the world’s fourth most
significant crop. The average global banana consumption has been reported to be
12 kg per capita. Banana is a universal term, comprising several species of this genus
in the Musaceae family and is a tropical climacteric fruit. According to the latest Food
and Agriculture Organization (FAO) statistics, Asia is the largest banana
production region, with 54.4% of the world's banana production (FAOSTAT, 2017).
In New Zealand, banana is an essential part of the diet, with consumption of more
than 90,000 tons annually. Almost two-thirds of New Zealand’s imported bananas
come from Ecuador, one third from the Philippines, the two main banana exporters
at the international level, and a small quantity (less than 2%) comes from Mexico
(Edmunds, 2015). It is estimated that a total of 40% of green banana harvests are lost
before exporting. Unsuitable handling, deformity of the banana, irregular shape
and brown dots are some examples of the fruit rejection (De Gouveia and
Zandonadi, 2013). Moreover, before bananas are treated by the ripening process in
the destination country, there is another screening step to remove unwanted fruits
which were affected by the transportation system (FAOSTAT, 2017). There are
studies for use of this mass waste by extracting macromolecules, such as pectin,
cellulose and dietary fibre (DF) for food products applications or animal feed (Viena
et al., 2018, Sri Suryaningsih et al., 2018, Putra et al., 2018, Nikhila et al., 2018, Pathak
et al., 2017, Chavan et al., 2013). Green banana pulp (BP) is a rich source of essential

CHAPTER 1: INTRODUCTION
4
phytonutrients, including phenolic compounds and vitamins (niacin, pyridoxine,
cobalamin, ascorbic acid and alpha-tocopherols). It also contains carotenoids,
flavonoids, minerals and DF. It is also rich in resistant starch (RS) which has a
positive impact on the colon’s health, while ripe banana contains more digestible
starch and monosaccharides. Banana peel (BPe) is a rich source of minerals,
bioactive compounds, RS and fibres (Kurhade et al., 2016). With the aim of taking
advantage of the nutritious compounds which are captivated within banana peel
and pulp cell walls, drying is an alternative approach that has been introduced in
recent years to prevent the waste before it happens (Vu et al., 2017, Musa et al., 2017,
La Fuente and Tadini, 2017, Baptestini et al., 2017, Vaidya et al., 2016). Preserving
the most important prebiotic in green banana, RS, requires a controlled-modified
drying method.
Resistant starch is defined as the sum of starch and products of starch degradation
that are not absorbed in the small intestine of healthy individuals (Goñi et al., 1996).
It acts as a prebiotic and has a positive influence on the functioning of the digestive
tract, reduces blood cholesterol levels and assists in the control of diabetes. In
addition, to be an important source of bioactive compounds, green banana is one of
the richest sources of resistant starch, which makes it a valuable natural resource
for enrichment purposes in foods (Bello-Perez and Hoyos-Leyva, 2017).

CHAPTER 1: INTRODUCTION
5
1.2. Overview of project
There has been an increase in research towards the formulation of functional food
products in the last decade; to develop products containing a wide range of
beneficial nutrients ranging from micro-nutrient enriched foods to products that
have probiotic functionality. The increased attention to health and wellbeing of
consumers in the last decade, has led to an increased interest in vitamins, minerals,
unsaturated fatty acids, bioactive compounds and fibres in food products. The
utilization of by-products of fruits, especially banana, has recently become a trend,
and many studies are underway to evaluate their effects on food properties
(Chávez-Salazar et al., 2017).
Banana peel takes up approximately 40% of a banana weight, which is usually
discarded. One of the aims of this study was to take advantage of the banana peel’s
high nutritional value by transforming it into flour together with the banana pulp.
Doing so, can not only help sustainability and waste control, but also increases the
production yield of the whole green banana flour (GBF). Furthermore,
incorporating such banana flour into bread and investigating its effects on the
technological, nutritional and volatile profile aspects of the bread were
investigated.
Given the importance of a functional bread in a diet, and the potential use of banana
peel as a rich source of bioactive compounds, especially RS, this thesis was designed
to characterize the properties of green banana flour produced from different drying
CHAPTER 1: INTRODUCTION
6
methods (freeze-drying and oven-drying). Thereafter, the quality properties,
structural and textural attributes of dough and bread were assessed together with
in vitro digestion tests in order to determine different starch types of the final
fortified bread. Finally, a comparative volatile fingerprinting was performed in
order to determine the key chemical compounds that distinguish a 100% wheat
bread from fortified banana bread.
A review of the available literature is presented in chapter 2. Five experimental
chapters are provided following a research design that is presented in chapter 3 in
order to summarize research gaps and provide detailed objectives of this work.
Each experimental chapter includes an introduction, method and materials, result
and discussion and conclusion (chapter 4-8). Finally, the outcome, limitations and
recommendations of this study are summarised in chapter 9. A schematic outline
of how the present thesis is structured is shown in Fig 1.1.

CHAPTER 1: INTRODUCTION
7
Investigation of the effect of
bread fortification with selected
GBF at different levels
Optimisation of drying methods
and characterisation of green banana
Chapter 1: Introduction
Chapter 2: Literature review
Chapter 3: Problem statement, objectives and research strategy
Chapter 4
Chapter 6 Chapter 7 Chapter 8
Chapter 9: General conclusion
Chapter 5
Figure 1.1. Schematic outline of thesis content

CHAPTER 1: INTRODUCTION
8
1.3. Thesis Format
Based on the guidelines of the University of Otago Graduate Research School, this
thesis has been written in “hybrid format”, whereby published materials are wholly
inserted as chapters (chapter 2, 4-7) which has been approved by Board of Graduate
Studies, 5 June 2014, revised on 5 June 2016. In order to maintain the coherency
between the chapters, formatting was standardized (references, bibliography, page
numbers, margins, etc) and duplicated material was deleted and cited where it was
appropriate. Some changes have been made in published chapters in order to make
the information more related amongst chapters. A bridging page has been
implemented prior to where an experimental chapter begins. Points below were taken
into consideration when writing this thesis:
1. New Zealand spelling were used in the text except the in-text citation and
references.
2. Abbreviations or symbols were defined in appropriate places as far as being
practical.
3. The international system of units (SI) was used in the whole thesis.
4. Harvard reference style were followed in citation and bibliography.

Chapter 2

CHAPTER 2: LITERATURE REVIEW
10
Production, application and health effects of banana pulp and peel
flour in the food industry
This chapter has been published as:
AMINI KHOOZANI, A., BIRCH, J. & BEKHIT, A. E.-D. A. 2019. Production,
application and health effects of banana pulp and peel flour in the food industry.
Journal of Food Science and Technology, 56, 548-559.
Chapter aim:
This chapter discusses the health benefits of banana bioactive compounds and
utilization of different parts of the banana and flour produced at various ripeness
stages in food applications. Of particular interest, various methods for producing
banana flour are compared to highlight the effect of each one on physicochemical,
nutritional and structural properties of flour properties

CHAPTER 2: LITERATURE REVIEW
11
2.1. Introduction
Banana is a tropical climacteric fruit and universally comprises a number of species in
the genus Musa of the family Musaceae. It is one of the most favoured fruits in the
world and the fourth most important crop produced globally (Zhu et al., 2018). Nearly
all of the identifiable banana cultivars are derived from two diploid species, Musa
acuminata and Musa balbisiana, in which the Cavendish variety is the most common.
Plantain is related to the hybrid triploid cultivars of banana and is longer, more
angular and diverse in shape. In the mature state, plantain is firmer than Cavendish
and thus it is less valued as a fresh product (Zhang et al., 2005). According to the latest
Food and Agriculture Organization (FAO) statistics, Asia is the largest producer of
banana with a share of 54.4% of the world's banana production. With an average
banana consumption of 12 kg per capita, banana is amongst the world’s major food
crops, after rice, wheat and maize (FAOSTAT, 2017).
Banana fruit consists of two parts: peel and pulp. Banana peel (BPe), which is the main
by-product of banana, is about 40% of total weight of the fruit. Until recently, BPe had
no useful applications and was dumped as waste, contributing massive amounts of
organic materials to be managed. Since researchers have begun to focus on studying
the composition of BPe, several possible applications have emerged (Agama-Acevedo
et al., 2016). Banana pulp (BP), which is the edible part of the fruit, has an abundant
amount of nutrients. Studies conducted on BP have investigated different aspects
ranging from its use as an ingredient for food enrichment to extraction and isolation

CHAPTER 2: LITERATURE REVIEW
12
of many health-beneficial components, such as different types of starch, cellulose and
bioactive compounds (Singh et al., 2016). As stated by Kitts (1994), bioactive
compounds are constituents with extra nutritional advantages that are naturally
occurring in plants and foods in small amounts. They exert their beneficial biological
effects by stimulating the probiotic growth and help in the prevention of
cardiovascular disease and cancer (Kris-Etherton et al., 2002). Phenolics, carotenoids,
flavonoids, biogenic amines, phytosterols and other phytochemicals can be found in
BP and peel (Pereira and Maraschin, 2015). Due to the presence of these compounds,
bananas have a higher antioxidant capacity than some berries, herbs and vegetables
(Moongngarm et al., 2014). Bioactive compounds in different cultivars of banana and
their health benefits were reviewed in details by Singh et al. (2016). They reviewed the
content of phenolic compounds, carotenoids, biogenic amines, phytosterols,
antioxidant activity and overall health benefits of banana based on different cultivars
and ripening stage. They also reported the potential of banana pulp and peel usage as
a functional food source against many chronic diseases.
The increasing attention to functional food products and health and wellbeing of
consumers in the last decade has led to an increased interest in vitamins, minerals,
unsaturated fatty acids, bioactive compounds and fibre in food products (Al-Sheraji
et al., 2013). The utilization of by-products of fruits, especially banana, has become a
trend as of late and many studies are in progress to evaluate their effects on food
properties (Chávez-Salazar et al., 2017, Yu et al., 2018, Viena et al., 2018, Temesgen et
al., 2018, Tan and So, 2018, Singh et al., 2018, Ren et al., 2018, Rahimi-Mohseni et al.,

CHAPTER 2: LITERATURE REVIEW
13
2018, Pereira et al., 2018). As approximately one-third of banana is lost due to the
public tendency to consume only ripened fruit, utilization of different parts of the
banana at different ripening stages has also gained interest over the past years (Sheikh
et al., 2017).
This chapter discusses the health benefits of banana bioactive compounds and
physicochemical composition of different parts of banana in all stages of ripeness. This
is followed by a comparison between the available drying methods in terms of the
effect of each one on various properties of the produced banana flour.
2.2. Composition of banana
Banana pulp is a rich source of essential phytonutrients, including phenolic
compounds and vitamins (niacin, pyridoxine, cobalamin, ascorbic acid and alpha-
tocopherols). It also contains carotenoids, flavonoids, amine compounds and dietary
fibre (DF). Dietary fibres are indigestible carbohydrate polymers that are classified
based on their water solubility into two types, soluble fibres (pectin and some
hemicelluloses) and insoluble fibres (cellulose, lignin and resistant starch) (Alba et al.,
2018). In general, it has been reported that BPe contains more DF than BP (Garcia-
Amezquita et al., 2018). Extracting pectin from the peels could add value. In addition,
BPe has high amount of lignin, cellulose and hemicelluloses fractions, which can be
extracted as a formed complex substrate named lignocellulosic biomass which could
be used to produce bioethanol (Happi Emaga et al., 2008). Also Khamsucharit et al.

CHAPTER 2: LITERATURE REVIEW
14
(2018) signified that the extracted pectin from BPe could be an alternative source for
commercial pectin.
One of the most important DF which has gained a lot of attention in recent years is
resistant starch (RS). It is mainly composed of the linear part of starch (amylose) which
is fermented by probiotics in the colon, specifically Bifidobacterium and Lactobacillus
species (Kale et al., 2002). This brings about the production of short chain fatty acids,
mainly butyric acid, which has a key role in prevention of colorectal cancer (Pérez-
Burillo et al., 2018, Singh et al., 2016, Hu et al., 2015, Birt et al., 2013, Gratz et al., 2011,
Perera et al., 2010). There are five types of RS introduced up to now: starch that is
physically inaccessible in crop’s cell walls (RS1), granular native starch with high
crystalline structure (RS2), retrograded starch achieved by heating and cooling of
starchy foods (RS3), chemically modified starch (RS4) and amylose-lipid complex
(RS5). Fractionation of the DF and RS is different parts of banana in different levels of
maturation is shown in Table 2.1.
Unripe banana is rich in RS2, which is beneficial to colon health, while ripe banana
contains more digestible starch and protein (Singh et al., 2016). Banana peel is a rich
source of minerals, bioactive compounds and DF (Kusuma et al., 2018). Several studies
reported the use of banana peel flour (BPeF) as a functional food source (Ramli et al.,
2009, Ramli et al., 2010, Türker et al., 2016, Agama-Acevedo et al., 2016). According to
some reports, both pulp and peel have high antioxidant activity (González-
Montelongo et al., 2010, Agama-Acevedo et al., 2016). As lipid oxidation in food
components is one of the unwanted reactions causing rancidity, food producers rely

CHAPTER 2: LITERATURE REVIEW
15
on synthetic antioxidants to minimize lipid deterioration. Potential health risks,
however, is a limiting factor of using these preservatives extensively in food products,
especially staple ones (Pathak et al., 2017). Given that BPe extract has been found to
be non-toxic to human cells, more information has become available on using it as an
inexpensive fruit by-product source of antioxidants (Segundo et al., 2017b).
The amount of ash, protein, crude fibre and digestible starch of BPeF was reported to
be significantly higher than that of pulp, which makes the BPeF more effective as a
functional additive (Nasrin et al., 2015). For instance, the higher quantity of ash can be
valuable in treating deficiencies of minerals caused by celiac disease. Additionally,
several studies have shown the application of BPe as a low-cost precursor for
producing materials such as anionic dye and heavy metal adsorbents (Vilardi et al.,
2018, Singh et al., 2018, Oyewo et al., 2018, Munagapati et al., 2018, Mahindrakar and
Rathod, 2018), recovering phenolic compounds (Vu et al., 2018), producing cellulose
nanofibres (Tibolla et al., 2018, Harini et al., 2018, Costa et al., 2018), as well as
bioethanol (Prakash et al., 2018, Berawi and Bimandama, 2018) and pectin extract
(Khamsucharit et al., 2018). In following sections, some of the exclusive added value
components in banana are introduced.
2.3. Health effects of banana bioactive compounds
Carotenoids are natural antioxidants that contribute to the stability of foods during
storage. Previous studies documented the existence of various carotenoids in banana

CHAPTER 2: LITERATURE REVIEW
16
fruit (Davey et al., 2006). Although some suggested that the cultivars genotype
specifies the quantity of carotenoids, they mostly concurred that the amount of trans-
alpha and trans-beta carotene comprised the majority of pro-vitamin A compounds
(Yan et al., 2016). Another significant carotenoid reported was lutein, which exhibited
antioxidant properties and an inhibitory effect on the age-related macular
degeneration. Interestingly, it has been identified that green banana peel (GBPe) has
substantially higher carotenoids than the pulp (Davey et al., 2006).
Phytochemicals, especially phenolic acids, are the main bioactive compounds known
for exerting health benefits. Unexpectedly, the percentage of phenolic compounds has
been reported to be greater in the peel than the pulp (Kanazawa and Sakakibara, 2000).
For example, it was reported that the quantity of gallocatechin in the peel was five
times greater than the pulp. The banana peel extract was found to inhibit lipid
oxidation better than pulp extract (Someya et al., 2002). Phytosterol compounds, such
as cycloeucalenone, cycloeucalenone, cycloeucalenol, cycloartenol, stigmasterol,
campesterol and b-sitosterol, were reported to be in the range of 2.8–12.4 g/kg dry
weight base in GBP (Villaverde et al., 2013).
Recently, it has been shown that gallocatechin extracted from GBPe was effective in
the healing of surgical wounds in rats (Von Atzingen et al., 2015). Correspondingly, a
unique flavonoid named leucocyanidin was found in aqueous extract of unripe
plantain pulp, which is now known to be effective in the treatment of gastric diseases
(Lewis et al., 1999).

CHAPTER 2: LITERATURE REVIEW
17
Biogenic amines play a key role in the prevention of depression. Catecholamines,
dopamine, norepinephrine (noradrenaline) and epinephrine (adrenaline) are the best-
known examples of these bioactive compounds which regulate hormones in glycogen
metabolism (González-Montelongo et al., 2010). Results of dopamine levels in
different ripening stages of banana revealed an inverse relation between its
concentration and fruit’s maturity, noting that BPe contained more dopamine than
pulp (Kanazawa and Sakakibara, 2000).
There is a wide range of DF in banana fruit, including pectin, cellulose, lignin and
hemicellulose which can be found naturally in banana flour (BF). Amongst them, RS
is the most notable one which provides bioactive effects (Thebaudin et al., 1997).
Resistant starch, which is mainly derived from retrograded amylose in cooked starchy
food, is resistant to digestion in the small intestine after 2 h incubation (Homayouni et
al., 2014). After it reaches the colon undigested, it will be fermented by membrane
microbiota (mainly probiotics) and cause pH reduction. Therefore, the environment
will be undesirable for the growth of pathogenic microbiota and formation of
carcinogenic cells (Hung et al., 2016). A considerable number of studies has been
published on the direct relationship between RS intake and reduction of the large
bowel cancer risks either in vitro or in vivo; it seems that RS may be a major protective
factor against colorectal cancer (Yin and Zhao, 2017, Panebianco et al., 2017).
In a randomized clinical trial on 22 healthy adults who were under 5 g per week of
green banana pulp flour (GBPF) diet, decreased hunger and increased satiety were
reported (Hoffmann Sardá et al., 2016). Also, Silva et al. (2016) reported a consumption

CHAPTER 2: LITERATURE REVIEW
18
of 25-70% of GBP could prevent oxidative damage in liver and kidney and improves
biochemical parameters in type 1 over a 12-week diet. Arun et al. (2017) reported
similar results in a GBPF-enriched diet, which resulted in a reduction of type 2
diabetes risk and associated cardiovascular diseases.
It has been shown that the amount of RS decreased from 8% to 2% with progression
in banana peel ripeness (changing the colour from green to yellow). However, the
percentage of total dietary fibre (TDF) slightly increased in yellow banana peel (YBPe)
(Ramli et al., 2010). In a parallel report, the RS and TDF contents of GBPF of 49.9%
and 7.2% were reported, respectively (Menezes et al., 2011). In general, it can be
concluded that because approximately 70% (dry basis) of the peeled green banana
comprises of RS2, the unripe pulp is a remarkable source of this bioactive compound
(Wang et al., 2017a). It is well-known that phytosterols are immune system
modulators and exert cholesterol-lowering and anticancer properties in the intestine
(González-Montelongo et al., 2010). As reported by (Marangoni and Poli, 2010), a
daily intake of phytosterols up to three grams/day significantly reduced total and low
density lipoprotein (LDL). A study pointed to a high amount of phytosterols can be
found in GBF, mainly beta-sitosterol, campesterol and stigmasterol (Bertolini et al.,
2010). Although citric acid pre-treatment reduced phytosterol in flour obtained from
the peel, no change was detected between phytosterols of acidified and control
samples from the pulp (Bertolini et al., 2010). Consequently, the known properties of
phytosterols suggest these flours could be used as functional food components.
Recently, Falcomer et al. (2019) reviewed the latest studies on health benefits of green

CHAPTER 2: LITERATURE REVIEW
19
banana products’ consumption with a major focused on in vivo works. Overall, the
studies showed the health benefits can be obtained from green banana products
consumption. Mainly, they have a positive impact on the gastrointestinal diseases, the
glycaemic index, diabetes and weight control. However, more studies, in vivo or in
vitro, are needed to investigate the changes in digestibility of fortified food products
with GBF.
2.4. Methods for banana flour preparation
Due to the climacteric nature of the banana, it is highly perishable and requires drying
during processing for preserving for a longer period of time. Banana flour is a product
with high storability potential and long shelf life and can be readily applied to food
products. The proximate composition of the flour also depends on the origin, variety,
time of harvest, and drying procedure of bananas (Haslinda et al., 2009). Table 2.1
depicts a summary of the proximate composition of both green and yellow BF made
from pulp and peel.

CHAPTER 2: LITERATURE REVIEW
20
Table 2.1. Composition (g/ 100 g) of banana flour produced from different
ripening stage
Banana
Maturity
Flour
base
Starch RS DF Ash Lipid Protein Reference
Green
(stage 1-2)
Pulp 64-75
17.5-
48
7.5-
15
2.6-
4.7
0.4-
2.7
6.5-14.3
(Juarez-Garcia et al.,
2006, Haslinda et al.,
2009, Menezes et al.,
2011)
Peel
10.1-
11.7
8.2-
8.6
43-
50
1.2-
9.6
6.1-9 4.1-8.1
(Haslinda et al., 2009,
Nasrin et al., 2015, Eshak,
2016, Agama-Acevedo et
al., 2016)
Yellow
(stage 6-7)
Pulp 56-63 11-17
17-
18
3.3-
6.9
0.6-
1.2
3.76
(Da Mota et al., 2000,
Aurore et al., 2009,
Segundo et al., 2017b)
Peel 3.5-6.3
2.3-
2.5
47-
53
9-11 3.8-11 5-8
(Ramli et al., 2009, Zhang
et al., 2005, Kurhade et
al., 2016)
RS, resistant starch. DF, dietary fibre.
Processing steps used for flour preparation from banana pulp and peel are similar,
except for the heating procedure used. Pre-treatment process steps of BF preparation
are summarized in Fig 2.1.

CHAPTER 2: LITERATURE REVIEW
21
•Distilled/ Tap water Rinsing
•Deionized water
•Citric acid
•Sodium metabisulfite
•Sodium hypochlorite
Soaking
•Pulp: 1.5 mm < thickness < 2.5mm
•Peel: 1 cm< length < 2 cm
Slicing
•GrinderGrinding
•Particle size (µm):
•Fine: 80
•Medium: 80-156
•Coarse: 156-200
Screening
•Freezer
•Refrigerator
•Room
Storage
Drying
Figure 2.1. The process steps of banana flour preparation
CHAPTER 2: LITERATURE REVIEW
22
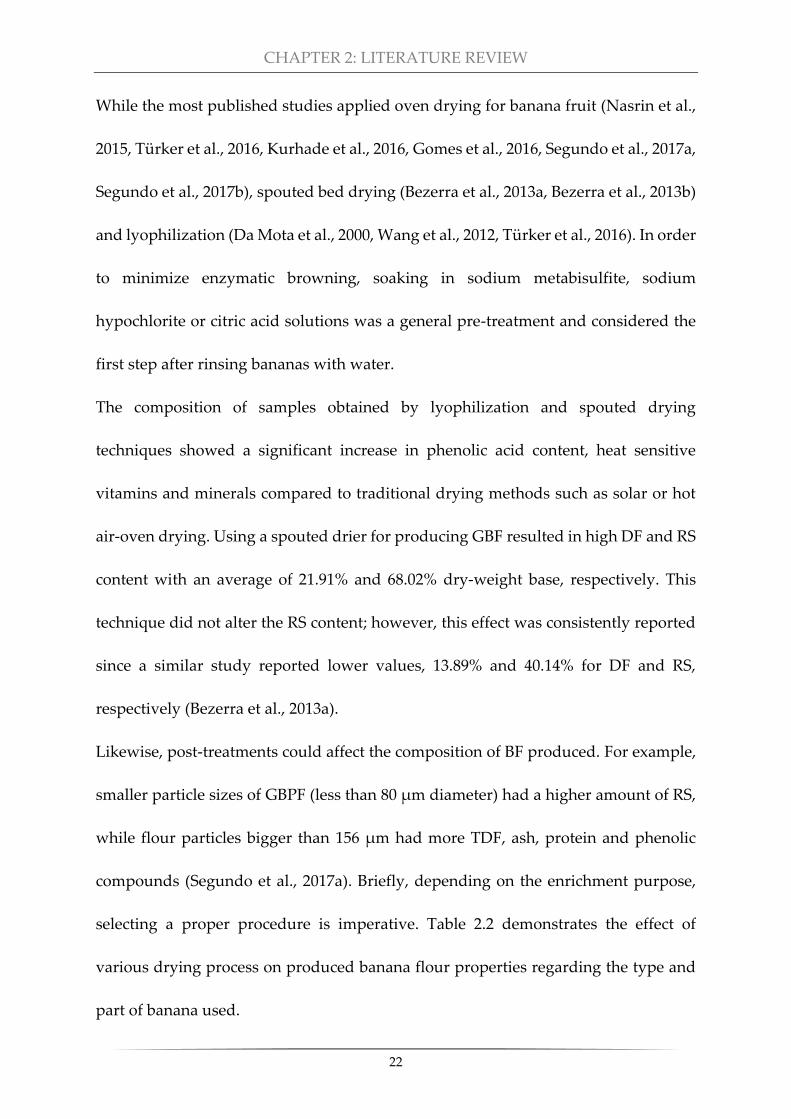
While the most published studies applied oven drying for banana fruit (Nasrin et al.,
2015, Türker et al., 2016, Kurhade et al., 2016, Gomes et al., 2016, Segundo et al., 2017a,
Segundo et al., 2017b), spouted bed drying (Bezerra et al., 2013a, Bezerra et al., 2013b)
and lyophilization (Da Mota et al., 2000, Wang et al., 2012, Türker et al., 2016). In order
to minimize enzymatic browning, soaking in sodium metabisulfite, sodium
hypochlorite or citric acid solutions was a general pre-treatment and considered the
first step after rinsing bananas with water.
The composition of samples obtained by lyophilization and spouted drying
techniques showed a significant increase in phenolic acid content, heat sensitive
vitamins and minerals compared to traditional drying methods such as solar or hot
air-oven drying. Using a spouted drier for producing GBF resulted in high DF and RS
content with an average of 21.91% and 68.02% dry-weight base, respectively. This
technique did not alter the RS content; however, this effect was consistently reported
since a similar study reported lower values, 13.89% and 40.14% for DF and RS,
respectively (Bezerra et al., 2013a).
Likewise, post-treatments could affect the composition of BF produced. For example,
smaller particle sizes of GBPF (less than 80 µm diameter) had a higher amount of RS,
while flour particles bigger than 156 µm had more TDF, ash, protein and phenolic
compounds (Segundo et al., 2017a). Briefly, depending on the enrichment purpose,
selecting a proper procedure is imperative. Table 2.2 demonstrates the effect of
various drying process on produced banana flour properties regarding the type and
part of banana used.

CHAPTER 2: LITERATURE REVIEW
23
Table 2.2. The effect of different drying methods on banana flours
Method Conditions
Banana
flour
type
Remarks Reference
Room drying
23°C
6 d
GBPeF
- Minimum or no Maillard Reaction
- Long preparation time
(Eshak, 2016)
Oven drying
40°C - 60°C
12h - 24h
GBPF
- No changes in phenolic acids and
flavonols (thermally stable)
- ↓ 50% of RS in final flour
- ↓ Epicatechin (the most abundant
flavan-3-ol in green banana)
(Juarez-
Garcia et al.,
2006,
Alkarkhi et
al., 2011,
Segundo et
al., 2017a,
Pico et al.,
2019b)
Air flow
drying
55°C, 6h
1.4m/s
GBPF
- RS content remained constant
between GBPF and banana paste
- Low dispersibility and solubility in
water
(Tribess et al.,
2009)
Spouted bed
with hot air
flow
80°C
50 m3/h
GBF
GBPF
- No need for grinding process after
drying
- Maintaining RS to 35% in GBF and
42% in GBPF
- RS content remained constant
between GBPF and banana paste
(Bezerra et al.,
2013b)

CHAPTER 2: LITERATURE REVIEW
24
- Low solubility under cold conditions
Pulsed-
fluidized bed
agglomeration
95 °C, 0.3 m/s
10 Hz
1 m/s (air
flow)
GBPF
- Lower wetting time
- Dispersible in cold water
- Higher level of RS achieved in GBPF
(Rayo et al.,
2015)
Ultrasound
and pulsed
vacuum
followed by
air drier
20-25 min
(ultrasound)
60 min under
50 KPa
pressure
(vacuum
convective
drier)
50 °C (air
drying)
GBPF
- ↓ RS in ultrasound pre-treatment
samples which followed by 60 °C
heating in GBPF
- No significant increase in RS amount
(La Fuente et
al., 2017)
Microwave
heating
960 W for 6
min
YBPeF
- ↓ Lightness more than other drying
methods
- Lowest drying time
- Minimum loss of bioactive
compounds, total phenolic and
antioxidant activity
- Maximum moisture content
compared to other drying methods
(but below the safe limit)
(Vu et al.,
2017)

CHAPTER 2: LITERATURE REVIEW
25
Freeze drying
-50 °C, 12 – 48
h
GBPeF
GBPF
GBPF
YBPF
- Maintained the original colour
regarding the least browning reaction
- Highest value of total flavonoids
reported in YBPeF and GBPF
(Da Mota et
al., 2000,
Wang et al.,
2012, Türker
et al., 2016,
Vu et al.,
2017, Pico et
al., 2019b)
Spray drier
27000 rpm
(atomizer
rotation)
50% (biomass
concentration)
30 °C
(biomass
temperature)
40 mL/min
(biomass flow
rate)
GBPF
- Moisture content of 9.17%
- Fastest method after microwave
- No analytical measurements
(Oi et al.,
2013)
Dehumidified
drier
60 °C, 13 h YBPeF
- Highest flour lightness after freeze
drying
- Lowest phenolic compounds
(Vu et al.,
2017)
GBPeF, green banana peel flour. GBPF, green banana pulp flour. YBPeF, yellow banana peel flour.
YBPF, yellow banana pulp flour. RS, resistant starch.

CHAPTER 2: LITERATURE REVIEW
26
2.5. Banana flour applications
The high DF content of banana and high levels of mentioned bioactive compounds
have enabled the production of BF-fortified food products with remarkable
functionalities. Moreover, discovering high nutrition value of BPeF represents a
low-cost by-product for industrial application. As discussed earlier, depending on
the ripening stage, there are four flour products produced from banana with
different chemical composition (Table 2.1). Due to the structure of BF, cereal-based
products have gained more attention than other food products. The main starch-
based foods targeted for enrichment with BF products are listed in the following
sections. In each food product section, the effect of BF addition has been reviewed
into three categories: physicochemical, structural and nutritional. At the end of this
section, Table 2.3 gives a summary of the finding reported in literature.
2.5.1. Bread
2.5.1.1. Physicochemical properties
In a study by Juarez-Garcia et al. (2006), GBF was obtained from a Mexican species
(Musa paradisiacal L.) to develop a high gluten bread using 37% GBF in the
formulation. Chemical composition analysis showed an increase in ash, protein,
TDF and starch percentage of banana bread compared to wheat bread. Similarly,
increased protein and TDF content were reported in leavened bread containing 20%
and 30% fermented green banana slurry substituted with wheat flour (Adebayo-

CHAPTER 2: LITERATURE REVIEW
27
Oyetoro et al., 2016). In another study, while TDF and ash content increased
significantly in 20% fortification of bread made with GBF, protein content decreased
by 5% due to the reduced amount of gluten (Gomes et al., 2016). Also, Gomes et al.
(2016) reported that the moisture content (MC) and water activity (aw) of the
fortified bread increased significantly compared to a traditional bread made with
no GBF fortification. This was explained by the increased capacity of DF which
came from GBF. These findings were similar to a 10%-fortified balady bread with
GBPeF: increased DF, MC and protein. Unfortunately, statistical analysis was not
available in this study to understand the reason behind the increase in protein
content (Eshak, 2016).
In terms of bread lightness changes (L*), Mohamed et al. (2010) findings on
composite bread with 10% peeled yellow banana pseudo-stem flour fortification
with wheat flour resulted in a darker bread compared to the control sample. The
presence of reducing sugars in the BF was described as the reason of the Maillard
Reactions. In another report, (Kurhade et al., 2016) found that with the fortification
of yellow banana peel flour (YBPeF) at any ratio with wheat flour in chapatti bread,
L* index was declined.
2.5.1.2. Structural (textural) properties
In a study on gluten-added bread, substitution of 25% of a commercial freeze-dried
banana powder (maturity level was not mentioned) with wheat flour resulted in

CHAPTER 2: LITERATURE REVIEW
28
increased volume and viscosity of leavened bread. Regarding the evaluation of
shelf life, while bread firmness increased in higher banana powder fortification
level regardless of storage temperature (25°C, 4°C and -20°C), the stiffness of the
control was higher than BF-fortified bread. By comparing storage temperature, it
was stated that bread stored at -20°C up to seven days, experienced lower firmness
compared to other samples (Mohamed et al., 2010). Similar findings are reported by
Ho et al. (2013) who prepared a steam bread with 30% GBPF wheat flour
substitution. However, the adverse impact of 30% GBPF with 80% added gluten
caused an increase in hardness and adhesiveness in the final bread product. The
cohesiveness, elasticity and chewiness of bread supplemented with 30% GBPF were
decreased due to the lack of consistency in gluten structure. With reference to
higher specific volume in banana bread samples containing 8% gluten, researchers
explained that GBPF could affect the gluten network and attenuate the gas holding
capability of the dough, which leads to low elasticity and expansion in leavened
bread. Loong and Wong (2018) associated the increased hardness in Chinese
steamed bread fortified with 15% GBPF with the presence of more DF, incomplete
gelatinisation of starch, less gluten matrix and less expansion of gas cells. In order
to improve the texture quality, a following study investigated the relation between
gum type and BF effect on volume, in which the addition of 0.8% sodium
carboxymethyl cellulose (NaCMC) improved specific volume (Ho et al., 2015).
NaCMC, which is a soluble DF, acts like a sponge and absorbs water in the intestine.
Therefore, it helps in mixing with the starchy food’s structure to form a dense

CHAPTER 2: LITERATURE REVIEW
29
structure that results in slowing down the rate of digestion. As a result, it can be a
suitable additive together with peeled yellow banana pseudo-stem flour (Fig 2.2).
These findings were in agreement with Steel et al. (2013) who researched on
fortified pan bread with 20% of GBPF and also consistent with those who worked
on yellow banana peel flour (YBPeF) and GBF, respectively (Kurhade et al., 2016,
Gomes et al., 2016). The chapatti containing 10% YBPeF was found to be softer
owing to a decrease in the tear force (Kurhade et al., 2016). In contrary to previous
findings, Eshak (2016) also reported a higher amount of protein in banana bread
(12.52%) which was ascribed to the slightly higher amount of protein in GBPeF
(8.74%) compared to wheat flour (8.68%). Although the bread baking performance
and textural analysis were not done in the study, the pictures showed an irregular
shape (Fig 2.3).
Figure 2.2. Bread crumb cross-sectional views (Ho et al., 2015)
BCt, control bread, B10BPF, fortified with 10% pseudo-stem flour, XG, xanthan, CMC, sodium
carboxymethyl cellulose

CHAPTER 2: LITERATURE REVIEW
30
Figure 2.3. The balady bread (Eshak, 2016)
B0, control bread, B1, 5%-fortified sample, B2, 10%-fortified sample with GBPeF
2.5.1.3. Nutritional and sensory attributes
In a study conducted by Juarez-Garcia et al. (2006), even though RS content was
decreased from 17.5% in GBPF to 6.7% in a 100% GBPF-fortified bread (with the
addition of 20% gluten). The authors also reported a significant decrease in
predicted Glycaemic Index (pGI) and Hydrolysis Index (HI) of the final product; a
result that was in accordance with a higher value of total indigestible fraction, the
main ingredients unavailable for digestion in the small intestine. A reduction in
TDF level and a slight increase in RS level (2.6%) were observed in a freeze-dried
tortilla bread containing 40%-GBPF substituted with corn flour. Moreover, higher
values of pGI and HI than control showed that GBPF addition may not be a proper
enrichment strategy for the purpose of producing a low-calorie tortilla bread
(Aparicio-Saguilan et al., 2013). This could also be attributed to the high amount of
RS2 in corn flour which could lead to a major increase in RS amount (Robles-

CHAPTER 2: LITERATURE REVIEW
31
Ramírez et al., 2012). Total phenolic content, flavonoids, antioxidants and free
radical scavenging activity were higher in a chapatti bread fortified with 10% YBPeF
than the control sample, which justified the high concentration of these elements in
YBPeF (Kurhade et al., 2016).
In another study on GBPF bread fortification by Ho et al. (2013), a significant
increase was shown in a 10%-fortified bread with GBPF without the addition of
hydrocolloids compared to the samples with added xanthan and sodium carboxy
methyl cellulose. Also a significant increase in total phenolic content and TDF
demonstrated the fact that peeled mature banana pseudo-stem flour could be
effective in producing a functional composite bread (Ho et al., 2013). These findings
were attributed to the high antioxidant activity of GBPF due to a higher level of
phenolic compounds (Pico et al., 2019b). In a following study, researchers also
found an interaction between gum type and BF effect on bread specific volume, in
which the addition of 0.8% sodium carboxymethyl cellulose (NaCMC) improved
minerals (Na, K, Mg and Ca) and RS content (14.98%) more than the same amount
of xanthan (Ho et al., 2015).
The sensory evaluation on bread samples in the following studies was conducted
using the seven-point hedonic scale. The GBF substitution with wheat flour resulted
in lower sensory scores in 20% enriched-samples (Gomes et al., 2016). However, no
significant difference was observed between 10%-fortified bread with GBPF and
control bread sample, except for colour and softness in a sensory analysis (Ho et al.,
2013). This was similar to a bread made with 10% YBPeF substitution with wheat

CHAPTER 2: LITERATURE REVIEW
32
flour which its overall acceptability score was not distinguished by panellists up to
10% of substitution (Kurhade et al., 2016). Nevertheless, when green banana peel
flour (GBPeF) was added to a level of 10% in balady bread in another study, the
control sample scored better in all sensory parameters, except taste and chewiness
(Eshak, 2016). In contrast, the Chinese steamed bread fortified with 15% GBPF
showed a higher overall acceptability compared to wheat bread (Loong and Wong,
2018). In accordance with the application of GBPeF in previous studies, sensory
scores diminished for all treatments with more than 10% substitution of green
banana slurry with wheat flour (Adebayo-Oyetoro et al., 2016). It can be concluded
that the mixed findings in literature could be due to the hedonic test which is based
on non-trained consumers’ perception.
2.5.2. Pasta
2.5.2.1. Physicochemical properties
The properties of spaghetti enriched with different substitution ratios of GBPF with
semolina flour was investigated in two studies. Following a similar pattern in most
of the banana bread products, a reduction in lightness, protein and fat content of
spaghetti containing 20, 35 and 40% GBPF was reported (Ovando-Martinez et al.,
2009). In another study, increased water absorption led to an increased cooking loss
in a 15%-GBPF fortified pasta compared to control samples (Krishnan and

CHAPTER 2: LITERATURE REVIEW
33
Prabhasankar, 2010). Amylose leaching from starch structure during the cooking
process was mentioned to be the reason behind this phenomenon.
Incorporation of green banana parts, individually, has also been considered in pasta
products. A separate substitution of 10% green pulp and peel (obtained from two
different varieties, Cavendish and dream) with wheat flour was conducted to produce
darker noodles (the lowest a*and L* values for GBPeF-fortified samples) (Ramli et
al., 2009). It was explained that an extension of the Maillard reaction was possibly
associated with non-enzymatic browning reactions. In addition, polyphenol
oxidase activity in banana peel could be contributed to enzymatic browning. In
another study, banana flour was prepared from a commercial GBPF and added to
tagliatelle pasta up to 30% substitution with wheat flour. Contrary to previous
findings, there was no evidence of darker colour in banana pasta which possibly
was due to the use of wheat flour instead of semolina flour (Zheng et al., 2016).
However, Biernacka et al. (2020) explained the swelling of the wheat pasta and the
conversion of pigments caused by cooking as the reasoned of darkening fortified
pasta with commercial 5% GBPF.
2.5.2.2. Structural (textural) properties
Ovando-Martinez et al. (2009) study on fortified spaghetti with 20, 35 and 40%
GBPF showed an increased adhesiveness and chewiness compared to the control,
which was because of the release of amylose from starch granules during cooking.
This also caused a rise in cooking loss (less than 7%) with increasing GBPF in the

CHAPTER 2: LITERATURE REVIEW
34
formulation. Since, regarding that a cooking loss below 8% is considered acceptable
for semolina-based pasta products, it might not be considered as a negative effect.
On account of the high amount of RS (12%) and incomplete gelatinization of starch
granules, enriched samples showed lower values in vitro digestion tests. Krishnan
and Prabhasankar (2010) findings showed a substantial decrease in pasta firmness
in samples fortified with 15% GBPF compared to control. This result could be due
to the insufficient gluten strength because of the substitution. Biernacka et al. (2020)
reported only in lower fortification level of GBPF (3% substitution with wheat flour)
cutting force can be increased significantly.
Whilst a 10%-GBPF fortified noodles exhibited higher elasticity, fortified samples
with 10% GBPeF showed the lowest values. In discussion, it was stated that higher
sugar content was responsible for high levels of total solid content which led to an
increase in the density of the molecular structure (Ramli et al., 2009). Also, noodles
prepared from GBPF contained high levels of starch which made them gradually
become disintegrated over cooking. This could result in swelling of starch granules
and more water absorption (Cleary and Brennan, 2006).
2.5.2.3. Nutritional and sensory attributes
Pasta products are foodstuffs with an important role in diets. In addition to being
easily produced with a long shelf life, pasta products also have a lower predicted
glycaemic index (pGI) in comparison with white bread or rice (Nilsson et al., 2008).

CHAPTER 2: LITERATURE REVIEW
35
Hence, enrichment of pasta products with different DF-enriched flours and
micronutrients has been considered in the last decade (Filipović et al., 2010). Since
the GBPeF was higher in TDF but lower in RS content than the GBPF, the low pGI
of 10%-fortified noodles with GBPeF was primarily because of its high TDF (Ramli
et al., 2009). Also, digestion tests showed that 30% GBPF-fortified pasta is more
resistant to enzyme digestion compared to wheat flour pasta (Zheng et al., 2016).
The authors also reported that banana pasta presented higher ash, TDF and total
phenolic content than the control, although, 15% substitution showed more ash
content (Zheng et al., 2016).
In a study conducted by Agama-Acevedo et al. (2009), produced GBPF comprised
of 42.54% RS2. Higher percentage of polyphenols and antioxidant capacity of
banana pasta was reported in the spaghetti they made with 30% GBPF substituted
with semolina. These results were confirmed by Krishnan and Prabhasankar (2010)
findings a year later. Besides, they found a synergic relation between sprouted Ragi
Flour and GBPF; in which a combination of 15% sprouted Ragi Flour and 15% GBPF
reported to increase iron and zinc in pasta samples compared to control one.
Moreover, it exhibited a higher antioxidant activity compared to 15%-GBPF
fortified pasta sample. Because pasta is subjected to hydrothermal treatment prior
to consumption, a decrease in the antioxidant activity of durum wheat pasta has
been reported (Biernacka et al., 2020). Overall, the literature has many areas to
investigate the impact of GBF on remaining RS content, especially in gluten free

CHAPTER 2: LITERATURE REVIEW
36
pasta products. Considering mixed results from textural properties of cooked pasta,
the sole effect of GBF needs to be investigated.
2.5.3. Confectionaries
2.5.3.1. Physicochemical properties
Owing to its high sugar content, utilization of BF in confectionaries is increasing by
the food industry, specifically cereal-based ones. The growth of pathogens in a cake
premix substituted with 60% GBPF instead of wheat flour over four months of room
storage was investigated. Despite the high sugar concentration, the pre-mixture
remained significantly unaltered in pH and pathogenic growth, fungus or yeasts
(Borges et al., 2010). In another study, foaming stability increased in the presence of
10% banana powder (maturity was not mentioned) in sponge cake (Park et al.,
2010).
2.5.3.2. Structural (textural) properties
In a study by Park et al. (2010), it was reported that with the increase level of BPF
to 20%, higher hardness was recorded in sponge cake, although, chewiness and
adhesiveness were not significantly different amongst samples. Furthermore, all the
fortified samples (even at 5% level) showed lower MC and specific volume
compared to control. These results indicated the lower amount of MC in fortified
samples had a negative impact on textural properties (Park et al., 2010). In terms of

CHAPTER 2: LITERATURE REVIEW
37
technological properties, sponge cakes were noticeably worsened with the presence
of banana flour (lower specific volume, inferior sensory characteristics and higher
hardness), which was diminished at the 15% ratio; except for cohesiveness that
showed a dramatic decrease in all samples compared to the control. The authors
accounted for different gelatinization and retrogradation behaviour of banana
starch compared to wheat starch for textural changes and decreased sensory scores
in banana cakes (Segundo et al., 2017a).
In concurrence with their previous work, increased hardness and decreased volume
in sponge cake fortified with different levels of YBPF led to a more dense structure,
especially in 40% banana cakes (Segundo et al., 2017b). The same behaviour was
observed by Oliveira de Souza et al. (2018), even though they used a higher
concentration of GBP puree instead of flour for pound cakes. Considering the
correlation between volume and hardness was more significant in sponge than in
layer cakes, the maturity of banana was not correlated to improvements of textural
properties (Segundo et al., 2017b). Another research on a fortified biscuit, YBPeF
was substituted up to 75% with wheat flour and caused a decline in hardness (Joshi,
2007). According to the discussions, prior treatments of mashed peels together with
DF led to an increase in softness of the product. While a high level of consistency
and crispiness is required in a biscuit product, reduced amount of gluten in higher
concentrations of YBPeF led to insignificant decrease of these attributes in all
enriched samples (Joshi, 2007). The findings reported by Carvalho and Conti-Silva

CHAPTER 2: LITERATURE REVIEW
38
(2018), on fortified cereal bars with YBPeF exhibited a darker colour, more hardness
and adhesiveness at 14% level.
2.5.3.3. Nutritional and sensory attributes
With the aim of increasing DF and RS in layer and sponge cakes, GBPF was added
at different particle size, ranging from 80 µm (fine) to 200 µm (coarse) in diameter.
Researchers showed that the fine flour comprised of 40% RS compared to 25% RS
in the coarse flour. This fact specified higher RS content (about 3%) in 30%
replacement samples with fine flours in both layer and sponge cakes. However, the
percentage of TDF and phenolic compounds were higher in the coarse flour
attributes (Segundo et al., 2017a). However, the flour with fine particle size showed
significantly higher RS content compared to medium and coarse ones (more than
10%). The presence of particles with different size indicates differences in the
hardness between different parts of the dried pulp. The coarse parts could come
from the hardest fractions of the dried pulp, resulting in prolonged times inside the
laboratory mill before escaping through the mesh and consequently initiating some
damage at granular level (Segundo et al., 2017a). Similar results were reported in
their following study on the selection of YBPF in 40% substitution with sugar in
sponge and layer cakes. Both cake types depicted enhancement in DF, polyphenols
and antioxidant capacity values (Segundo et al., 2017b). With focusing on sugar
reduction in confectionaries, cookies containing 20% of YBPeF were rich in TDF and

CHAPTER 2: LITERATURE REVIEW
39
were categorized as a low-calorie product (Agama-Acevedo et al., 2012). The same
pattern was reported by Elaveniya and Jayamuthunagai (2014) in which banana
blossom powder was added at 5 g in 100 g of biscuit formulation. Park et al. (2010)
reported that up to 10% fortification of sponge cake with BPF could bring
reasonably high overall acceptability. In another study, consumer acceptance of
biscuit samples for colour, crispiness and taste decreased with the addition of BPe,
while it was acceptable at 5% substitution (Elaveniya and Jayamuthunagai, 2014).
Organoleptic results were not significantly different in terms of colour, flavour,
after taste and mouthfeel at even the 75% level of substitution with YBPF in biscuit
(Joshi, 2007).
Overall, replacement of BF, regardless of ripeness degree, was feasible up to 15%
for achieving optimal quality and maximum 30% for functional purposes in
confectionaries (Carvalho and Conti-Silva, 2018). Still, quality control of produced
different types of cakes with BPeF is needed to be investigated.
2.5.4. Gluten-free products
Because of the rise of the gluten related disorders, such as celiac disease and
dermatitis herpetiformis, it has been essential to expand the gluten-free (GF) food
market. Moreover, considering that untreated celiac disease contributes to intestinal
cancer, nutrient deficiencies and oxidative stress, developing GF products with the
consideration of additional nutritional values is highly important (Wang et al.,

CHAPTER 2: LITERATURE REVIEW
40
2017b). In this regard, bioactive compounds are a prominent ingredient in GF foods.
As most of GF starchy products do not provide proper technological qualities,
application of different types of BF has been considered recently (Torres et al., 2017).
2.5.4.1. Physicochemical properties
Zandonadi et al. (2012) reported a reduction in protein and increase in ash content
in a 47% GBPF fortified-GF pasta. Also, cooking time increased significantly for GF-
pasta samples. Researchers attributed this to more presence of RS in GF-samples,
which had a higher gelatinization temperature, hence, needed more time for being
fully cooked. An increase in ash, TDF and MC content was reported in a GF-layer
cake made with 100% GBPF compared to 100% corn flour one (Segundo et al., 2020).
Also, substitution of corn flour with GBPF improved the yellowness and lightness
index in the samples.
2.5.4.2. Structural (textural) properties
By incorporation of 47% commercial GBPF in 100 g pasta formulation, Zandonadi
et al. (2012) studied on a GF-pasta with an additional proportion of egg white and
hydrocolloids. Regarding excess amount of water absorption during cooking,
increased stickiness of the product led to a weakened structure with a higher
cooking loss compared to standard pasta sample. However, Rachman et al. (2019)
reported that optimum cooking time decreased in a GF-pasta made with 100% BF

CHAPTER 2: LITERATURE REVIEW
41
because of the poor structure in the absence of a gluten network which resulted in
faster water penetration into the pasta structure. Likewise, a decrease in firmness
was reported in Rachman et al. (2019) study which was associated to the use of egg
white, guar and xanthan gums in GF-samples. Similar behaviour was reported in
100%-banana GF-pasta together with extensibility decrease (Rachman et al., 2019).
The authors ascribed this due to the lower protein content of banana flour (maturity
level was not mentioned). They showed with increasing protein content by the
addition of egg white powder, firmness can be increased significantly.
Gluten free bread has also been produced by the use of BF. In a study conducted by
Sarawong et al. (2014a), while crumb firmness increased in 15% of green plantain
flour addition, bread volume improved by 25% addition at a lower baking
temperature over a longer time. An elevated proportion of green plantain flour in
GF-bread contributed to higher water binding capacity and a reduction in
retrogradation owing to the presence of extra starch hydration. Also, breadcrumb
started to become significantly darker at 5% addition level. In sweetened GF-bread,
both green and yellow fortified bread samples showed lower volume, lesser height
and darker colour, but, when black banana pulp flour was utilized at 20% of the
formulation, those variables improved to a significant level (Seguchi et al., 2014).
The substitution of 15% of GBPeF was with rice flour in GF cake gave rise to a
decrease in GF cake volume. Due to an increase in viscosity, the density of banana
GF cakes rose (Türker et al., 2016). Higher water absorption and soluble DF in GBPF
made the GF-sponge cake batter fortified with 30% GBPF show the highest storage

CHAPTER 2: LITERATURE REVIEW
42
modulus amongst all samples, even those made with corn flour (Segundo et al.,
2020). They correlated the compacted structure in the layer cake batter made with
100% GBPF instead of corn flour to larger size of banana starch molecules compared
to corn flour ones. Increased elastic properties (G’) also might lead into a decrease
in gas expansion during baking of cake samples (Segundo et al., 2020).
2.5.4.3. Nutritional and sensory attributes
Radoi et al. (2015) reported a growth in total phenolic acids, cinnamic acids and
minerals (mainly Fe, Cu, Zn, Mn, and Ni) with presence of 30-40% banana pasta.
Also, Seguchi et al. (2014) showed an increase in RS amount could be achieved by
2.5% fortification of GF-bread. In terms of antioxidant activity, baking temperature
could decrease the phenolic compounds. The addition of 28.5% of commercial
GBPF to GF-muffins resulted in a reduction in the antioxidant activity. This was
associated with the high temperature applied during baking which led to the
degradation of essential compounds such as phenolics and anthocyanins (Radünz
et al., 2020). Overall quality of GF-pasta fortified with 47% GBPF received better
scores in sensory evaluation (Zandonadi et al., 2012). Similar acceptability index
was reported in Radünz et al. (2020) study carried out on fortified GF-muffins with
28.5% of commercial GBPF.
The GF-food products should be nutritious enough in order to compensate the loss
of high-protein flour which contains minerals, vitamins and dietary fibres. Besides,

CHAPTER 2: LITERATURE REVIEW
43
the texture undermines negative changes, especially in products which high
porosity and specific volume is required. The insufficient work on textural and
rheological aspects of GF-foods and contradictory results shows that still there is a
need for more research in this area. Table 2.3 summarizes the detailed findings of
the literature.

CHAPTER 2: LITERATURE REVIEW
44
Table 2.3. banana flour application effect on different properties of food products
Food product
Type and
level of
banana fort.
Drying
method
Physicochemical properties
Textural/ rheological
properties
Volatile
analysis
Storage quality Ref.
Bread
Chinese
steamed
bread
GBPF (10,
15%)
OD at 50 °C/
18 h
↑ SV
↓ L*, b*
↑ Hardness
↓ Cohesiveness and
adhesiveness
NA NA
(Loong
and
Wong,
2018)
Non
fermented
gluten-added
flat bread
GBPF (38%) OD at 50 °C
↑ Ash, MC, RS, TDF in GBPF and fortified
bread
↓ Lipid, HI and pGI
NA NA NA
(Juarez-
Garcia et
al., 2006)
Leavened
gluten-added
bread
Commercial
BF (10-30%)
(banana
ripening stage
NA
↑ Loaf volume up at 10% with a reduction
at higher levels
↓ Freezable water above 20%
↑ MC at 20%
↑ G′ in 30%-samples
Bread firmness (staling):
At -20, 4 and 25°C:
↓ Up to 10%
NA
↓ firmness at -20, 4
and 25 °C until
the second day at
10%
(Mohame
d et al.,
2010)

CHAPTER 2: LITERATURE REVIEW
45
was not
mentioned)
↓ L* in crumb and crust without a
significant change in a* of crumb
then ↑ (from 20% was no
significant)
Only in -20°C firmness
increasing wasn’t
significant after 2,5 and 7d
Equal firmness
after 7 days
storage at -20 °C
for 30%-sample
Steamed
gluten-added
bread
GBPF (30%)
OD at 60 °C/
12 h
↑ WHC and OHC
↑ Volume
↓ L*
↑ RS, ash, TDF, fat
↑ K, Mg and Ca in both
↑ Hardness and
adhesiveness
↓ Cohesiveness, elasticity
and chewiness
NA NA
(Noor
Aziah et
al., 2012)
Freeze-dried
Tortilla
bread (with
corn flour)
Commercial
GBPF (40%)
NA
↓ Prt and TDF
↑ RS, ash, fat and TS remained constant
↑ HI
↑ pGI in 0h, decreased after 1d
NA
NA NA
(Aparicio-
Saguilan
et al.,
2013)
Composite
bread with
BPsF (10%)
OD at 60 °C/
24 h
↓ SV, LV, LH
↑ SV in presence of NaCMC
WL remained constant
NA NA NA
(Ho et al.,
2013)

CHAPTER 2: LITERATURE REVIEW
46
hydrocolloid
s
↑ ρ
↑ Ash, MC, TDF
↓ Prt, fat, L*
↑ Phenolics, DPPH and FRAP values
Unleavened
Indian flat
bread
YBPeF (5-20%)
35 °C/
unknown
time
↑ Total phenolic content and flavonoid
↑ Antioxidant activity, free radical
scavenging activity and flavonoid
content
↑ WHC
↓ L* starting at 5%-samples
↑ Dough stickiness,
strength, adhesion,
rollability and kneading
Sticky dough at 20%
↓ Extensibility and tear
force
NA NA
(Kurhade
et al.,
2016)
Balady flat
bread
GBPeF (5%,
10%)
At room for 6
d
↑ Prt, TDF, WHC and fat
↑ WHC and OHC
↓ MC
↑ Ca in 5% but ↓ in 10%-sample
↑ Mg, Zn, Fe, K
↓ P
NA NA NA
(Eshak,
2016)

CHAPTER 2: LITERATURE REVIEW
47
Leavened
bread
GBPF (10-30%)
OD at 60 °C/
24 h followed
by a 24 h
fermentation
↑ MC in 30%
↑ Swelling properties and ρ in 30%
Ash and fat, Zn and Fe remained constant
in all samples
↑ TDF and prt
↓ L*
NA NA NA
(Adebayo
-Oyetoro
et al.,
2016)
Leavened
bread
GBF (10, 20%)
OD at 50 °C/
72 h
↓ SV
↑ TDF and ash
↓ caloric value, prt
↓ L*
↑ Hardness in 20% NA NA
(Gomes et
al., 2016)
Pasta products
Wheat pasta GBPF (1-5%)
FD at 40 °C/
12 h
↑ Cooking loss
↓ L* and b*
↓ Antioxidant activity
Water absorption remained constant
↑ Firmness only up to 3% NA NA
(Biernack
a et al.,
2020)

CHAPTER 2: LITERATURE REVIEW
48
Spaghetti GBPF (15-45%)
50 °C/
unknown
time
↑ Diameter of cooked spaghetti in 30%
↑ WBC (Only in 15%)
↓ L*
Hardness and elasticity
remained constant
↑ Adhesiveness and
chewiness
NA NA
(Agama-
Acevedo
et al.,
2009)
Spaghetti GBPF (15-45%)
50 °C/
unknown
time
↑ Cooking loss from 15% but constant in 30
and 45%-samples
↓ Prt and fat
↑ Ash and RS (42% in BF and 12% in 45%-
sample)
↑ In vitro carbohydrate hydrolysis rate in
control sample
↑ Polyphenols
↑ Antioxidant capacity
NA NA NA
(Ovando-
Martinez
et al.,
2009)
Yellow
alkaline
noodles
GBPF
GBPeF
YBPF
YBPeF
OD at 60 °C/
12 h
pGI:
Least pGI was observed in GBPeF
RS:
GBPF > GBPeF
↑ Elasticity in pulp-
enriched samples
NA NA
(Ramli et
al., 2009)

CHAPTER 2: LITERATURE REVIEW
49
Prepared from
2 varieties
(10%)
TDF:
GBPF < GBPeF
Semolina
pasta
Commercial
GBPF (10-30%)
↓ Prt and fat
↑ TDF
↑Antioxidant capacity
↑ Minerals
↑ Cooking loss
↓ L*
↓ Firmness NA NA
(Krishnan
and
Prabhasan
kar, 2010)
Pasta paste
Whole green
banana paste
(25-75%)
No drying
and
extrusion
↑ Ash,
↓ crude fibre, prt, MC
↓ Oxidative
damage in rat kidneys
NA NA NA
(da Silva
et al.,
2016)
Tagliatelle
pasta
GBPF 4:1
GBPeF (15,
30%)
OD at 60 °C/
20 h
↑ Ash, fat, TDF
MC and colour remained constant
↓ Prt
NA NA NA
(Castelo-
Branco et
al., 2017)

CHAPTER 2: LITERATURE REVIEW
50
Confectionaries
Cookie GBPF (15-50%)
OD at 50 °C/
unknown
time
↑Ash, MC, TDF and RS (from 2.3 to 8.37%)
↓ Prt and fat in 30 and 50%-samples
↓ HI and pGI in 30 and 50%-samples
NA NA NA
(Agama-
Acevedo
et al.,
2012)
Fish cracker
Cassava
cracker
GBPF (5-25%)
GBPF (10-50%)
FD at 50 °C/
12 h
↑ Ash, TDF
↑ ρ
↓ porosity
↓ L*
↑ b*
↑ K, Mg, P and Ca
↓ Fat
↑ Total polyphenol and superoxide radical
scavenging capacity
Water absorption remained constant
NA NA NA
(Wang et
al., 2012)

CHAPTER 2: LITERATURE REVIEW
51
Sponge cake
Layer cake
YBPF (20, 40%
substituted
with sugar)
NA
↑ DF (<1%)
↑ Polyphenols
↑ Hardness
↓ Cohesiveness
Constant springiness
NA NA
(Segundo
et al.,
2017b)
Biscuits YBPF (4%)
OD at 60 °C/
12 h
↓ L*
↑ Spread ratio
↑ WHC and OHC
↑ Total phenolic and flavonoid content
NA NA NA
(Mahloko
et al.,
2019)
Gluten-free products
Pasta
Commercial
GBPF (47%)
NA
↓ Fibre, prt, lipid
↑ WHC
↑ Volume
↑ Ash
↑ Stickiness
↓ Firmness
NA NA
(Zandona
di et al.,
2012)
Pasta
Commercial
GBPF (47-80%)
NA ↓ Digestion rate in fortified samples NA NA NA
(Zheng et
al., 2016)
Bread
Commercial
GBPF (5-35%)
NA
↓ L* at 5%
↑ SV up to 25%
↑ RS in all fortified samples up to 2.5%
↑ Firmness at 15% NA NA
(Sarawon
g et al.,
2014a)

CHAPTER 2: LITERATURE REVIEW
52
Bread
GBPF
YBPF
BBPF
(22%)
FD (15 °C/70
h)
BBPF-fortified breads:
↑ Bread height
↑ SV
↓ L* in all samples
↓ µ in BBPF-fortified
samples
NA NA
(Seguchi
et al.,
2014)
Cake
GBPeF (5-20%
substituted
with rice flour)
FD (48 h)
↓ Vol
↑ ρ
↓ Baking loss (15%, 20%)
NA NA NA
(Türker et
al., 2016)
Other food products
Jelly
BPeF (10-30%)
(semi ripe)
FD (48 h)
↑ Ash, prt, fat, TDF, carbohydrates and
pectin
↑ Total phenolic and flavonoids
↓ MC
↑ Hardness, chewiness and
springiness with increasing
BPeF compared to lower
levels
NA NA
(Lee et al.,
2010)
Fermented
synbiotic
milk
GBPF (1-5%)
OD for 24 h
(unknown T)
↓ pH after 14 days
↑ Post acidification, proteolysis and
concentration of lactic and acetic acids up
to 3%
↑ Probiotic growth after a week of storage
NA
↑
Hexanol
and
pentanol
after 14
↑ Hardness after
two weeks of
storage
(Batista et
al., 2017)

CHAPTER 2: LITERATURE REVIEW
53
↑ RS up to five times in 5%-samples
↓ RS after 21 days of storage
days of
storage
↑ 2-
nonanon
e in at
least 3%-
samples
Ice cream
GBPF and
GBPeF (1-2%)
OD at 60 °C/
12 h
↓ Overrun value in all fortified samples
↑ K, Mg, P, Fe, Zn and Na in all peel-
fortified samples compared to pulp ones
↓ Ca in both sample types
↓ L* more in peel-fortified samples
↑ µ in 2%-peel fortified
samples
↓ µ in all pulp samples
NA NA
(Yangilar,
2015)
Dried
banana
YBPF
Heat pump
drying for 24
NA NA
↓ Ester,
alcohol
and
NA
(Saha et
al., 2018)

CHAPTER 2: LITERATURE REVIEW
54
h (unkno wn
T)
aldehyde
compoun
ds right
after
drying
Banana
powder
YBPF
Vacuum belt
drying (1150
Pa)
FD
OD (75 °C)
NA NA
Preserve
d 3-
methylbu
tanoic
acid 3-
methylbu
tyl ester,
3-
methylbu
tyl
acetate in
NA
(Wang et
al., 2007)

CHAPTER 2: LITERATURE REVIEW
55
FD-
sample
BPsF, banana pseudo-stem flour. ρ density, FDF, freeze-dried flour, FD, freeze-dried, GBF, whole green banana flour, GBPF, green banana pulp flour, GBPeF,
green banana peel flour, YBPF, yellow banana pulp flour, YBPeF, yellow banana peel flour, BBPF, black banana pulp flour, ODF, oven-dried flour, OD, oven-
dried, SV, specific volume, µ, viscosity, vol, loaf volume, ρ, density, RS, resistant starch, WHC, water holding capacity, OHC, oil holding capacity, TDF, total
dietary fibre, prt, protein, MC, moisture content, L*, lightness index, b*, yellowness index, HI, starch hydrolysis index, pGI, predicted glycaemic index, T,
temperature.

CHAPTER 2: LITERATURE REVIEW
56
2.6. Conclusion
It is desirable to find proper food applications for banana pulp and peel for
achieving two goals: First, helping the environment through sustainability by
utilizing secondary processing products and second, creating a new outlook for
consumers and producers for generating value-added food products. Besides
adding nutritional value to food products, GBF also stands out for not creating
production waste, thus representing the complete use of the fruit, increasing the
yield and reducing manpower costs due to peeling which is not required. In gluten-
added starchy products, such as bread, cake and pasta, textural properties were not
negatively affected by banana flour addition to a certain extent. As discussed in this
chapter, there are several methods for producing banana flour. Comparing new
drying technologies with existing methods and their effect on bioactive components
of produced products would be an important subject for future research. This was
one of the areas that has been covered in this thesis.

Chapter 3

CHAPTER 3: RESEARCH STRATEGY
58
Research strategy
Chapter aim:
This chapter shows the detailed objectives of this thesis.

CHAPTER 3: RESEARCH STRATEGY
59
3.1. Research problem statement
As discussed in the literature review, it is clear that over the past decade, a wealth
of research has been done on the impact of different types of banana flour (BF) on
various food quality attributes. What is applicable in food industry though, is to
what extent this new food ingredient can improve nutritional and technological
properties. Comparing the composition of different types of BF (yellow banana
pulp flour, yellow banana peel flour, green banana pulp flour, green banana peel
flour) showed higher nutritional value of GBPF and GBPeF. In addition to showing
an overall significant difference from the technological point of view in food
applications, the use of unripe fruit flour exhibited higher total dietary fibre (TDF),
resistant starch (RS) and antioxidant activity in the final product compared to the
application of ripe banana flour. However, the following topics were either missing
from the literature or were not been thoroughly investigated.
3.1.1. Preparation of the whole green banana flour
Considering that 40% of green banana weight is in its nutritious peel, hence, this
part was removed in most of the “green banana fortification” studies. The
application of both peel and pulp was studied separately in some studies and
compared with each other (Table 2.3). However, preparing a flour from the whole
fruit and fortifying bread to then investigate its effect on different dough and bread
properties was seldom studied. Chapter 4 and 5 focuses on optimizing the drying

CHAPTER 3: RESEARCH STRATEGY
60
methods (thermal and non-thermal techniques) with providing a full
characterization of produced samples, ranging from technological to nutritional
aspects.
3.1.2. Textural properties
The structure of bread particularly dependent on its high protein content (Segundo
et al., 2017a). Gluten, is generally claimed to be a superior compared to other protein
molecules in terms of creating a complex to bring elasticity in dough and optimum
hardness in bread (Mancebo et al., 2017). However, use of other food ingredients,
such as shortenings, hydrocolloids, milk powder, egg white powder has been
commonly researched in fortified breads with other BF types instead of wheat flour
(Ferrero, 2017, Curti et al., 2017). As observed in Table 2.3, the knowledge about
textural changes after BF fortification is limited. Changes in textural properties of
bread could be related to one step earlier, dough making. viscoelastic behaviour of
dough [Storage modulus (G′), loss modulus (G′′), loss tangent (tan δ), complex
modulus (G*) and complex viscosity (|ɳ*|)] together with large deformation
mechanical alterations (hardness, adhesiveness, resilience, cohesiveness,
springiness) after dough making, could show a better understanding of
forthcoming changes in bread texture. Chapter 6 focuses on examining these
properties and also bread textural properties.

CHAPTER 3: RESEARCH STRATEGY
61
3.1.3. Starch analysis
Increasing prebiotic intake via food products has been an interest amongst food
producers for decades. The importance of delivering effective dosage of these DFs
confirms the necessary analysis of the fortified food products to quantify these
components. In particular of interest, resistant starch (RS) is the dominant prebiotic
in green banana, and it is vital to keep this DF intact until consumption. The review
on literature showed that the studies conducted on RS remaining content of BF and
the bread produced from it still needs more work. In order to understand the
changes in starch from flour to bread, RS content was analysed in both flour and
bread to monitor the loss of this prebiotic during the breadmaking process. Also,
Chapter 7 gives a comprehensive outlook to starch digestion showing the
concentration of slow digestible and rapidly digestible starch.
3.1.3. Volatile compounds fingerprint
There is a lack of knowledge on the specific volatile compounds which are
responsible for fortified bread with BF. While sensory evaluation was the main
focus on many studies, analysis of volatile profile was neglected. Considering the
mixed results in descriptive sensory analysis of different BF-bread products,
Chapter 8 aims to investigate the chemical compounds which are responsible for
the distinctive fortified bread aroma.
CHAPTER 3: RESEARCH STRATEGY
62
3.2. Research strategy
For the first time in literature the whole green banana flour (GBF) was made with
freeze-drying and its properties, from both technological and nutritional aspects,
were compared to flour obtained from a modified drying method; an air-oven
drying technique with reduced drying time. In addition, to make a fortified bread
with acceptable structural properties, this study has provided a nutritious bread
with the consideration of sustainability and increasing the resistant starch intake.
Also, a comprehensive investigation on viscoelastic, textural and rheological
properties of both dough and bread was fulfilled in this thesis. Another area which
was not studied was the volatile profile of bread containing GBF. The last chapter
of thesis assessed the feasibility of using an untargeted headspace gas
chromatography mass spectroscopy fingerprinting and chemometrics to increase
insight into the volatiles in different bread fortified with different levels and types
of GBF. Detailed content of the objectives of this thesis is summarized in Table 3.1.

CHAPTER 3: RESEARCH STRATEGY
63
Table 3.1. The detailed content of the thesis experimental chapters
Experimental chapters Objectives
Chapter 4: Effects of different drying conditions on the
starch content, thermal properties and some of the
physicochemical parameters of whole green banana flour
1. Green banana flour preparation (air oven-drying, freeze-
drying)
2. Physicochemical properties of the GBF
3. Colour measurements
4. Oil and water holding properties
5. Relative crystallinity
6. Starch analysis (Resistant starch, total starch, amylose and
amylopectin)
7. Diffraction scanning calorimetry

CHAPTER 3: RESEARCH STRATEGY
64
Chapter 5: Textural properties and characteristics of
whole green banana flour produced by air-oven and
freeze-drying processing
1. Sample preparation
2. Particle size distribution
3. Textural properties
4. Pasting/ rheology properties
5. Fourier-transform infrared spectroscopy
6. Minerals analysis
Chapter 6: Rheological, textural and structural changes in
dough and bread partially substituted with whole green
banana flour
1. Green banana flour preparation
2. Dough preparation
3. Viscoelastic properties
4. Large deformation mechanical properties of dough
5. Bread preparation
6. Bread characteristics
7. Bread baking performance
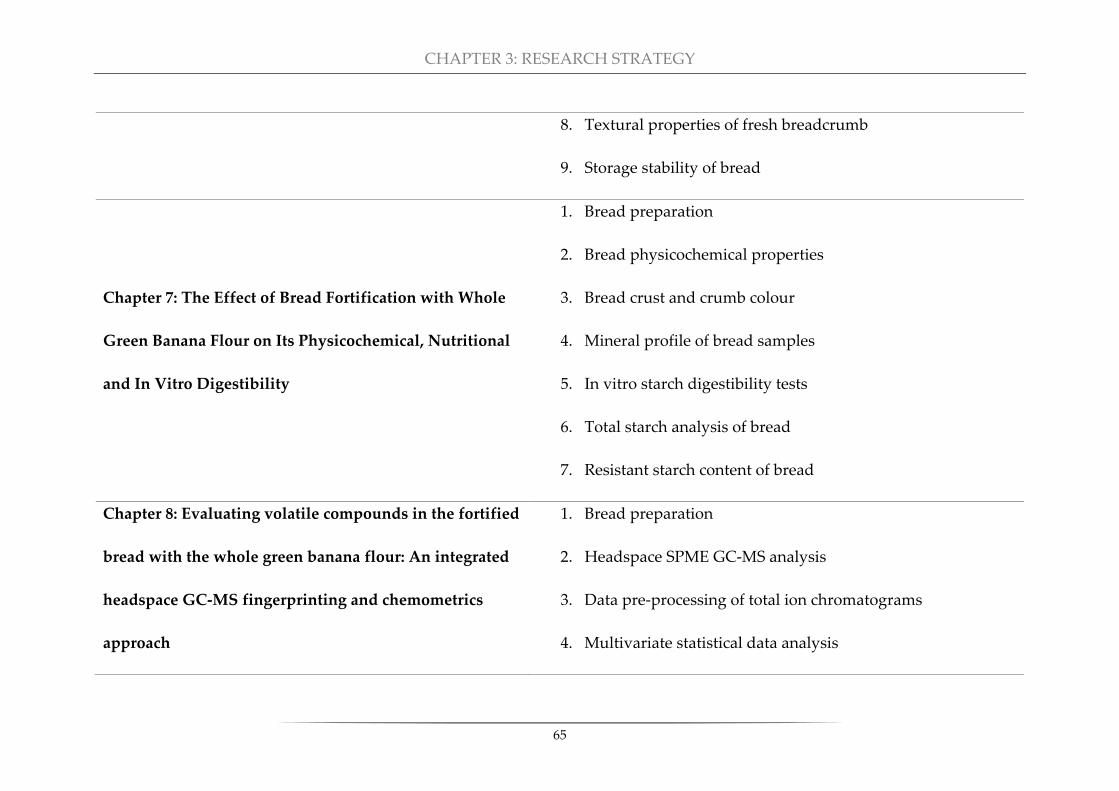
CHAPTER 3: RESEARCH STRATEGY
65
8. Textural properties of fresh breadcrumb
9. Storage stability of bread
Chapter 7: The Effect of Bread Fortification with Whole
Green Banana Flour on Its Physicochemical, Nutritional
and In Vitro Digestibility
1. Bread preparation
2. Bread physicochemical properties
3. Bread crust and crumb colour
4. Mineral profile of bread samples
5. In vitro starch digestibility tests
6. Total starch analysis of bread
7. Resistant starch content of bread
Chapter 8: Evaluating volatile compounds in the fortified
bread with the whole green banana flour: An integrated
headspace GC-MS fingerprinting and chemometrics
approach
1. Bread preparation
2. Headspace SPME GC-MS analysis
3. Data pre-processing of total ion chromatograms
4. Multivariate statistical data analysis

CHAPTER 3: RESEARCH STRATEGY
66
5. The overall effect on crumb and crust
6. Effect of Crumb/ Crust per each fortification levels
7. Effect of fortification level in crumb and crust per processing
8. Effect of processing on crumb and crust

Chapter 4
CHAPTER 4: GREEN BANANA FLOUR COMPOSITIONAL PROPERTIES
68
Effects of different drying conditions on the starch content, thermal
properties and physicochemical parameters of whole green banana
flour
This chapter has been published as:
AMINI KHOOZANI, A., BEKHIT, A. E.-D. A. & BIRCH, J. 2019. Effects of different
drying conditions on the starch content, thermal properties and some of the
physicochemical parameters of whole green banana flour. International Journal of
Biological Macromolecules, 130, 938-946.
Chapter aim:
The chapter’s aim is to evaluate the effects of freeze-drying and air oven-drying at
three different temperatures on the resistant starch content, thermal properties and
some physicochemical parameters of whole green banana flour.

CHAPTER 4: GREEN BANANA FLOUR COMPOSITIONAL PROPERTIES
69
4.1. Introduction
The increased demand for functional food products has led to an increased interest
in nutrients such as minerals, vitamins, bioactive compounds, fibre and prebiotics
to be present in food formulations (Coleman et al., 2014). Amongst the prebiotics,
resistant starch (RS) has gained a lot of attention in recent years, due to its
acknowledged health benefits such as prevention and control of colon cancer,
diabetes, and obesity (Birt et al., 2013). Resistant starch is present in grains, legumes
and seeds (RS1), raw starchy plants (RS2), retrograded starchy foods (RS3),
chemically modified starch (RS4) and in amylose-lipid complexes (RS5) that are
considered to be physically inaccessible to digestion (Chávez-Salazar et al., 2017).
Banana, the world’s most favourite fruit, is one of the richest sources of RS2 at early
stages of ripeness (Campuzano et al., 2018).
Globally, banana is reported to be the fourth most demanded food after rice, wheat
and corn (Silva et al., 2015). According to FAO, banana (Musa Cavendish, AAA group)
is an essential part of New Zealanders diet with a per capita consumption on
average of 20 kg of banana per year, which is reported to be more than the
worldwide average consumption (FAOSTAT, 2018). However, banana is the second
most discarded food in New Zealand after bread, contributing to 3% of the total
food waste (Edmunds, 2015). Banana is a perishable food commodity and is also
sensitive to postharvest defects including bruising during transportation and
browning because of inappropriate ripening environment (Maunahan et al., 2018).

CHAPTER 4: GREEN BANANA FLOUR COMPOSITIONAL PROPERTIES
70
Unripe banana is rich in RS which is recognized to have positive effects on colon
health (Moongngarm et al., 2014), while ripe banana contains more digestible starch
and protein (Ramli et al., 2009). Banana consists of two parts, the banana pulp (BP)
and the banana peel (BPe). The pulp is a rich source of essential phytonutrients,
phenolic compounds, B group vitamins, ascorbic acid and tocopherols, while the
BPe is a rich source of minerals, bioactive compounds and dietary fibre (DF) such
as pectin, cellulose, hemicelluloses and lignin (Zhu et al., 2018).
Considering the nutritional value of both pulp and peel of green bananas, the
production of banana flour (BF) obtained by drying, provides a way of preserving
the nutritional benefits and increasing the shelf-life of banana material (Wang et al.,
2017a). The drying conditions used, such as different temperatures and humidity
levels, can have a profound influence on both functional and technological
characteristics of the obtained BF.
The effects of room drying (Eshak, 2016), air oven-drying (Yangilar, 2015, Segundo
et al., 2017a), spouted bed with hot air flow (Bezerra et al., 2013b), pulsed-fluidized
bed agglomeration (Rayo et al., 2015), ultrasound and pulsed-vacuum followed by
air drying (La Fuente et al., 2017), microwave heating (Vu et al., 2017), freeze-drying
(Türker et al., 2016, Vu et al., 2017) and spray drying (Oi et al., 2013) on some of the
attributes of different green banana parts have been discussed in chapter 2.
However, the collective information available comparing different air oven-drying
temperatures with non-heat treatment processes on properties of the whole green
banana flour (GBF), especially on RS content and hydration properties, have

CHAPTER 4: GREEN BANANA FLOUR COMPOSITIONAL PROPERTIES
71
scarcely been reported in the literature. Additionally, the effect of freeze drying,
which is considered to be one of the best dehydration methods for heat-sensitive
materials, on thermal properties and starch content of GBF has not yet been
investigated.
Compared to other methods of drying, freeze-drying is considered to be the best
dehydration method for heat-sensitive materials to enable achievement of the
highest possible quality, minimal comprising of colour, structure, nutrients and
flavour (Ahmed et al., 2020). As most of the leading banana producers are located
in developing countries, a simple and efficient drying method would be preferable
for production of GBF with the highest possible yield and quality. Consequently,
from the feasibility point of view in the food industry and the minimum effect on
green banana nutrients, air oven-drying and freeze-drying (followed by blast
freezing) were chosen for analysis in the present chapter, to investigate the effect of
banana drying process on the properties of the produced flour. This chapter aims
to evaluate the effect of freeze-drying and of three different air oven-drying
methods on whole GBF, with examination of the effects of these methods on the
starch content, functional behaviour and physicochemical properties.

CHAPTER 4: GREEN BANANA FLOUR COMPOSITIONAL PROPERTIES
72
4.2. Materials and Methods
4.2.1. Sample preparation
A total of 20 kg green banana (Musa Cavendish spp AAA) was supplied by a local
food supply company in Dunedin, New Zealand between February and March
2018. The bananas were harvested approximately 100 days after anthesis and were
not exposed to any maturation treatments. Bananas were processed on arrival and
were used for the measurement of pH, firmness, total soluble solids and titratable
acidity. The production steps used to produce the GBF are shown in Fig. 4.1. Wheat
flour (WF) was provided by the same local food supply company in Dunedin New
Zealand and was used as a reference sample.
4.2.2. Method optimisation
The process of selection and optimisation of the proper drying method took around
four months based on the availability of the equipment at University of Otago,
feasibility of applied methods in industry and novelty in literature (Table A1,
appendix). For achieving the best comparison, drying methods was applied in two
types: thermal and non-thermal. The selection of a thermal heat treating amongst
dehumidified drying, spouted bed with hot air flow, microwave, spray drying,
ultrasound and pulsed-vacuum followed and air-oven drying was based on these
factors: literature study, availability of the equipment for a large scale sample
preparation in a specific time period, the cost of renting the equipment from other

CHAPTER 4: GREEN BANANA FLOUR COMPOSITIONAL PROPERTIES
73
departments, feasibility in food industry and how common a method is at the
moment. The selection of the temperatures was based on the literature in the area
of drying fruits. The 50 °C was selected as the lowest (based on the constant weight
measurement method) and the 110 °C was selected as the maximum temperature
in regards of the minimum drying time. The 80 °C was selected as the median one.

CHAPTER 4: GREEN BANANA FLOUR COMPOSITIONAL PROPERTIES
74
Figure 4.1. Flow chart of green banana flour production by freeze-drying and oven-
drying

CHAPTER 4: GREEN BANANA FLOUR COMPOSITIONAL PROPERTIES
75
4.2.3. Sample characterization
The pH of processed banana samples was measured using a pH meter (HANNA
Instruments, Woonsocket, USA). Titratable acidity was determined according to the
official method 942.15 AOAC (AOAC, 2005) by titration with 0.1 N sodium
hydroxide until a phenolphthalein indicator was just changed into a light pink
colour. A hand-held refractometer (ATAGO N1, California, USA) was used to
determine the total soluble solids with correction for acidity and temperature
values according to Kar et al. (2003). Total solids were assessed by gravimetric
determination after drying at 60 °C under a pressure of 60 mmHg for 16 hours.
4.2.4. Green banana flour production
The procedure was performed based on Yangilar (2015) method with modifications.
After rinsing the supplied green bananas with distilled water containing sodium
hypochlorite (10 g/l), the bananas were immersed in 0.5% (w/v) citric acid solution
for 15 min and then drained, in order to minimize the enzymatic browning. The
unpeeled green bananas were then cut into slices with two mm thickness and then
dipped in 0.5% (w/v) citric acid solution for 15 min and then drained well. The
treated sliced bananas were dried using either an air oven-drying method or freeze-
drying method. The optimum condition of the drying methods was achieved based
on literature and preliminary tests (Fig B1-B4, appendix).

CHAPTER 4: GREEN BANANA FLOUR COMPOSITIONAL PROPERTIES
76
4.2.4.1. Air oven-drying method
The sliced bananas were distributed on screened trays and transferred into a pre-
heated forced-air oven-dryer (Steridium, Marrickville, NSW, Australia) at either 50
°C, 80 °C, or 110 °C for 7, 4 or 2 h, respectively, until no further change in weight
was achieved.
4.2.4.2. Freeze-drying method
The banana samples were placed on stainless steel trays in a blast freezer (IRINOX,
Treviso, Italy) at -30 °C for 4 h and then transferred to a freeze dryer (SP Scientific,
New York, USA) for 48 h until the water activity reached below 0.4. The dried green
banana slices that were subjected to either of the drying methods were then
grounded in a home coffee grinder for 30 seconds per batch and the powder was
passed through a 100 mesh (150 mm) screen, then vacuum packed, and stored at 4
°C until used for analysis.
4.2.5. Physicochemical properties of the banana flour
Some of the physicochemical properties, such as water activity (aw), moisture
content, ash, protein, lipid and carbohydrate contents were determined according
to the AOAC 2000 standard methods (AOAC, 2005). The aw was measured by an
Aqualab device (Decagon Devices, Washington DC, USA) at 24 °C. The moisture
content of the samples was determined using a vacuum oven dryer (Thermoline,

CHAPTER 4: GREEN BANANA FLOUR COMPOSITIONAL PROPERTIES
77
Australian Marketing Group, Marrickville, NSW, Australia) at 60 °C for 16 hours
(Method 925.40; AOAC 2000). The ash content was determined using a furnace at
550 °C for 4 h (Method 923.03; AOAC 2000). The Kjeldahl method was used to
determine the protein content (%N×6.25) of samples using Method 923.03; AOAC
2000 based on the digestion of samples with concentrated H2SO4, distillation with
NaOH 35% and titration with 0.01 HCl. The lipid content was determined by the
Soxtec machine based on extraction by the petroleum ether (Method 920.39; AOAC
2000) (AOAC, 2005). The carbohydrate content was calculated by difference using
the following equation:
Carbohydrate (g/ 100 g) = 100 - [moisture content (g) + ash (g) + protein (g) + lipid (g)]
4.2.5.1. Colour measurements
The colour of banana samples was assessed by using a Hunterlab
Spectrocolorimeter (Hunter Lab Mini Scan Plus Colorimetric, USA). The colour
parameters were defined using the CIE L*a*b* system, where L∗ (L∗ = 0 is complete
black and L∗ = 100 is perfect white), a∗ (−a∗ = greenness and + a∗ = redness) and b∗
(−b∗ = blueness and +b∗ = yellowness) (Nasrin et al., 2015).
Chroma values (C) that were near zero were interpreted to indicate subdued colour,
whereas high chroma values were interpreted to specify a more vibrant colour.
Browning index and chroma were measured by the following formula (Cornejo and
Rosell, 2015).

CHAPTER 4: GREEN BANANA FLOUR COMPOSITIONAL PROPERTIES
78
Chroma= √a2+b2 (4.1)
Browning index = 100(x-0.31)
0.17, where x is obtained using the formula 4.2:
x = a* + 1.75L*
5.645L* + a*- 3.012b* (4.2)
4.2.5.2. Oil and water holding properties
The oil holding capacity (OHC), water holding capacity (WHC), solubility index
(SI) and swelling power (SP) were determined according to the methods of Nasrin
et al. (2015). One g aliquots of banana sample were dispersed in either 50 mL of
distilled water to determine the WHC, or 50 mL of canola oil to measure the OHC
in previously weighed centrifuge tubes (Nalgene, Rochester, USA.). The tubes were
capped and placed in a water bath at various temperatures (40 °C, 60 °C and 80 °C)
for 30 min with intermittent stirring. The tubes were then cooled to room
temperature and then centrifuged at 1500 g for 20 min. The OHC was calculated as
g of oil per g of dried flour. The supernatant generated from the centrifugation step
in the WHC measurement was dried at 105 °C for 5 h to determine the SI (g/ 100g).
The paste was weighed and then dried for 5 h at 100 °C. The WHC (g/ g) and SP (g/
g) were determined according to the following formula (Abbas et al., 2009):
WHC = (W3- W4)/ W4, where W3 and W4 are the weights of wet residue and dry
residue, respectively.

CHAPTER 4: GREEN BANANA FLOUR COMPOSITIONAL PROPERTIES
79
SI = W2
W1×100, where W1 and W2 are the weights of the dry sample itself and the
dry sample in supernatant, respectively.
SP = W3
W4
(4.3)
For determination of emulsion activity (EA), a mixture consisting of 10 mL of
distilled water, 10 mL of soybean oil and one g of the sample was transferred into a
calibrated centrifuge tube after mixing for two minutes. After centrifugation at 1500
g for 5 min, the ratio of the height of emulsion layer to the total height of the mixture
in the tube was recorded as EA percentage (Rodríguez-Ambriz et al., 2008)
After keeping the emulsion at 80 °C for 30 min in a heated water-bath, the tubes
were cooled down under running cold tap water for five minutes until it reaches to
the ambient temperature and then centrifuged at 1500 g for 15 min. The emulsion
stability was calculated as the ratio of the height of the emulsified layer compared
to the total height of the mixture in the tube (Rodríguez-Ambriz et al., 2008)
4.2.6. Relative Crystallinity
An X-Ray diffractometer (Bruker Model D8 Discover, Billerica, USA) was set up
with the following parameters; 30 mA and 40 kV, a diffraction angle (2θ) range of
5– 40°, a 0.03° step size and measuring time of 15 s, according to the method
reported by Campuzano et al. (2018). The relative crystallinity (RC) was calculated
according to the following equation:

CHAPTER 4: GREEN BANANA FLOUR COMPOSITIONAL PROPERTIES
80
RC (%) = (Ac
Ac+Aa) × 100, where Aa is the amorphous area and Ac is the crystalline
area obtained from the graph provided by the device. These areas were quantified
using the software Origin® 2017 (OriginLab Corporation, Northampton, USA).
4.2.7. Starch analysis
4.2.7.1. Resistant starch
The RS content was determined according to the methodology of AOAC 2002.02,
using a Megazyme kit (Resistant starch assay kit; Megazyme International,
Wicklow, Ireland) according to the manufacturer guidelines. The samples were
incubated in a shaking water bath with two enzymes, pancreatic α-amylase and
amyloglucosidase (AMG) for 16 h at 37 °C in order to achieve complete hydrolysis
of the non-resistant starch. After centrifugation at 1500 g for 15 min at room
temperature, the pellet was washed with ethanol (50% v/v) and the supernatant was
decanted. The RS in the pellet was dissolved in 2 M KOH by vigorously stirring in
an ice-water bath for 20 min. The starch was quantitatively hydrolysed to glucose
with AMG and then the glucose determined using a glucose oxidase/peroxidase
reagent (GOPOD) and RS was calculated as mg of glucose × 0.9 (as the conversion
factor).
CHAPTER 4: GREEN BANANA FLOUR COMPOSITIONAL PROPERTIES
81
4.2.7.2. Total Starch
The total starch content was assessed according to the AOAC method 996.11 using
a kit (total starch assay kit; Megazyme International, Wicklow, Ireland). The
principle of the method involves the hydrolysis of starch using a thermostable α-
amylase into soluble branched and unbranched maltodextrins, according to the
method of Moongngarm et al. (2014). Digestible starch (DS) was determined by
pooling and washing the supernatant, adjusting the volume to 100 mL, and
measuring the D-glucose content with GOPOD. Resistant starch was subtracted
from TS to determine DS.
4.2.7.3. Amylose and amylopectin content
The amylose content was quantified using a commercial kit (amylose/amylopectin
kit; Megazyme International, Wicklow, Ireland) based on the separation of amylose
and amylopectin and precipitation of amylopectin with the addition of
concanavalin-A and removing it by centrifugation at 1500 g for 5 min at room
temperature.
4.2.8. Diffraction scanning calorimetry
Starch gelatinization temperature was examined by differential scanning
calorimetry (Diamond DSC, Perkin Elmer, Connecticut, USA), using an instrument
equipped with an intercooler unit (Perkin Elmer, Model 2P, USA.), with nitrogen as

CHAPTER 4: GREEN BANANA FLOUR COMPOSITIONAL PROPERTIES
82
the purge gas. Based on the method of Tribess et al. (2009), approximately two mg
(db) of the sample was accurately weighed in an aluminium pan and 7 µL of
deionized water was added. After tightly sealing the pans and maintaining them at
room temperature for an hour, the samples were exposed to a temperature gradient
from 24 °C to 120 °C at a rate of 10 °C min-1. The gelatinization/ peak temperature
(Tp), onset temperature (T0) and transition enthalpy (ΔH) and gelatinization range
(R) were obtained directly from the data curves using the Pyris® manager software.
4.2.9. Statistical analysis
Statistical analysis was performed by Minitab® program version 16 (Minitab,
Australia). After confirming that the data were normally distributed, the one-way
ANOVA test was applied to assess the significance of the differences among the
treatments for each variable. The correlation between the variables was determined
using Pearson’s correlation. The differences among the mean values were resolved
using Tukey’s test. The significance level was set at P-value < 0.05, with a confidence
interval of 95%. All the tests were performed in triplicates.
4.3. Results and discussion
4.3.1. Physicochemical properties
The physicochemical characteristics and firmness of green bananas are presented
in Table 4.1 compared to data reported by Tribess et al. (2009) and Abbas et al.

CHAPTER 4: GREEN BANANA FLOUR COMPOSITIONAL PROPERTIES
83
(2009). The results suggest that the banana samples used for GBF production was
at the first stage of ripeness.
Table 4.1. Characterisation of banana samples maturity using pH, total solid,
firmness and total acidity of green banana used in the present study compared
to literature findings
Banana characteristics
Data from literature*
Current
findings
First ripening
stage
Second
ripening
stage
pH 5.3 ± 0.1 4.8 ± 0.1 5.3 ± 0.1
Soluble solids (°Brix) 5 ± 2 7 ± 1 4.2 ± 1.0
Total solids (g/ 100 g) NR NR 30.7 ± 2.3
Firmness (N) 26 ± 6 14 ± 2 26.8 ± 3.0
Titratable acidity 0.24 ± 0.03 0.44 ± 0.03 0.32 ± 0.07
Mean values ± SD of triplicate determinations. NR, not reported
* Tribess et al. (2009), Abbas et al. (2009)
4.3.1.1. Proximate composition
The composition of GBF flour samples was compared to the reference control (WF)
and the results are shown in Table 4.2. Compared to WF, all GBF samples regardless
of the drying method showed significantly lower moisture content (MC), aw, protein

CHAPTER 4: GREEN BANANA FLOUR COMPOSITIONAL PROPERTIES
84
content and lipid content values, and significantly higher ash and carbohydrate
contents (P-value < 0.05). This behaviour was also reported in a report on green
banana pulp flour (GBPF) (Bezerra et al., 2013a). The lower water content in all GBF
samples indicated better stability and longer shelf life due to the lower potential for
microbial growth (aw < 0.4) and better stability against physical and chemical
reactions (Menezes et al., 2011). Amongst the GBF samples, as the drying
temperature increased above 50 °C, a substantial change in water content was
observed (P-value < 0.05), relating to the higher rate of drying compared to others
(Menezes et al., 2011). The FDF samples had the same carbohydrates, lipid, protein
and ash contents found in oven-dried samples. However, the FDF samples had
higher moisture content than the ODF80 and ODF110 (P-value < 0.05) and was not
different from ODF50 (Table 4.2). This could be due to the smaller particle size and
more porous structure of FDF.
As green banana have been considered as a valuable fruit due to its abundance in
minerals, taking advantage of the minerals in the BPe also results in higher amount
of ash compared to peeled green banana flour (Wang et al., 2017a). The results
indicated that carbohydrate content was over 80% of GBF (g/100 g db), which was
similarly found by Bezerra et al. (2013a) who investigated on GBPF. The inclusion
of the peel in addition to the pulp could lead to a greater amount of RS2 and RS3.
Overall, the effect of drying methods on the composition of GBF was not statistically
significant (P-value > 0.05).

CHAPTER 4: GREEN BANANA FLOUR COMPOSITIONAL PROPERTIES
85
Table 4.2. The composition of green banana and wheat flour samples (g/ 100 g)
Sample Moisture Content Ash Protein Lipid Carbohydrate
WF 9.47±0.17 a 2.83±0.11 a 9.78±0.03 a 1.24±0.01 a 76.68±0.43 b
FDF 5.27±0.11 b 5.21±0.01 bc 3.97±0.13 b 0.92±0.01 b 84.61±0.71 a
ODF50 5.09±0.01 bc 5.19±0.06 b 4.17±0.12 b 0.93±0.01 b 84.62±0.12 a
ODF80 4.56±0.21 d 5.21±0.08 bc 4.13±0.1 b 0.93±0.01 b 85.14±0.32 a
ODF110 4.46±0.19 d 5.24±0.10 bc 4.14±0.04 b 0.93±0.01 b 85.26±0.62 a
Mean ± standard deviation values of triplicate determinations. Values with different letters in the
same column are significantly different (P-value < 0.05). WF, wheat flour, FDF, freeze-dried flour,
ODF50, oven-dried flour at 50 °C, ODF80, oven-dried flour at 80 °C, ODF110, oven-dried flour at
110 °C.
4.3.1.2. Colour
The differences in colour parameters of GBF samples and WF are shown in Table
4.3. The results showed that FDF had a light green colour flour; with the highest
values for lightness, yellowness and chroma amongst the GBF samples were found
in that treatment. Increasing the temperature resulted in a darker colour amongst
oven-dried samples (P-value < 0.05). The same trend was observed by previous
researchers in GBPF (Sarawong et al., 2014b, Andrade et al., 2018). The degradation
of chlorophyll, which is sensitive to oxygen, heat and pH, produces pheophytin and
pheophorbide which accounts for the green–brown colour (Andrade et al., 2018).
Moreover, the high amount of starch and protein along with the high temperatures

CHAPTER 4: GREEN BANANA FLOUR COMPOSITIONAL PROPERTIES
86
may have resulted in the partial Maillard reaction (Falade and Oyeyinka, 2015).
Similarly, Yangilar (2015) stated that FDF had a greener colour than spray dried
banana pulp flour. The degree of colour saturation (chroma) was notably higher in
FDF compared to oven-dried GBF and WF (P-value < 0.05) corresponding with
Aziah and Komathi (2009) findings on unpeeled pumpkin four. The GBF obtained
from freeze-drying and all air oven-drying methods were darker in colour
compared to spouted bed drying method (Bezerra et al., 2013b). Also, it was
reported that GBF made from BPe had shown a darker colour when produced by
microwave drying and freeze-drying, respectively (Türker et al., 2016, Vu et al.,
2017). According to Jeet et al. (2015), the bright colour of flour could be more
acceptable for the consumer. Yet, the incorporation of flour as an ingredient into
food products could eventually affect the colour of the flour. In general, it seems
that more starch would be preserved in FDF and ODF50 compared to other
samples.

CHAPTER 4: GREEN BANANA FLOUR COMPOSITIONAL PROPERTIES
87
Table 4.3. Colour analyses of green banana and wheat flour samples
Sample L* a* b* Browning
Index Chroma
WF 66.69±0.65 e 0.87±0.03 b 11.82±0.12 a 20.05±0.42 a 11.85±0.11 a
FDF 59.72±0.19 d -0.75±0.05 a 15.55±0.13 d 28.45±0.30 b 15.57±0.12 e
ODF50 51.46±0.58 c 2.08±0.04 c 14.32±0.83 c 33.67±0.85 c 14.47±0.13 d
ODF80 46.55±0.77 b 2.55±0.10 d 12.13±0.41 b 34.93±0.97 cd 12.40±0.09 b
ODF110 42.42±0.23 a 2.97±0.04 de 13.63±0.26 c 42.90±0.27 d 13.94±0.53 c
Mean ± standard deviation values of triplicate determinations. Values with different letters in the
same column are significantly different (P-value < 0.05). WF, wheat flour, FDF, freeze-dried flour,
ODF50, oven-dried flour at 50 °C, ODF80, oven-dried flour at 80 °C, ODF110, oven-dried flour at
110 °C.
4.3.2. Hydration properties
As shown in Table 4.4, as the incubation temperature increased, the mean value of
WHC increased significantly in all GBF and control samples (P-value < 0.05). At 40
°C, all GBF samples absorbed more water than WF, and the FDF samples showed
the highest significant value (P-value < 0.05). Similar trends among the samples
were observed at higher temperatures with the ODF110 values had lower values
than WF at 60 °C and 80 °C. While WHC could be related to the physical status of
amylose (Happi Emaga et al., 2007), the amount of insoluble dietary fibres, protein
and particle porosity of the flour could also play an important role in water
absorption (Nasrin et al., 2015, Yangilar, 2015).

CHAPTER 4: GREEN BANANA FLOUR COMPOSITIONAL PROPERTIES
88
Table 4.4. Hydration properties of green banana and wheat flour samples
Sample WF FDF ODF50 ODF80 ODF110
WHC40 1.97±0.19 c 3.58±0.32 c 3.01±0.2 a 3.00±0.75 ba 3.06±0.82 a
WHC60 4.71±0.63 b 5.23±0.74 b 4.310.1 cb 4.86±0.11 dc 3.90±0.88 c
WHC80 7.87±0.81 ba 9.62±0.33 a 7.61±0.55 b 7.64±0.75 c 7.07±0.12 c
OHC40 2.74±0.21 cb 5.81±0.72 b 2.77±0.22 cb 2.70±0.21 dc 2.49±0.68 c
OHC60 2.54±0.4 c 5.91±0.88 b 2.77±0.22 cb 2.76±0.22 dc 2.53±0.33 c
OHC80 2.34±0.55 c 5.9±0.7 a 2.92±0.21 a 2.74±0.57 dc 2.47±0.32 c
SI40 0.06±0.45 c 0.12±0.21 c 0.14±0.56 b 0.19±0.44 cb 0.18±0.21 ba
SI60 0.08±0.12 c 0.13±0.56 c 0.14±0.45 b 0.19±0.18 cb 0.18±0.75 ba
SI80 0.16±0.23 c 0.14±0.2 d 0.17±0.66 cb 0.20±0.56 b 0.20±0.78 a
SP40 3.28±0.74 c 5.01±0.21 cb 4.64±0.58 b 4.65±0.79 c 4.58±0.45 b
SP60 6.24±0.78 cb 5.96±0.56 d 6.02±0.89 cb 6.77±0.56 b 5.70±0.42 b
SP80 10.73±0.64 b 11.75±0.2 b 10.31±0.17 cb 10.63±0.6 c 9.93±0.71 c
Mean ± standard deviation values of triplicate determinations. Values with different letters in the
same row are significantly different (P-value < 0.05). WHC, water holding capacity. OHC, oil holding
capacity. SI, solubility index. SP, swelling power. WF, wheat flour, FDF, freeze-dried flour, ODF50,
oven-dried flour at 50 °C, ODF80, oven-dried flour at 80 °C, ODF110, oven-dried flour at 110 °C.
Increasing the temperature results in protein denaturation and starch
gelatinization. This may lead to greater water absorption due to the availability of
hydroxyl (OH) groups (Agama-Acevedo et al., 2016). According to Alkarkhi et al.
(2011), the release of amylose into water during heating, occurs more in pulp flour
than peel flour. Compared to other findings, the current results showed higher

CHAPTER 4: GREEN BANANA FLOUR COMPOSITIONAL PROPERTIES
89
WHC for FDF than those reported by previous findings (Ramli et al., 2009, Yangilar,
2015). High WHC indicates the capability of FDF to be used as a thickener in semi-
liquid and liquid foods (Abbas et al., 2009). Also, Grigelmo-Miguel et al. (1999)
stated the syneresis in food can also be controlled by adding flour with high WHC
due to the increase in expansibility of starch matrix.
The OHC of flour relates to the hydrophobic character of starch: the higher the
OHC, the higher the EA (Rodríguez-Ambriz et al., 2008). In other words,
stabilization of food systems with high fat content, such as in bakery products, can
be easily achieved by emulsifiers (Gómez et al., 2013). By promoting the formation
of starch-protein complex and strengthening the gluten-gluten interaction,
emulsifiers can improve the aeration in bakery products (Aziah and Komathi, 2009).
The results of this chapter specified a substantial increase in OHC for FDF sample
at all temperatures compared to the control and other GBF (P-value < 0.05).
Comparing results at 80 °C showed a significant increase in OHC of ODF50, which
means it can be an emulsifier compared to the control and other GBF samples.
However, ODF50 showed significantly lower values for OHC compared to FDF.
The current results for FDF were higher than those reported for GBPF (Rodríguez-
Ambriz et al., 2008, Yangilar, 2015), mango peel flour (Larrauri et al., 1996) and
citrus peel flour (Chau and Huang, 2003). The OHC found in FDF is almost equals
to the OHC content of Balady flat bread which contained GBPeF (Eshak, 2016) and
unripe plantain peel flour (Agama-Acevedo et al., 2016).

CHAPTER 4: GREEN BANANA FLOUR COMPOSITIONAL PROPERTIES
90
It has been previously stated that the amylose-lipid complex formation, which can
be formed during heating at above gelatinization temperatures, produces RS5
which is resistant to hydrolysis formulation. As a result, FDF could increase the RS
content, and also be used as an alternative emulsifying agent in food. The results of
the emulsifying properties were correlated with OHC properties (r > 0.92, P-value
< 0.05). The ES of different samples ranged between 30.54% and 36.47%, where
ODF110 had the lowest stability and ODF50 showed the highest stability (P-value
< 0.05) as shown in Table 4.5. However, the ES values varied from 9.69% to 28.99%
for WF and FDF, respectively. Consequently, FDF appears to act as an emulsifier as
it has the highest stability amongst whole green banana flours as well as WF.
The SI is related to the soluble solid contents in dried flour, while the SP is an index
that relates to the strength of the starch granule to stay intact during high cooking
temperatures (Bezerra et al., 2013a). The SI and SP specify the range of interaction
within the amorphous (amylopectin) and crystalline (amylose) areas of starch
molecule together with the length of branches, degree of branching, and formation
of the molecules (Nasrin et al., 2015). As mentioned earlier, an increase in SI and SP
brings about gelatinization, which is the basis for making pre-cooked starchy foods,
especially in bakeries (Oliveira de Souza et al., 2018). The obtained results showed
that all GBF samples had higher SI compared to WF, and this increase was
significant for ODF80 and ODF110 (P-value < 0.05).

CHAPTER 4: GREEN BANANA FLOUR COMPOSITIONAL PROPERTIES
91
Table 4.5. Emulsifying properties of green banana and wheat flour samples
Sample Emulsion Activity (%) Emulsion Stability (%)
WF 32.61±0.17 b 9.69±0.08 e
FDF 32.59±0.16 b 28.99±0.15 a
ODF50 36.47±0.22 a 19.21±0.09 d
ODF80 32.65±0.09 b 23.15±0.10 c
ODF110 30.54±0.22 c 25.36±0.08 b
Mean ± standard deviation values of triplicate determinations. Values with different letters in the
same column are significantly different (P-value < 0.05). WF, wheat flour, FDF, freeze-dried flour,
ODF50, oven-dried flour at 50 °C, ODF80, oven-dried flour at 80 °C, ODF110, oven-dried flour at
110 °C.
However, the increment in SI was not as high as GBPF (de la Torre-Gutiérrez et al.,
2008, Bezerra et al., 2013a, Campuzano et al., 2018), but greater than in green banana
peel flour (GBPeF) (Ratnayake et al., 2002, Nasrin et al., 2015). The same pattern was
observed for SP as well; considering FDF had a more stable starch structure than
other GBFs as temperature increases. As Campuzano et al. (2018) reported, the
ripening stage is positively correlated with SI. By increasing the temperature over
the gelatinization temperature (more than 65 °C), starch degradation and sugar
release lead to an increase in both SI and SP.
The distribution of amylopectin and amylose in starch granule was suggested as a
factor that influenced the SI value by Seguchi et al. (2014). As amylose plays a key

CHAPTER 4: GREEN BANANA FLOUR COMPOSITIONAL PROPERTIES
92
role in maintaining the starch structure, the higher amylose content could
eventually create a more compact starch granule. At temperatures rose above 65 °C,
both the SI and SP were dramatically increased (P-value < 0.05). As the hydrogen
bonds break, the water molecules bind to the exposed OH groups and the granule
expands and exudes amylose, meaning it would be more difficult for starch to
overflow outside of the granules (de la Torre-Gutiérrez et al., 2008). According to
Ratnayake et al. (2002), green banana starches compared to those of corn, chayote
and cassava, swell more slowly, which may signify that a strong micellar
arrangement needs to be broken. In consequence, incorporation of the peel into the
pulp flour has improved the SI and SP of the whole GBF.
4.3.3. Starch analysis
Starch is classified into two groups based on its digestibility: digestible starch
(comprises of slow and rapidly digestible starches) and resistant starch (Englyst and
Cummings, 1987). In the whole green banana, 70-80% of the dry weight contributes
to starch, considering that the peel contains up to 12% of the total amount of starch
(Campuzano et al., 2018). It has been previously described that the RS type in green
banana is type two, which is resistant to hydrolysis (Bi et al., 2017). However,
during the production of GBF the amount of RS2 decreases due to gelatinization,
especially in higher temperature (Kar et al., 2003). That fact signifies the importance
of choosing the right processing condition together with proper pre-treatments.

CHAPTER 4: GREEN BANANA FLOUR COMPOSITIONAL PROPERTIES
93
The present results corroborate the previous findings about the destructive effect of
drying at higher temperatures (Fig 4.2). Interestingly, ODF50 displayed similar
values to FDF, which had the highest amount of RS. Although the difference
between FDF and ODF50 samples was significant (P-value < 0.05), the RS content
was well preserved during the ODF50 heat-treated flour compared to ODF80 and
ODF110.
More than half of the total starch in FDF and ODF50 was RS. While the digestible
starch represented a range between 17% and 36% dry weight base (db) in GBF
samples, the WF contained the highest amount of available starch. Also, the results
indicated that drying temperatures over 80 °C did not have a significant effect on
RS content reduction (P-value > 0.05).
Drying conditions at temperatures below 60 °C, the RS content of FDF and ODF50
were higher than the reported values for GBPF (Menezes et al., 2011, Bezerra et al.,
2013b, Segundo et al., 2017a) and only lower than the findings of Surendra Babu et
al. (2014), who also worked on GBPF, is because of the different variety (Monthan)
used in their study. Considering the dramatic increase in the levels of digestible
starch in both ODF80 and ODF110, it can be suggested that retrogradation could be
a reason for the disruption of the starch molecule, precisely amylose.

CHAPTER 4: GREEN BANANA FLOUR COMPOSITIONAL PROPERTIES
94
As shown in Fig 4.3, the amount of amylose was decreased dramatically by the
application of heat treatment. Contrarily, during the freeze-drying process the
amylose crystallites remained nearer to the double amount compared to other GBF
samples and WF. The linear structure of amylose (α-1→4) is responsible for the RS2
structure, whereas amylopectin is branched and its chains are connected through
(α-1→6) bonds to form a composite structure. Multiple significant correlations were
found between amylose and RS (r > 0.91, P-value < 0.05) as well as TS (r > 0.89, p =
0.05), and WHC (r > 0.90 p = 0.05) According to Eshak (2016), higher amount of
amylose led to a higher OHC, which was seen in the current chapter. This brings
about the possibility of amylose-lipid complex that has been shown is resistant
against α-amylase (RS5). The FDF results were higher than those found in GBPF
reported by Bi et al. (2017) but almost the same for ODF50 (Zhang et al., 2005,
Figure 4.2. Starch analysis of green banana and wheat flour samples
Bars showing mean and standard deviation for each starch type that have different letters are
significantly different (P-value < 0.05).

CHAPTER 4: GREEN BANANA FLOUR COMPOSITIONAL PROPERTIES
95
Sarawong et al., 2014b) and even more than culled plantain starch (Nasrin et al.,
2015). As the amount of RS found in FDF and OFD50 were higher than other
samples, it may be advisable for nutritional purposes to use RS as a functional
ingredient, as it contributes to the prevention the colorectal cancer (Malcomson et
al., 2015, Birt et al., 2013, Gratz et al., 2011, Perera et al., 2010).
4.3.4. Relative Crystallinity
The XRD patterns of starches are categorized into three types: A, B and C. A-type
starches possess surface pores and channels which are slowly digestible,
while C-type can be easily lost in foods due to the hydrothermal procedures
Figure 4.3. Amylose and Amylopectin content of green banana and wheat flour
samples
Bars showing mean and standard deviation for amylose variable that have different letters are
significantly different (P-value < 0.05).

CHAPTER 4: GREEN BANANA FLOUR COMPOSITIONAL PROPERTIES
96
such as boiling, cooking and baking bringing about complete or partial starch
gelatinization (Cahyana et al., 2019). However, B-type starches do not have pores in
their structure and are inherently resistant to digestion (Van Hung et al., 2012). In
green banana, the abundance of B-type makes it valuable in terms of health benefits
(Zhang et al., 2005).
The XRD patterns of GBF different samples and WF are shown in Fig 3.4. Three
prominent peaks were detected by diffractogram within the diffraction angles of
15° and 25°, which relates to B-type crystallinity (Van Hung et al., 2012). While WF
showed the least amount of crystallinity, the increased drying temperature resulted
in the disruption of the starch crystalline section.
The FDF samples had 58.34% crystallinity, which was the greatest amongst the GBF
samples (P-value < 0.05). These results explained the existing significant correlation
between the obtained RS amount and the effect of temperature (r > 0.91, P-value =
0.05). These results also confirmed that destroying the granular crystalline structure
of starch was associated with decreasing in the amount of RS. This relation was
presented by Zhang and Hamaker (2012) who investigated the starch properties in
green banana. The current findings suggest a greater crystallinity in FDF compared
to some studies on GBPF obtained from different cultivars (Bi et al., 2017).
Furthermore, Wang et al. (2017a) reported the effect of cultivar on the percentage
of crystallinity in this order: Pisan Awak > Bluggoe > Cavendish > Pisang. Most of the
RS found in GBF is type two (Silva et al., 2015). The crystalline area is structurally
tight and orderly in a way that makes it hard for it to be eroded by acids and

CHAPTER 4: GREEN BANANA FLOUR COMPOSITIONAL PROPERTIES
97
0
2000
4000
6000
8000
10000
12000
14000
16000
18000
20000
5 8 12 15 18 22 25 28 31 35
Inte
nsi
ty (
arb
itra
ry u
nit
)
2θ (degrees)
ODF50
WF
FDF
ODF80
ODF110
Figure 4.4. X-Ray diffraction patterns of green banana and wheat flour samples
Sample Crystallinity SEM
WF 41.16 e 1.23
FDF 58.34 a 1.34
ODF50 48.39 b 1.19
ODF80 45.64 c 1.41
ODF110 43.37 d 1.49
enzymes, whereas the non-crystalline area (amorphous part) can be easily degraded
(Rodríguez-Ambriz et al., 2008, Tribess et al., 2009). In this chapter, all heat-treated
flours showed that crystallinity decreased along with the amylose content.
Thermal properties of the whole GBF and WF are presented in Table 4.6. All of the
thermal variables, except for gelatinization range, were significantly higher in GBF
samples than the control (P-value < 0.05). Owing to the presence of RS in the GBF
samples, a higher Tp than WF was found, ranging from 74.99 °C to 75.9 °C. This
significant difference could be related to the high amount of DF in pulp, and
especially peel (Silva et al., 2015). The values of Tp found in this work were higher
than those found in corn starch (67.88 °C) (Han et al., 2009), potato (64.48 °C) (Zaidul
et al., 2008) and cassava (71.08 °C) (Hong et al., 2016). This trend was similar in T0.

CHAPTER 4: GREEN BANANA FLOUR COMPOSITIONAL PROPERTIES
98
Almost the same results were reported in previous studies with different banana
varieties but same drying conditions (Waliszewski et al., 2003, Pelissari et al., 2012),
except for Musa paradisiaca Macho, which showed a Tp value of 77 °C (Bello-Pérez et
al., 2000); and the freeze-drying method exhibited a higher Tp than other methods
such as ultrasound treatment (Rayo et al., 2015) and pulsed-fluidized bed
agglomeration (Tribess et al., 2009). The required energy for breaking the molecular
interactions within the starch structure during gelatinization defines the ∆H (Bello-
Pérez et al., 2000). Lower values of ∆H would indicate either a fractional melting of
amylopectin branches or a possible variance in the crystals’ stability related to the
size of the starch granules (Pelissari et al., 2012).
Table 4.6. Thermal properties of green banana flour samples and wheat flour
Sample Start (°C) Maximum (°C) Stop (°C) Delta H (J/ g) R (°C)
WF 54.70±0.20 d 62.62±0.10 c 69.42±0.13 d 5.41±0.07 e 11.95±0.03 a
FDF 64.18±0.16 c 74.99±0.11 b 90.64±0.32 a 23.16±0.2 a 8.02±0.09 b
ODF50 67.73±0.24 ab 75.9±0.06 a 85.51±0.16 a 19.48±0.24 b 4.69±0.64 d
ODF80 66.69±0.12 b 740.6±0.19 b 81.61±0.01 c 10.31±0.2 d 6.88±0.50 c
ODF110 68.54±0.43 a 75.86±0.05 a 84.37±0.36 b 11.70±0.2 c 5.92±0.16 cd
Mean ± standard deviation values of triplicate determinations. Values with different letters in the
same column are significantly different (P-value < 0.05). WF, wheat flour, FDF, freeze-dried flour,
ODF50, oven-dried flour at 50 °C, ODF80, oven-dried flour at 80 °C, ODF110, oven-dried flour at
110 °C.

CHAPTER 4: GREEN BANANA FLOUR COMPOSITIONAL PROPERTIES
99
For that reason, the control samples had the least amount of ∆H (5.41 J/g), while
FDF and ODF50 showed a dramatically higher temperature amongst GBF samples.
Also, as seen in Table 4.6, the R value of WF was the highest (11.95 °C), while ODF50
represented the smallest gelatinization range amongst all GBF samples. This is
explained by the presence of the large amount of amylose per unit mass in flour.
Compared to the results acquired from the oven drying for producing GBPF and
GBPeF (Zaidul et al., 2008, Kaur et al., 2016), the freeze-dried sample and ODF50
presented higher values which means that these flours can potentially be useful in
products which delayed pasting is favourable. Also, the current results suggest that
the incorporation of peel flour into pulp flour may increase the gelatinization
temperature positively.
4.4. Conclusion
The world largest banana producers are developing countries and thermal
processing is the most common preservation treatment. As a result, optimizing a
feasible drying method that has the least negative effects on green banana
components, especially its RS2 content, is very useful for streamlining production
of banana flour. Furthermore, banana peel is rich in dietary fibres, minerals and
RS2. Producing GBF from whole green banana can add nutritional and economic
incentives to process. The present chapter investigated the effects of drying
conditions on the properties of whole green banana flour.

CHAPTER 4: GREEN BANANA FLOUR COMPOSITIONAL PROPERTIES
100
Colour analysis showed that FDF had bright greenish-like flour with the closest
browning index to wheat flour and the ODF50 treatment may contribute to a better
consumer acceptancy amongst heat-treated green banana samples. The emulsifying
properties showed that FDF and ODF50 can act as an emulsifier in oil-containing
food products and they are better than ODF80 and ODF110 samples. Additionally,
the high WHC of all GBF samples, especially the FDF, suggests that they can be
applied in food products as a thickening agent.
High drying temperatures decreased the percentage of RS starch and increased the
percentage of digestible starch. These findings, which were in accordance to high
crystallinity and gelatinization temperature of starch, showed that 50 °C is the best
temperature for hot-air oven drying that can be applied with the least possible effect
on RS content. Further, the ODF50 samples were the closest properties to the non-
heat-treated sample (i.e. FDF). Future studies should focus on the particle size
separation, starch granule microstructure and rheological properties of the whole
green banana flour to understand their potential behaviour during packaging,
transportation and use in food systems.
4.4. Limitations
There were some limitations which should be considered for designing future
studies. In order to better understand the changes in water absorption of green
banana flour, farinograph test, which was not available at the time, can be used to
estimate the amount of water required to make dough, evaluate the effects of

CHAPTER 4: GREEN BANANA FLOUR COMPOSITIONAL PROPERTIES
101
ingredients on mixing properties, evaluate flour blending requirements and to
check flour uniformity.

Chapter 5

CHAPTER 5: GREEN BANANA FLOUR STRUCTURAL PROPERTIES
103
Textural properties and characteristics of whole green banana flour
produced by air-oven and freeze-drying
This chapter has been published as:
AMINI KHOOZANI, A., BIRCH, J. & BEKHIT, A. E.-D. A. 2020. Textural properties
and characteristics of whole green banana flour produced by air-oven and freeze-
drying processing. Journal of Food Measurement and Characterization, 14, 1533–
1542.
Chapter aim:
In the previous chapter, the effects of oven-drying and freeze-drying on the starch
content, thermal properties and physicochemical properties of GBF were
investigated. This chapter aims to investigate the effects of three different heat
treatments (50, 80 and 110 C) on the physical, nutritional and rheological
properties of the produced whole green banana flours as well as their chemical
compositions compared to GBF made from freeze-drying. Wheat flour was used as
a reference.

CHAPTER 5: GREEN BANANA FLOUR STRUCTURAL PROPERTIES
104
5.1. Introduction
Banana is a tropical fruit that follows rice, wheat and maize in terms of popularity
as a food crop (Aurore et al., 2009). Musa Cavendishi is the main commercial banana
cultivar. As a climacteric fruit, maturation of the banana continues after the harvest
in seven stages. According to Aurore et al. (2009), each stage represents a dramatic
change in physicochemical characteristics and fruit firmness. At early stages of
ripeness, BP is considered a rich source of dietary fibre (DF), resistant starch type 2
(RS2), phenolic compounds, phytonutrients and vitamins (B groups, ascorbic acid
and tocopherols) (Singh et al., 2016). Banana peel, which comprises about 40% of
total weight of the fruit, has no useful applications and is usually dumped as waste.
Recent studies on the compositional properties of banana peel (BPe) reported high
RS2, micronutrients and DF contents compared to pulp (BP) (Homayouni et al.,
2014). Extraction of nutrients from green banana and evaluation of its technological
benefits as a functional ingredient in the form of flour in food formulations have
attracted the attention of researchers (Agama-Acevedo et al., 2016, Biernacka et al.,
2020, Pico et al., 2019b, Falcomer et al., 2019). Nevertheless, information comparing
different air-oven drying temperatures with freeze-drying processes on properties
of whole green banana flour (GBF), especially rheological properties, have scarcely
been reported in the literature.
Compared to other methods of drying, freeze-drying has been considered the best
dehydration method for heat-sensitive materials to obtain the highest possible

CHAPTER 5: GREEN BANANA FLOUR STRUCTURAL PROPERTIES
105
quality in terms of colour, structure, nutrients and flavour (Pathak et al., 2017). The
crystallization of water molecules into ice crystals with subsequent sublimation,
results in a high-quality porous dried banana peel product (Vu et al., 2017).
However, the effect of freeze-drying on textural properties of GBF has not been
thoroughly investigated yet.
From technological and financial points of view, high cost impedes the application
of the freeze-drying method for drying purposes, especially in developing countries
where banana production is mainly found. Moreover, leading countries in banana
production face losses during and after harvest-time. Due to the lack of proper
infrastructure and poor transportation, about one-fifth of all harvested banana
becomes unusable (Izidoro et al., 2011). Therefore, making flour from green banana
requires a feasible drying method with the least effect on both nutritional and
technological properties of the produced flour.
In the previous chapter, the effects of oven-drying and freeze-drying on the starch
content, thermal properties and physicochemical parameters of GBF were
investigated. To gain a complete understanding of the produced flour utility, the
rheological and nutritional aspects need to be elucidated. The aims of this study
were twofold: first, assessing the effect of the three different heat treatments (50, 80
and 110 C) on the physical, nutritional and rheological properties of the produced
whole green banana flour samples. Secondly, investigating the chemical
compositions and comparing the results with the GBF obtained from freeze-drying
while wheat flour was used as a reference.

CHAPTER 5: GREEN BANANA FLOUR STRUCTURAL PROPERTIES
106
5.2. Material and Methods
5.2.1. Green banana flour preparation
Samples (air-oven-dried green banana flour and freeze-dried one) were produced
based on the method that discussed in chapter 4, section 4.2.1.
5.2.2. Particle size separation
The particle size of the samples was determined according to AOAC (2000) using a
sieve shaker equipment (Endecotts MINOR 200, New town, USA) with sizes of 35,
48, 60, 80, 100 and 200 Mesh (0.500, 0.354, 0.250, 0.177, 0.149 and 0.074 mm,
respectively) (Bezerra et al., 2013a).
5.2.3. Bulking properties
Samples were put into 25 ml measuring cylinders up to the 5 ml line. The measuring
cylinder was then tapped 100 times continuously on a table until a constant volume
was obtained. The bulk density of the flour was calculated as the weight divided by
the bulk volume and expressed as g/cm3 using the formula 5.1 (Falade and
Oyeyinka, 2015).
Bulk Density = Weight of the sample
Volume of the sample after tapping (5.1)
Compressibility Index (CI) and Hausner Ratio (HR) show the propensity of the
flour to flow and define the interactions among the flour particles that influence the

CHAPTER 5: GREEN BANANA FLOUR STRUCTURAL PROPERTIES
107
bulking properties. The CI and HR were measured using the formula 5.2 and 5.3
(Rayo et al., 2015):
Compressibility Index = 100 × [(V0-Vf)/ V0] (5.2)
Hausner Ratio = V0
Vf (5.3)
Where V0 and Vf are unsettled apparent volume and final tapped volume,
respectively.
5.2.4. Textural properties
A TA-XTplus Texture Analyzer (Stable Micro Systems, Surrey, U.K.) was used to
analyse the texture of the flour slurry (10% w/v) as described by Segundo et al.
(2017b). Backward extrusion tests were conducted with a disc with a diameter of 45
mm, setting the probe travel distance at 30 mm. The test was performed with a test
speed of 5 mm/s, a trigger force of 5×g, a crosshead speed and recording speed of 5
mm/s and force in compression mode. The test was performed in the room
temperature.
5.2.5. Pasting properties
Pasting properties were determined according to Li et al. (2011) with a Rapid Visco
Analyzer (RVA Perten Starch Master Instruments, Hägersten,
Sweden). About 3.5 g of dried sample and 25 ml of deionized water were put
into a canister. The RVA settings were holding at 50 °C for one min, then heating

CHAPTER 5: GREEN BANANA FLOUR STRUCTURAL PROPERTIES
108
up gradually to 95 °C at 12.2 °C min-1, holding at 95 °C for 2.5 min and cooling down
to 50 °C at 11.8 °C min−1. The starting rotational speed of the paddle was 960 rpm
for 10 s and was kept at 160 rpm until the l completion of the test. Various
parameters such as pasting temperature (PT), peak viscosity (PV), hold viscosity
(HV), final viscosity (FV), setback (SB) and breakdown (BD) were recorded by the
RVA software.
5.2.6. FTIR spectroscopy
The mid-infrared spectra were collected using an infrared spectrometer (Bruker
Alpha, Fishers, USA) equipped with a deuterated triglycine sulphate detector and
a single reflectance attenuated total reflection (ATR) cell with a ZnSe (Zinc Selenide)
crystal. A total number of 24 scans were acquired for each spectrum at a resolution
of 4 cm-1 and co-added. All flour measurements were recorded at ambient
temperature in a wavenumber range of 600-4000 cm-1. The acquired spectrum was
generated by the standard direct mode where the background was recorded with
no sample in the ATR cell (Meziani et al., 2011). Data analysis was carried out using
the OPUS 7.2 Bruker software (Bruker Alpha, Fishers, USA).
5.2.7. Mineral analysis
An Agilent 7500ce quadrupole ICP-MS mass spectrometer was used for the analysis
of minerals in the flour samples. Dried flour samples (two mg) were weighed into

CHAPTER 5: GREEN BANANA FLOUR STRUCTURAL PROPERTIES
109
a MARSXpress (CEM Corporation, Matthews, USA) digestion tube, followed by the
addition of 10 mL of concentrated quartz distilled HNO3. The samples were
digested in a CEM MARS6 programmable 2450 MHz microwave reaction system
with a selectable operator output of 0 – 1600 W (CEM Corporation, Matthews, USA)
using the manufacturer's directions.
Dilutions of the sample digests and blanks in 2% (v/v) HNO3 were spiked offline
with a cocktail of seven reference elements to compensate for any drift or possible
matrix effects. Calibration standards were prepared by serial dilution of a SPEX
CertiPrep multi-element standard (Spex Certiprep, Metuchen, USA). In order to
minimize the instrumental drift and interferences, the ICP-MS was tuned according
to the manufacturer's recommendations. The accuracy of the measurement was
established with a corn meal reference material, supplied High Purity Standard
North Charleston, USA (Anyasi et al., 2018).
5.2.8. Statistical analysis
Statistical analysis was carried out by Minitab® software version 16. After
confirming that the data were normally distributed, the one-way ANOVA test was
used to evaluate the significance of the differences between the treatments for each
measured parameter. The correlation between the variables was determined using
Pearson’s correlation. The differences among the means were resolved using

CHAPTER 5: GREEN BANANA FLOUR STRUCTURAL PROPERTIES
110
Tukey’s test. The significant level was set at P-value < 0.05, with a confidence
interval of 95%.
5.3. Results and discussion
5.3.1. Particle size separation
The uniformity of particle size is correlated to particle density and can influence the
thermal properties and mixing behaviour of the flour during dough making (Musha
et al., 2013). The flour size values are shown in Table 5.1. As evidenced by the
significant differences in the size separation of the flours, all the oven-dried GBF
had non-uniform particle size distribution. The flour obtained from ODF110 had
the highest percentage of large particle size (500 mm). While the majority of ODF80
particles were around 250 mm, ODF50 had the smallest particle sizes amongst the
oven-dried samples and the closest particle size values to the FDF, even though the
mean values were different between the two treatment groups (P-value < 0.05).
Interestingly, GBF obtained from freeze-drying exhibited the same particle sizes of
the WF (P-value > 0.05). Bezerra et al. (2013a) investigated unpeeled green banana
dried by spouted bed dryer at 80 °C and reported smaller particles sizes than those
found in the FDF and ODF50 in the current study. This behaviour can be attributed
to the accumulation of fibres and starch on the surface of the banana slices during
drying. With increasing the rate of drying, the possibility of case hardening
phenomenon increases, especially in the presence of peel which contains more DF

CHAPTER 5: GREEN BANANA FLOUR STRUCTURAL PROPERTIES
111
than pulp (Tarvainen et al., 2006). Another explanation could be the collapse of
starch granules which results in more dense structure and more resistance to the
mechanical grinding (Turchiuli et al., 2005).
Table 5.1. Particle size separation of green banana and wheat flour samples
Sample
Mesh size (µm)
> 500 354 250 177 149 74 >
WF 0.01±0.07 d 1.01±0.09 d 6.13±2.23 d 32.66±2.13 bc 47.42±3.15 a 9.75±1.85 a
FDF 0.05±0.09 d 1.45±0.31 d 6.82±3.54 d 33.91±6.18 b 47.23±4.61 a 9.14±1.54 a
ODF50 2.71±0.11 c 8.31±2.61 c 10.22±4.12 c 37.06±8.17 a 31.71±5.76 b 5.46±1.61 b
ODF80 17.11±1.65 b 31.01±6.73 b 32.14±3.88 a 6.61±1.64 d 9.12±1.53 c 4.73±1.27 c
ODF110 40.10±6.02 a 38.21±7.62 a 25.99±4.02 b 12.45±2.71 c 6.61±1.02 d 3.64±0.97 d
Mean ± standard deviation values of triplicate determinations. Values with different letters in the
same column are significantly different (P-value < 0.05). WF, wheat flour, FDF, freeze-dried flour,
ODF50, oven-dried flour at 50 °C, ODF80, oven-dried flour at 80 °C, ODF110, oven-dried flour at
110 °C.
The application of freeze-drying causes instant sublimation of ice crystals and
produces a porous structure that eventually results in easier grinding. In heat-
treated banana slices, reducing the drying temperature allows proper evaporation
of water through the structure, so less shrinkage occur which leads to easier
grinding afterwards. This explains the smaller particles size of ODF50 compared to
ODF80 and ODF110. It has been reported that smaller particle size may lead to
better water/ oil absorption and might improve hydration properties of the flour
(Aparicio-Saguilán et al., 2015).

CHAPTER 5: GREEN BANANA FLOUR STRUCTURAL PROPERTIES
112
It can be concluded that the use of the oven drying method at 50 °C brings about
the best flour particles compared to the other higher temperatures and produces the
closest flour particle size to non-heat treatment.
5.3.2. Bulking properties
The bulk density is an indicator of the flour heaviness and is important property for
the transportation and packaging of materials (Elaveniya and Jayamuthunagai,
2014). As shown in Table 5.2, FDF had the lowest bulk density value compared to
all heat-treated GBF samples and WF (P-value < 0.05). The ODF50 presented almost
the same bulk density found in the reference samples (P-value > 0.05), while ODF80
and ODF110 treatment groups showed the highest bulk density values. Rayo et al.
(2015) produced green banana pulp flour (GBPF) at 55 °C followed by pulsed-
fluidized bed agglomeration, which resulted in a higher bulk density than the FDF
and ODF50 in the present work.
The Hausner Ratio and Compressibility Index are used for assessing the tendency
of flour, the ability to settle down and flow behaviour (Rayo et al., 2015). Flour
samples with HR < 1.2 are categorized as free-flowing, flour with 1.2 < HR < 1.4 is
classified as intermediate flowing powder and at HR > 1.4 flour is considered a non-
flowing or very cohesive powder (Turchiuli et al., 2005). Amongst all air-oven-dried
GBF samples, ODF50 showed the highest CI, which was statistically similar to the
freeze-dried one (P-value > 0.05). Considering the strong correlation between bulk

CHAPTER 5: GREEN BANANA FLOUR STRUCTURAL PROPERTIES
113
density and CI (r > 0.92, P-value < 0.05), it can be concluded that ODF110 samples
will have more flowability than the other samples. Similarly, HR results were in
accordance with the CI results (r > 0.73, P-value < 0.05). It can be observed in Table
5.2 that while FDF, ODF50 and WF contained HR > 1.4 (very cohesive), ODF80 is
classified as intermediate flowing flour and ODF110 is considered a free flowing
one.
Table 5.2. Bulk properties of green banana and wheat flour samples
Sample Bulk Density (g/m3) % Compressibility index % Hausner Ratio
WF 0.42±0.01 c 38.46±0.15 a 1.62±0.30 a
FDF 0.13±0.01 d 35.70±0.32 b 1.55±0.01 b
ODF50 0.43±0.02 c 35.24±0.30 b 1.55±0.01 b
ODF80 0.53±0.01 b 21.56±0.48 c 1.28±0.02 c
ODF110 0.66±0.01 a 9.78±0.18 d 1.10±0.02 d
Mean ± standard deviation values of triplicate determinations. Values with different letters in the
same column are significantly different (P-value < 0.05). WF, wheat flour, FDF, freeze-dried flour,
ODF50, oven-dried flour at 50 °C, ODF80, oven-dried flour at 80 °C, ODF110, oven-dried flour at
110 °C.
Adebayo-Oyetoro et al. (2016) reported that fine particles with HR > 1.4 display a
strong agglomeration with an inclination to create a better flour slurry in presence
of water. Moreover, Abdullah and Geldart (1999) affirmed that free-flowing flours
have lesser consolidation and take longer to collapse in a container. Therefore,
CHAPTER 5: GREEN BANANA FLOUR STRUCTURAL PROPERTIES
114
higher CI and HR in FDF and ODF50 samples could markedly improve pasting and
textural properties of the flours.
5.3.3. Textural properties
Textural properties of banana flour are noteworthy as they can specify the type of
food product for successful GBF incorporation. Firmness, consistency, cohesiveness
and viscosity index are the determining factors for textural properties. It was noted
that thermal processing caused a significant reduction in the firmness of banana
slurry compared to FDF and WF (P-value < 0.05) (Table 5.3). Wheat flour showed
the highest resistance to the maximum applied force (0.42 N), while ODF110
displayed the least force (0.14 N). According to Abbas et al. (2009), the firmness of
the banana slurry signifies the gelation property of the flour. By increasing the
drying temperature, larger flour particle size was generated, which leads to low
ability to absorb water/rehydration and results in a lower ability to create a firm
slurry. According to Segundo et al. (2017b), flour slurry exhibits more resistance
against the instrument probe when its pulled out of the sample as the extrusion
energy becomes higher. This phenomenon indicates that viscosity is related to the
resistance to flow and also to cohesiveness and consistency of the sample (Segundo
et al., 2017b). Cohesiveness, which is related to fibre content, is the extent to which
a material can be deformed before disruption (Toledo De Camargo Ranzani et al.,
1996). Abbas et al. (2009) reported that the high viscosity of flours is attributed to
the protein content and carbohydrates (Wang et al., 2017a). This explains the

CHAPTER 5: GREEN BANANA FLOUR STRUCTURAL PROPERTIES
115
significantly higher viscosity, cohesiveness and consistency of WF compared to all
GBF samples (P-value < 0.05).
Table 5.3. Textural properties of green banana and wheat flour samples
Sample Firmness (N) Consistency (N) Cohesiveness (N) Viscosity Index
WF 0.42±0.13 a 3.80±0.21 a 0.12±0.69 a 0.31±0.82 a
FDF 0.29±0.06 b 1.03±1.01 b 0.09±0.14 b 0.12±0.42 b
ODF50 0.25±0.41 c 1.01±0.30 b 0.08±0.20 bc 0.10±0.83 c
ODF80 0.25±0.41 c 0.94±0.80 bc 0.07±0.09 c 0.09±0.97 cd
ODF110 0.14±0.40 d 0.64±1.01 c 0.04±0.72 d 0.07±0.45 d
Mean ± standard deviation values of triplicate determinations. Values with different letters in the
same column are significantly different (P-value < 0.05). WF, wheat flour, FDF, freeze-dried flour,
ODF50, oven-dried flour at 50 °C, ODF80, oven-dried flour at 80 °C, ODF110, oven-dried flour at
110 °C.
As shown before, small particle sizes contributed to higher compressibility and HR
index in FDF and ODF50. The correlation between HR index and textural
parameters (r = 0.87, P-value < 0.05) confirmed that the drying method could exert
substantial effect on GBF textural attributes. Consequently, these results show that
physical differences in GBF may have certain implications on the textural properties
of dough made from these flours. However, information on textural properties of
GBF is scarce in the literature and more studies are required to ensure a better

CHAPTER 5: GREEN BANANA FLOUR STRUCTURAL PROPERTIES
116
understanding of the behaviour of banana flours during the baking process (Abbas
et al., 2009).
5.3.4. Pasting properties
Wang et al. (2017a) highlighted that the functionality of starch is dependent on its
pasting properties. They described that after heating the banana flour, amylose
leaches out of the swollen starch molecule and eventually leads to a rapid increase
in viscosity with increasing temperature until PV is reached. Due to the high
temperature (95 °C) and the mechanical shear stress, more amylose leaches out of
the flour granules and affects the HV and BD indexes that are influenced by
temperature, nature of the starch and the applied shear stress. As the temperature
of the mixture drops to around 60 °C, starch molecules become retrograded and
form a viscose gel network (final viscosity).
When starch is gelatinized after being heated in the presence of water and cooled,
the disrupted amylose and amylopectin chains can progressively re-associate into
an ordered structure in a process called retrogradation (Bertolini et al., 2010). Starch
retrogradation is often accompanied with increased viscosity, gel formation and
increased degree of crystallinity (Chockchaisawasdee et al., 2010). Amylose arrange
a network after starch gelatinization, which results in swollen granules and changes
in gel characteristics (Wang et al., 2017a). Pasting properties of GBF and WF are
presented in Table 5.4. Pasting temperature represents the least temperature needed
for cooking the samples (Bertolini et al., 2010). WF had a PT at 66.63 °C while

CHAPTER 5: GREEN BANANA FLOUR STRUCTURAL PROPERTIES
117
ODF110 showed the highest temperature amongst GBF samples with 81.23 °C (P-
value < 0.05). The remarkable increase was found when the drying temperature had
been increased from 50 °C onwards (P-value < 0.05). Compared to the WF samples,
the higher RS content of GBF might be the reason for the increment in PT as the
gelatinization temperature of RS is higher than normal starch (Singh et al., 2016),
which indicates higher temperature needs for food products containing ODF80 and
ODF110 to be fully cooked compared to other GBF samples. Ng et al. (2014)
explained that the higher PT of ripe banana flour compared to WF was due to the
higher sugar content. Further, the increment in PT has also been attributed to the
increase in the crystalline part (granular structure) of the starch (Cahyana et al.,
2019). Considering all GBF samples showed significantly higher PT than WF (P-
value < 0.05), the high percentage of DF in GBF makes its starch more preserved
during thermal processing (Aparicio-Saguilán et al., 2015).
The water binding capacity of the flour and ability to swell during cooking are
indicated by PV. High PV value shows a highly viscose gel formation and a stable
gel (Haslinda et al., 2009). The PV values for GBF samples ranged from 2523 to 5390
cp, with the ODF80 samples having the lowest PV, whereas the highest value was
found in the ODF50 samples. Considering all the GBF samples showed significantly
higher PV compared to WF (P-value < 0.05), the higher amylose content in GBF
samples may be a reason for higher viscosity (Bertolini et al., 2010). The stability of
starch gel in the ODF50 samples was statistically similar to FDF (P-value > 0.05).

CHAPTER 5: GREEN BANANA FLOUR STRUCTURAL PROPERTIES
118
The HV and FV as well as the SB decreased dramatically with the application of
high drying temperatures to produce GBF. Hold viscosity measures the viscosity
when the swollen starch was disrupted due to shearing and heating (Cahyana et
al., 2019). Starch granules become progressively susceptible to shear stress when
they are swollen, especially in starches with lower amylose content (e.g., ODF80
and ODF110).
Table 5.4. Pasting properties of green banana and wheat flour samples
Sample PT (°C) PV (cp) HV (cp) FV (cp) SB (cp) BD (cp)
WF 66.63±0.25 d 3768±245 c 5768±159 a 6258±332 a 2489±256 a 3891±106 d
FDF 77.10±0.10 c 4989±137 b 4589±302 bc 5659±274 b 2386±291 a 5675±152 b
ODF50 77.06±0.15 c 5390±201 a 4390±172 c 5442±140 b 2269±267 ab 5275±157 c
ODF80 79.06±0.15 b 2523±249 d 2723±364 cd 4751±264 c 1225±223 b 7252±227 a
ODF110 81.23±0.35 a 2735±297 d 2535±317 d 4674±137 c 1098±214 b 7118±151 a
Mean ± standard deviation values of triplicate determinations. Values with different letters in the
same column are significantly different (P-value < 0.05). PT, pasting temperature. PV, peak viscosity.
HV, hold viscosity. FV, final viscosity. SB, setback. BD, breakdown. WF, wheat flour, FDF, freeze-
dried flour, ODF50, oven-dried flour at 50 °C, ODF80, oven-dried flour at 80 °C, ODF110, oven-dried
flour at 110 °C.
While drying banana at temperatures higher than starch gelatinization temperature
results in disruption of granular sections (Shafie et al., 2016), ODF50 samples were
the only heat-treated GBF that showed no significant difference compared to the
freeze-dried samples (P-value > 0.05).

CHAPTER 5: GREEN BANANA FLOUR STRUCTURAL PROPERTIES
119
Final viscosity provides information about the specific quality of the starch and
reflects the stability and ability of the cooked gel to form a viscous paste after
cooling, and SB is an index for syneresis of starch (Khamsucharit et al., 2018). As
these two parameters are correlated with syneresis, especially during freeze-thaw
cycles, it can be concluded that FDF and ODF50 samples are more likely to generate
more stable products during storage. Furthermore, the SB indicates starch
retrogradation tendency during storage; a lower SB shows less tendency for
retrogradation (Shafie et al., 2016). Adding FDF and ODF50 in formulations of food
products may increase the content of resistant starch type 3 (RS3) by enhancing
retrogradation after cooling down. This trend was also observed in another study
on ripe banana flour (Cahyana et al., 2019).
Breakdown viscosity specifies the susceptibility of cooked starch granules to be
disintegrated by mixing at elevated temperatures. As shown in Table 5.4, FDF was
the most stable GBF to shear and heat treatment during the pasting process. On the
other hand, ODF50 had significantly the highest resistance against shearing
amongst the heat-treated samples (P-value < 0.05). Considering previous results,
the ability to form a cohesive gel (FDF and ODF50) might be correlated with the
stability of flour paste during mixing at high temperature in food processing.
Cahyana et al. (2019) reported similar results for GBPF and WF. Conversely, Nasrin
et al. (2015) reported reduced viscosity in peel flour compared to the pulp one. The
result of this study showed that with the incorporation of peel into the banana pulp
flour, the overall viscosity properties were improved.

CHAPTER 5: GREEN BANANA FLOUR STRUCTURAL PROPERTIES
120
5.3.5. FTIR spectroscopy
The chemical structures of GBF and WF samples were characterized by FTIR and
the results are presented in Table 5.5. The information obtained from the spectra is
associated with short range order in the starch granule (Khamsucharit et al., 2018).
In order to understand the behaviour of the starch upon heat treatment or the
changes during storage, the analysis of the information of FTIR spectrogram is
important (Meziani et al., 2011). As shown in Fig 5.1, the FTIR spectra shows the
functional groups on the flours. By matching the band transmittance on FTIR
spectra with the vibrational modes of various chemical bonds based on
experimental data, the differences in peak intensity might be used to predict the
occurrence of conformational changes in starch granules (Ng et al., 2014).
The stretching absorption band centred at 3277.52 cm-1 represents the OH groups
(carboxylic acids) in all GBF samples (Table 5.5). Similar findings were found in a
study on GBPeF (Pathak et al., 2017). The band observed at around 2900 cm-1
contributed to stretching vibration of methyl and methylene groups for all samples.
Except for the FDF sample, all the other samples showed a peak at around 1630 cm-
1, which signifies that the amide I bond was broken during the freeze-drying
process. Meziani et al. (2011) suggested that the β-plated sheet and α-helix
structures are partially unfolded under freezing. This explains the shifting of a new
range of formed β-sheets to a less strongly hydrogen-bonded structure. Due to the

CHAPTER 5: GREEN BANANA FLOUR STRUCTURAL PROPERTIES
121
Figure 5.1. FTIR spectrum of green banana and wheat flour samples
WF, wheat flour, FDF, freeze-dried flour, ODF50, oven-dried flour at 50 °C, ODF80, oven-
dried flour at 80 °C, ODF110, oven-dried flour at 110 °C.
presence of more protein, a sharp shift around 1640 cm-1 in the WF samples
indicated stronger intra-molecular bonds compared to GBF.
The presence of high CHO groups in WF samples caused a significant drop in
transmittance around 1100 cm-1 compared to heat-treated flours which showed less
stretching of C-O-C, C-O and C-C bonds. Although there was no trace of notable
nucleic acids, phosphorylated proteins, phospholipids in GBF samples, the WF
samples showed a band assignment of asymmetric phosphodiesters at 1000 cm-1.
These results confirmed the previous findings about sensitivity of β-sheet, α-helix
and amide structures to the freezing-drying process (Nasrin et al., 2015). a-
molecular bonds compared to GBF.

CHAPTER 5: GREEN BANANA FLOUR STRUCTURAL PROPERTIES
122
Table 5.5. FTIR peaks for green banana and wheat flour samples
Wavenumber (cm-1) Band
assignments
Primary
contributing
biomolecules WF FDF ODF50 ODF80 ODF110
3282.91 3281.52 3277.79 3271.98 3272.09 ν(=C–H)
OH groups
Unsaturated
lipids
2925.19 2922.4 2924.39 2892.58 2919.47
νas(C–H) of CH3
OH groups and
CH2
deformations
Saturated lipids
1644.34 - 1631.27 1615.49 1611.32 amide I
Protein 1536.49 - - - - amide II
1343.21 1368.06 1339 1338.55 1337.34 amide III
1146.34 998.06 995.49 995.83 996.24
ν(C–O–C), ν(C–
O), ν(C–C), ν(C–
O–P), ν(P–O–P)
Carbohydrates,
nucleic acids,
phospholipids
and proteins
1000.02 - - - -
νas(P=O) of
phosphodiesters
(PO2−)
C–O (Aliphatic
amines)
Nucleic acids,
phosphorylated
proteins,
phospholipids
ν, stretching, s, symmetric, as, asymmetric, WF, wheat flour, FDF, freeze-dried flour, ODF50, oven-
dried flour at 50 °C, ODF80, oven-dried flour at 80 °C, ODF110, oven-dried flour at 110 °C.
5.3.6. Mineral content
It is well known that ripe banana pulp is known as a rich source of potassium and
magnesium in the diet, while ripe banana peel do not contain much of these

CHAPTER 5: GREEN BANANA FLOUR STRUCTURAL PROPERTIES
123
minerals (Segundo et al., 2017b). There is no information available on the mineral
content in whole green banana flour. As reported by Sulaiman et al. (2011) in a
study on different species of fresh banana, the peel showed almost three times more
K content compared to the pulp. In the present work, the average potassium and
magnesium content of GBF samples was at least 11 and three times more than those
found in the WF, respectively. Considering that the type of the heat treatment used
for GBF production did not show significant difference amongst the samples (P-
value > 0.05), it can be concluded that 100 g of GBF contributes 42% of the Dietary
Reference Intake (DRI) for potassium (Monsen, 2000). Furthermore, the marked
increase in copper content in all GBF samples indicated that this flour is a rich
source of this essential trace mineral (Table 5.6). The average Mg content of all GBF
samples (145.33 mg/100 g) was significantly higher than WF (37.5 mg/100 g) (P-
value < 0.05). The DRI for Mg has been reported as 420 mg for male adults and 320
mg for female adults (Monsen, 2000). The Mg content of GBF produced in this
study, from either of the drying methods, can provide around 34% (males) to 45%
(females) of the DRI for Mg.
This trend was similar in terms of Ca, Mn, Fe and Zn content of GBF samples. The
DRI for calcium is 1000 mg for adults (Monsen, 2000). The GBF obtained in this
work would supply about 8% of the DRI for Ca. As Haslinda et al. (2009) showed
in his comparative study on GBF and GBPF (awak ABB Muasa Acuminate), the
amount of minerals increases when peel is incorporated into pulp flour. The current
results mostly agree with the previous reports for Cu and Mg obtained from GBF

CHAPTER 5: GREEN BANANA FLOUR STRUCTURAL PROPERTIES
124
dried at 60 °C (Toledo De Camargo Ranzani et al., 1996, Pereira and Maraschin,
2015). However, the average values for Ca, P, Fe, K, Zn and Na are higher than those
reported by Aurore et al. (2009) and Haslinda et al. (2009). This might be due to the
differences in cultivars, genus and also environmental factors (Pereira and
Maraschin, 2015).
Table 5.6. Mineral composition of green banana and wheat flour samples (mg/100 g)
Minerals WF FDF ODF50 ODF80 ODF110
Na 13.01±0.20 b 17.01±0.10 a 17.50±0.1 a 17.30±0.1 a 17.60±0.10 a
Mg 110.50±11.5 b 143.33±8.9 a 144.66±13.07 a 143.03±11.05 a 143.66±9.12 a
P 335.01±2.71 a 293.33±3.23 b 292.3±2.18 b 292.02±2.61 b 291.90±3.62 b
K 377.33±3.10 b 2001.30±2.10 a 2002.66±2.11 a 2007.66±2.17 a 2002±3.71 a
Ca 23.73±0.10 b 85.53±0.53 a 84.60±0.23 a 83.23±0.31 a 83.33±0.36 a
Mn 1.43±0.01 b 2.49±0.05 a 2.62±0.06 a 2.60±0.04 a 2.52±0.05 a
Fe 1.25±0.10 b 3.41±0.05 a 3.99±0.06 a 3.39±0.07 a 3.46±0.10 a
Cu 0.20±0.04 b 0.40±0.01 a 0.39±0.03 a 0.34±0.02 a 0.35±0.01 a
Zn 1.90±0.01 b 3.09±0.02 a 3.14±0.02 a 3.04±0.02 a 3.04±0.01 a
Mean ± standard deviation values of triplicate determinations. Values with different letters in the
same column are significantly different (P-value < 0.05). WF, wheat flour, FDF, freeze-dried flour,
ODF50, oven-dried flour at 50 °C, ODF80, oven-dried flour at 80 °C, ODF110, oven-dried flour at
110 °C.

CHAPTER 5: GREEN BANANA FLOUR STRUCTURAL PROPERTIES
125
5.4. Conclusion
The particle size results suggested that ODF50 treatment group had the highest
percentage of uniform flour compared to other higher drying temperatures and was
the nearest to the non-heat treatment method. This behaviour was correlated to
density properties, where ODF50 samples showed the same heaviness to FDF
samples, while higher drying temperature (i.e., ODF80 and ODF110 treatment
groups) resulted in flour that is easier for transportation and packaging. As the
Hausner ratio and compressibility index show, FDF and ODF50 displayed a strong
agglomeration with propensity to create a better slurry in the presence of water.
These results were correlated with textural properties, which indicated the ODF50
treatment resulted in a flour that was viscose cohesive with higher consistency
compared to the other heat-treated samples. These results, together with the pasting
behaviour of GBF samples, indicated that the functionality of GBF was significantly
affected by treatment at temperature higher than 50 °C. Consequently, due to the
lower setback parameter, syneresis phenomena are more likely to happen in ODF80
and ODF110 samples. Likewise, the findings from this study confirmed that the
incorporation of peel into pulp flour improved the stability of flour paste and
increased resistance during mixing. Likewise, FDF can act as a good thickener and
stabilizer in the food matrix. Furthermore, FDF and ODF50 samples are remarkable
sources of potassium, magnesium and calcium. However, further studies are

CHAPTER 5: GREEN BANANA FLOUR STRUCTURAL PROPERTIES
126
required to understand the behaviour of these GBF samples in different food
products.
5.5. Limitations
More textural attributes could have been done with different probes (Light Knife
Blade, Kieffer dough & gluten extensibility rig, Chen-Hoseney dough stickiness rig
and Warburtons dough stickiness system) which were not available. Textural tests
such as extrusion, tensile and adhesion could have provided more information on
the green banana flour characteristics for potential application in other food
products. Also, use of the amylograph test could have provided information about
alpha amylase activity, gelatinisation of starch and its relation to the observed
rheological properties.

Chapter 6

CHAPTER 6: TEXTURAL PROPERTIES OF GREEN BANANA FORTIFIED BREAD
128
Rheological, textural and structural changes in dough and bread
partially substituted with whole green banana flour
This chapter has been published as:
AMINI KHOOZANI, A., KEBEDE, B. & BEKHIT, A. E. D. A. 2020b. Rheological,
textural and structural changes in dough and bread partially substituted with
whole green banana flour. LWT - Food Science and Technology, 126, 109252.
Chapter aim:
The nutritional properties of the green banana flours produced in chapter 4 were
evaluated in chapter 5. To gain more insights on the utility of these flours the
rheological properties of the flours need to be studied. The present chapter
investigates the textural and storage properties of a bread made at different
fortification levels of whole green banana flour produced by oven or freeze-drying
techniques to examine their impact on the technological properties of dough and
bread in relation to fortification level.

CHAPTER 6: TEXTURAL PROPERTIES OF GREEN BANANA FORTIFIED BREAD
129
6.1. Introduction
Bread is the most consumed staple food around the world, especially in developing
countries, and is mainly composed of flour, water, yeast and salt (Mancebo et al.,
2017). Bread is considered an unstable solid foam formed by crust and crumb with
a dispersion of starch molecules in a continuous protein matrix (Arp et al., 2018).
White bread is the most popular bread type in the world, however, there is a
growing research on fortifying it with an array of dietary fibres (DF) and functional
compounds to make bread as a carrier of health benefiting compounds. In recent
years, substitution of wheat flour with bran, prebiotics, vitamins, minerals, and
others functional ingredients has been proposed (Al-Sheraji et al., 2013).
Considering the global high amount of banana loss along the production chain, the
utilization at early stage can be a feasible solution to reduce banana waste. Drying
and converting the whole green banana into a flour has been proposed as a potential
process to produce a long-lasting food ingredient. The effect of different drying
treatments on green banana has been reported in the previous chapters.
The structural quality of bread emanates from the gluten-starch matrix, and
substitution of wheat flour with other ingredients could result in poor technological
properties. Researchers have attempted to predict bread quality by dough
properties analysis (Al-Sheraji et al., 2013). However, those studies were limited to
banana pulp flour only. Others investigated banana flour (BF) in pasta, noodles and
gluten-added bread with the focus on nutritional and digestive attributes of the

CHAPTER 6: TEXTURAL PROPERTIES OF GREEN BANANA FORTIFIED BREAD
130
products more than the technological aspects (Anyasi et al., 2018, Alkarkhi et al.,
2011, Vu et al., 2018, Almeida-Junior et al., 2017).
In the previous chapters, the characteristics of four types of prepared GBF were
examined. The GBF prepared at 50° C (ODF50) and by freeze drying (FDF) were
selected to be incorporated in bread model to examine the effects of the flour
samples on the nutritional properties of the fortified bread (chapter 5). The present
study investigates the textural and storage properties of this fortified bread made
at three different fortification levels to examine the impact on the technological
properties of dough and bread.
6.2. Material and Methods
6.2.1. Green banana flour preparation
The flour samples (air-oven-dried and freeze-dried green banana flours) were
produced as described in chapter 4, section 4.2.1.
6.2.2. Breadmaking process
Preliminary tests were conducted to determine the maximum quantity of green
banana flour (GBF) to prepare a bread with at least specific volume of 4 L/kg
(Sluimer, 2005). Maximum GBF incorporation to be used in formulation was 30%.
The dough was formulated with a mixture of wheat flour (WF) or three substitution
levels of freeze-dried green banana flour (FDF) and oven-dried green banana flour

CHAPTER 6: TEXTURAL PROPERTIES OF GREEN BANANA FORTIFIED BREAD
131
(ODF) (10%, 20% and 30% w/w) and labelled as F10, F20, F30 and O10, O20 and
O30. Above 30% of substitution resulted in poor technological and sensory
properties. Only the breads with specific volume greater than 4 L/kg were selected
to continue the study because lower values than that negatively affect the quality
of the breads (Sluimer, 2005). A control bread was baked with 100% wheat flour
and labelled as WB (wheat bread).
The formulation for making 100 g control dough sample was as follows: 53.2 g of
WF, 16 ml of water, 16 ml of standard milk (3% fat), 0.5 g of sodium chloride, 5 g of
honey, 8.8 g of butter and 0.5 g of activated dried yeast. Treatments were made with
10%, 20% and 30% substitution of GBF replacing the WF. Water addition was kept
constant in all formulations in order to examine the true effect of fortification on
bread dough. The dough was made using a bread maker-mixer (Breville, Sydney,
Australia). All dry ingredients were mixed for 3 min at a low speed followed by
addition of liquid ingredients and mixed for another 3 min. The mixture was
kneaded for 12 min at a medium speed (Arp et al., 2017). This fresh dough was used
for the assessment of viscoelastic and mechanical properties.
6.2.3.1. Viscoelastic properties
The fundamental rheological analysis of the dough samples was performed by
oscillation tests based on Mancebo et al. (2017) method. A Haake RheoStress
rheometer (Thermo Fisher Scientific, Schwerte, Germany) equipped with a Phoenix

CHAPTER 6: TEXTURAL PROPERTIES OF GREEN BANANA FORTIFIED BREAD
132
II P1-C25P water bath at 25 °C. The rheometer was installed with a 60 mm titanium
serrated plate-PP60 Ti in parallel plate-plate geometry with a 3-mm gap. The dough
was rested for 300 s prior the test. Firstly, a strain sweep test was performed at 25
°C with a stress range of 0.1 - 10 % at the frequencies of 0.1, 1, 10 and 100 Hz to
identify the linear viscoelastic region. Based on the obtained results, a strain value
of 0.1% in the linear region was selected (part of the plot stress versus strain where
is linear). Finally, 1 Pa was chosen for all dough samples. Storage modulus (G′), loss
modulus (G′′), loss tangent (tan δ), complex modulus (G*) and complex viscosity
(|ɳ*|) responses were collected a HAAKE RheoWin Data Manager ver. 3.50.0012
(Thermo Fisher Scientific, Schwerte, Germany).
6.2.3.2 Large deformation mechanical properties of dough
The texture profile analysis (TPA) was used to determine hardness, adhesiveness,
resilience, cohesiveness, springiness and chewiness. The test was completed using
a TA-XT2 texture analyser (Stable Micro Systems, Surrey, UK) using a 50 mm
diameter aluminium probe at speed of 1.0 mm/s, 75 s delay between first and
second compression and a 60% compression of dough original height (Sanz-Penella
et al., 2010). Approximately 20 g of dough was freshly made (without yeast) in a
spherical shape. To prevent moisture loss and the distortion induced by the
negative peak of adhesiveness, a plastic film was applied on the dough. A second

CHAPTER 6: TEXTURAL PROPERTIES OF GREEN BANANA FORTIFIED BREAD
133
TPA was made without plastic film for measuring the dough adhesiveness
(Sanchez et al., 2014). The test was performed at the room temperature.
6.2.4. Bread characteristics
Bread samples (n = 3) were prepared according to a straight dough procedure with
the same bread-maker (Breville, Sydney, Australia). After the first dough proofing
for 90 min, it was kneaded for 5 min for deaeration. Followed by the final proofing
(30 min), baking was completed within 180 °C for 25 min in the same bread maker-
mixer. Bread samples were cooled at room temperature for one hour before packing
in polypropylene zip bags. Except for textural analysis, breadcrumb samples were
grounded, freeze-dried and vacuum packed for the further analysis.
6.2.4.1 Bread baking performance
Baking performance parameters were carried out on the fresh bread loaves. The
bread mass was determined by the average value of a direct measurement of three
bread loaves. The apparent volume was measured by the rapeseed’s displacement
method (AACC 10-05 method) as described by previous researchers (Gomes et al.,
2016, Altuna et al., 2016, Ho et al., 2013). The seeds were poured into an empty
container to measure its volume. Then, the rapeseeds in the container were
measured in a graduated cylinder and marked as V1. Afterwards, a bread loaf
sample was placed into the same container and rapeseeds were poured in until the

CHAPTER 6: TEXTURAL PROPERTIES OF GREEN BANANA FORTIFIED BREAD
134
test bread sample was covered. The rapeseeds were measured again in a graduated
cylinder and labelled as V2.
Bread apparent volume = V1 - V2 (6.1)
Bread density was calculated by dividing bread mass to bread volume. The baking
loss and specific volume (SV) were calculated as described in equations below (Ho
et al., 2013, Gujral et al., 2018):
% Baking loss = Weight of the dough - Weight of baked bread
Weight of the dough (6.2)
Bread specific volume (cm3/g) = Bread apparent volume (cm3)
Bread mass (g) (6.3)
6.2.4.2. Textural properties of fresh breadcrumb
Texture profile analysis was performed by the texture analyser using a 50 kg load
cell and a 50 mm aluminium cylindrical probe. The pre-test and post-test speed was
1.0 mm/s and the test speed was 4.0 mm/s with one second interval time between
the first and second cycles (Liu et al., 2018). The texture profile analysis software
(TPA) was used to calculate hardness, resilience, springiness and chewiness.
6.2.4.3. Storage stability of bread
In order to understand the changes in bread structure during the storage time,
firmness (F) and moisture content (MC) were analysed under different time and
temperature values. The AACC (2000) method number 74-09 was employed as

CHAPTER 6: TEXTURAL PROPERTIES OF GREEN BANANA FORTIFIED BREAD
135
modified by Mohamed et al. (2010). A bread slice with 25 mm in thickness was
undergone in the TPA using a 50 kg load cell equipped with a 50 mm aluminium
cylindrical probe. The analysis was performed on bread slices after 0, 2, 4 and 7 days
of storage at 25 °C, 4 °C and -20 °C.
6.2.6. Data analysis
The statistical analysis of data was performed using Minitab® program version 16
(Minitab, Australia). Data were analysed using one-way ANOVA test to determine
the effect of GBF type and fortification levels on the measured parameters. The
correlation amongst parameters was assessed using Pearson’s correlation. Post-hoc
Tukey test was used to determine the differences amongst the means at P-value <
0.05. The means of three replicates expressed as mean ± standard deviation.
6.3. Results and Discussion
6.3.1. Dough rheological properties
Frequency sweep results showed that all dough samples had higher G′ than G′′,
signifying a viscoelastic behaviour of dough (Table 6.1). Compared to the low GBF
fortification levels (10% and 20%), WB showed significantly higher G′ in dough
samples regardless of the GBF type (P-value < 0.05). This could be as a result of
gluten network loss in the GBF samples (Zhang et al., 2019). In the F30 and O30

CHAPTER 6: TEXTURAL PROPERTIES OF GREEN BANANA FORTIFIED BREAD
136
samples, the effect of low content of gluten owing to replacing the WF with GBF,
might be compensated by the presence of high percentage of GBF.
Higher percentage of soluble DF in green banana peel together with higher total
starch content has also been considered factors that can increase G* value (Kurhade
et al., 2016). This can be seen in Table 6.1, where F30 and O30 showed the highest
complex modulus which indicated those dough samples contained the greatest
rigidity amongst other ones (P-value < 0.05).
Table 6.1. Viscoelastic properties of bread dough determined at frequency of 1 Hz
Sample G′ (Pa) G′′ (Pa) tan (δ) |G*| (Pa) |ɳ*| (Pas.s)
WB 2571±100.90 b 732±48.80 b 0.28±0.01 d 2665±89.80 c 425±19.70 b
F10 1392±100.01 cd 499±50 cd 0.36±0.01 a 1475±104.40 de 235±19.60 cd
F20 1605±98.70 c 573±50.50 c 0.36±0.01 a 1705±98.50 d 272±19.90 c
F30 2844±120.70 ab 936±50.80 a 0.33±0.01 c 3180±107.20 b 473±21.20 ab
O10 1172±93.20 d 429±50.60 d 0.36±0.01 a 1249±98.80 e 198±20.10 d
O20 1774±103.70 c 625±46.50 c 0.33±0.01 b 1860±99.30 bc 264±20.20 c
O30 3075±162.70 a 1038±48.40 a 0.32±0.01 c 3262±89.30 a 524±15.70 a
Mean ± standard deviation values of triplicate determinations. Values with different letters in the
same column are significantly different (P-value < 0.05). G′, storage modulus, G′, loss modulus, tan
δ, loss tangent, G*, complex modulus, |ɳ*|, complex viscosity, WB, wheat bread, F10, F20 and F30,
substitution levels of freeze-dried banana flour with wheat flour. O10, O20 and O30, substitution
levels of air oven-dried banana flour with wheat flour.

CHAPTER 6: TEXTURAL PROPERTIES OF GREEN BANANA FORTIFIED BREAD
137
Moreover, a lower tan (δ) value was found in WB samples compared to all fortified
bread samples. Han et al. (2019) reported that increasing starch content can be
associated with weakening the strength of the gluten strength and results in
impaired dough viscoelasticity. Furthermore, presence of DF in the bread dough
could reduce starch swelling which might decrease the bread volume (Blanco
Canalis et al., 2019). The same increasing trend for G* and ɳ* in 30% fortified bread
samples resulted in lower bread volume compared to 20% and 10% treatments (P-
value < 0.05). These results might indicate the dough ability to resist the expansion
caused by yeasts during fermentation (Mirsaeedghazi et al., 2008).
6.3.2. Dough mechanical properties
The hardness of the dough represents the peak force measured during the first
compression in TPA. Considering the high amount of DF and lower gluten in GBF
compared to WF, an increase in hardness with the increasing in fortification level
was recorded (Table 6.2). Higher water holding capacity in GBF, especially FDF,
promotes partial dehydration of gluten, starch incomplete gelatinisation and trans-
conformational change in dough structure (Loong and Wong, 2018). These changes
make the fibres to act as a barrier against water migration and protected starch
granules from swelling (Steglich et al., 2014). Current findings concurred with those
found in a high-fibre steamed bread made with high amylose maize starch (Lin et
al., 2012) and also in a bread fortified with 10% bran (Bock et al., 2013).

CHAPTER 6: TEXTURAL PROPERTIES OF GREEN BANANA FORTIFIED BREAD
138
It has been reported that gums and soluble DF can increase the adhesiveness of the
dough because of the hydrophilic sites (Altuna et al., 2015). In support, Guo et al.
(2003) reported that high amylose content is another factor for increasing dough
adhesion. The GBF used in the current study showed almost three times more
amylose than WF (Fig 4.3). In fact, a suitable dough for Breadmaking should not be
too sticky (Loong and Wong, 2018). As it can be seen in Table 6.2, fortified dough
samples exhibited lower adhesion compared to control, without any significant
difference amongst GBF samples. Overall, it can be concluded that FDF had slightly
improved dough characteristics compared to ODF.
Cohesion showed a significant decrease above 10% fortified dough samples
compared to control ones (Table 6.2). Also, dough made with ODF exhibited lower
cohesiveness values in comparison to FDF-fortified bread samples (P-value < 0.05).
These results were similar to those reported by Arp et al. (2017) who suggests the
presence of gluten is vital for cohesiveness. This phenomenon can also explain the
lower adhesiveness values in all fortified doughs compared to the wheat dough.
Steglich et al. (2014) reported that DF can prohibit water migration and inhibit the
starch swelling, which results in the reduction of adhesiveness.
Elasticity or springiness refers to the tendency of the deformed dough to return to
its undeformed condition after removal of force. Springiness showed no significant
difference amongst treatments; however, lower values were recorded in control
dough (P-value < 0.05) which was similar to the findings found in dough enriched
with RS (Altuna et al., 2015).

CHAPTER 6: TEXTURAL PROPERTIES OF GREEN BANANA FORTIFIED BREAD
139
Table 6.2. Large mechanical properties of bread dough samples
Sam
ple
Hardness (N) Adhesiveness
(N.sec)
Resilience
(%)
Cohesivenes
s
Springiness
(%)
WB 0.82±0.28 c 0.24±0.01 a 0.08±0.01 cd 0.67±0.02 a 0.47±0.01 b
F10 0.98±0.44 abc 0.59±0.02 ab 0.11±0.01 a 0.61±0.02 ab 0.78±0.01 a
F20 0.99±0.83 abc 0.91±0.01 b 0.09±0.01 ab 0.6±0.01 b 0.69±0.01 a
F30 1.05±0.73 ab 0.69±0.05 b 0.07±0.01 d 0.47±0.01 c 0.63±0.01 ab
O10 0.8±0.12 c 0.59±0.01 ab 0.09±0.01 bc 0.59±0.03 ab 0.68±0.01 a
O20 0.86±0.24 bc 0.81±0.06 b 0.08±0.01 cd 0.58±0.02 bc 0.68±0.01 a
O30 1.08±0.63 a 0.83±0.02 b 0.08±0.01 cd 0.4±0.02 d 0.66±0.01 a
Mean ± standard deviation values of triplicate determinations. Values with different letters in the
same column are significantly different (P-value < 0.05). WB, wheat bread, F10, F20 and F30,
substitution levels of freeze-dried banana flour with wheat flour. O10, O20 and O30, substitution
levels of air oven-dried banana flour with wheat flour.
6.3.4. Bread baking performance
A significant decreasing trend was observed in bread height and SV with more
incorporation of GBF regardless of its drying method (P-value < 0.05). As the GBF
percentage increased in the bread, a denser structure with a significant higher SV
was recorded (Table 6.3). Higher loaf volume achieved in a bread fortified with the
flour made from banana pseudo-stem pulp only when it was accompanied with
carboxyl methylcellulose (Ho et al., 2013). Partial substitution of WF with rye, oat,
barley and sweet potato resulted in a significant increment in bread density (Al-
Sheraji et al., 2013). This observation could be related to the reduction in glutenin,

CHAPTER 6: TEXTURAL PROPERTIES OF GREEN BANANA FORTIFIED BREAD
140
which causes the reduced ability of bread to hold the expanded structure
(Lazaridou et al., 2007).
It is well-known that gluten plays a key role in bread structure and the maintenance
of moisture during the baking process. Baking loss is an indicator of water loss from
dough during baking (Arp et al., 2017). To reduce moisture loss during baking,
partial substitution of WF with starch, flour improvers, hydrocolloids and
hydrophilic groups have been suggested (Silvas García et al., 2013). The ability of
gluten-starch matrix to hold water in the texture during baking is directly related
to the percentage of GBF added, and a lower baking loss percentage was evident at
higher level of fortifications. The substitution at 30% FDF or ODF significantly
reduced the moisture loss (P-value < 0.05), which could be because of an increase in
hydrophilic bonds of total starch content in fortified bread samples. Our previous
findings on the same samples showed at least 5% more total starch content in 30%
fortified samples compared to control bread samples (Fig 4.2). These findings also
were similar to those found in banana bread made with 10% banana pseudo-stem
pulp with added carboxy methyl cellulose as a texture improver (Ho et al., 2013,
Altuna et al., 2015, Gujral et al., 2018). Considering the baking loss values, it can be
concluded that there was no significant difference between the types of the GBF
used in bread in 30% fortification level compared to control.

CHAPTER 6: TEXTURAL PROPERTIES OF GREEN BANANA FORTIFIED BREAD
141
Table 6.3. Baking performance of bread samples S
amp
le
Bre
ad H
eig
ht
(cm
)
SV
(cm
3 /g
)
Den
sity
(g/c
m3 )
Bak
ing
Lo
ss
(%)
Do
ug
h m
ass
(g)
Bre
ad m
ass
(g)
Ap
par
ent
vo
lum
e (c
m3 )
WB 9.10±0.01 b 4.50±0.03 b 0.22±0.01 e 6.80±0.26 d 586±7.81 ab 546±6.51 ab 2500±12.7 b
F10 9.90±0.05 a 4.80±0.01 a 0.21±0.02 f 8.78±0.52 b 587±3.86 ab 536±3.31 bc 2596±5.69 a
F20 8.90±0.05 c 4.46±0.03 c 0.23±0.01 d 8.60±0.62 bc 591±0.47 ab 540±3.31 abc 2396±5.29 c
F30 8.17±0.05 f 4.12±0.01 d 0.25±0.03 a 7.40±0.16 cd 592±0.93a 549±2.56 a 2164±15.11 f
O10 9.20±0.10 b 4.50±0.07 bc 0.23±0.01 c 10.22±0.01 a 590±3.08 ab 533±4.24 c 2433±13.01 c
O20 8.60±0.1 d 4.20±0.05 d 0.22±0.01 de 8.91±0.63 b 591±1.59 ab 538±2.31 bc 2278±30.63 d
O30 8.40±0.010 e 4.10±0.50 d 0.24±0.02 b 7.5±0.42 cd 580±4.44 b 536±4.36 bc 2227±14.01 e
Mean ± standard deviation values of triplicate determinations. Values with different letters in the
same column are significantly different (P-value < 0.05). WB, wheat bread, F10, F20 and F30,
substitution levels of freeze-dried banana flour with wheat flour. O10, O20 and O30, substitution
levels of air oven-dried banana flour with wheat flour. SV, Specific volume.
6.3.5. Textural analysis of breadcrumb
The texture of breadcrumb is a vital factor which can be regarded as a freshness
indicator by consumers (Hernández-Aguirre et al., 2019). Despite of the type of
GBF, the increase in GBF levels in bread samples increased hardness and chewiness
(Fig 6.1, P-value < 0.05). Since the baking performance of fresh bread exhibited a
denser structure in fortified samples, consequently, it affected resilience and
springiness in a converse manner (P-value < 0.05). This phenomenon could be due
to the presence of the high solid components, incomplete gelatinisation of starch,
partial retrogradation after baking, less gluten matrix, and less expansion of gas

CHAPTER 6: TEXTURAL PROPERTIES OF GREEN BANANA FORTIFIED BREAD
142
cells (Loong and Wong, 2018, Agama-Acevedo et al., 2019). Moreover, significant
differences were observed due to the GBF type where chewiness values were higher
in ODF-fortified bread samples compared to FDF ones (Fig 6.1). Our previous
results, using the approach under the same experimental conditions, showed a
higher porous structure in FDF compared to the ODF, which led to higher water
holding capacity and oil holding capacity compared to the ODF (Table 4.4 and 5.2).
The lower water binding capacity and the coarse structure of ODF compared to FDF
could be the reasons for a denser structure and higher chewiness in the former
treatment.
Interactions between protein, DF, starch and lipid are important for structural
changes occurring during breadmaking (Liu et al., 2018). For instance,
incorporation of 20% shortenings decreases hardness due to the softening effect of
lipids and water entrapment within of the bread structure (Mancebo et al., 2017).
Further, high amylose maize starch increased the springiness of bread when it
substituted WF at 30% (Arp et al., 2018). The hardness values were in accordance to
the findings of Gomes et al. (2016) for bread contained 20% green banana pulp flour
together with protein and flour improver. Soto-Maldonado et al. (2018) findings on
muffin made with partial substitution of over ripen banana flour exhibited a lower
hardness compared to control, which suggests that the lower DF in ripe banana
compared to green one affects the texture of the product.

CHAPTER 6: TEXTURAL PROPERTIES OF GREEN BANANA FORTIFIED BREAD
143
0
10
20
30
40
50
WB F10 F20 F30 O10 O20 O30
Fo
rce
(N)
Bread samples
Hardness (N) Chewiness (N)
e
d
c
a
d
b
a
k
i
h
g
g
f i
Figure 6.1. Textural properties of fresh bread crumb samples
Mean ± standard deviation values of triplicate determinations. Bars with the different letters
in the same variable are significantly different (P-value < 0.05) (a to e for hardness and f to
k for chewiness). WB, wheat bread, F10, F20 and F30, substitution levels of freeze-dried
banana flour with wheat flour. O10, O20 and O30, substitution levels of air oven-dried
banana flour with wheat flour.
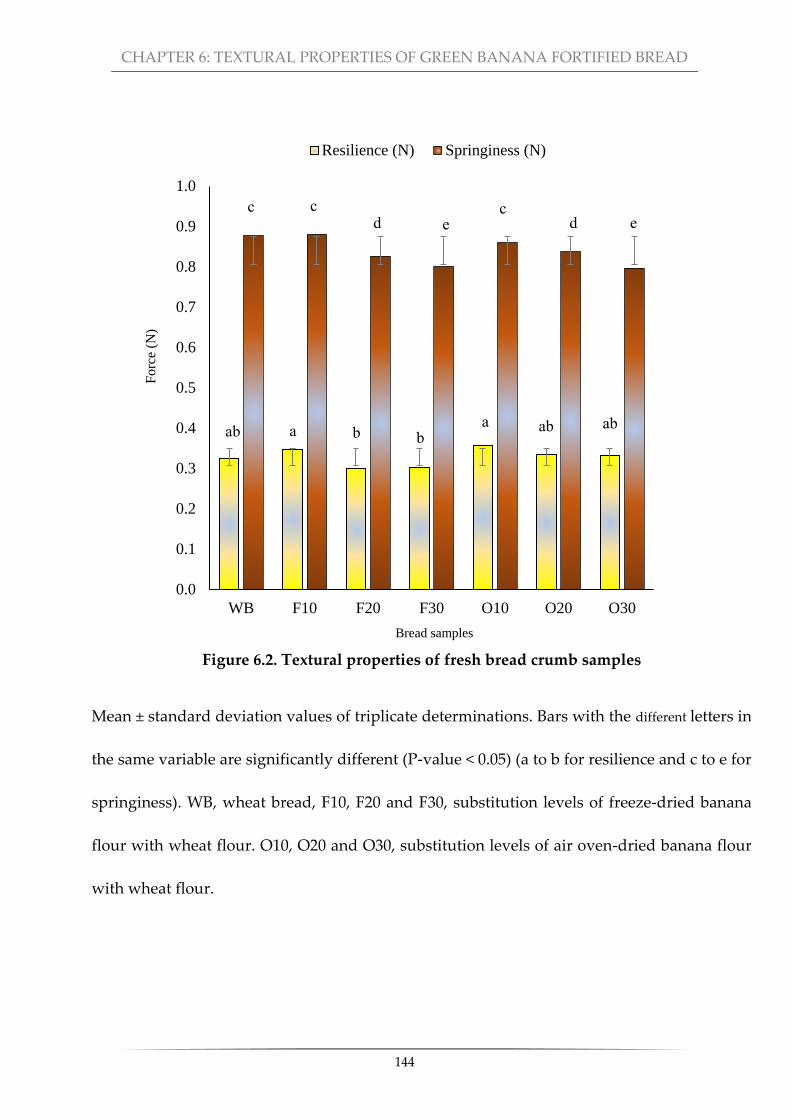
CHAPTER 6: TEXTURAL PROPERTIES OF GREEN BANANA FORTIFIED BREAD
144
0.0
0.1
0.2
0.3
0.4
0.5
0.6
0.7
0.8
0.9
1.0
WB F10 F20 F30 O10 O20 O30
Forc
e (N
)
Bread samples
Resilience (N) Springiness (N)
ab
a
b
b
a
ab
ab
c
c
d
e
c
d
e
Figure 6.2. Textural properties of fresh bread crumb samples
Mean ± standard deviation values of triplicate determinations. Bars with the different letters in
the same variable are significantly different (P-value < 0.05) (a to b for resilience and c to e for
springiness). WB, wheat bread, F10, F20 and F30, substitution levels of freeze-dried banana
flour with wheat flour. O10, O20 and O30, substitution levels of air oven-dried banana flour
with wheat flour.
CHAPTER 6: TEXTURAL PROPERTIES OF GREEN BANANA FORTIFIED BREAD
145
6.3.6. Bread staling during storage
Starch gelatinisation occurs during baking, implicating the loss of double helix
structure of amylopectin and leaching amylose out of starch granule.
Retrogradation of starch is a phenomenon that stems from slow recrystallization of
amylose and amylopectin. Retrogradation results in bread staling which
contributes to increasing the firmness of the breadcrumbs and thus it becomes less
desirable by consumers (Curti et al., 2014). These changes are directly influenced by
the temperature and time of storage as well as the ingredients used in the making
of the bread. This can affect consumer acceptability due to the changes in firmness
and moisture loss. As a result, measuring these variables are considered indications
for bread staling (Salinas and Puppo, 2018).
Overall, the lowest MC was recorded in O30 samples stored at 25 °C after seven
days of storage (Table 6.4). According to the results, the highest water retention was
found in control samples stored and 10% fortified ones stored at 25 °C after two
days of storage. Results for firmness indicated the highest value in O30 samples
after seven days of storage in the fridge and at room temperature, while F10
samples depicted the least firmness under freezing condition after two days of
storage (5.2 N) (Table 6.5).
Regardless of the storage conditions, firmness of bread fortified with ODF was at
least similar or higher than FD-fortified ones and WB (P-value < 0.05). Considering
the fact that MC level was significantly higher in WB compared to the fortified

CHAPTER 6: TEXTURAL PROPERTIES OF GREEN BANANA FORTIFIED BREAD
146
samples throughout the storage, it can be suggested that loss of moisture can affect
the rate of starch retrogradation, especially in the 4 °C samples. These findings were
in accordance with the findings of Mohamed et al. (2010), who reported higher
banana pulp flour fortification lead to high staling rate after two days of storage.
The authors suggested that a lower gluten content and a higher insoluble fibres
content can increase firmness. This behaviour was also seen in inulin-fortified bread
stored at ambient temperature after the third day of storage (Salinas and Puppo,
2018). In terms of storage temperature, storage at -20 °C showed the lowest firmness
(P-value < 0.05) independent from the type of GBF in fortified bread samples. The
F10 treatment exhibited the nearest firmness to WB after a week of storage at -20
°C. Regarding fortification level, due to the increment in coarse DF amounts and
lower moisture content in the fortified bread, there was an inverse relationship
between GBF fortification level and firmness at all storage conditions. Al-Mahsaneh
et al. (2018) showed that elevated amount of sugar has a direct influence on the
migration of water from gelatinised starch, gluten and soluble fibres, which
eventually causing bread stiffness. Current findings showed that the amount of
carbohydrate was higher in FDF and ODF compared to WF. The Tables 6.4 and 6.5
show the results of firmness and MC changes during different storage conditions.

CHAPTER 6: TEXTURAL PROPERTIES OF GREEN BANANA FORTIFIED BREAD
147
Table 6.4. The moisture content of bread samples during different storage conditions
Sample
Days 0 2 4 7
T (°C) MC (%) MC (%) MC (%) MC (%)
WB
25
38.5±2.7 a
37.7±1.9 b 34.9±1.7 d 33.7±2.1 f
4 34.6±1.7 de 32.3±1.5 g 29.5±1.9 h
-20 35.5±1.6 c 34.5±1.6 de 34.1±1.5 ef
F10
25
35.8±2.3 a
35.2±1.9 b 34.8±1.6 bc 33.2±1.6 e
4 34.2±1.8 d 32.5±1.7 f 30.7±1.8 g
-20 34.9±1.9 bc 34.9±1.9 bc 34.6±1.8 cd
F20
25
35.3±2.4 a
34.8±0.9 ab 34.3±1.2 c 31.3±0.7 e
4 34.5±1.9 bc 31.8±1.8 d 30.3±0.8 f
-20 34.9±0.9 ab 34.6±1.3 bc 34.3±1.1 c
F30
25
34.8±2.9 a
32.5±1.1 c 31.5±1.3 d 29.1±1.8 f
4 33.7±1.9 b 30.7±1.5 e 29.5±1.7 f
-20 34.8±1.5 a 34.4±1.2 a 34.2±1.5 ab
O10
25
35.4±2.7 a
35.2±1.6 ab 34.4±1.7 c 33.6±1.6 d
4 34.6±1.5 bc 32.4±1.9 e 30.5±1.9 f
-20 34.6±1.6 bc 34.4±1.0 c 34.2±1.8 cd
O20
25
35.9±2.7 a
34.5±2.1 bc 34.1±2.6 c 33.5±2.3 d
4 34.3±2.1 bc 31.6±2.3 e 30.4±2.2 f
-20 34.7±2.2 b 34.7±2.1 bc 34.5±2.5 bc
O30
25
34.4±2.6 a
34.2±2.7 ab 31.2±2.8 d 29.0±2.8 e
4 32.9±2.6 c 31.1±2.1 d 29.9±2.9 e
-20 33.8±2.7 b 33.74±2.6 b 32.9±2.5 c
Mean ± standard deviation values of triplicate determinations. Values with different letters for each
bread sample are significantly different (P-value < 0.05). T, temperature, WB, wheat bread, F10, F20
and F30, substitution levels of freeze-dried banana flour with wheat flour. O10, O20 and O30,
substitution levels of air oven-dried banana flour with wheat flour. SV, Specific volume.
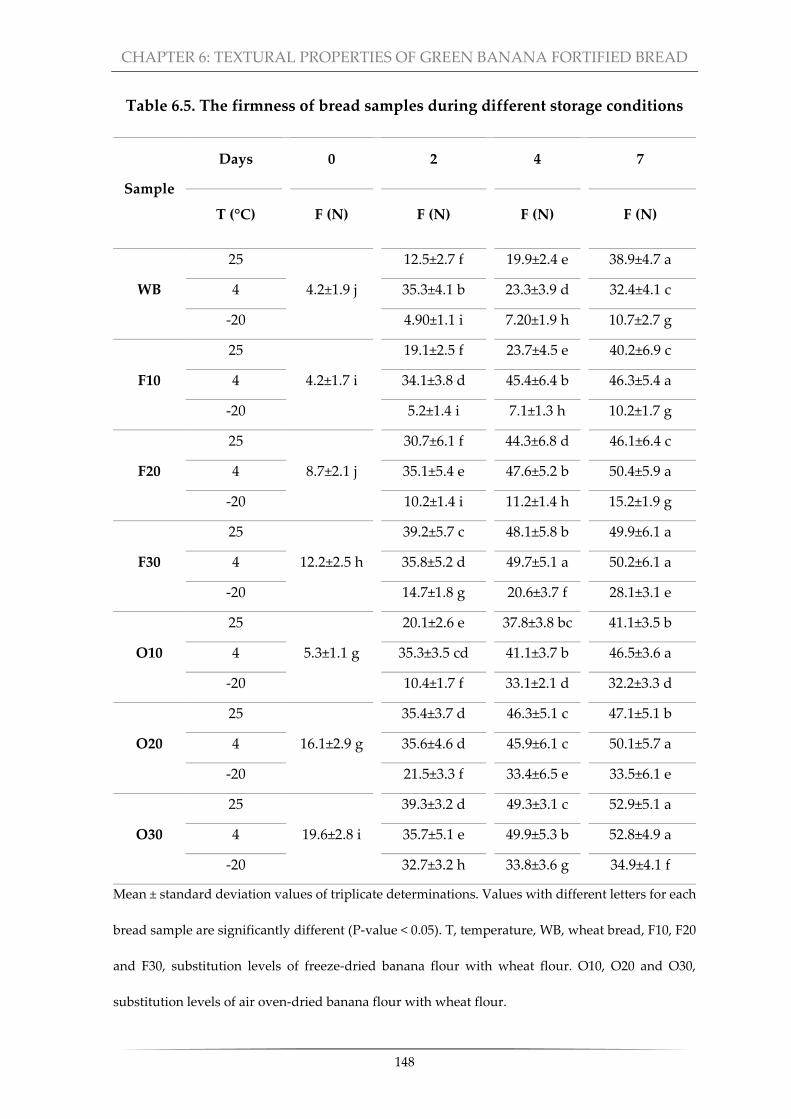
CHAPTER 6: TEXTURAL PROPERTIES OF GREEN BANANA FORTIFIED BREAD
148
Table 6.5. The firmness of bread samples during different storage conditions
Sample
Days 0 2 4 7
T (°C) F (N) F (N) F (N) F (N)
WB
25
4.2±1.9 j
12.5±2.7 f 19.9±2.4 e 38.9±4.7 a
4 35.3±4.1 b 23.3±3.9 d 32.4±4.1 c
-20 4.90±1.1 i 7.20±1.9 h 10.7±2.7 g
F10
25
4.2±1.7 i
19.1±2.5 f 23.7±4.5 e 40.2±6.9 c
4 34.1±3.8 d 45.4±6.4 b 46.3±5.4 a
-20 5.2±1.4 i 7.1±1.3 h 10.2±1.7 g
F20
25
8.7±2.1 j
30.7±6.1 f 44.3±6.8 d 46.1±6.4 c
4 35.1±5.4 e 47.6±5.2 b 50.4±5.9 a
-20 10.2±1.4 i 11.2±1.4 h 15.2±1.9 g
F30
25
12.2±2.5 h
39.2±5.7 c 48.1±5.8 b 49.9±6.1 a
4 35.8±5.2 d 49.7±5.1 a 50.2±6.1 a
-20 14.7±1.8 g 20.6±3.7 f 28.1±3.1 e
O10
25
5.3±1.1 g
20.1±2.6 e 37.8±3.8 bc 41.1±3.5 b
4 35.3±3.5 cd 41.1±3.7 b 46.5±3.6 a
-20 10.4±1.7 f 33.1±2.1 d 32.2±3.3 d
O20
25
16.1±2.9 g
35.4±3.7 d 46.3±5.1 c 47.1±5.1 b
4 35.6±4.6 d 45.9±6.1 c 50.1±5.7 a
-20 21.5±3.3 f 33.4±6.5 e 33.5±6.1 e
O30
25
19.6±2.8 i
39.3±3.2 d 49.3±3.1 c 52.9±5.1 a
4 35.7±5.1 e 49.9±5.3 b 52.8±4.9 a
-20 32.7±3.2 h 33.8±3.6 g 34.9±4.1 f
Mean ± standard deviation values of triplicate determinations. Values with different letters for each
bread sample are significantly different (P-value < 0.05). T, temperature, WB, wheat bread, F10, F20
and F30, substitution levels of freeze-dried banana flour with wheat flour. O10, O20 and O30,
substitution levels of air oven-dried banana flour with wheat flour.

CHAPTER 6: TEXTURAL PROPERTIES OF GREEN BANANA FORTIFIED BREAD
149
6.4. Conclusion
In view of the importance of the technological aspects of fortified foods, this study
aimed to determine the effect of two types of GBF on structural properties of the
fortified bread. Dough viscoelastic properties indicated a resistant dough at 30%
fortification, regardless of the GBF type, without losing considerable stretching
modulus compared to the control wheat dough. This study also showed that the
drying method used for GBF production had an impact on bread structural
properties. Utilization of FDF caused a significant decrease in moisture loss during
baking, while ODF incorporated bread samples showed lower bread height and
specific volume in all fortification levels. Although that both types of fortified bread
samples exhibited harder and chewier crumbs compared to wheat bread, even at
10%, they did not change the springiness and resilience of breadcrumbs. The effect
of storage conditions on bread staling depicted that the loss of moisture and
freshness during storage could be controlled by keeping fortified bread samples in
-20 °C. In this regard, changes in firmness were not significantly different from
control sample up to 20% of fortification with the use of FDF. More studies are
needed for the evaluation of microstructural changes in GBF bread mainly with FDF
as it has shown less textural damaging effect on bread slices. Also, sensory
evaluation and consumer acceptance are suggested for further studies in this area.

CHAPTER 6: TEXTURAL PROPERTIES OF GREEN BANANA FORTIFIED BREAD
150
6.5. Limitations
In order to make a correlation between machinery results and human senses in
terms of textural properties, a descriptive sensory panel test would have been
beneficial which have not been done in this study due to the insufficient budget and
time limitation. Furthermore, for better understanding the correlation between
bread firmness and bread mechanical properties, the determination of air-bubble
parameters (such as mean bubble area, mean bubble perimeter, number of bubbles
and bubble area ratio) needed the flatbed image scanner which was not available.

Chapter 7

CHAPTER 7: NUTRITIONAL PROPERTIES OF GREEN BANANA FORTIFIED BREAD
152
The effect of bread fortification with whole green banana flour on
its physicochemical, nutritional and in vitro digestibility
This chapter has been published as:
AMINI KHOOZANI, A., KEBEDE, B., BIRCH, J. & BEKHIT, A.E.D.A. 2020. The
effect of bread fortification with whole green banana flour on its physicochemical,
nutritional and in vitro digestibility. Foods, 9(2), 152-163.
Chapter aim:
Previous chapters investigated the technological and nutritional aspects of the
green banana flour (GBF) samples to obtain background information the potential
of GBF obtained from different processing regimes. In order to investigate the
nutritional aspects of including the GBF in bread, this chapter is designed to
determine the effect of both heat treatment used in drying and fortification levels of
whole green banana flour on physicochemical and nutritional properties as well as
the digestibility of the fortified bread.

CHAPTER 7: NUTRITIONAL PROPERTIES OF GREEN BANANA FORTIFIED BREAD
153
7.1. Introduction
Banana is one of the most favourite fruits in the world and contains a high nutritional
value. Banana contains higher flavonoids, dietary fibre (DF) and resistant starch (RS)
at its early stage of ripeness than when it is ripe (Vu et al., 2018). One of the important
features of RS is not being digested within 2 h in the intestine and it enhances the
growth of probiotics in the large intestine, which may have a positive indirect effect
on colorectal cancer (Nascimento-Souza et al., 2018, Malcomson et al., 2015, Hu et al.,
2015, Birt et al., 2013, Sánchez-Pardo et al., 2007). A whole green banana, including the
peel, is considered a rich source of RS (41-59%) (Perera et al., 2010). Considering the
undesirable taste of green banana, green banana flour (GBF) production has been
recommended to add value to banana crops in terms of reducing waste and loss
during production chain, improve sustainability and capture some of its nutritional
benefits that gets lost with ripening (Hernández-Aguirre et al., 2019).
It has been reported that the type of heating process used in GBF preparation has an
impact on both physicochemical and technological properties of the flour (chapter 5).
For instance, the RS content in banana flour can vary from 20% to 59% based on
banana species, stage of ripeness and most importantly, the drying treatment applied
(Tribess et al., 2009). In order to deliver additional health benefits using this functional
ingredient, a mixture of banana flour and other alternative flours has been proposed
in mostly starch-based food products, such as pasta (Agama-Acevedo et al., 2009),
bread (Gomes et al., 2016, Kurhade et al., 2016, Eshak, 2016), cake (Borges et al., 2010,

CHAPTER 7: NUTRITIONAL PROPERTIES OF GREEN BANANA FORTIFIED BREAD
154
Segundo et al., 2017a, Oliveira de Souza et al., 2018) and gluten-free products (Türker
et al., 2016, Radoi et al., 2015, Seguchi et al., 2014). Amongst those, bread has gained
more attention in this regard. It is extensively consumed all over the world as it
contributes to the intake of proteins, lipid and carbohydrates especially in developing
countries. Thus, there is a good opportunity to use banana flour to fortify bread and
increase its nutritional value (De Souza Viana et al., 2018).
Even though a wide range of bread types are available in the market, white bread is
still the first choice of many consumers due to its sensory attributes. However, white
bread is considered a high glycaemic index food due to its high percentage of rapidly
digested starch (RDS), which is positively correlated with in vivo predicted glycaemic
index (pGI) after 20 min of digestion (Martínez et al., 2018).
On the other hand, slow digestible starch (SDS) is accounted for starch digested
between 20 to 120 min according to the definition provided by Englyst et al. (1992). As
recent studies have shown notably higher content of SDS and RS compared to RDS in
green banana pulp flour, utilization of it in bread has gained attention as of late
(Menezes et al., 2011, Nasrin et al., 2015, Eshak, 2016, Agama-Acevedo et al., 2016).
The slow rate of SDS and RS digestion can improve the insulin response which
controls metabolic syndrome and contributes to the risk reduction of obesity, diabetes
and cardio-related diseases (Agama-Acevedo et al., 2019).
Although there are few reports on the effect of replacement of wheat flour with banana
flour on bread’s technological properties (Aurore et al., 2009), in vitro studies
investigating the digestibility of starch in this model is scarce. Furthermore, the

CHAPTER 7: NUTRITIONAL PROPERTIES OF GREEN BANANA FORTIFIED BREAD
155
available information on the effect of GBF preparation method on bread properties is
scarce. In order to maximize the yield of green banana flour and taking advantage of
its high nutritional value, the use of both peel and pulp is proposed (Qamar and
Shaikh, 2018). The objectives of this study were to determine the effect of both heat
treatment used in drying and fortification levels of the GBF on physicochemical and
nutritional properties as well as the digestibility of a bread fortified with different GBF
levels.
7.2. Materials and Methods
Green banana (Musa Cavendish spp AAA), wheat flour and all the ingredients required
for Breadmaking (baking powder, commercial dry yeast, butter, salt, milk and honey)
were purchased from a local store (Dunedin, New Zealand).
7.2.1. Green banana flour preparation
The flour samples (air-oven-dried and freeze-dried green banana flours) were
produced as described in chapter 4, section 4.2.1.
7.2.2. Breadmaking process
Bread samples were prepared as described in chapter 6, section 6.2.3.

CHAPTER 7: NUTRITIONAL PROPERTIES OF GREEN BANANA FORTIFIED BREAD
156
7.2.3. Bread chemical composition
All the physicochemical properties of bread samples were determined using the
approved AOAC 2000 standard methods (AOAC, 2005). The moisture content was
assayed using a vacuum oven dryer (Thermoline, Australian Marketing Group,
Marrickville, NSW, Australia) at 60 °C for 16 h. The water activity was measured by an
Aqualab device (Decagon Devices, Washington DC, USA) at 25 °C (Method 925.40;
AOAC 2000). Ash content was measured by using a furnace according to the method
923.03 (AOAC 2000). Total fat content was measured using the Soxhlet extraction
method (Method 920.39; AOAC 2000). Protein content was conducted using Kjeldahl
method to determine total nitrogen and a conversion factor of 6.25 was used (Method
923.03; AOAC 2000). The carbohydrate and energy values were calculated via the
following formula:
Carbohydrate (g) = 100 − [moisture content (g) + ash (g) + protein (g) + lipid (g)] (7.1)
Energy value (Kcal/100 g) = 4 × protein (%) + 9 × lipid (%) + 4 × carbohydrate (%) (7.2)
The total dietary fibre (TDF) was determined using Megazyme kit (K-TDF; Megazyme
International, Wicklow, Ireland) based on AOAC Method 991.43 and AACC Method
32-07.01. Briefly, one gram of ground dried bread was added to 50 mL phosphate buffer
(pH 6, 0.5 M) and then subjected to heat stable α-amylase at 95-100 °C initial heating in
a water bath for 30 min. In order to hydrolyse the protein, the solution was cooled to
room temperature and pH was adjusted to 7.5. Afterwards, an incubation step at 60 °C
for 30 min with Bacillus licheniformis protease was followed by amyloglucosidase
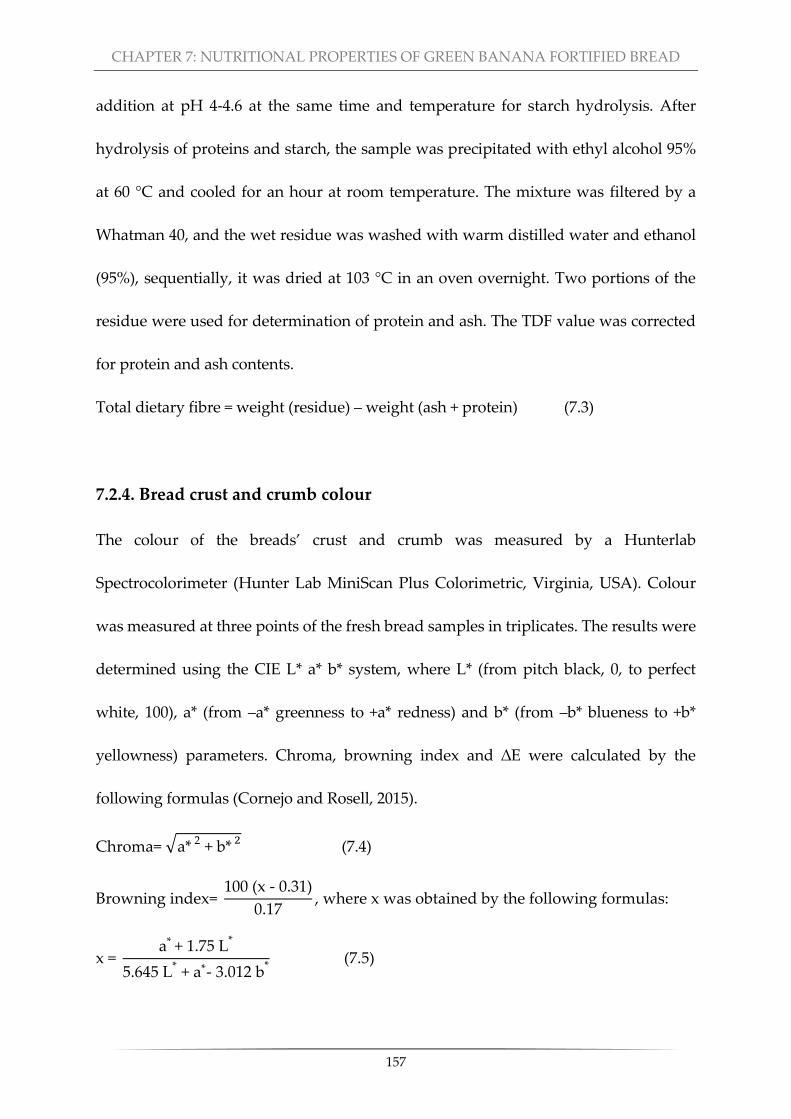
CHAPTER 7: NUTRITIONAL PROPERTIES OF GREEN BANANA FORTIFIED BREAD
157
addition at pH 4-4.6 at the same time and temperature for starch hydrolysis. After
hydrolysis of proteins and starch, the sample was precipitated with ethyl alcohol 95%
at 60 °C and cooled for an hour at room temperature. The mixture was filtered by a
Whatman 40, and the wet residue was washed with warm distilled water and ethanol
(95%), sequentially, it was dried at 103 °C in an oven overnight. Two portions of the
residue were used for determination of protein and ash. The TDF value was corrected
for protein and ash contents.
Total dietary fibre = weight (residue) – weight (ash + protein) (7.3)
7.2.4. Bread crust and crumb colour
The colour of the breads’ crust and crumb was measured by a Hunterlab
Spectrocolorimeter (Hunter Lab MiniScan Plus Colorimetric, Virginia, USA). Colour
was measured at three points of the fresh bread samples in triplicates. The results were
determined using the CIE L* a* b* system, where L* (from pitch black, 0, to perfect
white, 100), a* (from –a* greenness to +a* redness) and b* (from –b* blueness to +b*
yellowness) parameters. Chroma, browning index and ∆E were calculated by the
following formulas (Cornejo and Rosell, 2015).
Chroma= √a* 2 + b* 2 (7.4)
Browning index= 100 (x - 0.31)
0.17, where x was obtained by the following formulas:
x = a* + 1.75 L*
5.645 L* + a*- 3.012 b* (7.5)
CHAPTER 7: NUTRITIONAL PROPERTIES OF GREEN BANANA FORTIFIED BREAD
158
∆E = √(∆L*)2+ (∆a*)2+ (∆b*)2 (7.6)
7.2.5. Mineral profile
The analysis of minerals was performed by an Agilent 7500ce quadrupole ICP-MS mass
spectrometer connected to a CEM MARS6 programmable 2450 MHz microwave
reaction system with a selectable operator output of 0–1600 W (CEM Corporation,
Matthews, USA). Approximately two mg of dried bred sample were weighed in a
MARSX press (CEM Corporation, Matthews, USA) digestion tube with the addition of
10 mL of concentrated quartz distilled nitric acid (HNO3) subsequently. After digestion
of the samples in microwave, they were spiked offline with a cocktail of seven reference
elements to compensate for any drift or possible matrix effects. Serial dilutions of a SPEX
CertiPrep multi-element were prepared for calibration standards (Spex Certiprep,
Metuchen, USA). The ICP-MS was tuned according to the manufacturer's
recommendations for minimizing the instrumental interferences. The accuracy of the
measurement was established with a corn meal reference material, supplied High
Purity Standard North Charleston, USA, following the method of Anyasi et al. (2018).
7.2.6. In vitro starch digestibility of bread samples
Based on its digestion, starch has been classified into rapidly digestible starch (RDS,
amount of released glucose after 20 min); slowly digestible starch (SDS, amount of
released glucose between 20 and 120 min) and RS (starch remaining undigested after

CHAPTER 7: NUTRITIONAL PROPERTIES OF GREEN BANANA FORTIFIED BREAD
159
180 min) (Gujral et al., 2018). All starch determinations were analysed using Megazyme
kits (Megazyme International, Wicklow, Ireland) based on the official method AOAC
modified by Sharma et al. (2017). The released glucose was measured at 0, 20 and 120
min of small intestine digestion. Firstly, bread crumb samples (100 mg, d.b) were
subjected to 0.2 ml artificial porcine salivary amylase solution (one g amylase in 10 ml
of buffer KCl–HCl solution in 0.02 M phosphate buffer at pH 1.5). Then incubation of
the samples was carried out at 37 °C for 30 min after the addition of pepsin (1 mg/ml)
enzyme prepared in 0.02 M HCl (40 mg α- amylase A-3176; Sigma, Madrid, Spain) to
mimic the gastric phase Lastly, in order to mimic the intestinal phase, samples were
incubated at 37 °C for 2 h in presence of pancreatin (5 mL of 2.5% solution in 0.1 M
sodium maleate buffer pH=6), bile salts at a concentration of 10 mM, and CaCl2 at a
concentration of 0.3 mM at pH 7) and amyloglucosidase (0.1 ml) prepared in 0.2 M
sodium acetate buffer (pH=6) were added and the released glucose was measured using
glucose oxidase-peroxidase reagent (GOPOD) (Goñi et al., 1997): (7.7)
Digestible starch (g/ 100 g d.b) = 0.9 × glucose concentration after 2h digestion of small intestine × volume of digesta (ml)
Sample weight (g) × starch (g)
The total starch was measured according to the method of Moongngarm et al. (2014)
which was based on AOAC Method 996.11 using the Megazyme total starch assay kit
(Megazyme International Ireland Ltd, Bray, Ireland). A 100 mg of dried samples were
mixed with 10 ml of sodium acetate buffer, pH 5 and 0.1 ml of thermostable α-amylase
(280 U) at 100 °C for 15 min in sealed tubes with intermittently vortex. With the addition
of 0.1 ml amyloglucosidase (AMG) 3300 U/ml after cooling the solution to 50 °C, the

CHAPTER 7: NUTRITIONAL PROPERTIES OF GREEN BANANA FORTIFIED BREAD
160
suspension was centrifugated at 3000 g at room temperature for 5 min. The total starch
content om the solution was measured as the released glucose with glucose
oxidase/peroxidase reagent assay and was determined at 510 nm. The different
digestible starches were calculated according to the equations provided by Liu et al.
(2019):
RDS (%) = (G20 – FG) × 0.9 ×100 (7.8)
SDS (%) = (G120 – G20) × 0.9 ×100 (7.9)
where G20 and G120 are the amount of glucose released after 20 min and 120 min,
respectively, and FG is the amount of free glucose in the undigested samples.
For resistant starch determination, bread crumb samples (100 mg, d.b) was incubated
with 3.5 ml maleate buffer (50 mM, pH 6) and the mixture of pancreatic α-amylase (40
KU/g) and AMG (17 KU/g) at 37 °C for 4 h. After stopping the starch hydrolysis reaction
by adding ethanol and centrifugation at 1500 g for 5 min at room temperature, the pellet
was dissolved in KOH 4 M by vigorous stirring in an ice-water bath over a magnetic
stirrer. Digested pellet and supernatant were incubated separately with AMG (14 ml of
3300 U/ml amyloglucosidase on soluble starch) at 50 °C for 20 min in a water bath.
Finally, the absorbance of the released glucose was measured by GOPOD assay at 510
nm against the reagent blank. Resistant starch content was calculated as mg of glucose
× 0.9 based on the method described by Menezes et al. (2011).

CHAPTER 7: NUTRITIONAL PROPERTIES OF GREEN BANANA FORTIFIED BREAD
161
7.2.7. Statistical analysis
Data were analysed using one-way ANOVA to determine the effects of GBF type, the
addition percentage on the measured parameters. The statistical analysis was
performed by Minitab® program version 16. Post-hoc Tukey test was used to determine
the differences amongst the means at 95% of confidence level. The results are the means
of three replicate experiments and expressed as mean ± standard deviation.
7.3. Results and discussion
The results shown in Table 7.1 present the proximate chemical composition of bread
samples. The fortification above 10% caused a significant increase in water activity
(aw) of the bread samples compared to the control ones. The MC and TDF content
increased (P-value < 0.05) with increasing GBF fortification level in bread. This
suggests the presence of more hydrophilic chains that resulted in higher water
absorption capacity (Ho et al., 2013). These findings were in agreement with the results
obtained by Eshak (2016) and Gomes et al. (2016) who used hydrocolloids as water
binders. Protein and fat contents decreased with the increased addition of GBF
regardless of its preparation method (P-value < 0.05). This was expected since the
protein content was lower in the GBF (approximately 36% less in F30 and O30)
compared to the WF (chapter 6). This is in agreement with the findings reported by
Gomes et al. (2016) who utilised GBF and Loong and Wong (2018) who used green
banana pulp flour (GBPF).

CHAPTER 7: NUTRITIONAL PROPERTIES OF GREEN BANANA FORTIFIED BREAD
162
High ash content in banana bread samples indicates the presence of high mineral
contents. The higher ash content in GBF compared to WF improved the ash level in
fortified-bread samples and resulted in almost 2.5 times increase in the ash content for
F30 and O30 samples (Table 7.1).
Table 7.1. Chemical composition properties of bread samples (g/ 100 g)
Sam
ple
MC Ash Fat Protein Carbohydrate TDF EV (Kcal/100 g)
WB 31.2±0.09 g 1.21±0.01 f 3.32±0.01 a 5.50±0.02 a 58.6 ±0.03a 3.31±0.03 g 286.82±0.42 a
F10 34.2±0.05 e 2.21±0.01 e 3.60±0.02 cd 5.21±0.01 b 54.7±0.03 c 3.60±0.03 e 272.40±0.32 c
F20 35.81±0.05 c 2.62±0.01 c 3.81±0.01 b 4.73±0.05 d 53.01±0.01 d 3.82±0.01 c 265.10±0.10 e
F30 38.52±0.40 a 3.01±0.01 a 4.01±0.05 a 4.26±0.01 f 50.1±0.04 e 4.13±0.04 a 253.91±0.51 g
O10 33.50±0.14 f 2.21±0.01 e 3.60±0.01 d 5.16±0.03 c 55.6±0.03 b 3.61±0.03 f 274.95±0.10 b
O20 35.10±0.02 d 2.63±0.01 d 3.73±0.02 c 4.64±0.01 e 53.9±0.02 c 3.72±0.02 d 267.62±0.40 d
O30 36.53±0.39 b 2.94±0.01 b 3.86±0.02 b 4.01±0.01 g 52.6±0.01 d 3.90±0.03 b 261.10±0.40 f
Mean ± standard deviation values of triplicate determinations. Values with different letters in the same
column are significantly different (P-value < 0.05). TDF, total dietary fibre. EV, energy value. WB, wheat
bread, F10, F20 and F30, fortification levels of freeze-dried banana flour. O10, O20 and O30, fortification
levels of air oven-dried banana flour.
From the results obtained from TDF and EV, it can be seen that higher content of TDF
gave rise to lesser EV of the final product. Bread samples made with FDF displayed
higher TDF compared to ones made with ODF in all fortification levels (P-value <
0.05). This result may be explained by the fact that fibres were preserved more during
freeze-drying compared to air oven-drying. Also, surface furrowing and cracking
CHAPTER 7: NUTRITIONAL PROPERTIES OF GREEN BANANA FORTIFIED BREAD
163
stems from heat treatment can be the cause of lower TDF in all ODF and eventually in
the bread (Chang and Morris, 1990). The findings of chemical composition indicated
that GBF-fortified bread samples had superior nutritional value than the control bread
with a decrease in protein content.
7.3.2. Bread colour analysis
The control sample showed the L* value of 66.6 and 72.5 which indicates the whiteness
of crust and crumb bread slice, respectively (Table 7.2). In relation to browning index
of bread crust, a significant increasing trend was observed in oven-dried fortified
bread samples compared to freeze-dried ones. Although this trend was similar in
breads fortified with FDF as well, breads with freeze-dried flour showed lower
browning index, yellowness and redness (Table 7.2). Previous findings have shown
that chlorophyll was more preserved in FDF compared to ODF (Oliveira et al., 2015,
Yang et al., 2009). Crust colour saturation exhibited a declining trend with more GBF
content levels in bread. Martínez-Castaño et al. (2019) also reported the brownest
colour in crust for gluten free bread made with partial banana flour substitution (15%).
Control samples exhibited higher crumb yellowness and a more intense crust
browning compared to all FDF-fortified bread samples (P-value < 0.05). The presence
of different xanthophylls and phenolic compounds might have been associated with
the yellowish-brownish colour of banana bread samples (Kurhade et al., 2016). Also,
Mohamed et al. (2010) mentioned that for fruits like banana that contains high levels
of polyphenol oxidase, enzymatic oxidation of mono-phenolic compounds and releasing

CHAPTER 7: NUTRITIONAL PROPERTIES OF GREEN BANANA FORTIFIED BREAD
164
Table 7.2. Colour parameters of bread crust and crumb
Crust colour
Sample L* a* b* Browning index Chroma ∆E
WB 66.6±0.4 a 13.1±0.1 b 37.7±0.5 a 94.5±0.9 d 41.1±0.1 a -
F10 37.0±0.1 e 7.6±0.1 c 19.8±0.4 d 69.9±0.4 f 21.2±0.2 d 35±0.9 c
F20 34.4±0.6 f 6.2±0.2 cd 16.8±0.2 e 78.3±0.1 ef 17.9±0.1 e 38.9±0.9 b
F30 33.2±0.1 g 5.6±0.4 d 14.7±0.3 f 89.2±1.0 de 15.8±0.1 e 41.2±0.8 a
O10 52.3±0.1 b 15.7±0.2 a 37.9±0.3 a 110.4±1.1 c 41.0±0.2 a 14.6±1.1 f
O20 47.7±0.9 c 15.7±0.2 a 34.7±0.1 b 138.2±3.0 b 38.1±0.2 b 23.4±0.9 d
O30 43.5±0.6 d 11.4±0.2 b 29.8±0.1 c 162.1±1.1 a 31.9±0.1 c 20.5±1.1 e
Crumb colour
WB 72.5±0.1 a 4.2±0.1 f 28.6±0.3 a 53.1±0.9 f 29.2±0.1 a -
F10 43.1±0.1 b 3.7±0.1 g 15.2±0.1 g 49.1±0.4 f 15.7±0.1 g 32.2±0.1 d
F20 41.1±0.1 d 5.2±0.1 e 18.5±0.1 f 67.4±0.1 e 19.2±0.1 f 33.0±0.1 cd
F30 38.6±1.6 f 7.1±0.2 c 20.1±0.1 e 85.1±0.1 d 21.4±0.1 e 35.1±0.2 b
O10 42.5±0.4 c 5.6±0.1 d 25.4±0.9 d 95.9±5.1 c 25.9±1.0 d 30.8±0.3 e
O20 39.4±1.6 e 7.7±0.2 b 27.3±0.1 b 122.1±1.8 b 28.3±0.1 b 33.3±0.1 c
O30 36.6±0.1 g 8.2±0.2 a 26.6±0.6 c 133.5±9.5 a 27.9±0.6 c 36.2±0.3 a
Mean ± standard deviation values of triplicate determinations. Values with different letters in the same
column for the same bread part (crumb or crust) are significantly different (P-value < 0.05). WB, wheat
bread, F10, F20 and F30, fortification levels of freeze-dried banana flour. O10, O20 and O30, fortification
levels of air oven-dried banana flour.

CHAPTER 7: NUTRITIONAL PROPERTIES OF GREEN BANANA FORTIFIED BREAD
165
o-diphenols and o-quinones is likely to happen. The colour differences between
control and fortified samples increased (P-value < 0.05) with increasing GBF in bread.
The higher carbohydrate content in GBF also may have resulted in Maillard reaction
especially in OD-breadcrumb samples similar to what was found in literature (Tribess
et al., 2009, Loong and Wong, 2018, Agama-Acevedo et al., 2012).
7.3.3. Mineral profile
Minerals play a key role in enzyme systems and facilitate the functioning of certain
organs (Wang et al., 2012). Some minerals are essential in larger amounts (macro
minerals) and other in smaller (micro minerals) quantities. As more GBF was
incorporated into the bread, the mineral content was increased, especially the macro
elements (Fig 7.1). All the 20% and 30% bread samples contained significantly higher
K, P, Na, Ca and Mg compared to control (P-value > 0.05). Considering recommended
daily intake of minerals (Fayet-Moore et al., 2018), each 100 g of F30 sample can
provide 18.6% K, 18.16% P, 4.91% Na, 8.07% Ca and 14.74% Mg of the recommended
daily intake. Similarly, all oven-dried fortified bread samples showed a higher
percentage of Fe, Zn and Cu (O20 and O30) compared to control bread (Fig 7.1b).
This significant increase (P-value < 0.05) could be due to the high ash content of GBF
(Anyasi et al., 2018). These findings can be beneficial in particular for the products
which are made for celiac disease (Hernández-Aguirre et al., 2019). The same
observation was reported in bread made with fermented banana flour (Adebayo-
Oyetoro et al., 2016).

CHAPTER 7: NUTRITIONAL PROPERTIES OF GREEN BANANA FORTIFIED BREAD
166
Figure 7.1. a) Macro minerals in bread samples b) Microminerals in bread samples
Bars showing mean and standard deviation for each of the individual minerals that have different
letters are significantly different (P-value < 0.05).
0
100
200
300
400
500
600
700
800
WB F10 F20 F30 O10 O20 O30
Mac
orm
iner
als
(mg
/ 10
0 g
)
Bread samples
(a)
K P Na Ca Mg
0
1
1
2
2
3
3
4
4
5
WB F10 F20 F30 O10 O20 O30
Mic
rorm
iner
als
(mg
/ 10
0 g
)
Bread samples
(b)
Fe Zn Mn Rb Cu
p pq q rs r rs s
a
b
c
d
e
e
f
g h hi ij j ij
g
k l m
m o
n n
t u v vw w x y
h g ef fg efg e d
nop p mno op no mn m
c
c
c
c
c
b
a
l k j k jk j i
t st r
rs
rs q
q

CHAPTER 7: NUTRITIONAL PROPERTIES OF GREEN BANANA FORTIFIED BREAD
167
Correspondingly, Ho et al. (2015) reported an increment in Na, K, Mg and Ca contents
in bread made with 10% peeled yellow banana pseudo-steam flour in presence of
sodium carboxy methyl cellulose. Apart from these studies, there are no similar works
in this area to compare the results. These results indicated that addition of GBF,
especially that produced by freeze-drying, could be utilized as a supplement to
improve the essential minerals in bread products.
7.3.4. Starch digestibility analysis
It is well known that food products with high level of RS and SDS do not cause
postprandial hyperglycaemic and hyperinsulinemic spikes associated with the RDS
(Aparicio-Saguilan et al., 2013). It can be seen from Table 7.3 that control bread
displayed low RS content (2.17%), which agrees with results from studies on wheat
breads (Roman et al., 2019, Ho et al., 2015). As the amount of GBF increased in bread,
the RS percentage increased significantly, with F30 samples (8.55%) exhibiting the
highest percentage (P-value < 0.05). Lower RS content in O10, O20 and O30 samples
was possibly due to the lesser amount in the ODF compared to FDF (Fig 4.2).
Consumption of 100 g of F30 and O30 bread can supplement the recommended daily
intake of 6-12g/d of RS for prebiotic effects (Peres, 2014, Moongngarm et al., 2014).
Retrogradation process which occurs after cooling the bread samples and the
formation of the amylo-lipid bonds creates RS3 and RS5, respectively (Martínez-
Castaño et al., 2019).

CHAPTER 7: NUTRITIONAL PROPERTIES OF GREEN BANANA FORTIFIED BREAD
168
The presence of more DF in banana bread samples, specially above 20% level, resulted
in a change in viscosity, which acts as a physical barrier on the starch surface and
prevents it from being subjected by digestive enzymes (Liu et al., 2018). As can be seen
in Table 7.3, the amount of SDS increased significantly in O30 and F30 compared to
other treatments. It has been mentioned that RS has a “sponge role” and is capable of
absorbing water in the big intestine and helps in mixing with the foodstuff in a tangled
network form, and thereby can slow down the rate of digestion (Juarez-Garcia et al.,
2006).
Table 7.3. Starch digestibility of bread samples (g/ 100 g d.b)
Sample RS (%) * TS (%) * SDS (%) ** RDS (%) ** DS (%) **
WB 2.17±0.06 g 71.60±0.64 a 10.21±0.06 c 59.20±0.53 a 71.61±0.65 ab
F10 3.20±0.06 e 72.34±1.02 a 13.91±0.15 bc 55.20±0.86 b 72.70±1.02 a
F20 4.33±0.01 c 77.14±1.01 a 15.60±0.21 b 57.10±0.79 ab 69.10±1.01 abc
F30 8.55±0.06 a 76.43±1.44 a 17.80±0.50 a 50.11±0.92 d 67.90±0.06 bc
O10 2.61±0.02 f 68.10±1.71 b 10.42±0.22 c 54.90±1.48 bc 70.63±0.02 ab
O20 3.52±0.4 d 74.12±2.67 a 13.42±0.45 bc 57.11±2.22 ab 65.44±0.04 c
O30 5.92±0.03 b 75.70±1.73 ab 15.90±0.55 b 53.90±1.16 c 69.80±0.03 ab
Mean ± standard deviation values of triplicate determinations. Values with different letters in the same
column are significantly different (P-value < 0.05). RS, resistant starch, SDS, slow digestible starch, RDS,
rapidly digestible starch, DS, digestible starch, TS, total starch, WB, wheat bread, F10, F20 and F30,
substitution levels of freeze-dried banana flour with wheat flour. O10, O20 and O30, substitution levels
of air oven-dried banana flour with wheat flour.
* Measured chemically according to the AOAC method 2002.02.
** Measured indirectly by calculation through total starch analysis by formulas 7.8 and 7.9.

CHAPTER 7: NUTRITIONAL PROPERTIES OF GREEN BANANA FORTIFIED BREAD
169
Roman et al. (2019) reported the remaining RS content cannot be beyond 2% w/w in
bread made with 20% banana starch. Likewise, De Souza Viana et al. (2018) reported
that 25% of substitution of WF with GBPF led to an increase in RS content up to 3.2%
in the final bread. In a study on a gluten-added bread made with 60% GBPF, a low RS
(6.7%) was reported, which was explained by the low level of RS in the prepared flour
(17%) (Juarez-Garcia et al., 2006). In a recent work conducted by Agama-Acevedo et
al. (2019), bread crust was analysed for the remaining RS and it was found that no
more 2.5% was available. Similarly, Hernández-Aguirre et al. (2019) reported 3.5% of
RS in a gluten free bread but without reporting the RS content of GBPF. It can be
concluded that the use of whole banana for making flour could have an effect on
remaining RS content in the final bread. More studies are needed to compare the bread
fortified with different green banana flour sources: peel only, pulp only and the whole
fruit.
7.4. Conclusion
It can be concluded that the use of whole green banana flour (GBF) up to 30% in
substitution for wheat flour significantly increased total dietary fibre, ash and mineral
content in bread. Additionally, bread samples made with air-over dried GBF exhibited
darker colour in both crumb and crust, with similar yellowness compared to the
control bread sample in 10% level of fortification. The marked increase in
macronutrients, P, K, Mg, Na and Ca in particular, with a slight increase in micro

CHAPTER 7: NUTRITIONAL PROPERTIES OF GREEN BANANA FORTIFIED BREAD
170
minerals in all GBF bread samples, specially above 10% fortification, showed an
improvement in nutritional value of all fortified bread samples. The addition of 20%
and 30% of GBF in the bread resulted in a product with the pronounced percentage of
RS and SDS. As FDF-bread samples showed lower RDS and DS compared to OD-
bread samples, it might be concluded that the 30% GBF addition can be considered as
a functional bread containing prebiotic dosage. Current findings are also expected to
help the sustainability of food systems by the use of whole green banana and prevent
losses during maturation, transportation and storage. Also, the study on the
synergistic effect of hydrocolloids with resistant starch can be studied on bread
formulation.
7.5. Limitations
The human-involved digestion test (in vivo) was not carried out. Also, total phenolic
content and antioxidant activity, which required 2,2-bipyridyl, 2,2-diphenyl-1-
picrylhydrazyl radical scavenging activity (DPPH), was not performed due to the time
limitation and limited access to the lab due to the COVID-19 pandemic condition.
These additional tests can show the nutritional impact of GBF fortification more.

Chapter 8

CHAPTER 8: VOLATILE FINGERPRINTING OF BANANA FORTIFIED BREAD
172
A chemometrics approach to investigate the volatile compounds of
wheat bread fortified with whole green banana flour
This chapter is currently under review as an original article up to this date.
Chapter aim:
The aim of the present study was to compare the volatile profile of the crust and crumb
of bread made with different fortification levels of green banana flour produced using
different drying methods (oven-drying and freeze-drying). The volatile compounds
were studied using an untargeted headspace solid-phase micro-extraction GC-MS
fingerprinting procedure. Advanced chemometrics and feature selection were applied
to classify the samples, explore the trends and identify discriminant volatile
compounds.

CHAPTER 8: VOLATILE FINGERPRINTING OF BANANA FORTIFIED BREAD
173
8.1. Introduction
Banana is one of the most consumed fruits in the world and it is also the second largest
fruit crop after citrus contributing to 16% of the global fruit production (Ji and
Srzednicki, 2015). Musa Cavendish, a triploid cultivar, is the most appreciated and
cultivated one. The popularity of banana relates to its nutritional value, aroma and
flavour (Berhal et al., 2017). Also, based on the level of maturation, banana’s
nutritional value varies. While the yellow fruit (ripeness stage 6-7) are high in
digestible fibres, ash and carbohydrates, green banana has high antioxidant activity,
phenolic compounds, dietary fibres (DF) and resistant starch (RS) (Agama-Acevedo
et al., 2016, Kurhade et al., 2016). The banana peel represents about 30-40% of its total
weight, resulting in a large amount of undesired waste generated from the
consumption and processing of this crop. The peels are highly perishable, seasonal
and often disposed of improperly, and when it is green, the peel contains almost 50%
DF (Sharma et al., 2016). Since the limitation on the consumption of green banana
relates to the undesirable taste and aroma, several studies have shown the possibility
of producing green banana flour (from pulp, peel or both) as a functional ingredient
by the use of different drying techniques which were reviewed in chapter 2. Thermal
air-oven drying, and non-thermal freeze-drying methods have been introduced in
chapter 4 to obtain flour from the whole fruit, i.e., peel and pulp together (GBF), yet,
they have different impacts on the properties of the final fortified product as discussed
in Chapters 6 and 7.

CHAPTER 8: VOLATILE FINGERPRINTING OF BANANA FORTIFIED BREAD
174
As a basic foodstuff, bread is considered one of the most consumed food products
around the world, and it is also considered a major source of protein and carbohydrate
in developing countries. Thus, bread can be a valuable carrier for delivering additional
health benefits by fortifying it with functional ingredients (Gomes et al., 2016), such
as inulin (Rubel et al., 2015), probiotics (Pepe et al., 2013), oligosaccharides (Damen et
al., 2012), fruit flour (Rolim et al., 2011), rye bran (Karppinen, 2003) and organic salts
(Salinas et al., 2016). Studies on the effect of different yellow and green banana flour
fortification on technological and nutritional properties on bread have been reviewed
in Chapter 2. However, no comprehensive reports were available on the changes in
bread aroma profile when green banana flour is incorporated.
Bread aroma is one of the most imperative sensory characteristics which is perceived
just before consumption. It is produced during mixing, fermentation, kneading,
baking and is also affected by additional ingredients (Pico et al., 2016). The aroma of
bread is composed of volatile compounds including aldehydes, alcohols, esters,
ethers, carboxylic acids, ketones, furans, sulphur compounds, hydrocarbons,
pyrrolines and pyrazines. Onishi et al. (2011) and Pico et al. (2018a) reported that
Maillard reaction, caramelisation and other thermally-induced degradation (i.e. lipid
oxidation) are responsible for the formation of bread volatile aroma compounds.
Several studies on the representative volatile compounds of bread have already been
presented (Pico et al., 2018a, Jourdren et al., 2017, Jensen et al., 2011, Hussein and
Ibrahim, 2019, Birch et al., 2014, Rannou et al., 2008, Pico et al., 2018b). On the other

CHAPTER 8: VOLATILE FINGERPRINTING OF BANANA FORTIFIED BREAD
175
side, studies on green banana volatile profile is divided into two categories: fruit and
dried fruit/ flour, mainly made from pulp.
Qamar and Shaikh (2018) reported that the majority of volatile aroma compounds in
green banana fruit derived from terpenes and alcohols, which aligns with the results
achieved by Zhu et al. (2018) and Aurore et al. (2009). These compounds could vary
in terms of species, fruit ripeness, climate conditions, postharvest storage and
biosynthetic pathways (Zhu et al., 2018, Saha et al., 2018, Berhal et al., 2017). In terms
of banana flour (BF), it was reported that the type of drying method had an impact on
volatile compounds (Wang et al., 2007). They found that freeze-drying (FD) and
vacuum belt drying of banana resulted in the highest retention of volatiles in banana
powder, mainly esters and alcohols. The banana fruity odour was reported to be
related to butanoic acid 3-methylbutyl ester and 3-methylbutanoic acid 3-methylbutyl
ester. These findings were supported by Mui et al. (2002) who associated the
effectiveness of FD with microregion entrapment theory. During the first stage of FD
process, freezing, rapid crystallization of water molecules forms the microregions
which contains concentrated carbohydrates and banana aroma compounds. In the
next stage, when sublimation occurs and entrapped moisture content level decreases
in the microregions, association of carbohydrates molecules begins via hydrogen
bonds and keeps the volatiles inside of the texture.
On the other hand, regarding thermal drying, banana chips dried in a combination of
air-oven drying at 70 °C and vacuum microwave drying, resulted in a better retention
of volatile compounds compared to microwave only (Mui et al., 2002). In another

CHAPTER 8: VOLATILE FINGERPRINTING OF BANANA FORTIFIED BREAD
176
study conducted on the effect of drying process on banana’s volatile compounds,
Boudhrioua et al. (2003) reported a total loss of aroma content of banana fruit during
high temperature air drying (80 °C for 24 h) and could be followed by an increase in
elemicine levels. The profile changes in BF volatiles (prepared from a fruit of stage five
ripeness) during low temperature air-oven drying showed that ester and aldehyde
levels decreased, followed by an increase towards the end of drying, whilst high
molecular weight compounds such as eugenol and elemicine were not affected
significantly (Saha et al., 2018). Considering the literature, there is still limited
understanding into the effect of different drying method of whole green banana fruit
on volatile compounds of the produced flour and the retention of them in bread.
This study is the first time to systematically integrate untargeted GC-MS-based
chemical fingerprinting, which is a non-discriminatory detection of as many volatile
compounds as possible present in the bread samples headspace fraction, and modern
chemometrics data analysis to evaluate volatiles in bread fortified with different levels
and types of the GBF. The aim of the present study was to compare the volatile profile
of bread crust and crumb with different fortification levels of GBF, to investigate the
impact of processing used for GBF preparation and to identify discriminant
compounds that can segregate the treated samples.

CHAPTER 8: VOLATILE FINGERPRINTING OF BANANA FORTIFIED BREAD
177
8.2. Materials and Methods
Green banana (Musa Cavendish spp AAA), wheat flour, and the ingredients essential
for Breadmaking (activated dried yeast, butter, milk, baking powder, salt and honey)
were purchased from a local food supplier (Dunedin, New Zealand).
8.2.1. Green banana flour preparation
The flour samples (air-oven-dried and freeze-dried green banana flours) were
produced as described in chapter 4, section 4.2.1.
8.2.2. Breadmaking process
Bread samples were prepared as described in chapter 6, section 6.2.3.
8.2.3. Sample preparation
After slicing each freshly baked bread loaf with a kitchen electric bread automatic
cutter, bread crust was removed from the crumb by precisely cutting one centimetre
from the edge of the bread slice with a stainless-steel knife, followed by gently cutting
into minimum 2×2×2 mm pieces (Fig 8.1). Then, one gram (±0.050 g) of each bread
sample (crumb and crust, separately) was weighed in a 20 mL vial and tightly sealed
with magnetic PTFE/ silicone septum and crimp caps (Fig 8.3).

CHAPTER 8: VOLATILE FINGERPRINTING OF BANANA FORTIFIED BREAD
178
8.2.4. Headspace SPME GC-MS analysis
Volatile compounds were extracted by the headspace-solid phase micro-extraction
(HS-SPME) method according to Arcena et al. (2020b) and examined using the Agilent
6890N GC system connected to an Agilent MSD 5975 VL. This technique permits the
extraction of the volatile compounds from the solid and liquid matrices in a simple
and time effective way. Equilibration, extraction and desorption of volatile
compounds were automated using an autosampler (Santa Clara, California, United
States). With the aim of detecting an extensive range of volatile compounds, the HS-
SPME-GC-MS method of analysis was optimised in advance for an untargeted
fingerprinting (Arcena et al., 2020a). The optimisation included SPME fibre
incubation, extraction conditions, GC-MS analysis parameters and sample weight. An
SPME fibre with a balanced polarity [50/30 μm divinylbenzene/ carboxen/
polydimethylsiloxane (DVB/CAR/PDMS)] was selected because of its capacity to
capture a wide range of volatile compounds from varied chemical classes (Kebede et
al., 2013). The SPME fibres were conditioned and regenerated according to the
manufacturer’s guidelines. The vials were equilibrated at 50 °C for 5 min with
agitation prior to headspace SPME extraction at 50 °C for 30 min. After volatile
extraction, the SPME fibre was inserted into the GC injection port, where the volatile
compounds were thermally desorbed at 230 °C for 5 min in a splitless mode. Using
helium as the carrier gas, the volatile compounds were separated through the ZB-Wax
column (60 m × 0.32 mm inner diameter × 0.5 µm film thickness, Phenomenex,

CHAPTER 8: VOLATILE FINGERPRINTING OF BANANA FORTIFIED BREAD
179
California, United States) at a constant 1 ml/ min flow rate. This column is excellent
for separating polar complex mixtures and is widely used for profiling and
fingerprinting purposes (Kebede et al., 2013, Arcena et al., 2020b, Arcena et al., 2020a).
The GC-MS oven temperature was initially held at 50 °C for 5 min, followed by
heating at 5 °C/min to reach 230 °C, followed by a further temperature ramp at 10 °C
/min to reach the final 240 °C, and kept for another 5 min before cooling to 50 °C.
Electron ionisation (EI mode) at 70 eV was used to obtain the mass spectra with a
scanning range of 35 to 400 m/z (mass to charge ratio). The MS ion source and MS
quadrupole temperature was set at 230 °C and 150 °C, respectively. Also, the GBF
samples were analysed according to the same method (Fig. 8.4). Six independents
SPME extraction were performed for each sample.
(a) (c) (b)
Figure 8.1. Examples of the typical breadcrumbs for GC-MS analysis
(a) Breadcrumb made from oven-dried green banana flour
(b) Breadcrumb made from white wheat flour with 0% fortification (control)
(c) Breadcrumb made from freeze-dried green banana flour

CHAPTER 8: VOLATILE FINGERPRINTING OF BANANA FORTIFIED BREAD
180
Figure 8.2. Gas chromatography mass spectroscopy setup
(a)
(b)
Figure 8.3. Examples of the typical breadcrust in vials for GC-MS analysis
(a) Breadcrust made from freeze-dried green banana flour at 30% level of fortification
(b) Breadcrust made from wheat bread crust with 0% fortification (control)

CHAPTER 8: VOLATILE FINGERPRINTING OF BANANA FORTIFIED BREAD
181
8.2.5. Data pre-processing of total ion chromatograms
The data pre-processing was performed according to the method reported by Kebede
et al. (2013) and Arcena et al. (2020a). The GC-MS total ion chromatograms, usually
loaded with co-eluting peaks, were analysed using an automated mass spectral
deconvolution and identification system (AMDIS, version 2.72, 2014) to deconvolute
and extract pure component spectra. This aids in acquiring a more accurate
identification of the peaks using NIST spectral library (NIST14, version 2.2, National
Institute of Standards and Technology). The deconvoluted spectra was analysed by
Mass Profiler Professional (MPP) software (Version 14.9.1, 2017, Agilent
Technologies) to filter the irregular, non-reproducible, non-related sample or very
small peaks and align the similar peaks, producing the data table containing each
peaks quantity level expressed as peak areas.
8.2.6. Chemometrics
The data matrix was auto scaled, which includes mean-centring and standardization.
Then, in order to evaluate the data for outliers and groupings, the data was explored
using unsupervised principal component analysis (PCA). The multivariate data was
further analysed by a regression-based supervised classification technique, partial
least squares-discriminant analysis (PLS-DA) to increase insight into the volatile
differences and identify discriminant compounds. In this analysis, the optimum
number of latent variables (LV) was selected with a criterion to explain the maximum

CHAPTER 8: VOLATILE FINGERPRINTING OF BANANA FORTIFIED BREAD
182
variance/information in the data while maintaining the room mean squared error to a
minimum (via cross-validation). In the present work, a venetian blind cross validation
with 6 data splits was used. This helps limits the risk of over fitting. Based on the PLS-
DA model. Bi-plots were constructed based on the PLS-DA model to examine the
differences amongst different samples.
Finally, to identify metabolites significantly affected by GBF addition (potential
discriminant volatiles), variable identification coefficients (VID) were calculated. The
VID values are the corresponding correlation coefficients between X-variables
(attributes) and predicted Y-variable (samples). Attributes with an absolute VID value
of at least 0.650 were selected as a potential discriminating compound. These
compounds were then identified and linked to associated reaction pathways. A bar
plot was constructed for representative discriminant compound to clearly
demonstrate the differences and Tukey’s HSD test at p < 0.05 confidence level were
used to evaluate the statistical differences between samples. In the current study, three
criteria were employed to increase the power of volatile identification: (a) matching
retention time and spectra with the control bread sample; (b) comparison of the
experimental retention index (RI) with RI obtained from literature; (c) match and
reverse match with the NIST library of 90% certainty.

CHAPTER 8: VOLATILE FINGERPRINTING OF BANANA FORTIFIED BREAD
183
8.3. Result and discussion
The volatile fractions of wheat flour (WF), freeze-dried green banana flour (FDF) and
oven-dried green banana flour (ODF) were analysed using the HS-SPME-GC-MS
fingerprinting method. The total ion chromatograms (TIC) of flour samples are shown
in Fig 8.4, 8.5, 8.6. From visual comparison, one can see that the FDF and ODF samples
seem to have a comparable volatile profile, whereas WF had a clearly different profile.
The chromatogram of the WF had a total of 45 compounds mainly composed of
alcohols (e.g., 1-hexanol, 1-nonanol, 1-pentanol and ethanol), alkane (e.g., 2,2-
dimethyl-undecane, 2-methyl-octane, and heptadecane) and aldehydes (e.g., hexanal,
and pentanal) (Fig 8.4).
The headspace fraction of the FDF samples was composed of ketones (e.g., 2-
butanone, and 2-heptanone), alcohols (e.g., 2-methyl-1-undecanol, 1-octen-3-ol, 1-
pentanol and 2-penten-1-ol), aldehydes (e.g., butanal, pentanal, 2-methyl-2-pentenal,
hexanal, heptanal and 2-hexenal), Strecker aldehydes (e.g., benzaldehyde, and 2-
methyl-butanal) and alkanes (e.g., heptane, octane, dodecane and hexane) (Fig 8.5).
Comparable volatile compounds were detected in the ODF samples including
aldehydes (e.g., butanal, propanal, 2-hexenal, heptanal, pentanal and nonanal),
Strecker aldehydes (e.g. 2-methyl-butanal, and 3-methyl-butanal), ketones (e.g. 2-
butanone and 2-heptanone), alcohols (e.g. 1-pentanol, 1-butanol and 1-octen-3-ol),
furans (e.g. 3-methyl-furan, 2-ethyl-furan and 2-pentyl-furan) and alkanes (e.g.
nonane, dodecane, hexadecane, pentadecane, heptane, undecane and 3-methyl-

CHAPTER 8: VOLATILE FINGERPRINTING OF BANANA FORTIFIED BREAD
184
undecane) (Fig 8.6). Next, the volatile profile of the bread samples was characterized
using the GC-MS-based chemical fingerprinting method. A total number of 102
volatile compounds from various chemical classes were identified in each bread
sample, ranging from alcohol and ester in crumb to furan, ketone and aldehyde in
crust. Visually, the volatile profiles appear to be different among the bread samples.
Multivariate data analysis was used to investigate the impact of three factors: (i) bread
part (crumb and crust); (ii) GBF fortification level (10%, 20% and 30%) and (iii) drying
method used for GBF preparation (freeze drying and oven drying) on the volatile
compounds. As discussed in sections 8.2.5 and 8.2.6, the raw chromatograms were
pre-processed with AMDIS and MPP before applying the multivariate data analysis
(PCA and PLSDA).
5.00 10.0
0
15.0
0
20.00 25.0
0
30.00 35.00 40.00
200000
400000
600000
800000
1000000
1200000
1400000
1600000
Retention time (min)
Ab
un
dan
ce
Figure 8.4. Total ion chromatogram of wheat flour
Hex
anal
γ
-3-c
aren
e
1-h
exan
ol
1-
hep
tan
ol
3-n
on
en-1
-ol

CHAPTER 8: VOLATILE FINGERPRINTING OF BANANA FORTIFIED BREAD
185
5.00 10.00 15.00 20.00 25.00 30.00 35.00 40.00
2000000
4000000
6000000
8000000
1e+07
1.2e+07
1.4e+07
1.6e+07
1.8e+07
Retention time (min)
Ab
un
dan
ce
Figure 8.6. Total ion chromatogram of oven-dried green banana flour
3-m
eth
yl-
bu
tan
al
Hex
anal
2-m
eth
yl-
bu
tan
al
5.00 10.00 15.00 20.0 25.00 30.00 35.00 40.0
1000000
2000000
3000000
4000000
5000000
6000000
7000000
8000000
9000000
1e+07
Retention time (min)
Ab
un
dan
ce
Figure 8.5. Total ion chromatogram of freeze-dried green banana flour
2-b
uta
no
ne
H
exan
al
ben
zald
ehy
de
2-m
eth
yl-
bu
tan
al

CHAPTER 8: VOLATILE FINGERPRINTING OF BANANA FORTIFIED BREAD
186
Multivariate data analysis was used to investigate the impact of three factors on the
volatile compounds:(i) bread part (crumb and crust); (ii) GBF fortification level (10%,
20% and 30%) and (iii) drying method used for GBF preparation (freeze drying and
oven drying). The results of these analyses will be discussed step by step, starting with
the analysis of the overall effect of all factors (section 8.3.1) to determine the most
dominating trend. Then, the impact of each factor will be discussed, and discriminant
volatile compounds will be selected (section 8.3.2, 8.3.3 and 8.3.4).
8.3.1. Investigating the overall trend in all 14 bread samples: Including the
effects of bread part, GBF fortification and drying method
A PCA model was performed including all 14 bread samples, to identify the most
dominant one out of the three factors: bread type, GBF fortification and drying
method. PCA is an unsupervised explorative technique where only the volatile
information (X-variable) is taken into account, without considering the sample
information into the model. Figure 8.9 shows a PCA bi-plot constructed using the first
two principal components (PCs). PCA is a powerful explorative technique useful to
see any trends and patterns in the data and detect potential outliers. A clear difference
between breadcrumb and crust volatile profiles was observed (Fig 8.9). This variation
is represented by PC1. Next to the bread part (crust and crumb), the bi-plot also shows
the partial effect of fortification level represented by the second PC. From the plot, the
effect of the drying methods on the volatile fraction seems limited.

CHAPTER 8: VOLATILE FINGERPRINTING OF BANANA FORTIFIED BREAD
187
5 .0 0 1 0 .0 0 1 5 .0 0 2 0 .0 0 2 5 .0 0 3 0 .0 0 3 5 .0 0 4 0 .0 0
1 00 0 0 00
2 00 0 0 00
3 00 0 0 00
4 00 0 0 00
5 00 0 0 00
6 00 0 0 00
7 00 0 0 00
8 00 0 0 00
9 00 0 0 00
T ime -->
A b un d a nc e
T IC: 1 91 1 1 2_ O 1 0 t5 03 .D \ d a ta .ms
5 . 0 0 1 0 . 0 0 1 5 . 0 0 2 0 . 0 0 2 5 . 0 0 3 0 . 0 0 3 5 . 0 0 4 0 . 0 0
1 0 0 0 0 0 0
2 0 0 0 0 0 0
3 0 0 0 0 0 0
4 0 0 0 0 0 0
5 0 0 0 0 0 0
6 0 0 0 0 0 0
7 0 0 0 0 0 0
8 0 0 0 0 0 0
9 0 0 0 0 0 0
1 e + 0 7
1 . 1 e + 0 7
1 . 2 e + 0 7
1 . 3 e + 0 7
T im e -->
A b u n d a n c e
T I C : 1 9 1 1 1 2 _ O 1 0 b 5 0 3 . D \ d a t a . m s
5.00 10.00 15.00 20.00 25.00 30.00 35.00 40.00
1000000
2000000
3000000
4000000
5000000
6000000
7000000
8000000
9000000
1e+07
1.1e+07
1.2e+07
1.3e+07
1.4e+07
Time-->
Abundance
TIC: 191113_O201b1.D\ data.ms
5 .0 0 1 0 .0 0 1 5 .0 0 2 0 .0 0 2 5 .0 0 3 0 .0 0 3 5 .0 0 4 0 .0 0
1 0 0 0 0 0 0
2 0 0 0 0 0 0
3 0 0 0 0 0 0
4 0 0 0 0 0 0
5 0 0 0 0 0 0
6 0 0 0 0 0 0
7 0 0 0 0 0 0
8 0 0 0 0 0 0
9 0 0 0 0 0 0
1 e + 0 7
T im e -->
A b u n d a n c e
T IC : 1 9 1 1 1 3 _ O 2 0 1 t2 .D \ d a ta .m s
5 .0 0 1 0 . 0 0 1 5 . 0 0 2 0 . 0 0 2 5 . 0 0 3 0 . 0 0 3 5 . 0 0 4 0 . 0 0
1 0 0 0 0 0 0
2 0 0 0 0 0 0
3 0 0 0 0 0 0
4 0 0 0 0 0 0
5 0 0 0 0 0 0
6 0 0 0 0 0 0
7 0 0 0 0 0 0
8 0 0 0 0 0 0
9 0 0 0 0 0 0
1 e + 0 7
1 .1 e + 0 7
T im e -->
A b u n d a n c e
T IC : 1 9 1 1 1 3 _ O 3 0 1 b 2 . D \ d a ta .m s
5.00 10.00 15.00 20.00 25.00 30.00 35.00 40.00
1000000
2000000
3000000
4000000
5000000
6000000
7000000
8000000
T ime-->
Abundanc e
T IC: 191113_O301t2.D \ data.ms
(a1) (a2)
(b1) (b2)
(c1) (c2)
Retention time (min)
Retention time (min)
Retention time (min)
Retention time (min)
Retention time (min)
Retention time (min)
Ab
un
dan
ce
Ab
un
dan
ce
Ab
un
dan
ce
Ab
un
dan
ce
Ab
un
dan
ce
Ab
un
dan
ce
Figure 8.7. Total ion chromatograms of (a1) O10B, (a2) O10T, (b1) O20B, (b2) O20T, (c1)
O30B, (c2) O30T obtained with the headspace GC-MS fingerprinting method
O10B, O20B, O30B, oven-dried-fortified breadcrumb at 10%, 20%, 30% substitution with wheat flour
O10T, O20T, O30T, oven-dried-fortified breadcrust at 10%, 20%, 30% substitution with wheat flour.

CHAPTER 8: VOLATILE FINGERPRINTING OF BANANA FORTIFIED BREAD
188
Retention time (min)
Retention time (min)
Retention time (min)
Retention time (min)
Retention time (min)
Retention time (min)
Retention time (min)
Retention time (min)
Retention time (min)
Retention time (min)
(a1) (a2)
(b1)
(c1) (c2)
(b2)
(d1) (d2)
5 .0 0 1 0 .0 0 1 5 .0 0 2 0 .0 0 2 5 .0 0 3 0 .0 0 3 5 .0 0 4 0 .0 0
1 0 0 0 0 0 0
2 0 0 0 0 0 0
3 0 0 0 0 0 0
4 0 0 0 0 0 0
5 0 0 0 0 0 0
6 0 0 0 0 0 0
7 0 0 0 0 0 0
8 0 0 0 0 0 0
9 0 0 0 0 0 0
1 e + 0 7
T im e -->
A b u n d a n c e
T IC : 1 9 1 1 1 4 _ F 1 0 1 b 2 .D \ d a ta .m s
5.00 10.00 15.00 20.00 25.00 30.00 35.00 40.00
1000000
2000000
3000000
4000000
5000000
6000000
7000000
8000000
9000000
T ime-->
Abundanc e
T IC: 191114_F101t2.D \ data.ms
5.00 10.00 15.00 20.00 25.00 30.00 35.00 40.00
1000000
2000000
3000000
4000000
5000000
6000000
7000000
8000000
9000000
T ime-->
Abundanc e
T IC: 191115_F201b1.D \ da ta .ms
5 .0 0 1 0 .0 0 1 5 .0 0 2 0 .0 0 2 5 .0 0 3 0 .0 0 3 5 .0 0 4 0 .0 0
5 0 0 0 0 0
1 0 0 0 0 0 0
1 5 0 0 0 0 0
2 0 0 0 0 0 0
2 5 0 0 0 0 0
3 0 0 0 0 0 0
3 5 0 0 0 0 0
4 0 0 0 0 0 0
4 5 0 0 0 0 0
5 0 0 0 0 0 0
5 5 0 0 0 0 0
T im e -->
A b u n d a n c e
T IC : 1 9 1 1 1 5 _ F 2 0 1 t2 .D \ d a ta .m s
5 .0 0 1 0 .0 0 1 5 .0 0 2 0 .0 0 2 5 .0 0 3 0 .0 0 3 5 .0 0 4 0 .0 0
1 0 0 0 0 0 0
2 0 0 0 0 0 0
3 0 0 0 0 0 0
4 0 0 0 0 0 0
5 0 0 0 0 0 0
6 0 0 0 0 0 0
7 0 0 0 0 0 0
8 0 0 0 0 0 0
9 0 0 0 0 0 0
1 e + 0 7
1 .1 e + 0 7
T im e -->
A b u n d a n c e
T IC : 1 9 1 1 1 4 _ F 3 0 1 b 1 .D \ d a ta .m s
5 . 0 0 1 0 . 0 0 1 5 . 0 0 2 0 . 0 0 2 5 . 0 0 3 0 . 0 0 3 5 . 0 0 4 0 . 0 0
5 0 0 0 0 0
1 0 0 0 0 0 0
1 5 0 0 0 0 0
2 0 0 0 0 0 0
2 5 0 0 0 0 0
3 0 0 0 0 0 0
3 5 0 0 0 0 0
4 0 0 0 0 0 0
4 5 0 0 0 0 0
5 0 0 0 0 0 0
5 5 0 0 0 0 0
6 0 0 0 0 0 0
6 5 0 0 0 0 0
T im e -->
A b u n d a n c e
T I C : 1 9 1 1 1 4 _ F 3 0 1 t 2 . D \ d a t a . m s
5 .0 0 1 0 .0 0 1 5 .0 0 2 0 .0 0 2 5 .0 0 3 0 .0 0 3 5 .0 0 4 0 .0 0
1 0 0 0 0 0 0
2 0 0 0 0 0 0
3 0 0 0 0 0 0
4 0 0 0 0 0 0
5 0 0 0 0 0 0
6 0 0 0 0 0 0
7 0 0 0 0 0 0
8 0 0 0 0 0 0
9 0 0 0 0 0 0
1 e + 0 7
1 .1 e + 0 7
T im e -->
A b u n d a n c e
T IC : 1 9 1 1 2 0 _ W B b 2 .D \ d a ta .m s
5 . 0 0 1 0 . 0 0 1 5 . 0 0 2 0 . 0 0 2 5 . 0 0 3 0 . 0 0 3 5 . 0 0 4 0 . 0 0
1 0 0 0 0 0 0
2 0 0 0 0 0 0
3 0 0 0 0 0 0
4 0 0 0 0 0 0
5 0 0 0 0 0 0
6 0 0 0 0 0 0
7 0 0 0 0 0 0
8 0 0 0 0 0 0
9 0 0 0 0 0 0
1 e + 0 7
1 . 1 e + 0 7
1 . 2 e + 0 7
T im e -->
A b u n d a n c e
T I C : 1 9 1 1 2 0 _ W B t 2 . D \ d a t a . m s
Ab
un
dan
ce
Ab
un
dan
ce
Ab
un
dan
ce
Ab
un
dan
ce
Ab
un
dan
ce
Ab
un
dan
ce
Ab
un
dan
ce
Ab
un
dan
ce
Figure 8.8. Total ion chromatograms of (a1) F10B, (a2) F10T, (b1) F20B, (b2) F20T, (c1) F30B,
(c2) F30T, (d1) WB, (d2) WT obtained with the headspace GC-MS fingerprinting method
F10B, F20B, F30B, freeze-dried-fortified bread crumb at 10%, 20%, 30% substitution with wheat flour
F10T, F20T, F30T, freeze-dried-fortified bread crumb at 10%, 20%, 30% substitution with wheat flour
WB, wheat bread crumb, WT, wheat bread crust.

CHAPTER 8: VOLATILE FINGERPRINTING OF BANANA FORTIFIED BREAD
189
In summary, the PCA analysis displayed that the most dominant factor in the data is
bread part (crust and crumb), mainly explained by the PC1, followed by effect of
fortification and lastly the effect of banana drying process. In the next sections, each
of these factors will be further investigated using a supervised PLS-DA method
starting from the comparison between crumb and crust at each fortification level.
Bread crumb samples
Bread crust samples
Figure 8.9. The Principal component biplot of bread samples, including the bread
type, level of fortification and drying methods
F10B, F20B, F30B, freeze-dried-fortified breadcrumb at 10%, 20% and 30% substitution with wheat flour
F10T, F20T, F30T, freeze-dried-fortified breadcrust at 10%, 20% and 30% substitution with wheat flour
O10B, O20B, O30B, oven -dried-fortified breadcrumb at 10%, 20% and 30% substitution with wheat flour
O10T, O20T, O30T, oven-dried-fortified breadcrust at 10%, 20% and 30% substitution with wheat flour
WB, wheat breadcrumb, WT, wheat breadcrust

CHAPTER 8: VOLATILE FINGERPRINTING OF BANANA FORTIFIED BREAD
190
8.3.2. Comparison of the volatile profiles between breadcrumb and
breadcrust at 10%, 20% and 30% fortification levels
A PLS-DA model was performed to compare the volatile profiles of crumb and crust
samples at three fortification levels (10, 20 and 30%). For the model, the volatiles were
considered as X-variables and crust and crumb as categorical Y-variables. Three latent
variables (LVs) were selected as optimum based on venetian blind cross validation.
As can be seen on the PLS-DA bi-plots, there is a clear difference between crumb and
crust volatile profiles. This pattern appears to be comparable for all fortification levels
(Fig 8.10 a, b, c). The volatiles discriminating the crust from the crumb samples, at each
fortification level, were selected using the VID feature selection method (> 0.650 VID
coefficient value) (Table 8.1, 8.2 and 8.3).
The VID feature selection method revealed the abundance of alcohol and ester in
breadcrumb and aldehyde and furan compounds in the crust. Specifically, the volatile
markers selected with higher amounts in the crumb were from alcohol (1-hexanol, 1-
heptanol, phenylethyl alcohol) and ester (ethyl ester butanoic acid, octanoic acid)
chemical classes, while furanic compounds (furfural, 2-furanmethanol), ketones (2-
undecanone, 2-tridecanone) and Strecker aldehydes (2-methyl-butanal, 3-methyl-
butanal) were the key ones detected in higher amounts in the crust.
It is worth mentioning that volatile compounds commonly associated with the
Maillard reactions, Strecker degradation and high temperature processing, such as
furfural, 2-methyl-butanal and 3-methyl-butanal, are detected at higher amounts in

CHAPTER 8: VOLATILE FINGERPRINTING OF BANANA FORTIFIED BREAD
191
the crust samples (Rahaie et al., 2012). This makes sense as the thermal load during
baking is much higher on the crust compared to the crumb. These compounds are
commonly reported as indicators of high temperature processing in several processed
food products (Drakula et al., 2019). Furfural is also a well-known indicator of non-
enzymatic browning of a wide range of food products (Gibson et al., 2018). It is
noteworthy that some of these compounds (2-methyl-butanal, 3-methyl-butanal) were
already detected in ODF samples. Therefore, it can be hypothesized that these
compounds are formed due to high temperature processing, starting from the drying
of the GBF, and then increasingly formed, mainly in the crust, during Breadmaking.
On the other hand, the breadcrumb showed high contents of esters, ketones and
alcohols. Esters have a fruity note (Yan et al., 2019, Pico et al., 2017, Salim Ur and
Awan, 2011), whilst ketones are associated with the floral note of the ripening aroma
(Qamar and Shaikh, 2018, Aurore et al., 2009) and alcohols are known for woody or
musty flavour (Saha et al., 2018, Pico et al., 2017).
In contrast, the bread crust had high amounts of furans and Strecker aldehydes which
can be linked to the high thermal load during baking. The breadcrumb, on the other
hand, seemed to have higher contents of ester and alcohol compounds. According to
Rohleder et al. (2019), the presence of alcohol and ester chemical classes might be more
related to grassy green and fatty note. On the other side, aldehyde and furan
compounds were mainly associated with Maillard reactions and were noted more in
bread crust samples and have been reported to create caramel-like note (Boeswetter
et al., 2019). However, comparing volatile compounds in Table 8.1, 8.2 and 8.3 shows

CHAPTER 8: VOLATILE FINGERPRINTING OF BANANA FORTIFIED BREAD
192
that with increasing GBF fortification level in bread, different aromatic compounds
were observed (showing a possible effect of fortification). Hence, in the next section,
the effect of fortification level on producing volatiles in relation to the bread part will
be discussed.

CHAPTER 8: VOLATILE FINGERPRINTING OF BANANA FORTIFIED BREAD
193
(a) (b)
(c)
Figure 8.10. The partial least squares-discriminant analysis biplot of bread samples,
showing a clear difference between the volatile profiles of the bread crust and crust
samples at each fortification levels.
(a) 10% fortified-bread crumb samples (10B) vs. 10% fortified-bread crust (10T)
(b) 20% fortified-bread crumb samples (20B) vs. 20% fortified-bread crust (20T)
(c) 30% fortified-bread crumb samples (30B) vs. 30% fortified-bread crust (30T).

CHAPTER 8: VOLATILE FINGERPRINTING OF BANANA FORTIFIED BREAD
194
Table 8.1. Volatile compounds selected based on variable identification (VID)
discriminating the bread crust and crust samples for 10% fortification level. The
calculated retention index (RI) and one retrieved from literature (LRI) for volatile
compounds are listed. The chemical class for each compound is also listed.
VID ID Chemical class CRI LRI
10B
0.877 1-octyn-3-ol alcohol 1297 1300
0.788 nonanal aldehyde 1391 1391
0.725 toluene alkane 1040 1042
-0.653 2-undecanone ketone 1595 1598
-0.658 2-propoxy-ethanol alcohol 1293 1326
-0.679 1-(2-furanyl)-ethanone furan 1505 1499
-0.707 hexanoic acid, ethyl ester straight-chain saturated fatty acid 1227 1233
-0.738 2-octenal aldehyde 1431 1429
-0.912 1-hexanol alcohol 1340 1355
10T
0.912 2,4-decadienal medium-chain aldehyde 1815 1797
0.870 2-tridecanone ketone 1806 1809
0.738 3-hydroxy-2-butanone methyl ketone 1282 1284
0.716 furfural aldehyde 1462 1461
0.706 hexanoic acid, ethyl ester straight chain saturated fatty acid 1227 1233
0.679 3-methyl-1-butanol alcohol 1195 1209
0.673 1-hydroxy-2-propanone ketone 1297 1303
0.658 heptyl ester ester 1441 1453
-0.725 maltol pyrone 1967.2 1969
-0.859 1-hexanol alcohol 1339.7 1355
-0.877 2-propanol alcohol 1513.5 NA
10B, 10% fortified-breadcrumb samples, 10T, 10% fortified-bread crust.

CHAPTER 8: VOLATILE FINGERPRINTING OF BANANA FORTIFIED BREAD
195
Table 8.2. Volatile compounds selected based on variable identification (VID)
discriminating the bread crust and crust samples for 20% fortification level. The
calculated retention index (RI) and one retrieved from literature (LRI) for volatile
compounds are listed. The chemical class for each compound is also listed.
20B, 20% fortified-breadcrumb samples, 20T, 20% fortified-bread crust.
VID ID Chemical class CRI LRI
20B
0.807 ethyl ester butanoic acid ester 1033 1035
0.805 2,4-decadienal aldehyde 1815 1797
0.805 phenylethyl alcohol alcohol 1911 1906
0.786 1-hexanol alcohol 1340 1355
0.677 heptyl ester ester 1441 1453
0.668 2-propanol alcohol 1518 1570
-0.665 3-methyl-butanal Strecker aldehyde 917 918
-0.755 2-undecanone ketone 1595 1598
-0.800 2-methyl-propanoic acid carboxylic acid 1566 1570
-0.830 carbon sulphide sulphur compound 732 135
-0.850 2-tridecanone ketone 1806 1809
-0.851 3-furanmethanol furan 1646 1670
-0.879 furfural aldehyde 1462 1461
20T
0.879 furfural aldehyde 1462 14.61
0.851 2-furanmethanol furan 1646 1660
0.850 2-tridecanone ketone 1806 1809
0.826 maltol pyrone 1967 1973
0.800 2-methyl-propanoic acid carboxylic acid 1566 1570
0.789 1-(2-furanyl)-ethanone furan 1505 1499
0.755 2-undecanone ketone 1595 1598
0.665 3-methyl-butanal Strecker aldehyde 917 918
0.656 pentanal aldehyde 978 979
-0.677 1-heptanol alcohol 1441 1453
-0.786 1-hexanol alcohol 1340 1355
-0.805 phenylethyl alcohol alcohol 1911 1906
-0.807 ethyl ester butanoic acid ester 1033 1035

CHAPTER 8: VOLATILE FINGERPRINTING OF BANANA FORTIFIED BREAD
196
Table 8.3. Volatile compounds selected based on variable identification (VID)
discriminating the bread crust and crust samples for 30% fortification level. The
calculated retention index (RI) and one retrieved from literature (LRI) for volatile
compounds are listed. The chemical class for each compound is also listed.
VID ID Chemical class CRI LRI
30B
0.828 phenylethyl alcohol alcohol 1911 1906
0.739 ethyl ester butanoic
acid ester 1033 1035
0.686 toluene alkane 1040 1042
0.657 octanoic acid, ethyl
ester ester 1428 1435
-0.652 3-methyl-butanal Strecker aldehyde 917 918
-0.652 2-methyl-butanal Strecker aldehyde 914 914
-0.711 ethanone ketone 1967 1973
-0.728 pentanal aldehyde 978 979
-0.741 furfural aldehyde 1462 1461
-0.742 2-methyl-propanoic
acid carboxylic acid 1566 1570
-0.785 1-(2-furanyl)-ethanone furan 1505 1499
-0.824 2-undecanone ketone 1595 1598
-0.902 2-tridecanone ketone 1806 1809
-0.939 2-furanmethanol furan 1646 1660
30T
0.939 2-furanmethanol furan 1646 1660
0.902 2-tridecanone ketone 1805 1809
0.824 2-undecanone ketone 1595 1598
0.785 1-(2-furanyl)-ethanone furan 1504 1499
0.742 2-methyl-propanoic
acid carboxylic acid 1566 1570
0.741 furfural aldehyde 1462 1461
0.728 pentanal aldehyde 978 979
0.725 maltol pyrone 1967 1969
0.652 2-methyl-butanal aldehyde 914 914
0.652 3-methyl-butanal aldehyde 917 918
-0.657 octanoic acid, ethyl
ester ester 1427 1435
-0.739 ethyl ester butanoic
acid ester 1033 1035
-0.828 phenylethyl alcohol alcohol 1910 1906 30B, 30% fortified-breadcrumb samples, 30T, 30% fortified-bread crust.

CHAPTER 8: VOLATILE FINGERPRINTING OF BANANA FORTIFIED BREAD
197
8.3.3. Effect of fortification level on the volatile fraction of crumb and crust
in each GBF type
PLS-DA model was used to investigate the effect of GBF fortification level on the
volatile fraction of the crumb and crust (in each processing level). For the supervised
PLS-DA model, the volatile compounds were used as X-variables and the fortification
level as categorical Y-variable. As can be seen from the bi-plots (Fig 8.11), the volatile
fraction of samples at different fortification levels was different. This shows that the
volatile fraction of the bread samples is modified by the different levels of GBF
fortification. It can be seen from Table 8.4 that increasing the fortification level in bread
resulted in a higher number of discriminant volatile compounds. This trend was the
same for both FDF and ODF-fortified bread samples.
For the freeze-dried breadcrumb (FB), furans (i.e., 2-pentenyl furan), aldehydes and
alcohols (i.e. (E)-2-nonenal, 3-methyl-1-butanol) and ester (hexanoic acid ethyl ester)
volatile compounds were detected at higher amounts in 30% compared to 10 and 20%
level of fortification.
The breadcrumb samples made from oven-dried GBF (OB), had high levels of 3-
methyl-butanal, benzaldehyde and furfural in 30% level of fortification. Similarly, for
the oven-dried bread crust (OT), furans, Strecker aldehydes and pyrrolines were
detected in O30T samples (Table 8.4). The formation of furfural and benzaldehyde in
O30T samples indicates the effect of high thermal load in making these compounds
(Göğüş et al., 2009). Benzaldehyde was observed in 30%, both crumb and crust, but

CHAPTER 8: VOLATILE FINGERPRINTING OF BANANA FORTIFIED BREAD
198
only in OD-fortified bread samples. This Strecker aldehyde has been considered as a
burnt sugar descriptor (Bugaud and Alter, 2016).
In summary, the level of fortification has a clear effect on the volatile compounds in
both breadcrumb and crust. Specifically, furans and Strecker aldehyde volatiles were
significantly increased at the highest level of fortification. Based on literature, the
formation of these compounds is associated with thermally induced reactions, such as
the Maillard reaction, Strecker degradation and lipid oxidation (Majcher et al., 2019,
Pico et al., 2018a, Birch et al., 2014, Kebede et al., 2013). It can be hypothesised that the
level of the fortification is influencing the concentration of precursors, such as
carbohydrates and amino acids, which is available for the Maillard and lipid oxidative
reactions. This hypothesis can be confirmed by monitoring and quantifying the
number of sugars, amino acids and other precursors in the GBF and bread samples
(this is outside the scope of this work).

CHAPTER 8: VOLATILE FINGERPRINTING OF BANANA FORTIFIED BREAD
199
(a) (b)
(c) (d)
Figure 8.11. The partial least squares-discriminant analysis biplot of bread samples. There is
clear effect of the level of GBF fortification on the final bread volatile profile.
(a) freeze-dried fortified breadcrumb samples, (b) freeze-dried fortified breadcrust samples, (c) oven-dried fortified
breadcrumb samples (d), (c) oven-dried fortified breadcrust samples
F10B, F20B, F30B, freeze-dried-fortified breadcrumb at 10%, 20%, 30% substitution with wheat flour
F10T, F20T, F30T, freeze-dried-fortified breadcrust at 10%, 20%, 30% substitution with wheat flour
O10B, O20B, O30B, oven-dried-fortified breadcrumb at 10%, 20% and 30% substitution with wheat flour.
O10T, O20T, O30T, oven-dried-fortified breadcrust at 10%, 20% and 30% substitution with wheat flour.
WB, wheat bread crumb, WT, wheat bread crust

CHAPTER 8: VOLATILE FINGERPRINTING OF BANANA FORTIFIED BREAD
200
Table 8.4. Discriminant volatiles based on highest absolute variable identification
coefficients (VID) coefficients for breadcrumb and crust samples through PLS-DA
analysis. The calculated retention index (RI) and one retrieved from literature
(LRI) for volatile compounds are listed.
VID ID Chemical class CRI LRI
FDB
F10B
0.877 5-butyldihydro-2(3h)-furanone alkane hydrocarbon 2044 1910
0.720 2-propoxy-ethanol alcohol 1293 1326
-0.656 1-hepten-3-one alkane 1297 1196
-0.674 toluene alkane 1040 1042
-0.674 3-hydroxy-2-butanone methyl ketone 1282 1284
-0.747 1-hexanol alcohol 1340 1355
F30B
0.828 2-pentenyl furan furan 1297 NA
0.779 3-hydroxy-2-butanone methyl ketone 1284 1284
0.765 hexanoic acid ethyl ester ester 1846 1846
0.731 1-hexanol alcohol 1340 1355
0.726 ethyl ester butanoic acid ester 1033 1035
0.722 3-methyl-1-butanol alcohol 1195 1209
0.716 (E)-2-nonenal medium-chain aldehydes 1537 1534
-0.689 2-propoxy-ethanol alcohol 1293 1293
FDT
F30T 0.702 2-undecanone ketone 1595 1598
ODB
O10B 0.766 2-propanol alcohol 1514 1532
O30B 0.886 3-methyl-butanal Strecker aldehyde 917 918
0.879 benzaldehyde Strecker aldehyde 1531 1520

CHAPTER 8: VOLATILE FINGERPRINTING OF BANANA FORTIFIED BREAD
201
0.865 furfural aldehyde 1462 1461
ODT
O10T 0.664 2-methyl-propanoic acid short chain fatty acid 1566 1570
-0.701 benzaldehyde Strecker aldehyde 1531 1520
O20T 0.812 ethanol alcohol 926 932
O30T
0.872 furfural aldehyde 1462 1461
0.809 benzaldehyde Strecker aldehyde 1531 1520
0.794 1-(2-furanyl)-ethanone furan 1505 1499
0.783 2-acetyl-1-pyrroline pyrrolines 1967 1973
FDB, freeze-dried fortified breadcrumb, FDT, freeze-dried fortified breadcrust.
ODB, oven-dried fortified breadcrumb, ODT, oven-dried fortified breadcrust.
F10B, F30B, freeze-dried-fortified breadcrumb at 10% and 30% substitution with wheat flour.
F10T, freeze-dried-fortified breadcrust at 10% substitution with wheat flour.
O10B, O30B, oven-dried-fortified breadcrumb at 10% and 30% substitution with wheat flour.
O10T, O20T, O30T, oven-dried-fortified breadcrust at 10%, 20% and 30% substitution with
wheat flour.
8.3.4. Effect of drying method on volatile fraction of GBF-fortified bread
PLS-DA model was applied to compare the two drying methods. From the bi-plots in
Fig. 8.12, there is less clear separation amongst samples regards to the drying method
used for GBF preparation. This is in line with the observation found in the PCA bi-
plot. In line with that, the feature selection managed to determine only few
discriminant volatile compounds.

CHAPTER 8: VOLATILE FINGERPRINTING OF BANANA FORTIFIED BREAD
202
The FD-processing resulted in (E)-2-nonenal and 1-hexanol formation in breadcrumb
and pentanal, 2-heptenal, 2-undecanone and furfural in bread crust. There were no
notable volatiles for OT samples, while a range of compounds were observed for FT
samples. This might be due to the decomposition of browning reactions’ precursors
during ODF preparation and higher surface temperature in crust during the baking
process.
(a) (b)
Figure 8.12. A PLS-DA bi-plot showing the difference in volatile profile of breadcrumb
and breadcrust based on the drying process
(a) FB, fortified-bread crumb samples with freeze-dried green banana flour, OB, fortified-bread
crumb samples with oven-dried green banana flour, WB, wheat bread crumb. (b) FT, fortified-bread
crust samples with freeze-dried green banana flour, OT, fortified-bread crust samples with oven-
dried green banana flour, WT, wheat bread crust.

CHAPTER 8: VOLATILE FINGERPRINTING OF BANANA FORTIFIED BREAD
203
Table 8.5. Discriminant volatiles based on highest absolute variable identification
coefficients (VID) coefficients for breadcrumb and crust samples through PLS-DA
analysis. The calculated retention index (RI) and one retrieved from literature
(LRI) for volatile compounds are listed.
VID ID Chemical class CRI LRI
FB
0.766 (E)-2-nonenal medium-chain
aldehyde 1537 1534
0.757 1-hexanol alcohol 1340 1355
0.684 pentanal aldehyde 978 979
OB 0.658 3-methyl-butanal Strecker aldehyde 917 918
WB
0.719 octaethylene glycol monododecyl
ether ethylene glycol 1779 NA
0.684 phenylethyl alcohol alcohol 1911 1906
0.665 2-phenylethanol alcohol 1935 1915
FT
0.798 pentanal aldehyde 978 979
0.752 2-heptenal alkyl aldehyde 1325 1322
0.702 2-undecanone ketone 1595 1598
0.689 furfural aldehyde 1462 1461
0.664 1-hydroxy-2-propanone ketone 1297 1300
WT 0.778 2-propoxy-ethanol alcohol 1293 1326
0.651 carbon disulphide sulphur compound 732 735
FB, fortified-breadcrumb samples with freeze-dried green banana flour, OB, fortified-breadcrumb
samples with oven-dried green banana flour, WB, wheat breadcrumb. FT, fortified-bread crust samples
with freeze-dried green banana flour, WT, wheat bread crust.

CHAPTER 8: VOLATILE FINGERPRINTING OF BANANA FORTIFIED BREAD
204
8.4. Changes of key volatile compounds in bread samples
From what has been discussed so far, it can be concluded that the volatile profile of
the bread crust is evidently different from that of the crumb. Furthermore, green
banana flour fortification level also showed a clear effect on modifying the volatile
profile in both breadcrumb and crust. Lastly, the processing method of GBF
preparation had an impact on the fortified bread volatile profile (but relatively lower
impact compared to the other factors). In summary, volatile compounds that were
significantly affected by the bread part, level of fortification and processing can be
grouped into:
(i) furanic compounds (furfural and 2-furanmethanol)
(ii) Strecker aldehydes (3-methyl-butanal)
(iii) esters (ethyl ester butanoic acid)
(iv) ketones (2-undecanone)
Each of these chemical classes were discussed in relation to the relevant chemical
reactions’ pathways and odour relevance. One should note that there are very limited
studies investigating the impact of different variables in a bread made with BF. To
clearly show the trend, a bar graph is prepared for these representative compounds in
order to compare and interpret the significant difference amongst all the seven bread
samples.

CHAPTER 8: VOLATILE FINGERPRINTING OF BANANA FORTIFIED BREAD
205
8.4.1. Furanic compounds
8.4.1.1. Furfural
As can be seen from Fig 8.13, the bread crust contained higher furfural compared to
crumb in all the samples. The increasing quantity in furfural content in conjunction
with an increase in fortification level is another important trend of Fig 8.13. However,
this level of fortification effect was not statistically significant (P-value > 0.05) in
breadcrumb or crust samples (except from O30T compared to other OT samples).
Drying method used for GBF preparation had a notable impact on the production of
furfural, in which the amount of furfural was higher in the FD samples compared to
the OD samples. This might be due to the uncaramelized sugars and Maillard
precursors (e.g., 5-hydroxymethylfurfural) which possibly remained intact during FD
processing (Pico et al., 2017). According to Pico et al. (2018a), 5-hydroxymethylfurfural
could be converted to furfural by Maillard reactions and caramelisation during
cooking process. This hypothesis can be confirmed by designing a targeted
experiment to quantify the concentration of 5-hydroxymethylfurfural and other
intermediate products, however, this was outside the scope of this study. Furfural is
considered as an indicator for non-enzymatic browning and is the distinguished
aldehyde in bread crust. It could be formed by the heat-induced complex Maillard
reaction primarily occurring on the dough surface during baking (Perez-Locas and
Yaylayan, 2010).
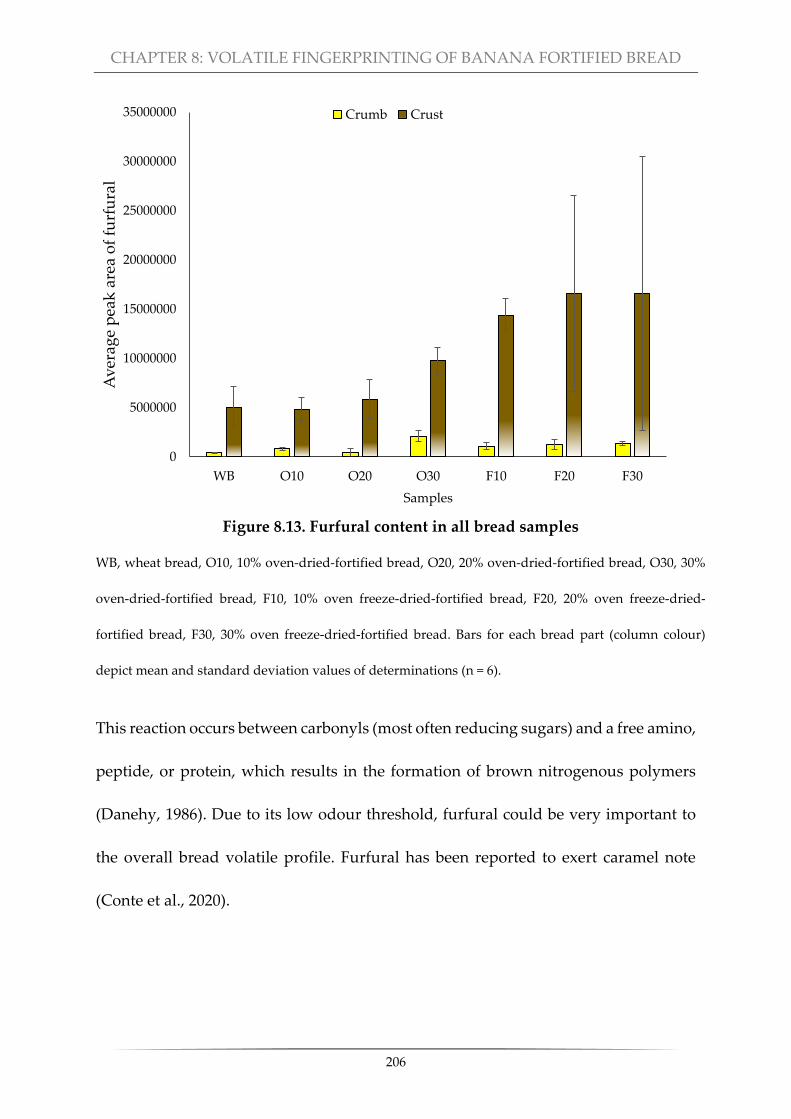
CHAPTER 8: VOLATILE FINGERPRINTING OF BANANA FORTIFIED BREAD
206
This reaction occurs between carbonyls (most often reducing sugars) and a free amino,
peptide, or protein, which results in the formation of brown nitrogenous polymers
(Danehy, 1986). Due to its low odour threshold, furfural could be very important to
the overall bread volatile profile. Furfural has been reported to exert caramel note
(Conte et al., 2020).
0
5000000
10000000
15000000
20000000
25000000
30000000
35000000
WB O10 O20 O30 F10 F20 F30
Av
erag
e p
eak
are
a o
f fu
rfu
ral
Samples
Crumb Crust
Figure 8.13. Furfural content in all bread samples
WB, wheat bread, O10, 10% oven-dried-fortified bread, O20, 20% oven-dried-fortified bread, O30, 30%
oven-dried-fortified bread, F10, 10% oven freeze-dried-fortified bread, F20, 20% oven freeze-dried-
fortified bread, F30, 30% oven freeze-dried-fortified bread. Bars for each bread part (column colour)
depict mean and standard deviation values of determinations (n = 6).
CHAPTER 8: VOLATILE FINGERPRINTING OF BANANA FORTIFIED BREAD
207
8.4.1.2. 2-Furanmethanol
An increase was recorded in 2-furanmethanol content in all bread crust samples
compared to crumbs (Fig 8.14). Furanmethanol or furfuryl alcohol is a cyclic furanic
compound which has been reported to polymerise in acidic pH to aliphatic polymers,
which causes a higher browning index to bread (Pico et al., 2018a). Pico et al. (2019a)
signified furfuryl alcohol as one of the compounds responsible for darker colour of
crust compared to crumb. They also reported that 2-furanmethanol can be generated
by caramelisation processes. According to Conte et al. (2020) findings, 2-
furanmethanol was reported as a reduction product from furfural in gluten-free
bread. The appearance of 2-furanmethanol mainly in bread crust samples could
contribute to the nutty, roasted aroma (Aguilar et al., 2015, Birch et al., 2014, Salim Ur
and Awan, 2011). However, considering the non-significant difference amongst
banana bread samples, this hypothesis needs to be confirmed using GC-olfactometry
in future studies.
Overall, it can be said that furanic compounds were the discriminant volatiles in bread
crust. All three selected furanic compounds were higher in FDF-fortified bread
samples, which could be due to the presence of higher amounts of Maillard reactions
precursors in FDF compared to ODF. Furthermore, fortification level showed a slight
increase within each bread type which was only significant in O30T samples for 3-
methyl butanal. Moreover, considering the non-significant difference amongst banana

CHAPTER 8: VOLATILE FINGERPRINTING OF BANANA FORTIFIED BREAD
208
bread samples and fortification levels, this compound might not be related to GBF
addition to bread.
8.4.2. Strecker aldehydes
From Fig 8.15, it can be seen that bread crust contained higher 3-methyl-butanal
compared to breadcrumb samples. The drying method also had an effect on the
formation of 3-methyl-butanal. 3-Methyl-butanal is formed through a Strecker
degradation reaction, which is one of the side reactions of the Maillard reaction. In
this reaction, amino acids react with dehydroreductones to produce aldehydes, in
0
10000000
20000000
30000000
40000000
50000000
60000000
WB O10 O20 O30 F10 F20 F30
Av
erag
e p
eak
are
a o
f 2-
Fu
ran
met
han
ol
Samples
Crumb Crust
Figure 8.14. 2-Furanmethanol content in all bread samples
WB, wheat bread, O10, 10% oven-dried-fortified bread, O20, 20% oven-dried-fortified bread, O30, 30%
oven-dried-fortified bread, F10, 10% oven freeze-dried-fortified bread, F20, 20% oven freeze-dried-
fortified bread, F30, 30% oven freeze-dried-fortified bread. Bars for each bread part (column colour)
depict mean and standard deviation values of determinations (n = 6).

CHAPTER 8: VOLATILE FINGERPRINTING OF BANANA FORTIFIED BREAD
209
particular, 3-methyl-butanal from leucine (Barbarisi et al., 2019). As FDF was prepared
by non-thermal drying (Chapter 4), higher 3-methyl-butanal content in F20T and F30T
samples might be due to the presence of leucine which was kept in the FDF until the
baking process. Its pungent malty aroma is reported to be easily detectable as it has a
low flavour threshold (Pico et al., 2016). Overall, a combined effect of bread part,
fortification level and drying method could be seen for 3-methyl-butanal.
0
5000000
10000000
15000000
20000000
25000000
30000000
WB O10 O20 O30 F10 F20 F30
Av
erag
e p
eak
are
a o
f 3-
Met
hy
l-b
uta
nal
Samples
Crumb Crust
Figure 8.15. 3-Methyl-butanal content in all bread samples
WB, wheat bread, O10, 10% oven-dried-fortified bread, O20, 20% oven-dried-fortified bread, O30, 30% oven-
dried-fortified bread, F10, 10% oven freeze-dried-fortified bread, F20, 20% oven freeze-dried-fortified bread, F30,
30% oven freeze-dried-fortified bread. Bars for each bread part (column colour) depict mean and standard
deviation values of determinations (n = 6).

CHAPTER 8: VOLATILE FINGERPRINTING OF BANANA FORTIFIED BREAD
210
8.4.3. Esters
Contrary to furanic compounds, esters seemed to be found more in breadcrumb
samples compared to crusts (Fig 8.16). The abundance of ethyl ester butanoic acid in
breadcrumb was already reported in previous sections (Table 8.3). Regarding
fortification level, no significant changes could be seen amongst bread samples (P-
value > 0.05), however, above 10% level, FB samples showed a clear difference
between crumb and crust. Amongst the ethyl acetate group (butanoate, octanoate,
hexanoate, propanoate and 2-hydroxypropanoate), ethyl ester butanoic acid is also
recognized as a discriminant compound in banana fruit (Zhu et al., 2018, Qamar and
Shaikh, 2018). Also, it has been reported that can be generated in wheat breadcrumb
as well (Birch et al., 2013a). This ester, which could enhance the sweet impression of
sucrose, is generated by esterification of alcohols and acyl-CoA derived from both
fatty acid and amino acid metabolism (Birch et al., 2013b).
The study of Seymour (1993) on different ripe banana varieties showed that amyl
esters are responsible for the distinctive banana-like flavour, while fruity note is
mainly attributed to butyl esters. Esters constitute the major class of compounds
present in the volatile profile of the ripe banana, such as isoamyl acetate, ethyl acetate,
butyl acetate, isoamyl isobutanoate and butyl butanoate (Zhu et al., 2018). According
to Vermeir et al. (2009) findings, the predominant ester in semi-ripe banana was 3-
methyl-butyl-butanoate. Overall, it can be concluded that although the processing
approach taken to produce GBF had an impact on producing different volatile

CHAPTER 8: VOLATILE FINGERPRINTING OF BANANA FORTIFIED BREAD
211
0
1000000
2000000
3000000
4000000
5000000
6000000
WB O10 O20 O30 F10 F20 F30
Av
erag
e p
eak
are
a o
f b
uta
no
ic a
cid
eth
yl
este
r
Samples
Crumb Crust
compounds, bread part played the dominant role. However, the FD-fortified bread
samples might produce a more pronounced “banana like” aroma. The difference in
volatile compounds found in fortified bread samples, in both crust and crumb,
showed the method of GBF preparation prior to the Breadmaking could have an
impact on the bread’s flavour.
Figure 8.16. Butanoic acid ethyl ester content in all bread samples
WB, wheat bread, O10, 10% oven-dried-fortified bread, O20, 20% oven-dried-fortified bread, O30, 30%
oven-dried-fortified bread, F10, 10% oven freeze-dried-fortified bread, F20, 20% oven freeze-dried-fortified
bread, F30, 30% oven freeze-dried-fortified bread. Bars for each bread part (column colour) depict mean
and standard deviation values of determinations (n = 6).

CHAPTER 8: VOLATILE FINGERPRINTING OF BANANA FORTIFIED BREAD
212
0
1000000
2000000
3000000
4000000
5000000
WB O10 O20 O30 F10 F20 F30
Av
erag
e p
eak
are
a o
f 2-
un
dec
ano
ne
Samples
Crumb Crust
Figure 8.17. 2-Undecanone content in all bread samples
WB, wheat bread, O10, 10% oven-dried-fortified bread, O20, 20% oven-dried-fortified bread, O30, 30% oven-
dried-fortified bread, F10, 10% oven freeze-dried-fortified bread, F20, 20% oven freeze-dried-fortified bread,
F30, 30% oven freeze-dried-fortified bread. Bars for each bread part (column colour) depict mean and
standard deviation values of determinations (n = 6).
8.4.4. Ketones
In Fig 8.17, a discriminant compound trend from ketone chemical class is shown. A
gradual increase in the peak area of 2-undecanone by adding more GBF was observed
in bread crust samples. Similar to furanic compounds, 2-undecanone appeared more
notably in crust compared to crumb. The gradual increase in 2-undecanone content
was not significant in OD-fortified samples, however, increasing fortification level had
an increasing impact on FDT samples. It was also shown that in higher levels of
fortification, this volatile was detected more, particularly in F30T samples (Table 8.5).
Studies on banana fruit volatiles have indicated that this compound is one of the
aromatic compounds in the early ripening stage of green bananas (Zhu et al., 2018,
Vermeir et al., 2009, Wang et al., 2007).

CHAPTER 8: VOLATILE FINGERPRINTING OF BANANA FORTIFIED BREAD
213
Regarding the notable effect of drying method, the explanation might be due to the
presence of this ketone in FDF considering non-thermal GBF preparation.
8.4. Conclusion
This study has provided an overview of the volatile compounds of wheat bread
fortified with different levels of two types of green banana flour, using an integrated
headspace fingerprinting and chemometrics. This was a successful approach which
led to the detection of an increased number of volatile compounds from a wide range
of chemical classes in two bread parts, crumb and crust. The implemented
chemometrics modelling such as PCA and PLS-DA gave a detailed insight into three
factors: bread part, fortification level and processing method used for GBF
preparation.
From the three main factors, the volatile compounds were significantly different
between the bread parts, i.e., crumb and crust. Maillard reactions and Strecker
degradation were the most dominant reactions responsible for the development of 2-
furanmethanol, furfural, 3-methyl-butanal and benzaldehyde in bread crust. The
breadcrumb had a higher amount of ester and alcohol compounds. The second
important effect was the level of GBF fortification in bread, which causes more volatile
generation in 30% level and no significant changes between 10% and 20%. Alcohols
(3-methyl-1-butanol and 1-hexanol) and esters (hexanoic and butanoic acid ethyl
ester) in crumb and Strecker aldehydes (benzaldehyde and 3-methyl-butanal) and

CHAPTER 8: VOLATILE FINGERPRINTING OF BANANA FORTIFIED BREAD
214
aldehydes (furfural) in crust were the result of lipid oxidation and browning reactions,
respectively. Furthermore, the banana drying method used for GBF preparation had
an impact on the generation of different key volatile compounds both in bread crust
and crumb. The FDF-fortified samples yielded more distinctive volatile profile
compounds, mainly Strecker aldehydes.
This study successfully demonstrated the potential of GC-MS-based fingerprinting
and chemometrics to increase insight into the volatile changes and identify
discriminant volatile compounds. However, headspace fingerprinting only allowed
tentative identification and relative quantification of selected volatiles. In the future,
there is a need for identity confirmation and absolute quantification of the selected
discriminant components using pure standards. Furthermore, characterising
headspace components with respect to reducing sugar and amino acid profile of GBF
and the bread could contribute to more detailed information about the differences
between the GBF preparation techniques. In addition, Gas Chromatography
Olfactometry (GC-O) can provide a correlation between selected compounds and the
odour activity. A follow-up descriptive sensory analysis can also be used to
investigate how the volatile profile changes will be perceived.
8.5. Limitations
Although this study provides a broad perspective into the volatile profile of the GBF-
fortified bread, the identification approach was a tentative identification. The

CHAPTER 8: VOLATILE FINGERPRINTING OF BANANA FORTIFIED BREAD
215
identification of the selected compounds needs to be confirmed by injecting pure
standards. Also, in order to understand the bread aroma profile, a descriptive sensory
analysis would be advised.

Chapter 9

CHAPTER 9: GENERAL CONCLUSION
217
General conclusion and recommendations for future studies
Chapter aim:
In this chapter, the key findings of the study are discussed. Then, future possible
follow-up studies and recommendations are summarized.

CHAPTER 9: GENERAL CONCLUSION
218
9.1. Introduction
The main goal of this study was to select the best feasible drying method for producing
a functional ingredient for fortification of bread. Thereafter, the quality attributes and
textural properties of dough and bread were assessed together with in vitro digestion
in order to determine resistant starch content of the final fortified bread. Finally, a
comparative volatile fingerprinting was performed in order to find the discriminant
volatile compounds that distinguish different bread samples.
In this thesis, two drying techniques were applied in four conditions to investigate the
effect of each one on resistant starch content, changes in thermal properties of the flour
and physicochemical parameters of the whole green banana flour (Chapter 3). In order
to find out the capability of the flour for application in bread formulation, textural,
rheological, physical and nutritional properties of the produced flour was also
investigated (Chapter 4). Based on the findings, two of the best treatments were
selected for fortification of bread: oven-dried GBF obtained at 50 °C (ODF) and freeze-
dried flour (FDF). The subsequent experimental chapters (5-7) focused on the effect of
type of produced GBF and the fortification level in bread while comparing the
viscoelastic, rheological and textural properties and finally the volatile profile of both
dough and bread to a control sample made with 0% GBF.

CHAPTER 9: GENERAL CONCLUSION
219
9.2. General conclusion
The obtained results support the use of whole green banana to produce an added
value food ingredient for fortification purposes. Freeze-dried green banana flour is a
greenish-like powder with high water holding capacity and emulsifying attributes. It
contains the highest possible percentage of resistant starch remained after drying
processing. It also can generate more stable gels during storage due to the high setback
viscosity. The application of this flour in bread structure resulted in a food product
with a considerable amount of resistant starch, slow digestible starch and minerals
compared to the control sample without GBF. The bread fortification with 10% of this
flour resulted in a bread with a high specific volume. Continuing substitution up to
30%, resulted in a drop in bread springiness and resilience, while it increased the
chewiness and hardness. This could suggest fortification at 30% level would be more
suitable for other flat bread types. Overall, the bread made with maximum 30% freeze-
dried green banana flour resulted in a bread with distinctive volatile compounds from
both technological and nutritional aspects.
Comparing the results achieved from thermal treatment of green banana showed that
although it is possible to produce GBF with only two hours at 110 ˚C of drying time,
samples obtained after 7.5 h at 50 ̊ C treatment had more similar properties to the non-
thermal treated ones. The dough made with the latter one showed the lowest
breakdown viscosity amongst heat treated samples. Considering that Maillard
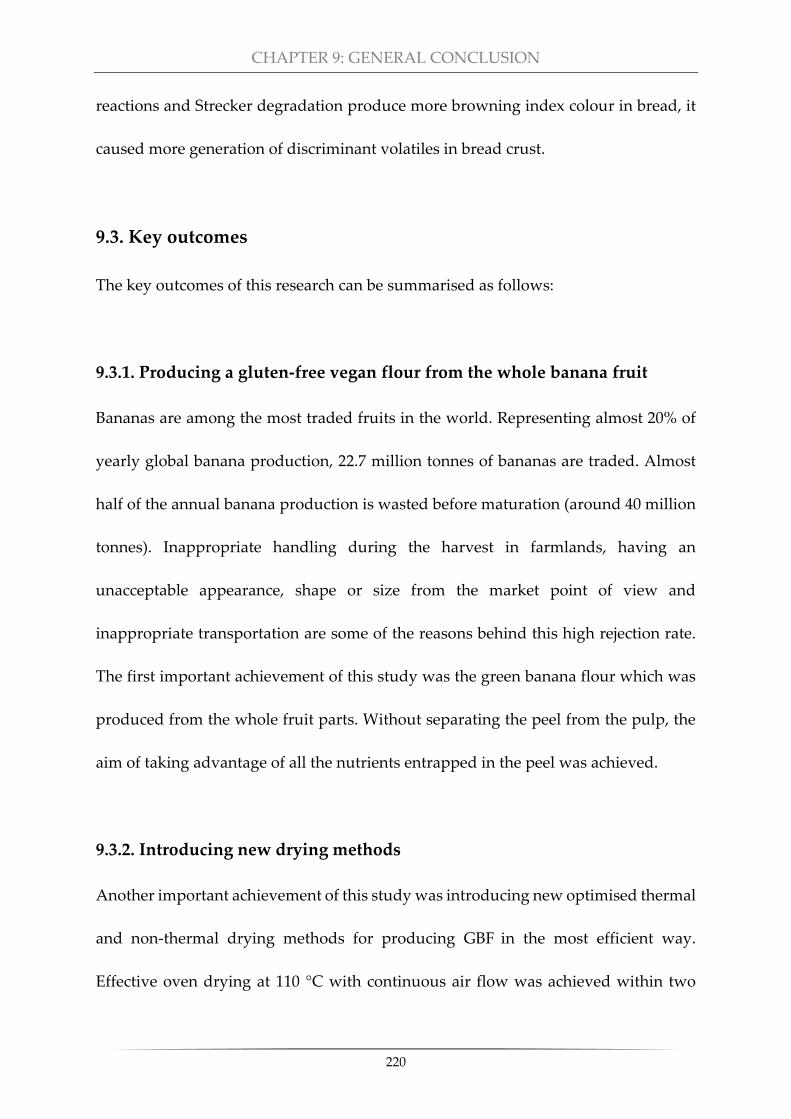
CHAPTER 9: GENERAL CONCLUSION
220
reactions and Strecker degradation produce more browning index colour in bread, it
caused more generation of discriminant volatiles in bread crust.
9.3. Key outcomes
The key outcomes of this research can be summarised as follows:
9.3.1. Producing a gluten-free vegan flour from the whole banana fruit
Bananas are among the most traded fruits in the world. Representing almost 20% of
yearly global banana production, 22.7 million tonnes of bananas are traded. Almost
half of the annual banana production is wasted before maturation (around 40 million
tonnes). Inappropriate handling during the harvest in farmlands, having an
unacceptable appearance, shape or size from the market point of view and
inappropriate transportation are some of the reasons behind this high rejection rate.
The first important achievement of this study was the green banana flour which was
produced from the whole fruit parts. Without separating the peel from the pulp, the
aim of taking advantage of all the nutrients entrapped in the peel was achieved.
9.3.2. Introducing new drying methods
Another important achievement of this study was introducing new optimised thermal
and non-thermal drying methods for producing GBF in the most efficient way.
Effective oven drying at 110 °C with continuous air flow was achieved within two

CHAPTER 9: GENERAL CONCLUSION
221
hours. Nutritional results reported in chapters 4 and 5 showed that heat-treated GBF
samples could be considered as a good source of minerals. Freeze-drying successfully
granted dried samples with maximum aw of 0.24 in total 52 h, which was the least
processing time reported in the literature. Sample preparation (slicing the whole fruit
into 2-mm thickness circular shapes) helped minimizing the processing time, thermal
conduction and sublimation of moisture from banana fruit. Freeze-drying can be an
expensive drying technique, however, the characteristics of the flour obtained at 50
°C with oven-drying showed that this GBF had the most similar rheological, textural
and nutritional properties amongst other drying conditions. This showed the
possibility of using this treatment as an alternative low-cost technique compared to
freeze drying, especially in developing countries which are the leading banana
producers.
9.3.3 Full characterization of green banana flour, dough and bread
The green banana flour samples made from two methods in four conditions was
examined to understand the effect of the banana drying process on its various
properties. Resistant starch analysis showed a significant amount of available RS in
freeze-dried and oven-dried samples, especially those dried at 50 °C which was
slightly less than the freeze-dried sample. In chapter 7, it was shown that 20% GBF
substitution with wheat flour resulted in at least 1.5 times more RS in bread, regardless
of the type of GBF. However, for obtaining the highest possible intake of RS, 30% FDF

CHAPTER 9: GENERAL CONCLUSION
222
addition showed a remarkable increase in RS content within the range of prebiotic
dosage. This showed the importance of RS analysis in both GBF and bread to observe
the processing effect on the remaining of RS. In terms of textural attributes, the strong
correlation between fresh dough hardness and bread hardness (P-value < 0.05)
showed the importance of textural analysis of dough for being able to predict the final
product’s properties.
9.3.4. Changes of bread quality during storage
Storage results showed that retrogradation reactions happened quicker in fortified
bread samples compared to whole wheat bread (chapter 6). Also, higher levels of GBF
increased the firmness after a week of bread storage. Although recrystallization of
starch postponed at -20 °C, due to the increased amount of sugar in fortified samples,
it resulted in greater stiffness. Moisture loss, however, was not significant amongst
fortified bread which shows the effect of high-water holding capacity of GBF stored
in freezer.
9.3.5. Increased amount of resistant starch in bread
The in vitro digestibility analysis showed that the 30% fortified bread can be
considered as a prebiotic bread (chapter 6). The remaining RS and SDS content in the
final bread was in the range of recommended daily intake of RS (6-12 g/d), which
makes it a valuable source for increasing the intake of this nutritive DF. Considering
CHAPTER 9: GENERAL CONCLUSION
223
that this amount was lesser in OD-fortified bread, it can be concluded that fortification
with ODF at minimum of 30% can be as close as the FDF. As a result, these results
could provide an opportunity in industries who are not capable of establishing freeze
drying equipment. Considering results reported for ODF50 in chapter 4, the use of
ODF50 as a functional ingredient in other food products can be further explored.
9.3.6. Increased the availability of macro and micro minerals in bread
Comparing the results from ICP-MS mass spectrometer revealed a significant rise in
potassium, magnesium, iron, copper and zinc in all fortified bread samples,
particularly at 30% level. This can play a part in fulfilling the daily intake advised for
these elements. Regardless of the type of GBF, this study showed that for the purpose
of increasing minerals in diet, the type of processing technique has the least effect on
the remaining percentage of the elements.

CHAPTER 9: GENERAL CONCLUSION
224
9.4. Future recommendations
1) Future studies should focus on the particle size distribution, starch granule
microstructure and rheological properties of the whole green banana flour to
understand their potential behaviour during packaging, transportation and use in
food systems.
2) Green banana flour produced with FD and dried at 50 °C generated a high viscose
slurry in reaction with water molecules. In this regard, it can be added to other food
products and act as a thickener, gelling agent, reinforcing agent and filler. Studies are
required to understand the behaviour of these GBF samples in other food products.
3) More studies are needed for the evaluation of microstructural changes in GBF bread
mainly with FDF as it has shown less textural damaging effect on bread slices. Also,
sensory evaluation and consumer acceptance are suggested for further studies in this
area.
4) Some previous studies have shown the synergic effect of hydrocolloids with
resistant starch content which can be used for the future studies on bread formulation.
5) There is a need for identifying confirmation and quantification of the selected
discriminant components by the use of pure standard samples. Furthermore,
characterising headspace components with respect to reducing sugar and amino acid
profile of GBF and the bread could provide more detailed information about the
differences between the GBF production techniques.

CHAPTER 9: GENERAL CONCLUSION
225
6) Gas Chromatography Olfactometry (GC-O) can provide a correlation between
specific chemicals and the odour concentration by the senses of trained panellists.
7) A follow-up descriptive sensory analysis or consumer acceptance testing should be
carried out to improve the impact of these selected discriminant components.

Appendix

APPENDIX
227
Table A1. The observations of the effect of different trial processes on green
banana samples
Whole green Banana preparation
Before drying After freeze-drying After oven drying
Chopped and mixed in a mixer
Enzymatic browning started
Samples was not fully frozen after 6 hours (time consuming)
Browning after an hour
Cut the fruit in half (from length)
Difficult to split exactly in half due to the curvy shape of fruits
Incomplete drying after 48 h
Case hardening occurred with incomplete core drying
Green banana slices with a thickness range of 10 - 2 mm
Difficult handling for one person
Not efficient drying in slices with > 2 mm
- Needed more drying time - Not appropriate for temperature > 80 °C

APPENDIX
228
Figure B 2. Green banana slices immersion in 0.5% (w/v) citric acid
Figure B 1. Fresh green banana slices (left) and dried ones (right) by oven drying

APPENDIX
229
Figure B 3. Green banana flour prepared at 110 °C (left), 80 °C (middle) and 50 °C (right)
Figure B 4. Fresh frozen green banana slices (left) and freeze-dried slices (right)
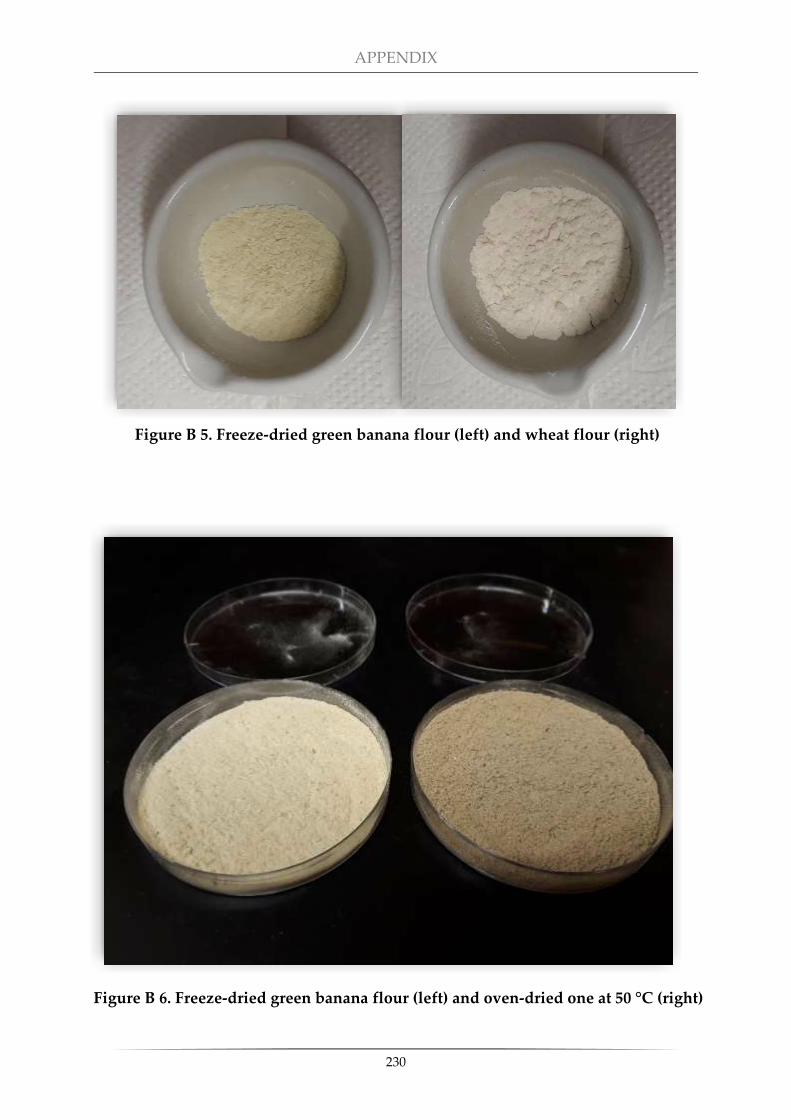
APPENDIX
230
Figure B 6. Freeze-dried green banana flour (left) and oven-dried one at 50 °C (right)
Figure B 5. Freeze-dried green banana flour (left) and wheat flour (right)

APPENDIX
231
Figure B 7. First trial of bread dough making
Figure B 8. First trial of non-fermented pan bread making

APPENDIX
232
Figure B 10. Trials for other bakery product (cookie dough, left and baked one,
right)
Figure B 9. The first trial for green banana fortified bread at 30% level (left) and
wheat bread (right)

APPENDIX
233
F20 F10
F30 WB
O10 O20
O30
Figure B 11. All the prepared bread samples
* WB, wheat bread, F10, F20 and F30, substitution levels of freeze-dried banana flour with wheat flour.
* O10, O20 and O30, substitution levels of air oven-dried banana flour with wheat flour.

APPENDIX
234
Figure B 12. Oven-dried banana flour (left) vs. freeze-dried samples (right)
REFERENCES
235
List of References
ABBAS, F. M. A., SAIFULLAH, R. & AZHAR, M. E. 2009. Assessment of physical
properties of ripe banana flour prepared from two varieties: Cavendish and
Dream banana. International Food Research Journal, 16, 183-189.
ABDULLAH, E. C. & GELDART, D. 1999. The use of bulk density measurements as
flowability indicators. Powder Technology, 102, 151-165.
ADEBAYO-OYETORO, A. O., OGUNDIPE, O. O. & ADEEKO, K. N. 2016. Quality
assessment and consumer acceptability of bread from wheat and fermented
banana flour. Food Science and Nutrition, 4, 364-369.
AGAMA-ACEVEDO, E., ISLAS-HERNANDEZ, J. J., OSORIO-DÍAZ, P., RENDÓN-
VILLALOBOS, R., UTRILLA-COELLO, R. G., ANGULO, O. & BELLO-PÉREZ,
L. A. 2009. Pasta with unripe banana flour: Physical, texture, and preference
study. Journal of Food Science, 74, 263-267.
AGAMA-ACEVEDO, E., ISLAS-HERNÁNDEZ, J. J., PACHECO-VARGAS, G.,
OSORIO-DÍAZ, P. & BELLO-PÉREZ, L. A. 2012. Starch digestibility and
glycaemic index of cookies partially substituted with unripe banana flour. LWT
- Food Science and Technology, 46, 177-182.
AGAMA-ACEVEDO, E., PACHECO-VARGAS, G., GUTIERREZ-MERAZ, F.,
TOVAR, J. & BELLO-PEREZ, L. A. 2019. Dietary fiber content, texture, and in

REFERENCES
236
vitro starch digestibility of different white bread crusts. Journal of Cereal Science,
89, 102824.
AGAMA-ACEVEDO, E., SAÑUDO-BARAJAS, J. A., VÉLEZ DE LA ROCHA, R.,
GONZÁLEZ-AGUILAR, G. A. & BELLO-PERÉZ, L. A. 2016. Potential of
plantain peels flour (Musa paradisiaca L.) as a source of dietary fiber and
antioxidant compound. CyTA - Journal of Food, 14, 117-123.
AGUILAR, N., ALBANELL, E., MIÑARRO, B., GALLARDO, J. & CAPELLAS, M.
2015. Influence of final baking technologies in partially baked frozen gluten-
free bread quality. Journal of Food Science, 80, 619-626.
AHMED, J., THOMAS, L. & KHASHAWI, R. 2020. Influence of hot-air drying and
freeze-drying on functional, rheological, structural and dielectric properties of
green banana flour and dispersions. Food Hydrocolloids, 99, 105331.
AL-MAHSANEH, M., ALJARRAH, M., RABABAH, T. & ALU'DATT, M. 2018. Using
MR-FTIR and texture profile to track the effect of storage time and temperature
on pita bread staling. Journal of Food Quality, 2018, 1-9.
AL-SHERAJI, S. H., ISMAIL, A., MANAP, M. Y., MUSTAFA, S., YUSOF, R. M. &
HASSAN, F. A. 2013. Prebiotics as functional foods: A review. Journal of
Functional Foods, 5, 1542-1553.

REFERENCES
237
ALBA, K., MACNAUGHTAN, W., LAWS, A. P., FOSTER, T. J., CAMPBELL, G. M. &
KONTOGIORGOS, V. 2018. Fractionation and characterisation of dietary fibre
from blackcurrant pomace. Food Hydrocolloids, 81, 398-408.
ALKARKHI, A. F. M., RAMLI, S. B., YONG, Y. S. & EASA, A. M. 2011. Comparing
physicochemical properties of banana pulp and peel flours prepared from
green and ripe fruits. Food Chemistry, 129, 312-318.
ALMEIDA-JUNIOR, L. D., CURIMBABA, T. F. S., CHAGAS, A. S., QUAGLIO, A. E.
V. & DI STASI, L. C. 2017. Dietary intervention with green dwarf banana flour
(Musa sp. AAA) modulates oxidative stress and colonic SCFAs production in
the TNBS model of intestinal inflammation. Journal of Functional Foods, 38, 497-
504.
ALTUNA, L., RIBOTTA, P. D. & TADINI, C. C. 2015. Effect of a combination of
enzymes on dough rheology and physical and sensory properties of bread
enriched with resistant starch. LWT - Food Science and Technology, 64, 867-873.
ALTUNA, L., RIBOTTA, P. D. & TADINI, C. C. 2016. Effect of a combination of
enzymes on the fundamental rheological behaviour of bread dough enriched
with resistant starch. LWT - Food Science and Technology, 73, 267-273.
ANDRADE, B. A., PERIUS, D. B., DE MATTOS, N. V., DE MELLO LUVIELMO, M. &
MELLADO, M. S. 2018. Production of unripe banana flour (Musa spp) for
application in whole wheat bread. Brazilian Journal of Food Technology, 21, 1-10.

REFERENCES
238
ANYASI, T. A., JIDEANI, A. I. O. & MCHAU, G. R. A. 2018. Phenolics and essential
mineral profile of organic acid pre-treated unripe banana flour. Food Research
International, 104, 100-109.
AOAC 2005. AOAC International. Official Methods of Analysis of AOAC
International.
APARICIO-SAGUILAN, A., OSORIO-DÍAZ, P., AGAMA-ACEVEDO, E., ISLAS-
HERNÁNDEZ, J. J. & BELLO-PEREZ, L. A. 2013. Tortilla added with unripe
banana and cassava flours: Chemical composition and starch digestibility.
Journal of Food, 11, 90-95.
APARICIO-SAGUILÁN, A., VALERA-ZARAGOZA, M., PERUCINI-AVENDAÑO,
M., PÁRAMO-CALDERÓN, D. E., AGUIRRE-CRUZ, A., RAMÍREZ-
HERNÁNDEZ, A. & BELLO-PÉREZ, L. A. 2015. Lintnerization of banana
starch isolated from underutilized variety: Morphological, thermal, functional
properties, and digestibility. CYTA - Journal of Food, 13, 3-9.
ARCENA, M. R., KEBEDE, B., LEONG, S. Y., SILCOCK, P. & OEY, I. 2020a. Feasibility
of using integrated fingerprinting, profiling and chemometrics approach to
understand (bio) chemical changes throughout commercial red winemaking: A
case study on Merlot. Food Research International, 127, 108767.
ARCENA, M. R., LEONG, S. Y., HOCHBERG, M., SACK, M., MUELLER, G., SIGLER,
J., SILCOCK, P., KEBEDE, B. & OEY, I. 2020b. Evolution of volatile and phenolic

REFERENCES
239
compounds during bottle storage of merlot wines vinified using pulsed electric
fields-treated grapes. Foods, 9.
ARP, C. G., CORREA, M. J. & FERRERO, C. 2018. High-amylose resistant starch as a
functional ingredient in breads: a technological and microstructural approach.
Food and Bioprocess Technology, 11, 2182-2193.
ARP, C. G., CORREA, M. J., ZULETA, Á. & FERRERO, C. 2017. Techno-functional
properties of wheat flour-resistant starch mixtures applied to breadmaking.
International Journal of Food Science and Technology, 52, 550-558.
ARUN, K. B., THOMAS, S., RESHMITHA, T. R., AKHIL, G. C. & NISHA, P. 2017.
Dietary fibre and phenolic-rich extracts from Musa paradisiaca inflorescence
ameliorate type 2 diabetes and associated cardiovascular risks. Journal of
Functional Foods, 31, 198-207.
AURORE, G., PARFAIT, B. & FAHRASMANE, L. 2009. Bananas, raw materials for
making processed food products. Trends in Food Science and Technology, 20, 78-
91.
AZIAH, A. A. N. & KOMATHI, C. A. 2009. Physicochemical and functional properties
of peeled and unpeeled pumpkin flour. Journal of Food Science, 74, S328-S333.
BAPTESTINI, F. M., CORRÊA, P. C., DE OLIVEIRA, G. H. H., BOTELHO, F. M. & DE
OLIVEIRA, A. P. L. R. 2017. Heat and mass transfer coefficients and modelling
of infrared drying of banana slices. Revista Ceres, 64, 457-464.

REFERENCES
240
BARBARISI, C., DE VITO, V., PELLICANO, M. P., BOSCAINO, F., BALSAMO, S.,
LAURINO, C., SORRENTINO, G. & VOLPE, M. G. 2019. Bread chemical and
nutritional characteristics as influenced by food grade sea water. International
Journal of Food Properties, 22, 280-289.
BATISTA, A. L. D., SILVA, R., CAPPATO, L. P., FERREIRA, M. V. S., NASCIMENTO,
K. O., SCHMIELE, M., ESMERINO, E. A., BALTHAZAR, C. F., SILVA, H. L. A.,
MORAES, J., PIMENTEL, T. C., FREITAS, M. Q., RAICES, R. S. L., SILVA, M.
C. & CRUZ, A. G. 2017. Developing a synbiotic fermented milk using probiotic
bacteria and organic green banana flour. Journal of Functional Foods, 38, 242-250.
BELLO-PÉREZ, L. A., AGAMA-ACEVEDO, E., SÁYAGO-AYERDI, S. G., MORENO-
DAMIAN, E. & FIGUEROA, J. D. C. 2000. Some structural, physicochemical
and functional studies of banana starches isolated from two varieties growing
in Guerrero, México. Starch/Staerke, 52, 68-73.
BELLO-PEREZ, L. A. & HOYOS-LEYVA, J. D. 2017. Development of Foods High in
Slowly Digestible and Resistant Starch. Starch in Food: Structure, Function and
Applications: Second Edition. Elsevier Inc.
BERAWI, K. N. & BIMANDAMA, M. A. 2018. The effect of giving extract ethanol of
kepok banana peel (Musa Acuminata) toward total cholesterol level on male
mice (Mus Musculus L.) strain deutschland-denken-yoken (ddy) Obese.
Biomedical and Pharmacology Journal, 11, 769-774.

REFERENCES
241
BERHAL, C., DE CLERCK, C., FAUCONNIER, M. L., LEVICEK, C., BOULLIS, A.,
KADDES, A., JIJAKLI, H. M., VERHEGGEN, F. & MASSART, S. 2017. First
characterisation of volatile organic compounds emitted by banana plants.
Scientific Reports, 7, 1-7.
BERTOLINI, A. C., BELLO-PÉREZ, L. A., MÉNDEZ-MONTEALVO, G., ALMEIDA,
C. A. S. & LAJOLO, F. 2010. Rheological and functional properties of flours
from banana pulp and peel. Starch/Staerke, 62, 277-284.
BEZERRA, C. V., AMANTE, E. R., DE OLIVEIRA, D. C., RODRIGUES, A. M. C. & DA
SILVA, L. H. M. 2013a. Green banana (Musa cavendishii) flour obtained in
spouted bed - Effect of drying on physico-chemical, functional and
morphological characteristics of the starch. Industrial Crops and Products, 41,
241-249.
BEZERRA, C. V., RODRIGUES, A. M. C., AMANTE, E. R. & DA SILVA, L. H. M.
2013b. Nutritional potential of green banana flour obtained by drying in
spouted bed. Revista Brasileira de Fruticultura, 35, 1140-1146.
BI, Y., ZHANG, Y., JIANG, H., HONG, Y., GU, Z., CHENG, L., LI, Z. & LI, C. 2017.
Molecular structure and digestibility of banana flour and starch. Food
Hydrocolloids, 72, 219-227.
BIERNACKA, B., DZIKI, D., RÓŻYŁO, R. & GAWLIK-DZIKI, U. 2020. Banana
powder as an additive to common wheat pasta. Foods (Basel, Switzerland), 9, 53.

REFERENCES
242
BIRCH, A. N., PETERSEN, M. A., ARNEBORG, N. & HANSEN, T. S. 2013a. Influence
of commercial baker's yeasts on bread aroma profiles. Food Research
International, 52, 160-166.
BIRCH, A. N., PETERSEN, M. A. & HANSEN, Å. S. 2013b. The aroma profile of wheat
bread crumb influenced by yeast concentration and fermentation temperature.
LWT - Food Science and Technology, 50, 480-488.
BIRCH, A. N., PETERSEN, M. A. & HANSEN, Å. S. 2014. Aroma of wheat bread
crumb. Cereal Chemistry, 91, 105-114.
BIRT, D. F., BOYLSTON, T., HENDRICH, S., JANE, J. L., HOLLIS, J., LI, L.,
MCCLELLAND, J., MOORE, S., PHILLIPS, G. J., ROWLING, M.,
SCHALINSKE, K., PAUL SCOTT, M. & WHITLEY, E. M. 2013. Resistant starch:
Promise for improving human health. Advances in Nutrition, 4, 587-601.
BLANCO CANALIS, M. S., LEÓN, A. E. & RIBOTTA, P. D. 2019. Incorporation of
dietary fiber on the cookie dough. Effects on thermal properties and water
availability. Food Chemistry, 271, 309-317.
BOCK, J. E., CONNELLY, R. K. & DAMODARAN, S. 2013. Impact of bran addition
on water properties and gluten secondary structure in wheat flour doughs
studied by attenuated total reflectance fourier transform infrared spectroscopy.
Cereal Chemistry, 90, 377-386.

REFERENCES
243
BOESWETTER, A. R., SCHERF, K. A., SCHIEBERLE, P. & KOEHLER, P. 2019.
Identification of the Key Aroma Compounds in Gluten-Free Rice Bread. Journal
of Agricultural and Food Chemistry, 67, 2963-2972.
BORGES, A. M., PEREIRA, J., SILVA JÚNIOR, A., DE LUCENA, E. M. P. & DE SALES,
J. C. 2010. Stability of cake pre-mixture made with 60% of green banana flour.
Ciencia e Agrotecnologia, 34, 173-181.
BOUDHRIOUA, N., GIAMPAOLI, P. & BONAZZI, C. 2003. Changes in aromatic
components of banana during ripening and air-drying. LWT - Food Science and
Technology, 36, 633-642.
BUGAUD, C. & ALTER, P. 2016. Volatile and non-volatile compounds as odour and
aroma predictors in dessert banana (Musa spp.). Postharvest Biology and
Technology, 112, 14-23.
CAHYANA, Y., WIJAYA, E., HALIMAH, T. S., MARTA, H., SURYADI, E. &
KURNIATI, D. 2019. The effect of different thermal modifications on slowly
digestible starch and physicochemical properties of green banana flour (Musa
acuminata colla). Food Chemistry, 274, 274-280.
CAMPUZANO, A., ROSELL, C. M. & CORNEJO, F. 2018. Physicochemical and
nutritional characteristics of banana flour during ripening. Food Chemistry, 256,
11-17.

REFERENCES
244
CARVALHO, V. S. & CONTI-SILVA, A. C. 2018. Cereal bars produced with banana
peel flour: evaluation of acceptability and sensory profile. Journal of the Science
of Food and Agriculture, 98, 134-139.
CASTELO-BRANCO, V. N., GUIMARÃES, J. N., SOUZA, L., GUEDES, M. R., SILVA,
P. M., FERRÃO, L. L., MIYAHIRA, R. F., GUIMARÃES, R. R., FREITAS, S. M.
L., REIS, M. C. D. & ZAGO, L. 2017. The use of green banana (Musa balbisiana)
pulp and peel flour as an ingredient for tagliatelle pasta. Brazilian Journal of Food
Technology, 20, 1-8.
CHANG, M. C. & MORRIS, W. C. 1990. the effect of heat treatments on dietary fiber
as assessed by scanning electron microscopy. Journal of Food Processing and
Preservation, 14, 335-343.
CHAU, C. F. & HUANG, Y. L. 2003. Comparison of the chemical composition and
physicochemical properties of different fibres prepared from the peel of citrus
sinensis L. Cv. Liucheng. Journal of Agricultural and Food Chemistry, 51, 2615-
2618.
CHAVAN, R., SAXENA, K., KUMAR, M., BAHADURE, S. & GORE, S. 2013.
Comparison of biomass and ethanol production kinetics of commercial baker's
yeast (S. cerevisiae) in a chemically defined medium against cane molasses,
waste Banana pulp and waste potato flour. International Journal of Applied
Engineering Research, 8, 1853-1859.

REFERENCES
245
CHÁVEZ-SALAZAR, A., BELLO-PÉREZ, L. A., AGAMA-ACEVEDO, E.,
CASTELLANOS-GALEANO, F. J., ÁLVAREZ-BARRETO, C. I. & PACHECO-
VARGAS, G. 2017. Isolation and partial characterization of starch from banana
cultivars grown in Colombia. International Journal of Biological Macromolecules,
98, 240-246.
CHOCKCHAISAWASDEE, S., MOUNSEY, J. S. & STATHOPOULOS, C. E. 2010.
Textural and rheological characteristics of sun-dried banana traditionally
prepared in the north-east of Thailand. Food Science and Technology Research, 16,
291-294.
CLEARY, L. & BRENNAN, C. 2006. The influence of a (1→3) (1→4)-β-d-glucan rich
fraction from barley on the physico-chemical properties and in vitro reducing
sugars release of durum wheat pasta. International Journal of Food Science &
Technology, 41, 910-918.
COLEMAN, K. L., MIAH, E. M., MORRIS, G. A. & MORRIS, C. 2014. Impact of health
claims in prebiotic-enriched breads on purchase intent, emotional response and
product liking. International Journal of Food Sciences and Nutrition, 65, 164-171.
CONTE, P., DEL CARO, A., URGEGHE, P. P., PETRETTO, G. L., MONTANARI, L.,
PIGA, A. & FADDA, C. 2020. Nutritional and aroma improvement of gluten-
free bread: is bee pollen effective? LWT - Food Science and Technology, 118,
108711.

REFERENCES
246
CORNEJO, F. & ROSELL, C. M. 2015. Physicochemical properties of long rice grain
varieties in relation to gluten free bread quality. LWT - Food Science and
Technology, 62, 1203-1210.
COSTA, A. L. R., GOMES, A., TIBOLLA, H., MENEGALLI, F. C. & CUNHA, R. L.
2018. Cellulose nanofibers from banana peels as a Pickering emulsifier: High-
energy emulsification processes. Carbohydrate Polymers, 194, 122-131.
CURTI, E., CARINI, E., TRIBUZIO, G. & VITTADINI, E. 2014. Bread staling: Effect of
gluten on physico-chemical properties and molecular mobility. LWT - Food
Science and Technology, 59, 418-425.
CURTI, E., CARINI, E. & VITTADINI, E. 2017. Staling and water dynamics in high-
gluten bread. European Food Research and Technology, 243, 1173-1182.
DA MOTA, R. V., LAJOLO, F. M., CIACCO, C. & CORDENUNSI, B. R. 2000.
Composition and functional properties of banana flour from different varieties.
Starch/Staerke, 52, 63-68.
DA SILVA, A. R., CERDEIRA, C. D., BRITO, A. R., SALLES, B. C. C., RAVAZI, G. F.,
MORAES, G. O. I., RUFINO, L. R. A., DE OLIVEIRA, R. B. S. & SANTOS, G. B.
2016. Green banana pasta diet prevents oxidative damage in liver and kidney
and improves biochemical parameters in type 1 diabetic rats. Archives of
Endocrinology and Metabolism, 60, 355-366.

REFERENCES
247
DAMEN, B., CLOETENS, L., BROEKAERT, W. F., FRANÇOIS, I., LESCROART, O.,
TROGH, I., ARNAUT, F., WELLING, G. W., WIJFFELS, J., DELCOUR, J. A.,
VERBEKE, K. & COURTIN, C. M. 2012. Consumption of breads containing in
situ-produced arabinoxylan oligosaccharides alters gastrointestinal effects in
healthy volunteers. Journal of Nutrition, 142, 470-477.
DANEHY, J. P. 1986. Maillard reactions: Nonenzymatic browning in food systems
with special reference to the development of flavour. Advances in Food Research,
30, 77-138.
DAVEY, M. W., KEULEMANS, J. & SWENNEN, R. 2006. Methods for the efficient
quantification of fruit provitamin A contents. Journal of Chromatography A, 1136,
176-184.
DE GOUVEIA, P. F. & ZANDONADI, R. P. 2013. Green banana: New alternative for
gluten-free products. Agro Food Industry Hi-Tech, 24, 49-52.
DE LA TORRE-GUTIÉRREZ, L., CHEL-GUERRERO, L. A. & BETANCUR-ANCONA,
D. 2008. Functional properties of square banana (Musa balbisiana) starch. Food
Chemistry, 106, 1138-1144.
DE SOUZA VIANA, E., DOS SANTOS DE SOUZA, A., REIS, R. C. & DOS SANTOS
DE OLIVEIRA, V. J. 2018. Application of green banana flour for partial
substitution of wheat flour in sliced bread. Semina:Ciencias Agrarias, 39, 2399-
2408.

REFERENCES
248
DRAKULA, S., NOVOTNI, D., MUSTAČ, N. Č., VOUČKO, B., KRPAN, M.,
HRUŠKAR, M. & ĆURIĆ, D. 2019. A Simple HS-SPME/GC-MS method for
determination of acrolein from sourdough to bread. Food Analytical Methods, 12,
2582-2590.
EDMUNDS, S. 2015. Food waste costs New Zealand $870m [Online]. New Zealand: stuff.
Available: https://www.stuff.co.nz/business/73762879/Food-waste-costs-New-
Zealand-870m [Accessed].
ELAVENIYA, E. & JAYAMUTHUNAGAI, J. 2014. Functional, Physicochemical and
anti-oxidant properties of dehydrated banana blossom powder and its
incorporation in biscuits. International Journal of ChemTech Research, 6, 4446-
4454.
ENGLYST, H. N. & CUMMINGS, J. H. 1987. Digestion of polysaccharides of potato in
the small intestine of man. American Journal of Clinical Nutrition, 45, 423-431.
ENGLYST, H. N., KINGMAN, S. M. & CUMMINGS, J. H. 1992. Classification and
measurement of nutritionally important starch fractions. European Journal of
Clinical Nutrition, 46, S33-s50.
ESHAK, N. S. 2016. Sensory evaluation and nutritional value of balady flat bread
supplemented with banana peels as a natural source of dietary fiber. Annals of
Agricultural Sciences, 61, 229-235.
REFERENCES
249
FALADE, K. O. & OYEYINKA, S. A. 2015. Colour, Chemical and Functional Properties
of Plantain Cultivars and Cooking Banana Flour as Affected by Drying Method
and Maturity. Journal of Food Processing and Preservation, 39, 816-828.
FALCOMER, A. L., RIQUETTE, R. F. R., DE LIMA, B. R., GINANI, V. C. &
ZANDONADI, R. P. 2019. Health Benefits of Green Banana Consumption: A
Systematic Review. Nutrients, 11, 1222.
FAOSTAT. 2017. Top Production-bananas-2016 [Online]. Food and Agriculture
Organisation of the United Nations. Available:
http://www.fao.org/economic/est/est-commodities/bananas/en/ [Accessed].
FAOSTAT. 2018. Banana facts and figures [Online]. Available:
http://www.fao.org/economic/est/est-
commodities/bananas/bananafacts/en/#.W7Pr9-V1NPY [Accessed].
FAYET-MOORE, F., CASSETTARI, T., TUCK, K., MCCONNELL, A. & PETOCZ, P.
2018. Dietary fibre intake in Australia. Paper ii: Comparative examination of
food sources of fibre among high and low fibre consumers. Nutrients, 10.
FERRERO, C. 2017. Hydrocolloids in wheat breadmaking: A concise review. Food
Hydrocolloids, 68, 15-22.
FILIPOVIĆ, J., FILIPOVIĆ, N. & FILIPOVIĆ, V. 2010. The effects of commercial fibres
on frozen bread dough. Journal of the Serbian Chemical Society, 75, 195-207.

REFERENCES
250
GARCIA-AMEZQUITA, L. E., TEJADA-ORTIGOZA, V., HEREDIA-OLEA, E.,
SERNA-SALDÍVAR, S. O. & WELTI-CHANES, J. 2018. Differences in the
dietary fiber content of fruits and their by-products quantified by conventional
and integrated AOAC official methodologies. Journal of Food Composition and
Analysis, 67, 77-85.
GIBSON, B., AUMALA, V., HEINIÖ, R.-L., MIKKELSON, A. & HONKAPÄÄ, K. 2018.
Differential evolution of Strecker and non-Strecker aldehydes during aging of
pale and dark beers. Journal of Cereal Science, 83, 130-138.
GÖĞÜŞ, F., FADLOĞLU, S. & SOYSAL, Ç. 2009. Biological oxidations: Enzymatic and
nonenzymatic browning reactions and control mechanisms. Advances in Food
Biochemistry. CRC Press.
GOMES, A. A. B., FERREIRA, M. E. & PIMENTEL, T. C. 2016. Bread with flour
obtained from green banana with its peel as partial substitute for wheat flour:
Physical, chemical and microbiological characteristics and acceptance.
International Food Research Journal, 23, 2214-2222.
GÓMEZ, A. V., BUCHNER, D., TADINI, C. C., AÑÓN, M. C. & PUPPO, M. C. 2013.
Emulsifiers: Effects on quality of fibre-enriched wheat bread. Food and
Bioprocess Technology, 6, 1228-1239.
GOÑI, I., GARCIA-ALONSO, A. & SAURA-CALIXTO, F. 1997. A starch hydrolysis
procedure to estimate glycaemic index. Nutrition Research, 17, 427-437.

REFERENCES
251
GOÑI, I., GARCÍA-DIZ, L., MAÑAS, E. & SAURA-CALIXTO, F. 1996. Analysis of
resistant starch: A method for foods and food products. Food Chemistry, 56, 445-
449.
GONZÁLEZ-MONTELONGO, R., GLORIA LOBO, M. & GONZÁLEZ, M. 2010.
Antioxidant activity in banana peel extracts: Testing extraction conditions and
related bioactive compounds. Food Chemistry, 119, 1030-1039.
GRATZ, S. W., WALLACE, R. J. & EL-NEZAMI, H. S. 2011. Recent perspectives on
the relations between faecal mutagenicity, genotoxicity, and diet. Frontiers in
Pharmacology, 1-9.
GRIGELMO-MIGUEL, N., GORINSTEIN, S. & MARTÍN-BELLOSO, O. 1999.
Characterisation of peach dietary fibre concentrate as a food ingredient. Food
Chemistry, 65, 175-181.
GUJRAL, H. S., SHARMA, B. & KHATRI, M. 2018. Influence of replacing wheat bran
with barley bran on dough rheology, digestibility and retrogradation
behaviour of chapatti. Food Chemistry, 240, 1154-1160.
GUO, G., JACKSON, D. S., GRAYBOSCH, R. A. & PARKHURST, A. M. 2003. Asian
salted noodle quality: Impact of amylose content adjustments using waxy
wheat flour. Cereal Chemistry, 80, 437-445.

REFERENCES
252
HAN, W., MA, S., LI, L., ZHENG, X. & WANG, X. 2019. Impact of wheat bran dietary
fiber on gluten and gluten-starch microstructure formation in dough. Food
Hydrocolloids, 95, 292-297.
HAN, Z., ZENG, X.-A., ZHANG, B.-S. & YU, S.-J. 2009. Effects of pulsed electric fields
(PEF) treatment on the properties of corn starch. Journal of Food Engineering, 93,
318-323.
HAPPI EMAGA, T., ANDRIANAIVO, R. H., WATHELET, B., TCHANGO, J. T. &
PAQUOT, M. 2007. Effects of the stage of maturation and varieties on the
chemical composition of banana and plantain peels. Food Chemistry, 103, 590-
600.
HAPPI EMAGA, T., ROBERT, C., RONKART, S. N., WATHELET, B. & PAQUOT, M.
2008. Dietary fibre components and pectin chemical features of peels during
ripening in banana and plantain varieties. Bioresource Technology, 99, 4346-4354.
HARINI, K., RAMYA, K. & SUKUMAR, M. 2018. Extraction of nano cellulose fibres
from the banana peel and bract for production of acetyl and lauroyl cellulose.
Carbohydrate Polymers, 201, 329-339.
HASLINDA, W. H., CHENG, L. H., CHONG, L. C. & AZIAH, A. A. N. 2009. Chemical
composition and physicochemical properties of green banana (Musa acuminata
× balbisiana Colla cv. Awak) flour. International Journal of Food Sciences and
Nutrition, 60, 232-239.

REFERENCES
253
HERNÁNDEZ-AGUIRRE, M. A., ISLAS-HERNÁNDEZ, J. J., SÁNCHEZ-PARDO, M.
E., RODRÍGUEZ-AMBRIZ, S. L. & OSORIO-DÍAZ, P. 2019. Response surface
methodology for optimization of gluten-free bread made with unripe banana
flour. Journal of Food Measurement and Characterization, 13, 1652-1660.
HO, L. H., ABDUL AZIZ, N. A. & AZAHARI, B. 2013. Physico-chemical characteristics
and sensory evaluation of wheat bread partially substituted with banana (Musa
acuminata X balbisiana cv. Awak) pseudo-stem flour. Food Chemistry, 139, 532-
539.
HO, L. H., TAN, T. C., ABDUL AZIZ, N. A. & BHAT, R. 2015. In vitro starch
digestibility of bread with banana (Musa acuminata X balbisiana ABB cv. Awak)
pseudo-stem flour and hydrocolloids. Food Bioscience, 12, 10-17.
HOFFMANN SARDÁ, F. A., GIUNTINI, E. B., GOMEZ, M. L. P. A., LUI, M. C. Y.,
NEGRINI, J. A. E., TADINI, C. C., LAJOLO, F. M. & MENEZES, E. W. 2016.
Impact of resistant starch from unripe banana flour on hunger, satiety, and
glucose homeostasis in healthy volunteers. Journal of Functional Foods, 24, 63-74.
HOMAYOUNI, A., AMINI KHOOZANI, A., KESHTIBAN, A. K., MORTAZAVIAN,
A. M., ESAZADEH, K. & POURMORADIAN, S. 2014. Resistant starch in food
industry: A changing outlook for consumer and producer. Starch/Staerke, 66,
102-114.

REFERENCES
254
HONG, J., ZENG, X.-A., BUCKOW, R., HAN, Z. & WANG, M.-S. 2016. Nanostructure,
morphology and functionality of cassava starch after pulsed electric fields
assisted acetylation. Food Hydrocolloids, 54, 139-150.
HU, Y., LE LEU, R. K., CHRISTOPHERSEN, C. T., SOMASHEKAR, R., CONLON, M.
A., MENG, X. Q., WINTER, J. M., WOODMAN, R. J., MCKINNON, R. &
YOUNG, G. P. 2015. Manipulation of the gut microbiota using resistant starch
is associated with protection against colitis-associated colorectal cancer in rats.
Carcinogenesis, 37, 366-375.
HUNG, P. V., VIEN, N. L. & LAN PHI, N. T. 2016. Resistant starch improvement of
rice starches under a combination of acid and heat-moisture treatments. Food
Chemistry, 191, 67-73.
HUSSEIN, A. M. S. & IBRAHIM, G. E. 2019. Effects of various brans on quality and
volatile compounds of bread. Foods and Raw Materials, 7, 42-50.
IZIDORO, D. R., SCHEER, A. D. P., HAMINIUK, C. W. I. & SIERAKOWSKI, M. R.
2011. Studies applying green banana pulp. In: COHEN, A. E. (ed.) Bananas:
Nutrition, Diseases and Trade Issues. Nova Science Publishers, Inc.
JEET, P., IMMANUEL, G. & PRAKASH, O. 2015. Effects of blanching on the
dehydration characteristics of unripe banana slices dried at different
temperature. Agricultural Engineering International: CIGR Journal, 17, 168-175.
REFERENCES
255
JENSEN, S., OESTDAL, H., SKIBSTED, L. H., LARSEN, E. & THYBO, A. K. 2011.
Chemical changes in wheat pan bread during storage and how it affects the
sensory perception of aroma, flavour, and taste. Journal of Cereal Science, 53, 259-
268.
JI, L. & SRZEDNICKI, G. 2015. Extraction of aromatic compounds from banana peels.
Acta Horticulturae, 1088, 541-546.
JOSHI, R. V. 2007. Low calorie biscuits from banana peel pulp. Journal of Solid Waste
Technology and Management, 33, 142-147.
JOURDREN, S., MASSON, M., SAINT-EVE, A., PANOUILLÉ, M., BLUMENTHAL,
D., LEJEUNE, P., DÉLÉRIS, I. & SOUCHON, I. 2017. Effect of bread crumb and
crust structure on the in vivo release of volatiles and the dynamics of aroma
perception. Journal of Agricultural and Food Chemistry, 65, 3330-3340.
JUAREZ-GARCIA, E., AGAMA-ACEVEDO, E., SÁYAGO-AYERDI, S. G.,
RODRÍGUEZ-AMBRIZ, S. L. & BELLO-PÉREZ, L. A. 2006. Composition,
digestibility and application in breadmaking of banana flour. Plant Foods for
Human Nutrition, 61, 131-137.
KALE, C. K., KOTECHA, P. M., CHAVAN, J. K. & KADAM, S. S. 2002. Effect of
processing conditions of bakery products on formation of resistant starch.
Journal of Food Science and Technology, 39, 520-524.
REFERENCES
256
KANAZAWA, K. & SAKAKIBARA, H. 2000. High Content of Dopamine, a Strong
Antioxidant, in Cavendish Banana. Journal of Agricultural and Food Chemistry,
48, 844-848.
KAR, A., CHANDRA, P., PRASAD, R., SAMUEL, D. V. K. & KHURDIYA, D. S. 2003.
Comparison of different methods of drying for banana (Dwarf Cavendish)
slices. Journal of Food Science and Technology, 40, 378-381.
KARPPINEN, S. 2003. Dietary fibre components of rye bran and their fermentation in
vitro. VTT Publications.
KAUR, A., SHEVKANI, K., KATYAL, M., SINGH, N., AHLAWAT, A. K. & SINGH,
A. M. 2016. Physicochemical and rheological properties of starch and flour
from different durum wheat varieties and their relationships with noodle
quality. Journal of Food Science and Technology, 53, 2127-2138.
KEBEDE, B. T., GRAUWET, T., TABILO-MUNIZAGA, G., PALMERS, S.,
VERVOORT, L., HENDRICKX, M. & VAN LOEY, A. 2013. Headspace
components that discriminate between thermal and high-pressure high
temperature treated green vegetables: Identification and linkage to possible
process-induced chemical changes. Food Chemistry, 141, 1603-1613.
KHAMSUCHARIT, P., LAOHAPHATANALERT, K., GAVINLERTVATANA, P.,
SRIROTH, K. & SANGSEETHONG, K. 2018. Characterization of pectin
extracted from banana peels of different varieties. Food Science and
Biotechnology, 27, 623-629.

REFERENCES
257
KITTS, D. D. 1994. Bioactive substances in food: Identification and potential uses.
Canadian Journal of Physiology and Pharmacology, 72, 423-434.
KRIS-ETHERTON, P. M., HECKER, K. D., BONANOME, A., COVAL, S. M.,
BINKOSKI, A. E., HILPERT, K. F., GRIEL, A. E. & ETHERTON, T. D. 2002.
Bioactive compounds in foods: Their role in the prevention of cardiovascular
disease and cancer. American Journal of Medicine, 113, 71S-88S.
KRISHNAN, M. & PRABHASANKAR, P. 2010. Studies on pasting, microstructure,
sensory, and nutritional profile of pasta influenced by sprouted finger millet
(eleucina coracana) and green banana (musa paradisiaca) flours. Journal of Texture
Studies, 41, 825-841.
KURHADE, A., PATIL, S., SONAWANE, S. K., WAGHMARE, J. S. & ARYA, S. S.
2016. Effect of banana peel powder on bioactive constituents and
microstructural quality of chapatti: unleavened Indian flat bread. Journal of Food
Measurement and Characterization, 10, 32-41.
KUSUMA, S. A. F., FEBRIANTI, M. & SARASWATI, A. 2018. Comparison of unripe
banana peel of kepok (Musa paradisiaca L.) and klutuk (Musa balbisiana colla):
Phytochemical and anti- dysenteriae activity. Journal of Pharmaceutical Sciences
and Research, 10, 911-914.
LA FUENTE, C. I. A. & TADINI, C. C. 2017. Unripe Banana Flour Produced by Air-
Drying Assisted with Ultrasound - Description of the Mechanisms Involved to

REFERENCES
258
Enhance the Mass Transfer in Two Approaches. International Journal of Food
Engineering, 13, 1-13.
LA FUENTE, C. I. A., ZABALAGA, R. F. & TADINI, C. C. 2017. Combined effects of
ultrasound and pulsed-vacuum on air-drying to obtain unripe banana flour.
Innovative Food Science and Emerging Technologies, 44, 123-130.
LARRAURI, J. A., RUPÉREZ, P., BORROTO, B. & SAURA-CALIXTO, F. 1996. Mango
peels as a new tropical fibre: Preparation and characterization. LWT - Food
Science and Technology, 29, 729-733.
LAZARIDOU, A., DUTA, D., PAPAGEORGIOU, M., BELC, N. & BILIADERIS, C. G.
2007. Effects of hydrocolloids on dough rheology and bread quality parameters
in gluten-free formulations. Journal of Food Engineering, 79, 1033-1047.
LEE, E. H., YEOM, H. J., HA, M. S. & BAE, D. H. 2010. Development of banana peel
jelly and its antioxidant and textural properties. Food Science and Biotechnology,
19, 449-455.
LEWIS, D. A., FIELDS, W. N. & SHAW, G. P. 1999. A natural flavonoid present in
unripe plantain banana pulp (Musa sapientum L. var. paradisiaca) protects the
gastric mucosa from aspirin-induced erosions. Journal of Ethnopharmacology, 65,
283-288.
LI, G., ZENG, J., GAO, H. & LI, X. 2011. Characterization of phosphate monoester
resistant starch. International Journal of Food Properties, 14, 978-987.

REFERENCES
259
LIN, S. Y., CHEN, H. H., LU, S. & WANG, P. C. 2012. Effects of blending of wheat
flour with barley flour on dough and steamed bread properties. Journal of
Texture Studies, 43, 438-444.
LIU, X., LU, K., YU, J., COPELAND, L., WANG, S. & WANG, S. 2019. Effect of purple
yam flour substitution for wheat flour on in vitro starch digestibility of wheat
bread. Food Chemistry, 284, 118-124.
LIU, X., MU, T., SUN, H., ZHANG, M., CHEN, J. & FAUCONNIER, M. L. 2018.
Influence of different hydrocolloids on dough thermo-mechanical properties
and in vitro starch digestibility of gluten-free steamed bread based on potato
flour. Food Chemistry, 239, 1064-1074.
LOONG, C. Y. L. & WONG, C. Y. H. 2018. Chinese steamed bread fortified with green
banana flour. Food Research, 2, 320-330.
MAHINDRAKAR, K. V. & RATHOD, V. K. 2018. Utilization of banana peels for
removal of strontium (II) from water. Environmental Technology and Innovation,
11, 371-383.
MAHLOKO, L. M., SILUNGWE, H., MASHAU, M. E. & KGATLA, T. E. 2019.
Bioactive compounds, antioxidant activity and physical characteristics of
wheat-prickly pear and banana biscuits. Heliyon, 5, e02479.

REFERENCES
260
MAJCHER, M. A., OLSZAK-OSSOWSKA, D., SZUDERA-KOŃCZAL, K. & JELEŃ, H.
H. 2019. Formation of key aroma compounds during preparation of
pumpernickel bread. Journal of Agricultural and Food Chemistry, 1-9.
MALCOMSON, F. C., WILLIS, N. D. & MATHERS, J. C. 2015. Is resistant starch
protective against colorectal cancer via modulation of the WNT signalling
pathway? Proceedings of the Nutrition Society, 74, 282-291.
MANCEBO, C. M., MARTÍNEZ, M. M., MERINO, C., DE LA HERA, E. & GÓMEZ,
M. 2017. Effect of oil and shortening in rice bread quality: Relationship between
dough rheology and quality characteristics. Journal of Texture Studies, 48, 597-
606.
MARANGONI, F. & POLI, A. 2010. Phytosterols and cardiovascular health.
Pharmacological Research, 61, 193-199.
MARTÍNEZ-CASTAÑO, M., LOPERA-IDARRAGA, J., PAZMIÑO-ARTEAGA, J. &
GALLARDO-CABRERA, C. 2019. Evaluation of the behaviour of unripe
banana flour with non-conventional flours in the production of gluten-free
bread. Food Science and Technology International, 0, 1082013219873246.
MARTÍNEZ, M. M., ROMÁN, L. & GÓMEZ, M. 2018. Implications of hydration
depletion in the in vitro starch digestibility of white bread crumb and crust.
Food Chemistry, 239, 295-303.

REFERENCES
261
MAUNAHAN, M. V., NUEVO, P. A. & RESOREZ, J. M. 2018. The role of gender in
maintaining quality and reducing postharvest losses: The case of 'Bungulan'
(Musa genome AAA) bananas for export. Acta Horticulturae.
MENEZES, E. W., TADINI, C. C., TRIBESS, T. B., ZULETA, A., BINAGHI, J., PAK, N.,
VERA, G., DAN, M. C. T., BERTOLINI, A. C., CORDENUNSI, B. R. & LAJOLO,
F. M. 2011. Chemical composition and nutritional value of unripe banana flour
(Musa acuminata, var. Nanicão). Plant Foods for Human Nutrition, 66, 231-237.
MEZIANI, S., JASNIEWSKI, J., GAIANI, C., IOANNOU, I., MULLER, J. M., GHOUL,
M. & DESOBRY, S. 2011. Effects of freezing treatments on viscoelastic and
structural behaviour of frozen sweet dough. Journal of Food Engineering, 107,
358-365.
MIRSAEEDGHAZI, H., EMAM-DJOMEH, Z. & MOUSAVI, S. M. A. 2008. Rheometric
measurement of dough rheological characteristics and factors affecting it.
International Journal of Agriculture and Biology, 10, 112-119.
MOHAMED, A., XU, J. & SINGH, M. 2010. Yeast leavened banana-bread:
Formulation, processing, colour and texture analysis. Food Chemistry, 118, 620-
626.
MONSEN, E. R. 2000. Dietary reference intakes for the antioxidant nutrients: vitamin
C, vitamin E, selenium, and carotenoids. Journal of the American Dietetic
Association, 100, 637-640.

REFERENCES
262
MOONGNGARM, A., TIBOONBUN, W., SANPONG, M., SRIWONG, P.,
PHIEWTONG, L., PRAKITRUM, R. & HUYCHAN, N. 2014. Resistant starch
and bioactive contents of unripe banana flour as influenced by harvesting
periods and its application. American Journal of Agricultural and Biological
Science, 9, 457-465.
MUI, W. W. Y., DURANCE, T. D. & SCAMAN, C. H. 2002. Flavour and texture of
banana chips dried by combinations of hot air, vacuum, and microwave
processing. Journal of Agricultural and Food Chemistry, 50, 1883-1889.
MUNAGAPATI, V. S., YARRAMUTHI, V., KIM, Y., LEE, K. M. & KIM, D. S. 2018.
Removal of anionic dyes (Reactive Black 5 and Congo Red) from aqueous
solutions using Banana Peel Powder as an adsorbent. Ecotoxicology and
Environmental Safety, 148, 601-607.
MUSA, S., IBRAHIM, I., MOHD, A. S., SHAHABUDDIN, M. M. & SULAIMAN, S.
Solar Trap for Banana Drying Method. MATEC Web of Conferences, 2017.
MUSHA, H., CHANDRATILLEKE, G. R., CHAN, S. L. I., BRIDGWATER, J. & YU, A.
B. Effects of size and density differences on mixing of binary mixtures of
particles. AIP Conference Proceedings, 2013. 739-742.
NASCIMENTO-SOUZA, M. A., DE PAIVA, P. G., PÉREZ-JIMÉNEZ, J., DO CARMO
CASTRO FRANCESCHINI, S. & RIBEIRO, A. Q. 2018. Estimated dietary intake
and major food sources of polyphenols in elderly of Viçosa, Brazil: a
population-based study. European Journal of Nutrition, 57, 617-627.

REFERENCES
263
NASRIN, T. A. A., NOOMHORM, A. & ANAL, A. K. 2015. Physico-chemical
characterization of culled plantain pulp starch, peel starch, and flour.
International Journal of Food Properties, 18, 165-177.
NG, K. F., ABBAS, F. M. A., TAN, T. C. & AZHAR, M. E. 2014. Physicochemical,
pasting and gel textural properties of wheat-ripe Cavendish banana composite
flours. International Food Research Journal, 21, 655-662.
NIKHILA, P. S., SATHEESH, N., SREEJITHA, V. S., PILLAI, A. R., SARITHA, A. &
SMITHA CHANDRAN, S. Sustainable Utilization of Bio waste towards the
Green Synthesis of Nanoparticles and its Utility in the Naked Eye Detection of
Metals Coupled with its Larvicidal and Antimicrobial Properties. IOP
Conference Series: Materials Science and Engineering, 2018. 12089.
NILSSON, A., ÖSTMAN, E., PRESTON, T. & BJÖRCK, I. 2008. Effects of GI vs content
of cereal fibre of the evening meal on glucose tolerance at a subsequent
standardized breakfast. European Journal of Clinical Nutrition, 62, 712-720.
NOOR AZIAH, A. A., HO, L. H., NOOR SHAZLIANA, A. A. & BHAT, R. 2012.
Quality evaluation of steamed wheat bread substituted with green banana
flour. International Food Research Journal, 19, 869-876.
OI, R. K., SANTANA, J. C. C., TAMBOURGI, E. B. & JÚNIOR, M. 2013. Feasibility
study for production of green banana flour in a spray dryer. Chemical
Engineering Transactions, 32, 1825-1830.

REFERENCES
264
OLIVEIRA DE SOUZA, N. C., DE LACERDA DE OLIVEIRA, L., RODRIGUES DE
ALENCAR, E., MOREIRA, G. P., SANTOS LEANDRO, E. D., GINANI, V. C. &
ZANDONADI, R. P. 2018. Textural, physical and sensory impacts of the use of
green banana puree to replace fat in reduced sugar pound cakes. LWT - Food
Science and Technology, 89, 617-623.
OLIVEIRA, S. M., RAMOS, I. N., BRANDÃO, T. R. S. & SILVA, C. L. M. 2015. Effect
of Air-Drying Temperature on the Quality and Bioactive Characteristics of
Dried Galega Kale (Brassica oleraceaL. var. Acephala). Journal of Food Processing
and Preservation, 39, 2485-2496.
ONISHI, M., INOUE, M., ARAKI, T., IWABUCHI, H. & SAGARA, Y. 2011. Odorant
transfer characteristics of white bread during baking. Bioscience, Biotechnology
and Biochemistry, 75, 261-267.
OVANDO-MARTINEZ, M., SÁYAGO-AYERDI, S., AGAMA-ACEVEDO, E., GOÑI,
I. & BELLO-PÉREZ, L. A. 2009. Unripe banana flour as an ingredient to increase
the undigestible carbohydrates of pasta. Food Chemistry, 113, 121-126.
OYEWO, O. A., ONYANGO, M. S. & WOLKERSDORFER, C. 2018. Lanthanides
removal from mine water using banana peels nano sorbent. International Journal
of Environmental Science and Technology, 15, 1265-1274.
PANEBIANCO, C., ADAMBERG, K., ADAMBERG, S., SARACINO, C., JAAGURA,
M., KOLK, K., DI CHIO, A. G., GRAZIANO, P., VILU, R. & PAZIENZA, V.
2017. Engineered resistant-starch (ERS) diet shapes colon microbiota profile in

REFERENCES
265
parallel with the retardation of tumour growth in in vitro and in vivo pancreatic
cancer models. Nutrients, 9.
PARK, J. S., LEE, Y. J. & CHUN, S. S. 2010. Quality characteristics of sponge cake
added with banana powder. Journal of the Korean Society of Food Science and
Nutrition, 39, 1509-1515.
PATHAK, P. D., MANDAVGANE, S. A. & KULKARNI, B. D. 2017. Fruit peel waste:
Characterization and its potential uses. Current Science, 113, 444-454.
PELISSARI, F. M., ANDRADE-MAHECHA, M. M., SOBRAL, P. J. D. A. &
MENEGALLI, F. C. 2012. Isolation and characterization of the flour and starch
of plantain bananas (Musa paradisiaca). Starch/Staerke, 64, 382-391.
PEPE, O., VENTORINO, V., CAVELLA, S., FAGNANO, M. & BRUGNO, R. 2013.
Prebiotic Content of Bread Prepared with Flour from Immature Wheat Grain
and Selected Dextran-Producing Lactic Acid Bacteria. Applied and
Environmental Microbiology, 79, 3779-3785.
PEREIRA, A. & MARASCHIN, M. 2015. Banana (Musa spp) from peel to pulp:
Ethnopharmacology, source of bioactive compounds and its relevance for
human health. Journal of Ethnopharmacology, 160, 149-163.
PEREIRA, G. A., ARRUDA, H. S., MOLINA, G. & PASTORE, G. M. 2018. Extraction
optimization and profile analysis of oligosaccharides in banana pulp and peel.
Journal of Food Processing and Preservation, 42, 1-10.

REFERENCES
266
PERERA, A., MEDA, V. & TYLER, R. T. 2010. Resistant starch: A review of analytical
protocols for determining resistant starch and of factors affecting the resistant
starch content of foods. Food Research International, 43, 1959-1974.
PERES, J. 2014. Resistant starch may reduce colon cancer risk from red meat. Journal
of the National Cancer Institute, 106.
PÉREZ-BURILLO, S., PASTORIZA, S., JIMÉNEZ-HERNÁNDEZ, N., D'AURIA, G.,
FRANCINO, M. P. & RUFIÁN-HENARES, J. A. 2018. Effect of food thermal
processing on the composition of the gut microbiota. Journal of Agricultural and
Food Chemistry, 66, 11500-11509.
PEREZ-LOCAS, C. & YAYLAYAN, V. A. 2010. The Maillard reaction and food quality
deterioration. Chemical Deterioration and Physical Instability of Food and Beverages.
Elsevier Inc.
PICO, J., ANTOLÍN, B., ROMÁN, L., BERNAL, J. & GÓMEZ, M. 2019a. Selection of
the most suitable mixture of flours and starches for the improvement of gluten-
free breads through their volatile profiles. European Food Research and
Technology, 245, 1755-1766.
PICO, J., ANTOLÍN, B., ROMÁN, L., GÓMEZ, M. & BERNAL, J. 2018a. Analysis of
volatile compounds in gluten-free bread crusts with an optimised and
validated SPME-GC/QTOF methodology. Food Research International, 106, 686-
695.

REFERENCES
267
PICO, J., GÓMEZ, M., BERNAL, J. & BERNAL, J. L. 2016. Analytical methods for
volatile compounds in wheat bread. Journal of Chromatography A, 1428, 55-71.
PICO, J., KHOMENKO, I., CAPOZZI, V., NAVARINI, L., BERNAL, J., GÓMEZ, M. &
BIASIOLI, F. 2018b. Analysis of volatile organic compounds in crumb and crust
of different baked and toasted gluten-free breads by direct PTR- ToF-MS and
fast-GC-PTR-ToF-MS. Journal of Mass Spectrometry, 53, 893-902.
PICO, J., MARTÍNEZ, M. M., BERNAL, J. & GÓMEZ, M. 2017. Evolution of volatile
compounds in gluten-free bread: From dough to crumb. Food Chemistry, 227,
179-186.
PICO, J., XU, K., GUO, M., MOHAMEDSHAH, Z., FERRUZZI, M. G. & MARTINEZ,
M. M. 2019b. Manufacturing the ultimate green banana flour: Impact of drying
and extrusion on phenolic profile and starch bio accessibility. Food Chemistry,
297, 124990.
PRAKASH, H., CHAUHAN, P. S., GENERAL, T. & SHARMA, A. K. 2018.
Development of eco-friendly process for the production of bioethanol from
banana peel using inhouse developed cocktail of thermo-alkali-stable
depolymerizing enzymes. Bioprocess and Biosystems Engineering, 41, 1003-1016.
PUTRA, H. E., DAMANHURI, E., DEWI, K. & PASEK, A. D. Hydrothermal
carbonization of biomass waste under low temperature condition. MATEC
Web of Conferences, 2018.

REFERENCES
268
QAMAR, S. & SHAIKH, A. 2018. Therapeutic potentials and compositional changes
of valuable compounds from banana- A review. Trends in Food Science and
Technology, 79, 1-9.
RACHMAN, A., BRENNAN, M. A., MORTON, J. & BRENNAN, C. S. 2019. Effect of
egg white protein and soy protein fortification on physicochemical
characteristics of banana pasta. Journal of Food Processing and Preservation, 43,
e14081.
RADOI, P. B., ALEXA, E., RADULOV, I., MORVAY, A., MIHAI, C. S. S. & TRASCA,
T. I. 2015. Total phenolic, cinnamic acids and selected microelements in gluten
free pasta fortified with banana. Revista de Chimie, 66, 1162-1165.
RADÜNZ, M., CAMARGO, T. M., NUNES, C. F. P., PEREIRA, E. D. S., RIBEIRO, J.
A., DOS SANTOS HACKBART, H. C., RADÜNZ, A. F. O., RADÜNZ, A. L.,
GULARTE, M. A. & DA FONSECA BARBOSA, F. 2020. Gluten-free green
banana flour muffins: chemical, physical, antioxidant, digestibility and sensory
analysis. Journal of Food Science and Technology, 7, 1-7.
RAHAIE, S., GHARIBZAHEDI, S. M. T., RAZAVI, S. H. & JAFARI, S. M. 2012. Recent
developments on new formulations based on nutrient-dense ingredients for the
production of healthy-functional bread: a review. Journal of Food Science and
Technology, 51, 2896-2906.
RAHIMI-MOHSENI, M., RAOOF, J. B., OJANI, R., AGHAJANZADEH, T. A. &
BAGHERI HASHKAVAYI, A. 2018. Development of a new paper-based nano-

REFERENCES
269
biosensor using the co-catalytic effect of tyrosinase from banana peel tissue
(Musa Cavendish) and functionalized silica nanoparticles for voltametric
determination of L-tyrosine. International Journal of Biological Macromolecules,
113, 648-654.
RAMLI, S., ALKARKHI, A. F. M., SHIN YONG, Y., MIN-TZE, L. & EASA, A. M. 2009.
Effect of banana pulp and peel flour on physicochemical properties and in vitro
starch digestibility of yellow alkaline noodles. International Journal of Food
Sciences and Nutrition, 60, 326-340.
RAMLI, S., ISMAIL, N., ALKARKHI, A. F. M. & EASA, A. M. 2010. The use of
principal component and cluster analysis to differentiate banana peel flours
based on their starch and dietary fibre components. Tropical Life Sciences
Research, 21, 91-100.
RANNOU, C., VANZEVEREN, E., COURCOUX, P., LE BAIL, A. & PROST, C. 2008.
Study of the Frozen Part-Baked Bread Odour. Consumer Driven Cereal
Innovation: Where Science Meets Industry. Elsevier.
RATNAYAKE, W. S., HOOVER, R. & WARKENTIN, T. 2002. Pea starch:
Composition, structure and properties - A review. Starch/Staerke, 54, 217-234.
RAYO, L. M., CHAGURI E CARVALHO, L., SARDÁ, F. A. H., DACANAL, G. C.,
MENEZES, E. W. & TADINI, C. C. 2015. Production of instant green banana
flour (Musa cavendischii, var. Nanicão) by a pulsed-fluidized bed agglomeration.
LWT - Food Science and Technology, 63, 461-469.

REFERENCES
270
REN, K., ZHANG, W., CAO, S., WANG, G. & ZHOU, Z. 2018. Carbon-Based Fe₃O₄
nanocomposites derived from waste pomelo peels for magnetic solid-phase
extraction of 11 Triazole Fungicides in fruit samples. Nanomaterials, 8, 302.
ROBLES-RAMÍREZ, M. C., FLORES-MORALES, A. & MORA-ESCOBEDO, R. 2012.
Corn tortillas: Physicochemical, structural and functional changes. Maize:
Cultivation, Uses and Health Benefits. Nova Science Publishers, Inc.
RODRÍGUEZ-AMBRIZ, S. L., ISLAS-HERNÁNDEZ, J. J., AGAMA-ACEVEDO, E.,
TOVAR, J. & BELLO-PÉREZ, L. A. 2008. Characterization of a fibre-rich
powder prepared by liquefaction of unripe banana flour. Food Chemistry, 107,
1515-1521.
ROHLEDER, A. R., SCHERF, K. A., SCHIEBERLE, P. & KOEHLER, P. 2019.
Quantitative Analyses of Key Odorants and Their Precursors Reveal
Differences in the Aroma of Gluten-Free Rice Bread and Wheat Bread. Journal
of Agricultural and Food Chemistry, 67, 11179-11186.
ROLIM, P. M., SALGADO, S. M., PADILHA, V. M., LIVERA, A. V. S., ANDRADE, S.
A. C. & GUERRA, N. B. 2011. Glycaemic profile and prebiotic potential "in
vitro" of bread with yacon (Smallanthus sonchifolius) flour. Ciencia e Tecnologia
de Alimentos, 31, 467-474.
ROMAN, L., GOMEZ, M., HAMAKER, B. R. & MARTINEZ, M. M. 2019. Banana
starch and molecular shear fragmentation dramatically increase structurally

REFERENCES
271
driven slowly digestible starch in fully gelatinized bread crumb. Food
Chemistry, 274, 664-671.
RUBEL, I. A., PÉREZ, E. E., MANRIQUE, G. D. & GENOVESE, D. B. 2015. Fibre
enrichment of wheat bread with Jerusalem artichoke inulin: Effect on dough
rheology and bread quality. Food Structure, 3, 21-29.
SAHA, B., BUCKNALL, M. P., ARCOT, J. & DRISCOLL, R. 2018. Profile changes in
banana flavour volatiles during low temperature drying. Food Research
International, 106, 992-998.
SALIM UR, R. & AWAN, J. A. 2011. Flavour of bread and bakery products. Food
Flavours: Chemical, Sensory and Technological Properties. CRC Press.
SALINAS, M. V. & PUPPO, M. C. 2018. Bread staling: changes during storage caused
by the addition of calcium salts and inulin to wheat flour. Food and Bioprocess
Technology, 11, 2067-2078.
SALINAS, M. V., ZULETA, A., RONAYNE, P. & PUPPO, M. C. 2016. Wheat bread
enriched with organic calcium salts and inulin. A bread quality study. Journal
of Food Science and Technology, 53, 491-500.
SÁNCHEZ-PARDO, M. E., ORTIZ-MORENO, A., MORA-ESCOBEDO, R. &
NECOECHEA-MONDRAGÓN, H. 2007. In vitro starch digestibility and
predicted glycaemic index of microwaved and conventionally baked pound
cake. Plant Foods for Human Nutrition, 62, 99-105.

REFERENCES
272
SANCHEZ, D. B. O., PUPPO, M. C., AÑON, M. C., RIBOTTA, P. D., LEÓN, A. E. &
TADINI, C. C. 2014. Effect of maize resistant starch and transglutaminase: A
study of fundamental and empirical rheology properties of pan bread dough.
Food and Bioprocess Technology, 7, 2865-2876.
SANZ-PENELLA, J. M., WRONKOWSKA, M., SORAL-ŚMIETANA, M., COLLAR, C.
& HAROS, M. 2010. Impact of the addition of resistant starch from modified
pea starch on dough and bread performance. European Food Research and
Technology, 231, 499-508.
SARAWONG, C., GUTIÉRREZ, Z. R., BERGHOFER, E. & SCHOENLECHNER, R.
2014a. Effect of green plantain flour addition to gluten-free bread on functional
bread properties and resistant starch content. International Journal of Food Science
and Technology, 49, 1825-1833.
SARAWONG, C., SCHOENLECHNER, R., SEKIGUCHI, K., BERGHOFER, E. & NG,
P. K. W. 2014b. Effect of extrusion cooking on the physicochemical properties,
resistant starch, phenolic content and antioxidant capacities of green banana
flour. Food Chemistry, 143, 33-39.
SEGUCHI, M., TABARA, A., ISEKI, K., TAKEUCHI, M. & NAKAMURA, C. 2014.
Development of gluten-free bread baked with banana (musa spp.) flour. Food
Science and Technology Research, 20, 613-619.

REFERENCES
273
SEGUNDO, C., GIMÉNEZ, A., LOBO, M., ITURRIAGA, L. & SAMMAN, N. 2020.
Formulation and attributes of gluten-free cakes of Andean corn improved with
green banana flour. Food Science and Technology International, 26, 95-104.
SEGUNDO, C., ROMÁN, L., GÓMEZ, M. & MARTÍNEZ, M. M. 2017a. Mechanically
fractionated flour isolated from green bananas (M. cavendishii var. nanica) as a
tool to increase the dietary fiber and phytochemical bioactivity of layer and
sponge cakes. Food Chemistry, 219, 240-248.
SEGUNDO, C., ROMÁN, L., LOBO, M., MARTINEZ, M. M. & GÓMEZ, M. 2017b.
Ripe banana flour as a source of antioxidants in layer and sponge cakes. Plant
Foods for Human Nutrition, 72, 365-371.
SHAFIE, B., CHENG, S. C., LEE, H. H. & YIU, P. H. 2016. Characterization and
classification of whole-grain rice based on rapid visco analyser (RVA) pasting
profile. International Food Research Journal, 23, 2138-2143.
SHARMA, B., GUJRAL, H. S. & SOLAH, V. 2017. Effect of incorporating finger millet
in wheat flour on mixolab behaviour, chapatti quality and starch digestibility.
Food Chemistry, 231, 156-164.
SHARMA, S. K., BANSAL, S., MANGAL, M., DIXIT, A. K., GUPTA, R. K. &
MANGAL, A. K. 2016. Utilization of food processing by-products as dietary,
functional, and novel fiber: A review. Critical Reviews in Food Science and
Nutrition, 56, 1647-1661.

REFERENCES
274
SHEIKH, B. Y., SARKER, M. M. R., KAMARUDIN, M. N. A. & ISMAIL, A. 2017.
Prophetic medicine as potential functional food elements in the intervention of
cancer: A review. Biomedicine and Pharmacotherapy, 95, 614-648.
SILVA, A. A., BARBOSA JUNIOR, J. L. & JACINTHO BARBOSA, M. I. M. 2015. Green
banana flour as a functional ingredient in food products. Ciencia Rural, 45, 2252-
2258.
SILVA, A. R. D., CERDEIRA, C. D., BRITO, A. R., SALLES, B. C. C., RAVAZI, G. F.,
MORAES, G. D. O. I., RUFINO, L. R. A., OLIVEIRA, R. B. S. D. & SANTOS, G.
B. 2016. Green banana pasta diet prevents oxidative damage in liver and kidney
and improves biochemical parameters in type 1 diabetic rats. Archives of
Endocrinology and Metabolism, 60, 355-366.
SILVAS GARCÍA, M. I., RAMÍREZ WONG, B., TORRES CHÁVEZ, P. I., CARVAJAL
MILLAN, E., BELLO-PÉREZ, L. A. & BARRÓN HOYOS, J. M. 2013.
Physicochemical changes in frozen dough and the effect on bread quality: A
review. Interciencia, 38, 332-338.
SINGH, B., SINGH, J. P., KAUR, A. & SINGH, N. 2016. Bioactive compounds in
banana and their associated health benefits - A review. Food Chemistry, 206, 1-
11.
SINGH, S., PARVEEN, N. & GUPTA, H. 2018. Adsorptive decontamination of
rhodamine-B from water using banana peel powder: A biosorbent.
Environmental Technology and Innovation, 12, 189-195.

REFERENCES
275
SLUIMER, P. 2005. Principles of Breadmaking: Functionality of Raw Materials and Process
Steps, American Association of Cereal Chemists.
SOMEYA, S., YOSHIKI, Y. & OKUBO, K. 2002. Antioxidant compounds from bananas
(Musa Cavendish). Food Chemistry, 79, 351-354.
SOTO-MALDONADO, C., CONCHA-OLMOS, J., CÁCERES-ESCOBAR, G. &
MENESES-GÓMEZ, P. 2018. Sensory evaluation and glycaemic index of a food
developed with flour from whole (pulp and peel) overripe banana (Musa
Cavendishi) discards. LWT - Food Science and Technology, 92, 569-575.
SRI SURYANINGSIH, N. L., WAHIDA & PASARIBU, Y. P. 2018. Bioethanol from
Dewaka banana waste as sustainable energy and environmental management.
International Journal of Mechanical Engineering and Technology, 9, 787-793.
STEEL, C. J., DA SILVA, C. B., ORMENESE, R. C. S. C., CLERICI, M. T. P. S.,
CÁCERES, M. C. & CHANG, Y. K. 2013. Technological evaluation of pan bread
produced with the addition of commercial resistant starch or unripe banana
flour. Bread Consumption and Health. Nova Science Publishers, Inc.
STEGLICH, T., BERNIN, D., RÖDING, M., NYDÉN, M., MOLDIN, A., TOPGAARD,
D. & LANGTON, M. 2014. Microstructure and water distribution of
commercial pasta studied by microscopy and 3D magnetic resonance imaging.
Food Research International, 62, 644-652.

REFERENCES
276
SULAIMAN, S. F., YUSOFF, N. A. M., ELDEEN, I. M., SEOW, E. M., SAJAK, A. A. B.,
SUPRIATNO & OOI, K. L. 2011. Correlation between total phenolic and
mineral contents with antioxidant activity of eight Malaysian bananas (Musa
sp.). Journal of Food Composition and Analysis, 24, 1-10.
SURENDRA BABU, A., MAHALAKSHMI, M. & PARIMALAVALLI, R. 2014.
Comparative study on properties of banana flour, starch and autoclaved starch.
Trends in Carbohydrate Research, 6, 38-44.
TAN, N. & SO, R. C. Biochar from waste banana peels as growth promoter for holy
basil (Ocimum tenuiflorum) and chili pepper (Capsicum annuum).
TechConnect Briefs 2018 - Advanced Materials, 2018. 239-241.
TARVAINEN, V., RANTA-MAUNUS, A., HANHLJÄRVI, A. & FORSÉN, H. 2006.
The effect of drying and storage conditions on case hardening of scots pine and
Norway spruce timber. Maderas: Ciencia y Tecnologia, 8, 3-14.
TEMESGEN, F., GABBIYE, N. & SAHU, O. 2018. Biosorption of reactive red dye
(RRD) on activated surface of banana and orange peels: Economical alternative
for textile effluent. Surfaces and Interfaces, 12, 151-159.
THEBAUDIN, J. Y., LEFEBVRE, A. C., HARRINGTON, M. & BOURGEOIS, C. M.
1997. Dietary fibres: Nutritional and technological interest. Trends in Food
Science and Technology, 8, 41-48.

REFERENCES
277
TIBOLLA, H., PELISSARI, F. M., MARTINS, J. T., VICENTE, A. A. & MENEGALLI,
F. C. 2018. Cellulose nanofibers produced from banana peel by chemical and
mechanical treatments: Characterization and cytotoxicity assessment. Food
Hydrocolloids, 75, 192-201.
TOLEDO DE CAMARGO RANZANI, M. R., LUCAZECHI STURION, G. &
HIRONAKA BICUDO, M. 1996. Chemical and biological evaluation of ripe
banana peel. Archivos Latinoamericanos de Nutricion, 46, 320-324.
TORRES, M. D., ARUFE, S., CHENLO, F. & MOREIRA, R. 2017. Coeliac cannot live
by gluten-free bread alone – every once in a while they need antioxidants.
International Journal of Food Science and Technology, 52, 81-90.
TRIBESS, T. B., HERNÁNDEZ-URIBE, J. P., MÉNDEZ-MONTEALVO, M. G. C.,
MENEZES, E. W., BELLO-PEREZ, L. A. & TADINI, C. C. 2009. Thermal
properties and resistant starch content of green banana flour (Musa Cavendishi)
produced at different drying conditions. LWT - Food Science and Technology, 42,
1022-1025.
TURCHIULI, C., FUCHS, M., BOHIN, M., CUVELIER, M. E., ORDONNAUD, C.,
PEYRAT-MAILLARD, M. N. & DUMOULIN, E. 2005. Oil encapsulation by
spray drying and fluidised bed agglomeration. Innovative Food Science and
Emerging Technologies, 6, 29-35.

REFERENCES
278
TÜRKER, B., SAVLAK, N. & KAŞIKCI, M. B. 2016. Effect of green banana peel flour
substitution on physical characteristics of gluten-free cakes. Current Research in
Nutrition and Food Science, 4, 197-204.
VAIDYA, D., SHARMA, A., ABROL, G. S., SHARMA, S. & VAIDYA, M. K. 2016.
Evaluation of technology for low cost drying of banana slices. Indian Journal of
Natural Products and Resources, 7, 176-180.
VAN HUNG, P., LAN PHI, N. T. & VY VY, T. T. 2012. Effect of debranching and
storage condition on crystallinity and functional properties of cassava and
potato starches. Starch - Stärke, 64, 964-971.
VERMEIR, S., HERTOG, M. L. A. T. M., VANKERSCHAVER, K., SWENNEN, R.,
NICOLAÏ, B. M. & LAMMERTYN, J. 2009. Instrumental based flavour
characterisation of banana fruit. LWT - Food Science and Technology, 42, 1647-
1653.
VIENA, V., ELVITRIANA, E. & WARDANI, S. Application of banana peels waste as
adsorbents for the removal of CO2, NO, NOx, and SO2 gases from motorcycle
emissions. IOP Conference Series: Materials Science and Engineering, 2018. 97-
104.
VILARDI, G., DI PALMA, L. & VERDONE, N. 2018. Heavy metals adsorption by
banana peels micro-powder: Equilibrium modelling by non-linear models.
Chinese Journal of Chemical Engineering, 26, 455-464.

REFERENCES
279
VILLAVERDE, J. J., OLIVEIRA, L., VILELA, C., DOMINGUES, R. M., FREITAS, N.,
CORDEIRO, N., FREIRE, C. S. R. & SILVESTRE, A. J. D. 2013. High valuable
compounds from the unripe peel of several Musa species cultivated in Madeira
Island (Portugal). Industrial Crops and Products, 42, 507-512.
VON ATZINGEN, D. A. N. C., MENDONÇA, A. R. A., FILHO, M. M., ALVARENGA,
V. A., ASSIS, V. A., PENAZZO, A. E., MUZETTI, J. H. & REZENDE, T. S. 2015.
Repair of surgical wounds in rats using a 10% unripe Musa sapientum peel gel.
Acta Cirurgica Brasileira, 30, 586-592.
VU, H. T., SCARLETT, C. J. & VUONG, Q. V. 2017. Effects of drying conditions on
physicochemical and antioxidant properties of banana (Musa cavendish) peels.
Drying Technology, 35, 1141-1151.
VU, H. T., SCARLETT, C. J. & VUONG, Q. V. 2018. Phenolic compounds within
banana peel and their potential uses: A review. Journal of Functional Foods, 40,
238-248.
WALISZEWSKI, K. N., APARICIO, M. A., BELLO, L. A. & MONROY, J. A. 2003.
Changes of banana starch by chemical and physical modification. Carbohydrate
Polymers, 52, 237-242.
WANG, J., HUANG, H. H. & CHEN, P. S. 2017a. Structural and physicochemical
properties of banana resistant starch from four cultivars. International Journal of
Food Properties, 20, 1338-1347.

REFERENCES
280
WANG, J., LI, Y. Z., CHEN, R. R., BAO, J. Y. & YANG, G. M. 2007. Comparison of
volatiles of banana powder dehydrated by vacuum belt drying, freeze-drying
and air-drying. Food Chemistry, 104, 1516-1521.
WANG, K., LU, F., LI, Z., ZHAO, L. & HAN, C. 2017b. Recent developments in gluten-
free bread baking approaches: A review. Food Science and Technology, 37, 1-9.
WANG, Y., ZHANG, M. & MUJUMDAR, A. S. 2012. Influence of green banana flour
substitution for cassava starch on the nutrition, colour, texture and sensory
quality in two types of snacks. LWT - Food Science and Technology, 47, 175-182.
YAN, B., SADIQ, F. A., CAI, Y., FAN, D., CHEN, W., ZHANG, H. & ZHAO, J. 2019.
Microbial diversity in traditional type I sourdough and jiaozi and its influence
on volatiles in Chinese steamed bread. LWT - Food Science and Technology, 101,
764-773.
YAN, L., FERNANDO, W. M. A. D. B., BRENNAN, M., BRENNAN, C. S., JAYASENA,
V. & COOREY, R. 2016. Effect of extraction method and ripening stage on
banana peel pigments. International Journal of Food Science and Technology, 51,
1449-1456.
YANG, X. T., ZHANG, Z. Q., JOYCE, D., HUANG, X. M., XU, L. Y. & PANG, X. Q.
2009. Characterization of chlorophyll degradation in banana and plantain
during ripening at high temperature. Food Chemistry, 114, 383-390.

REFERENCES
281
YANGILAR, F. 2015. Effects of green banana flour on the physical, chemical and
sensory properties of ice cream. Food Technology and Biotechnology, 53, 315-323.
YIN, D. T. & ZHAO, X. H. 2017. Impact of exogenous strains on in vitro fermentation
and anti-colon cancer activities of maize resistant starch and xylo-
oligosaccharides. Starch/Staerke, 69, 125-133.
YU, D., WANG, L. & WU, M. 2018. Simultaneous removal of dye and heavy metal by
banana peels derived hierarchically porous carbons. Journal of the Taiwan
Institute of Chemical Engineers, 57, 543-553.
ZAIDUL, I. S. M., ABSAR, N., KIM, S. J., SUZUKI, T., KARIM, A. A., YAMAUCHI, H.
& NODA, T. 2008. DSC study of mixtures of wheat flour and potato, sweet
potato, cassava, and yam starches. Journal of Food Engineering, 86, 68-73.
ZANDONADI, R. P., BOTELHO, R. B. A., GANDOLFI, L., GINANI, J. S.,
MONTENEGRO, F. M. & PRATESI, R. 2012. Green banana pasta: An
alternative for gluten-free diets. Journal of the Academy of Nutrition and Dietetics,
112, 1068-1072.
ZHANG, D., MU, T. & SUN, H. 2019. Effects of starch from five different botanical
sources on the fermentation and gelatinization properties of starch–gluten
model doughs. Starch/Staerke, 71, 156-162.
ZHANG, P. & HAMAKER, B. R. 2012. Banana starch structure and digestibility.
Carbohydrate Polymers, 87, 1552-1558.

REFERENCES
282
ZHANG, P., WHISTLER, R. L., BEMILLER, J. N. & HAMAKER, B. R. 2005. Banana
starch: Production, physicochemical properties, and digestibility - A review.
Carbohydrate Polymers, 59, 443-458.
ZHENG, Z., STANLEY, R., GIDLEY, M. J. & DHITAL, S. 2016. Structural properties
and digestion of green banana flour as a functional ingredient in pasta. Food
and Function, 7, 771-780.
ZHU, X., LI, Q., LI, J., LUO, J., CHEN, W. & LI, X. 2018. Comparative study of volatile
compounds in the fruit of two banana cultivars at different ripening stages.
Molecules, 23, 79-88.