Embed Size (px)
Citation preview

UNIVERSITY OF NAIROBI
DEPARTMENT OF MECHANICAL & MANUFACTURING
ENGINEERING
A Final Year Project Submitted in Partial Fulfilment of the Requirement for the
Award of the Degree of Bachelor of Science in Mechanical Engineering
TITLE: PREPARATION AND CHARACTERISATION OF ACTIVATED CARBON
FROM LOCALLY AVAILABLE MATERIALS, VIZ. COCONUT SHELLS
PROJECT CODE: KG/O1/2012
SUPERVISOR: DR. KAMAU GACHIGI
AUTHORS:
I. LEMARO FEREITI ANGELO F18/1896/2007
II. ROTICH BENARD KIPKEMOI. F18/1858/2007
DATE DUE: 21ST MAY 2012

i
DECLARATION The work herein is original and to the best of our knowledge, it has never been presented
anywhere else for academic or any other purpose.
----------------------------------- -----------------------------------
Rotich Benard Kipkemoi Lemaro Fereiti Angelo
F18/1858/2007 F18/1896/2007

ii
DEDICATION
We dedicate this work to all the lecturers and support staff of the Department of Mechanical
& Manufacturing Engineering, at the University of Nairobi, for their tireless and selfless
efforts they have spared in making us who we are today.

iii
ACKNOWLEDGEMENT
Our first and foremost gratitude is to our GOD Almighty who has been with us all along and giving us the
strength to complete this project.
We would also like to acknowledge our deepest gratitude to our principal supervisor, Dr. Kamau Gachigi,
for his guidance, constant attention, valuable suggestion, enthusiastic support and personal concern during
the project. Furthermore, our appreciation also goes to our lab technicians; Mr. Njue and Ms. Angela from
the Mechanical Engineering workshop for their time, attention and guidance.
Special thanks go to the Department of Mechanical Engineering for their permission to use the facilities and
equipment available at the Department which aided us to complete this project successfully. We would also
like to extend our sincere appreciation to the Chemistry Department, at the University of Nairobi, for their
support in the tests carried out for the project.
Special appreciation goes to our loving parents especially our moms who brought us here, and are always on
our side, riding along with us on our ups and downs as well as giving us the encouragement to pursue our
dreams. We say a big thank you.
iv
TABLE OF CONTENTS DECLARATION ..................................................................................................................................................... i
DEDICATION ...................................................................................................................................................... ii
ACKNOWLEDGEMENT ...................................................................................................................................... iii
TABLE OF CONTENTS ........................................................................................................................................ iv
ABSTRACT .................................................................................................................................................... vii
LIST OF TABLES ............................................................................................................................................... viii
LIST OF FIGURES ............................................................................................................................................... ix
1. INTRODUCTION ............................................................................................................................................. 1
1.1. The On-going Research ........................................................................................................................... 1
1.2. Statement of Objectives ......................................................................................................................... 1
1.3. Activated Carbon .................................................................................................................................... 2
1.4. Scope of study ......................................................................................................................................... 2
1.5 Organization of the Report ...................................................................................................................... 2
2. LITERATURE REVIEW...................................................................................................................................... 4
2.1. Activated Carbon .................................................................................................................................... 4
2.1.1. Definition of Activated carbon ......................................................................................................... 4
2.1.2. History of Activated Carbon ............................................................................................................. 4
2.1.3. Structure of Activated Carbon ......................................................................................................... 5
2.2. CLASSIFICATION OF ACTIVATED CARBON .............................................................................................. 7
2.2.1. Powdered activated carbon (PAC) ................................................................................................... 7
2.2.2. Granular activated carbon (GAC) ..................................................................................................... 7
2.2.3. Extruded activated carbon (EAC) ..................................................................................................... 8
2.2.4. Impregnated carbon ........................................................................................................................ 8
2.2.5. Polymer coated carbon .................................................................................................................... 8
2.3. APPLICATIONS OF ACTIVATED CARBON ................................................................................................. 8
2.3.1. Metal finishing field ......................................................................................................................... 9
2.3.2. Environmental field .......................................................................................................................... 9
2.3.3. Medical application .......................................................................................................................... 9
2.3.4. Gold Recovery ................................................................................................................................ 10
2.3.5. Alcohol Purification ........................................................................................................................ 10
2.3.6. Water Purification .......................................................................................................................... 10

v
2.4. ADSORPTION MECHANISM ................................................................................................................... 13
2.4.1 Adsorption Capacity ........................................................................................................................ 15
2.5. THE MANUFACTURING PROCESS.......................................................................................................... 15
2.5.1. Raw Materials ................................................................................................................................ 15
2.6. METHODS OF MANUFACTURE ............................................................................................................. 17
2.6.1. Carbonization ................................................................................................................................. 17
2.6.2 Activation ........................................................................................................................................ 17
2.7. METHODS OF ACTIVATION ................................................................................................................... 18
2.7.1. Chemical Activation ....................................................................................................................... 18
2.7.2. Physical Activation ......................................................................................................................... 19
2.7.3 Physiochemical activation ............................................................................................................... 21
2.8. COMPARISON OF PHYSICAL AND CHEMICAL ACTIVATION METHODS ................................................. 22
2.9. TYPES OF KILNS USED ........................................................................................................................... 22
2.10. FACTORS AFFECTING ACTIVATED CARBON PRODUCTION ................................................................. 23
2.10.1 Raw Material ................................................................................................................................. 23
2.10.2. Temperature ................................................................................................................................ 23
2.10.3. Activation time ............................................................................................................................. 24
2.11. PROPERTIES AND QUALITY CONTROL TESTING .................................................................................. 25
2.11.1. Carbon Tetrachloride Activity ...................................................................................................... 26
2.11.2. Surface Area ................................................................................................................................. 26
2.11.3. Mesh Size ..................................................................................................................................... 27
2.11.4. Ash Content .................................................................................................................................. 27
2.11.5. Density ......................................................................................................................................... 27
2.11.6. Iodine number .............................................................................................................................. 27
2.11.7. Methylene Blue ............................................................................................................................ 27
2.11.8. Hardness....................................................................................................................................... 28
2.12. METHODS OF HARDNESS TESTS ......................................................................................................... 28
2.12.1. Ball-pan Hardness Test. ................................................................................................................ 28
2.12.2. The Stirring bar Abrasion Test...................................................................................................... 28
2.13. INTERRELATION OF PROPERTIES ........................................................................................................ 29
2.14. SURFACE EXHAUSTION AND REGENERATION .................................................................................... 29
2.14.1. Surface Exhaustion .......................................................................................................................... 29

vi
2.14.2. Surface Regeneration ...................................................................................................................... 30
2.15. METHODS OF SURFACE REGENERATION ............................................................................................ 30
2.15.1. Thermal regeneration ...................................................................................................................... 30
2.15.2. Chemical regeneration .................................................................................................................... 31
2.15.3. Microbial regeneration .................................................................................................................... 32
2.15.4. Wet air oxidation regeneration ....................................................................................................... 32
2.15.5. Ultrasonic regeneration ................................................................................................................... 33
2.15.6. Electro-chemical regeneration ........................................................................................................ 33
2.15.6.1. Principles of Electrochemical Regeneration ............................................................................. 33
2.15.7. Cathodic Regeneration .................................................................................................................... 34
2.15.8. Anodic Regeneration ....................................................................................................................... 34
3. EXPERIMENTAL SET UP ................................................................................................................................ 35
3.1. APPARATUS ........................................................................................................................................... 35
3.1.1. Dehydration Unit ............................................................................................................................ 35
3.1.2. Electric Furnace .............................................................................................................................. 36
3.1.3. Crucible .......................................................................................................................................... 37
3.1.4. Activation Unit ............................................................................................................................... 38
3.2. EXPERIMENTAL PROCEDURE ................................................................................................................ 39
3.2.1 Dehydration .................................................................................................................................... 39
3.2.2. Pyrolysis.......................................................................................................................................... 39
3.2.3. Activation ....................................................................................................................................... 40
3.2.4. Methylene Blue Test ...................................................................................................................... 40
4. RESULTS, ANALYSIS AND DISCUSSION......................................................................................................... 42
4.1. Pyrolysis Data Analysis .......................................................................................................................... 42
4.1.1. Pyrolysis temperature and weight loss .......................................................................................... 46
4.2. Methylene Blue Adsorption Results ..................................................................................................... 48
4.2.1. Calibration curve ............................................................................................................................ 48
4.2.2. Influence of Activation Temperature on Adsorption ..................................................................... 51
4.2.3. Influence of Activation Time on Adsorption .................................................................................. 53
5. CONCLUSION ............................................................................................................................................... 54
RECOMMENDATIONS ...................................................................................................................................... 55
REFERENCES .................................................................................................................................................... 56

vii
ABSTRACT
Activated carbon has been there with us for centuries. It has wide applications in various industriese.g. in
the water-treatment, dye, sugar refining, among others. All the activated carbon available in Kenya is
imported. Therefore production of activated carbons locally and from locally available materials would be
one of the most lucrative and environment-friendly solutions to this as it would transform negative–valued
wastes to valuable materials. Thus, the main objective of this research was to prepare activated carbons from
coconut shells using a two-step method, and to establish the optimum conditions of production.
Thecarbonization process was carried out at 520°C for 45 minutes, and physical activation carried out at
850oC for a range of soaking times of 30, 60 and 75 minutes.
The activated carbon was prepared under limited supply of oxygen from coconut shells as the precursor.
The coconut shells are the ones from coconut trees scientifically known as cocos nucifera. This species is
the most prevalent in the Kenya’s coast. Three different pyrolysis temperatures were considered with each
three different soaking times investigated. Then also three different activation temperatures were used. The
effect of the different activation conditions was investigated by comparing adsorbance of Methylene blue in
samples which had undergone the different conditions.
The optimum temperature for pyrolysis was obtained by optimizing carbon yield and costs, while optimum
activation temperature and time were obtained by plotting graphs of temperature against Methylene blue
adsorbance and soaking time versus Methylene blue adsorbance respectively. The most suitable conditions
for the preparation of activated carbons were found to be pyrolysis temperature of 520°C for 45 minutes,
and activation temperature of 850oC with steam gasification time 60 minutes.

viii
LIST OF TABLES
Table 1: Comparison of Physical and Chemical Activation ........................................................................... 22
Table 2: Weight Loss Analysis ....................................................................................................................... 42
Table 3: % Yield after 30 Minutes .................................................................................................................. 43
Table 4: % Yield after 45 Minutes .................................................................................................................. 44
Table 5: % Yield after 60 minutes ................................................................................................................... 45
Table 6: Calibration Curve Values .................................................................................................................. 48
Table 7: Variation of Absorbance with Activation Temperature and Time .................................................... 49
Table 8: Concentration of Samples from Calibration Curve ........................................................................... 50
Table 9: Concentration Adsorbed by Activated Carbon Sample .................................................................... 50
Table 10: Sample Adsorbance Values ............................................................................................................. 51

ix
LIST OF FIGURES Figure 1: The Process of Chemical Activation ............................................................................................... 18
Figure 2: The Process of Physical Activation ................................................................................................. 21
Figure 3: Dehydration Unit ............................................................................................................................. 35
Figure 4: Electric Furnace ............................................................................................................................... 36
Figure 5: Pyrolysis Crucible ............................................................................................................................ 37
Figure 6: Activation Unit ................................................................................................................................ 38
Figure 7: Chart of % Yield after 30 minutes ................................................................................................... 43
Figure 8: Chart of % Yield after 45 minutes ................................................................................................... 44
Figure 9: Chart of % Yield after 60 minutes ................................................................................................... 45
Figure 10: Graph of Weight Loss against Pyrolysis Temperature, 30 minutes .............................................. 46
Figure 11: Graph of Weight Loss against Pyrolysis Temperature, 45 minutes .............................................. 46
Figure 12: Graph of Weight Loss against Pyrolysis Temperature, 60 minutes .............................................. 47
Figure 13: Graph of Absorbance against concentration .................................................................................. 49
Figure 14: Graph Methylene Blue Adsorbed against Activation Temperature ............................................... 52
Figure 15: Graph of Methylene Blue Adsorbed against Activation Time ...................................................... 53

1
1. INTRODUCTION
1.1. The On-going Research
There has been an on-going research on the Production and Characterization of Activated Carbon from
locally available precursors at the University of Nairobi’s Mechanical Engineering department. The
precursors which have been previously dealt with are tires, coffee husks, coconut shells and rice husks.
Though coconut shells had been previously studied and had proved to be a formidable source of carbon,
there were loopholes which could be better sealed in a further research. It is against this background that
this project is anchored.
The various studies had been using inert gas, argon, to lock out oxygen in the carbonation process (see
later sections). Since one of the targets of the project was the informal sector popularly known as the Jua
Kali industry, the use of inert gas could turn the whole project costly. The project will look for ways of
circumventing this. Again, there were gaps in the results which we would seek to fill. Some of these will
be captured in the following statement of objectives.
It is worth to remember that the wheel is not being reinvented. Activated Carbon has been with us for
centuries and commercial ones are available, though all are imported in Kenya. However, the project
seeks to use locally available precursors. Also the project wants to involve local manufacturers in the
production of activated carbon to meet the fast growing local market. This is in line with Vision 2030
tenet.
1.2. Statement of Objectives
i. To prepare activated carbons from coconut shells through physical activation under different operating
parameters and preparation variables such as Pyrolysis time and temperature, Activation time and
temperature.
ii. To establish the best conditions for producing activated carbons using coconut shells.
iii. To investigate the physical characteristics and surface chemistry of the prepared activated carbons.

2
1.3. Activated Carbon
Activated charcoal is charcoal that has been treated with oxygen to open up millions of tiny pores
between the carbon atoms. The use of special manufacturing techniques results in highly porous charcoals
that have surface areas of 300-2,000 square metres per gram. These so-called active, or activated,
charcoals are widely used to adsorb odorous or coloured substances from gases or liquids.
1.4. Scope of study
In this study, coconut shells were used as a raw material in preparation of activated carbon adsorbent
using two-step physical process. First, carbonation and then activation using steam. The experiments were
carried out in a furnace which can heat up to a temperature of 1100°C. Initially the shells had been dried
in an oven at 105oC for 24 hours to remove any moisture. Whereas, the activating agent used in the
activation process was steam, the effects of various preparatory conditions including different activation
temperature (750-950 oC) and steam gasification time (up to 1hr) were studied in order to establish the
optimum conditions for producing high surface area activated carbons from the shells.
Tests such as Methylene-Blue and Iodine Number were then used to determine the physical characteristics
and surface chemistry of the prepared activated carbons.
1.5 Organization of the Report
Chapter one includes a brief introduction of the on-going research that is being done at the University of
Nairobi’s Department of Mechanical Engineering on the Production and Characterization of Activated
carbon from coconut shells. The problem statement of the research is stated to give clear objectives of the
present study. The scope of the study covers the research work done to meet these objectives.
Chapter two covers the history of activated carbon and methods of preparation of activated carbons that
have been applied in the course of the experiment. In addition, this chapter also gives a brief explanation
on the physical and chemical properties of activated carbon obtained from the study.
Chapter three provides a list of materials and chemical reagents used in the present research work. It also
gives the general description of the equipment used in the activated carbon preparation system.
It continues with the explanation on the methods and analysis required on preparation of activated carbon
followed by adsorption studies. The description of equipment used is also included in this chapter.

3
Chapter four presents the result obtained from the experiments in the preparation of activated carbon,
characterization of activated carbon and adsorption studies.
Chapter five gives the conclusions of the results obtained in the present study. Some recommendations for
the future studies are also included in this chapter.
4
2. LITERATURE REVIEW
2.1. Activated Carbon
2.1.1. Definition of Activated carbon
Activated carbon includes a wide range of amorphous carbon-based materials prepared to exhibit a high
degree of porosity and an extended interparticulate surface area. It is also a common term used for a group
of adsorbing substances of crystalline form, having large developed internal pore structures that make the
carbon more adsorbent.
2.1.2. History of Activated Carbon
The use of carbon extends so far back into history that its origin is impossible to document. The first
known use of activated carbon dates back to the Ancient Egyptians as early as 1500 B.C. who utilized its
adsorbent properties for purifying oils and medicinal purposes. Charcoal was used for drinking water
filtration by ancient Hindus in India.
Centuries later, the early ocean-going vessels stored drinking water in wooden barrels, the inside of
which had been charred. However, by modern definition the carbon used in these applications could not
truly be described as “activated”. By the early 19th century both wood and bone charcoal was in large-
scale use for the decolourization and purification of cane sugar.
The first documented use of activated carbon in a large scale water treatment application was in 19th-
century England, where it was used to remove undesirable odours and tastes from drinking water. In
recent years, the use of activated carbon for the removal of priority organic pollutants has become very
common. Today, hundreds of brands of activated carbon are manufactured for a large variety of purposes.
The largest market for activated carbon is currently in the municipal water purification industry, where
charcoal beds have been used for the dual purpose of physical filtration and sorption. In fact, activated
carbon filters are used today in drinking water treatment to remove the natural organic compounds (i.e.
tannins) that produce carcinogenic chlorinated by-products during chlorine disinfection of water. In
wastewater treatment, activated carbon is usually used as a filter medium in tertiary (later) treatment
processes. In these applications, carbon filters are usually quite effective in removing low concentrations
of organic compounds, as well as some inorganic metals.
In addition to its drinking water and wastewater treatment applications, activated carbon is used today for
many other purposes.
5
Some other common uses are: corn and cane sugar refining, gas adsorption, dry cleaning recovery
processes, pharmaceuticals, fat and oil removal, electroplating, alcoholic beverage production, and as
nuclear power plant containment systems.
2.1.3. Structure of Activated Carbon
In order to explain the capabilities of activated carbon, an appreciation of its structure is most useful.
Much of the literature quotes a modified graphite-like structure; the modification resulting from the
presence of micro crystallites, formed during the carbonization process, which during activation, have
their regular bonding disrupted causing free valencies which are very reactive. In addition, the presence of
impurities and process conditions influence the formation of interior vacancies, in the microcrystalline
structures.
Such theory generally explains pores as the result of faults in crystalline structures. However, more recent
research studies provide a more feasible explanation of the carbon structure.
The generally accepted graphite-like structure theory falls down since the hardness of activated carbon is
not in keeping with the layered structure of graphite. Furthermore, the manufacturing conditions are
different; in particular the temperature range utilized for activated carbon production is lower than that
required for graphitization.
Supporters of the graphite-like structure generally only explain the modified microcrystalline structure
and ignore photographic and other methods of examining the residual macro structure. High
magnification electron scanning microscopy, at 20,000x magnification, has revealed the presence of
residual cellular structures. These were previously unseen and unsuspected, except in the case of wood-
based activates which have sufficiently open structures visible to the naked eye.
Cellular units are built from sugars, the most important being glucose. Sugars ultimately will build to
cellulose (the most important single unit in cellular construction) and cellulose polymers cross-link to
form the wall of individual plant cells. Glucose units are wound into very tight helical spirals and under
polarized light, these exhibit anisotropy - demonstrating the presence of crystalline structures. Although
not as yet proven, it has been postulated that in the areas of maximum strain in cellulose chains it is
conceivable that smaller crystalline units could be produced. In addition to cellulose, other materials also
exist in cell wall structure. Hemi-cellulose, which undergoes degradation more easily than cellulose and
Lignin (the structure of which is still unproven) also exists and this is the most resistant to oxidation.

6
Most theories attribute the structure of activated carbon to be aromatic in origin, thus, allowing the carbon
structure itself to be described as aromatic in order to explain active centres, etc. Structures of the size of
cell dimensions obviously do not influence physical adsorption but illustrate that the only material
available for oxidation lies within the cell walls themselves.
Final activates consist almost entirely of elemental carbon together with residual ash which, in the case of
wood and coconut, originate from minerals within the vessels of living tissues; silica being the only
constituent actually incorporated within the cell wall tissue matrix. The ash content of coal is of different
composition and due to intrusion of inorganic materials during coalification. Thus, the overall structure
consists of a modified cellular-like configuration with varying ash components depending on the
particular raw material.
The cellular-like structure theory offers a logical explanation for the differences in apparent density
between activates of wood, coal and coconut. Wood activates have a very open structure with thin wall
cells whereas coconut activates show very thick walls with many pits.
It is known that the carbonization and activation processes destroy, to varying degrees, intercellular walls
and sieve plates between cells. The end result on wood is a very open, sponge-like macrostructure
seriously reducing the probability of adsorbate contact with cell walls. Activation of coconut produces a
composition of rod-like cells in very close contact and large surface cavities are formed by destruction of
dividing walls but these are shallow and do not extend through the activates granule.
The coconut activates thus differ significantly from wood activates in mechanical strength and density.
Coconut activates exhibit extensive micro pore volume, whereas wood activates have a definite trend to
Mesopores/macro pores and a corresponding change in their basic properties. In the case of coal based
carbons, pre-treatment of the raw coal is necessary in order for it to be processed, since raw coal swells
during heating to produce coke-like structures. Control of this is achieved by first grinding the raw coal
and mixing it with various additives, such as pitch, before it is introduced to the activation furnace.
However, the grinding process destroys the mechanical strength of coal - therefore, ground coal is
reconstituted into briquettes prior to processing. Despite such pre-treatment, mercury penetration data for
coal activates support the presence of structures similar to those identified in activates of wood and
coconut, but to date no detection of residual plant structures has been found in coal activates.

7
Isotherm determinations reveal extensive micro pore structures, although coal activates’ pore spectra are
different to those of coconut activates with a tendency toward Meso pores at lower activation.
The most reliable carbon structure model suggested to date is similar to that of polyamantane (C66 H59)
which allows for a large degree of non-aromaticity, electron transfer and resonance.
Progressive activation would tend to increase the number of active sites, and in turn the surface activity,
similar to observed reactions with higher activates.
2.2. CLASSIFICATION OF ACTIVATED CARBON
Activated carbons are complex products which are difficult to classify on the basis of their behaviour,
surface characteristics and preparation methods. The types of activated carbon available in the current
market are powder, granular and pellet. It is classified according to its particle sizes and shape, and each
type has its specific application. However, some broad classification is made for general purpose based on
their physical characteristics.
2.2.1. Powdered activated carbon (PAC)
The size of powder activated carbon is less than 100µm in size with an average diameter between 15 and
25 µm. Thus, they present a large internal surface with a small diffusion distance.
PAC is made up of crushed or ground carbon particles, 95–100% of which will pass through a designated
mesh sieve or sieve. Powdered activated carbons are mainly used in liquid phase adsorption and flue gas
treatment. In wastewater treatment, the most common used of powdered activated carbon is in the
secondary treatment called powdered activated carbon treatment process.
PAC is not commonly used in a dedicated vessel, owing to the high head loss that would occur. PAC is
generally added directly to other process units, such as raw water intakes, rapid mix basins, clarifiers, and
gravity filters.
2.2.2. Granular activated carbon (GAC)
Granular activated carbon has a relatively larger particle size compared to powdered activated carbon and
consequently, presents a smaller external surface. Diffusion of the adsorbate is thus an important factor.
These carbons are therefore preferred for all adsorption of gases and vapours as their rate of diffusion are
faster. Granulated carbons are used for water treatment, deodorization and separation of components of
flow system. GAC can be either in the granular form or extruded. GAC is designated by sizes such as
8×20, 20×40, or 8×30 for liquid phase applications and 4×6, 4×8 or 4×10 for vapour phase applications.

8
2.2.3. Extruded activated carbon (EAC)
Extruded activated carbon combines powdered activated carbon with a binder, which are fused together
and extruded into a cylindrical shaped activated carbon block with diameters from 0.8 to 130 mm. These
are mainly used for gas phase applications because of their low pressure drop, high mechanical strength
and low dust content.
2.2.4. Impregnated carbon
Porous carbons containing several types of inorganic impregnate such as iodine, silver, cations such as Al,
Mn, Zn, Fe, Li, and Ca have also been prepared for specific application in air pollution control especially
in museums and galleries. Due to antimicrobial/antiseptic properties, silver loaded activated carbon is
used as an adsorbent for purification of domestic water. Drinking water can be obtained from natural
water by treating the natural water with a mixture of activated carbon and Al (OH) 3, a flocculating agent.
Impregnated carbons are also used for the adsorption of H2S and thiols. Adsorption rates for H2S as high
as 50% by weight have been reported.
2.2.5. Polymer coated carbon
This is a process by which a porous carbon can be coated with a biocompatible polymer to give a smooth
and permeable coat without blocking the pores. The resulting carbon is useful for hemoperfusion i.e. a
treatment technique in which large volumes of the patient's blood are passed over an adsorbent substance
in order to remove toxic substances from the blood.
2.3. APPLICATIONS OF ACTIVATED CARBON
Activated carbon is used in gas purification, gold purification, metal extraction, water purification,
medicine, sewage treatment, air filters in gas masks and respirators, filters in compressed air and many
other applications. Recently Activated Carbon filters have gained popularity among recreational users of
Cannabis, and other smoking herbs for their use in effectively filtering out "Tar" from the smoke. Some of
the applications include:-

9
2.3.1. Metal finishing field
This is one major industrial application of activated carbon in the metal finishing field. It is very widely
employed for purification of electroplating solutions. For example, it is a main purification technique for
removing organic impurities from bright nickel plating solutions. A variety of organic chemicals are
added to plating solutions for improving their deposit qualities and for enhancing properties like
brightness, smoothness, ductility, etc. Due to passage of direct current and electrolytic reactions of anodic
oxidation and cathodic reduction, organic additives generate unwanted break down products in solution.
Their excessive build up can adversely affect the plating quality and physical properties of deposited
metal. Activated carbon treatment removes such impurities and restores plating performance to the
desired level. Activated carbon, in 50% w/w combination with celite, is used as stationary phase in low
pressure chromatographic separation of carbohydrates using ethanol solutions (5–50%) as mobile phase in
analytical or preparative protocols.
2.3.2. Environmental field
Here, activated carbon adsorption has numerous applications in removing pollutants from air or water
streams both in the field and in industrial processes such as spill cleanup, groundwater remediation,
drinking water filtration, air purification, volatile organic compounds capture from painting, dry cleaning,
gasoline dispensing operations, and other processes.
2.3.3. Medical application
In medical applications activated carbon is used to treat poisonings and overdoses following oral
ingestion. It is thought to bind to poison and prevent its absorption by the gastrointestinal tract.
In cases of suspected poisoning, medical personnel administer activated charcoal on the scene or at a
hospital's emergency department. Dosing is usually empirical at 1 gram/kg of body mass (for adolescents
or adults, gives 50-100g), usually given only once, but depending on the drug taken, it may be given more
than once. In rare situations activated charcoal is used in Intensive Care to filter out harmful drugs from
the blood stream of poisoned patients. Activated charcoal has become the treatment of choice for many
poisonings, and other decontamination methods such as ipecac-induced emesis or stomach pumping are
now used rarely.

10
2.3.4. Gold Recovery
Activated carbon acts as a sponge to aurocyanide and other complex ions in solution. Carbon particles
which are much larger than the ore particle size can be mixed with the ore and cyanide solution. When
this is applied to gold extraction, the gold cyanide complex is adsorbed onto the carbon until it comes to
equilibrium with the gold solution. Since the carbon particles are much larger, they can easily be
separated from the slurry by screening using a wire mesh. The gold is then reactivated and returned to the
circuit.
2.3.5. Alcohol Purification
Activated carbon filters can be used to remove organic impurities from alcohols (vodka and whiskey) that
affect colour, taste, and odour increasing its purity.
Some other common uses included corn and cane sugar refining, dry cleaning recovery processes, fat and
oil removal, catalyst support, battery electrodes and super-capacitors.
2.3.6. Water Purification
Activated carbon water filters have been used in home water purification systems primarily to remove
taste and odour. Taste and odour, although undesirable, are generally not considered unhealthy. In recent
years, however, activated carbon filters have been used to remove some of the contaminants that have
been discovered in water supplies. Activated carbon is most effective at removing organic compounds
such as volatile organic compounds, pesticides and benzene. It can also remove some metals, chlorine and
radon. As with any treatment system, it cannot remove all possible drinking water contaminants.
Because Activated carbon systems are limited in the types of compounds they can effectively remove, it is
essential that the home owner determine which water contaminants are present before using such a system
thus results in the need of water analysis.
2.3.6.1. Activated Carbon Filters
Home Activated carbon treatment systems are quite simple. The activated carbon is normally packaged in
filter cartridges that are inserted into the purification device. Water needing treatment passes through the
cartridge contacting the AC on its way to the faucet.

11
AC filters eventually become fouled with contaminants and lose their ability to adsorb pollutants. At this
time, they need to be replaced OR regenerated.
Purified Water Contaminated Water
AC filter
An AC filter must be deep enough so that the pollutants will adsorb to the AC in the time it takes the
water to move through the filter. The appropriate filter depth depends on the flow rate of water through
the filter. The slower the flow rate, the better the removal.
As the contaminated water stream passes through a confined bed of activated carbon, a dynamic condition
develops which establishes a mass transfer zone. This “mass transfer zone” is defined as the carbon bed
depth required to reduce the contaminant concentration from the initial to the final level, at a given flow
rate.

12
The next figure shows these sections,
INFLUENT
EQUILIBRIUM ZONE
(Zone of Exhaustion)
BED
DEPHT MASS TRANSFER ZONE
(MTZ)
UNUSED CARBON
EFFLUENT
As the mass transfer zone (MTZ) moves through a carbon bed and reaches its exit boundary,
contamination begins to show in the effluent. This condition is classified as “breakthrough” and the
amount of material adsorbed is considered the breakthrough capacity. If the bed continues to be exposed
to the water stream, the mass transfer zone will pass completely through the bed and the effluent
contaminant level will equal the influent. At that point, saturation capacity is reached. The saturated
capacity is usually represented by an isotherm.
To take full advantage of the adsorption capacity difference between breakthrough and saturation, several
carbon beds are often operated in series.
This allows the mass transfer zone to pass completely through the first bed prior to its removal from
service. Effluent quality is maintained by the subsequent beds in the series.

13
When sizing an activated carbon system, it is necessary to choose an appropriate contact time for the
waste water and the carbon. EBCT (Empty Bed Contact Time) is the terminology used to describe this
parameter. EBCT is defined as the total volume of the activated carbon bed divided by the liquid flow rate
and is usually expressed in minutes.
The appropriate EBCT for a particular application is related to the rate of adsorption for the organic
compound to be removed. While this rate will vary for individual applications, experience has shown that
for most low concentration dissolved organics, an EBCT contact time of 10 to 15 minutes is normally
adequate.
2.4. ADSORPTION MECHANISM
Activated carbon can be considered as a material of phenomenal surface area made up of millions of
pores - rather like a “molecular sponge”. The process by which such a surface concentrates fluid
molecules by chemical and/or physical forces is known as Adsorption. This is a process whereby fluid
molecules are taken up by a liquid or solid and distributed throughout that liquid or solid.
In the physical adsorption process, molecules are held by the carbon’s surface by weak forces known as
Van Der Waals Forces resulting from intermolecular attraction. The carbon and the adsorbate are thus
unchanged chemically. However, in the process known as Chemisorption, molecules chemically react
with the carbon’s surface (or an impregnate on the carbon’s surface) and are held by much stronger forces
- chemical bonds.
In general terms, to affect adsorption it is necessary to present the molecule to be adsorbed to a pore of
comparable size. In this way the attractive forces coupled with opposite wall effect will be at a maximum
and should be greater than the energy of the molecule. For example, a fine pored coconut shell carbon has
poor decolorizing properties because colour molecules tend to be larger molecular species and are thus
denied access to a fine pore structure.
In contrast, coconut shell carbons are particularly efficient in adsorbing small molecular species. Krypton
and Xenon, for instance, are readily adsorbed by coconut shell carbon but readily adsorbed from large
pored carbons such as wood. Maximum adsorption capacity is determined by the degree of liquid packing
that can occur in the pores. In very high vapour pressures, multilayer adsorption can lead to capillary
condensation even in Meso pores (25A).
If adsorption capacity is plotted against pressure (for gases) or concentration (for liquids) at constant
temperature, the curve so produced is known as an Isotherm. Adsorption increases with increased pressure

14
and also with increasing molecular weight, within a series of a chemical family. Thus, methane (CH4) is
less easily adsorbed than propane (C3H8). This is a useful fact to remember when a particular system has a
number of components. After equilibrium, it is generally found that, all else being equal; the higher
molecular weight species of a multi-component system are preferentially adsorbed. Such a phenomenon is
known as competitive or preferential adsorption - the initially adsorbed low molecular weight species
desorbing from the surface and being replaced by higher molecular weight species.
Physical adsorption in the vapour phase is affected by certain external parameters such as temperature and
pressure.
The adsorption process is more efficient at lower temperatures and higher pressures since molecular
species are less mobile under such conditions. Such an effect is also noticed in a system where moisture
and an organic species are present. The moisture is readily accepted by the carbon surface but in time
desorbs as the preferred organic molecules are selected by the surface. This usually occurs due to
differences in molecular size but can also be attributable to the difference in molecular charge.
Generally speaking, carbon surfaces dislike any form of charge - since water is highly charged (ionic)
relative to the majority of organic molecules the carbon would prefer the organic to be adsorbed. Primary
amines possess less charge on the nitrogen atom than secondary amines that in turn have less than tertiary
amines. Thus, it is found that primary amines are more readily adsorbed than tertiary amines.
High levels of adsorption can be expected if the adsorbate is a reasonably large bulky molecule with no
charge, whereas a small molecule with high charge would not be expected to be easily adsorbed.
Molecular shape also influences adsorption but this is usually of minor consideration.
In certain situations, regardless of how the operating conditions can be varied, some species will only be
physically adsorbed to a low level. (Examples are ammonia, sulphur dioxide, hydrogen sulphide, and
mercury vapour and methyl iodide). In such instances, the method frequently employed to enhance a
carbon’s capability is to impregnate it with a particular compound that is chemically reactive towards the
species required to be adsorbed.
Since carbon possesses such a large surface (a carbon granule the size of a “quarter” has a surface area in
the order of 0.5 square miles!) coating of this essentially spreads out the impregnate over a vast area. This,
therefore, greatly increases the chance of reaction since the adsorbate has a tremendous choice of reaction
sites. When the adsorbate is removed in this way the effect is known as Chemisorption.

15
2.4.1 Adsorption Capacity
The specific capacity of a granular activated carbon to adsorb organic compounds is related to: molecular
surface attraction, the total surface area available per unit weight of carbon, and the concentration of
contaminants in the wastewater stream. The basic instrument for evaluating activated carbon use is the
adsorption isotherm. The isotherm represents an empirical relationship between the amount of
contaminant adsorbed per unit weight of carbon and its equilibrium water concentration.
This relationship can be expressed in the form:
X/M = KC1/n
Where:
X/M = Amount of contaminant adsorbed per unit weight of carbon
C = Concentration of contaminant in the water stream
K, n = Empirical constants particular to the contaminant
The constants K and n are determined by plotting the logarithms of experimental results with the
concentration of contaminant on the X axis and the amount of contaminant adsorbed on the y axis.
The slope of the line developed is equal to 1/n and the intercept equal to K. These dimensionless,
empirical constants are useful for comparing the adsorption capacities for different compounds or for
assessing the adsorption capacities of various activated carbons.
2.5. THE MANUFACTURING PROCESS
2.5.1. Raw Materials
It has already been stated that essentially any carbonaceous material can potentially be activated. In
addition to the more common raw materials discussed earlier, others can include waste tires, phenol
formaldehyde resin, rice husks, pulp mill residues, corn cobs, coffee beans, coconut shells and bones.
Present total annual world production capacity is estimated at 300,000 tons: available as granular,
extruded or powdered product. Most of the developed nations have facilities to activate coconut shell,
wood and coal. Third world countries have recently entered the industry and concentrate on readily
available local raw materials such as wood and coconut shell.

16
2.5.1.1 Coconut shells
They are obtained from the coconut tree scientifically as Cocosnucifera. This is the species prevalent in
the Kenya’s coast. It contains about 75% volatile matters that are removed, largely at source by partial
carbonization, to minimize transport costs. The cellulosic structure of the shell determines the end product
characteristics, which (at 30-40% yield on the carbonized basis) is a material of very high internal surface
area consisting of pores and capillaries of fine molecular dimensions. The ash content is normally low and
composed mainly of alkalis and silica.
2.5.1.2 Coal
Coal is also a readily available and reasonably cheap raw material. The obtained activate depends on the
type of coal used and its initial processing prior to carbonization and activation. It is a normal procedure
to grind the coal and reconstitute it into a form suitable for processing, by use of a binder such as pitch,
before activation. (This is typical for extruded or pelletized carbon). An alternative method is to grind the
coal and utilize its volatile content to fuse the powder together in the form of a briquette. This method
allows for blending of selected materials to control the swelling power of the coals and prevents coking. If
the coal is allowed to “coke”, it leads to the production of an activate with an unacceptably high
proportion of large pores. Blending of coals also allows a greater degree of control over the structure and
properties of the final product.
2.5.1.3 Wood
Wood may be activated by one of two methods, i.e. physical (steam) or chemical activation, depending on
the desired product. A common chemical activator is phosphoric acid, which produces a char with a large
surface area suitable for decolonization applications. The carbon is usually supplied as a finely divided
powder which since produced from waste materials such as sawdust, is relatively cheap and can be used
on a “throw-away” basis.
Since activated carbon is manufactured from naturally occurring raw materials, its properties will
obviously be variable. In order to minimize variability it is necessary to be very selective in raw material
source and quality and practice a high level of manufacturing quality control.
Other commonly used raw materials include; Maize cobs, Coffee husks, Bagasse, Bamboo waste and
from Chicken waste (for making Mercury adsorbent).

17
2.6. METHODS OF MANUFACTURE
Commercial activated carbons are commonly produced from naturally occurring carbonaceous materials
such as coal, wood and peat. Due to the growing need for activated carbons in our society and the high
cost of raw materials and production, many researchers have attempted various wastes such as tires resins,
agricultural by-products and dried sewage sludge, as raw materials and proposed new production methods
for activated carbons with potential applications in many fields. Furthermore, more interest has been
devoted to utilize some wastes of carbonaceous materials such as paper mill sludge, old newspapers and
waste tires. Recently, activated sludge has been produced as a result of wastewater treatment activities
and has emerged as an interesting option for the production of activated carbon. It has been shown that
chemical activation of the sewage sludge with ZnCl2 and H2SO4 produced activated carbon of high
adsorption capacity comparable with that of commercial activated carbon. As we discuss the manufacture
of activated carbon, several terms can be explained for better understanding, these are
2.6.1. Carbonization
The terms carbonization means to convert organic matter to elemental carbon at high temperature in the
absence of oxygen. This process drives off the volatiles matter to form char. The char obtained normally
has low surface area and adsorption capacity since the porous structure is not well developed.
2.6.2 Activation
The activation process creates or increases porosity on the activated carbon Surface. The two main
methods of producing activated carbon can either be physical (steam/carbon dioxide) or chemical
activation, both of which require the use of elevated temperatures.
Chemical activation is achieved by degradation or dehydration of the usually cellulosic raw material
structure. Steam activation, however, initially involves the removal of volatiles, followed by oxidation of
the structure’s carbon atoms.

2.7. METHODS OF ACTIVATION
2.7.1. Chemical Activation
Chemical activation is typically employed when wood products are used as raw materials. It allows both
pyrolysis and activation to be integrated into a single, relatively lower temperature process in the absence
of oxygen. Chemical agents such as phosphoric acid, zinc chloride and pota
dehydrating and stabilizing agents that enhance the development of porous structure in the activated
carbon. The process can be summarized by the flow chart below
Figure 1: The Process of Chemical Activatio
Chemical activation is usually avoided in industrial applications due to environmental concerns and the
costs involved in the treatment of materials with chemicals.
Chemical activation offers several advantages since it is carried out in a single step
carbonization and activation process, performed at lower temperatures, produced a much higher yield than
the physical activation, and therefore resulting in the development of a better porous structure. However,
there are also some disadvantages such as corrosiveness of the process and the washing stage.
Raw
material
preparation
Activation
(Cheminal)
700
18
METHODS OF ACTIVATION
ly employed when wood products are used as raw materials. It allows both
pyrolysis and activation to be integrated into a single, relatively lower temperature process in the absence
of oxygen. Chemical agents such as phosphoric acid, zinc chloride and potassium hydroxide act as
dehydrating and stabilizing agents that enhance the development of porous structure in the activated
carbon. The process can be summarized by the flow chart below
Chemical Activation
Chemical activation is usually avoided in industrial applications due to environmental concerns and the
costs involved in the treatment of materials with chemicals.
Chemical activation offers several advantages since it is carried out in a single step
carbonization and activation process, performed at lower temperatures, produced a much higher yield than
the physical activation, and therefore resulting in the development of a better porous structure. However,
ages such as corrosiveness of the process and the washing stage.
Activation
(Cheminal)
700-1000oC
CoolingActivated
Carbon
ly employed when wood products are used as raw materials. It allows both
pyrolysis and activation to be integrated into a single, relatively lower temperature process in the absence
ssium hydroxide act as
dehydrating and stabilizing agents that enhance the development of porous structure in the activated
Chemical activation is usually avoided in industrial applications due to environmental concerns and the
Chemical activation offers several advantages since it is carried out in a single step combining the
carbonization and activation process, performed at lower temperatures, produced a much higher yield than
the physical activation, and therefore resulting in the development of a better porous structure. However,
ages such as corrosiveness of the process and the washing stage.
Activated
Carbon

19
The thermal treatment scheme of one-step chemical activation can be represented as follows;
Temperature, oC
Activation
Chemical
Impregnation
Time, h
2.7.2. Physical Activation
It is a conventional manufacturing process for activated carbon. The overall process usually consists of
two steps: thermal pyrolysis at a relatively low temperature (typically 400-600oC) in the presence of
nitrogen or helium to break down the cross-linkage between carbon atoms, and activation with activating
gas at 800-1000oC for further development of the porosity. Carbon characteristics are greatly influenced
by the degree of the activation but also by the nature of the activating agent (steam or carbon dioxide)
and process temperature. For the purpose of elevating the degree of burn-off, the activation temperature is
usually higher than 900oC to maintain a sufficiently high reaction rate.

20
The figure below shows the thermal treatment scheme for a two-step physical activation.
Steam
950oC, (1h)
850oC, (1h)
520oC, (45min) 800oC, (1h)
Room
Carbonization Activation Temp.
Since the overall reaction (converting carbon to carbon dioxide) is exothermic it is possible to utilize this
energy and have a self-sustaining process as shown by the equations below
C + H2O (steam) ---> CO + H2 (-31 Kcal)
CO + ½ O2 ---> CO2 (+67 Kcal)
H2 + ½ O2 ---> H2O (steam) (+58 Kcal)
C + O2 ---> CO2 (+94 Kcal)
The reaction that produces H2 retards activation since H2 becomes strongly adsorbed at the active sites on
the carbon surface.
Time
Temperature,oC

It has been shown that steam is a better activating agent compared to CO
surface area. This is because of the small Van der Waal radius of the water molecules. Physical activation
can be illustrated further using the process diagram below
Figure 2: The Process of Physical Activation
2.7.3 Physiochemical activation
Here activated carbon is prepared through a two
carbonized first to produce char under nitrogen flow (inert atmosphere). Then, the chars are chemically
treated. The resulting mixture is then activated in a furnace reactor system at different activation times.
The result is that, the Carbon yield and surface area is slightly higher. This helps to conclude that the
product quality of two-step pyrolysis is better com
the thermal treatment scheme of two
Temperature, oC
Carbonization
Raw
material
preparation
Carbonization
400-600
21
It has been shown that steam is a better activating agent compared to CO2sinc
surface area. This is because of the small Van der Waal radius of the water molecules. Physical activation
can be illustrated further using the process diagram below
Activation
.3 Physiochemical activation
Here activated carbon is prepared through a two-step chemical activation method. The material is
carbonized first to produce char under nitrogen flow (inert atmosphere). Then, the chars are chemically
The resulting mixture is then activated in a furnace reactor system at different activation times.
The result is that, the Carbon yield and surface area is slightly higher. This helps to conclude that the
step pyrolysis is better compared to the single step pyrolysis. Figure below shows
the thermal treatment scheme of two-step chemical activation method applied
Chemical
Carbonization Impregnation Activation
Carbonization
600oC
Activation (physical)
750-950oC
Cooling
since is results to high BET
surface area. This is because of the small Van der Waal radius of the water molecules. Physical activation
step chemical activation method. The material is
carbonized first to produce char under nitrogen flow (inert atmosphere). Then, the chars are chemically
The resulting mixture is then activated in a furnace reactor system at different activation times.
The result is that, the Carbon yield and surface area is slightly higher. This helps to conclude that the
pared to the single step pyrolysis. Figure below shows
step chemical activation method applied
Room
Activation Temp
Time, h
CoolingActivated
Carbon

22
2.8. COMPARISON OF PHYSICAL AND CHEMICAL ACTIVATION METHODS
Table 1: Comparison of Physical and Chemical Activation
Physical activation Chemical activation
Two stage process Single stage process
High energy consumption – expensive Low energy consumption – Cheap
Longer process duration Shorter process duration
High surface area and porosity Modest surface area and porosity
2.9. TYPES OF KILNS USED
A number of different types of kilns and furnaces can be used for carbonization/activation and include
rotary (fired directly or indirectly), vertical multi-hearth furnaces, fluidized bed reactors and vertical
single throat retorts. Each manufacturer has a preference. As an example, production of activated carbon
using a vertical retort is described below.
Raw material is introduced through a hopper on top of the retort and falls under gravity through a central
duct towards the activation zone. As the raw material moves slowly down the retort, the temperature
increases to 800-1000oC and full carbonization takes place. The activation zone, at the bottom of the
retort, covers only a small part of the total area available and it is here that steam activation takes place.
Air is bled into the furnace to convert the product gases, CO and H2 into CO2 and steam which, because of
the exothermic nature of this reaction, reheats the firebricks on the downside of the retort, enabling the
process to be self-supporting. Every 15 minutes or so, the steam injection point is alternated to utilize the
“in situ” heating provided by the Product gas combustion. The degree of activation (or quality) of the
product is determined by the residence time in the activation zone.
The resulting product is in the form of 1” to 3” pieces and requires further processing before being
suitable for its various end uses. This entails a series of crushing and screening operations to produce
specific mesh ranges. Certain products may undergo further processing such as drying, acid washing or
chemical impregnation to satisfy particular requirements.

23
2.10. FACTORS AFFECTING ACTIVATED CARBON PRODUCTION
2.10.1 Raw Material
Most organic materials rich in carbon that do not fuse upon carbonization can be used as a raw material
for the manufacture of activated carbon. In the selection of raw material for the preparation of porous
carbon, several factors are taken into consideration, these include;
• High carbon content
• Low inorganic content (i.e. low ash)
• High density and sufficient volatile content
• The stability of supply in the country
• Potential extent of activation
• Low costs
• Low degradation upon storage
Lignocelluloses materials constitute the more commonly used precursor and account for around 45% of
the total raw materials used for the manufacture of activated carbon. Low content in organic materials is
important to produce activated carbon with low ash content, but relatively high volatile content is also
needed for the control of the manufacturing process.
Raw materials such as coconut shells and fruit stones are very popular for many types of activated carbon
because their relatively high density, hardness and volatile content are ideal for the manufacture of hard
granular activated carbon. Coconut shells together with peach and olive stones are used commercially for
the production of micro porous activated carbons for a very wide range of applications.
2.10.2. Temperature
Temperature especially the final activation temperature affects the characteristics of the activated carbon
produced. Generally, for commercial activated carbon, it is usually conducted at temperature above 800oC
using steam or carbon dioxide. Recently, the researchers have been working out on optimizing the final
activation temperature to economize the cost of production and time. As reported by several authors,
activation temperature significantly affects the production yield of activated carbon and also the surface
area of activated carbon. The temperature used as low as 200oC and up to a high of 1100oC.
The optimum temperatures have been reported to be between 400oC - 600oC by most of the earlier
researchers irrespective of the time of activation and impregnation ratio for different raw material.

24
The increasing of the activation temperature reduces the yield of activated carbon continuously. This is
expected since an increasing amount of volatiles is released at increasing temperature from 600oC- 900oC.
The decreasing trend in yield is paralleled by the increasing activation temperature due to the activation
reaction. These phenomena are also manifested in the decreasing volatile content and increasing fixed
carbon for increasing activation temperature.
It was also suggested previously that, the percentage of volatile matter decreased with an increase of
carbonization temperature and the variation of this parameter was maximum between 200oC-800oC due to
rapid carbonization occurring in this region. It was also unsuitable to prepare activated carbon when
carbonization temperature was more than 800oC since the successive decreased in volatile matter is
minimal above this range.
This was accompanied with an increase of fixed carbon and ash content which may be attributed to the
removal of volatile matter in the material during carbonization process thus leaving behind more stable
carbon as forming minerals. Another notable feature that showed the effect of activation temperature on
the activated carbon is the BET surface area. As the activation temperature increased, the BET surface
area also increased. This may be attributed to the development of new pores as a result of volatile matter
released and the widening of existing ones as the activation temperature became higher.
2.10.3. Activation time
Besides activation temperature, the activation time also affects the carbonization process and the
properties of activate carbon. From previous studies, the activation times normally used were from 1 hour
to 3 hours for palm shell and coconut shells. As the time increased, the percentage of yield decreased
gradually and the BET surface area also increased. This result is possibly due to the volatilization of
organic materials from raw materials which result in formation of activated carbon. The extent of decrease
in product yield is observed to be reducing when excessive activation occurs.

25
2.11. PROPERTIES AND QUALITY CONTROL TESTING
A gram of activated carbon can have a surface area in excess of 500 m2, with 1500 m2 being readily
achievable. Carbon aerogels, while more expensive, have even higher surface areas, and are used in
special applications. Under an electron microscope, the high surface-area structures of activated carbon
are revealed. Individual particles are intensely convoluted and display various kinds of porosity; there
may be many areas where flat surfaces of graphite-like material run parallel to each other, separated by
only a few nanometres or so. These Micro pores provide superb conditions for adsorption to occur, since
adsorbing material can interact with many surfaces simultaneously. Tests of adsorption behaviour are
usually done with nitrogen gas at 77 K under high vacuum, but in everyday terms activated carbon is
perfectly capable of producing the equivalent, by adsorption from its environment, liquid water from
steam at 100 °C and a pressure of 1/10,000 of an atmosphere. James Dewar, the scientist after whom the
Dewar (vacuum flask) is named, spent much time studying activated carbon and published a paper
regarding its absorption capacity with regard to gases. In this paper, he discovered that cooling the carbon
to liquid nitrogen temperatures allowed it to absorb significant quantities of numerous air gases, among
others, that could then be recollected by simply allowing the carbon to warm again and that coconut based
carbon was superior for the effect. He uses oxygen as an example, wherein the activated carbon would
typically absorb the atmospheric concentration (21%) under standard conditions, but release over 80%
oxygen if the carbon was first cooled to low temperatures. Physically, activated carbon binds materials by
van der Waals force or London dispersion force.
Activated carbon does not bind well to certain chemicals, including alcohols, glycols, strong acids and
bases, metals and most inorganics such as lithium, sodium, iron, lead, arsenic, fluorine, and boric acid.
Activated carbon does adsorb iodine very well and in fact the iodine number, mg/g, (ASTM D28 Standard
Method test) is used as an indication of total surface area.
Because of the diverse end use to which a carbon may be applied, it is difficult for manufacturers to
conduct specific tests related to any one application. A manufacturer can undertake some specialty tests
after agreement with the user but this is the exception rather than the rule. The size and number of pores
essentially determine a carbon’s capacity in adsorbing a specific compound. Since pore size and total pore
volume determinations are quite lengthy, they are impractical as a means of quality control during
manufacture. It is, therefore, necessary to relate the carbon’s surface capabilities to a standard reference
molecule.

26
2.11.1. Carbon Tetrachloride Activity
The most widely used method is to measure the carbon’s capacity to adsorb carbon tetrachloride (referred
to as CTC) and express this as a w/w %. This is determined by flowing CTC laden air through a sample of
carbon of known weight, under standard conditions, until constant weight is achieved. The apparatus
essentially consists of a means to control the supply of air pressure, produce a specified concentration of
CTC and control the flow rate of the air/CTC mixture through the sample. The weight of CTC adsorbed is
referred to as the carbon’s % CTC activity. However, this test does not necessarily provide an absolute or
relative measure of the effectiveness of the carbon for other adsorbents or under different conditions.
CTC activity is now universally accepted as a means of specifying the degree of activation or quality of
activated carbon. Commercially available carbons range from 20% to 90% CTC activity.
2.11.2. Surface Area
The internal surface area of a carbon is usually determined by the BET method (Brunauer-Emmett-
Teller). This method utilizes the low-pressure range of the adsorption isotherm of a molecule of known
dimensions (usually nitrogen). This region of the isotherm is generally attributed to monolayer adsorption.
Thus, by assuming the species is adsorbed only one molecule deep on the carbon’s surface, the surface
area may be calculated using the equation:
S = ����
�
Where:
S = specific surface in m2/g
XM = sorption value (weight of adsorbed N2 divided by weight of carbon sample)
N = Avogadro’s number, 6.025 E+23
A = cross-sectional area of nitrogen molecule in angstroms
M = molecular weight of nitrogen
Most manufacturers will specify the surface area of their products but as with CTC activity, it does not
necessarily provide a measure of their effectiveness, merely demonstrating their degree of activation. It is
also impractical to utilize surface area measurement as a means of quality control since this is a very
lengthy procedure.

27
2.11.3. Mesh Size
The physical size, or mesh size, of a carbon must be considered in relation to the flow rate in the system it
is to be used. Naturally, the smaller the carbons mesh size, the greater its resistance to flow. Thus, it is
usual to select the smallest mesh size carbon that will satisfy the pressure drop limitations of the system.
2.11.4. Ash Content
Ash content is less important except where the carbon is used as a catalyst support since certain
constituents of the ash may interfere or destroy the action of precious metal catalysts. Ash content also
influences the ignition point of the carbon. This may be a major consideration where adsorption of certain
solvents is concerned.
2.11.5. Density
The density of carbon is, of course, of great importance to many users in estimating the weight required to
fill a vessel.
2.11.6. Iodine number
This is the most fundamental parameter used to characterize activated carbon performance especially for
liquid phase applications. This is because they preferentially adsorb small molecules. It is a measure of
activity level often reported in mg/g, typical range being 500-1200 mg/g. higher levels of this value
represent high degree of activation.
2.11.7. Methylene Blue
When carbon is activated, different sizes of pores form (as explained earlier) Meso pores being one of
them. This adsorbs medium sized molecules such as Methylene blue molecules (C16H18CL3.3H2O). This
can also be used to measure the extent to which Meso pores structure has been formed.

28
2.11.8. Hardness
The hardness and resistance to attrition of activated carbons is becoming more and more important. The
loosely applied term of “hardness” is somewhat difficult to measure on activated carbon. Three forces can
mechanically degrade an activated carbon - impact, crushing and attrition. Of these three, the force of
attrition, or abrasion, is the most common cause of degradation in actual end use. At the present time,
there are two commonly used methods available to evaluate a carbon’s hardness.
2.12. METHODS OF HARDNESS TESTS
2.12.1. Ball-pan Hardness Test.
A screened, weighed sample of carbon is placed in a special hardness pan with a number of stainless steel
balls and subjected to combined rotating and tapping action for ½ hour. The particle size degradation is
measured by determining the weight of carbon retained on a sieve (with an opening closest to one half the
opening of the sieve defining the minimum nominal particle size of the original sample).
The ball-pan hardness method has been used widely in the past and has a broad history in the activated
carbon industry for measuring the property loosely described as “hardness”. In this context, the test is
useful in establishing a measurable characteristic, conceding that it does not actually measure in-service
resistance to degradation, it can be used to establish comparability of differing batches of the same
material. This test actually applies all of the three forces mentioned earlier, in a variable manner
determined by the size, shape and density of the particles.
2.12.2. The Stirring bar Abrasion Test
In this procedure, a sample of carbon is placed in a cylindrical vessel where an inverted T-shaped stirrer is
turning rapidly at a controlled rate. The percentage reduction in average particle size, resulting from the T
bar action, is recorded after 1 hour. This method measures attrition of the carbon, as long as the particle
size is smaller than a 12 mesh. There is evidence showing that the results of this method are influenced by
particle geometry. Whichever of these tests is performed on carbon it is generally accepted that granular
coconut based carbons show the least rate of physical degradation.
This is possible due to two factors. First, granular coconut carbon is produced from pieces of raw coconut
shell whereas; most other carbons are produced from reconstituted powders. In consequence, carbons
other than coconut based types can only breakdown to a powder or dust.

29
Coconut carbon essentially chips and breaks into smaller pieces and thus degradation to powder, is a
relatively lengthy process. Second, as outlined earlier, the coconut carbon structure is different to other
types, producing a material of relatively high density and physical strength.
2.13. INTERRELATION OF PROPERTIES
There is a relationship between BET surface area and CTC adsorption and this is taken into account when
specifications are formulated. CTC activity, density and ash content are interrelated and provide a simple
means of manufacturing control. As quality, or degree of activation increases, CTC activity and ash
content increase and density decreases. Furthermore, CTC activity being equal, coconut carbons show
higher density and lower ash content than coal based carbons.
Wood based carbons show much lower density than either coal or coconut carbons but ash contents
midway between coal and coconut carbons. Thus, these properties are not only a means of controlling
quality during manufacture but may also assist in determining the raw material and quality of an unknown
carbon.
CTC activity, density, hardness, mesh size and raw material information will enable selection of a suitable
carbon for most common applications (excepting those utilizing Chemisorption as the prime mechanism).
Other important tests include; Molasses number, Phenol value and alkyl benzene sulfonate value (ABS).
All these tests and many others can be carried out but these are usually only relevant to specific end-uses.
2.14. SURFACE EXHAUSTION AND REGENERATION
2.14.1. Surface Exhaustion
In almost every application of activated carbon the surface will eventually become saturated (or
exhausted). This may occur within a few weeks, several months or many years depending on the
conditions of service. Saturation is inevitable since the carbon surface has a finite number of reaction sites
and when these are all occupied an adsorption potential no longer exists. Carbon is a very non-selective
sorbent and has a great affinity for a wide spectrum of organic compounds. Although, a carbon may be
designed and employed to remove a very specific compound from a process stream in doing so it will
undoubtedly adsorb most other components in the stream thus creating a cumulative effect on the rate and
degree of saturation. In fact if so called "clean air" were to be passed through a carbon filter it would
eventually become saturated.

30
2.14.2. Surface Regeneration
In many applications, the surface can be regenerated or reactivated using steam or other heat treatment
processes, thus allowing reuse of the carbon many times over. The regeneration of activated carbons
involves restoring the adsorptive capacity of saturated activated carbon by desorbing adsorbed
contaminants on the activated carbon surface. This principle is used to great advantage in the recovery of
volatile organic solvents.
The desorbed contaminants (i.e. solvents) being recovered from the steam used to strip the carbon surface.
In situations where the adsorbed contaminants are not readily desorbed by steam, thermal reactivation in a
kiln (similar to that used in the activation process) is necessary. In the case of chemically impregnated
carbons, reactivation is seldom possible since the chemisorbed contaminants are chemically fixed on the
carbon’s surface and the impregnate cannot be returned to its original state. Although the predominant
mechanism of an impregnated carbon is one of Chemisorption, some physical adsorption to varying
degrees will also take place. In theory the physically adsorbed species could be removed from a saturated
impregnated carbon by reactivation.
However, the reactivated carbon would remain inactive towards those species requiring a chemisorption
removal mechanism since the impregnate would either still be exhausted or be chemically changed by the
reactivation conditions.
2.15. METHODS OF SURFACE REGENERATION
2.15.1. Thermal regeneration
The most common regeneration technique employed in industrial processes is thermal regeneration. The
thermal regeneration process generally follows three steps: adsorbent drying at approximately 105 °C;
high temperature desorption and decomposition (500–900°C) under an inert atmosphereand finally
residual organic gasification by an oxidizing gas (steam or carbon dioxide) at elevated temperatures
(800°C). The heat treatment stage utilizes the exothermic nature of adsorption and results in desorption,
partial cracking and polymerization of the adsorbed organics. The final step aims to remove charred
organic residue formed in the porous structure in the previous stage and re-expose the porous carbon
structure regenerating its original surface characteristics. After treatment the adsorption column can be
reused. Per adsorption-thermal regeneration cycle between 5–15 weight percent of the carbon bed is burnt
off resulting in a loss of adsorptive capacity. Thermal regeneration is a high energy process due to the
high required temperatures making it both an energetically and commercially expensive process.

31
Plants that rely on thermal regeneration of activated carbon have to be of a certain size before it is
economically viable to have regeneration facilities onsite. As a result, it is common for smaller waste
treatment sites to ship their activated carbon cores to a specialized facility for regeneration, increasing the
process' already significant carbon footprint.
Activated carbon used in consumer devices such as oil deep fryers or air and water filters can similarly be
reactivated using commonly available heating appliances such as a baking oven, toaster oven, or simply a
propane torch. The carbon is removed from any paper or plastic containers that could melt or ignite, and
heated to vaporize and/or burn off contaminants.
Current concerns with the high energy/cost nature of thermal regeneration of activated carbon have
encouraged research into alternative regeneration methods to reduce the environmental impact of such
processes. Though several of the regeneration techniques cited have remained areas of purely academic
research, some alternatives to thermal regeneration systems have been employed in industry. Current
alternative regeneration methods are:
2.15.2. Chemical regeneration
The mechanisms underlying chemical regeneration of activated carbon loaded with physisorbed organics
have been explored. Using four aromatic adsorbate and five chemical regenerants in batch equilibrium
and regeneration experiments, it has been shown that solubility of the organics and surface characteristics
of the adsorbent under regeneration conditions strongly influence the regeneration efficiency. Solubility in
the regenerant has been enhanced either by the addition of micelles or by the generation of soluble forms
of the adsorbate. In general, the latter technique is more effective. It has been demonstrated that soluble
forms of the adsorbate can be obtained by PH control or the use of reactive regenerants. PH can also be
used to control surface charge characteristics and, consequently, adsorbate affinity for the adsorbent. For
adsorbates that are difficult to solubilise or are very strongly bound to the surface, reduced affinity for the
adsorbent through a change in surface charge characteristics can be used to improve regeneration
efficiencies.

32
2.15.3. Microbial regeneration
Microbial regeneration of spent activated carbon provides a synergic combination of adsorption and
biodegradation. Microorganisms regenerate the surface of activated carbon using sorbed organic substrate
as a source of food and energy. Aromatic hydrocarbons, particularly phenols, including their chlorinated
derivatives and industrial waste water containing synthetic organic compounds and explosives-
contaminated ground water are the major removal targets in adsorption-bio-regeneration process. Popular
mechanisms of bio-regeneration include exo-enzymatic hypothesis and biodegradation following
desorption. Efficiency of bio-regeneration can be quantified using direct determination of the substrate
content on the adsorbent, the indirect measurement of substrate consumption by measuring the carbon
dioxide production and the measurement of oxygen uptake. Modelling of bio-regeneration involves the
kinetics of adsorption/desorption and microbial growth followed by solute degradation. Some modelling
aspects based on various simplifying assumptions for mass transport resistance, microbial kinetics and
bio-film thickness, are briefly exposed.
2.15.4. Wet air oxidation regeneration
The regeneration of a commercial activated carbon (AC) was studied using the wet air oxidation (WAO)
process in the temperature range 150−180 °C and an oxygen partial pressure of 0.718 MPa. P-Nitro
phenol (PNF) was used as the adsorbate. First, the oxidation process of PNF was studied. In the absence
of AC, it was independent of the initial concentration of PNF at the conditions used in this work.
The temperature and oxygen partial pressure exerted positive effects on the oxidation process. The
activation energy of the PNF oxidation process and the reaction order with respect to oxygen were 134.8
kJ mol-1 and 0.55, respectively. The desorption process of PNF from the saturated AC was studied in the
aforementioned temperature range. It was found to occur during the heating period, with an equilibrium
being reached. The regeneration process was studied at these same temperatures, yielding activation
energy for PNF oxidation of 99.1 kJ per mole.
The isotherms of the virgin and regenerated AC and the phenol, Methylene blue, and iodine indices
indicated that the WAO regeneration produced notable modifications in the porous structure of the
carbon, diminishing its adsorption capacity. Nevertheless, at a regeneration temperature of 170 °C, 80%
of the adsorption capacity of AC can be recovered.

33
2.15.5. Ultrasonic regeneration
To evaluate the feasibility of ultrasonic regeneration of granular activated carbon (GAC), desorption of
trichloroethylene (TCE) from GAC by ultrasound was investigated at 20 kHz. About 64% of TCE was
desorbed from 5 g of GAC loaded with 6.5 mg TCE for 1 h in ultrasonic field and TCE desorbed to liquid
phase were rapidly degraded by ultrasound. 34-43% of stoichiometrically calculated chloride, final
degradation product of TCE, was observed in liquid phase during ultrasonic treatment. However, there
was desorption limitation at 20 kHz ultrasound. Despite of prolonged ultrasonic irradiation, desorption
efficiency of TCE did not exceed critical value.
And also, the higher percentage of TCE was desorbed when a sample of 2 mg TCE/4 g GAC was treated
ultrasonically than that of 2 mg TCE/g GAC under the same experimental conditions. These results
indicate that desorption of TCE by 20 kHz ultrasound occurred mainly at a nearby surface of GAC. In
conclusion, the ultrasonic regeneration showed a possibility as an alternative to chemical and thermal
regenerations of GAC.
2.15.6. Electro-chemical regeneration
Once the adsorptive capacity of the activated carbon bed has been exhausted by the adsorption of
pollutant molecules, the carbon is transferred to an electrochemical cell (to either the anode or the
cathode) in which electrochemical regeneration can occur.
2.15.6.1. Principles of Electrochemical Regeneration
There are several mechanisms by which passing a current through the electrochemical cell can encourage
pollutant desorption. Ions generated at the electrodes can change local PH conditions in the divided cell
which affect the adsorption equilibrium and have been shown to promote desorption of organic pollutants
such as phenols from the carbon surface.
Other mechanisms include reactions between the ions generated and the adsorbed pollutants resulting in
the formation of a species with a lower adsorptive affinity for activated carbon that subsequently desorb
or the oxidative destruction of the organics on the carbon surface.
It is agreed that the main mechanisms are based on desorption induced regeneration as electrochemical
effects are confined to the surface of the porous carbons so cannot be responsible for bulk regeneration.
The performance of different regeneration methods can be directly compared using the regeneration
efficiency.

34
This is defined as:
Adsorptive capacity before adsorption
Adsorptive capacity after adsoption and electrochemical regeneration∗ 100
2.15.7. Cathodic Regeneration
The cathode is the reducing electrode and generates OH – ions which increase local PH conditions. An
increase in PH can have the effect of promoting desorption of pollutants into the solution where they can
migrate to the anode and undergo oxidation hence destruction. Studies on cathodic regeneration have
shown regeneration efficiencies for adsorbed organic pollutants such as phenols of the order of 85% based
on regeneration times of 4 hours with applied currents between 10-100 mA. However, due to mass
transfer limitations between the cathode and anode, there is often residual pollutant left in the cathode
unless large currents or long regeneration times are employed.
2.15.8. Anodic Regeneration
The anode is the oxidizing electrode and as a result has a lower localized pH during electrolysis which
also promotes desorption of some organic pollutants. Regeneration efficiencies of activated carbon in the
anodic compartment are lower than that achievable in the cathodic compartment by between 5-20% for
the same regeneration times and currents, however there is no observed residual organic due to the strong
oxidizing nature of the anode.

35
3. EXPERIMENTAL SET UP
3.1. APPARATUS
In this paper, the precursor researched on was coconut shells. These shells were pyrolyzed and then
activated under a stream of steam.
3.1.1. Dehydration Unit
An oven was used to dehydrate the coconut shells. The shells were placed inside the oven and then heated
at 105oC for 24 hours in order to remove the moisture in them. The oven has a rotating motor on top
coupled to a fan (as shown) that ensures uniform temperature in the oven by distributing heat within it. Its
maximum temperature was 500oC.
Figure 3: Dehydration Unit

36
3.1.2. Electric Furnace
The type of the furnace is ELSKLO. The heating elements were made of Kanthal Aluminum, and the
maximum temperature being 1200oC. This is shown below;
Figure 4: Electric Furnace
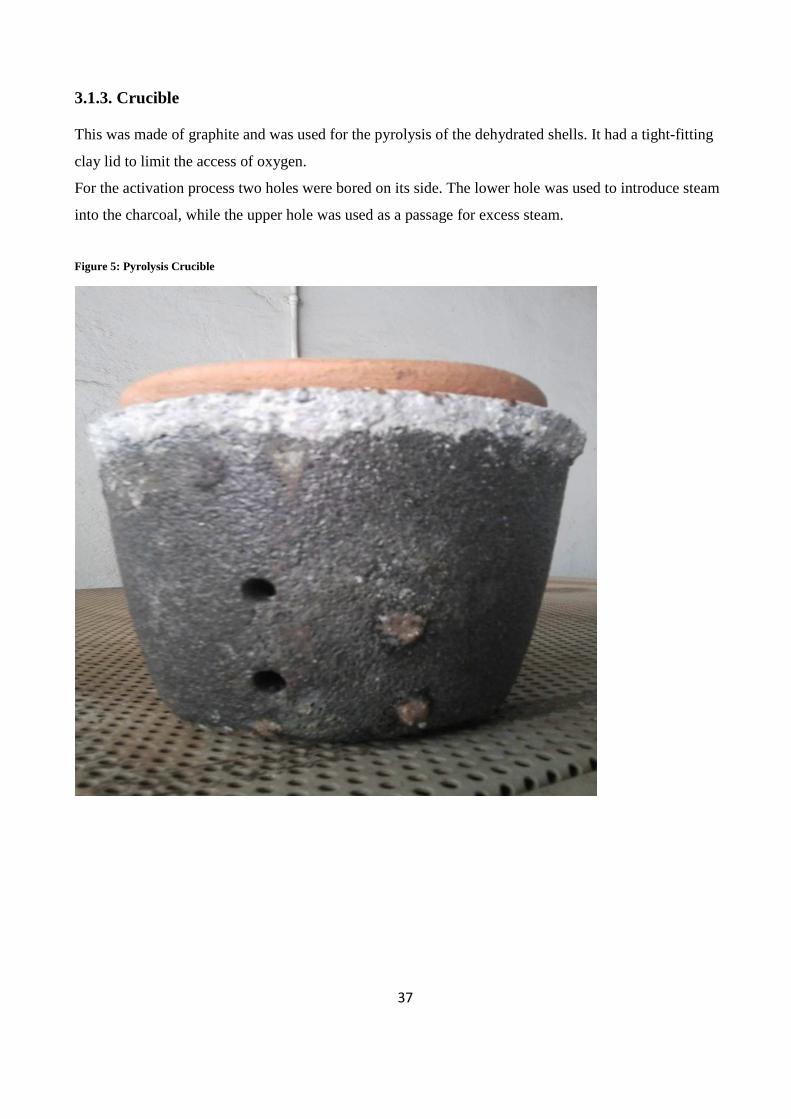
37
3.1.3. Crucible
This was made of graphite and was used for the pyrolysis of the dehydrated shells. It had a tight-fitting
clay lid to limit the access of oxygen.
For the activation process two holes were bored on its side. The lower hole was used to introduce steam
into the charcoal, while the upper hole was used as a passage for excess steam.
Figure 5: Pyrolysis Crucible

38
3.1.4. Activation Unit
The whole unit was composed of a Heating Coil, Pressure cooker, Copper tubing and Ceramic tubes. The
heating coil was used to heat the water in the pressure cooker for the production of steam. The copper
tube was used to connect the cooker and the ceramic tube with the help of a plastic tube. The basic
arrangement looked as follows;
Figure 6: Activation Unit

39
3.2. EXPERIMENTAL PROCEDURE
The different operating parameters and preparation variables for the activated carbon were:
I. Dehydrating temperature of 105oC for 24 hours.
II. Pyrolysis temperature of 460, 520 and 580oC with soaking period of 30, 45 and 60 minutes
each.
III. Activation at temperatures of 750, 850 & 950oC for 45, 60 and 75 minutes each.
3.2.1 Dehydration
The coconut shells were crushed into small pieces of about 2mm diameter to give large surface area for
dehydration. Then they were sieved to get rid of dust particles and other impurities.
The crushed coconut shells were then placed in an oven maintained at 105oC and soaked for 24 hours.
The dried coconut shells were placed in airtight plastic bags to prevent re-absorption of moisture from the
atmospheric air.
3.2.2. Pyrolysis
The crucible was charged with just sufficient coconut shells (about 103gms), and the lid tightly fitted to
ensure an airtight environment. Then the crucible was placed in the furnace carefully and the furnace
closed.
The furnace was switched on and heated to a temperature of 460oC, then held constant for 30 minutes to
allow pyrolysis to take place. This was also repeated for a time of 45 and 60 minutes. The same procedure
was also repeated at temperatures of 520 and 560oC.
As is the case in dehydration, the charcoal obtained from pyrolysis were kept in airtight bags and
weighed.

40
3.2.3. Activation
The charcoal from pyrolysis was then placed in the activation unit and the furnace heated to a temperature
of 750oC. Steam from the pressure cooker was then allowed to flow through it for 30 minutes with
temperature held constant. At 750oC, the above was repeated for other two activation times of 60 and 75
minutes for all the samples from pyrolysis.
The whole procedure was repeated for activation temperatures of 850 and 950oC. At the end of activation,
9 samples had been obtained. Samples were labelled according to the procedure done on them with
various parameters labelled to facilitate the ease of carrying out of the successive tests.
3.2.4. MethyleneBlue Test
The porosity development of the resulting activated carbon was determined using MethyleneBlue test. To
achieve this, adsorbance of Methylene blue by activated carbon was determined.
APPARATUS
1. 1000ml volumetric flask
2. 100 ml conical flasks
3. shaker
4. 200 ml beakers
5. pipette,
6. 50 ml measuring Cylinder
7. Buchner funnel
8. digital balance
9. UV Spectrophotometer
10. stopwatch
11. tissue rolls
12. filter paper

41
PROCEDURE
1000ml solution of Methylene blue of concentration 10-4 moles was prepared and stored in a volumetric
flask. This was the working solution.
Then 2gm of crushed and fine activated carbon sample (0.5mm) was precisely and meticulously weighed
in the digital balance. The 2gm was then introduced into a clean and dry 100ml conical flask. 50ml of
the10-4 moles solution was pipetted and incorporated carefully into the flask, and shaken by a shaker at
room temperature for 5 minutes.
The solution was then allowed to settle for 30 minutes and then filtered in a Buchner funnel.
The above procedure was repeated for all the nine samples and correctly labelled.
Then the samples were tested for absorbance using a UV Visible Spectrophotometer set to a wavelength
of 664.5nm with distilled water as the reference sample. The absorbance for each sample was recorded.
CALIBRATION CURVE
Using the stock solution of 10-4moles, 50ml was pipetted into a conical flask and then topped to 100ml
with distilled water to give a solution of 0.5 × 10!" moles. From this, a solution of 2.5 × 10!$%&'()
was made. In a similar way, a solution of 1.25×10⁻⁵ moles was prepared.
The solutions of different concentrations were tested using a UV Visible Spectrophotometer at a
wavelength of 664.5nm using distilled water as a reference sample. The respective adsorbances obtained
were used to plot a calibration curve i.e. adsorbance against concentration.
These adsorbance values for the various samples, with the calibration curve were then used to calculate
the change in concentration of Methylene blue in the solution. From such, the mass of Methyleneblue was
calculated and the values recorded.
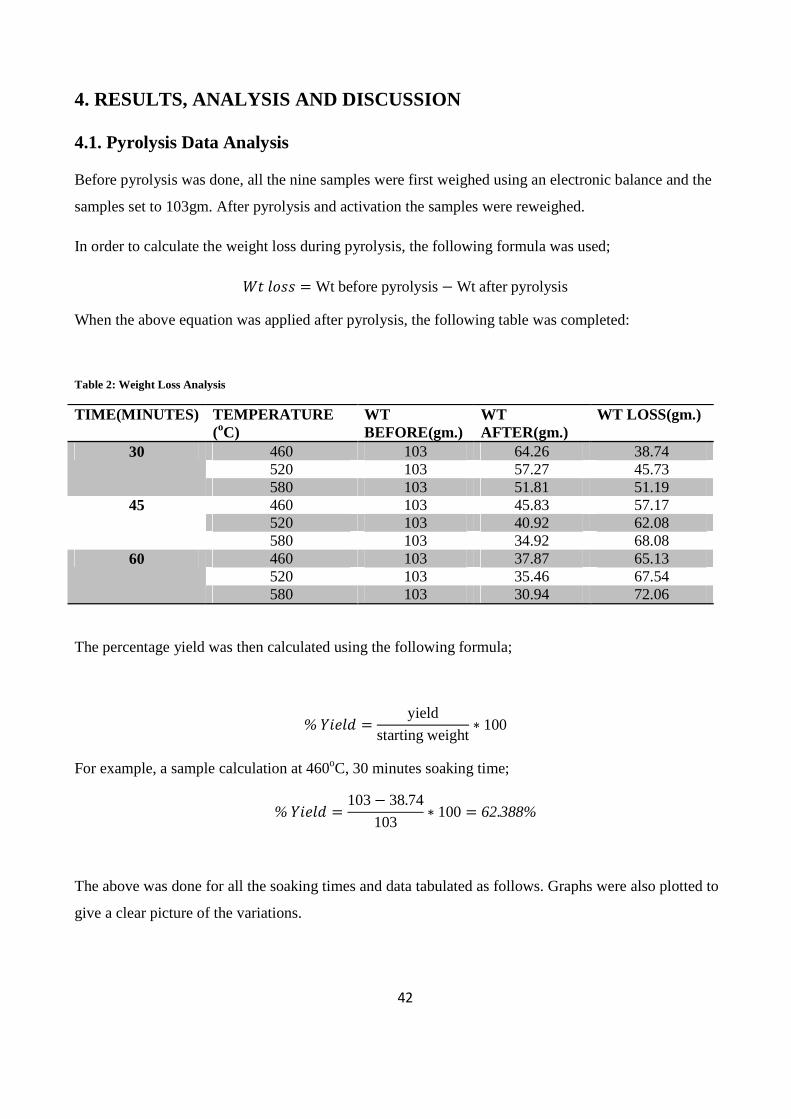
42
4. RESULTS, ANALYSIS AND DISCUSSION
4.1. Pyrolysis Data Analysis
Before pyrolysis was done, all the nine samples were first weighed using an electronic balance and the
samples set to 103gm. After pyrolysis and activation the samples were reweighed.
In order to calculate the weight loss during pyrolysis, the following formula was used;
*+ '&)) = Wt before pyrolysis− Wt after pyrolysis
When the above equation was applied after pyrolysis, the following table was completed:
Table 2: Weight Loss Analysis
TIME(MINUTES) TEMPERATURE (oC)
WT BEFORE(gm.)
WT AFTER(gm.)
WT LOSS(gm.)
30 460 103 64.26 38.74 520 103 57.27 45.73 580 103 51.81 51.19
45 460 103 45.83 57.17 520 103 40.92 62.08 580 103 34.92 68.08
60 460 103 37.87 65.13 520 103 35.46 67.54 580 103 30.94 72.06
The percentage yield was then calculated using the following formula;
% ./('0 =yield
starting weight∗ 100
For example, a sample calculation at 460oC, 30 minutes soaking time;
% ./('0 =103− 38.74
103∗ 100= 62.388%
The above was done for all the soaking times and data tabulated as follows. Graphs were also plotted to
give a clear picture of the variations.

43
i. For 30 minutes
The following table was then completed with the help of % Yield equation
Table 3: % Yield after 30 Minutes
Temp (oC) % Yield 460 62.388 520 55.602 580 50.301
A graph of yield against temperature was plotted for various duration of time as follows
Figure 7: Chart of % Yield after 30 minutes
0 10 20 30 40 50 60 70
580
520
460
580 520 460
% Yield 50.301 55.602 62.388
Pyrolysis for 30 minutes

44
ii. For 45 Minutes
Table 4: % Yield after 45 Minutes
Temp (oC) Yield 460 44.495% 520 39.728% 580 33.369%
A graph of yield against temperature was plotted for various duration of time as follows
Figure 8: Chart of % Yield after 45 minutes
0 5 10 15 20 25 30 35 40 45 50
580
520
460
580 520 460
% Yield 33.369 39.728 44.495
Pyrolysis for 45 minutes

45
iii. For 60 Minutes
Table 5: % Yield after 60 minutes
Temp (oC) Yield 460 36.767% 520 34.427% 580 30.039%
A graph of yield against temperature was plotted for various duration of time as follows
Figure 9: Chart of % Yield after 60 minutes
0 5 10 15 20 25 30 35 40
580
520
460
580 520 460
% Yield 30.039 34.427 36.767
Pyrolysis for 60 minutes

46
4.1.1. Pyrolysis temperature and weight loss
There was a need to determine the variation of weight loss with pyrolysis temperature hence graphs of
weight loss against pyrolysis temperature were plotted as shown below
i. For 30 minutes;
Figure 10: Graph of Weight Loss against Pyrolysis Temperature, 30 minutes
ii. For 45 minutes;
Figure 11: Graph of Weight Loss against Pyrolysis Temperature, 45 minutes
0
10
20
30
40
50
60
460 480 500 520 540 560 580 600
Wt
Loss
(g
m)
Pyrolysis Temp (oC)
Wt loss (gm) Vs Pyrolysis Temp
0
10
20
30
40
50
60
70
80
460 480 500 520 540 560 580 600
Wt
Loss
(g
m)
Pyrolysis Temp (oC)
Wt loss (gm) Vs Pyrolysis Temp

47
iii. For 60 minutes;
Figure 12: Graph of Weight Loss against Pyrolysis Temperature, 60 minutes
From the above graphs, it is evident that for a particular soaking time, weight loss in pyrolysis increased
with increase in temperature. At lower temperatures e.g. at 460oC, weight loss was relatively low. This
could be because not all the volatile matter was driven. For the samples, a lot of loss was in the 580oC.
This was due to more volatiles being driven out at the high elevated temperatures and also due to some of
the carbon being oxidized by the oxygen initially present/trapped in the airtight crucible.
The gases produced in pyrolysis principally consist of hydrogen, CO2, CO, CH4, ethane (C2H6) and other
hydrocarbons. At elevated temperatures, the associated energy supplied makes the molecules of these
gases disintegrate and hence escape. The 520oC sample is a compromise between the two extremes; not
much volatile matter remaining and not much weight loss. This was the sample taken to the next step of
activation. Indeed this is in line with the previous reports’ recommendations and also from various texts
on activated carbon.
The trend observed in pyrolysis temperature versus weight loss was also seen in pyrolysis soaking time
against weight loss. Weight loss increased with soaking time. This is attributable to the fact that increased
soaking time gave enough time for some of the remaining volatile matter to escape, and also some of the
carbon to be oxidised. Again, the optimum time was the compromise between the two extremes i.e. 45
minutes.
64
65
66
67
68
69
70
71
72
73
74
460 480 500 520 540 560 580 600
Wt
Loss
(g
m)
Pyrolysis Temp (oC)
Wt loss (gm) Vs Pyrolysis Temp

48
The sample then chosen to proceed to the next step of activation was the one made under 520oC pyrolysis
temperature and soaking time of 45 minutes.
4.2. Methylene Blue Adsorption Results
4.2.1. Calibration curve
In order to get the amount of Methylene blue adsorbed by the prepared samples, a calibration curve of
absorbance against concentration was plotted. To obtain this curve, the Methylene blue was prepared at
different concentrations as explained earlier. The results obtained from the spectrophotometer were as
follows;
Table 6: Calibration Curve Values
Methylene Blue concentration, (moles)×10-6
Absorbance
0 0 6.25 0.192 12.5 0.391 25 0.812 50 1.524 100 3.072
It is important to note that the zero values correspond to distilled water which acts as reference point,
having adsorbance of zero. These values were plotted to give the following graph;

49
Figure 13: Graph of Absorbance against concentration
The plot of absorbance against concentration gave a straight line through the origin as shown above. This
was used in conjunction with the various samples’ absorbance values of 664.5nm-wavelength light.
The samples were then tested using the UV spectrophotometer and the results were as follows;
Table 7: Variation of Absorbance with Activation Temperature and Time
Activation Time (Minutes)
Temperature (oC) Absorbance
30 750 1.791 850 1.081 950 1.104
60 750 1.243 850 0.476 950 0.627
75 750 1.358 850 0.584 950 0.746
0
0.5
1
1.5
2
2.5
3
3.5
0 0.00002 0.00004 0.00006 0.00008 0.0001 0.00012
Me
thy
len
e b
lue
Ab
sorb
an
ce
Concentration (moles)

50
The above absorption values, with the calibration curve, were then used to read off the corresponding
concentration of the samples. This was tabulated as follows;
Table 8: Concentration of Samples from Calibration Curve
Absorption Concentration (moles) of Methylene Blue 1.791 0.0000583 1.081 0.0000352 1.104 0.0000359 1.243 0.0000379 0.476 0.0000148 0.627 0.0000171 1.358 0.0000435 0.584 0.0000187 0.746 0.0000238
The above concentration values for Methylene Blue were that remaining after mixing it with the
Activated Carbon samples. In order to get the amount of Methylene Blue that was actually adsorbed by
the carbon, we need to apply the following equation;
1(+ℎ3'(4( 5'6( 70)&89(0 = :4/+/;' <&4=(4+8;+/&4 >:<? − @/4;' <&4=(4+8;+/&4 >@<?
E.g. at 750oC, 30 minutes, for initial number of moles = 0.0001 prepared,
70)&89(0 %&'() = 0.0001 − 0.0000583 = 0.0000417
When the above equation was applied, the moles adsorbed were obtained for the rest of the samples as;
Table 9: Concentration Adsorbed by Activated Carbon Sample
Absorption Moles Adsorbed (I.C – F.C) Mg/2g Adsorbed
1.288 0.0000417 13.34 1.982 0.0000648 20.74 1.957 0.0000641 20.51 1.894 0.0000621 19.87 2.613 0.0000852 27.26 2.543 0.0000829 26.53 1.727 0.0000565 18.08 2.492 0.0000813 26.02 2.336 0.0000762 24.38

51
4.2.2. Influence of Activation Temperature on Adsorption
Using this set of moles adsorbed, the adsorption can be obtained from the calibration curve. This can now be grouped according to the samples activated as;
Table 10: Sample Adsorbance Values
30 minutes Activation
Sample Temperature (oC) Adsorption
1. 750 1.288
2. 850 1.982
3. 950 1.957
60 minutes Activation
Temperature (oC) Adsorption
4. 750 1.894
5. 850 2.613
6. 950 2.543
75 minutes Activation
Temperature (oC) Adsorption
7. 750 1.727
8. 850 2.492
9. 950 2.336
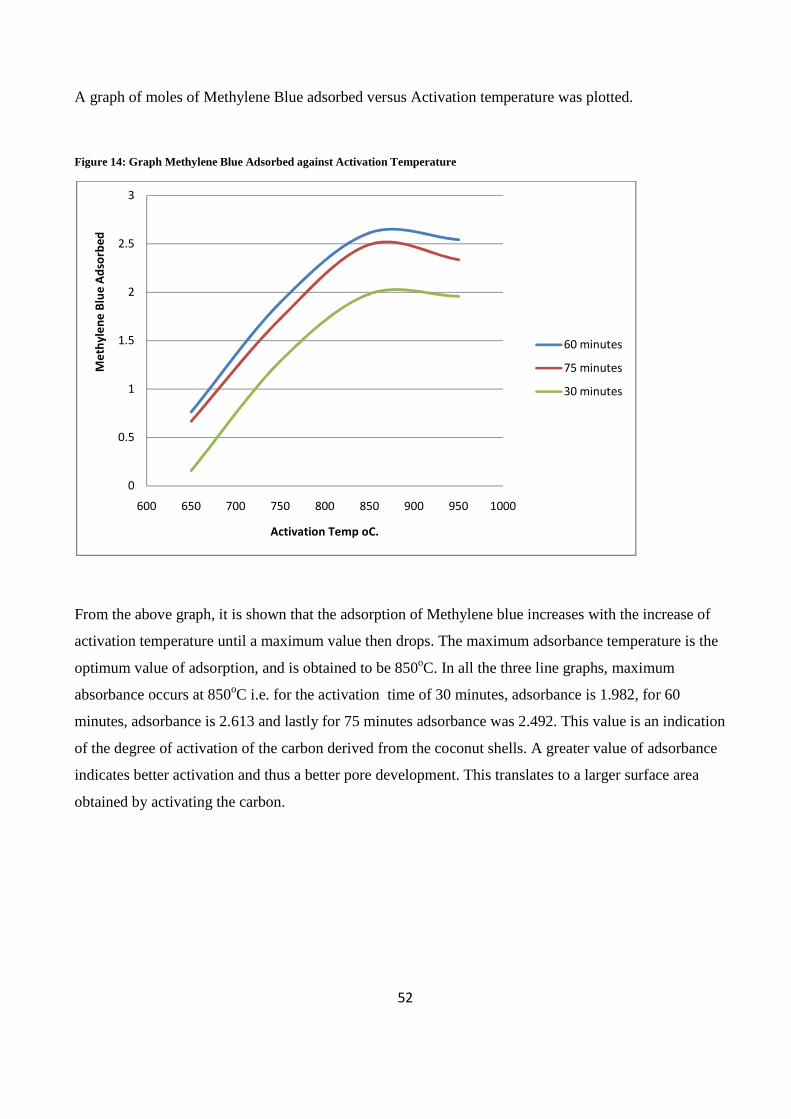
52
A graph of moles of Methylene Blue adsorbed versus Activation temperature was plotted.
Figure 14: Graph Methylene Blue Adsorbed against Activation Temperature
From the above graph, it is shown that the adsorption of Methylene blue increases with the increase of
activation temperature until a maximum value then drops. The maximum adsorbance temperature is the
optimum value of adsorption, and is obtained to be 850oC. In all the three line graphs, maximum
absorbance occurs at 850oC i.e. for the activation time of 30 minutes, adsorbance is 1.982, for 60
minutes, adsorbance is 2.613 and lastly for 75 minutes adsorbance was 2.492. This value is an indication
of the degree of activation of the carbon derived from the coconut shells. A greater value of adsorbance
indicates better activation and thus a better pore development. This translates to a larger surface area
obtained by activating the carbon.
0
0.5
1
1.5
2
2.5
3
600 650 700 750 800 850 900 950 1000
Me
thy
len
e B
lue
Ad
sorb
ed
Activation Temp oC.
60 minutes
75 minutes
30 minutes

53
4.2.3. Influence of Activation Time on Adsorption
Another graph of Methylene Blue adsorbed versus Activation time was plotted and is as shown below.
Figure 15: Graph of Methylene Blue Adsorbed against Activation Time
From the above graph, it is noted that with increase in activation time, adsorbance of Methylene blue
increases. But this trend does not go on indefinitely; it peaks at 60 minutes, then levels off and drops. At
soaking time of 60 minutes the adsorbance values are the highest i.e. for an activation temperature 750oC
it is 1.894, for 850oC it is 2.163 and lastly for 950oC it is 2.543.
The reason for this is that with increased activation time, some of the volatiles originally in the carbon
structure are driven of as a result of increased steam activation hence the adsorption surface is improved.
With further increase in activation time, the steam penetrated deeper inside the particles than with short
time.
The reason for the levelling off and dropping of adsorbance after peaking at 60 minutes is that possibly
there was continued activation which favoured formation of micropores, and as the Methylene blue test
could not detect much of the change.
0
0.5
1
1.5
2
2.5
3
20 30 40 50 60 70 80
Me
thy
len
e B
lue
ad
sorb
ed
Time (minutes)
850 oC
950 oC
750 oC

54
5. CONCLUSION
The results of this study show that it is feasible to prepare activated carbons with relatively high surface
areas and pore volumes from coconut shells at the optimum conditions arrived at above by physical
activation with steam. These conditions are: a pyrolysis temperature of 520oC with soaking time of 45
minutes, and an activation temperature of 850oC with soaking time of 60 minutes. The pyrolysis
temperature of 520oC was arrived at so as toeconomize the cost of production and time. High pyrolysis
temperature translates to high energy costs coupled with low carbon yields at increasing temperatures.
Methylene blue test was successfully used to investigate the effects of activation temperature and
activation time on the surface area. The amount of Methylene blue adsorbed corresponded to the amount
of surface area formed. This was an indication of the degree of activation. The maximum adsorption was
obtained at an activation temperature of 850oC and soaking time of 60 minutes. This gave a removal rate
of 27 mg per 2gm of activated carbon. This elevated temperature maintains a sufficiently high reaction
rate.
The project’s objective of carrying out pyrolysis and activation without the use of inert gas was met.
There were no adverse effects of carrying out the above in relatively airtight environment. The airtight
crucible provided relatively inert atmosphere as it prevented atmospheric air from oxidizing the carbon
during pyrolysis. Also the almost airtight furnace aided in preventing circulation of air in and out of the
pyrolysis chamber. The Methylene blue adsorbance results obtained did not differ greatly with the
previous values obtained when positive inert gas pressure gradient was maintained. Therefore, activated
carbon can be produced inexpensively. This is a great relief for the informal sector commonly known as
the Jua Kali Industry. She can produce quality activated carbon for the Kenyan market i.e. water
treatment sector, sugar refining, dye industry and other industrial processes.

55
RECOMMENDATIONS
� To get compound characterization results, several characterisation methods should be used.
Central to this is the Iodine Number test.
� A flow meter should be incorporated to measure the steam flow rate and as such the effect of
steam flow rate on the degree of activation to be determined.
� A means of tapping the volatile gases from pyrolysis be introduced, and analysis done to
determine their viability as a source of fuelin the subsequent processes.

56
REFERENCES
1. Properties of Activated Carbon", CPL Caron Link, accessed 2008-05-02
2. Srinivasakannan C. and Abu Baker M. Z., Production of activated carbon from rubber wood
sawdust, (2006)
3. Mattson J. S. and Mark H. B., activated carbon, New York: Dekker, (1971).
4. Wikipedia contributors, Activated Carbon.
5. Philip L. walker, Chemistry and Physics of Carbon, 1966.