Embed Size (px)
Citation preview

University of Notre DameAerospace and Mechanical Engineering Notre Dame, Indiana 46556-9956
365 Fitzpatrick Hall of Engineering Telephone: (219) 239-5430Fax: (219) 239-8007
Report: 1783-ARIDate: March 30, 1990
0Prepared by: Drs. P.F. Dunn& T. J. Mueller
N, DTIC0 Dr. S.C. Lekoudis ELECTE
Scientific Officer, Fluid Dynamics APR 111990N Department of the Navy
Office of Naval ResearchSD
Code 1132-F wI 800 North Quincy Street
C Arlington, Virginia 22217
Subject: Annual Report for the period 1 April 1989 to 31 March 1990, Contract NumberN00014-89-J-1783, Fluid Dynamic and Acoustic Experiments on TurbomachineRotors Subject to Variable Flow Conditions
Dear Sir:
The primary objective of this research is to obtain a better understanding of how inflownonuniformities interact with rotor blades, thereby producing rotor vibrations and the radiation ofunwanted noise. In this research, carefully controlled experiments will be conducted in low speedwind tunnels utilizingtan advanced rotor-dynamometer system. The fluid mechanical characteristicsof the inflow will be documented and related to performance and blade radiated sound. The bladeresponse, as characterized by its thrust, torque, surface pressure distribution and radiated sound,will be measured for the cases of both steady and unsteady inflows of variable turbulence intensityand scale. . , ' , ,
I. ROTOR-DYNAMOMETER PERFORMANCE MEASUREMENTS
a. Description of Research
A foremost consideration in experiments designed to determine how various inflownonuniformities interact with rotor blades is the response of the rotor itself to both steady andnonsteady disturbances. A complete characterization of rotor response requires the measurement ofthe rotor's thrust, torque and rpm, and individual blade loading as a function of inflow conditions.Typically, this is accomplished best by determining the rotor's thrust and torque coefficients andblade surface pressure distribution as a function of rotor advance ratio. The accurate measurementof each of these parameters can be achieved through use of the advanced rotor-dynamometerdeveloped for this project.
Our approach in incorporating the advanced rotor-dynamometer into this research programchronologically consists of four stages: (1) design, fabricate, shakedown the dynamometer, (2) usethe dynamometer in a series of rotor-dynamometer performance studies, in which the rotorresponse is characterized in terms of its efficiency, torque and thrust coefficients versus advanceratio under steady inflow conditions, and the structure of the flow about the rotor is characterizedusing various flow visualization techniques, (3) perform similar experiments to those in the second
fifirotOv WfoaTEM2 A
pp w d for pubIIC rutoo m1Distrbution Untimdled
2
stage in which the rotor is operated in a duct, and (4) conduct experiments similar to those in thesecond and third stages in which the effect of upstream turbulence intensity (between 0.07% and5.0%) on performance will be determined, and acoustic measurements will be made to ascertain theinfluence of the turbulence length scale at the same intensity and its relation to the radiated noisespectrum. This contract year, we completed the first two stages. The results of this effort aredescribed in the following.b. Significant Results since 1 April 1989
During the first six months of this project, we designed and fabricated the advanced rotor-dynamometer and then conducted initial shakedown tests in a low speed wind tunnel. Thiscompleted the first stage of our plan. During the second six months, we used this dynamometer tocharacterize the forward and backing operating performances of an unducted #3714 four-bladedpropeller that was tested previously at the NSRDC.This completed the second stage of our plan.
i. The Advanced Rotor-Dynamometer
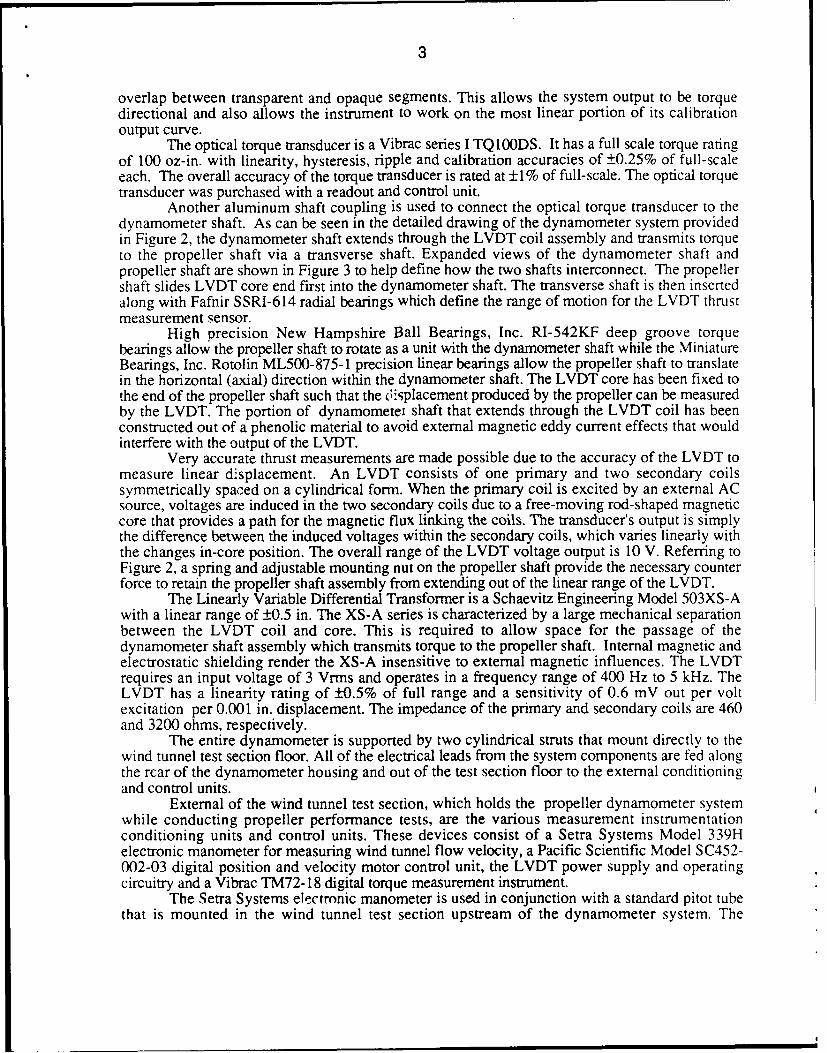
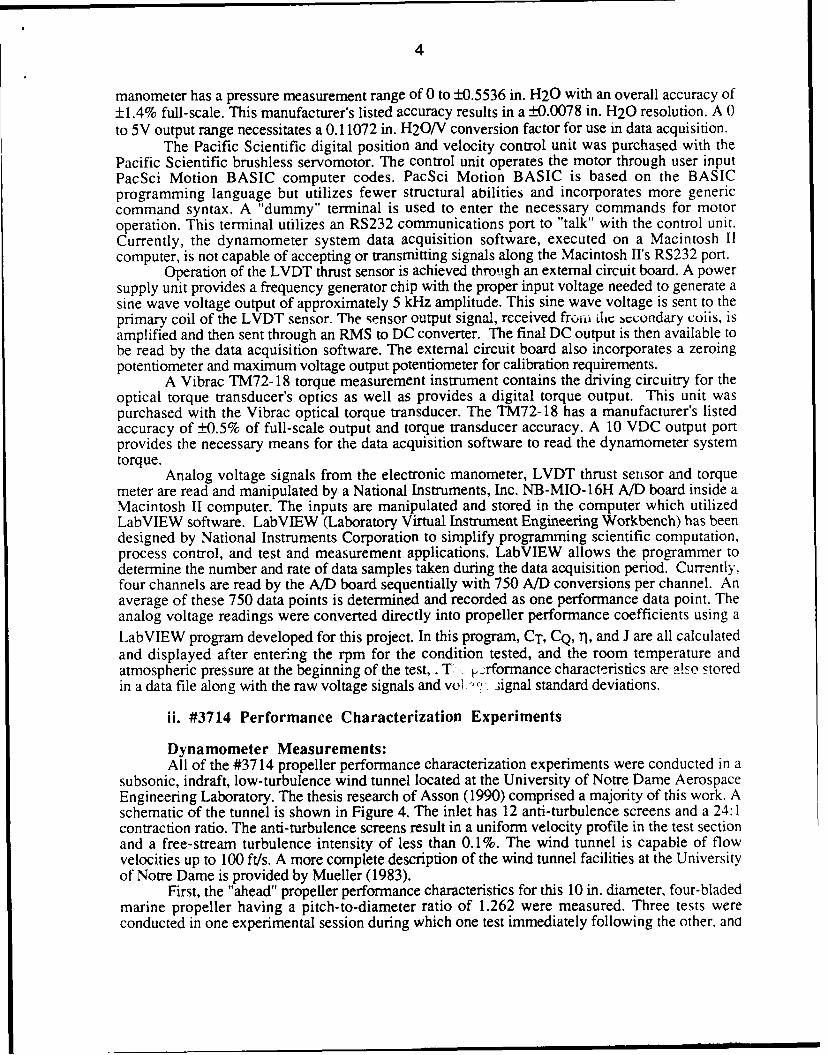
The advanced rotor-dynamometer was designed to utilize state-of-the-art components toachieve the accurate measurement of rotor rpm, torque and displacement. This dynamometer,capable of either forward or aft-mounted rotor configurations, was carefully constructed with highprecision bearings, couplings and instrumentation to provide very accurate performancemeasurements.Using this device, rotor rpm, torque and displacement can be measured to within0.001%, 1.5% and 3.2% accuracy, respectively, over a typical advance ratio range. When used ina low speed wind tunnel, the recultant average errors in the thrust coefficient, torque coefficient,efficiency and advance ratio are 3.5%, 2.1%, 4.2% and 1.2%, respectively. This type of accuracyis achieved through use of an optical encoder to determine rpm, an optical torque meter, and aLinearly Variable Differential Transformer (LVDT) to measure displacement. Each instrument islinked to its own signal conditioning unit, which, in turn, is connected through an A/D board to aMacintosh II computer. In this manner, the rotor's performance parameters can be determined andviewed in real-time and recorded over a wide range of inflow conditions.
The advanced dynamometer system, shown schematically in Figure 1, is comprised of thedynamometer itself, which is mounted in a wind tunnel test section, the required external signalconditioning and operational control units, a Macintosh II computer utilized for its data acquisitionabilities, and, of course, the actual wind tunnel facility.
The propeller dynamometer itself is comprised of a servomotor, optical torque transducer,LVDT thrust sensor, dynamometer shaft assembly and two aluminum shaft couplings. Thesecomponents are all housed within an aluminum casing which is mounted in a wind tunnel foroperation. A brushless servomotor is mounted in the rear of the dynamometer. This motor isequipped with a resolver which allows for very accurate position and speed control. The resolvereliminates the need for contact brushes which result in internal system friction and motor wear.
The motor is a compact 2.0 in. diameter, 8.38 in. long Pacific Scientific brushless modelR23HENA-R1-NS-NV-00 samarium-cobalt permanent magnet servomotor. An operating range of0 to ±8,000 rpm is possible with a speed resolution of ±0.01 rpm. The motor can deliver 14 lb-in.peak stall torque and 7.6 lb-in, continuous stall torque. With a 230 VAC input voltage, theservomotor controller is capable of up to 1000 W continuous stall power and 2000 W peak power.Its current output is rated at 3.5 A continuous stall current and 7.0 A peak current. Position controlresolution is rated at 4096 steps per revolution with an accuracy of ±0.001 revolutions.
The motor shaft is connected to an optical torque transducer with a solid aluminum shaftcoupling. The aluminum shaft coupling exhibits very little backlash ensuring that nearly all the 0torque output by the motor is transmitted through the rest of the system. The optical torque 0transducer is a very sensitive and accurate device for measuring torque. It is equipped with twooptical disks that are mounted on a torsion bar within the unit. Rotation of the slotted disks relativeto each other alters the "window area" between lamps and photoelectric cells, developing an outputcurrent proportional to torque. The disks are initially positioned on the torque bar to give a 50%
Codes
STATC1T "A" per Spyridou Lekoudis Avail and/orONR/Code 111277 Ut,,t Speoal.TELECON 4/10/90 VG
3
overlap between transparent and opaque segments. This allows the system output to be torquedirectional and also allows the instrument to work on the most linear portion of its calibrationoutput curve.
The optical torque transducer is a Vibrac series I TQ100DS. It has a full scale torque ratingof 100 oz-in. with linearity, hysteresis, ripple and calibration accuracies of ±0.25% of full-scaleeach. The overall accuracy of the torque transducer is rated at ±1% of full-scale. The optical torquetransducer was purchased with a readout and control unit.
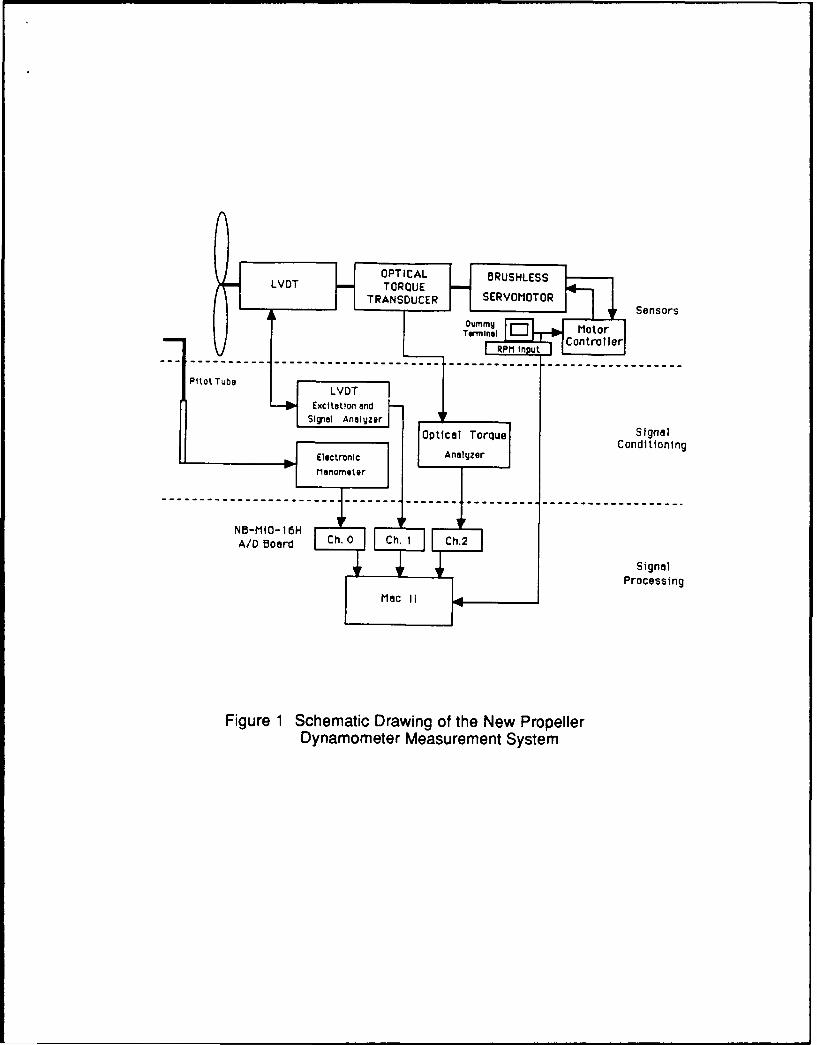
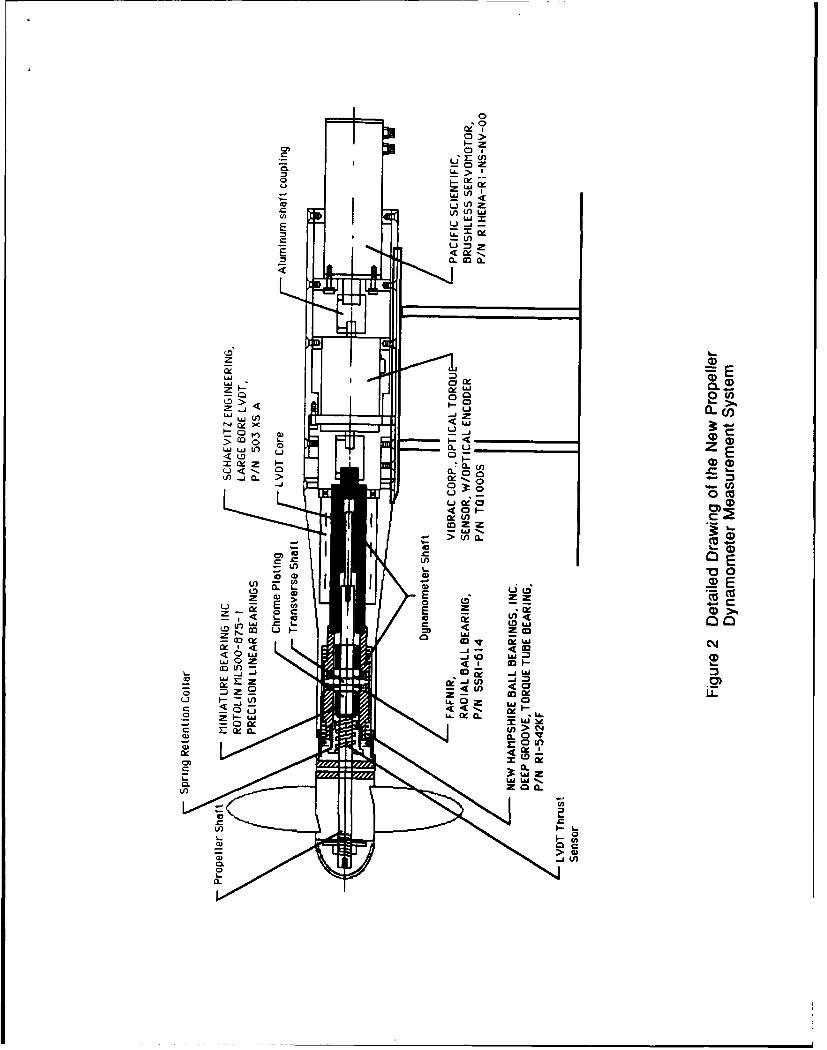
Another aluminum shaft coupling is used to connect the optical torque transducer to thedynamometer shaft. As can be seen in the detailed drawing of the dynamometer system providedin Figure 2, the dynamometer shaft extends through the LVDT coil assembly and transmits torqueto the propeller shaft via a transverse shaft. Expanded views of the dynamometer shaft andpropeller shaft are shown in Figure 3 to help define how the two shafts interconnect. The propellershaft slides LVDT core end first into the dynamometer shaft. The transverse shaft is then insertedalong with Fafnir SSRI-614 radial bearings which define the range of motion for the LVDT thrustmeasurement sensor.
High precision New Hampshire Ball Bearings, Inc. RI-542KF deep groove torquebearings allow the propeller shaft to rotate as a unit with the dynamometer shaft while the MiniatureBearings, Inc. Rotolin ML500-875-1 precision linear bearings allow the propeller shaft to translatein the horizontal (axial) direction within the dynamometer shaft. The LVDT core has been fixed tothe end of the propeller shaft such that the 6isplacement produced by the propeller can be measuredby the LVDT. The portion of dynamometei shaft that extends through the LVDT coil has beenconstructed out of a phenolic material to avoid external magnetic eddy current effects that wouldinterfere with the output of the LVDT.
Very accurate thrust measurements are made possible due to the accuracy of the LVDT tomeasure linear displacement. An LVDT consists of one primary and two secondary coilssymmetrically spaced on a cylindrical form. When the primary coil is excited by an external ACsource, voltages are induced in the two secondary coils duc to a free-moving rod-shaped magneticcore that provides a path for the magnetic flux linking the coils. The transducer's output is simplythe difference between the induced voltages within the secondary coils, which varies linearly withthe changes in-core position. The overall range of the LVDT voltage output is 10 V. Referring toFigure 2, a spring and adjustable mounting nut on the propeller shaft provide the necessary counterforce to retain the propeller shaft assembly from extending out of the linear range of the LVDT.
The Linearly Variable Differential Transformer is a Schaevitz Engineering Model 503XS-Awith a linear range of ±0.5 in. The XS-A series is characterized by a large mechanical separationbetween the LVDT coil and core. This is required to allow space for the passage of thedynamometer shaft assembly which transmits torque to the propeller shaft. Internal magnetic andelectrostatic shielding render the XS-A insensitive to external magnetic influences. The LVDTrequires an input voltage of 3 Vrms and operates in a frequency range of 400 Hz to 5 kHz. TheLVDT has a linearity rating of ±0.5% of full range and a sensitivity of 0.6 mV out per voltexcitation per 0.001 in. displacement. The impedance of the primary and secondary coils are 460and 3200 ohms, respectively.
The entire dynamometer is supported by two cylindrical struts that mount directly to thewind tunnel test section floor. All of the electrical leads from the system components are fed alongthe rear of the dynamometer housing and out of the test section floor to the external conditioningand control units.
External of the wind tunnel test section, which holds the propeller dynamometer systemwhile conducting propeller performance tests, are the various measurement instrumentationconditioning units and control units. These devices consist of a Setra Systems Model 339Helectronic manometer for measuring wind tunnel flow velocity, a Pacific Scientific Model SC452-002-03 digital position and velocity motor control unit, the LVDT power supply and operatingcircuitry and a Vibrac TM72-18 digital torque measurement instrument.
The Setra Systems electronic manometer is used in conjunction with a standard pitot tubethat is mounted in the wind tunnel test section upstream of the dynamometer system. The
4
manometer has a pressure measurement range of 0 to ±0.5536 in. H20 with an overall accuracy of+1.4% full-scale. This manufacturer's listed accuracy results in a ±0.0078 in. H20 resolution. A 0to 5V output range necessitates a 0.11072 in. H20/V conversion factor for use in data acquisition.
The Pacific Scientific digital position and velocity control unit was purchased with thePacific Scientific brushless servomotor. The control unit operates the motor through user inputPacSci Motion BASIC computer codes. PacSci Motion BASIC is based on the BASICprogramming language but utilizes fewer structural abilities and incorporates more genericcommand syntax. A "dummy" terminal is used to enter the necessary commands for motoroperation. This terminal utilizes an RS232 communications port to "talk" with the control unit.Currently, the dynamometer system data acquisition software, executed on a Macintosh IIcomputer, is not capable of accepting or transmitting signals along the Macintosh I's RS232 port.
Operation of the LVDT thrust sensor is achieved through an external circuit board. A powersupply unit provides a frequency generator chip with the proper input voltage needed to generate asine wave voltage output of approximately 5 kHz amplitude. This sine wave voltage is sent to theprimary coil of the LVDT sensor. The sensor output signal, received frl-ii die secondary coils, isamplified and then sent through an RMS to DC converter. The final DC output is then available tobe read by the data acquisition software. The external circuit board also incorporates a zeroingpotentiometer and maximum voltage output potentiometer for calibration requirements.
A Vibrac TM72-18 torque measurement instrument contains the driving circuitry for theoptical torque transducer's optics as well as provides a digital torque output. This unit waspurchased with the Vibrac optical torque transducer. The TM72-18 has a manufacturer's listedaccuracy of +0.5% of full-scale output and torque transducer accuracy. A 10 VDC output portprovides the necessary means for the data acquisition software to read the dynamometer systemtorque.
Analog voltage signals from the electronic manometer, LVDT thrust sensor and torquemeter are read and manipulated by a National Instruments, Inc. NB-MIO-16H A/D board inside aMacintosh II computer. The inputs are manipulated and stored in the computer which utilizedLabVIEW software. LabVIEW (Laboratory Virtual Instrument Engineering Workbench) has beendesigned by National Instruments Corporation to simplify programming scientific computation,process control, and test and measurement applications. LabVIEW allows the programmer todetermine the number and rate of data samples taken during the data acquisition period. Currently,four channels are read by the A/D board sequentially with 750 A/D conversions per channel. Anaverage of these 750 data points is determined and recorded as one performance data point. Theanalog voltage readings were converted directly into propeller performance coefficients using aLabVIEW program developed for this project. In this program, CT, CQ, i, and J are all calculatedand displayed after entering the rpm for the condition tested, and the room temperature andatmospheric pressure at the beginning of the test, . T',, prformance characteristics are also storedin a data file along with the raw voltage signals and vo , : signal standard deviations.
ii. #3714 Performance Characterization Experiments
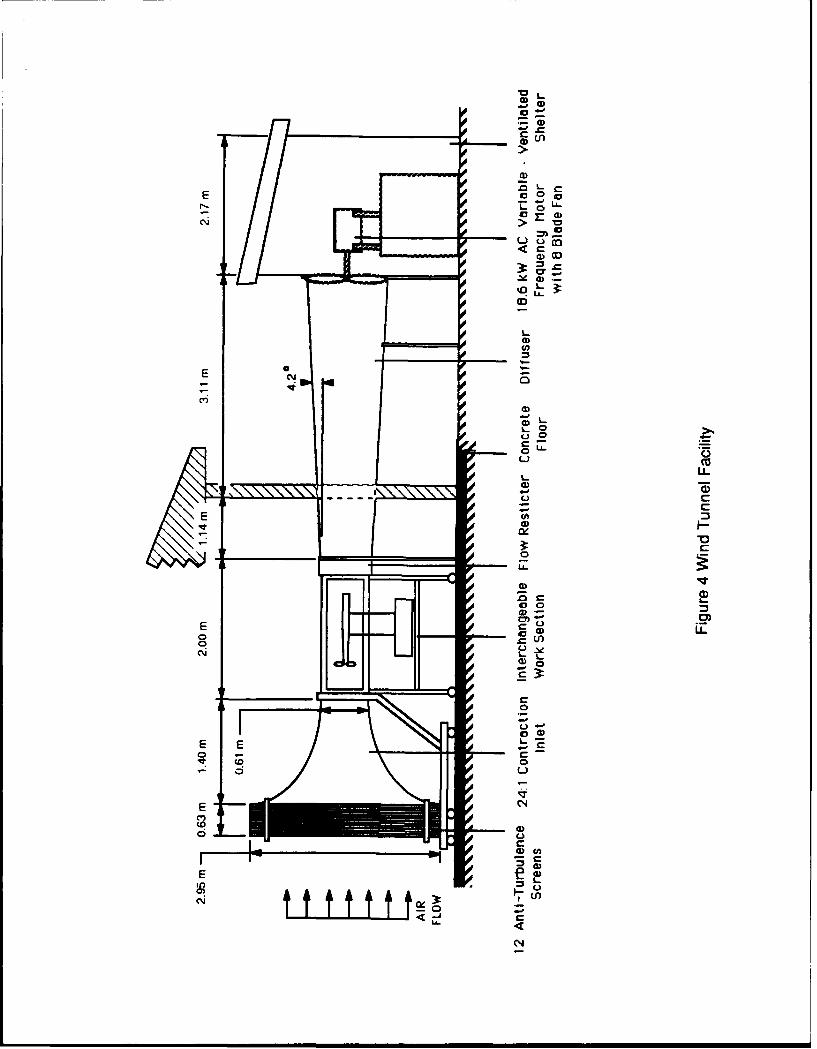
Dynamometer Measurements:All of the #3714 propeller performance characterization experiments were conducted in a
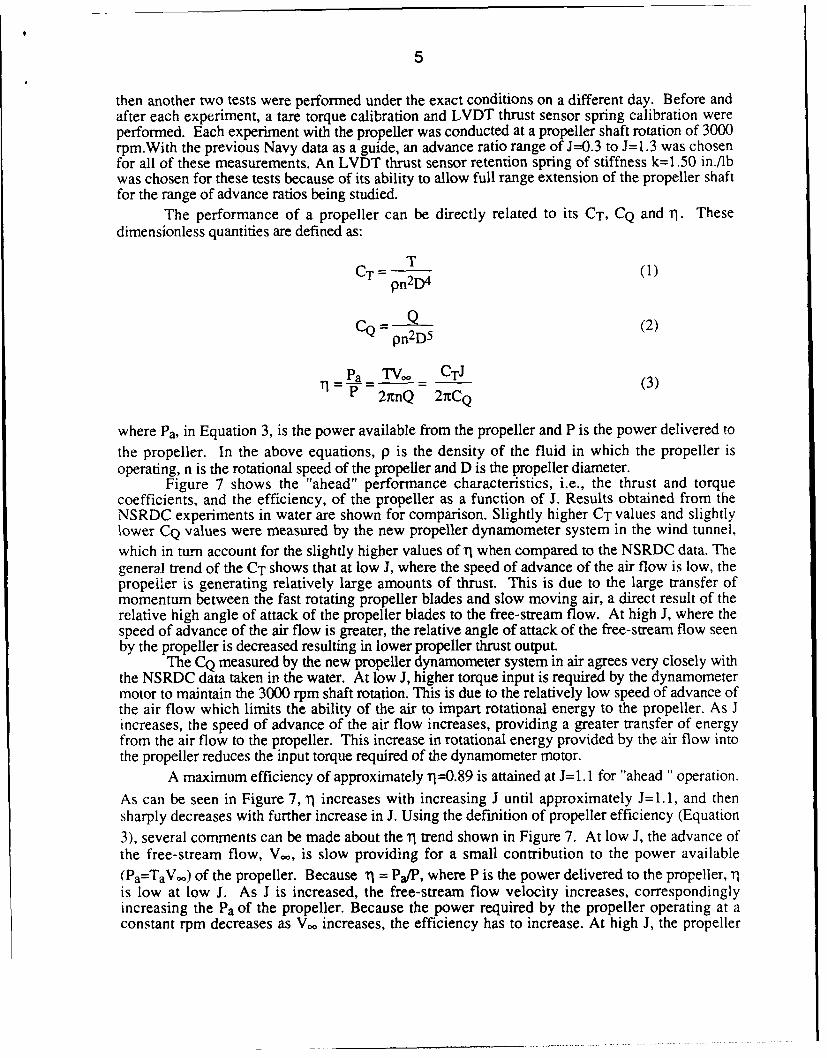
subsonic, indraft, low-turbulence wind tunnel located at the University of Notre Dame AerospaceEngineering Laboratory. The thesis research of Asson (1990) comprised a majority of this work. Aschematic of the tunnel is shown in Figure 4. The inlet has 12 anti-turbulence screens and a 24:1contraction ratio. The anti-turbulence screens result in a uniform velocity profile in the test sectionand a free-stream turbulence intensity of less than 0.1%. The wind tunnel is capable of flowvelocities up to 100 ft/s. A more complete description of the wind tunnel facilities at the Universityof Notre Dame is provided by Mueller (1983).
First, the "ahead" propeller performance characteristics for this 10 in. diameter, four-bladedmarine propeller having a pitch-to-diameter ratio of 1.262 were measured. Three tests wereconducted in one experimental session during which one test immediately following the other, and
5
then another two tests were performed under the exact conditions on a different day. Before andafter each experiment, a tare torque calibration and LVDT thrust sensor spring calibration wereperformed. Each experiment with the propeller was conducted at a propeller shaft rotation of 3000rpm.With the previous Navy data as a guide, an advance ratio range of J--0.3 to J= 1.3 was chosenfor all of these measurements. An LVDT thrust sensor retention spring of stiffness k=1.50 in./lbwas chosen for these tests because of its ability to allow full range extension of the propeller shaftfor the range of advance ratios being studied.
The performance of a propeller can be directly related to its CT, CQ and 11. Thesedimensionless quantities are defined as:
TCT (1)pn2D
Q -(2)pn2D5
_Pa TV CTJ (3)
- - 27tnQ 27tCQ
where Pa, in Equation 3, is the power available from the propeller and P is the power delivered tothe propeller. In the above equations, p is the density of the fluid in which the propeller isoperating, n is the rotational speed of the propeller and D is the propeller diameter.
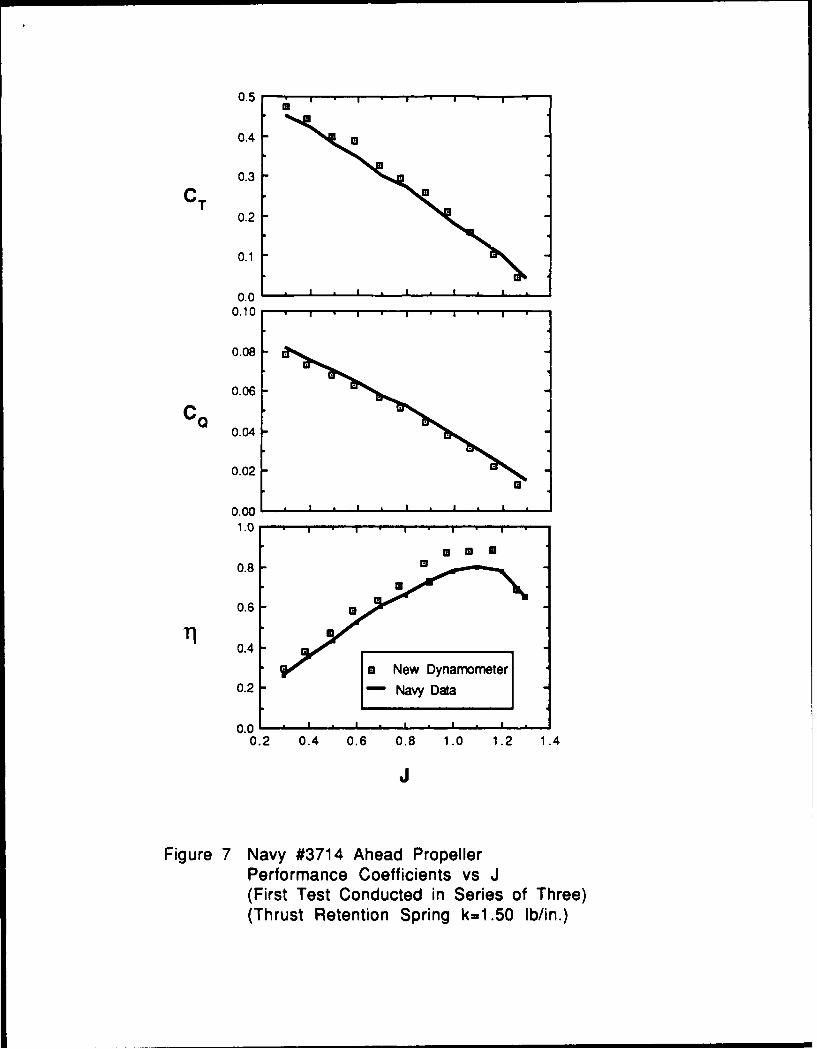
Figure 7 shows the "ahead" performance characteristics, i.e., the thrust and torquecoefficients, and the efficiency, of the propeller as a function of J. Results obtained from theNSRDC experiments in water are shown for comparison. Slightly higher CT values and slightlylower CQ values were measured by the new propeller dynamometer system in the wind tunnel,which in turn account for the slightly higher values of i" when compared to the NSRDC data. Thegeneral trend of the CT shows that at low J, where the speed of advance of the air flow is low, thepropeiler is generating relatively large amounts of thrust. This is due to the large transfer ofmomentum between the fast rotating propeller blades and slow moving air, a direct result of therelative high angle of attack of the propeller blades to the free-stream flow. At high J, where thespeed of advance of the air flow is greater, the relative angle of attack of the free-stream flow seenby the propeller is decreased resulting in lower propeller thrust output.
The CQ measured by the new propeller dynamometer system in air agrees very closely withthe NSRDC data taken in the water. At low J, higher torque input is required by the dynamometermotor to maintain the 3000 rpm shaft rotation. This is due to the relatively low speed of advance ofthe air flow which limits the ability of the air to impart rotational energy to the propeller. As Jincreases, the speed of advance of the air flow increases, providing a greater transfer of energyfrom the air flow to the propeller. This increase in rotational energy provided by the air flow intothe propeller reduces the input torque required of the dynamometer motor.
A maximum efficiency of approximately 11--0.89 is attained at J=1. 1 for "ahead "operation.
As can be seen in Figure 7, 11 increases with increasing J until approximately J=l. 1, and thensharply decreases with further increase in J. Using the definition of propeller efficiency (Equation
3), several comments can be made about the 1 trend shown in Figure 7. At low J, the advance ofthe free-stream flow, V., is slow providing for a small contribution to the power available(Pa=TaVo) of the propeller. Because 1i = Pa/P, where P is the power delivered to the propeller, TIis low at low J. As J is increased, the free-stream flow velocity increases, correspondinglyincreasing the Pa of the propeller. Because the power required by the propeller operating at aconstant rpm decreases as Vo, increases, the efficiency has to increase. At high J, the propeller

6
loses lift due to the small angles of attack between the propeller blades and the relative free-streamflow. With this decrease in Ta from the propeller, the Pa decreases which accounts for the decreasein 11.
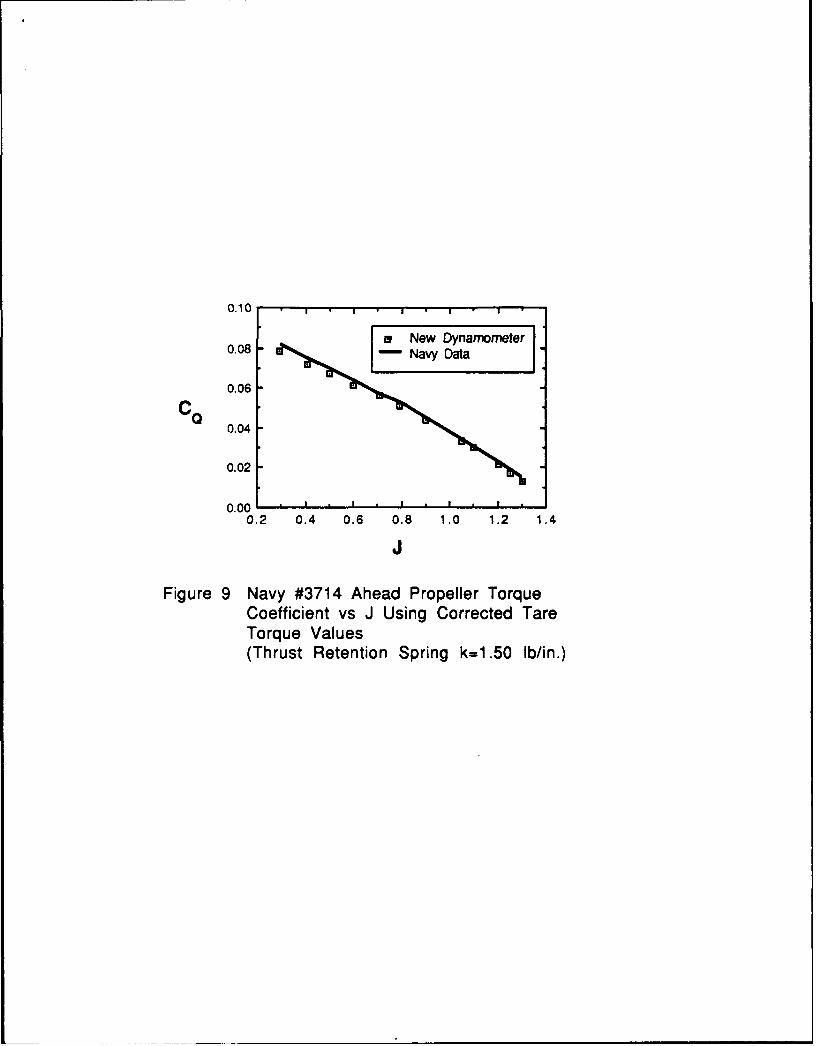
Figure 8 shows the results of the third experiment conducted in a series during the sametesting session. Again a slightly higher CT was measured as compared to the NSRDC data. Figure8 also shows a less consistent CQ measurement in comparison with the results provided in Figure7. This CQ discrepancy is attributed to a measured tare torque of 0.021 N-m prior to this final testas compared to a measured tare torque of 0.015 N-m for the first two tests conducted. Whensubtracted from the torque measurements this higher tare torque value results in a CQ slightly lessthan the CQ results shown in Figure 7.
Upon completion of this third test, another tare torque calibration was performed whichresulted in a measured tare torque of 0.015 N-m, which was the same tare torque measured prior tothe first and second tests conducted. It was concluded that the high tare torque measurementrecorded prior to the third test was most likely the result of an adjustment made to one of thedynamometer's couplings. Ample running time was not allowed to "re-set" the dynamometerbearings before continuing with the final test, resulting in the higher measured Laie ;orque andlower overall CQ. Figure 9 shows the same CQ values obtained from the third test corrected with 0tare torque value of 0.015 N-m. This C0 shows better agreement between the measured data andthe NSRDC results, which supports the aforementioned conclusion.
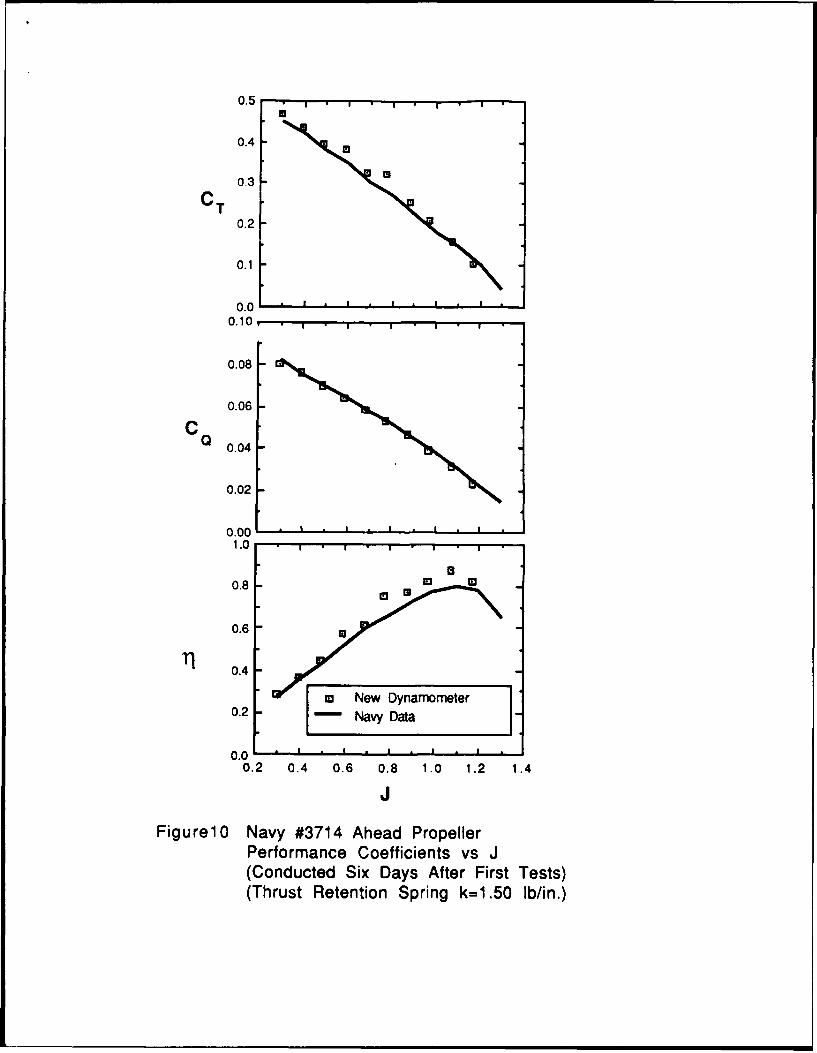
Several more propeller performance characteristic tests on the propeller were conducted ona different day to verify measurement repeatability. Figure 10 shows the performancecharacteristics as a function of J obtained under the same testing conditions, i.e., a thrust sensorretention spring with stiffness k = 1.50 in./lb and a propeller shaft rotation of 3000 rpm. This testwas conducted six days after the completion of the first experiments. The measured tare torque forthis test was 0.012 N-in both before and after the experiment. Thus, all three of these tests,conducted under the same operating conditions but at different times, show that the propeller thrustand torque coefficients agree to within ±2.1% and ±3.5%, respectively.
There are several other operational characteristics of the propeller dynamometer system thatwere found during these tests. The CT plots shown in Figures 7, 8, and 10 all reveal a tendency ofthe propeller shaft to "stick" under certain conditions. The smooth decrease in CT with increasing Jbecomes more discontinuous between approximately J=0.6 and J=0.8. It is postulated that thedynamic response of the propeller dynamometer is affected by the inherent flow characteristicsgenerated by the four-bladed marine propeller at these J's.
During the propeller performance tests, it was noticed that when the dynamometer systemwas tapped lightly when operating in the J range under question, different propeller shaft extensionequilibrium positions could be obtained. This led to the assumption that internal system frictionwas adversely affecting the thrust measurements. By varying the wind tunnel flow velocity anddynamometer shaft rpm in such a manner as to not change J, it was possible to vary the resultingextension of the propeller shaft due to the different thrust being generated. (This could also beaccomplished by changing the thrust sensor retention spring stiffness.) Further investigation of theadvance ratio range J=0.6 to J=0.8 under these new conditions resulted in the same tendency of thepropeller shaft to "stick." Because the system has a tendency to "stick" over the same range of Junder differing output thrust conditions, and, therefore, differing propeller shaft extensions, it wasconcluded that the friction experienced was the result of the flow about the propeller coupled to thesystem. The propeller dynamometer shaft assembly itself was not the cause of this atypical pattern.
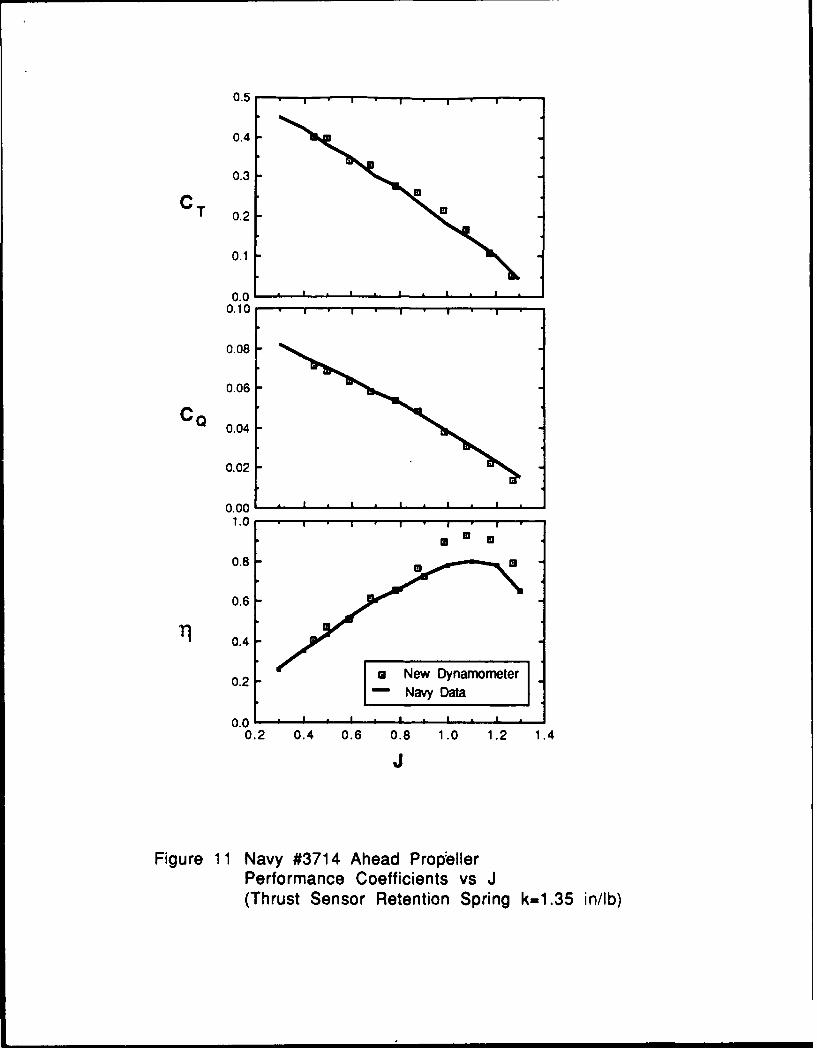
Further testing was conducted with the propeller to again verify system repeatability. AnLVDT thrust sensor retention spring of stiffness k=1.35 in./lb was used in the next series ofexperiments. This weaker spring allowed for the same range of J to be examined, as did thek=l.50 in./lb spring, but the LVDT thrust sensor calibration curve was different. Figure 11 showsthe results obtained with the k= 1.35 in.flb spring. The measured tare torque for this particular testwas 0.010 N-m. The tendency of the system to "stick" between J=0.6 and J=0.8 again wasevident in the CT plot, reinforcing the conclusions stated above regarding inherent flowcharacteristics and system friction.

7
Finally, Figure 12 shows in summary the measured performance characteristics for "ahead"operation of the Navy #3714 four-bladed marine propeller for every test performed. It should benoted that this data involves tests with varying thrust sensor retention spring constants, varyingsystem tare torque, and varying atmospheric conditions. These composite results reveal that thestandard percent difference in the thrust and torque coefficients, as compared to the NSRDCvalues, for "ahead" operation of the propeller measured were ±5.7% and ±5.3%, respectively. Thediscrepancy between the mean of the measured efficiency data at any advance ratio value and theNSRDC data is approximately 12%. This is outside the stated measurement error of thedynamometer, which was estimated to be ±4.2% for the efficiency. However, this does notconsider the error involved in the NSRDC measurements, which may be approximately ±10%.Part of this difference possibly also can be attributed to the additional power that is required inwater to accelerate the "apparent mass" of the water displaced by the propeller to the same advanceratio as compared to in air. We plan to continue to explore the reason for these differences.
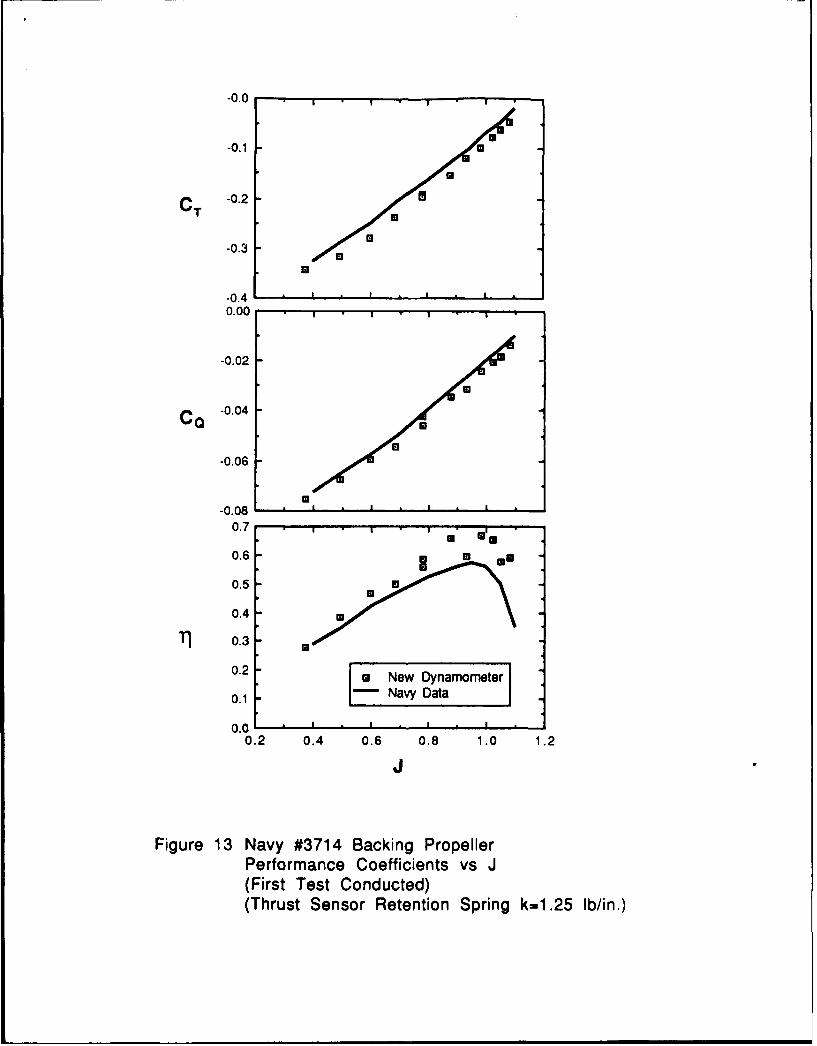
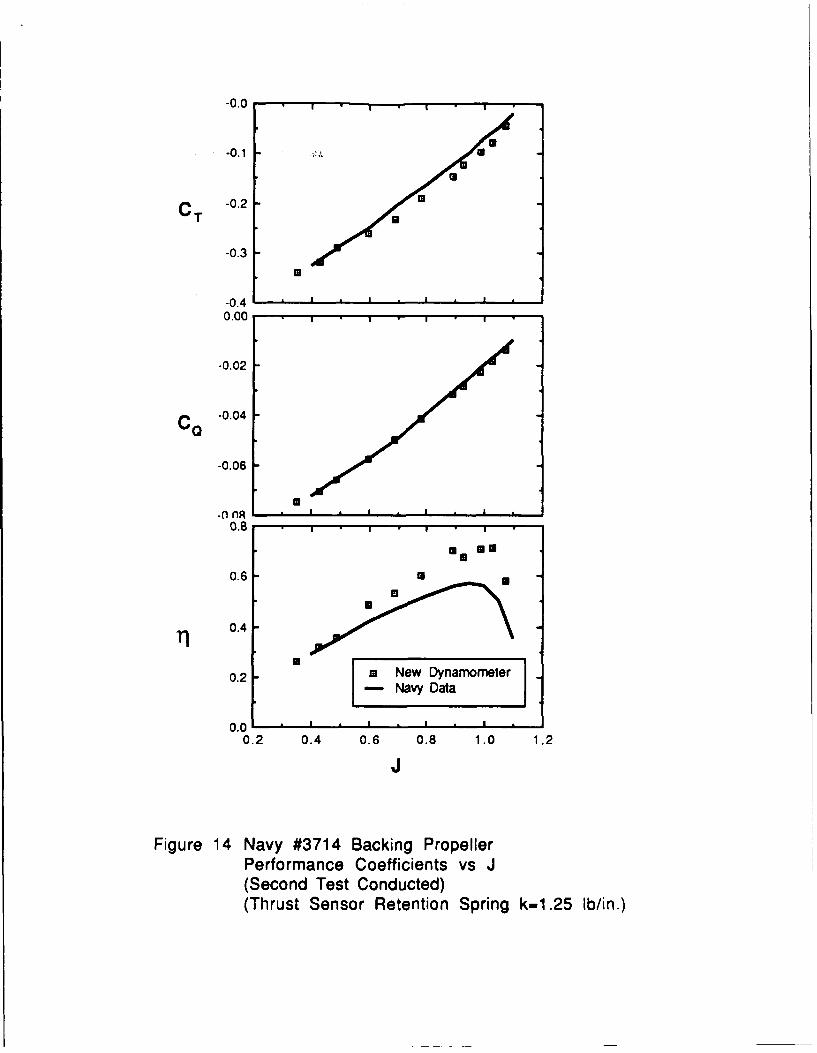
"Backing" performance tests were conducted on the propeller on two separate days. Athrust sensor retention spring of stiffness k=1.25 in./lb was utilized in both experiments. Figure 13shows the backing performance characteristics as a function of J for the first test, while Figure 14shows the results of the second test. The measured tare torque was 0.015 N-m before and aftereach test. Following the sign convention of the data provided, the performance characteristics havebeen plotted in the opposite sense of the data presented for "ahead" operation. The same generaltrends of CT, CQ and h prevail for the "backing" performance although thrust output is degraded ascompared to the "ahead" performance and torque required is slightly less.
It can be seen in Figures 13 and 14 that no apparent "sticking" of the propeller shaft occursover the range of J measured. This reinforces the conclusion that in "ahead" operation inherentflow characteristics affect the dynamometer thrust measurement between J--0.6 and J=0.8. It canalso be seen in Figures 13 and 14 that the CT measurements are slightly more negative (greater)than the Navy data, as was the case for "ahead" performance measurements. This consequentlyleads to higher values of the efficiency when measured in air.
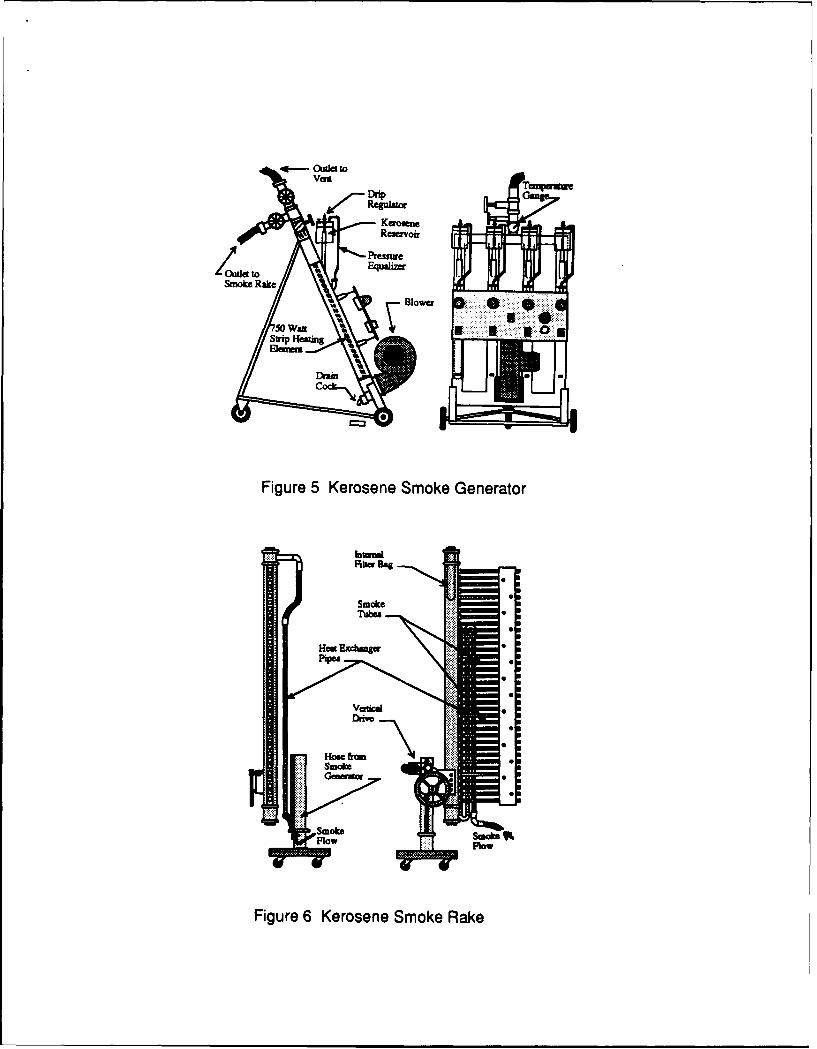
Flow Visualization Studies:Kerosene smoke visualization was used to characterize the structure of the flow field about
the propeller. This technique has been utilized extensively at the University of Notre Dame andinvolves the vaporization of kerosene by heating elements within a "smoke generator." The smokeis then pumped into a "smoke rake," in which it cools to ambient temperature and is directed thesmoke into the inlet of the wind tunnel. The resulting kerosene smoke tubes are then used tovisualize the flow field within the test section. Illustrations of the "smoke generator" and "smokerake" are shown in Figures 5 and 6. A more complete explanation of the smoke generation processand apparatus is provided by Mueller (1983).
Smoke flow visualization tests incorporated the use of short duration strobe lighting toilluminate the characteristics of the flow in the neighborhood of the propeller. An infrared photosensor was mounted on one of the aluminum couplings within the dynamometer which is used totrigger several stroboscopes. Three General Radio 1540-P2 Strobolume lamps controlled by threeGeneral Radio 1540-PI Strobolume oscillators connected in series provided sufficient lighting toobtain excellent photographic images of the propeller flow field and wake structure. Each strobewas powered by a General Radio 1540 electronic stroboscope power unit. Synchronizing thestrobe flashes with the photosensor also allows for the propeller to appear motionless even whileaccelerating or decelerating the propeller or wind tunnel free-stream velocity.
Two forms of visual recording media were used to help study the smoke flowvisualization, still photographs and real-time video recording. The still camera was a Nikon FM235 mm with a 28 mm 1:2.8 lens which was used to record stop-action photographs of the variouspropeller systems under various conditions. The real-time video recordings were obtained on aPanasonic NV-8950 VCR utilizing a Panasonic HD Digital 5000 WV-S050 motion camera system.Digitization of the video picture at various conditions of propeller operation can also be used torepresent the stop-action photography. Real-time video recording allows the investigator the abilityto obtain a continuous record of the stroboscopically illuminated images of the flow field. Using

8
this technique, continuous flow images can be acquired while accelerating or decelerating the flow,thereby providing a continuous record of the flow field over a range of advance ratios. Thedevelopment of the wake structure is clearly recorded as the propeller changes from one advanceratio to another. For the stop-motion photographs, the strobe lamps were synchronized directly tothe Nikon camera to provide a single high intensity flash for each photo. With the ability to extractstill pictures from real-time video, through the use of a Data Translation DT2255 Frame Grabberboard used in conjunction with a Macintosh II computer, quality "photos" of the flow wereobtained. The Frame Grabber board digitizes and stores an image from video signal which can bedisplayed with square-pixel accuracy on a Macintosh II high resolution computer screen. Thephotos have also been enhanced through the use of ImageStudio 1.5 software. This softwareprovides the user with the ability to alter a digitized "photo." Contrast enhancement and imagesharpening have been used to improve the quality of the pictures for presentation in this thesis.This section will present a few representative "photos" that have been acquired in this manner.
Figures 15, 16,17, and 18 show the typical flow structure at J=0.4, J=0.8, J=l.l andJ=l.2. respectively, for "ahead" performance of the propeller. Figure 15 represents the flowstructure characteristic of low J operation of the propeller. The sharply curved smoke streamlinesentering the plane of the propeller are a result of flow convergence through the propeller. When thedynamometer system and wind tunnel are operating at steady state conditions, the mass flow rate atany cross-section of the wind tunnel must be a constant. Assuming that the upstream velocity isconstant across the wind tunnel cross-section, and because the propeller slip stream velocity ismuch larger than the free-stream velocity at low J, there must be a component of velocity directedtoward the propeller disk area due to the acceleration of the flow which occurs at the plane of thepropeller. Also, because the upstream velocity is small, the relative angle of attack of the incomingflow seen by the propeller blades is large. As with any airfoil section, excessively large angles ofattack are met with flow separation and transition to turbulent flow. These phenomena are depictedby the disturbed wake seen behind the propeller.
Figure 16 represents the "ahead" operation flow characteristics for a propeller efficiency ofapproximately 1=0.70 at J=0.8. Although the wake structure of the propeller is seen to be muchmore defined than in Figure 15, which is the result of little or no flow separation from the propellerblades, losses in efficiency still occur because of the formation of propeller tip vortices. Theselosses are analogous to the induced flow caused by tip vortices of a finite wing. Less curvature ofthe incoming streamlines is also revealed in Figure 16, a result of the higher free-stream velocityencountered at higher J. It should also be noted that the propeller blade passage "cuts". seendirectly below each vortex structure, are somewhat parabolic in shape. This reveals that thepropeller blade is not generating as much thrust at the blade root and tip as it is in the blade middleregions. Uniform blade loading would yield a "cut" parallel to the plane of the propeller blades.The propeller blade is not evenly loaded, resulting in less than maximum efficiency.
Figure 17 shows the propeller operating at its most efficient conditions (J= 1.1). Incomingsmoke streamlines are seen to be completely perpendicular to the plane of the propeller and verysmall tip vortices are evident reflecting minimized tip effect losses. The propeller blade passage"cuts," seen directly below each vortex, also reveal a uniformly loaded propeller. This shows thateach section of the propeller blade is generating an equal amount of thrust.
Figure 18 shows the flow characteristics for the propeller operating at an efficiency ofapproximately T!--0.83 at J=1.2. The very low relative angle of attack of the free-stream flow seenby the propeller blades results in a loss of thrust at this high J. Both minimal tip effect losses andan evenly loaded propeller are again evident in Figure 18, as they were in Figure 17, but with therelative angle of attack of the free-stream converging on the cord line of the propeller blades, lessthrust is being developed.
These visualization techniques can be extended to elucidate greater detail in flow structure,such as the flow separation and the fine structure and spacing of the tip vortices. Examples of thisare shown in Figures 19, 20 and 21 for the four-bladed marine propeller. Figures 19 and 20 showfrontal views of "ahead" propeller operation at J--0.3 and J--0.8, respectively. Flow separation atthe blade of the propeller is seen in the low advance ratio "photo" (Figure 19) and the three

9
dimensionality of the flow structure is clearly seen in the J--0.8 "photo" (Figure 20). Figure 21reveals how the tip vortices are formed and shed parallel to the angle of the propeller blade tip. Theability to correlate propeller performance measurements with flow structure visualization makes thenew propeller dynamometer a very useful tool.
c. Plans for Next Year's Research
We plan to continue to use the advanced dynamometer with the objective to incorporate itinto our studies of the effect of variable inflow conditions in which the fluid mechanical andacoustic characteristics of the flow field. To this end, we plan to begin the third stage of ourresearch, in which the rotor is operated in a duct. Once this is completed, we plan to begin thefourth stage, in which the effect of upstream turbulence intensity (between 0.07% and 5.0%) onperformance will be determined, and acoustic measurements will be made to ascertain the influenceof the turbulence length scale at the same intensity and its relation to the radiated noise spectrum.
II. WIND TUNNEL/ACOUSTIC FACILITY
a. Description of Research
In order to prepare for the acoustic measurements to be made, two studies were performed:1.) modification of one of the existing low turbulence, closed test section wind tunnels and 2.) thedesign of a new low-noise low-turbulence, free-jet wind tunnel. The design criteria included a freejet-anechoic chamber facility with a low turbulence (i.e. 0.07%) uniform flow (maximum velocityof 100 ft/sec) with a cross-section of approximately four square feet and the low frequency cut offof approximately 150 Hz.
b. Significant Results since 1 April 1989
Modifications to one of the existing wind tunnels would require a new diffuser with amuffler and an anechoic chamber. Because of space limitation only a very small anechoic chambercould be built. The opportunity to design and build a new facility presented itself when theUniversity c6v..ided to make a new home for the Aerospace Research Laboratory. The designstudies for the inlet, anechoic chamber, and diffuser began in mid-July. Visits were made to theaeroacoustic wind tunnel facilities at NASA Lewis Research Center and General Electric Company,Evandale, Ohio to discuss wind tunnel design and acoustic measurement techniques.
Working with the architects for the new Aerospace Research Laboratory and EckelIndustries, Inc., an anechoic chamber was designed. This will have a working space 20 ft wide by26 ft long by 8 ft high with 22 in. fiberglass sound absorbing wedges on all six sides. This wedgeconfiguration will provide a low frequency cutoff of 150 Hz. Above the cutoff frequency, thewedges will have a coefficient of energy absorption at normal incidence equal to 0.99 or greater. Alow turbulence subsonic free-jet/closed test section wind tunnel was also designed. This will fitinto the anechoic chamber for aerodynamic measurements of sound pressure level and soundintensity generated from propellers, airfoil configurations, etc. The cross-sectional area of thetunnel test section will be four square feet with a maximum velocity of approximately 100 ft/s. Thetunnel has been designed so that it can be removed from the chamber to accommodate otheracoustic experiments. The floor plan of the anechoic facility and wind tunnel are shownschematically in Figure 22.
c. Plans for Next Year's Research
Construction drawings of the new free-jet/closed test section wind tunnel facility will becompleted and the fabrication of components will begin. Plans are being made so that the windtunnel can be incorporated into the new Aerospace Research Laboratory and be ready in early

10
Spring 1991. Pilot experiments using one of our existing wind tunnels to develop inflowmeasurement techniques will continue.
III. FLUID DYNAMIC & ACOUSTIC MEASUREMENTS
a. Description of Research
Turbomachine rotors usually are located where the approaching flow is nonuniform. As aresult, the rotor blades are subject to fluctuating forces that are induced by thc irregular andunsteady inflow patterns. This causes vibration of the rotor and its associated structure andproduces the radiation of unwanted noise. Because it is not possible with present technology toeliminate rotor inflow nonuniformities, it is therefore important to determine the rotor's response interms of the fluid mechanical and acoustic characteristics of the flow field both upstream anddownstream of the rotor. To this end, experiments will be conducted in which the flow field'smean velocities, fluctuating components and spectra, and resultant sound intensities of the radiatednoise are measured. These measurements will be conducted in conjunction with flow visualizationstudies aimed at identifying possible flow structures responsible for noise at selective frequencies.Simultaneous measurements of rotor performance also will be made.
b. Significant Results since 1 April 1989
Initial flow visualization studies have been conducted during the rotor-dynamometershakedown tests and have ascertained that it is possible with our present system to clearly identifyflow structures about the blade's surfaces, as described in section I. The goal using this approachis to identify what flow structures (e.g., separated regions along the blade's surface) contribute todegradation in rotor performance and. possibly, any resulting unwanted noise. In this manner,regions of interest can be identified for subsequent detailed flow and blade surface measurements.
Preliminary acoustic measurements were performed in our existing wind tunnel facility tostudy the influence of upstream turbulence intensity. The measurements were carried out using twophase-matched 0.5 in. microphones separated by a 12 mm spacer in the range of 0 to 4000 Hz insix octave bands. This is because the propeller noise is comprised of two components; one, adiscrete low frequency contribution that results from the rotation of the blades, and, the other, abroadband contribution that results from turbulence and wake effects. The data obtained from thesemeasurements currently is being analyzed.
c. Plans for Next Year's Research
The accuracy of the twin-microphone technique will continue to be studied. If this approachis deemed appropriate after several benchmark tests, this technique will be applied in a series ofinitial experiments to determine the influence that the intensity and scale of the inflow turbulencehas on the radiated noise. In addition, detailed flow visualization and fluid dynamic flow fieldcharacterization studies will be conducted coupled with the rotor performance measurements.

11
REFERENCES
1. Asson, K.A., "The Development of an Advanced Dynamometer System to ExperimentallyDetermine Propeller Performance," M.S. Thesis, Department of Aerospace & MechanicalEngineering, University of Notre Dame, May, 1990.
2. Mueller. T. J., "Flow Visualization by Direct Injection," Chapter 7, pp.307-375, FluidMechanics Measurements, Washington D.C., Hemisphere Publishing Co, 1983.
3. Mueller, T. J., "Smoke Visualization of Subsonic and Supersonic Flows (The Legacy otF.N.M. Brown)," Final Report UNDASTN-34121, AFSOR-TR-78-1262, June 1978.
CONCLUDING REMARKS
All phases of this project arc on schedule at the present time. During the next year, themajor effort will be to include the variable inflow conditions i.e., effect of upstream turbulenceintensity and scale. The techniques necessary to obtain detailed flow visualization, fluid dynamicsand acoustic properties of the propeller flowfields will continue to be developed. Performancestudies with and without the propeller duct will also be made. Further analysis of all data will beperformed to determine where further efforts need to be concentrated.
Very truly yours,
Thomas J. Mueller, Ph.D.Roth-Gibson Professor ofAerospace Engineering
Patrick F. Dunn, Ph.D.Associate Professor, Aerospaceand Mechanical Engineering
cc: Dr. F. M. KobayashiDr. A.N. MichelONR Regional Office (1)NRL (6)DTIC (12)
LDT ORQUE oqe odtinn
TerminSignotoRPM In Procestrolng
--- Fiur 1---------------- Schematic-- Drawig-of-he-Nw-Pro elleDPimmee Mesuemn Syste
00
C->
I.~z
Ul
uocM
0Lo >.
z 0)
UU z

Dynamometer ShaftAsseMbi t
Now Hampshire RI-542KFDeep Groove Torque Beari ngs Race for Fafnir Radial Bearinga Phenalic Dynamometer
Miniature Bearing Inc.Rotolin ML500-875- 1Precision Linear Bearings
Propeller ShaftAssembi Vj
Chrome Plating
Spri ng j LYDT CoreRetens ion-Collar HiFafnir SSRI-61 4
> Radial Bearings
Transverse Shaft @)\Locking
Nut
Figure 3 Detailed Drawing of the Dynamometer ShaftAssembly and Propeller Shaft Assembly
-a)
tLAo
iu a3<C
LA
V)
E 00
C.,
Cl0)
(JO
Li CLA--
LL
L)
L-
)
a) L
04)
,do L
r
E -ea)0
C-li C
t-t tt t0
IQ- cOizl to
Regulatorwzg
KeroseneReservoir
Sme ake f
Blower * 9
Figure 5 Kerosene Smoke Generator
Inka Rag
SmokeTubes
Smoke
Figure 6 Kerosene Smoke Rake
0.5
0.4
0.3
CT0.2
0.1
0.00.10
0.08
0.06Ca
0.04
0.02
0.00 "1.0
0.8
0.6 M m
0.4
0.2 1"- Navy Dea
0.0 * p * I p I l0.2 0.4 0.6 0.8 1.0 1.2 1.4
J
Figure 7 Navy #3714 Ahead PropellerPerformance Coefficients vs J(First Test Conducted in Series of Three)(Thrust Retention Spring k=1.50 lb/in.)

0.5 1 1 1 1 1
0.3
CT 0.2
0.1
0.0 p * I .
0.0
0.08
0.06
0.04
0.02
0.00 I
1.2
1.0 U
0.8
oi .6
0.4 _ _ _ _ _ _ _ _ _ _ _ _
m New Dynamometer0.2 -Navy Data
0.01 1 1
0.2 0.4 0.6 0.8 1.0 1.2 1.4
J
Figure 8 Navy #3714 Ahead PropellerPerformance Coefficients vs J(Third Test Conducted in Series of Three)(Thrust Retention Spring k=1 .50 lb/in.)
0.10
0.08 a New Dynamometer
0.06
0.04
0.02
0.00 --- I . . I0.2 0.4 0.6 0.8 1.0 1.2 1.4
J
Figure 9 Navy #3714 Ahead Propeller TorqueCoefficient vs J Using Corrected TareTorque Values(Thrust Retention Spring k=1.50 lb/in.)
0.5
0.4
0.3
C T0.2
0.1
0.00.10,
0.08
0.06
0.04
0.02
0.001.0
0.8 0
0.6
0.4__ _ _ _ _ _ _
*New Dynamometer0.2 - Navy Data
0.0 I . I . I
0.2 0.4 0.6 0.8 1.0 1.2 1.4
J
FigurelO Navy #3714 Ahead PropellerPerformance Coefficients vs J(Conducted Six Days After First Tests)(Thrust Retention Spring k=1.50 lb/in.)
0.5
0.4
0.3
CT 0.2
0.1
0.0 . I
0.10
0.08
0.06
CQ 0.04
0.02
0.00 .
1.0
0.8
0.6
0.4
0.2 - New Dynamometer-Navy Data
0.0 - I- . I
0.2 0.4 0.6 0.8 1.0 1.2 1.4
J
Figure 11 Navy #3714 Ahead Prop~eIlerPerformance Coefficients vs J(Thrust Sensor Retention Spring k.i1.35 in/Ib)

0.50.4 m
0.3
CT 0.2
0.1
0.00.10 "
0.08
0.06
C 0.04
0.02
0.00 --- -1.0
0.8m
0.6
0.4
New Dynamometer
0.2 Navy Data
0.0 I * I I . I0.2 0.4 0.6 0.8 1.0 1.2 1.4
J
Figure 12 Navy #3714 Ahead PropellerPerformance Coefficients vs J(All Tests Combined)
-0.0
-0.1
CT -0.2 I
-0.3
-0.40.00 . ,
-0.02
c. -0.04
-0.06
-0.08
0.7 ' "
0.6
0.5
0.4
0.3
0.2 im New Dynamometer I0.1 I- Navy Data
0.0 . i . I I
0.2 0.4 0.6 0.8 1.0 1.2
J
Figure 13 Navy #3714 Backing PropellerPerformance Coefficients vs J(First Test Conducted)(Thrust Sensor Retention Spring k-1.25 lb/in.)
-0.0 * . ,
-0.1 .. U
U
C T -0.2
-0.3U
-0.4 U
0.00
-0.02
Ca -0.04
-0.06
-OR *A"
0.8 , *
-0 EU
0.6 m
0.4
0.2 m New Dynamometer- Navy Data
0 .0 . ..
0.2 0.4 0.6 0.8 1.0 1.2
J
Figure 14 Navy #3714 Backing PropellerPerformance Coefficients vs J(Second Test Conducted)(Thrust Sensor Retention Spring k-1.25 lb/in.)
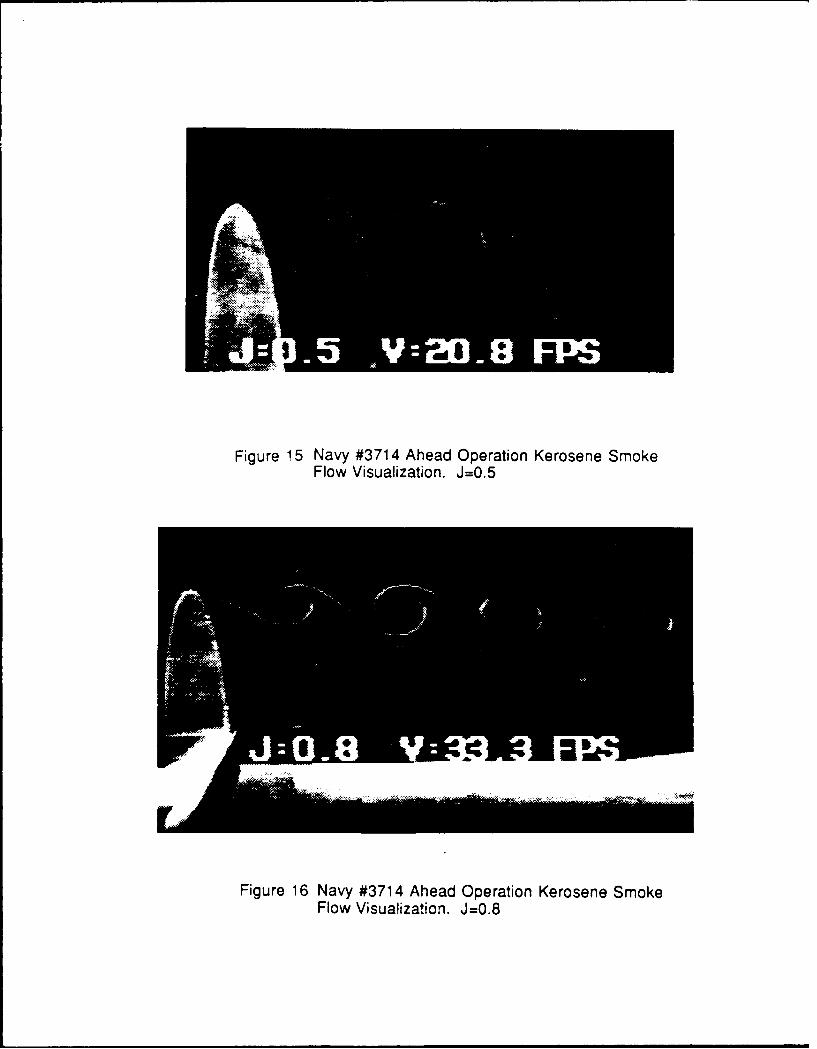
Figure 15 Navy #3714 Ahead Operation Kerosene SmokeFlow Visualization. J=0.5
Figure 16 Navy #3714 Ahead Operation Kerosene SmokeFlow Visualization. J=0.8

Figure 17 Navy #3714 Ahead Operation Kerosene SmokeFlow Visualization. J=1.1
Figure 18 Navy #3714 Ahead Operation Kerosene SmokeFlow Visualization. J=11.2
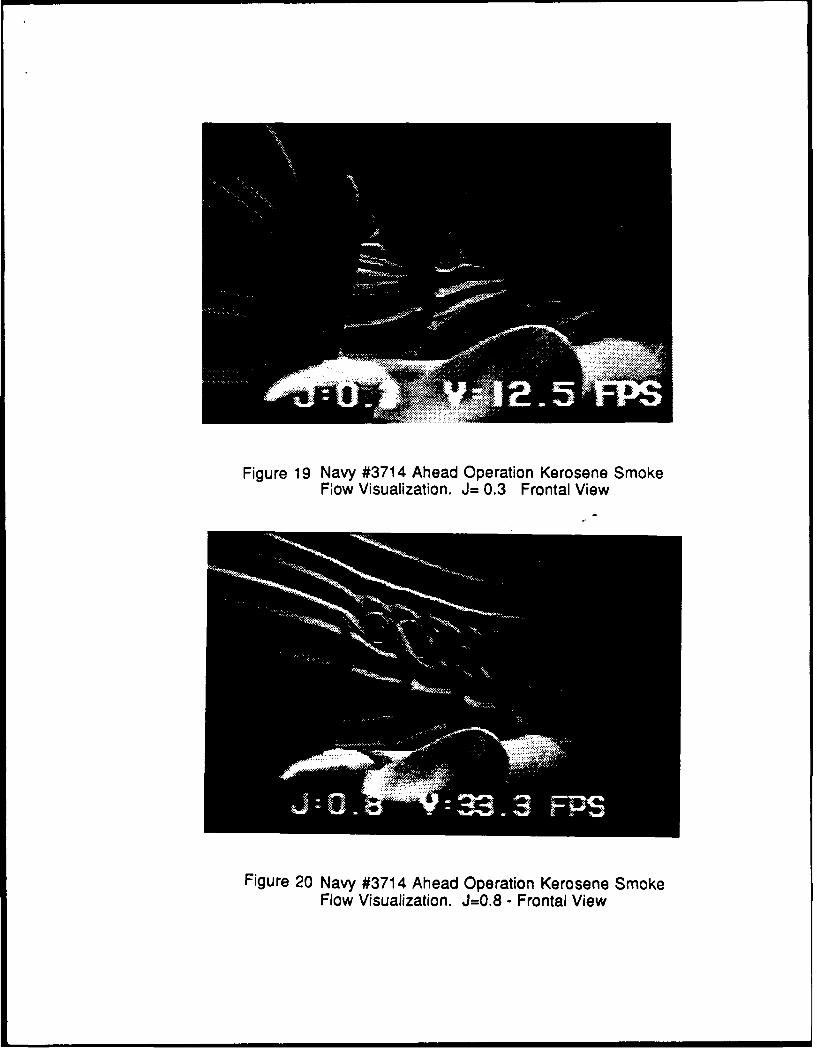
Figure 19 Navy #3714 Ahead Operation Kerosene SmokeFlow Visualization. J= 0.3 Frontal View
Figure 20 Navy #3714 Ahead Operation Kerosene SmokeFlow Visualization. J=0.8 - Frontal View
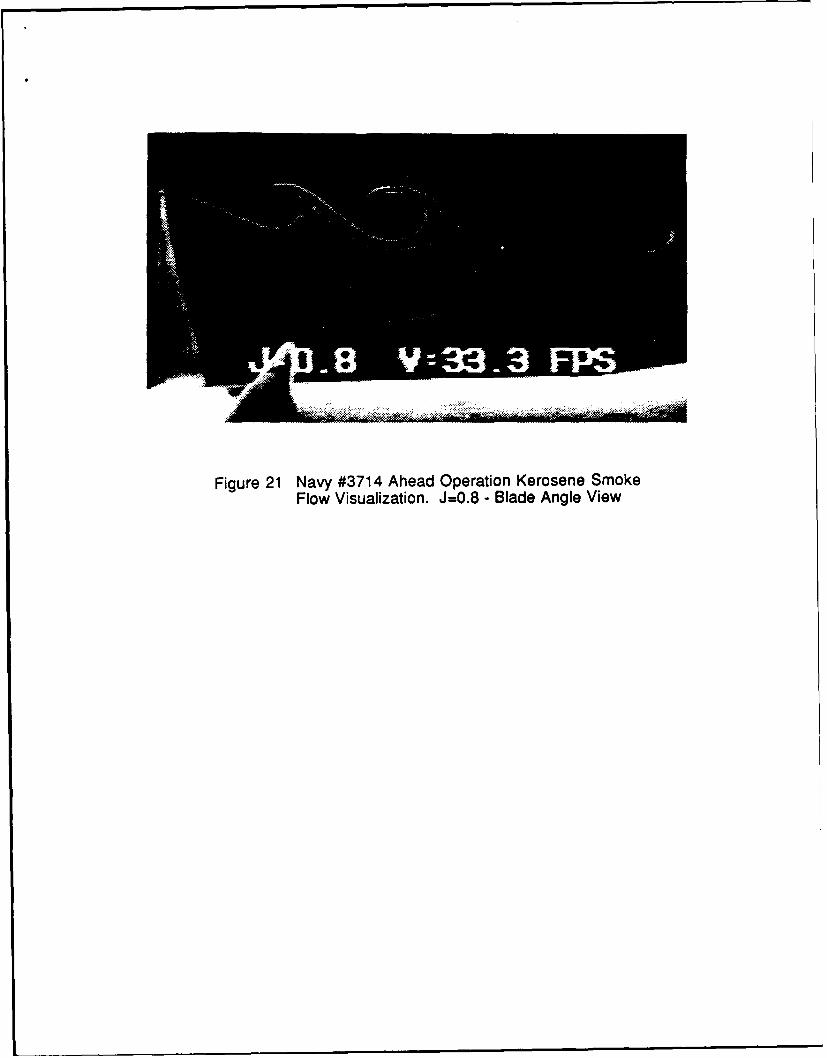
Figure 21 Navy #3714 Ahead Operation Kerosene SmokeFlow Visualization. J=0.8 - Blade Angle View

II
(U
3
0
Uir0