Embed Size (px)
Citation preview
University of Groningen
The Work Role Functioning Questionnaire 2.0 (Dutch Version)Abma, Femke I.; van der Klink, Jac J. L.; Bultmann, Ute
Published in:Journal of Occupational Rehabilitation
DOI:10.1007/s10926-012-9379-8
IMPORTANT NOTE: You are advised to consult the publisher's version (publisher's PDF) if you wish to cite fromit. Please check the document version below.
Document VersionPublisher's PDF, also known as Version of record
Publication date:2013
Link to publication in University of Groningen/UMCG research database
Citation for published version (APA):Abma, F. I., van der Klink, J. J. L., & Bultmann, U. (2013). The Work Role Functioning Questionnaire 2.0(Dutch Version): Examination of its Reliability, Validity and Responsiveness in the General WorkingPopulation. Journal of Occupational Rehabilitation, 23(1), 135-147. https://doi.org/10.1007/s10926-012-9379-8
CopyrightOther than for strictly personal use, it is not permitted to download or to forward/distribute the text or part of it without the consent of theauthor(s) and/or copyright holder(s), unless the work is under an open content license (like Creative Commons).
The publication may also be distributed here under the terms of Article 25fa of the Dutch Copyright Act, indicated by the “Taverne” license.More information can be found on the University of Groningen website: https://www.rug.nl/library/open-access/self-archiving-pure/taverne-amendment.
Take-down policyIf you believe that this document breaches copyright please contact us providing details, and we will remove access to the work immediatelyand investigate your claim.
Downloaded from the University of Groningen/UMCG research database (Pure): http://www.rug.nl/research/portal. For technical reasons thenumber of authors shown on this cover page is limited to 10 maximum.
Download date: 28-01-2022
ORIGINAL PAPER
The Work Role Functioning Questionnaire 2.0 (Dutch Version):Examination of its Reliability, Validity and Responsivenessin the General Working Population
Femke I. Abma • Jac J. L. van der Klink •
Ute Bultmann
Published online: 7 August 2012
� Springer Science+Business Media, LLC 2012
Abstract Purpose: The promotion of a sustainable, heal-
thy and productive working life attracts more and more
attention. Recently the Work Role Functioning Question-
naire (WRFQ) has been cross-culturally translated and
adapted to Dutch. This questionnaire aims to measure the
health-related work functioning of workers with health
problems. The aim of this study is to evaluate the reliability,
validity (including five new items) and responsiveness of the
WRFQ 2.0 in the working population. Methods: A longitu-
dinal study was conducted among workers. The reliability
(internal consistency, test–retest reliability, measurement
error), validity (structural validity-factor analysis, construct
validity by means of hypotheses testing) and responsiveness
of the WRFQ 2.0 were evaluated. Results: A total of
N = 553 workers completed the survey. The final WRFQ
2.0 has four subscales and showed very good internal con-
sistency, moderate test–retest reliability, good construct
validity and moderate responsiveness in the working popu-
lation. The WRFQ was able to distinguish between groups
with different levels of mental health, physical health, fati-
gue and need for recovery. A moderate correlation was found
between WRFQ and related constructs respectively work
ability and work productivity. A weak relationship was
found with general self-rated health, work engagement and
work involvement. Conclusion: The WRFQ 2.0 is a reliable
and valid instrument to measure health-related work func-
tioning in the working population. Further validation in
larger samples is recommended, especially for test–retest
reliability, responsiveness and the questionnaire’s ability to
predict the future course of health-related work functioning.
Keywords Measurement properties � Validation �Questionnaire � Work functioning
Introduction
Along with the focus of occupational health research and
practice on work disability prevention, the promotion of a
sustainable, healthy and productive working life attracts
more and more attention. In view of the expected shortages
in the labor force and demographic changes, the challenge
is to help workers stay at work in a healthy and productive
way. However, valid measurement of the impact of health
on work functioning is an important research challenge [1].
In line with this, measurement tools are needed that go
beyond the simple dichotomy of working versus non-
working, but that assess how workers function at work.
Measuring work functioning can provide valuable infor-
mation for both practitioners and researchers. Instruments
that measure work functioning can be used to evaluate
interventions aimed at work rehabilitation and the manage-
ment and prevention of work (dis)ability, and to monitor how
health problems impact on work functioning [2]. Health-
related work functioning can be seen as a continuum that
varies from working successfully (i.e., the ability to meet all
work demands for a given state of health) to work absence
(i.e., the inability to meet all work demands given a state of
health) [3]. The joint influence of work and health determines
an individual’s work functioning.
Multiple self-reported questionnaires have been devel-
oped to measure the impact of health on work functioning.
Overviews of existing questionnaires are provided in
F. I. Abma (&) � J. J. L. van der Klink � U. Bultmann
Department of Health Sciences, Community and Occupational
Medicine, University Medical Center Groningen,
University of Groningen, Antonius Deusinglaan 1, FA10,
Room 610, 9713 AV Groningen, The Netherlands
e-mail: [email protected]
123
J Occup Rehabil (2013) 23:135–147
DOI 10.1007/s10926-012-9379-8

several reviews [2, 4–12]. These questionnaires can be used
to evaluate lost productivity at work, to monitor abilities to
accomplish the work role and evaluate interventions
designed to improve work functioning [2].
Recently, one of these questionnaires, the Work Role
Functioning Questionnaire (WRFQ), has been successfully
cross-culturally translated and adapted for use in other cultural
contexts than the US, i.e. translations to Canadian French [13],
Brazilian Portuguese [14] and Dutch [15]. The Work Role
Functioning Questionnaire (WRFQ) was used because it is a
generic instrument developed to represent a broad variety of
both job demands and health problems. In addition, the
WRFQ is freely available in the literature for professionals
and researchers. No published data is available for the original
27 item WRFQ, but the translated versions have shown good
measurement properties in workers with musculoskeletal
disorders [13, 14] and workers with chronic conditions [15].
During the interviews conducted as part of the pre-test during
the cross-cultural adaptation to Dutch [15], participants were
asked whether they missed any elements of their work in the
questionnaire. Based on the participants suggestions and a
literature search, five new items were formulated to reflect the
changes in the nature of work in recent decades: multi-tasking,
development of complementary skills, and increased delega-
tion and autonomy of workers [16]. This requires that the
worker has the flexibility to adapt to these changes, is flexible
to multi-task and prioritize, therefore work demands flexi-
bility. Hence, five new items addressing these aspects were
developed and added to the original items.
Before using an instrument, it is important to evaluate
the measurement properties (e.g., reliability, validity,
responsiveness) [17]. In addition, a recent review on the
measurement properties of health-related work functioning
instruments showed the need for more and better validation
studies [4]. To date, little is known about the measurement
properties of the Work Role Functioning Questionnaire 2.0.
In addition, little is known about the relationship of this
questionnaire and other constructs such as health status and
job characteristics. A question to be addressed is as to
whether the WRFQ is able to distinguish between groups
with a different health status, or groups with different job
demands. If the instrument is to be used as a detection
instrument to identify workers with decreased work func-
tioning, it should be able to differentiate between these
groups. It is also interesting to investigate the correlation
between the WRFQ scores and a comparator instrument,
such as the Endicott Work Productivity Scale [18]. If both
instruments measure a related construct, it can be expected
that the scores of both instruments have a high correlation.
The relationship with other related constructs such as work
ability, work engagement, and work involvement are of
interest to explore.
Therefore, the aim of this study is to evaluate the reli-
ability, structural validity (including the five new items),
construct validity (by means of hypotheses testing) and
responsiveness of the WRFQ 2.0 in the general working
population. The COnsensus-based Standards for the selec-
tion of health status Measurement INstruments (COSMIN)
taxonomy was used in the design of the study [19–21].
Methods
Procedures
A longitudinal survey was conducted among workers. Two
versions of the baseline questionnaire were available, a short
version (completion in approximately 10 min) and an
extended version (completion in approximately 30 min).
Participants were recruited from several companies and
organizations in diverse work settings in the Netherlands,
and via multiple approaches. Two companies provided the
researchers the opportunity to distribute paper versions of the
survey during work hours, one company provided email
addresses of their workers (extended version). Another
group of participants was reached by an advertisement in a
regional newspaper and flyers that were distributed in a local
hospital (extended version). One organization distributed an
email to participants of their regular mailing list with a link to
the online survey (short version). One organization provided
home addresses of their participants to send an invitation
letter to participate in the study. In this letter, a link to the
online survey and a password was provided (short version).
These participant were also invited to complete a follow-up
survey after 1 week. Participants received no incentive for
their participation. Participants who completed the extended
version were invited to provide their (email) address to
receive a follow-up survey at 3 months.
Participants
The inclusion criteria were (1) aged between 18 and
64 years, (2) working at least 12 h per week (in the past
4 weeks). Exclusion criteria were (1) not able to read and
understand Dutch (the language of the questionnaire), (2)
being pregnant or (3) having plans to stop working within
6 months (for example due to retirement). As for ethical
standards, in this study we adhered to the Declaration of
Helsinki and the guidelines of the association of universi-
ties in the Netherlands [22]. According to the medical
ethics committee of the University Medical Center Gron-
ingen no ethical approval was necessary. Participation in
the study was voluntary, all participants provided informed
consent, and answers were processed anonymously.
136 J Occup Rehabil (2013) 23:135–147
123

Measures
Work Functioning
The Work Role Functioning Questionnaire (WRFQ) mea-
sures the perceived difficulties in meeting work demands
among employees given their physical health or emotional
problems [2, 3, 15, 23]. The original questionnaire consists of
27 items, divided into five subscales: work scheduling
demands, physical demands, mental demands, social
demands, and output demands. The recall period is 4 weeks
and the response options range on a five point scale from
0 = difficult all the time (100 %), 1 = difficult most of the
time, 2 = difficult half of the time (50 %), 3 = difficult
some of the time, 4 = difficult none of the time (0 %). There
is a response option ‘Does not apply to my job’. Subscale
scores are summed up separately by adding the answers in
the subscale, divided by the number of items and then mul-
tiplied with 25 to obtain percentages between 0 and 100, with
higher scores indicating better work functioning. The scores
on ‘Does not apply to my job’ were transformed to missing
values. If more than 20 % or more items were missing, the
score was set to missing. For the 2.0 version, five new items
were formulated based on the cross-cultural adaptation to
Dutch [15] and included in the questionnaire to test the
reliability and validity. The WRFQ 2.0 version consists of 27
items, divided into four subscales: work scheduling and
output demands (WSOD), physical demands (PD), mental
and social demands (MSD), and flexibility demands (FD),
comprising the new items.
Work Productivity
The Dutch version of the Endicott Work Productivity Scale
(EWPS) was used to measure a related construct to work
functioning with a comparable self-report instrument [18].
The EWPS consists of 25 items and each item is rated on a
5-point scale (0 = Never, 1 = Rarely, 2 = Sometimes,
3 = Often, and 4 = Almost always). The total score ranges
from 0 (best possible score) to 100 (worst possible score) and
is calculated by using the sum of the items divided by the
number of items that were scored and multiplied by 25. No
more than 1/3 of missing items are allowed. Information for
the measurement properties of the Dutch version is lacking.
However, data are available for the original version [18]
(Cronbach’s alpha = 0.93) and a Turkish translation in a
common mental disorder setting [4].
General Health
The Short Form-12 is a 12-item health status questionnaire,
with a physical component summary score (PCS-12) and a
mental component summary score (MCS-12) [24]. The 12
items were scored and transformed according to the stan-
dard procedure [25]. The scores were transformed to a
mean of 50 and a standard deviation of 10 in the general
US population, with higher scores reflecting better health.
In an overall question participants were asked ‘‘In general,
how would you rate your health?’’ with the response cat-
egories ‘‘very good’’, ‘‘good’’, ‘‘fair’’, ‘‘poor’’ or ‘‘very
poor’’. The component scores were dichotomized at the
population means (50).
Fatigue
Fatigue was measured by the ‘subjective experience of
fatigue’ subscale of the Checklist Individual Strength (CIS-
8) [26, 27]. This 8 item subscale was designed to measure
general severity of fatigue. The items were scored on a
seven-point scale (1 = yes, that is true to 7 = no that is not
true), with low scores indicating low fatigue. The CIS asks
respondents about how they felt in the past 2 weeks. A total
score was calculated by summing the items (reversed if
necessary) and has a Cronbach’s alpha (a) of 0.88 [26]. The
total score was divided into tertiles.
Need for Recovery
Need for recovery was measured with the Need for
Recovery (NFR) subscale of the Dutch questionnaire on
Perception and Judgment of Work (VBBA) [28, 29]. The
scale consists of 11 dichotomous items (yes/no) about the
short-term effects of a day of work. The total score has a
range from 0 to 100 with a higher score indicating higher
need for recovery (a = 0.88). The total score was divided
into tertiles.
Job Content
The Dutch version of the Job Content Questionnaire (JCQ)
was used to measure the job characteristics [30–33].
Hypotheses were formulated for two domains: Psycho-
logical job Demands (a = 0.67) and Decision Latitude
(a = 0.77) (Skill Discretion ? Decision Authority). Items
were scored on a four-point scale (1 = totally disagree to
4 = totally agree). Scale scores were divided into tertiles.
Work Ability
Three single items of the Work Ability Index (WAI) [34]
were included in the survey. The first single item is the
overall item ‘‘current work ability compared with the
lifetime best’’, with a possible score of 0 = completely
unable to work to 10 = work ability at its best. A recent
study showed that the overall single item highly correlates
with the total work ability score (in a population of women
J Occup Rehabil (2013) 23:135–147 137
123

on long term sick leave) [35]. Two other items were
included that measure the work ability in relation to the
respectively physical and mental demands of the job, with
a possible score of 1 = very poor to 5 = very good.
Work Engagement
The 9-item version of the Utrecht Work Engagement Scale
(UWES) was used to measure work engagement [36–38].
Work engagement is considered to be the antipode of
burnout and is defined as a positive, fulfilling work-related
state of mind that is characterized by vigor, dedication, and
absorption [37]. The items were rated on a 7-point scale
from 0 = never to 6 = always. A total score was calcu-
lated by taking the mean of all items (a = 0.93).
Work Involvement
The Work Involvement Scale (WIS) was used to measure
the importance of work and values about the goodness of
work [39]. This six item scale was rated on a four-point
scale (1 = totally agree to 4 = totally disagree). A total
score was calculated by taking the weight mean of all
items. A high score indicates a high work involvement.
Sociodemographics
Participant provided information about age, gender,
income, job type and their current work status.
Statistical Analysis
All analyses were performed with SPSS software (SPSS.
Version 18.03 Chicago, IL; 2010).
Structural Validity
Five new items were added to the original 27 items.
Exploratory factor analyses (EFA) were performed to
explore the new subscale structure, using principal com-
ponent analysis (PCA) with varimax rotation and pairwise
deletion. A combination of the scree plot, eigenvalues,
factor loadings and interpretation of the factors was used to
decide on the number of factors. A set of decision rules was
formulated in order to reduce the number of items [40].
Items were explored for factor loading on its own factor
(good if [0.5), other factors (good if \0.3), the inter-cor-
relation of items was explored (ideal between [0.2 and
\0.8), item-to-total correlation (ideal between 0.3 and 0.9),
Cronbach’s alphas and alpha-if-item-deleted (ideal between
0.7 and 0.9). If an item could not meet at least two of these
criteria it was considered a candidate for exclusion. Before
excluding an item the contribution of the item to the
conceptual model was discussed. If an item was viewed as
important to the construct, it was kept.
Reliability
Cronbach’s alpha coefficients were calculated for each
subscale of the WRFQ and the total score (ideal between 0.70
and 0.95 [40]). For test–retest reliability, a subsample
recruited in one organization received a second question-
naire after 1 week. For these participants the intra-class
correlation coefficient (ICC) was calculated for test–retest
reliability (ideal [0.7 on group level and [0.9 on individual
level [41]) and the standard error of measurement (SEM) was
calculated for measurement error. The ICC and SEM anal-
yses were performed on a stable subgroup that completed the
questionnaire twice in similar conditions, with a 1 week
interval [42]. The single measure ICC (agreement two-way
random model) and SEM = SDdiff/H2 were calculated.
Description of the Questionnaire
The WRFQ 2.0 mean scores, standard deviations (SD),
range, % at floor/ceiling were presented for the total score
and subscales. Floor and ceiling effects were considered if
more than 15 % of the participant reported the lowest or
highest scores [42]. Participants scores were presented by
health status and job type.
Construct Validity by Means of Hypotheses Testing
The construct validity was studied by means of hypotheses
testing, stating the expected correlation or differences. Cor-
relations between constructs are calculated using Pearson’s
correlation coefficient r (\0.4 = ’weak’, 0.4–0.7 = ’moder-
ate’, [0.7 = ’strong’). Differences between two groups were
tested by means of t tests, differences between multiple groups
were tested using ANOVA. The following hypotheses were
formulated.
Hypotheses
1. A moderate to strong correlation was expected
between the WRFQ and EWPS.
2. A moderate correlation was hypothesized between
WRFQ and general health. Workers with lower
health were expected to show lower work functioning
than workers who report a better general health.
3. Workers with low MCS score were expected to show
lower work functioning than workers with high MCS,
especially for the WSOD, MSD, and FD scales.
4. Workers with low PCS were expected to show lower
work functioning than workers with high PCS,
especially for the PD scale.
138 J Occup Rehabil (2013) 23:135–147
123
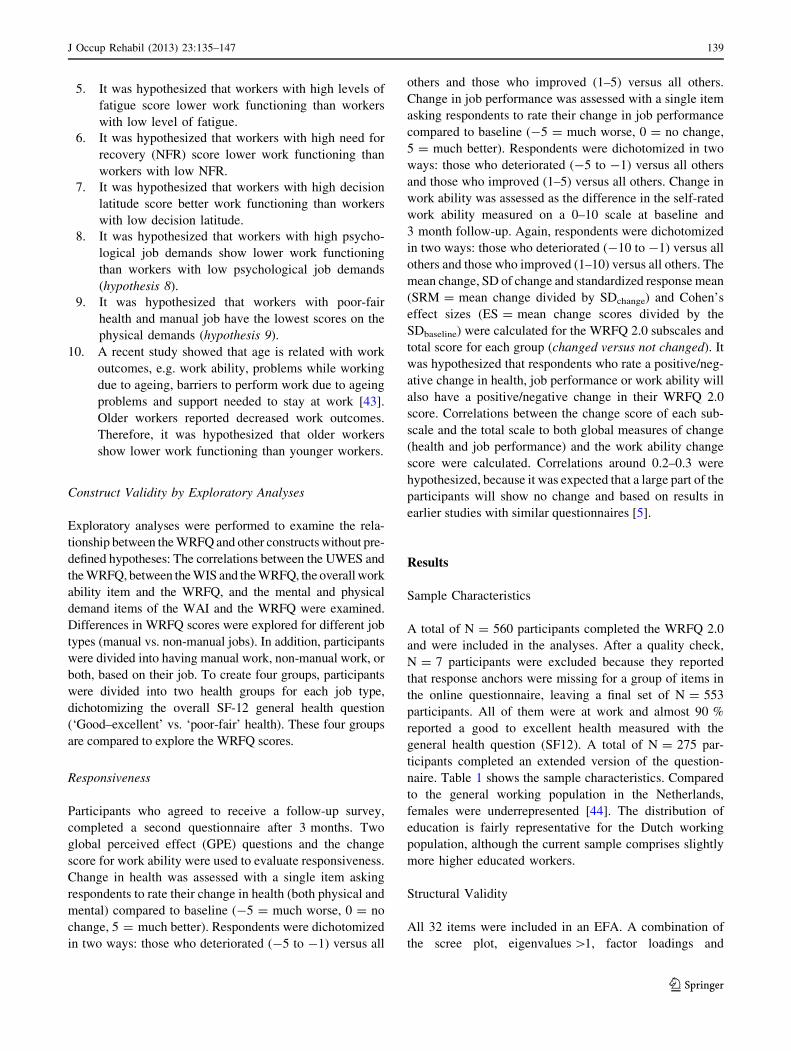
5. It was hypothesized that workers with high levels of
fatigue score lower work functioning than workers
with low level of fatigue.
6. It was hypothesized that workers with high need for
recovery (NFR) score lower work functioning than
workers with low NFR.
7. It was hypothesized that workers with high decision
latitude score better work functioning than workers
with low decision latitude.
8. It was hypothesized that workers with high psycho-
logical job demands show lower work functioning
than workers with low psychological job demands
(hypothesis 8).
9. It was hypothesized that workers with poor-fair
health and manual job have the lowest scores on the
physical demands (hypothesis 9).
10. A recent study showed that age is related with work
outcomes, e.g. work ability, problems while working
due to ageing, barriers to perform work due to ageing
problems and support needed to stay at work [43].
Older workers reported decreased work outcomes.
Therefore, it was hypothesized that older workers
show lower work functioning than younger workers.
Construct Validity by Exploratory Analyses
Exploratory analyses were performed to examine the rela-
tionship between the WRFQ and other constructs without pre-
defined hypotheses: The correlations between the UWES and
the WRFQ, between the WIS and the WRFQ, the overall work
ability item and the WRFQ, and the mental and physical
demand items of the WAI and the WRFQ were examined.
Differences in WRFQ scores were explored for different job
types (manual vs. non-manual jobs). In addition, participants
were divided into having manual work, non-manual work, or
both, based on their job. To create four groups, participants
were divided into two health groups for each job type,
dichotomizing the overall SF-12 general health question
(‘Good–excellent’ vs. ‘poor-fair’ health). These four groups
are compared to explore the WRFQ scores.
Responsiveness
Participants who agreed to receive a follow-up survey,
completed a second questionnaire after 3 months. Two
global perceived effect (GPE) questions and the change
score for work ability were used to evaluate responsiveness.
Change in health was assessed with a single item asking
respondents to rate their change in health (both physical and
mental) compared to baseline (-5 = much worse, 0 = no
change, 5 = much better). Respondents were dichotomized
in two ways: those who deteriorated (-5 to -1) versus all
others and those who improved (1–5) versus all others.
Change in job performance was assessed with a single item
asking respondents to rate their change in job performance
compared to baseline (-5 = much worse, 0 = no change,
5 = much better). Respondents were dichotomized in two
ways: those who deteriorated (-5 to -1) versus all others
and those who improved (1–5) versus all others. Change in
work ability was assessed as the difference in the self-rated
work ability measured on a 0–10 scale at baseline and
3 month follow-up. Again, respondents were dichotomized
in two ways: those who deteriorated (-10 to -1) versus all
others and those who improved (1–10) versus all others. The
mean change, SD of change and standardized response mean
(SRM = mean change divided by SDchange) and Cohen’s
effect sizes (ES = mean change scores divided by the
SDbaseline) were calculated for the WRFQ 2.0 subscales and
total score for each group (changed versus not changed). It
was hypothesized that respondents who rate a positive/neg-
ative change in health, job performance or work ability will
also have a positive/negative change in their WRFQ 2.0
score. Correlations between the change score of each sub-
scale and the total scale to both global measures of change
(health and job performance) and the work ability change
score were calculated. Correlations around 0.2–0.3 were
hypothesized, because it was expected that a large part of the
participants will show no change and based on results in
earlier studies with similar questionnaires [5].
Results
Sample Characteristics
A total of N = 560 participants completed the WRFQ 2.0
and were included in the analyses. After a quality check,
N = 7 participants were excluded because they reported
that response anchors were missing for a group of items in
the online questionnaire, leaving a final set of N = 553
participants. All of them were at work and almost 90 %
reported a good to excellent health measured with the
general health question (SF12). A total of N = 275 par-
ticipants completed an extended version of the question-
naire. Table 1 shows the sample characteristics. Compared
to the general working population in the Netherlands,
females were underrepresented [44]. The distribution of
education is fairly representative for the Dutch working
population, although the current sample comprises slightly
more higher educated workers.
Structural Validity
All 32 items were included in an EFA. A combination of
the scree plot, eigenvalues [1, factor loadings and
J Occup Rehabil (2013) 23:135–147 139
123
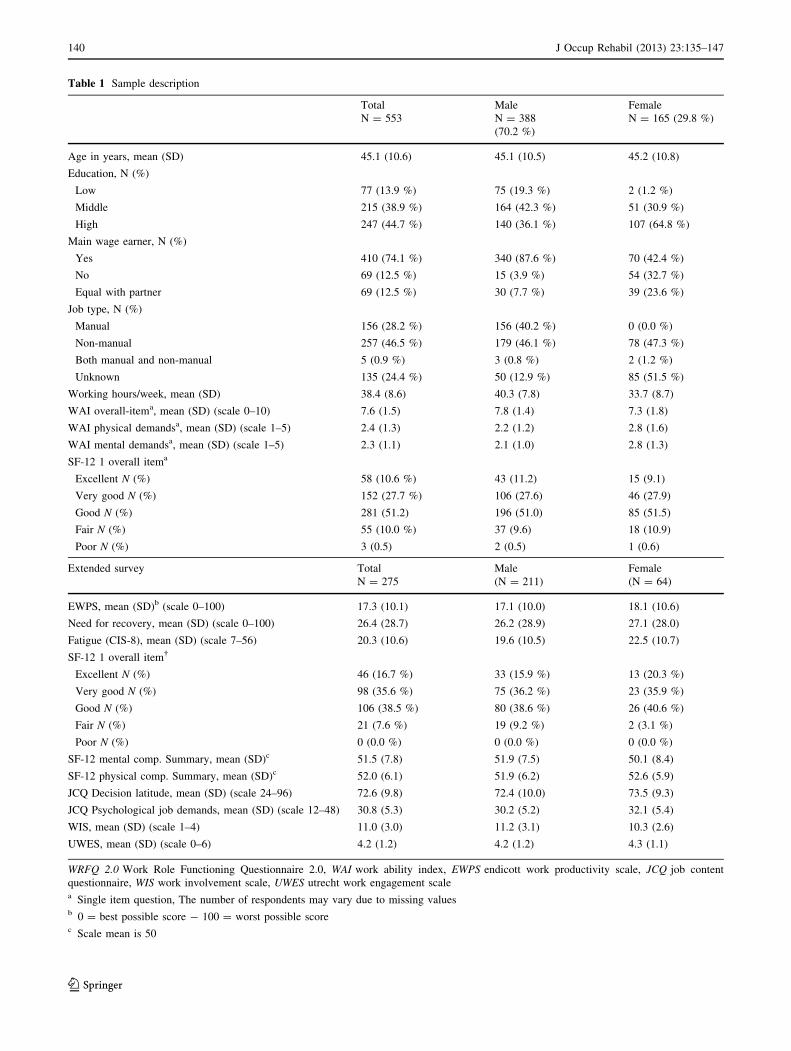
Table 1 Sample description
Total Male Female
N = 553 N = 388
(70.2 %)
N = 165 (29.8 %)
Age in years, mean (SD) 45.1 (10.6) 45.1 (10.5) 45.2 (10.8)
Education, N (%)
Low 77 (13.9 %) 75 (19.3 %) 2 (1.2 %)
Middle 215 (38.9 %) 164 (42.3 %) 51 (30.9 %)
High 247 (44.7 %) 140 (36.1 %) 107 (64.8 %)
Main wage earner, N (%)
Yes 410 (74.1 %) 340 (87.6 %) 70 (42.4 %)
No 69 (12.5 %) 15 (3.9 %) 54 (32.7 %)
Equal with partner 69 (12.5 %) 30 (7.7 %) 39 (23.6 %)
Job type, N (%)
Manual 156 (28.2 %) 156 (40.2 %) 0 (0.0 %)
Non-manual 257 (46.5 %) 179 (46.1 %) 78 (47.3 %)
Both manual and non-manual 5 (0.9 %) 3 (0.8 %) 2 (1.2 %)
Unknown 135 (24.4 %) 50 (12.9 %) 85 (51.5 %)
Working hours/week, mean (SD) 38.4 (8.6) 40.3 (7.8) 33.7 (8.7)
WAI overall-itema, mean (SD) (scale 0–10) 7.6 (1.5) 7.8 (1.4) 7.3 (1.8)
WAI physical demandsa, mean (SD) (scale 1–5) 2.4 (1.3) 2.2 (1.2) 2.8 (1.6)
WAI mental demandsa, mean (SD) (scale 1–5) 2.3 (1.1) 2.1 (1.0) 2.8 (1.3)
SF-12 1 overall itema
Excellent N (%) 58 (10.6 %) 43 (11.2) 15 (9.1)
Very good N (%) 152 (27.7 %) 106 (27.6) 46 (27.9)
Good N (%) 281 (51.2) 196 (51.0) 85 (51.5)
Fair N (%) 55 (10.0 %) 37 (9.6) 18 (10.9)
Poor N (%) 3 (0.5) 2 (0.5) 1 (0.6)
Extended survey Total Male Female
N = 275 (N = 211) (N = 64)
EWPS, mean (SD)b (scale 0–100) 17.3 (10.1) 17.1 (10.0) 18.1 (10.6)
Need for recovery, mean (SD) (scale 0–100) 26.4 (28.7) 26.2 (28.9) 27.1 (28.0)
Fatigue (CIS-8), mean (SD) (scale 7–56) 20.3 (10.6) 19.6 (10.5) 22.5 (10.7)
SF-12 1 overall item�
Excellent N (%) 46 (16.7 %) 33 (15.9 %) 13 (20.3 %)
Very good N (%) 98 (35.6 %) 75 (36.2 %) 23 (35.9 %)
Good N (%) 106 (38.5 %) 80 (38.6 %) 26 (40.6 %)
Fair N (%) 21 (7.6 %) 19 (9.2 %) 2 (3.1 %)
Poor N (%) 0 (0.0 %) 0 (0.0 %) 0 (0.0 %)
SF-12 mental comp. Summary, mean (SD)c 51.5 (7.8) 51.9 (7.5) 50.1 (8.4)
SF-12 physical comp. Summary, mean (SD)c 52.0 (6.1) 51.9 (6.2) 52.6 (5.9)
JCQ Decision latitude, mean (SD) (scale 24–96) 72.6 (9.8) 72.4 (10.0) 73.5 (9.3)
JCQ Psychological job demands, mean (SD) (scale 12–48) 30.8 (5.3) 30.2 (5.2) 32.1 (5.4)
WIS, mean (SD) (scale 1–4) 11.0 (3.0) 11.2 (3.1) 10.3 (2.6)
UWES, mean (SD) (scale 0–6) 4.2 (1.2) 4.2 (1.2) 4.3 (1.1)
WRFQ 2.0 Work Role Functioning Questionnaire 2.0, WAI work ability index, EWPS endicott work productivity scale, JCQ job content
questionnaire, WIS work involvement scale, UWES utrecht work engagement scalea Single item question, The number of respondents may vary due to missing valuesb 0 = best possible score - 100 = worst possible scorec Scale mean is 50
140 J Occup Rehabil (2013) 23:135–147
123

interpretation of the factors revealed a four factor model. In
order to reduce the number of items, additional analyses
were performed. Items 1 and 27 were removed because
they loaded lower than 0.50 on their own factor and higher
than 0.30 on another factor. Item 20 was removed because
it correlated higher than 0.8 with each other and other items
in their factor, items 22 and 23 were kept based on their
contribution to the construct. Although there were corre-
lations lower than 0.2 for items 14–17 with three other
items (9, 11 and e3), it was decided to keep these items
based on construct considerations. Cronbach’s alphas were
calculated for each factor. Finally, based on alpha-if-item-
deleted, items 6 and 13 were deleted from its factor,
resulting in a final item set of 27 items divided over four
factors. The final results of the factor analyses are pre-
sented in Table 2. The new subscales are work scheduling
and output demands (WSOD), physical demands (PD),
mental and social demands (MSD), and flexibility demands
(FD) comprising the new items.
Reliability
Cronbach’s alphas were calculated for each subscale and
the total scale to explore the internal consistency. All
alphas were high (0.91–0.96). The statistical software
SPSS uses listwise deletion for calculating alphas. There-
fore the analyses were also performed in Stata, but no large
differences were found. Table 3 presents the results based
on SPSS.
For the calculation of the ICC scores, a subsample
completed the questionnaire twice with a 1 week interval.
Participants that reported being absent from work in the
Table 2 Factor loadings final WRFQ 2.0 items (N = 553)
Items Original version Factor 1 Factor 2 Factor 3 Factor 4
Get going easily at the beginning of the workday WRFQ2 .525 .344 .245 .075
Start on your job as soon as you arrived at work WRFQ3 .581 .384 .320 .105
Do your work without stopping to take extra breaks or rests WRFQ4 .601 .280 .279 .057
Stick to a routine or schedule WRFQ5 .705 .359 .096 .155
Work fast enough WRFQ7 .777 .168 .164 .230
Finish work on time WRFQ8 .717 .158 .113 .263
Do your work without making mistakes WRFQ9 .738 .286 .058 .254
Satisfy the people who judge your work WRFQ10 .755 .229 .089 .257
Feel a sense of accomplishment in your work WRFQ11 .691 .226 .077 .164
Feel you have done what you are capable of doing WRFQ12 .704 .219 .202 .216
Lift, carry, or move objects at work weighing more than 10 pounds WRFQ14 .150 .120 .851 .046
Sit, stand, or stay in one position for longer than 15 min while working WRFQ15 .151 .188 .811 .146
Repeat the same motions over and over again while working WRFQ16 .182 .173 .844 .155
Bend, twist, or reach while working WRFQ17 .096 .177 .872 .100
Use hand-held tools or equipment (for example, a phone, pen,
keyboard, computer mouse, drill, hairdryer or sander)
WRFQ18 .255 .248 .648 .245
Keep your mind on your work WRFQ19 .354 .772 .190 .133
Do work carefully WRFQ21 .412 .678 .193 .255
Concentrate on your work WRFQ22 .340 .825 .143 .198
Work without losing your train of thought WRFQ23 .325 .833 .156 .164
Easily read or use your eyes when working WRFQ24 .255 .701 .192 .226
Speak with people in-person, in meetings or on the phone WRFQ25 .211 .578 .252 .287
Control your temper around people when working WRFQ26 .293 .568 .265 .304
Set priorities in my work New 1 .203 .269 .118 .796
Handle changes in my work New 2 .190 .202 .254 .747
Process incoming information, for example e-mails, in time New 3 .220 .092 -.004 .827
Perform multiple tasks at the same time New 4 .270 .210 .137 .804
Be proactive, show initiative in my work New 5 .247 .270 .232 .743
Extraction method: principal component analysis
Rotation method: varimax with Kaiser normalization
Bold values indicate the items grouped together
J Occup Rehabil (2013) 23:135–147 141
123

past 4 weeks were excluded from the analyses, leaving a
subsample of N = 113.
For the WRFQ 2.0 total score an ICC of 0.66 (95 %CI:
0.54–0.76) was calculated. The ICCs for the subscales were
respectively: WSOD = 0.63; PD = 0.82; MSD = 0.61
and FD = 0.29. The standard error of measurement (SEM)
for the WRFQ 2.0 total score was 7.89. The SEMs for the
subscales were respectively: WSOD = 13.22; PD = 7.51;
MSD = 8.69 and FD = 14.94. A scatterplot revealed large
change scores on the new items for a small number of
participants (N = 6 with a change score C75). The missing
anchors could have caused a reversed scoring, producing
large change scores. Exploration of the data without these
outliers revealed a much higher ICC for this scale (and total
scale), closer to the ICCs of the other scales.
Descriptive Statistics of WRFQ 2.0
Table 3 shows the mean scores per subscale. The physical
demands scale has the highest scale scores (87.1, SD 19.6)
and the work scheduling and output demands scale the
lowest (81.8, SD 19.8). All subscales showed over 15 %
scoring at the ceiling, no floor effects were reported for any
of the subscales. The total WRFQ 2.0 score showed no
floor or ceiling effects. The physical demands subscale had
the highest missing and ‘not applicable to my job’ scores.
In Table 4, WRFQ 2.0 scores are presented for job type
(manual versus non-manual) and self reported health (good
to excellent versus poor to fair health). The workers with
self reported ‘poor to fair’ health scored lower work
functioning in comparison with the workers who reported
‘good to excellent’ health. Workers with non-manual jobs
reported slightly higher scores than workers with manual
jobs on the WRFQ 2.0 total score and subscales, indicating
slightly better work functioning.
Construct Validity by Hypotheses Testing
Hypotheses regarding the correlation of the WRFQ with
several constructs were formulated and tested.
Correlations WRFQ and Other Constructs
Table 5 shows the correlations of the WRFQ and several
other constructs. The EWPS and WRFQ were moderately
correlated (-0.493 for the overall score), confirming
hypothesis 1. Weak correlations were found between the
WRFQ scores (total and subscale) and overall general
health, partly confirming hypothesis 2.
Differences Between Groups
Table 6 shows the results of the comparisons between
several groups on their WRFQ scores. Workers with
respectively low mental health or low physical health had
lower work functioning scores in comparison with workers
Table 3 WRFQ 2.0 description
Valid N (missing
or ‘not applicable’)
Mean (SD) Range
(0–100)
N (%) at
floor (0 %)
N (%) at
ceiling (100 %)
Cronbach’s a
Work scheduling and output
demands (WSOD)
545 (8) 81.8 (19.8) 5–100 0 (0.0 %) 88 (16.1 %) 0.92
Physical demands (PD) 381 (172) 87.1 (19.6) 0–100 1 (0.3 %) 185 (48.6 %) 0.92
Mental and social demands (MSD) 543 (10) 85.2 (17.5) 0–100 1 (0.2 %) 154 (28.4 %) 0.93
Flexibility demands (FD) 519 (34) 84.0 (20.7) 0–100 10 (1.9 %) 153 (29.5 %) 0.91
Total score 535 (18) 84.2 (15.8) 5.8–100 0 (0.0 %) 45 (8.4 %) 0.96
Alphas calculated in SPSS (listwise deletion)
Table 4 WRFQ 2.0 job type and health status subgroup scores
Manual
Mean (SD)
(N = 155)
Non-manual
Mean (SD)
(N = 262)
Good–excellent health
Mean (SD) (N = 479)
Poor–fair health
Mean (SD) (N = 59)
Work scheduling and output
demands (WSOD)
82.7 (22.5) 84.1 (17.7) 82.7 (19.0) 73.7 (23.7)
Physical demands (PD) 81.8 (20.6) 93.0 (15.8) 88.8 (17.9) 74.7 (26.7)
Mental and social demands (MSD) 86.8 (21.5) 86.8 (14.5) 86.5 (15.6) 75.6 (25.3)
Flexibility demands (FD) 83.7 (27.2) 86.5 (17.2) 84.9 (20.0) 76.1 (24.8)
Total score 84.1 (18.9) 86.8 (12.8) 85.2 (14.7) 75.5 (21.5)
142 J Occup Rehabil (2013) 23:135–147
123

Table 5 Correlations WRFQ
and other constructs (N = 275)
WSOD work scheduling and
output demands, PD physical
demands, MSD mental and
social demands, FD flexibility
demands, EWPS endicott work
productivity scale, WAI work
ability index, UWES utrecht
work engagement scale,
WIS work involvement scalea Hypothesis 1 confirmedb Hypothesis 2 partly confirmed
Total score WSOD PD MSD FD
Total score – 0.906 0.683 0.890 0.851
WSOD 0.906 – 0.460 0.675 0.668
PD 0.683 0.460 – 0.520 0.473
MSD 0.890 0.675 0.520 – 0.766
FD 0.851 0.668 0.473 0.766 –
EWPSa -0.493 -0.433 -0.243 -0.466 -0.468
Health (SF-1)b -0.267 -0.236 -0.309 -0.246 -0.157
WAI (overall item) 0.468 0.380 0.385 0.421 0.415
WAI physical demands -0.313 -0.215 -0.536 -0.212 -0.199
WAI mental demands -0.411 -0.340 -0.369 -0.378 -0.297
UWES 0.304 0.229 0.332 0.290 0.234
WIS -0.205 -0.168 -0.233 -0.142 -0.153
Table 6 Comparing means
WSOD work scheduling and
output demands, PD physical
demands, MSD mental and
social demands, FD flexibility
demands, MCS mental
component score, PCS physical
component score, NFR need for
recovery, DL decision latitude,
PsD psychological job demandsa Split at population mean (50)b Split at tertiles
WSOD (SD) PD (SD) MSD (SD) FD (SD) Total (SD)
SF12-MCSa
Low (N = 80) 78.4 (16.3) 81.8 (25.5) 77.7 (17.8) 84.0 (17.0) 80.2 (15.5)
High (N = 190) 86.9 (16.3) 91.4 (12.1) 90.0 (13.8) 90.1 (12.1) 89.1 (11.7)
P value \0.001 0.001 \0.001 0.001 \0.001
SF12-PCSa
Low (N = 71) 78.4 (19.4) 73.5 (24.2) 80.8 (20.5) 84.1 (17.8) 80.0 (17.4)
High (N = 199) 86.4 (15.3) 94.0 (10.3) 88.4 (13.6) 89.8 (12.1) 88.8 (11.0)
P value 0.001 \0.001 \0.001 0.004 \0.001
NFRb
Low 89.9 (14.8) 92.1 (13.7) 89.3 (15.4) 90.0 (13.2) 90.3 (11.9)
Medium 84.3 (17.1) 90.8 (15.7) 88.8 (14.2) 89.3 (14.0) 87.5 (12.6)
High 79.4 (17.6) 83.1 (21.3) 80.9 (17.9) 85.1 (16.3) 81.8 (15.6)
Total 84.3 (17.1) 88.6 (17.7) 86.3 (16.3) 88.1 (14.7) 86.4 (13.8)
P value \.001 0.009 \.001 0.061 \0.001
Fatigueb
Low 91.1 (12.3) 93.6 (11.9) 90.3 (15.8) 97.1 (11.8) 91.6 (11.1)
Medium 85.9 (13.0) 90.3 (13.4) 88.4 (13.6) 88.3 (13.2) 87.8 (10.3)
High 75.0 (21.0) 80.8 (23.7) 78.6 (18.9) 83.6 (18.1) 79.0 (16.7)
Total 84.1 (17.2) 88.4 (17.8) 85.9 (17.0) 88.0 (14.8) 86.3 (14.0)
P value \0.001 \0.001 \0.001 0.001 \0.001
DLb
Low 81.2 (20.2) 81.1 (22.9) 83.7 (20.9) 87.6 (17.8) 83.1 (17.7)
Medium 83.5 (18.2) 92.8 (10.6) 86.4 (15.5) 87.1 (14.5) 86.7 (12.4)
High 88.2 (10.7) 93.6 (12.2) 88.0 (13.1) 89.6 (11.3) 89.4 (9.5)
Total 84.3 (17.1) 88.6 (17.7) 86.0 (16.9) 88.1 (14.7) 86.4 (13.9)
P value 0.019 \0.001 0.208 0.468 0.009
PsDb
Low 87.2 (15.5) 90.2 (14.6) 91.0 (10.3) 91.6 (9.6) 89.9 (9.4)
Medium 83.7 (20.2) 89.9 (15.6) 84.6 (19.8) 87.0 (18.6) 85.5 (17.0)
High 81.9 (16.4) 86.2 (21.3) 82.3 (18.5) 85.7 (15.2) 83.7 (14.4)
Total 84.1 (17.2) 88.5 (17.8) 85.8 (17.0) 88.0 (14.8) 86.2 (13.9)
P value 0.096 0.362 0.001 0.016 0.007
J Occup Rehabil (2013) 23:135–147 143
123

with high mental or physical health, confirming hypotheses
3 and 4. Workers with respectively a low need for recovery
or a low fatigue reported better work functioning than
workers with higher levels of need for recovery or fatigue,
both hypotheses 5 and 6 were confirmed.
Workers with a high level of decision latitude reported
better work functioning than workers with low decision
latitude and workers with a high level of psychological job
demands reported lower work functioning, in line with
hypotheses 7 and 8. In Fig. 1, the WRFQ scores of the four
groups based on the combined job type and health are
presented (manual/good health N = 84; manual/poor
health N = 10; non-manual/good health N = 158; non-
manual/poor health N = 11). Both groups with low health
reported lower work functioning than the two groups with
good health. The manual/poor health group had the lowest
scores on three scales including the PD scale, confirming
hypothesis 9. On the FD scale, the non-manual/poor health
groups had the lowest score.
Table 7 shows the WRFQ scores for several age groups.
Although the younger age groups showed better work
functioning the differences are not significant, therefore
hypothesis 10 is not confirmed.
Exploratory Analyses
Correlations WRFQ and Other Constructs
Table 5 shows the correlations of the WRFQ and other
constructs, such as work ability, work engagement and
work involvement. The overall WAI item correlated 0.468
with the WRFQ score. The two other WAI items also
demonstrated moderate correlations with the WRFQ total
score and several subscales. The UWES and WIS showed
weak correlations with the WRFQ scores.
Differences Between Groups
A comparison of WRFQ scores for job type (manual vs.
non-manual jobs) was made. Only for the physical
demands a significant difference was visible, with low
scores on the physical demands for workers with a manual
job. The other scales showed only small, non-significant
differences.
Responsiveness
A total of N = 98 participants completed the 3 month
follow-up questionnaire. Participants were classified based
on the three measures of change. A large majority of the
participants reported no change on all three measures of
change, resulting in very small groups that reported
change.
For change in health, a total of 20 participants reported
an improvement in health of at least one point. However
this was not reflected in the WRFQ 2.0 total change score
(-1.20, SD = 9.8). The SRM and ES were respectively
-0.12 and -0.09. A total of six participants reported a
decrease in health of at least one point, which was reflected
in the total WRFQ 2.0 total change score of -9.54
(SD = 7.5). The SRM and ES were respectively -1.27 and
-0.79. The correlation between the WRFQ 2.0 total
change score and the GPE health was close to zero (0.01).
The same trend is observed for changes in job perfor-
mance. A total of 17 participants reported an improvement
of at least one point, the mean WRFQ 2.0 change score for
Fig. 1 Differences between groups in WRFQ scores: combined work
and health. 1 work scheduling and output demands (WSOD),
2 physical demands (PD), 3 mental and social demands (MSD),
4 flexibility demands (FD), 5 total score
Table 7 Differences between known age groups in WRFQ scores (ANOVA)
Age (years) 18–35 (N = 78) 36–45 (N = 74) 46–55 (N = 84) 56–65 (N = 33) P value
Work scheduling and output demands (WSOD) 85.5 (14.2) 84.7 (18.6) 84.4 (17.5) 80.0 (20.3) 0.513
Physical demands (PD) 90.4 (15.8) 89.8 (17.1) 86.6 (19.2) 83.9 (24.3) 0.468
Mental and social demands (MSD) 87.6 (13.8) 88.6 (13.7) 83.4 (20.7) 83.8 (19.4) 0.177
Flexibility demands (FD) 90.3 (13.8) 89.5 (14.4) 86.9 (15.27) 83.5 (15.6) 0.116
Total score 87.8 (11.1) 87.6 (13.2) 85.6 (15.4) 82.3 (17.9) 0.255
144 J Occup Rehabil (2013) 23:135–147
123
this group was -2.08 (SD = 8.3). The SRM and ES were
respectively -0.25 and -0.18. A total of eight participants
reported a decrease in job performance of at least one
point, which was reflected in the total WRFQ 2.0 change
score of -6.26 (SD = 12.1). The SRM and ES were
respectively -0.53 and -0.27. The correlation between the
WRFQ 2.0 change score and the GPE job performance was
close to zero (0.03).
For change in work ability, a total of 26 participants
reported an improvement of at least one point, the mean
WRFQ 2.0 change score for this group was 3.32
(SD = 10.6). The SRM and ES were respectively 0.31 and
0.20. A total of 30 participants reported a decrease in work
ability of at least one point, the mean WRFQ 2.0 change
score for this group was -0.861.33 (SD = 9.8). The SRM
and ES were respectively -0.09 and -0.06. The correla-
tion between the WRFQ 2.0 change score and the GPE
work ability was 0.18.
Discussion
The final WRFQ 2.0 is a brief questionnaire that consists of
27 items and scores are easily interpreted as percentages of
time on a scale from 0 to 100. The WRFQ 2.0 has four
subscales and shows very good internal consistency, mod-
erate test–retest reliability, good construct validity and
moderate responsiveness in this working sample. The total
score and the subscales show no floor effects, but do show
ceiling effects. Ten hypotheses were formulated and tested.
A total of 9 hypotheses were (partly) confirmed, providing
evidence for the construct validity of the WRFQ. Relation-
ships with several other constructs were explored, without
pre-defined hypotheses. This provided additional insight into
the construct the WRFQ aims to measure. The results show
that the WRFQ was able to distinguish between groups with
different levels of self-rated general health, mental health,
physical health, fatigue, need for recovery and between
workers with manual and non-manual jobs. Different levels
of decision latitude and psychological job demands showed
different scores on the WRFQ in the expected directions,
although not all differences were significant.
The measurement properties were similar to earlier
results with other translated WRFQ versions [13, 14]. The
main difference is the addition of the new subscale (flexi-
bility demands) developed during the cross-cultural adap-
tation of the questionnaire to Dutch [15]. The final WRFQ
2.0 was extended with five new items representing new
work practices; five original items were removed. These
changes also affected the original factor structure, which
was adapted in the final version. Earlier versions do not
contain this subscale.
In the current validation study, the general working
population was included. It is a prerequisite to validate a
questionnaire in the population in which it will be used and
for the intended purposes. Although the questionnaire was
originally developed for a population of workers with
health problems [2], it is important to validate the ques-
tionnaire in the general working population if the WRFQ
2.0 is to be used as a monitoring or surveillance instrument
in this population. This, however, may imply that the
population is rather healthy.
The WRFQ 2.0 showed ceiling effects. This could
indicate that the questionnaire is not performing optimal in
differentiating between workers with good work function-
ing. However, it could also be due to the relative healthy
population included in this study. Almost 90 % of the
participants reported a good, very good or excellent self-
rated health. In contrast with the participants that reported
poor to fair health, a difference of 10 points in the WRFQ
2.0 score was identified, indicating that the questionnaire is
able to discriminate between these two groups, especially
since the SEM for the total score was a little under 8 points.
Further studies comparing other groups, on for example
health status, are needed to evaluate the ability of the
WRFQ 2.0 to differentiate between groups and establish
correlations with other related constructs.
The test–retest reliability of the total WRFQ 2.0 score
and three subscales were moderate and for the new flexi-
bility demands low. This means that the questionnaire is
considered reliable for use on group level. The low scores
for the flexibility demands scale might be explained by the
fact that for some participants the anchors were not visible.
Exploration of the data without outliers revealed ICC
scores closer to the ICC of the other scales.
It is interesting to note, that the correlation between the
WRFQ scores and the general health question of the SF-12
is weak. This may indicate that the WRFQ score is only
marginally determined by health status. However, this may
also be due to the relative healthy population included in
this study.
The WRFQ total score has a moderate correlation with
the EWPS [18], a comparable instrument. This indicates
that these two questionnaires do measure a related con-
struct, but not the same construct. Although both instru-
ments were designed to measure a broad construct in a
broad population, the EWPS is often used in populations
with mental health problems [4]. The measurement prop-
erties of the EWPS in other populations are not known. The
WRFQ total score is also moderately correlated with the
overall work ability item of the Work Ability Index [34],
measuring the current work ability compared with the
lifetime best. Again, this indicates that the WRFQ is
measuring a related, but different construct than work
ability.
J Occup Rehabil (2013) 23:135–147 145
123

The WRFQ has a weak correlation with work engage-
ment and work involvement, indicating that there is no
direct relation between these constructs and work func-
tioning. It might be possible that these motivational con-
structs serve as moderators. Further longitudinal research is
needed to explore the relationships between these
constructs.
Although a trend was observed with younger workers
reporting better work functioning, no significant differ-
ences were observed when compared to older workers.
These results may indicate that work functioning is not
explained by chronologic age. It would be interesting to
examine how work functioning is related to other defini-
tions of age, for example by performance based or func-
tional age [45]. This definition of age is operationalized
based on individual variations in abilities and functioning.
De Vet et al. [40] describe three important uses of
instruments: diagnosis (or discriminative ability), evalua-
tion (for example of therapy) and prediction of future
course. The current study showed that the WRFQ is able to
differentiate between several subgroups (e.g. mental health,
physical health, need for recovery, fatigue) indicating the
instruments discriminative ability. A prerequisite for
evaluative purposes is good responsiveness.
Responsiveness was assessed using three global mea-
sures of perceived change. Due to the relative stable and
healthy population and the lack of an intervention, the
number of workers who reported change was very small. A
self-rated improvement in health, job performance and
work ability was not reflected in the WRFQ 2.0 change
scores, which were close to zero. The WRFQ 2.0 per-
formed better in detecting deterioration, especially for
changes in health and job performance. It is not surprising
that in this relatively healthy sample the WRFQ 2.0 per-
forms better in measuring deterioration than improvement,
since a ceiling effect was observed. The observed results
could also be due to the low number of participants in the
change groups. According to Terwee et al. [17], a sample
of at least 30 participants is required for each change group
to obtain fair methodological quality, and 50 participants
for good quality [17]. A similar method was used in
another study to assess responsiveness of health-related
work functioning measures [5]. However, it is recom-
mended to include participants who are expected to change
over time, for example after an intervention. Further
research is needed to evaluate the responsiveness of the
WRFQ 2.0.
This is the first study to evaluate the construct validity of
the WRFQ in the general working population. In addition,
it is one of the first studies to explore the relationship
between the construct of health-related work functioning
and other constructs such as health status, job content,
work productivity, work ability and work engagement. A
relatively healthy population was included. Although the
sample sizes in the subgroup analyses were small, the
samples were large enough to establish good methodo-
logical quality based on the COSMIN checklist [17]. A
strength of this study is the systematic approach described
by the COSMIN taxonomy.
In sum, the WRFQ 2.0 is a reliable and valid instrument
to measure health-related work functioning in the general
working population. Almost all hypotheses were con-
firmed, providing evidence for the construct validity of the
Work Role Functioning Questionnaire 2.0 (WRFQ) in the
general working population. The WRFQ showed very good
measurement properties for use on a group level. More
information is needed for its use on the individual level,
e.g. for monitoring individuals over time. In addition,
further research in larger samples is needed to investigate
the ability of the WRFQ to predict the future course of
health-related work functioning, test–retest reliability,
responsiveness, and to evaluate the measurement properties
in other populations (e.g. female workers and workers
presenting with chronic health problems).
Acknowledgments The authors report no declaration of interest.
This study was financially supported by a grant of SIG (Stichting
Instituut Gak), The Netherlands.
References
1. Council of the European Union. Council conclusions on healthy
and dignified ageing; 2980th employment, social policy, health
and consumer affairs council meeting. 2009.
2. Amick BC III, Lerner D, Rogers WH, Rooney T, Katz JN. A
review of health-related work outcome measures and their uses,
and recommended measures. Spine. 2000;25:3152–60.
3. Amick BC III, Gimeno D. Measuring work outcomes with a focus
on health-related work productivity loss. In: Wittink H, Carr D,
editors. Pain management: evidence, outcomes, and quality of life:
a sourcebook. Amsterdam: Elsevier; 2008. p. 329–43.
4. Abma FI, van der Klink JJ, Terwee CB, Amick BC III, Bultmann U.
Evaluation of the measurement properties of self-reported health-
related work-functioning instruments among workers with com-
mon mental disorders. Scand J Work Environ Health.
2012;38:5–18.
5. Beaton DE, Tang K, Gignac MA, Lacaille D, Badley EM, Anis
AH, et al. Reliability, validity, and responsiveness of five at-work
productivity measures in patients with rheumatoid arthritis or
osteoarthritis. Arthritis Care Res (Hoboken). 2010;62:28–37.
6. Loeppke R, Hymel PA, Lofland JH, Pizzi LT, Konicki DL,
Anstadt GW, et al. Health-related workplace productivity mea-
surement: general and migraine-specific recommendations from
the ACOEM Expert Panel. J Occup Environ Med. 2003;45:
349–59.
7. Lofland JH, Pizzi L, Frick KD. A review of health-related
workplace productivity loss instruments. Pharmacoeconomics.
2004;22:165–84.
8. Roy JS, MacDermid JC, Amick BC III, Shannon HS, McMurtry R,
Roth JH, et al. Validity and responsiveness of presenteeism scales
in chronic work-related upper-extremity disorders. Phys Ther.
2011;91:254–66.
146 J Occup Rehabil (2013) 23:135–147
123

9. Tang K, Escorpizo R, Beaton DE, Bombardier C, Lacaille D,
Zhang W, et al. Measuring the impact of arthritis on worker
productivity: perspectives, methodologic issues, and contextual
factors. J Rheumatol. 2011;38:1776–90.
10. Tang K, Pitts S, Solway S, Beaton D. Comparison of the psy-
chometric properties of four at-work disability measures in
workers with shoulder or elbow disorders. J Occup Rehabil.
2009;19:142–54.
11. Williams RM, Schmuck G, Allwood S, Sanchez M, Shea R,
Wark G. Psychometric evaluation of health-related work outcome
measures for musculoskeletal disorders: a systematic review.
J Occup Rehabil. 2007;17:504–21.
12. Prasad M, Wahlqvist P, Shikiar R, Shih YC. A review of self-
report instruments measuring health-related work productivity: a
patient-reported outcomes perspective. Pharmacoeconomics.
2004;22:225–44.
13. Durand MJ, Vachon B, Hong QN, Imbeau D, Amick BC III,
Loisel P. The cross-cultural adaptation of the Work Role Func-
tioning Questionnaire in Canadian French. Int J Rehabil Res.
2004;27:261–8.
14. Gallasch CH, Alexandre NMC, Amick B. Cross-cultural Adap-
tation, Reliability, and Validity of the Work Role Functioning
Questionnaire to Brazilian Portuguese. J Occup Rehabil.
2007;17:701–11.
15. Abma FI, Amick BC III, Brouwer S, van der Klink JJL, Bultmann U.
The cross-cultural adaptation of the Work Role Functioning Ques-
tionnaire to Dutch. Work (in press).
16. Lindbeck A, Snower DJ. Multitask Learning and the reorgani-
zation of work: from tayloristic to holistic organization. J Labor
Econ. 2000;18:353–76.
17. Terwee CB, Mokkink LB, Knol DL, Ostelo RW, Bouter LM, de
Vet HC. Rating the methodological quality in systematic reviews
of studies on measurement properties: a scoring system for the
COSMIN checklist. Qual Life Res. 2011;21:651–7.
18. Endicott J, Nee J. Endicott Work Productivity Scale (EWPS): a
new measure to assess treatment effects. Psychopharmacol Bull.
1997;33:13–6.
19. Mokkink LB, Terwee CB, Patrick DL, Alonso J, Stratford PW,
Knol DL, et al. The COSMIN study reached international con-
sensus on taxonomy, terminology, and definitions of measure-
ment properties for health-related patient-reported outcomes.
J Clin Epidemiol. 2010;63:737–45.
20. Mokkink LB, Terwee CB, Knol DL, Stratford PW, Alonso J,
Patrick DL, et al. The COSMIN checklist for evaluating the
methodological quality of studies on measurement properties: a
clarification of its content. BMC Med Res Methodol. 2010;10:22.
21. Mokkink LB, Terwee CB, Patrick DL, Alonso J, Stratford PW,
Knol DL, et al. The COSMIN checklist for assessing the meth-
odological quality of studies on measurement properties of health
status measurement instruments: an international Delphi study.
Qual Life Res. 2010;19:539–49.
22. VSNU. Gedragscode voor gebruik van persoonsgegevens in
wetenschappelijk onderzoek (Code of Behavior for using Per-
sonal Data in Scientific Research). 2005. (Available at the web-
site of the Association of Universities in the Netherlands:
www.vsnu.nl).
23. Amick BC III, Habeck RV, Ossmann J, Fossel AH, Keller R,
Katz JN. Predictors of successful work role functioning after
carpal tunnel release surgery. J Occup Environ Med.
2004;46:490–500.
24. Ware J Jr, Kosinski M, Keller SD. A 12-Item Short-Form Health
Survey: construction of scales and preliminary tests of reliability
and validity. Med Care. 1996;34:220–33.
25. Ware JE, Kosinski M, Turner-Bowker DM, Gandek B. How to
score version 2 of the SF-12 Health Survey. Lincoln, RI: Quali-
tyMetric Incorporated; 2002.
26. Vercoulen JH, Swanink CM, Fennis JF, Galama JM, van der
Meer JW, Bleijenberg G. Dimensional assessment of chronic
fatigue syndrome. J Psychosom Res. 1994;38:383–92.
27. Beurskens AJ, Bultmann U, Kant I, Vercoulen JH, Bleijenberg G,
Swaen GM. Fatigue among working people: validity of a Ques-
tionnaire measure. Occup Environ Med. 2000;57:353–7.
28. van Veldhoven M, Broersen S. Measurement quality and validity
of the ‘‘need for recovery scale’’. Occup Environ Med.
2003;60(Suppl 1):i3–9.
29. van Veldhoven M, Meijman T. Het meten van psychosociale
arbeidsbelasting met een vragenlijst: De Vragenlijst Beleving en
Beoordeling van de Arbeid (VBBA). [Questionnaire on Percep-
tion and Judgment of Work]. Amsterdam: NIA; 1994.
30. Karasek RA. Job Demands, Job Decision Latitude, and Mental
Strain - Implications for Job Redesign. Adm Sci Q. 1979;
24:285–308.
31. Houtman I. Reliability and validity of the Dutch version of the
Karasek Job Content Questionnaire. Washington, DC: APA/
NIOSH Conference on Work, Stress and Health; 1995.
32. Karasek R, Brisson C, Kawakami N, Houtman I, Bongers P,
Amick B. The Job Content Questionnaire (JCQ): an instrument
for internationally comparative assessments of psychosocial job
characteristics. J Occup Health Psychol. 1998;3:322–55.
33. Karasek RA. Job Content Questionnaire and Users’s Guide. Los
Angeles: University of Southern California, Department of
Industrial and Systems Engineering; 1985.
34. Tuomi K, Ilmarinen J, Jahkola A, Katajarinne L, Tulkki A. Work
Ability Index. In: Rautoja S, Pietilainen R, editors. Finland:
K-Print Oy Vantaa. Helsinki: Finnish Institute of Occupational
Health; 1998.
35. Ahlstrom L, Grimby-Ekman A, Hagberg M, Dellve L. The work
ability index and single-item question: associations with sick
leave, symptoms, and health–a prospective study of women on
long-term sick leave. Scand J Work Environ Health.
2010;36:404–12.
36. Schaufeli WB, Bakker AB, Salanova M. The measurement of
work engagement with a Short Questionnaire: a cross-national
study. Educ Psychol Measur. 2006;66:701–16.
37. Schaufeli WB, Bakker AB. Bevlogenheid: Een begrip gemeten.
Gedrag en Organisatie. 2004;17:89–112.
38. Schaufeli WB, Bakker AB. Test manual for the Utrecht Work
Engagement Scale. 2003. (Available at http://www.schaufeli.com).
39. Warr P, Cook J, Wall T. Scales for the measurement of some
work attitudes and aspects of psychological well-being. J Occup
Psychol. 1979;52:129–48.
40. de Vet HCW, Terwee CB, Mokkink LB, Knol DL. Measurement
in medicine. A practical guide. 1st ed. Cambridge: University
Press; 2011.
41. Nunnally JC, Bernstein IH. Psychometric theory. New York:
McGraw-Hill; 1994.
42. Terwee CB, Bot SD, de Boer MR, van der Windt DA, Knol DL,
Dekker J, et al. Quality criteria were proposed for measurement
properties of health status questionnaires. J Clin Epidemiol.
2007;60:34–42.
43. Koolhaas W, van der Klink JJ, Groothoff JW, Brouwer S.
Towards a sustainable healthy working life: associations between
chronological age, functional age and work outcomes. Eur J
Public Health. 2011;22:424–9.
44. Statistics Netherlands. StatLine database, Available at: http://
statline.cbs.nl/StatWeb. Accessed June 2012.
45. de Lange AH, Taris TW, Jansen PGW, Smulders P, Houtman
ILD, Kompier MAJ. Age as a factor in the relation between work
and mental health: results from the longitudinal TAS survey. In:
Houdmont J, McIntyre S, editors. Occupational health psychol-
ogy: European perspectives on research, Education and Practice
Maia. Portugal: ISMAI Publications; 2006. p. 21–45.
J Occup Rehabil (2013) 23:135–147 147
123