Embed Size (px)
Citation preview

University of Groningen
Soluble multiferroic hybridsPolyakov, Alexey
IMPORTANT NOTE: You are advised to consult the publisher's version (publisher's PDF) if you wish to cite fromit. Please check the document version below.
Document VersionPublisher's PDF, also known as Version of record
Publication date:2015
Link to publication in University of Groningen/UMCG research database
Citation for published version (APA):Polyakov, A. (2015). Soluble multiferroic hybrids: Controlling the electronic interactions. University ofGroningen.
CopyrightOther than for strictly personal use, it is not permitted to download or to forward/distribute the text or part of it without the consent of theauthor(s) and/or copyright holder(s), unless the work is under an open content license (like Creative Commons).
The publication may also be distributed here under the terms of Article 25fa of the Dutch Copyright Act, indicated by the “Taverne” license.More information can be found on the University of Groningen website: https://www.rug.nl/library/open-access/self-archiving-pure/taverne-amendment.
Take-down policyIf you believe that this document breaches copyright please contact us providing details, and we will remove access to the work immediatelyand investigate your claim.
Downloaded from the University of Groningen/UMCG research database (Pure): http://www.rug.nl/research/portal. For technical reasons thenumber of authors shown on this cover page is limited to 10 maximum.
Download date: 05-04-2022

23
Chapter 2. Experimental methods
This chapter describes the experimental methods used. First, techniques
for hybrid synthesis and templating will be discussed. Then, techniques for
structure determination and related methods will be described. Finally, I
will discuss experimental methods that determine the magnetic and
electron transport measurements in organic-inorganic hybrids.
2.1 Synthesis
Organic-inorganic hybrids by their nature consist of an organic and an
inorganic part1. As was discussed in Chapter 1, hybrids can adopt different
dimensionalities, depending on the inorganic connectivity. This thesis will
focus only on 1D and 2D hybrids. This thesis describes only their growth in
bulk form2 or deposited layer-by-layer to obtain hybrid thin films3.
2.1.1 Crystal growth from solution
Organic-inorganic hybrids are formed by self-assembly from solution by
evaporation of the solvent. Hybrid growth, as discussed in Chapter 1
requires formation of the inorganic backbone, originating from connecting
halogen octahedra, coordinating the metal ions.
As an example, I will describe the synthesis procedure for the organic-
inorganic hybrid CuCl4(C6H5C2H4NH3)24,5. For other hybrid compounds, the
procedure is the same, except for the Ni-hybrids.

Chapter 2. Experimental methods
24
The general procedure for the hybrid synthesis includes solvation of the
metal halide salt (e.g. CuCl2) and the organic halide salt (e.g. C6H5C2H4NH3Cl)
in stoichiometric ratio in the solvent. First, the organic salt should be
prepared. To obtain the required organic salt, hydrochloric acid is slowly
added to the organic precursor (C6H5C2H4NH2). This reaction is exothermic,
so the flask is cooled in a water bath. The HCl is added until the white
steam is not produced anymore by the solution. The reaction for the
formation of the organic salt for PEA-based hybrid is shown in Fig. 2.1.
Figure 2.1 Preparation of 2-phenylethylammoniumchloride: 2-
phenylethylammonia reacts with hydrochloric acid to form the product.
The resulting product is filtered and dried at 60°C. After that, the organic
salt and the metal halide salts are mixed in stoichiometric ratio in ethanol
and stirred for ~30 minutes. When both precursors are totally solved, the
flask is covered with an aluminum foil with holes to obtain a slow
evaporation. The resulting solution is kept in a furnace at 60°C. The hybrid
crystals of CuCl4(C6H5C2H4NH3)2 are formed by slow evaporation of the
solvent (Fig. 2).
For the Ni-hybrids the synthesis procedure is different. In case of the nickel-
based hybrids a metal precursor (NiCl2*6H2O) is heated in an open flask to
120°C to remove the water. The synthesis procedure is performed in argon
atmosphere in order to prevent exposure of the solution to H2O. Then, the
resulting solution is covered with an alumina foil and kept at 60°C.
Another method to obtain good quality single crystal of Ni-based hybrids is
the deviation of the classic solution growth. In this technique a saturated
solution of the NiCl2 salt and the organic salt is solved in a solution of
hydrochloric acid in ethanol (pH=0.3). Then, the solution is stirred in a
closed argon atmosphere at 80°C. When both precursors are totally solved,
the temperature is decreased by 5°C/hour. In this case, while lowering

25
temperature, supersaturation will be reached at some temperature and the
nucleation of the crystals will immediately start, as shown in Figure 2.3.
Figure 2.2 Reaction of 2-phenylethylammoniumchloride with
copper(II)chloride is a self-assembly of the two components. The picture
shows the obtained crystals.
Figure 2.3. Crystals of NiCl3(CH3NH3)2 hybrid (red).

Chapter 2. Experimental methods
26
2.1.2 Growth conditions and morphology of the crystals
Now I discuss the growth parameters to optimize the quality and the size of
the resulting hybrid crystals. Such growth conditions include aspects such as
that the shape of the container, the growth temperature and the solvent
strongly affect the quality and the shape of the resulting hybrid crystals.
The shape of the container is mainly responsible for the size of the obtained
crystals. This is caused by the fact that structure of the hybrid implies layer
formation, thus crystals tend to grow in the platelet form. Therefore, larger
planar areas of the container will result into larger crystals. Moreover, the
shape of the container also influences the evaporation rate, because the
evaporation rate from an Erlenmeyer container is lower than from a beaker
glass. Thus, best crystals were grown from Erlenmeyer type of container.
The temperature of the hybrid growth is one of the most important
parameters of the synthesis. The temperature determines the evaporation
rate of the solvent, thus, determining the kinetics of the growth process.
This is quite important in order to obtain high quality and large crystals.
Even though hybrids can grow at room temperature, higher temperatures
are preferable due to lower risk of water contamination. Obviously, the
optimal temperature of the synthesis is related to the solvent used. For the
CuCl4(C6H5C2H4NH3)2 hybrid growth from an ethanol solution, a
temperature of 60°C provides the best crystal quality/time ratio.
In order to get the best quality crystals, several solvents have been tried,
namely methanol, ethanol, DMF, acetonitrile, acetone, dimethyl sulfoxide,
water and its combinations. For Ni-hybrids water-free synthesis was
performed. The non-polar solvents offer a poor solubility, and are thus less
preferable to be used. Precursors hardly solve in acetonitrile, while
dimethyl sulfoxide takes 2-3 of months to evaporate and therefore they are
not appropriate for hybrid growth. From an acetone solution separate large
uniform crystals grow on the bottom of the container, however not with an
uniform surface. The solutions of a protic series (propanol -> ethanol ->
methanol -> water) provide progressively larger and thicker crystals, which
means that better solubility result in a larger crystals. The best crystals have

27
been obtained in ethanol and in a mixture of ethanol and about 10% water.
These crystals were large with varying thickness and had a good surface.
Hybrid crystals have the form of platelets, which is caused by weak bonding
in the c-direction. The c-direction of the crystal is held together by weak
interlayer forces. Therefore, this direction has the slowest growth. The
crystals are always oriented with the c-direction pointing up. The a- and b-
directions are more difficult to determine.
The solvent also influences the shape of the obtained crystals as seen in
Figure 2.4. Angles between the facets of the obtained crystal are mostly 90o
when solving in water. Variations caused by the different polarity of the
solvents, influence the in-plane faceting of the crystals.
Figure 2.4. CuCl4(PEA)2 crystals synthesized in a) ethanol b) water and c)
variations in faceting and growth morphologies.

Chapter 2. Experimental methods
28
The surface profile of the obtained crystals was measured with an AFM
microscope. An AFM picture of a CuCl4(PEA)2 hybrid, grown at 60oC from
ethanol is shown in Figure 2.5 (performed by A. Everhardt during his Top
Master NanoScience studies).
Figure 2.5. a) AFM topology of a CuCl4(PEA)2 surface, b) the phase image, c)
line scan of the topology image showing step sizes of about 2 nm. These
measurements were performed by A. Everhardt.

29
The best crystals show a very flat surface, in which clear steps of 2nm size
can be recognized (Fig.2.5 a, c). Also, the phase image and its line scan
(Fig.2.5 b) display the existence of impurities on these steps which belong to
a different phase than the one of the crystal surface.
Figure 2.6. Crystal structure of the CuCl4(PEA)2 hybrid with important
distances indicated.
The nature of the observed steps can be determined by analyzing the
structure of the hybrid. Figure 6 displays the crystal structure of the
CuCl4(PEA)2 hybrid with the size of the possible steps indicated. From these
distances we can suggest that the most preferably steps are represented by
the PEA-CuCl6-PEA layer of the hybrid between the Van der Waals bonded
molecules (1,93 nm).
2.1.3 Langmuir-Blodgett technique
The Langmuir-Blodgett (LB) technique6 was chosen to synthesize thin films
of the organic-inorganic hybrids. The advantages of this technique are low
temperature processing and the possibility of layer-by-layer deposition. The
LB technique, discovered by Langmuir and Blodgett is one of the earliest

Chapter 2. Experimental methods
30
techniques which has been commonly used to deposit organic molecules in
thin film form. LB implies the formation of the film from hydrophilic and
hydrophobic parts on the water-air interface under control by surface
pressure. Amphiphilic molecules are spread on the water surface and then
compressed to form a well-ordered monolayer at the air-water interface.
Then, the resulting monolayer film can be transferred homogenously to a
solid substrate by dipping it into the water as sketched in Figure 2.7.
Figure 2.7. a) Amphiphilic molecules spread on water surface, b) molecules are compressed by applying the pressure to form a solid-like phase consisting of one mono-layer and c) the monolayer is transferred to the substrate by vertical dippingthrough water-air interface.
Amphiphilic molecules consist of a polar head and a non-polar tail. The
polar part is hydrophilic, while the alkyl chain (non-polar part) is
hydrophobic. The Langmuir-Blodgett synthesis can be used to generate
complex sequences of different building blocks, yielding a method for
fabrication of heterostructures.

31
Figure 2.8. LB trough used for synthesis of the hybrid film a) front-view and b) side-view. Picture made by O. Floweri. Once a stable monolayer is formed, it can be mechanically transferred to a
solid substrate (hydrophilic or hydrophobic) by moving the substrate
vertically through the water-air interface (Figure 2.7d). Such a substrate also
needs a special treatment. For synthesis of Cu-based organic-inorganic
hybrids, the substrates were sonicated in methanol, then in an 1:1 ratio
solution of methanol + toluene and finally in toluene for 1 minute. Thus, the
surface of the substrate gets hydrolyzed. The substrates were made
hydrophobic through a treatment by an organic solution, namely by self-
assembling a monolayer of dodecyltrichlorosilane (C12H25ClSi) onto the
substrate. In these organic molecules, the SiCl3 functions as a covalent
attachment to the surface, rich in hydroxyl groups, whereas the alkyl part
acts as hydrophobic part. The synthesis was performed by N.Akhtar and is
described in details in the PhD thesis7. A 2% solution of
dodecyltrichlorosilane in toluene (1.5 mL (C12H25ClSi) in 75 mL toluene) was
used. The substrates were placed inside the (C12H25ClSi) solution, sonicated
for 1 min and exposed them overnight in the dark.
To synthesize the Cu-based organic-inorganic hybrid films by the Langmuir-
Blodgett technique, copper chloride is used as the inorganic part, while
methylamine (MA) and octadecylamine (ODA) acts as the organic moiety.
As discussed in Chapter 1, the inorganic octahedra in bulk CuCl4-based
hybrids are formed by six chlorine atoms with the Cu ion in the center. In
the case of films, we expect same organic-inorganic arrangement.

Chapter 2. Experimental methods
32
Therefore, the methylamine ligands are required in order to reach desired
formation of the CuCl6 octahedra. The subphase used in the experiments,
was an aqueous solution of CuCl2 (1.0×10⁻³ mol/L) and MA (1.0×10⁻³ mol/L).
Langmuir films were obtained by spreading a chloroform-methanol (9:1)
solution of ODAH+Cl- (0.15 mg/ml) onto the subphase at 210C. Then, after
solvent evaporation, the molecules were compressed at a rate of 30
cm2min-1 by a movable barrier until a desired surface pressure was reached
and this pressure was kept constant during the whole deposition process.
The compressed Langmuir film was allowed to stabilize for 30 min time
before deposition.
LB films were deposited by vertical dipping of pre-treated substrates into
the subphase at a dipping speed of 5 mm/min. A Langmuir film was
deposited each time the substrate moved across the air-water interface.
Therefore, one dipping cycle (dipping down and taking up the substrate
from the subphase) gives two hybrid monolayers. Further details of the
synthesis are discussed in Chapter 6 of this thesis and in doctoral thesis of
N. Akhtar.

33
2.2 Structural measurements
In this paragraph we will describe experimental methods, used to
determine the crystal structure, morphology, topology and structural phase
transitions of the investigated organic-inorganic hybrids. Also we will
discuss sample preparations for these methods.
2.2.1 Single crystal X-ray diffraction
X-ray diffractometers consist of three basic elements, an X-ray tube, a
sample holder, and an X-ray detector (Figure 2.9). To produce X-rays,
electrons are generated in a cathode ray tube by heating a filament. Thus
by applying a voltage, electrons will accelerated towards the anode, and the
impact of the electrons can produce X-rays. When electrons have sufficient
energy to dislodge inner shell electrons of the anode, characteristic X-ray
spectra are produced.
Figure 2.9. Bruker D8 Venture single crystal X-ray diffractometer8.
The X-ray spectra consist of several frequencies including Kα and Kβ. Kα
consists, in part, of Kα1 and Kα2.9 Kα1 has a slightly shorter wavelength and
twice the intensity as Kα2. The specific wavelengths are characteristic for
anode material. Filtering is required to produce monochromatic X-rays
needed for diffraction. This process is done by foils or crystal
monochromators. Kα1 and Kα2 are sufficiently close in wavelength such that

Chapter 2. Experimental methods
34
a weighted average of the two can be used. X-ray single diffraction
measurements were performed on a D8 Venture diffractometer from
Bruker using different temperatures with Mo or Cu X-ray anodes. The
crystals for these measurements were carefully chosen using an optical
microscope, using polarization filters when needed. The size of the selected
crystals was limited to 0.2 mm.
Constructive interference occurs when the geometry of the incident X-rays
concurs with the Bragg equation (Figure 2.10):
The resulting X-ray diffraction pattern represents the structure of the
material. The relation between the structure factor and the atomic
scattering factor is:
Figure 2.10: Visualization of Bragg’s Law
λ: wavelength of the X-ray
d: distance between two crystallographic scattering planes
θ: angle between the incoming X-ray and the crystallographic scattering plane

35
where h, k and l are the indices of the diffraction planes (Bragg reflections),
N is the number of atoms in the unit cell and (xj ,yj , zj) are the fractional
coordinates of the j of the atom with scattering factor fj. Each structure
factor represents a diffracted beam with an amplitude |F(hkl)| and a
relative phase. The crystal structure can be obtained from the diffraction
pattern if the electron density function is calculated at every point in a
single unit cell:
The calculation of the electron density results in a corresponding map,
where electron density represents the position of atoms in the cell. The
structure factors are the Fourier components of the electron density of the
crystal structure and vice versa. The well-known “phase problem” is caused
by the fact that the measured intensities of a diffraction pattern allow
determination of the structure factor amplitudes, but not their phases. The
calculation of the electron density is not obtained directly from
experimental measurements and the phases must be obtained by other
methods. When phases and structure factors amplitudes are calculated, a
first electron density map is calculated to obtain atomic positions. To
optimize fitting between the calculated and observed intensities, Fourier
synthesis and structural parameters refinement is performed, which include
positional atomic parameters and anisotropic vibration parameters. Finally,
the hydrogen atom positions are determined or calculated using
conventions. For the organic-inorganic hybrids the hydrogen atoms were
generated by geometrical considerations and constrained to their idealized
positions.
2.2.2 Thin film diffraction
To determine the crystal structure of the films, XRD thin film diffraction
methods were used in a reflective geometry10. X-ray reflectivity can be used
to investigate the density, crystallinity, thickness and d-spacing of films.
Moreover, it is a surface sensitive technique that can be used to determine

Chapter 2. Experimental methods
36
the thickness of the film. In this technique, the incident x-rays hit the
sample surface at low angles (below 10o). At very low angles (below a
critical angle), the x-rays do not penetrate into the sample surface whereas
above the critical angle the penetration increases quickly with increasing
angle. When they are incident on a multilayered thin film, the x-rays are
reflected from the interfaces where the electron density varies between
two layers.
Figure 2.11. Illustration of the refraction causing Kiessig fringes
The resulting x-ray diffraction pattern consists two kind of peaks: Bragg
peaks (Figure 2.10) and Kiessig fringes (Figure 2.11). Bragg peaks appear
due to the diffraction between individual planes in the film. Using the Bragg
equation, the d-spacing between the planes can be calculated. In case of
layered hybrids, the d-spacing is the repeat distance of the layers.
The Kiessig fringes result from the interference of X-rays scattered at
interfaces. They are a consequence of the angle-dependent phase shift,
with a period that is determined by the total thickness of the film (Figure
2.12). A layered material with n repeat units shows n-2 Kiessig fringes
between two diffraction peaks in the X-ray reflectivity spectrum.

37
Figure 2.12. Example of a thin film diffraction scan of 16 layers of CuCl4(ODA-MA) hybrid. The length of smallest periodic unit perpendicular to the film surface (d) can
be calculated from the position of the diffraction peaks using the Bragg
formula. To determine the peak position more precisely in a rapidly
changing background, the diffraction peaks can be fitted with Gaussian or
Lorentzian line shapes or linear combinations of the two.
Samples, investigated in this thesis were deposited and measured on glass
substrates. Measurements were performed by N.Akhtar7. The film XRD
measurements were done on a Philips X`pert materials research
diffractometer (MRD) equipped with a copper Kα radiation source with
wavelength 1.541 A. The XRD pattern was recorded in a 2theta range from
1 to 10o, in steps of 0:01o with a counting time of 15 s for each step.
2.2.3 Atomic Force Microscopy AFM
Atomic Force Microscopy (AFM)11 is used to determine changes in the
surface topography of a sample by measuring the interacting force between
sample and tip when they are very close to each other (Figure 2.13).

Chapter 2. Experimental methods
38
Figure 2.13. Schematic illustration of an Atomic Force Microscope12 In AFM, only changes in surface topography can be measured. The detection can
be performed by monitoring the probe or tip displacement when the tip is scanned
over the surface while keeping the force constant. This displacement can be
observed from a laser beam that is directed on the cantilever that supports the tip.
The deflection of the reflected laser beam corresponds to changes in topography
on a rough sample. AFM measurements were carried out with a Digital
Instruments MultiMode AFM equipped with a Nanoscope controller in tapping
mode using silicon cantilevers (Veeco, model RTESPW) by P.Gordiichyk. For each
sample, AFM scans were performed on several surface positions to check the
surface morphology and roughness. The AFM image for the organic-inorganic
hybrid films were taken by 15 scans and in each scan the tip was moved to fresh
sample area.
2.2.4 Scanning Electron Microscopy
Scanning electron microscopy (SEM)13,14 is a method to analyze surface
composition. This method is based on the interaction of high energy
electrons with the surface of the sample. The exposed area of the sample
interacts with focused accelerated electrons and results in various signals
(Figure 2.14).

39
Figure 2.14. Schematic illustration of Scanning Electron Microscope15
Two types of electrons result from this interaction. Firstly, secondary
electrons (SE), produced when an incident electron excites an electron in
the sample, therefore transferring part of its energy. The excited electron
moves towards the surface of the sample and, if it still has sufficient energy,
it exits the surface and is called a secondary electron. Secondary electrons
originate from the top 1-30 nm (depending on the incident beam energy) of
the sample and are used to image the surface composition of the sample.
SE originate from the ionization of electrons of surface atoms, caused by
the impact of the incident electron beam. A local variation in electron
intensity (due to surrounding electric field) creates an image contrast that
reveals the surface morphology. In insulating samples charging effects can
appear caused by exposure to the electron beam. To avoid these parasitic
effects, samples should be deposited on a conduction substrate. In case of
non-conductive samples, the surface can be coated with a conductive
material to avoid charging and increase the number of the secondary
electrons that will be emitted with energies less than 50 eV.
The second type of the electrons is called backscattered electrons (BSE).
These are elastically scattered electrons, which exhibit no energy loss,
backscattered from the surface of the sample. BSE can provide information
on the elements of the surface.

Chapter 2. Experimental methods
40
SEM images, presented in this thesis were performed on JEOL- JSM-7000F
microscope with the help of Gert ten Brink. Organic-inorganic thin films
were deposited on a gold-coated SiO2 substrate.
2.2.5 Differential scanning calorimetry DSC- thermogravimetric
analysis TGA
Figure 2.15. Schematic illustration of a Differential Scanning Calorimetry
apparatus16
Structural phase transitions of materials when varying temperature were
measured using Differential Scanning Calorimetry – Thermogravimetric
Analysis experiments17. In the measurements the sample and a reference
are heated in a constant heat flow. The difference of the temperature
between both crucibles, caused by changes in the temperature dependence
of the specific heat of the sample with respect to the reference, can be
detected (Figure 2.15).
The experiments were performed using a SDT 2960 (TA) Instrument.
Experiments were performed under argon atmosphere at constant flow of

41
100 cm3/min. Samples were prepared in powder form and measured in
platinum containers.
2.3 Magnetic measurements
In this paragraph we will discuss experimental details of the magnetic
measurements on the organic-inorganic hybrid compounds. Also we will
describe techniques of the magnetic measurements, such as the
temperature and magnetic field dependence of the magnetization.
2.3.1 SQUID magnetometer
Superconducting Quantum Interference Device (SQUID)18 is a very sensitive
magnetometer used to measure extremely small magnetic fields, based on
superconducting coils in a circuit containing Josephson junctions. Using a
superconducting pick-up coil with 4 windings, as shown in Figure 2.16, the
magnetic signal of the sample is obtained. As sketched in figure 2.17, the
magnetic flux from the sample is transferred to a SQUID located away from
the sample in the liquid helium bath through a superconducting connection.
The blue part in Figure 2.17. represents the device’s magnetic flux-to-
voltage converter, while the green part is the magnetometer’s electronics
that amplifies and reads out the voltage from the magnetic flux-to-voltage
converter.
An alternating superconducting current in the pick-up coil is produced while
the sample is moved up and down repeatedly. This current produces a
magnetic flux that leads to an alternating output voltage of the SQUID. By
locking the frequency of the readout to the frequency of the sample
movement (RSO, reciprocating sample oscillation), an extremely high
sensitivity for ultra-small magnetic signals is obtained by the magnetometer
system.

Chapter 2. Experimental methods
42
Figure 2.16. A superconducting pick-up coil with 4 windings in SQUID
magnetometer.19
Figure 2.17. Flux-to-voltage converter in SQUID.19
2.3.2 Sample preparation
A well-chosen, good quality crystal was placed into a gelatin capsule in a
particular orientation to allow anisotropic measurements. In order to keep
the crystal aligned and in place, dried cotton was added. Holes were made
in top and bottom of capsule to allow the helium gas flow. The capsule was
put into a plastic straw and glues in place, preventing movement of capsule.

43
The end of the straw was covered to prevent the capsule from falling into
the cryostat. The straw is homogeneous and therefore has no contribution
to changes of magnetic flux. The straw was mounted on a dip-stick and
inserted slowly into the SQUID. A magnetic field of the order of 100 Oe was
applied to center the sample in the pick-up coil.
2.3.3 Magnetic measurement techniques
The temperature dependent magnetization measurements were performed
using zero-field cooled (ZFC) and field cooled methods (FC). In the ZFC
method, cooling of the sample was performed in the residual field of the
magnetometer down to 2 K or 5 K. Then, the magnetic field was applied to
increase the magnetization and the measurements were taken while
heating up the sample. FC measurements were performed in the same way,
but the sample was cooled, after applying the magnetic field.
2.4 Electrical transport measurements
2.4.1 Probe stations & cryostats
The measurements were conducting in various conditions, such as high/low
temperatures and electric field. Thus, various cryostats and probe stations
were used.
In order to measure at low temperatures (from 2K to 350K) a Quantum
Design PPMS was used. The PPMS system can cool the sample down to 5K
and impose magnetic fields up to 9 Tesla. For high-temperatures (from
room temperature to 160o C regime, an INSTEC probe station with SuS
MicroTech probes was used.
Chapter 2. Experimental methods
44
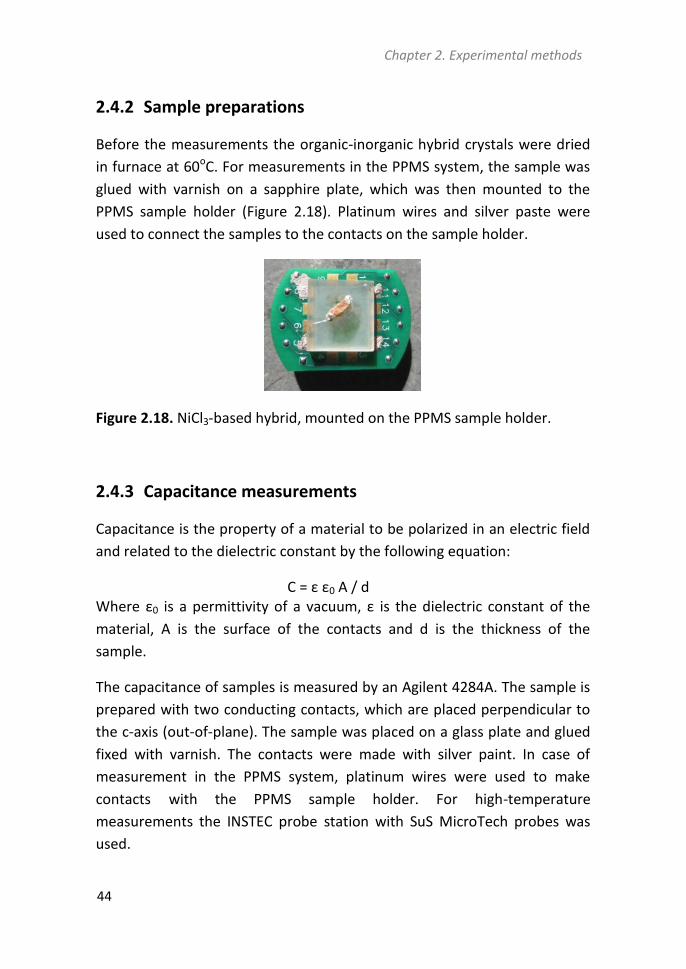
2.4.2 Sample preparations
Before the measurements the organic-inorganic hybrid crystals were dried
in furnace at 60oC. For measurements in the PPMS system, the sample was
glued with varnish on a sapphire plate, which was then mounted to the
PPMS sample holder (Figure 2.18). Platinum wires and silver paste were
used to connect the samples to the contacts on the sample holder.
Figure 2.18. NiCl3-based hybrid, mounted on the PPMS sample holder.
2.4.3 Capacitance measurements
Capacitance is the property of a material to be polarized in an electric field
and related to the dielectric constant by the following equation:
C = ε ε0 A / d Where ε0 is a permittivity of a vacuum, ε is the dielectric constant of the
material, A is the surface of the contacts and d is the thickness of the
sample.
The capacitance of samples is measured by an Agilent 4284A. The sample is
prepared with two conducting contacts, which are placed perpendicular to
the c-axis (out-of-plane). The sample was placed on a glass plate and glued
fixed with varnish. The contacts were made with silver paint. In case of
measurement in the PPMS system, platinum wires were used to make
contacts with the PPMS sample holder. For high-temperature
measurements the INSTEC probe station with SuS MicroTech probes was
used.
45
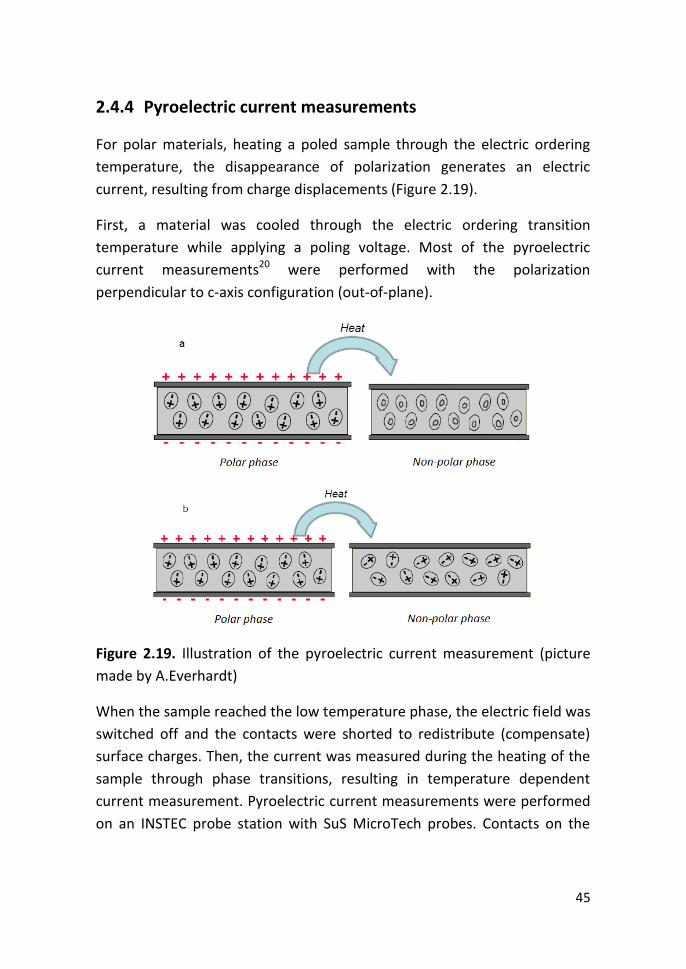
2.4.4 Pyroelectric current measurements
For polar materials, heating a poled sample through the electric ordering
temperature, the disappearance of polarization generates an electric
current, resulting from charge displacements (Figure 2.19).
First, a material was cooled through the electric ordering transition
temperature while applying a poling voltage. Most of the pyroelectric
current measurements20 were performed with the polarization
perpendicular to c-axis configuration (out-of-plane).
Figure 2.19. Illustration of the pyroelectric current measurement (picture
made by A.Everhardt)
When the sample reached the low temperature phase, the electric field was
switched off and the contacts were shorted to redistribute (compensate)
surface charges. Then, the current was measured during the heating of the
sample through phase transitions, resulting in temperature dependent
current measurement. Pyroelectric current measurements were performed
on an INSTEC probe station with SuS MicroTech probes. Contacts on the

Chapter 2. Experimental methods
46
sample were made with silver paste. The current was measured with a
Keithley 6517A electrometer.

47
References
1. Rao, C. N. R., Cheetham, A. K. & Thirumurugan, A. Hybrid inorganic – organic materials : a new family in condensed matter physics. J. Phys. Condens. Matter 20, (2008).
2. Mitzi, D. B. Templating and structural engineering in organic–inorganic perovskites. J. Chem. Soc. Dalt. Trans. 1–12 (2001). doi:10.1039/b007070j
3. Mitzi, D. B. Thin-film deposition of organic-inorganic hybrid materials. Chem. Mater. 13, 3283–3298 (2001).
4. Arkenbout, A. H. PhD thesis: Organic-inorganic hybrids : a route towards soluble magnetic electronics. (University of Groningen, 2010).
5. Polyakov, A. O. et al. Coexisting Ferromagnetic and Ferroelectric Order in a CuCl4-based Organic−Inorganic Hybrid. Chem. Mater. 24, 133–139 (2012).
6. Chen, X. et al. Langmuir-Blodgett patterning: a bottom-up way to build mesostructures over large areas. Acc. Chem. Res. 40, 393–401 (2007).
7. Akhtar, N. PhD Thesis. (University of Groningen, 2014).
8. http://www.bruker.com/.
9. Als-Nielsen, J. & McMorrow, D. Elements of Modern X-ray Physics. (John Wiley & Sons, Ltd., 2001).
10. Birkholz, M. Thin Film Analysis by X-Ray Scattering. (Wiley, 2005).
11. Binnig, G. & Quate, C. F. Atomic Force Microscope. Phys. Rev. Lett. 56, 930–933 (1986).
12. http://www.farmfak.uu.se
Chapter 2. Experimental methods
48
13. Smith, K. C. A. & Oatley, C. W. The scanning electron microscope and its fields of application. Br. J. Appl. Phys. 6, 391–399 (1955).
14. McMullan, D. Scanning electron microscopy 1928-1965. Scanning 17, 175–185 (2006).
15. Kalantar-zadeh, K. & Fry, B. Nanotechnology-Enabled Sensors. (Springer, 2008).
16. http://www.itc.tu-bs.de/Abteilungen/Makro/Methods/dsc.htm.
17. Wunderlich, B. & Wunderlich, B. Thermal Analysis. 137 – 140 (Academic Press, 1990).
18. Jaklevic, R., Lambe, J., Silver, A. & Mercereau, J. Quantum Interference Effects in Josephson Tunneling. Phys. Rev. Lett. 12, 159–160 (1964).
19. http://www.wmi.badw.de/methods/squid.htm.
20. Byer, R. L. & Roundy, C. B. Pyroelectric Coefficient Direct Measurement Technique and Application to a Nsec Response Time Detector. IEEE Trans. Sonics Ultrason. 19, 333–338 (1972).