Embed Size (px)
Citation preview

University of Groningen
Perceived risks, emotions, and policy preferencesPerlaviciute, Goda; Steg, Linda; Hoekstra, Elisabeth J.; Vrieling, Leonie
Published in:Energy Research & Social Science
DOI:10.1016/j.erss.2017.04.012
IMPORTANT NOTE: You are advised to consult the publisher's version (publisher's PDF) if you wish to cite fromit. Please check the document version below.
Document VersionPublisher's PDF, also known as Version of record
Publication date:2017
Link to publication in University of Groningen/UMCG research database
Citation for published version (APA):Perlaviciute, G., Steg, L., Hoekstra, E. J., & Vrieling, L. (2017). Perceived risks, emotions, and policypreferences: A longitudinal survey among the local population on gas quakes in the Netherlands. EnergyResearch & Social Science, 29, 1-11. https://doi.org/10.1016/j.erss.2017.04.012
CopyrightOther than for strictly personal use, it is not permitted to download or to forward/distribute the text or part of it without the consent of theauthor(s) and/or copyright holder(s), unless the work is under an open content license (like Creative Commons).
Take-down policyIf you believe that this document breaches copyright please contact us providing details, and we will remove access to the work immediatelyand investigate your claim.
Downloaded from the University of Groningen/UMCG research database (Pure): http://www.rug.nl/research/portal. For technical reasons thenumber of authors shown on this cover page is limited to 10 maximum.
Download date: 24-06-2020

Contents lists available at ScienceDirect
Energy Research & Social Science
journal homepage: www.elsevier.com/locate/erss
Original research article
Perceived risks, emotions, and policy preferences: A longitudinal surveyamong the local population on gas quakes in the Netherlands
Goda Perlaviciute⁎, Linda Steg, Elisabeth J. Hoekstra, Leonie VrielingUniversity of Groningen, Faculty of Behavioural and Social Sciences, Environmental Psychology, Grote Kruisstraat 2/1, 9712 TS Groningen, The Netherlands
A R T I C L E I N F O
Keywords:Risk perceptionsEmotionsEarthquakesGas production
A B S T R A C T
Energy production can pose risks, such as nuclear accidents, oil spills, and earthquakes caused by gas production.Besides experts’ evaluations of risks, appropriate risk assessment and management require knowledge about howpeople experience these risks and which mitigation measures they prefer. Media are often the sole source ofinformation about public risk perceptions. Yet, media typically only report the most severe risks. By studyingperceptions of different types of risks – among people with varying exposure to risks – we demonstrate howsocial science research can complement media reporting. We conducted a longitudinal questionnaire study intopublic risk perceptions of earthquakes caused by gas production in the province of Groningen, the Netherlands.While the media have reported multiple high risks and strong negative emotions, we found that people weremostly concerned about the risks for properties and for the image of the province of Groningen. Feelingpowerless was the strongest negative emotion. People also evaluated mitigation measures as urgent but poorlyimplemented. Our results suggest that appropriate risk assessment and management need to follow a multi-method approach. This should incorporate multiple levels of analyses, including media reports, social scienceresearch on public risk perceptions, and experts’ evaluations of risks.
1. Introduction
Energy production may pose serious risks. Examples include nuclearaccidents, oil spills, water contamination and tremors from shale gasproduction, leakages from CO2 capture and storage, and breaks of thedams of hydro-power plants. As such, energy production poses not onlytechnical but also societal challenges [1–3]. Besides experts’ evalua-tions of risks, adequate risk assessment and management requireknowledge about how people perceive and experience these risks andwhich mitigation measures they prefer. Media reports are often the solesource of information about public risk perceptions. We argue thatrelying solely on media reports may provide a narrow understanding ofpublic risk perceptions and preferences, and may therefore hinderadequate and responsible decision making. We aim to demonstrate inthis paper that social science research has important added value as asource for appropriate risk assessment and management. Therefore,social science needs to be incorporated together with other types ofanalyses, such as media reports and experts’ evaluations of risks.
1.1. Assessing perceived risks
Policy makers often (need to) rely on the media to assess public risk
perceptions associated with energy production. Yet, research suggeststhat people who perceive highest risks and who are most concernedabout certain types of energy production are most likely to engage inactions such as protests and public meetings [4], making it more likelythat their views are overrepresented in the media. Indeed, there is atrend in the media to engage the audience by reporting “scarce stories”and stressing high rather than low risks [5]. Such media analysis isinformative because it signals whether there are societal concerns aboutenergy production and it reveals which risks are most prominentlydiscussed. At the same time, however, if policymakers rely only on themedia, they may get a narrow understanding of public risk perceptionsand preferences. For example, policymakers may overgeneralize thehigh risk perceptions reported in the media to the general populationand think that everyone perceives the risks as equally high. This can becounterproductive. Policymakers may not further communicate therisks to people – and encourage them to take or accept actions to protectthemselves against these risks – if they conclude from the media reportsthat people are already motivated to take these actions [6].
Social science research can complement media analysis by system-atically studying the extent to which the risk perceptions presented inthe media are shared by the population in general. Such research canreveal whether public risk perceptions in general align with or differ
http://dx.doi.org/10.1016/j.erss.2017.04.012Received 16 December 2016; Received in revised form 25 April 2017; Accepted 25 April 2017
⁎ Corresponding author.E-mail address: [email protected] (G. Perlaviciute).
Energy Research & Social Science 29 (2017) 1–11
2214-6296/ © 2017 The Authors. Published by Elsevier Ltd. This is an open access article under the CC BY license (http://creativecommons.org/licenses/BY/4.0/).
MARK

from media reports and/or experts’ evaluations of risks, and why thiscould be the case. For example, studies have found that people who areexposed to high risks may downplay these risks for themselves – a resultof the optimism-bias [6]. Students in California who lived in dormi-tories that were not earthquake-proof tended to evaluate the risks ofearthquakes for themselves as lower than students living in earthquake-proof dormitories [7]. Optimism biases may have detrimental conse-quences if they reduce people’s motivation to take action to protectthemselves against risks (e.g., the risk of earthquakes [8,9], floods[10,11]; see also [6,12]). In case people do not face high risksthemselves, they may hear about the high risks of energy productionactivities from the media and/or from other people. An interestingquestion here is how they integrate such information into their riskperceptions and whether they distinguish between the risks forthemselves and the risk for others.
The media typically reports that people are concerned about manyrisks of energy production [13]. Yet, for effective risk assessment andmanagement, it is important to understand how people perceivedifferent types of risks and which risks they perceive as most likelyand most severe. Such knowledge can complement the experts’ evalua-tions of risks in setting priorities in risk mitigation policy. Furthermore,it is important to not only understand cognitions but also consider theemotions that people experience towards (the risks of) energy produc-tion, since such emotions may play an important role in people’swillingness to take action and/or accept policy to protect themselvesagainst risks [6]. Besides studying emotions that may motivate peopleto protect themselves against risks, such as anger, it is crucial to mapout emotions that may inhibit people to take protective measures, suchas feeling powerless [14].
Furthermore, in order to better understand the dynamics of riskperception, it is necessary to study how perceived risks, emotions, andpreferences for mitigation measures develop over time. For example,three months after the California earthquake in 1989, Californianuniversity students evaluated their own risk of being hurt in a naturaldisaster – such as earthquake – as lower than the same risk for anaverage student at their university and for an average person of theirage living in their region, which suggests optimism biases [15]. Yet,optimism biases were not observed immediately after the earthquake[15]. Furthermore, research suggests that experience of an earthquakeeliminated optimism biases five months after the earthquake [16].Studies employing longitudinal research designs to study changes inrisk perceptions are however rare [17]. Yet, perceived risks of energyproduction are likely to be continuously influenced by multiple factors,such as people’s experience of risks, media attention to these risks, andmitigation measures that have been implemented. Monitoring riskperceptions over time in such complex contexts is crucial for appro-priate risk assessment and management, and for evaluation of theeffectiveness of mitigation policies.
Based on the above, we argue that appropriate assessment andmitigation of risks posed by energy production should follow a multi-method approach. This should incorporate different levels of analyses,including social science research on public risk perceptions, mediaanalysis, and experts’ evaluations of risks. In the present study, wedemonstrate the added value of the first approach: social scienceresearch to better understand public risk perceptions, emotions, andpreferences for mitigation measures. To illustrate, we studied risksassociated with earthquakes caused by gas production in the provinceof Groningen, the Netherlands.
1.2. Earthquakes caused by gas production in the province of Groningen
Natural gas forms the largest share of the total energy mix in theNetherlands; the total share was 40% in 2014 [18]. Natural gas in theNetherlands is the primary energy source for households for heatinghouses and water and for cooking [19]. NAM (Nederlandse AardolieMaatschappij) operates gas extraction; the company is owned by Shell
and ExxonMobil. Decisions about gas extraction are made by a partner-ship between NAM and EBN (Energie Beheer Nederland); the latter is astate-owned company. The Dutch government is financially involved ingas extraction via EBN [20]. The income from domestic use and exportof gas to the national budget was 5.7 billion euros in 2016 [21]. Arecent study revealed that a representative sample of the Dutchpopulation evaluated gas positively in terms of consequences for theDutch economy, people’s daily comfort, and meeting energy needs inthe Netherlands [22]. Gas was evaluated neither negatively norpositively with regard to consequences for the environment andpeople’s health and safety, and rather negatively on the financial costsfor people [22].
Recently gas production in the Netherlands has been much debatedbecause of earthquakes induced by gas production. The earthquakeshave taken place in the province of Groningen in the north of thecountry, where most of the gas is produced. Multiple earthquakes in theregion have been observed, with a maximum strength of 3.6 on theRichter scale (the Huizinge earthquake in August 2012). The intensityand frequency of earthquakes varies across regions in the province ofGroningen. In January 2013, the State Supervision of Mines (SoDM)published a report stating that stronger earthquakes can be expected ifgas production continues at the same level [23]. This demandslegitimate policy and effective risk mitigation measures in order toprotect local communities and safeguard their quality of life. So far, themedia have been a dominating source of information about publicresponses to earthquakes caused by gas production. Below, we sum-marise a published analysis of media coverage on this topic [13].1 Next,we describe the mitigation measures that have been implemented sofar. Following this, we introduce the key research questions and therelated findings of the current longitudinal survey.
1.2.1. Risk perceptions in the mediaSince the strongest earthquake in August 2012 there has been
increased attention to the risks of earthquakes in the media and inpublic and policy debate. A qualitative analysis of the media coverageon earthquakes suggests that this corresponded with increasing concernabout earthquakes among local communities [13]. According to themedia analysis, public concern was amplified by the SodM report [23],which stated that even stronger earthquakes may happen in the future:“People in Groningen had known about the earthquakes for years andhad lived with them without much concern, but the SodM report withits prognosis of increasing severity of earthquakes and increasedimpacts led many people to reconsider their opinions, leading toconsiderable consternation at the local level” [[13], p. 1]. The mediaanalysis further suggests that people became increasingly concernedabout many risks of earthquakes, such as damage to houses and drop inhouse values, as well as risks for physical and mental health. Further-more, strong emotions, such as anxiety, fear, insecurity, and anger,have been depicted in the media [13].
1.2.2. Mitigation measuresIn January 2014, nine municipalities in the earthquake region, the
national government, and the province of Groningen agreed upon apackage of mitigation measures [24]. Some of these measures arefocused on preventing and/or reducing the risks and damage caused byearthquakes. For example, in March 2014, the minister of economicaffairs decided to reduce gas production in and around the municipalityof Loppersum, which has been most affected by the earthquakes [25].Other examples are reinforcing houses and compensating people fordamage to their houses and the drop in house values. The othermeasures are aimed at safeguarding or improving quality of life inthe region and do not specifically target the risks of earthquakes.Examples are providing facilities such as fast internet and sports
1 The media analysis was conducted mostly in 2013 [13].
G. Perlaviciute et al. Energy Research & Social Science 29 (2017) 1–11
2

facilities, investing in renewable energy sources in the region, andcreating employment by hiring local companies to repair and reinforcehouses (note that the latter measure is closely related to measuresaimed at reducing the risks and damage caused by earthquakes). Thesemeasures have been implemented to some extent and are planned to beimplemented further in the future. Yet, from the media analysis it seemsthat people are generally not satisfied with measures taken so far [13].2
On the basis of this, however, it is difficult to judge whether peopledisregard all the measures or they support some measures more thanothers. Also, it is not clear, based on the media reporting, whetherpeople do not support these measures at all or whether they mainlyobject the way these measures are implemented.
An important question is to what extent the perceived risks,emotions, and policy preferences presented in the media reflect theviews of the general population in the province of Groningen. Also,which risks are people most concerned about, which emotions do theyexperience most strongly, and how do they evaluate different types ofmitigation measures? Given that people live in different regions thatvary in exposure to earthquakes, how do they see the risks forthemselves and the risks for other inhabitants of the province ofGroningen? Answering these questions requires a social science studyof risk perceptions among a representative sample of the population ofthe province of Groningen.
1.3. Current research
We conducted a longitudinal questionnaire study among residentsin the province of Groningen from three regions varying in exposure toearthquakes. We studied public perceptions of different types of risks ofearthquakes and measured how people in different regions perceive therisks for themselves and for other people in the province of Groningen.Also, we studied which emotions people experience and how theyevaluate different mitigation measures that were implemented.3 Im-portantly, we monitored people’s responses over time. During the timeof the study, earthquakes reoccurred, there was increased mediaattention to the related risks, and mitigation measures were taken.Fig. 1 illustrates the timeline of the study, as well as the number ofmedia reports on the (risks of) earthquakes and the earthquakes with amagnitude 3 or higher on Richter scale that took place in that period.The first research phase took place about a year after the strongestearthquake in Huizinge. The second research phase took place shortlyafter the package with mitigation measures was introduced, and thethird research phase took place about half a year later.
2. Method
2.1. Regions
The data was collected in three regions within the province ofGroningen that vary in exposure to earthquakes. Exposure was assessedon the basis of magnitude, intensity, and frequency of earthquakes,based on the data from the Dutch Royal Meteorological Institute at thetime before the first research phase (www.knmi.nl). Region 1 was mostexposed to earthquakes and included the municipality of Loppersum.Region 2 was less exposed to earthquakes and included the munici-palities of Bedum, Appingedam, and Slochteren. Region 3 was leastexposed to earthquakes and included the municipalities of Zuidhorn,Groningen, and Delfzijl.
2.2. Procedure
People were approached at their homes by trained researchassistants and asked to participate in a study on their opinion aboutgas production and earthquakes in the province of Groningen.4 Acomputer programme was used to make a random selection of streetswithin each region and the research assistants went to at most fivehomes within the selected streets. The research assistants followed astrict protocol for approaching people. They first briefly introduced thegoal of the study and asked whether people would be willing toparticipate by filling in a questionnaire, which would take them about30 min. If they agreed to participate, respondents received the ques-tionnaire, which they could fill in by themselves. The questionnaireswere later picked up upon appointment. Also, respondents received aflyer with general information about the study and contact details incase of questions. Before filling in the questionnaire, participants wereasked to sign an informed consent form. As a token of appreciation fortheir time and effort, participants received a 10 euros voucher for alocal bakery. After each research phase, a summary of main findingswas sent to respondents (i.e., those who were willing to participate infollow-up research and therefore provided their contact details; seebelow) and were published on the research website and in the regionalpress. To not affect participants’ subsequent responses, we framed thesesummaries very neutrally, describing the means of key variables andrelative differences between the three regions and between differenttypes of perceived risks, emotions, and evaluations of mitigationmeasures.
2.2.1. MonitoringIn each phase, respondents were asked whether they would like to
participate in follow-up research. If so, a unique code had to be createdby respondents, in order to later match their responses across multiplephases while assuring respondents’ privacy.5 Respondents who agreedto participate again were also asked for their address for contactingthem again. The contact information was stored separately and couldnot be linked to responses in the questionnaire. Due to (potential) drop-out of respondents in the course of the study (e.g., declining toparticipate again, not being at home at the time of the subsequent datacollection phase), we also recruited new respondents in the second andthird phase, using the procedure described above. As such, the currentdesign was a mixture of a cross-section and longitudinal panel design[17].
2.2.2. RespondentsThe responses of 13 participants who did not sign the informed
consent form were excluded from the analyses.6 This resulted in thetotal of 1232 responses. Table 1 displays the number of responses perregion per phase and specifies how many new respondents wererecruited in phase 2 and phase 3.
Socio-demographics characteristics of respondents across researchphases are displayed in Table 2. The socio-demographic characteristicsare similar across the three phases.
2 The media analysis was conducted before the above-mentioned package of mitigationmeasures was introduced. Yet, some mitigation measures, for example compensating fordamages, had already been implemented before; the new package included improvementof implementation of these measures.
3 Measures in the questionnaire that are beyond the scope of this paper are notdiscussed here. The full questionnaire is available from the corresponding author.
4 The person who opened the door was invited to participate, although we did notcontrol (and believe this is not necessary for the study purpose) who in the householdcompleted the study in the first instance. During follow-up visits, we stressed that thesame person who completed the questionnaire the previous time(s) would need tocomplete the questionnaire again.
5 In order to be matched, the codes of the same participant needed to be identical atevery phase of data collection. In case a participant provided incomplete codes or slightlydifferent codes every time, we were not able to match his/her responses and could onlytreat them as independent rather than follow-up responses.
6 If participants did not sign the informed consent form but still indicated to be willingto participate in subsequent research phases, their responses were included in theanalyses.
G. Perlaviciute et al. Energy Research & Social Science 29 (2017) 1–11
3

2.3. Measures
The items measuring perceived risks of earthquakes, emotions, andevaluations of mitigation measures are displayed in Table 3.
2.3.1. Perceived risks of earthquakesRespondents reported to what extent they think it is likely (on a 7-
point scale ranging from 1 very unlikely to 7 very likely) that theearthquakes pose various risks for respondents themselves, for inhabi-tants of the province of Groningen, and several other risks (Table 3).
2.3.2. Emotions towards earthquakesRespondents reported which different emotions they experience
when thinking about the earthquakes on a 7-point scale ranging from 1not at all to 4 moderately to 7 very strongly (Table 3).
2.3.3. Evaluations of mitigation measuresIn all research phases, participants indicated on a 7-point scale to
what extent they think gas production from the Groningen gas fieldshould stop (1) or stay the same (7). Additionally, in phase 2,participants evaluated different types of mitigation measures that hadbeen introduced before phase 2 took place. We included four measuresaimed at preventing and/or reducing the risks and damage caused by
earthquakes and three measures that are not directly targeted atreducing the risks of earthquakes but are aimed at increasing people’squality of life. Respondents indicated on a 7-point scale how urgent (1not at all urgent – 7 very urgent) they find these measures, how wellthese measure are being implemented (1 not at all well implemented – 7very well implemented), and to what extent these measures areeffective (1 not at all effective – 7 very effective) in achieving relevantgoals (Table 3).
2.4. Analyses
We first examined differences between regions in each researchphase, following a cross-sectional design. To make sure that observa-tions were independent across phases, we only included respondentswho participated in one of the research phases for these analyses(n = 515). We tested differences in perceived risks and emotionsbetween regions in each research phase by using MANOVA. Next, weused one-way ANOVA to compare between regions the extent to whichpeople thought that gas production should stop or stay the same. Wealso tested differences between regions in evaluations of mitigationmeasures (which were only studied in phase 2) by using MANOVA. Weused the Bonferroni procedure for the post-hoc analyses. We analysedthe different types of perceived risks, emotions, and evaluations ofdifferent mitigation measures separately, instead of compiling thesemultiple items into overall scales. We followed this procedure in orderto provide a more nuanced counterpoint to the media analysis and togive detailed insight in which risks are perceived as most likely, whichemotions are strongest, and which mitigation measures people prefer.
Second, we examined differences across time following a long-itudinal panel design; here, we selected respondents who participatedin all research phases (n = 137). We tested differences over time byusing repeated measures (RM) ANOVA’s and used the LSD procedurefor the post-hoc analyses. When the assumption of sphericity wasviolated, we used the Bonferroni procedure for the post-hoc analysesand Huynh-Feldt as an estimate for the correction for the degrees offreedom.
Fig. 1. Timeline of the three study phases.
Table 1Number of responses per phase and per region, and number of new respondents in phase2 and phase 3.
Phase 1 Phase 2 Phase 3a
Total 390 (100%) 429 (100%) 413 (100%)New respondents 255 (59%) 160 (39%)Region 1 141 (36%) 139 (32%) 157 (38%)Region 2 126 (32%) 144 (34%) 149 (36%)Region 3 123 (32%) 146 (34%) 101 (24%)
a The percentages across regions do not add up to 100% because region informationwas missing for 6 cases.
G. Perlaviciute et al. Energy Research & Social Science 29 (2017) 1–11
4

3. Results
3.1. Perceived risks of earthquakes
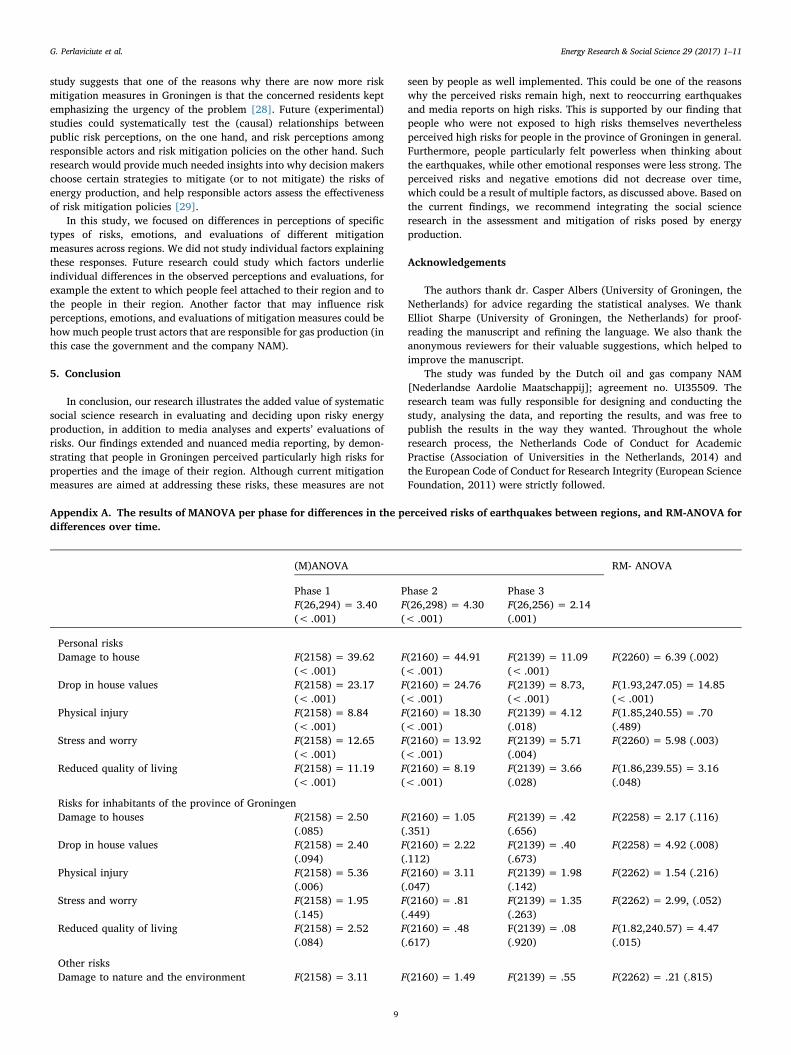
Perceptions of the different risks of earthquakes in the three regionsand across the three study phases are depicted in Fig. 2; details forgroup differences are given in Appendix A. Respondents thought it ishighly likely that the earthquakes will have negative consequences forproperties, namely damage to houses and reduced value of houses.While respondents perceived relatively high risks for their own proper-ties, they generally perceived even higher risks for properties ofinhabitants of the province of Groningen. This was most evident inthe regions that are less exposed to earthquakes, which makes itunlikely that the effects are due to optimism biases. In all study phases,people in most affected regions saw significantly higher risks for theirown properties than people in less affected regions. Yet, everyoneperceived the risks for properties for people in Groningen in general ashigh, with no significant differences across regions.
All respondents evaluated the likelihood that the earthquakes wouldresult in a negative image of the province of Groningen as rather high,with mostly no significant differences across the regions.
Perceived risks of physical injury, stress and worry, as well asreduced quality of living – for respondents themselves and forinhabitants of the province of Groningen – were seen as relativelylower. Again, residents in more affected regions saw their own risks ashigher than those in less affected regions. Everyone saw these risks asrelatively high for inhabitants of the province of Groningen, withmostly no significant differences across the regions.
The risk of damage to nature and the environment, and the risk ofimpaired relationships between people in one’s neighbourhood wereperceived as relatively low, with mostly no significant differencesacross the regions.
Significant increases in risk perceptions over time were found,despite the implementation of the mitigation measures. For peoplethemselves, the perceived risk of damage to houses, drop in housevalues, stress and worry, and reduced quality of living increased. Forinhabitants of Groningen, the perceived risk of a drop in house values,stress and worry, and reduced quality of living increased. Perceived riskof a negative image of the province of Groningen also increased.However, differences between phase 1 and phase 2, and between phase2 and phase 3 were not always statistically significant (details are givenin Appendix A).7
3.2. Emotions
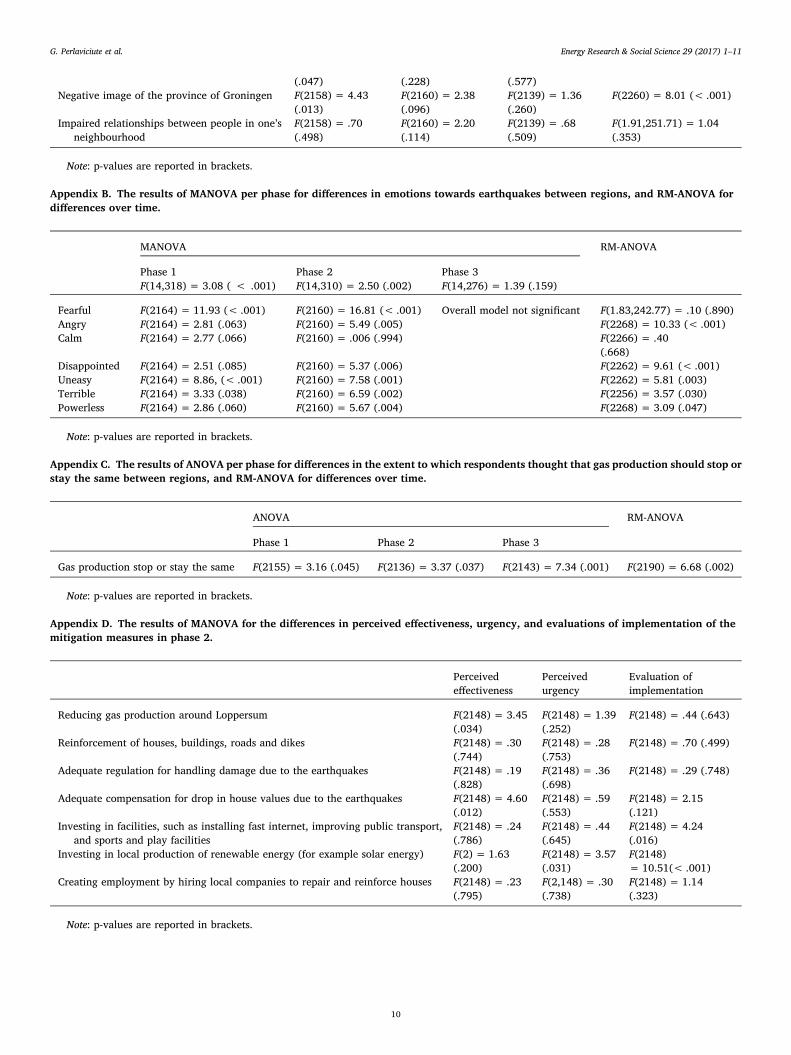
Mean evaluations of emotions towards earthquakes in the threeregions and across the three study phases are depicted in Fig. 3; detailsfor group differences are given in Appendix B. Respondents moststrongly felt powerless when thinking about the earthquakes. Otheremotions – namely feeling fearful, angry, disappointed, uneasy, terrible,and feeling calm – were less strong. Significant differences were foundbetween regions in emotions towards earthquakes at phase 1 and phase2 but not at phase 3. People in more affected regions tended to reportstronger negative emotions than people in less affected regions.
Negative emotions increased over time. In phase 3, respondentsreported feeling more angry, disappointed, uneasy, terrible, and power-less compared to phase 1, They also felt more terrible in phase 2compared to phase 1. Moreover, they reported feeling more angry,disappointed, and uneasy in phase 3 compared to phase 2 (Appendix B).
3.3. Evaluations of mitigation measures
The mean scores for the extent to which respondents thought gasproduction from the Groningen gas field should stop or stay the samewere around or below the mid-point of the scale (see Fig. 4). Thissuggests that respondents thought that gas production should at least bereduced. In all study phases, the regions significantly differed in theextent to which people thought that gas production should stop or staythe same; details for group differences are given in Appendix C.Respondents in the most affected region had a greater tendency tothink that the gas production should stop than respondents in lessaffected regions. Over time, there was an increase in the extent to whichrespondents believed that gas production should be reduced; thisdifference was statistically significant only between phases 1 and 3(Appendix C).
Evaluations of the other mitigation measures that were evaluated inphase 2 are depicted in Fig. 5. The measures aimed at preventing and/or reducing the risks and damage caused by earthquakes (i.e., reducinggas production around Loppersum; reinforcement of houses, buildings,roads and dikes; adequate regulation for handling damage due to theearthquakes; and adequate compensation for drop in house values due
Table 2Socio-demographic characteristics per research phase.
Phase 1 Phase 2 Phase 3
Gender Female 169(43%)
195(45%)
176(43%)
Male 212(54%)
225(52%)
232(56%)
Missing values 9 (2%) 9 (2%) 5 (1%)
Age (in years) M (SD) 52.15(14.91)
52.66(14.59)
54.81(13.71)
Minimum 19 18 20Maximum 90 84 84Missing values 12 (3%) 10 (2%) 6 (1%)
Highest completededucation
Primary school 8 (2%) 5 (1%) 3 (1%)Lower vocationaleducation
34 (9%) 37 (9%) 29 (7%)
Secondary(vocational)education
142(36%)
143(33%)
146(35%)
Higher (vocational)education
141(36%)
135(31%)
113(27%)
Scientific education(university)
47 (12%) 38 (9%) 25 (6%)
Other 6 (2%) 4 (1%) 4 (1%)Missing values 12 (3%) 67 (16%) 93 (22%)
Income per month < €1000 17 (4%) 14 (3%) 12 (3%)€1000–€2000 98 (25%) 113
(26%)94 (23%)
€2000–€3000 109(28%)
107(25%)
95 (23%)
€3000–€4000 79 (20%) 72 (17%) 74 (18%)€4000–€5000 30 (8%) 26 (6%) 31 (8%)> €5000 14 (4%) 7 (2%) 4 (1%)Missing values 43 (11%) 90 (21%) 103
(25%)
Householdcomposition
Alone 59 (15%) 52 (12%) 46 (11%)With children 12 (3%) 17 (4%) 13 (3%)With partner 161
(41%)160(37%)
146(35%)
With partner andchildren
139(36%)
130(30%)
120(29%)
Other 9 (2%) 8 (2%) 5 (1%)Missing values 10 (3%) 62 (14%) 83 (20%)
Number of years ofresidence in thearea
M (SD) 30.59(19.66)
31.95(19.30)
34.40(19.63)
Minimum .50 1 1Maximum 83 83 80Missing values 9 (2%) 63 (15%) 84 (20%)
7 Please note that differences over time were tested only for respondents whoparticipated in all study phases. The group means for these participants are comparableto the group means for those who participated once (see figures; exact means can berequested from the first author). This also applies for further analyses of emotions andevaluations of mitigation measures.
G. Perlaviciute et al. Energy Research & Social Science 29 (2017) 1–11
5

to the earthquakes) were evaluated as somewhat more urgent than themeasures aimed at safeguarding or improving quality of life in theregion (i.e., investing in facilities, such as installing fast internet,improving public transport, and sports and play facilities; and investingin local production of renewable energy such as solar energy). While
most measures were seen as rather urgent, they were not evaluated asvery effective and people were not very positive about the way thesemeasures were implemented. Creating employment by hiring localcompanies to repair and reinforce houses was seen as particularlyurgent and effective for achieving the relevant goal (i.e., strengthening
Table 3Measures of perceived risks of earthquakes, emotions towards earthquakes, and evaluations of mitigation measures.
Perceived risks of earthquakes
I consider […] because of the earthquakes 1 very unlikely – 7 very likelyPerceived risks for people themselves [damage to my house]
[drop in the value of my house][physical injury for myself or my family][stress and worry for myself or my family][reduced my quality of living]
Perceived risks for inhabitants of the province of Groningen [damage to houses of inhabitants of the province of Groningen][drop in the value of houses of inhabitants of the province of Groningen][physical injury for inhabitants of the province of Groningen][stress and worry for inhabitants of the province of Groningen][reduced quality of living of inhabitants of the province of Groningen]
Perceived other risks [damage to nature and the environment][that the image of the province of Groningen will be negative][impaired relationships between people in my neighbourhood]
Emotions towards earthquakes
When I think about earthquakes as consequence of gas production from the Groningen gas field, I feel… 1 not at all – 4 moderately – 7 very strongly…fearful…angry…calm…disappointed…uneasy…terrible…powerless
Evaluations of mitigation measures
I think that gas production from the Groningen gas field should… 1 stop – 7 stay the sameOther mitigation measures evaluated in phase 2: I consider this measure…
1 not at all – 7 very effectivein…a
Preventing and/or reducing the risksand damage caused byearthquakes
Reducing gas production around Loppersum 1 not at all urgent– 7 very urgent
1 not at all well implemented –7 very well implemented
…improving safetyReinforcement of houses, buildings, roads anddikes
…improving safety
Adequate regulation for handling damage due tothe earthquakes
…compensating inhabitantsfor damage
Adequate compensation for drop in house valuesdue to the earthquakes
…compensating inhabitantsfor damage
Increasing quality of life Investing in facilities, such as installing fastinternet, improving public transport, and sportsand play facilities
…improving liveability
Investing in local production of renewable energy(for example solar energy)
… increasing the value ofhouses
Creating employment by hiring local companies torepair and reinforce housesb
… strengthening theregional economy
Note. For all items translations from Dutch are given.a Different goals were indicated for different mitigation measures, as illustrated in the table.b This measure is closely related to measures aimed at preventing and/or reducing the risks and damage caused by earthquakes.
Fig. 2. Perceived risks of earthquakes in the three regions and across the three study phases.
G. Perlaviciute et al. Energy Research & Social Science 29 (2017) 1–11
6

the regional economy); yet, the implementation of this measure wasalso not evaluated very positively.
Respondents in less affected regions evaluated some mitigationmeasures as somewhat more effective, urgent, or well implementedthan respondents in more affected regions. But in general evaluations ofmitigation measures were similar across regions (Appendix D).
4. Discussion
Energy production may pose serious risks. Besides experts’ evalua-tions of such risks, appropriate risk assessment and managementrequire knowledge of how the public perceive and experience the risksand which mitigation measures they prefer. Decision makers often(need to) rely on media coverage on public risk perceptions, but themedia may over-represent the perspective of people who perceive highrisks and experience strong negative emotions. As a result, decision-
makers may get a narrow view of public risk perceptions, which canundermine responsible decision making about energy production. Weargue that social science research can provide an important contribu-tion to risk assessment and management, by studying which risks andemotions are most prominent among the population in general, andwhich mitigation measures people in the affected region prefer.Furthermore, monitoring risk perceptions over time can provide in-sights into how risk perceptions are continuously influenced by multi-ple factors, such as people’s experience of risks, media attention to theserisks, and mitigation measures that have been implemented. Weaddressed these questions in a longitudinal study on public perceptionsof risks, experienced emotions, and evaluations of mitigation measuresassociated with earthquakes caused by gas production in the provinceof Groningen.
Our results provided more nuance to the media analysis byrevealing which specific perceived risks and emotions people in the
Fig. 3. Emotions towards earthquakes in the three regions and across the three study phases.
Fig. 4. Extent to which people think gas production should stop (1) or stay the same (7) in the three regions and across the three study phases.
Fig. 5. Evaluations of mitigation measures across the three regions.
G. Perlaviciute et al. Energy Research & Social Science 29 (2017) 1–11
7

region experience, and how they evaluate various mitigation measuresthat have been implemented. While the media suggest that people arevery concerned about many earthquake-associated risks in the provinceof Groningen, we found that people perceived some risks as more likelythan other risks. People reported highest perceived risks for properties –namely damage to houses and drop in house values – and for the imageof the province of Groningen. In contrast, they evaluated the risks ofphysical injury, stress and worry, reduced quality of living, damage tonature and the environment, and impaired relationships betweenpeople in one’s neighbourhood as less likely. Notably, most of themitigation measures that have been implemented are aimed at com-pensating people for damaged properties and preventing furtherdamages, and therefore seem to focus on people’s prominent concerns.Yet, our findings indicate that people still perceive these risks as high.This could be due to multiple factors, including the reoccurringearthquakes and increased media focus on high risks. It may also be aresult of people thinking that the mitigation measures are not wellimplemented, as found in this study. These findings suggest that it isindeed important to incorporate multiple levels of analyses – includingmedia reports, social science research on public risk perceptions, andexperts’ evaluations of risks – in order to identify the most prominentrisks that should be prioritized in policy making. Notably, policymakers are not only responsible for addressing the most prominentrisks that people perceive but, more generally, for protecting peopleagainst the most acute risks, even if these risks may not be prominent inpublic concern.8
Differences in peoples’ evaluations of their own risks correspondedwith the exposure to earthquakes in the area in which they live. Peoplein the region most affected by earthquakes evaluated their own risks ashighest, whereas people in less affected regions perceived their ownrisks as lower. Notably, people in all regions perceived the risks forinhabitants of the province of Groningen in general as relatively high.Several factors could play a role here, including media reports abouthigh risks as well as mitigation measures that are generally not seen asvery well implemented. Future (experimental) studies could system-atically investigate the unique effects of such factors on public riskperceptions.
As may be expected, the negative emotions were somewhat strongerin the regions more exposed to earthquakes. Yet, on average, theevaluations of negative emotions were around the midpoint of the scale,which was labelled as “moderate” (“matig” in Dutch). Only the feelingof powerlessness was relatively strong. This is an important finding,since feeling powerless may prevent people from taking risk protectivemeasures. Future research could study whether feeling powerlessindeed prevents people from taking effective action to protect them-selves against the risks, for example using money received as compen-sation for damage to pay for repair or reinforcements of their homes.Additionally, future research could investigate which factors influencefeeling powerless and what are effective strategies to mitigate suchfeelings. In case of energy production, people themselves have littlecontrol over the related risks and need to rely on responsible actors –such as the government and industry – for risk assessment andmanagement. The way these actors manage (or do not manage) therisks and the extent to which people trust these parties may affect thefeeling of powerlessness. Additionally, future research could system-atically study the conditions under which certain risks and hazardsevoke strong negative emotions.
Respondents thought that gas production from the Groningen gasfield should be reduced to some extent. In the later research phases thisincreased, with respondents more strongly believing gas productionshould be decreased. The more people were exposed to earthquakes, themore they thought that gas production should stop or be reduced. Yet,on average, people did not think that gas production should stop
completely. This may be due to gas being perceived as beneficial for thenational economy and energy security, and as a comfortable energysource [22]. While the current study focused primarily on perceivedrisks of gas quakes, future studies could investigate the relationshipsbetween perceived risks, on the one hand, and perceived national aswell as regional benefits of gas production, on the other hand. Thiswould provide additional insights into how people weigh differentnegative and positive consequences of energy production and how theyincorporate these different consequences in their acceptability ratingsof different energy sources.
Furthermore, people evaluated measures that are aimed at prevent-ing and/or reducing the risks of earthquakes as particularly urgent. Incontrast, measures that do not directly target the risks of earthquakes(e.g., investing in various facilities) were seen as somewhat less urgent.Interestingly, creating employment by involving local companies inrecovering and reinforcing houses was seen as very urgent and effectivemeasure to strengthen the regional economy. This suggests that peoplepreferred measures that tackle the risks of earthquakes and improvequality of life. Preference for this measure may be partly due to the factthat some parts of the province of Groningen (e.g., municipalities ofLoppersum, Delfzijl, Appingedam) are facing economic decline due to ashrinking population [26]. Similarly, local communities may consider itfair to receive additional benefits for the risks they bear because of gasproduction. Future studies are needed to examine the effects of thedifferent characteristics of mitigation measures on people’s evaluationsof these measures.
While people perceived many mitigation measures as urgent, theywere not very positive about the effectiveness of most measures and theway these measures are implemented. This may be one of the keyfactors explaining why perceived risks and negative emotions did notdecrease over time; if anything, they increased. This again emphasizesthat it is important to incorporate knowledge about public riskperceptions in addition to experts’ evaluations of risks. Through this,we can better assess how the current measures address important risksand people’s concerns about these risks, as well as how these measurescan be optimized.
4.1. Limitations and future research
This research was a first attempt to study how perceived risks ofenergy production form and develop in a complex context of thereoccurring risks, media attention to these risks, and introduction ofmitigation measures. We conducted a longitudinal study to reveal andmonitor people’s risk perceptions, emotions, and preferences formitigation measures in such a complex context. Yet, field study designscannot explain the causal relationships between the observed publicviews and contextual factors. Future experimental studies couldinvestigate these relationships. For example, scenario studies couldintroduce mitigation measures that vary on certain aspects and test howthese different aspects influence people’s evaluations of the mitigationmeasures, as well as their risk perceptions and emotions.
We followed a door-to-door procedure for data collection in order toreach people who may normally not express their opinion, for examplein the media. Yet, not everyone whom we approached agreed toparticipate (please note that we did not record the response rate),and the sample may therefore not be fully representative of the relevantpopulation. Yet, a similar procedure has resulted in a high response ratein prior research (e.g., 79.5% in a study on quality of life in residentialenvironments [27]). Future studies could try to further optimize thedata collection procedures and how representative these samples are ofthe general population.
Furthermore, the aim of the current research was to study public riskperceptions. Future research could address how actors that are respon-sible for energy production – such as the government and industry –incorporate (their interpretation of) public risk perceptions in their ownassessment of risks and in risk mitigation policies. For example, a recent8 We thank anonymous reviewer for this important point.
G. Perlaviciute et al. Energy Research & Social Science 29 (2017) 1–11
8
study suggests that one of the reasons why there are now more riskmitigation measures in Groningen is that the concerned residents keptemphasizing the urgency of the problem [28]. Future (experimental)studies could systematically test the (causal) relationships betweenpublic risk perceptions, on the one hand, and risk perceptions amongresponsible actors and risk mitigation policies on the other hand. Suchresearch would provide much needed insights into why decision makerschoose certain strategies to mitigate (or to not mitigate) the risks ofenergy production, and help responsible actors assess the effectivenessof risk mitigation policies [29].
In this study, we focused on differences in perceptions of specifictypes of risks, emotions, and evaluations of different mitigationmeasures across regions. We did not study individual factors explainingthese responses. Future research could study which factors underlieindividual differences in the observed perceptions and evaluations, forexample the extent to which people feel attached to their region and tothe people in their region. Another factor that may influence riskperceptions, emotions, and evaluations of mitigation measures could behow much people trust actors that are responsible for gas production (inthis case the government and the company NAM).
5. Conclusion
In conclusion, our research illustrates the added value of systematicsocial science research in evaluating and deciding upon risky energyproduction, in addition to media analyses and experts’ evaluations ofrisks. Our findings extended and nuanced media reporting, by demon-strating that people in Groningen perceived particularly high risks forproperties and the image of their region. Although current mitigationmeasures are aimed at addressing these risks, these measures are not
seen by people as well implemented. This could be one of the reasonswhy the perceived risks remain high, next to reoccurring earthquakesand media reports on high risks. This is supported by our finding thatpeople who were not exposed to high risks themselves neverthelessperceived high risks for people in the province of Groningen in general.Furthermore, people particularly felt powerless when thinking aboutthe earthquakes, while other emotional responses were less strong. Theperceived risks and negative emotions did not decrease over time,which could be a result of multiple factors, as discussed above. Based onthe current findings, we recommend integrating the social scienceresearch in the assessment and mitigation of risks posed by energyproduction.
Acknowledgements
The authors thank dr. Casper Albers (University of Groningen, theNetherlands) for advice regarding the statistical analyses. We thankElliot Sharpe (University of Groningen, the Netherlands) for proof-reading the manuscript and refining the language. We also thank theanonymous reviewers for their valuable suggestions, which helped toimprove the manuscript.
The study was funded by the Dutch oil and gas company NAM[Nederlandse Aardolie Maatschappij]; agreement no. UI35509. Theresearch team was fully responsible for designing and conducting thestudy, analysing the data, and reporting the results, and was free topublish the results in the way they wanted. Throughout the wholeresearch process, the Netherlands Code of Conduct for AcademicPractise (Association of Universities in the Netherlands, 2014) andthe European Code of Conduct for Research Integrity (European ScienceFoundation, 2011) were strictly followed.
Appendix A. The results of MANOVA per phase for differences in the perceived risks of earthquakes between regions, and RM-ANOVA fordifferences over time.
(M)ANOVA RM- ANOVA
Phase 1 Phase 2 Phase 3F(26,294) = 3.40(< .001)
F(26,298) = 4.30(< .001)
F(26,256) = 2.14(.001)
Personal risksDamage to house F(2158) = 39.62
(< .001)F(2160) = 44.91(< .001)
F(2139) = 11.09(< .001)
F(2260) = 6.39 (.002)
Drop in house values F(2158) = 23.17(< .001)
F(2160) = 24.76(< .001)
F(2139) = 8.73,(< .001)
F(1.93,247.05) = 14.85(< .001)
Physical injury F(2158) = 8.84(< .001)
F(2160) = 18.30(< .001)
F(2139) = 4.12(.018)
F(1.85,240.55) = .70(.489)
Stress and worry F(2158) = 12.65(< .001)
F(2160) = 13.92(< .001)
F(2139) = 5.71(.004)
F(2260) = 5.98 (.003)
Reduced quality of living F(2158) = 11.19(< .001)
F(2160) = 8.19(< .001)
F(2139) = 3.66(.028)
F(1.86,239.55) = 3.16(.048)
Risks for inhabitants of the province of GroningenDamage to houses F(2158) = 2.50
(.085)F(2160) = 1.05(.351)
F(2139) = .42(.656)
F(2258) = 2.17 (.116)
Drop in house values F(2158) = 2.40(.094)
F(2160) = 2.22(.112)
F(2139) = .40(.673)
F(2258) = 4.92 (.008)
Physical injury F(2158) = 5.36(.006)
F(2160) = 3.11(.047)
F(2139) = 1.98(.142)
F(2262) = 1.54 (.216)
Stress and worry F(2158) = 1.95(.145)
F(2160) = .81(.449)
F(2139) = 1.35(.263)
F(2262) = 2.99, (.052)
Reduced quality of living F(2158) = 2.52(.084)
F(2160) = .48(.617)
F(2139) = .08(.920)
F(1.82,240.57) = 4.47(.015)
Other risksDamage to nature and the environment F(2158) = 3.11 F(2160) = 1.49 F(2139) = .55 F(2262) = .21 (.815)
G. Perlaviciute et al. Energy Research & Social Science 29 (2017) 1–11
9
(.047) (.228) (.577)Negative image of the province of Groningen F(2158) = 4.43
(.013)F(2160) = 2.38(.096)
F(2139) = 1.36(.260)
F(2260) = 8.01 (< .001)
Impaired relationships between people in one’sneighbourhood
F(2158) = .70(.498)
F(2160) = 2.20(.114)
F(2139) = .68(.509)
F(1.91,251.71) = 1.04(.353)
Note: p-values are reported in brackets.
Appendix B. The results of MANOVA per phase for differences in emotions towards earthquakes between regions, and RM-ANOVA fordifferences over time.
MANOVA RM-ANOVA
Phase 1 Phase 2 Phase 3F(14,318) = 3.08 ( < .001) F(14,310) = 2.50 (.002) F(14,276) = 1.39 (.159)
Fearful F(2164) = 11.93 (< .001) F(2160) = 16.81 (< .001) Overall model not significant F(1.83,242.77) = .10 (.890)Angry F(2164) = 2.81 (.063) F(2160) = 5.49 (.005) F(2268) = 10.33 (< .001)Calm F(2164) = 2.77 (.066) F(2160) = .006 (.994) F(2266) = .40
(.668)Disappointed F(2164) = 2.51 (.085) F(2160) = 5.37 (.006) F(2262) = 9.61 (< .001)Uneasy F(2164) = 8.86, (< .001) F(2160) = 7.58 (.001) F(2262) = 5.81 (.003)Terrible F(2164) = 3.33 (.038) F(2160) = 6.59 (.002) F(2256) = 3.57 (.030)Powerless F(2164) = 2.86 (.060) F(2160) = 5.67 (.004) F(2268) = 3.09 (.047)
Note: p-values are reported in brackets.
Appendix C. The results of ANOVA per phase for differences in the extent to which respondents thought that gas production should stop orstay the same between regions, and RM-ANOVA for differences over time.
ANOVA RM-ANOVA
Phase 1 Phase 2 Phase 3
Gas production stop or stay the same F(2155) = 3.16 (.045) F(2136) = 3.37 (.037) F(2143) = 7.34 (.001) F(2190) = 6.68 (.002)
Note: p-values are reported in brackets.
Appendix D. The results of MANOVA for the differences in perceived effectiveness, urgency, and evaluations of implementation of themitigation measures in phase 2.
Perceivedeffectiveness
Perceivedurgency
Evaluation ofimplementation
Reducing gas production around Loppersum F(2148) = 3.45(.034)
F(2148) = 1.39(.252)
F(2148) = .44 (.643)
Reinforcement of houses, buildings, roads and dikes F(2148) = .30(.744)
F(2148) = .28(.753)
F(2148) = .70 (.499)
Adequate regulation for handling damage due to the earthquakes F(2148) = .19(.828)
F(2148) = .36(.698)
F(2148) = .29 (.748)
Adequate compensation for drop in house values due to the earthquakes F(2148) = 4.60(.012)
F(2148) = .59(.553)
F(2148) = 2.15(.121)
Investing in facilities, such as installing fast internet, improving public transport,and sports and play facilities
F(2148) = .24(.786)
F(2148) = .44(.645)
F(2148) = 4.24(.016)
Investing in local production of renewable energy (for example solar energy) F(2) = 1.63(.200)
F(2148) = 3.57(.031)
F(2148)= 10.51(< .001)
Creating employment by hiring local companies to repair and reinforce houses F(2148) = .23(.795)
F(2,148) = .30(.738)
F(2148) = 1.14(.323)
Note: p-values are reported in brackets.
G. Perlaviciute et al. Energy Research & Social Science 29 (2017) 1–11
10
References
[1] European Commission, 10. Secure, clean and efficient energy, Horizon 2020 WorkProgramme 2016–2017, (2016) Decision C(2016)4614 of 25 July 2016.
[2] C. Foulds, T.H. Christensen, Funding pathways to a low-carbon transition, Nat.Energy 1 (2016) 16087.
[3] B.K. Sovacool, Diversity: energy studies need social science, Nature 511 (7511)(2014) 529.
[4] J.I. De Groot, L. Steg, Morality and nuclear energy: perceptions of risks and benefits,personal norms, and willingness to take action related to nuclear energy, Risk Anal.30 (9) (2010) 1363–1373.
[5] Breakwell, Barnett, (2001), cited in G.M. Breakwell, The Psychology of Risk, 2ndedition. Cambridge University Press, Cambridge, United Kingdom, (2014).
[6] G.T. Gardner, P.C. Stern, Environmental Problems and Human Behaviour, 2ndedition, Pearson Custom Publishing, Boston, MA, 2002.
[7] D.R. Lehman, S.E. Taylor, Date with an earthquake coping with a probable,unpredictable disaster, Pers. Soc. Psychol. Bull. 13 (4) (1987) 546–555.
[8] D.S. Mileti, P.W. O’Brien, Warnings during disaster: normalizing communicatedrisk, Soc. Probl. (1992) 40–57.
[9] C. Solberg, T. Rossetto, H. Joffe, The social psychology of seismic hazardadjustment: re-evaluating the international literature, Nat. Hazards Earth Syst. Sci.10 (8) (2010) 1663–1677.
[10] K. Burningham, J. Fielding, D. Thrush, ‘It'll never happen to me’: understandingpublic awareness of local flood risk, Disasters 32 (2) (2008) 216–238.
[11] T. Grothmann, F. Reusswig, People at risk of flooding: why some residents takeprecautionary action while others do not, Nat. Hazards 38 (1–2) (2006) 101–120.
[12] M. Helweg-Larsen, J.A. Shepperd, Do moderators of the optimistic bias affectpersonal or target risk estimates? A review of the literature, Pers. Soc. Psychol. Rev.5 (1) (2001) 74–95.
[13] N. Van der Voort, F. Vanclay, Social impacts of earthquakes caused by gasextraction in the Province of Groningen, The Netherlands, Environ. Impact Assess.Rev. 50 (2015) 1–15.
[14] G. Böhm, H.R. Pfister, Action tendencies and characteristics of environmental risks,Acta Psychol. 104 (3) (2000) 317–337.
[15] J.M. Burger, M.L. Palmer, Changes in and generalization of unrealistic optimismfollowing experiences with stressful events: reactions to the 1989 Californiaearthquake, Pers. Soc. Psychol. Bull. 18 (1) (1992) 39–43.
[16] M. Helweg-Larsen, (The lack of) optimistic biases in response to the 1994Northridge earthquake: the role of personal experience, Basic Appl. Soc. Psychol. 21
(2) (1999) 119–129.[17] M. Siegrist, Longitudinal studies on risk research, Risk Anal. 34 (8) (2014)
1376–1377.[18] Centraal Bureau voor de Statistiek(CBS) [Statistics Netherlands], Energieverbruik in
Nederland [Energy Use in the Netherlands], (2015) Cited in www.aardgas-in-ndereland.nl . (Accessed 21 March 2016).
[19] Dutch Ministry of Economic Affairs, Energierapport Transitie naar duurzaam[Energy Report Transition to Sustainable], Xerox/OBT, The Hague, 2016.
[20] Dutch Lower House of Parliament, Wijziging van de Mijnbouwwet in verband metnieuwe regels omtrent deelneming in de opsporing en winning van koolwater-stoffen door een daartoe aangewezen vennootschap en omtrent andere taken enactiviteiten van die vennootschap – 31 090, nr. 3, SDU uitgevers, The Hague, 2007.
[21] Dutch Lower House of Parliament, Miljoenennota 2016–34 300, nr. 1, (2016).[22] G. Perlaviciute, L. Steg, E.J. Hoekstra, Is gas perceived as sustainable? Insights from
value-driven evaluations in the Netherlands, Energy Res. Soc. Sci. 20 (2016) 55–62.[23] State Supervision of Mines (SoDM), Reassessment of the Probability of Higher
Magnitude Earthquakes in the Groningen Gas Field, (2013) Available via https://www.rijksoverheid.nl/documenten/rapporten/2013/01/16/reassessment-of-the-probability-of-higher-magnitude-earthquakes-in-the-groningen-gas-field .(Accessed 14 April 2016).
[24] Administrative agreement between nine municipalities in the earthquake region,the national government, and the province of Groningen, Herstel van vertrouwen –Vertrouwen op herstel [Recovery of trust - Trust in recovery], (2014) Available viahttp://www.provinciegroningen.nl/actueel/dossiers/aardbevingen/alles-op-een-rij/ . (Accessed 14 April 2016).
[25] Ministry of Economic Affairs, Winningsbesluit Gaswinning Groningenveld enversterkingsmaatregelen – DGETM-EM/14207601, (2014).
[26] Dutch government, Indeling gemeenten krimpregio’s en anticipeerregio’s[Distribution of Municipalities in Shrinking Regions and Anticipated Regions],(2015) Available via https://www.rijksoverheid.nl/onderwerpen/bevolkingskrimp/documenten/publicaties/2015/06/29/indeling-gemeenten-krimpregio-s-en-anticipeerregio-s . (Accessed 10 February 2017).
[27] G. Perlaviciute, L. Steg, Quality of life in residential environments, Psyecology 3 (3)(2012) 325–340.
[28] J. Kester, Energy security and human security in a Dutch gasquake context: a case oflocalized performative politics, Energy Res. Soc. Sci. 24 (2017) 12–20.
[29] P.C. Stern, How can social science research become more influential in energytransitions? Energy Res. Soc. Sci. 26 (2017) 91–95.
G. Perlaviciute et al. Energy Research & Social Science 29 (2017) 1–11
11


![Towards the Measurement of Perceived Architectural Qualities · of emotions” [2], a paper given by neurobiologists to survey the respective locations where emotions are felt in](https://img.dokumen.tips/doc/110x75/606107bc8644164e0c734262/towards-the-measurement-of-perceived-architectural-qualities-of-emotionsa-2.jpg)