Embed Size (px)
Citation preview

University of Groningen
New strategies for (biological) particle handling and separation in microfluidic devicesJellema, Laurens-Jan Cornelis
IMPORTANT NOTE: You are advised to consult the publisher's version (publisher's PDF) if you wish to cite fromit. Please check the document version below.
Document VersionPublisher's PDF, also known as Version of record
Publication date:2010
Link to publication in University of Groningen/UMCG research database
Citation for published version (APA):Jellema, L-J. C. (2010). New strategies for (biological) particle handling and separation in microfluidicdevices. Groningen: s.n.
CopyrightOther than for strictly personal use, it is not permitted to download or to forward/distribute the text or part of it without the consent of theauthor(s) and/or copyright holder(s), unless the work is under an open content license (like Creative Commons).
Take-down policyIf you believe that this document breaches copyright please contact us providing details, and we will remove access to the work immediatelyand investigate your claim.
Downloaded from the University of Groningen/UMCG research database (Pure): http://www.rug.nl/research/portal. For technical reasons thenumber of authors shown on this cover page is limited to 10 maximum.
Download date: 26-02-2019

25
Separating Biological Particlesin Flowing Microsystems
L.C. Jellema and E. VerpoorteIn preparation as invited paper for Electrophoresis
Pharmaceutical Analysis, Department of Pharmacy, University of Groningen,
A. Deusinglaan 1, PO-box 196, 9700 AD Groningen, The Netherlands
Chapter 2

Chapter 2
26
Microfluidic devices have become increasingly multifunctional tools, applicable to
many different areas of research. The well-defined flows within the channels are use-
ful when working with particles, as they follow a predictable path through the de-
vice. This report focuses on the use of laminar flows to separate particles in
microchannels. Specially designed channels are used to generate flow patterns which
facilitate particle separation by allowing the capture and transport of particles in clo-
sed streamlines or, alternatively, enabling particles to easily switch from one stream-
line to another. External forces can also be used to influence susceptible particles and
induce separation. The particles may be the actual analytes that have to be separated
from other particles or the fluids in which they are suspended. On the other hand,
particles may also be used as reagents to interact with the analyte under investigation.
In this review, we present studies describing the separation not only of well-charac-
terized inorganic nano- or microspheres but also biologically relevant particles, in-
cluding (blood) cells, bacteria and DNA. These biological particles deserve special
attention with respect to their behaviour and separation in microfluidic channels, as
they often have shapes deviating from the spherical, are deformable, and have the
ability in many cases to change conformation.
Abstract

Separating Biological Particles in Flowing Microsystems
27
2.1 Introduction
In the fields of chemical, biochemical and clinical analysis, sample preparation ge-
nerally remains a crucial step in the analysis process, as few methods allow the ana-
lysis of analytes directly in complex matrices. Sample preparation often includes the
manipulation of particles in fluids or the removal of particulate matter from fluids.
The particles may be the actual analyte, interact with the analyte, or interfere with ana-
lysis of the analyte, in which case they need to be removed from the sample. The
term “particles” is used in the broadest sense of the word here, and includes larger (bi-
ological) particles, like polymer microspheres, cells, bacteria or DNA. In all cases, the
method chosen for particle handling and separation strongly depends on the compo-
sition of the sample and the final goal of the analysis. Microfluidic channels can be
used to integrate analytical procedures like sampling, reactions, separations and de-
tection onto one automated device. Due to the micro- or nanometer-scale dimensions
of the channels, small aliquots of fluid can precisely be handled and manipulated in
short times. The smallest dimensions of the microchannel also determine the size of
the analyte and other species that can be manipulated. The first on-chip separation was
performed by Manz et al., namely a capillary electrophoresis separation of small fluo-
rescent molecules.1, 2 Shortly after these publications, Wilding and Kricka examined
sperm motility through microfabricated barriers in a microchannel, in one of the first
examples of cell analysis on a chip.3 Furthermore, they demonstrated that red blood
cells and microparticles could be separated from samples using filters with 5-µm-
wide gaps. However, whole blood was not processed because of clogging problems.4
These first publications showed the potential of lab-on-a-chip technologies for a wide
range of applications, from analysis of molecular species to cell analysis. Since then,
many other different separation mechanisms in microchannels for molecular and par-
ticulate species have been studied, many of which can be and have been used for ana-
lysis of biological samples.
The geometry, fluid flowrate, and fluid properties all dictate whether flow in a given
flow system is laminar, turbulent or transitional between these flow types. The type
of flow, on both the macro- and micro-scale, can be characterized with a dimension-
less parameter, the Reynolds number, Re.5 The Re represents the balance between
inertial and viscous forces on the fluid.5, 6 The inertial forces are represented by the
average velocity, v, and the density, ρ, of the fluid. The viscous forces are represen-

Chapter 2
28
ted by the dynamic viscosity, η, and the characteristic length, d, where d reflects the
effective diameter of the channel.5, 6
In microchannels, the Reynolds numbers are small and thus flows are well-defined
and predictable. When an analyte is present in the flow, it will follow the streamline
in which it finds itself. However, the analyte will also diffuse while being transpor-
ted by the flow, either in the direction of the flow or perpendicularly to it. Diffusion
is a time-dependent process,7 and diffusion rate decreases as analyte size increases.8,
9 Generally speaking, diffusion is a relatively slow process when compared to con-
vective transport of the analyte in the channel, especially where micrometer-sized
particles are concerned. Particles will thus tend to follow the streamlines in which
they find themselves, with little diffusion occurring between adjacent streamlines.
Hence, predictable flows in microchannels provide an extremely interesting route to
controlled particle transport and manipulation in microfluidic devices. Different me-
chanisms for particle separation and/or removal from samples in microfluidic devi-
ces have been reported in recent years, based on well-defined laminar flow profiles.
Separation of particle samples can be performed in two ways, namely as batch pro-
cesses or as continuous processes. In batch processes, a small aliquot of sample (nL
or less) is injected into a main channel, where separation is then performed (e.g. chro-
matographic or electrophoretic separation) and the different particle fractions detec-
ted. This type of separation is primarily analytical in nature and is not really suited to
procedures requiring the removal of particles from larger sample volumes. Though
this process could be repeated numerous times to process larger sample volumes and
collect larger particle amounts for preparative purposes, it would prove to be quite
cumbersome and time-consuming. Continuous separation methods provide an alter-
native when larger numbers of particles in larger volumes need to be processed. In this
case, the sample is continuously introduced into the separation channel, to be sorted
into different streams and subsequently leave the channel at different positions after
separation is performed. This can be achieved in liquid flows in branched channel
networks or in flows around obstacle arrays in microchannels. Other approaches in-
volve the use of externally applied forces, like acoustic or magnetic forces, to influ-
ence the behaviour of particles susceptible to these forces in the flow. Continuous
separation mechanisms may often also be executed with a small aliquot of sample,
Re = ���
� (1)

thus serving as batch separation procedures. Particle separation mechanisms in con-
tinuously flowing systems have been reviewed thoroughly by Pamme.10 A look at the
relevant literature will reveal that the number of applications for separation of biolo-
gical particles, based on various separation mechanisms, has recently grown sub-
stantially.
In this paper, different particle separation mechanisms inspired by the laminar flow
in micrometer-sized channels are reviewed. The different techniques are categorized
into three different sections. The first section includes all those mechanisms in which
particles are separated in laminar flows through channel networks, and around ob-
stacles placed in the channels. Separation in channels designed to induce secondary
flow effects are discussed in the second section. The third and last section focuses on
the use of external forces to separate particles susceptible to these forces, based on dif-
ferences in their susceptibility. Examples are given for the application of each sepa-
ration mechanism to biological particles, to highlight the usefulness of many of these
approaches for real-world samples. The Tables in the text give overviews of the dif-
ferent techniques and focus on applications utilizing well-defined microspheres, bi-
ological particles like cells, bacteria, and blood.
2.2 Separation by laminar flow through channels
A number of microfluidic separation techniques benefit from the exquisite control of
laminar solution flows possible only at the nano- and microscale. Several of these
are based on the use of pressure-driven flow velocity profiles. Channel networks are
designed to generate specific routes for the flow through the device. This section des-
cribes different techniques for separation based on laminar flow. Table 1 at the end
of the section summarizes the different separation mechanisms and their application
to the separation of biological particles.
2.2.1 Hydrodynamic Chromatography
The use of microfluidic devices has led to new particle separation approaches based
both on totally new laminar-flow enabled mechanisms and on the miniaturization of
existing methods. Hydrodynamic chromatography (HDC) is an example of an exis-
ting method first described by Dimarzio & Guttman11-13 and Small14 in the early
1970’s. HDC is reminiscent of Taylor-Aris dispersion,15-17 a phenomenon by which a
Separating Biological Particles in Flowing Microsystems
29

soluble compound is dispersed in a pressure-driven laminar flow (PF) due to the com-
bination of velocity variation across the flow profile and molecular diffusion between
streamlines. However, where Taylor-Aris dispersion addresses the problem of point
particles, HDC involves the separation by flow of particles of finite size.11 The par-
ticles are separated due to the fact that particles in a fluid flow follow the streamli-
nes in which they are present. Because the centre of a particle cannot get any closer
to the walls than its radius,11 larger particles occupy a slightly smaller region of the
channel, as shown in Fig. 1. Therefore, larger particles cannot sample the low-velo-
city streamlines near the wall, and thus gain a higher average velocity than small par-
ticles.14 Particles can be separated based on this phenomenon if the separation channel
is long enough, as larger particles will reach the end of the channel before smaller par-
ticles do. A schematic representation of the mechanism is given in Fig. 1.
HDC was performed initially in packed columns in order to obtain the narrow flui-
dic conduits required for size separation of polymers11 and colloidal particles ranging
in size from tens of nm to a few μm.14 The introduction of precision-made micro-
channels produced using chip-based technologies and having depths of 1 μm or less
has represented a major advance for this technique. It has become possible, for in-
stance, to perform separations of nm-sized particles and proteins in channels having
lengths of just a few cm.18-20
The first demonstrations of HDC separations on a chip involved the separation of
samples containing fluorescent 110-, 44- and 26-nm particles, injected onto an 80-
mm-long, 1-mm-wide and 1-µm-deep channel.18, 20 The larger 110-nm-diameter par-
ticles, as expected from theory, were carried faster by the flow and eluted first,
Chapter 2
30
Figure 1 Schematic overview of hydrodynamic chromatography separation. Left to right: (A)definition of the area of the channel occupied by the particles with respect to their diameters;(B) sample plug with small and large particles at the beginning of the channel; the parabo-lic flowprofile; (C) small and large particles are separated at the end of the channel; arrowsindicate the average velocities.
A B C

Separating Biological Particles in Flowing Microsystems
31
followed by 44- and 26-nm particles. However, it was observed that the elution of
both small molecules and particles often differed from theoretical predictions. It was
concluded that effects such as analyte adsorption to the wall (in the case of small
fluorescent molecules), ionic strength and differences in particle surface properties
such as charge, can all play a significant additional role in these HDC separations.
Comparison of separations performed in 1.0-mm-wide and 0.5-mm-wide channel re-
vealed that dispersion due to the contribution of the sidewalls was reduced by using
wider channels.20
The application of chip-based HDC to the analysis of proteins has been reported.
Blom et al. demonstrated the separation of two proteins, bovine serum albumin (BSA)
and bovine eye α-crystallin,20 in about 1 minute, rather than the 8 minutes required
for the same separation in a packed column HDC.20, 21 A report by Stein et al., inves-
tigating the mobility of DNA strands in shallow microchannels, also suggests that
this chip technique could be used for DNA separation.22 Linear DNA strands have an
equilibrium coil size which increases with length. In microchannels having a height
larger than 2 µm, the pressure-driven mobility of DNA is observed to increase as a
function of strand length.22 The cause of this behaviour is analogous to that of the
solid nanospheres discussed above, in that the DNA molecules cannot get any closer
to the walls than their radii allow. Therefore, larger DNA molecules are more locali-
zed towards the center of the channel than smaller DNA molecules, exhibiting a hig-
her mobility as a result. In fact, it should be possible to separate 8.8 kbp DNA from
48.5 kbp DNA in a 50-µm-wide, 3-µm-deep channel, as 8.8 kbp DNA exhibits a 10%
lower mobility in this system than 48.5 kbp DNA.22 However, the separation of two
different lengths of DNA would require a complete device with injection element and
separation channel and was not tested in ref. 22.
2.2.2 Pinched flow fractionation
Pinched flow fractionation (PFF), introduced by Yamada and Seki,23 is another mi-
crofluidic separation technique exploiting the laminar flow velocity profile. In PFF,
the sample stream containing particles is continuously introduced into a pinched chan-
nel segment via one inlet, as shown in Fig. 2A, and pinched against the wall with a
second carrier stream, introduced via a second inlet. In this way, the particles are alig-
ned against the wall. The center of a smaller particle ends up closer to the wall than
that of a larger particle, so that particles in the pinched stream are forced to sample

different streamlines depending on their size. When the flow leaves the pinched seg-
ment, the flow streamlines containing the different-sized particles fan out, and the
distance between streamlines is amplified. As a result, the particles are found at dif-
ferent positions across the wide segment perpendicular to the flow, with the smallest
particles closest to the walls and the largest located more towards the center of the
channel, as shown in Fig. 2. Because the streamlines containing different particles
are spread out over the width of the channel after exiting the pinched segment, this
technique is also referred to as hydrodynamic spreading.24
Separations were first performed with 15- and 30-µm-diameter particles using a 50-
µm-wide pinched segment.23 Multiple outlet channels located after the pinched seg-
ment could be used to collect the separated particle types, Fig 2B. The amount of
Chapter 2
32
Figure 2 (A) Schematic overview of pinched flow fractionation. Particles are pinched againstthe wall by a carrier fluid. When the flow enters the wide segment, it fans out and the sepa-ration between streamlines is amplified, with a resulting separation of particles perpendicu-lar to the flow. Microspheres and erythrocytes are colored dark and light grey, respectively.�ote that the erythrocytes are aligned vertically in the flow in the pinched segment. The re-lative flowrate distribution is indicated with the dashed line. (B) Channel design with multi-ple outlet channels to collect particle fractions separately. Outlet numbers correspond to theoutlets mentioned in the text. (C) Schematic overview of separation enhancement using a phy-sical barrier to separate the flow, followed by a second fan-out step.
A B
1
5
2
4
3
C
pinched segment
enhancing segment

fluid entering each outlet is determined by the relative flowrate distribution between
the outlets. Changing the flowrate distribution was used as a means to tune the sepa-
ration and collect 0.5 to 5.0-µm-diameter particles in different outlets.25-27 Different
approaches were chosen to change the flowrate distribution. In one case, the dimen-
sions (width, depth and length) of one of the outlet channels were altered so that this
channel acted as drain (e.g. outlet 5 in Fig. 2B could be changed). As a result, the
largest portion of the liquid flowed into this outlet. This approach was named Asym-
metric Pinched Flow Fractionation (AsPFF), as the outlet positioned closest to car-
rier flow acted as the drain and design of the outlet became asymmetric.25 The second
approach used a poly(dimethylsiloxane) (PDMS) microvalve, based on the valving
mechanism described by Unger et al.,28 to increase the resistance of one outlet and
decrease the amount of fluid running into the channel.26 A PDMS membrane placed
on top of the channel (outlet 1 in Fig. 2B) could be actuated with pneumatic pressure
to change channel resistance. A third method used electro-osmotic flows (EOF) in-
stead of PF to generate fluid flows. Electrodes were connected to the inlets (positive)
and outlets (negative), and different potentials were applied to the electrodes in the
outlets to tune the flowrate distribution precisely and thereby enhance separation per-
formance.27 The group of Hjort developed a fourth method, in which the pressure-
driven carrier flow was tuned by adding EOF. However, this was performed for 1.9-
and 9.9-µm-diameter particles in a channel where the outlet consisted of one wide
channel segment, as shown in Fig. 2A. Separated particles were therefore not col-
lected as different fractions.24 The separation in a channel with one wide outlet could
be improved by introducing a so-called ‘enhancing segment’, which physically se-
parates the particle-containing-flow from the non-particle-containing-flow in the wide
channel segment. The enhancing segment itself has a unique geometry, widening after
a short distance. This allows the separation of particle-containing streamlines to be
amplified a second time, improving separation as shown in Fig. 2C.29 These resear-
chers found that separation resolution depends on the microchannel aspect ratio, par-
ticle size difference and wall roughness. Others have noted that particles with
diameters on the order of the wall roughness could not be separated , due to the dis-
persion caused by the wall roughness.30 In contrast to HDC, the separation in PFF is
not dependent on the dispersion of particles between different streamlines in the la-
minar flow. Rather, the particles are pinched by the flow to end up in defined stre-
amlines, making PFF more suitable for larger particles than HDC.
Separating Biological Particles in Flowing Microsystems
33

The first application of PFF for separation of biological particles was done in an
AsPFF-device.25 Erythrocytes (red blood cells) were pinched with a carrier stream
and collected in one of thirteen outlets, using an outlet design similar to that in Fig.
2B. Importantly, erythrocytes are not spherical, having a biconcave discoid geome-
try instead with diameters of 6-8 µm and a thickness of 2 µm. Interestingly, 80% of
the erythrocytes were collected in the outlet where spherical particles of 2.6- to 3.9-
µm-diameter particles normally ended up. The remaining portion was collected in
the outlet where normally even smaller spherical particles were found. It was post-
ulated that the erythrocytes were aligned vertically in the flow towards the wall in the
pinched segment and beyond, as shown in Fig. 2A. Particle behaviour is thus domi-
nated by the minimum length, e.a. the thickness of the erythrocyte.25
The Hjort group enhanced the separation by PFF of E. coli and yeast by tuning the
carrier flow with EOF.24 The carrier and particle flow were operated at the same pres-
sure-driven flowrates, which resulted in an equal distribution of the flows over the
channel width. Particle pinching was then performed by tuning the carrier flow with
EOF. This is in contrast to the work from the group of Seki where different flowra-
tes were used to pinch the particles. In the Hjort group, neural cells were separated
from glial cells by Wu et al..31 Non-Newtonian fluids were used to control the width
of the particle-containing- and carrier-flows. One of the properties of a non-Newto-
nian fluids is that the viscosity changes when shear stress is applied. At low flowrate,
that is, low shear stress, the fluid exhibits a large viscosity. When the flowrate, and
thus the shear stress, increases, the viscosity decreases. At a constant flowrate ratio,
the viscosity will determine the width of the carrier and particle flow, in essence tu-
ning these flows viscoelastically. At high viscosity (low flowrate), the carrier stream
will pinch the particles or cells against the wall and hence separation of particles can
be performed.
The surfaces of particles can be specially coated to capture an analyte of interest or
extract species from solutions. One reported PFF application utilized different-sized
streptavidin-coated particles functionalized with oligonucleotides for the detection
of point-mutations or single-nucleotide polymorphisms (SNPs). After DNA hybridi-
zation, the larger ‘wild-type’ particles were separated with PFF from smaller ‘mu-
tant-type’ particles.32 A last example of PFF is the size separation of oil droplets in
water using PFF.33 This could be very useful, as droplets can be used to encapsulate
Chapter 2
34

biological particles like cells and therefore act as a tool in biological particle hand-
ling.34
Separating Biological Particles in Flowing Microsystems
35
Part
icle
type
M
echa
nism
(B
io-)
Parti
cle
diam
eter
C
omm
ents
C
ontin
uous
/B
atch
R
ef.
• Po
lyst
yren
e na
nopa
rticl
es
Hyd
rody
nam
ic
Chr
omat
ogra
phy
•
110,
44
and
26 n
m
Proo
f of p
rinci
ple
Bat
ch
18, 2
0
• Po
ly(s
tyre
ne/d
ivin
ylbe
nzen
e)
Pinc
hed
flow
frac
tiona
tion
• 15
& 3
0 μm
Pr
oof o
f prin
cipl
e C
ontin
uous
23
•
Poly
mer
•
Poly
styr
ene
Pinc
hed
flow
frac
tiona
tion
• 1.
0 –
5.0
μm
1.
9 –
9.9
μm
C
hang
e of
cha
nnel
resi
stan
ce
EOF
tuni
ng /
visc
oela
stic
ally
tuni
ng
Con
tinuo
us
25, 2
6 24
, 31
• Po
lyst
yren
e Pi
nche
d flo
w fr
actio
natio
n •
0.25
– 2
.5 μ
m
Extra
spre
adin
g ar
ea
Con
tinuo
us
29
• Po
lyst
yren
e Pi
nche
d flo
w fr
actio
natio
n •
0.5
– 3.
0 μm
Fl
ow d
istri
butio
n co
ntro
l by
EOF
Con
tinuo
us
27
Bio
logi
cal p
artic
les
•
Bov
ine
seru
m a
lbum
in a
nd
• B
ovin
e ey
e α-
crys
talli
n H
ydro
dyna
mic
C
hrom
atog
raph
y •
~10
nm
~ N
.A.
Sepa
ratio
n ba
sed
on si
ze
Bat
ch
20
• Li
near
DN
A
Hyd
rody
nam
ic
Chr
omat
ogra
phy
• 48
.5 k
bp (1
.46
μm)
20.3
kbp
(0.9
2 μm
) 8.
8 kb
p (0
.58
μm)
Sepa
ratio
n ba
sed
on le
ngth
/coi
l dia
met
er
Bat
ch
22
• Er
ythr
ocyt
es (d
isco
id)
Pinc
hed
flow
frac
tiona
tion
• 2
x 6
– 8
μm
Sepa
rate
d fr
om b
lood
con
stitu
ents
C
ontin
uous
25
•
E. c
oli
• Y
east
Pi
nche
d flo
w fr
actio
natio
n •
Smal
l la
rge
(< 9
.9 μ
m)
EOF
tuni
ng
C
ontin
uous
24
• G
lial c
ells
•
Neu
ron
cells
Pi
nche
d flo
w fr
actio
natio
n
• 4.
9 μm
20
μm
Se
para
tion
usin
g vi
scoe
last
ical
ly tu
ning
of
flow
stre
am w
idth
C
ontin
uous
31
• Fu
nctio
naliz
ed p
artic
les
Pi
nche
d flo
w fr
actio
natio
n •
3.09
μm
5.
6 μm
M
utan
t DN
A h
ybrid
izat
ion
on su
rfac
e W
ild-ty
pe D
NA
hyb
ridiz
atio
n on
surf
ace
Con
tinuo
us
32
Tab
le 1
. O
verv
iew
of
(bio
logi
cal)
par
ticl
es s
epar
ated
by
lam
inar
flo
w t
hrou
gh c
hann
els

2.3 Separation based on filtration and flow around obstacles
The previous section described particle separations enabled by laminar flow profiles
in channels. However, flow and particle transport in microchannels can also be con-
trolled and manipulated through the placement of obstacle arrays in mirochannels.
Micromachined pillars can serve as physical barriers for actual filtering, or can be
used to generate specific flow pathlines. Particle separation approaches exploiting
these types of concepts are discussed in this section and summarized in Table 2, which
is located at the end of the section.
2.3.1 Filtration techniques
Particle separation and removal from solutions is commonly accomplished in the con-
ventional lab by filtration, using materials with controlled pore sizes to retain parti-
cles larger than the pores and allow smaller particles to pass through. Key to a good
filter is the precision with which pores of a certain size are formed. Micromachined
filters often take the form of arrays of posts positioned across a microchannel, ex-
ploiting the micrometer size resolution and precision of photolithographic processes
to achieve very small and well-defined gaps between posts. Kricka and Wilding de-
monstrated several early examples of such systems micromachined in silicon. An
array of posts with complex geometry, separated by short, 5-μm-wide periodic ser-
pentine channels was used to separate erythrocytes and 5.78-μm latex particles in se-
parate experiments from small fluid samples. While erythrocytes were sometimes
able to pass through the gaps because of their ability to deform, the particles were too
large and remained on the injection side.4 In other examples from the same group, post
arrays were used to separate erythrocytes from leukocytes prior to polymerase chain
reaction (PCR) to amplify leukocyte DNA.35-37
More recently, the Groisman group used a filter-like concept to construct a micro-che-
mostat for the cultivation of microorganisms. The biological particles were retained
in 100-μm-wide, 6-μm-deep chambers, which were connected with shallow (0.6 μm)
capillaries to adjacent 150-μm-wide, 6-μm-deep channels. The capillaries were small
enough to prevent escape of micro-organisms from the chambers, but large enough
to allow for diffusive exchange of nutrients and metabolites between the channels
and chambers. Fresh medium was continuously passed through the channels to ensure
that medium was refreshed every 40 s next to the chambers. This method was used
Chapter 2
36

to culture E. coli and yeast and expose them to other media.38 This filtering approach
was also applied by the same group to the separation of plasma from blood, using a
device with a deep main channel with arrays of 1920 shallow channels aligned along-
side each side. Cross-flow filtration was used to extract ~8% of the blood volume as
plasma through these side channels as the blood sample, including all cellular com-
ponents, flowed past. Again, the shallow channels had a depth of only 0.5 μm, pre-
venting the co-extraction of blood cells along with plasma. Dilute blood was pumped
with a pulsatile average flowrate of 0.65 µL/min to prevent the device from clog-
ging.39 To clean the device, a flow was applied through the shallow side channels to
wash away the small components from blood and exchange the medium. The amount
of red blood cells in whole blood were reduced by a factor of ~4000 while leaving
98% of the white blood cells behind.40
Cross-flow filtration for blood separation has also been performed by other resear-
chers in straight channels which were separated into three regions by two arrays of
pillars along the length of the channel. The flow containing blood was introduced
into the central region in between the pillar arrays. Small components were able to
pass the array and reach the outer channel areas, leaving larger particles behind.41-43
This was done in a PDMS device to remove leukocytes from blood, a process known
as leukapheresis,41 with as a result the isolation of 50 % of the erythrocytes and a gre-
ater than 97 % depletion of the leukocytes. Other examples also involve the separa-
tion of erythrocytes from leukocytes,42, 43 with subsequent cell lysis integrated for
PCR.43 The same approach was used to separate large myocytes from small non-my-
ocytes, with a viability test afterwards. It was noted by the author that the small 7-9
µm non-myocyte cells had to deform as they passed through 5-µm-wide gaps.44
Hydrodynamic filtration (HDF), developed by the group of Seki, resembles the cross-
flow filtration devices presented above, except that the extraction side channels have
the same depth as the main channel itself. There are thus no physical barriers pre-
venting extraction of large blood components into these channels, rather, selective
extraction of different-sized components is controlled by flowrate distribution. In
HDF, a continuous flow with randomly spread particles enters a main channel with
multiple side branches.45 Only the fluid flow near the wall enters the side branches,
with the amount of fluid leaving the main channel being dictated by the relative flo-
wrate distribution between the main and side channels. This will thus also define the
Separating Biological Particles in Flowing Microsystems
37

width of the flow stream near the walls which enters the side branch. The relative
flowrate distribution is determined by the flow resistances in the various channels,
which are in turn determined by channel dimensions. When the flowrates into the
side branches are sufficiently low, only a small portion of the flow near the wall goes
into the side branches, as shown in Fig 3A. Particles with radii larger than the width
of this flow will not enter the side branch, but will be carried past the channel ope-
ning. The particles remain in the main channel even if present near the wall or if their
diameter is smaller than the cross-sectional area of the side branch. Interestingly, the
particles are aligned against the wall as the fluid near the wall is extracted from the
main channel, and thus after each branch the particles are shifted towards the walls
of the channel, shown in Fig. 3B. This operation mode is called the “flow state”. Par-
ticles with radii small enough to be contained within the width of the flow portion en-
tering the side branches, enter the side branch with the flow, schematically shown in
Fig 3B-D. This technique was utilized to concentrate and align 1 to 3-µm-diameter
particles by extracting fluid using multiple side branches. Further downstream, the re-
lative flowrate distribution changes and the portion of fluid that enters the side
branche increases. Particles that fit into the fluid portion are collected and separation
Chapter 2
38
Figure 3 Schematic overview of hydrodynamic filtration. The relative flowrate distrubtion isindicated with the dashed line. (A) The relative flow rate distribution into the side channelsis low, only fluid leaves the main channel. (B) After repeated operation with relative low flowrate distribution particles are aligned against the wall. Relative flow rate distribution changed,therefore aligned erythrocytes go into the side branches. When the relative flow rate distri-bution is further increased, small (C) and large (D) particles can enter the side branches.
A B
C D

is performed according to size.45, 46 The power of this technique is its dual capability
for particle concentration and separation.
The flow state mode of HDF can be exploited to concentrate and align particles not
only at the walls but also in the center of the channel. To do this, fluid is extracted at
one side of the main channel to align the particles at that wall. Further downstream,
the fluid from the side branches is recombined with the fluid in the main channel,
and the aligned particles are shifted towards the center.47 Side branches on the oppo-
site side of the channel operated in the flow state mode enhance particle concentra-
tion, alignment, separation selectivity and recovery.46 Particles could also be
concentrated and aligned in the center of the channel with side branches on both sides
of the channel. Fluid was first removed from the channel on both sides, to be recom-
bined further downstream.47
HDF was applied to blood samples to enrich the number of leukocytes compared to
erythrocytes. Erythrocytes were able to enter the side channels, as the disc-thickness
was smaller than the width of the fluid stream entering the side branches, as shown
in Fig. 3B. The alignment of these cells with respect to the flow was the same as in
the PFF case, shown in Fig 2. Prior to HDF, 780 times more erythrocytes then leu-
kocytes were present in the sample. After enrichment, an increased number of leu-
kocytes was measured, with erythocytes outnumbering leukocytes by a factor of 29
rather than 780.45
Separation of liver cells, hepatocytes and nonparenchymal cells is another example
of the application of HDF to biological particles.48 Viability tests before and after se-
paration yielded the same results, indicating that shear stress didn’t influenced the
cells. After filtration, off-chip anti-albumin antibody staining was used to confirm
that hepatocytes were separated from non-parenchymal cells.
The flow state mode of HDF can also by employed to exchange cell medium.49 This
was done to study the time-dependent exposure of HeLa cells to Triton X-100, a sur-
factant used to solubilize the cellular membrane. The device in this case had a se-
cond inlet located on one side. On the other side and further downstream, multiple
side branches were located to replace the original medium with Triton X-100 using
the flow state mode. The “stimulation area”, so called because the cells were meant
Separating Biological Particles in Flowing Microsystems
39

to interact with the Triton X-100 in this region, was located downstream from these
channels. A second inlet and set of side branches were located after this region to re-
move the Triton X-100 and wash the cells in the same manner as the Triton X-100 was
introduced. The residence time in the “stimulation area” could be changed by vary-
ing the length of the “stimulation area” or changing the flowrates. Cells were expo-
sed 17 to 210 ms and collected in the outlet to study their viability.
HDF is thus a proven technique for the concentration, alignment and enrichment pro-
cedures of (biological) particles. Furthermore, the technique can be applied to toxi-
city studies, biochemical assays and other studies, where controlled exposure to fluids
or reagents is required. It can also be used for encapsulated biological material, as it
has been shown that this technique is applicable to the separation of droplets.50
2.3.2 Obstacle array for sorting by diffusion
The intelligent placement of obstacles in a channel can be used to size-separate par-
ticles by diffusion. Particles migrate not only under the influence of the flow, but dif-
fuse at the same time. Rectangular obstacles placed at a 45-degree angle with respect
to the direction of flow create an asymmetric obstacle array. Slowly diffusing parti-
cles are likely to travel straight through the obstacle array without being deflected
Chapter 2
40
Figure 4 Schematic representation of the separation mechanism underlying the Brownian ra-chet. (A) Particles pass gap A between the obstacles and are transported in the direction ofgap B by the electric field, E. Between gap A and B the particles diffuse perpendicularly tothe direction of transport. Small particles, which diffuse faster, are deflected by the obstacleand pass through gap B+, whereas larger particles diffuse slowly and pass through gap B. Inthis way, particles are separate based on diffusion. (B) Schematic overview of the separationof a sample containing small and large particles in the obstacle array. (Figures adapted fromDuke et al. ref. 51)
injection
small
large
A B
y
x
B
B+
B-
A

while passing the obstacles on the short side,51 as shown in Fig. 4A. Diffusion is a
size-dependent process and small particles, with larger diffusion coefficients, diffuse
faster than large particles. Small and therefore faster diffusing particles will also tra-
vel straight down through the obstacle array. However, at the same time small parti-
cles diffuse perpendicular to the direction of the flow to such an extent that they may
be deflected by the obstacles and pass along the long side of the obstacle, as shown
in Fig. 4A. Particles with different sizes and therefore different diffusion coefficients
will be deflected by differing amounts and find themselves at different lateral positi-
ons, resulting in size separation based on diffusion (Fig. 4B). This approach is refer-
red to as the Brownian rachet.51-55 The time to diffuse in directions perpendicular to
the flow can be altered by modifying the distance between the obstacles and the trans-
port velocity of the analyte.
This diffusion-based method for size separation was used to separate 15-kbp and
33.5-kbp DNA fragments with radii of gyration of 0.31 µm and 0.43 µm, respectively.
After passing through a 10-cm-long array consisting of 1.5 x 6 µm obstacles separa-
ted by a 1.5 µm gap, the two DNA fragment bands were separated by 6.4 mm from
each other in the direction perpendicular to the flow, with each band exhibiting a nar-
row bandwidth.52 An array of different dimensions was used to separate T2 and T7
DNA (radii of gyration of 2.3 µm and 1.1 µm, respectively). Based on theoretical
considerations and observed results, the authors expect this technique to be applica-
ble to the separation of 50-500 bp ladders within 10 minutes, and mixtures of 65 kDa
and 68 kDa proteins within 2 minutes.53 Huang et al. improved the separation reso-
lution with a factor ~3.8 and increased the separation speed by a factor 10 simply by
tilting the direction of flow at a small angle with respect to the original direction of
flow (the y-axis in Fig. 4A).55 The device works better at low than at high flowrates,
as the particles have more time to diffuse at the lower flowrates.
2.3.3 Deterministic lateral displacement
Besides filters and Brownian ratchets, an obstacle array in a microchannel may also
be used to generate a pattern of flow streamlines to separate particles. Huang et al.placed obstacles in a channel with a gap larger than the particles under investigation
to generate flow streamlines, mentioned with G in Fig. 5.56 This concept is based on
the fact that the flow splits into defined lanes (defined by flow streamlines) when it
travels around the obstacles and will recombine after passing. In a periodic array of
Separating Biological Particles in Flowing Microsystems
41

obstacles, with a horizontal shift, δ, of the obstacles each row with respect to the pre-
vious row, this process is repeated each row when flow passes the obstacle array,
shown in Fig. 5. However, the relative positions of the lanes change each row which
is determined by the shift of the obstacles and rejoins its original position in a perio-
dic way. Now imagine two types of particles present in this flow, with radii smaller
and larger than the lane width. Particles with radii smaller than the lane width will re-
main within the lane, and return towards the same relative position one spatial period
downstream, via a so-called “zigzag mode” around the obstacles, shown in Fig. 5. If
its radius is larger than the lane width, the particle transfers into the neighbouring
lane when its centre of mass is within that lane. This is repeated every time a parti-
cle passes a row in the periodic array of obstacles, resulting in the deflection of its po-
sition within the obstacle array relative to the direction of flow. This mode is called
the “displacement mode”. Depending on their size, particles are transported in the
Chapter 2
42
Figure 5 Size-separation modes for deterministic lateral displacement. G indicates the gapwidth between posts, λ the distance between rows, and δ the displacement of posts in one rowwith respect to posts in adjacent rows. At the far left, the flow lanes around the obstacles andtheir pathway through the post array are depicted. Towards the right, the trajectories for smallparticles and large particles through the post array are given. Small particles remain in theirrespective lanes in the so-called ‘zigzag-mode’, and follow a relatively straight path throughthe post array as a result. Large particles are transferred into the neighbouring lane at eachrow and are thus deflected with respect to the flow when passing through the array. (Figureadapted from Morton et al. ref. 58)
G
δ
λ
small particle large particle
zigzag-mode displacement mode

Separating Biological Particles in Flowing Microsystems
43
• Pa
rtic
le ty
pe
Mec
hani
sm
(B
io-)
Parti
cle
diam
eter
C
omm
ents
C
ontin
uous
/B
atch
•
Poly
mer
mic
rosp
here
s Fi
ltrat
ion
• 5.
8 μm
1.
5 μm
Pr
oof o
f prin
cipl
e, se
para
ted
from
m
ediu
m
Bat
ch
• Po
lym
er m
icro
sphe
res
Hyd
rody
nam
ic fi
ltrat
ion
• 1.
0 –
3.0
μm
Proo
f of p
rinci
ple
Impr
ovem
ent o
f sep
arat
ion
Con
tinuo
us
• Po
lym
er m
icro
sphe
res
Det
erm
inis
tic la
tera
l di
spla
cem
ent
• 0.
80 –
1.0
3 μm
•
2.3
- 22
μm
Proo
f of p
rinci
ple
Dev
elop
men
t of m
odel
C
ontin
uous
Bio
logi
cal p
artic
les
• E.
Col
i •
Yea
st
Phys
ical
bar
rier
• 2-
3 x
1 μm
Perf
usio
n w
ith n
utrit
ion
Bat
ch
• M
yocy
tes
• N
on-m
yocy
tes
Cro
ss-f
low
filtr
atio
n •
15-1
7 μm
•
7-9
μm
Sepa
ratio
n C
ontin
uous
• H
epat
ocyt
es
• N
on-p
aren
chym
al c
ells
H
ydro
dyna
mic
filtr
atio
n
• 18
.7 +
/- 5.
3 μm
9.
3 +/
- 4.5
μm
Si
ze b
ound
ary
of 1
5 μm
C
ontin
uous
• H
eLa
cells
(cer
vica
l can
cer)
M
ediu
m e
xcha
nge
• 8
- 30
μm
Tim
e-de
pend
ent t
reat
men
t of c
ells
C
ontin
uous
•
15 k
bp D
NA
•
33.5
kbp
DN
A
Bro
wni
an ra
chet
•
0.31
μm
0.
43 μm
D
iffus
ion
base
d se
para
tion
Con
tinuo
us
• T2
col
ipha
ge D
NA
•
T7 c
olip
hage
DN
A
Bro
wni
an ra
chet
•
2.3
μm
1.1
μm
Sepa
ratio
n C
ontin
uous
• 48
.5 k
bp λ
-DN
A
• 16
8 kb
p T2
-DN
A
Bro
wni
an ra
chet
•
N.A
. Se
para
tion
Con
tinuo
us
• 61
arti
ficia
l chr
omos
omes
DN
A
• 15
8 kb
p ar
tific
ial c
hrom
osom
es D
NA
D
eter
min
istic
late
ral
disp
lace
men
t •
N.A
. Se
para
tion
and
prec
once
ntra
tion
Con
tinuo
us
• Ep
ithel
ial c
ells
•
Fibr
obla
st
Det
erm
inis
tic la
tera
l di
spla
cem
ent
• 17
.3 ±
2.7
μm
13
.7 ±
3.0
μm
Se
para
tion
as m
odel
for
card
iom
yocy
tes a
nd n
on-m
yocy
tes
Con
tinuo
us
Tab
le 2
.B
iolo
gica
l pa
rtic
les
sepa
rate
d by
fil
trat
ion
or f
low
aro
und
obst
acle
s pl
aced
in
the
chan
nels

“zigzag” or in the “displacement mode” and can thus be separated by size, shown in
Fig. 5. The main difference between this technique and the Brownian rachet51-55 is
that this method does not depend on diffusion.56 In fact, increasing the flowrate would
decrease the effect of diffusion and give sharper separation bands. In contrast, an inc-
reased flowrate in a Brownian rachet would decrease the time for diffusion would
decrease and thus the separation would be less efficient.
Size separation with deterministic lateral displacement was demonstrated by Huang
et al. with 0.80 – 1.03-µm-diameter, fluorescently-labelled particles, and 61 kbp and
158 kbp artificial chromosomes from E. coli. Furthermore it was shown that DNA
could be preconcentrated when a broad stream was directed to one side of a channel
exploiting the displacement mode.56 The gap size and horizontal shift of the row in
the array determine the particle size that is transported according to the displacement
mode. A model for the critical particle size depended on the gap between the posts (Gin Fig. 5), distances between the rows (λ in Fig. 5) and fluid transport mechanism was
presented and supported with data from 2.3-µm to 22-µm-diameter particles.57
Arrays with different characteristics can be used to focus or guide particles. Separa-
tion of lymphocytes from blood platelets was shown with an obstacle array using nu-
cleic-acid-staining dye to follow the trajectories of the different cell types. The array
was designed such that lymphocytes are transported in the displacement mode and
platelets and other staining residues are subjected to the zigzag mode.58 In an array
where platelets are transported in the displacement model it was demonstrated that
this technique is useful for downstream analysis as the platelets were stained with
immunofluorescent dye (phycoerythrin conjugated CD-41 antigen). This was done by
parallel introducing a running buffer with the cells, the antigen solution and washing
buffer. The array runs the cells from the running buffer to the washing buffer through
the antigen solution. Similar to this was the chromosomal separation of E. coli bac-
teria using lysis buffer.59
Different arrays in series was used to size blood components.60, 61 In the first array, the
smallest particles follow the direction of the flow and larger particles are displaced.
In the next array the stream with the smallest particles continuous in the direction of
the flow. The fraction containing larger particles is then again separated an array, with
smaller particles continuing in the direction of the flow and larger ones which are
Chapter 2
44

displaced by the array. With several arrays placed in series different lateral displace-
ment routes are generated that particles follow according to their size and particles end
up on different lateral positions perpendicular to the flow direction. Inglis et al. se-
parated monocytes and lymphocytes for 99% from red blood cells without the need
to lyse red blood cells prior to separation, which is required for flow cytometry. They
reported that red blood cells behaved as particles with diameters less than 5 µm whe-
reas the diameter is 6 to 8 µm and thickness is 2 µm. This reminds us of the way
erythrocytes behave in PFF25 and HDF.45 This device was used to differentiate he-
althy lymphocytes from larger malignant lymphocytes after activation.60 In another
study they first separated large white blood cells from cells smaller than 5 µm in one
array. The platelets were then separated in an array with different characteristics to
study the effect of heat and thrombin on the size.61 Combining these studies would re-
sult in one device with different arrays capable to size separate whole blood in its
different components. Davis et al. took blood apart with deterministic lateral displa-
cement arrays. First removing the large white blood cells would prevent the device
from clogging when separating the smaller red blood cells and platelets in an array
with smaller gaps. However, they were also not able to do it in one device jet.62
Deterministic lateral displacement was also used to select cells for tissue enginee-
ring. A heterogeneous cell suspension containing epithelial and fibroblast cells as a
model for large cardiomyocytes (17 ± 4 µm diameters) and small non-myocytes (12
± 3 µm diameters), respectively, was run over an array. Large cells were purified
(>97%) and viable after only a single run through the device. However, high input
concentrations (1 x10⁶ cells mL-1) of cells caused clogging of the device.63
2.4 Separation based on secondary flow effects
The flow of a solution through appropriately designed channels can induce secon-
dary flow effects that significantly decrease the time required to fully mix two solu-
tions. So-called Dean flows can be generated in solutions flowing at higher flowrates
through curved channels64-67, and microstructured grooves on the bottom of the chan-
nel can generate helical flow along the length of the channel.68-70 Both effects were
first used for mixing fluids, but have now also been used for particle separation. The
reader is referred to Table 3 for an overview of the different particle types, both in-
organic and biological, separated using secondary flow effects.
Separating Biological Particles in Flowing Microsystems
45
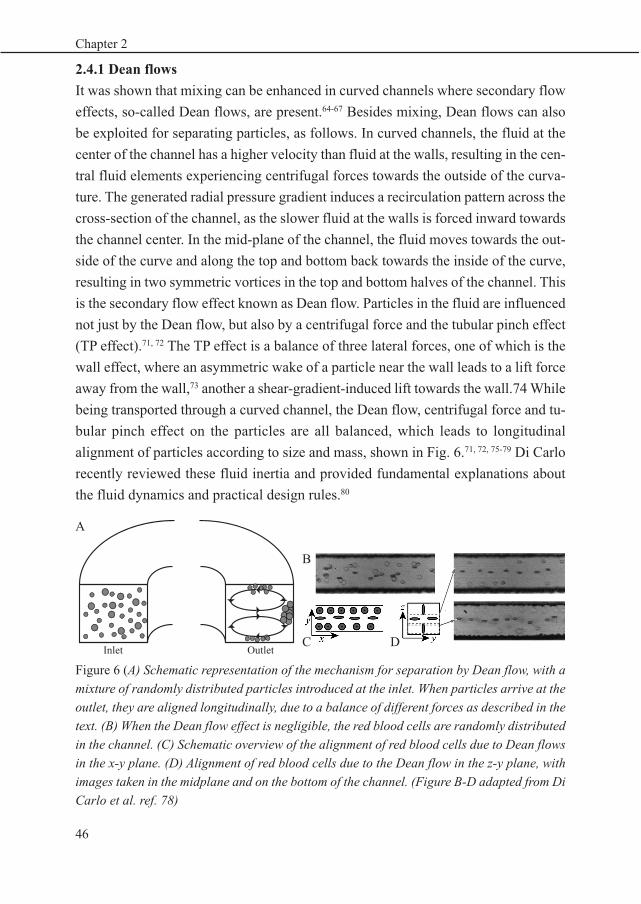
2.4.1 Dean flows
It was shown that mixing can be enhanced in curved channels where secondary flow
effects, so-called Dean flows, are present.64-67 Besides mixing, Dean flows can also
be exploited for separating particles, as follows. In curved channels, the fluid at the
center of the channel has a higher velocity than fluid at the walls, resulting in the cen-
tral fluid elements experiencing centrifugal forces towards the outside of the curva-
ture. The generated radial pressure gradient induces a recirculation pattern across the
cross-section of the channel, as the slower fluid at the walls is forced inward towards
the channel center. In the mid-plane of the channel, the fluid moves towards the out-
side of the curve and along the top and bottom back towards the inside of the curve,
resulting in two symmetric vortices in the top and bottom halves of the channel. This
is the secondary flow effect known as Dean flow. Particles in the fluid are influenced
not just by the Dean flow, but also by a centrifugal force and the tubular pinch effect
(TP effect).71, 72 The TP effect is a balance of three lateral forces, one of which is the
wall effect, where an asymmetric wake of a particle near the wall leads to a lift force
away from the wall,73 another a shear-gradient-induced lift towards the wall.74 While
being transported through a curved channel, the Dean flow, centrifugal force and tu-
bular pinch effect on the particles are all balanced, which leads to longitudinal
alignment of particles according to size and mass, shown in Fig. 6.71, 72, 75-79 Di Carlo
recently reviewed these fluid inertia and provided fundamental explanations about
the fluid dynamics and practical design rules.80
Chapter 2
46
Figure 6 (A) Schematic representation of the mechanism for separation by Dean flow, with amixture of randomly distributed particles introduced at the inlet. When particles arrive at theoutlet, they are aligned longitudinally, due to a balance of different forces as described in thetext. (B) When the Dean flow effect is negligible, the red blood cells are randomly distributedin the channel. (C) Schematic overview of the alignment of red blood cells due to Dean flowsin the x-y plane. (D) Alignment of red blood cells due to the Dean flow in the z-y plane, withimages taken in the midplane and on the bottom of the channel. (Figure B-D adapted from DiCarlo et al. ref. 78)
Inlet Outlet
A
B
C D

Particle filtration and separation based on the Dean effect was demonstrated with 2-
to-20 µm diameter particles in curved,75 spiral,71, 72 arc76 and asymmetrical curved
channels.77, 78 The flow velocity and radius of the curve are important factors deter-
mining the particle cut-off size. As the Dean flow effect increases, particles will be
located more towards the inside of the curvature. Di Carlo et al. used this method to
align polystyrene beads, silicone oil droplets, trypsinized H1650 cells and red blood
cells.78 Furthermore, they were able to separate platelets from whole blood. It was
shown that the relative number of platelets was enriched by approximately a factor
of 100.77 Interestingly, the disc-shaped red blood cells aligned rotationally so that the
disk axis was directed to the nearest walls, as shown in Fig. 6B.78
Dean flows have been exploited for three-dimensional focusing of particles. In a cur-
ved channel, particles are vertically focused by the presence of the Dean vortices.
Three-dimensional focusing can be achieved by introducing two fluid streams via
side channels located after the curve to pinch and thereby horizontally focus the sam-
ple stream.81, 82 This was done with particles having sizes and densities comparable
to human CD4+ T-lymphocytes used for e.g. HIV-diagnosis. However, results with
the human cells had not yet been reported at the time of this review.
Dean vortices have been used to separate neuroblastoma and glioma cells with 80%
efficiency and relatively high viability (>90%).83 The throughput of 1 million
cells/min is comparable to conventional flow cytometry techniques and 100-fold hig-
her than in PFF.25
In a serpentine channel, the inside and outside of the curvature switches at each turn.
An analyte will thus be subjected to a back-and-forth transfer across the width of the
channel while moving downstream. The influence of the forces is larger on double-
stranded DNA (dsDNA) than on single-stranded DNA (ssDNA) and thus these DNA
strands will be separated perpendicular to the flow.67, 84, 85 Wu et al. designed a chan-
nel with three inlets meeting at a single junction, where a sample stream from the
central inlet is pinched in between an acting flow and a protecting sheath flow coming
from two side inlets and operated at high and low velocities, respectively.86 This re-
sulted in a curved flow trajectory of the centered sample stream at the junction, which
then entered a main channel and flowed away from the junction. The authors claimed
that at high flowrates Dean vortices are present and large particles get enough mo-
Separating Biological Particles in Flowing Microsystems
47

mentum to escape the flow trajectory in the main channel. Upon a rapid change of the
fluids’ and particles’ momentums, a mismatch would cause them to separate. This
method was used to separate E. coli bacteria from a sample containing blood cells and
resulted in a 300-fold enrichment of bacteria. The authors demonstrate a separation
which they claim is based on soft inertial force-induced migration. However, Di Carlo
is of the opinion that a kinetic separation mechanism is the most likely cause of the
observed separation, whereby hydrodynamically focusing cells/particles of different
sizes against a wall led to faster migration of larger particles away from the wall.80 In
fact, it is our impression as well that the separation mechanism in this example shows
similarities to the mechanism described for PFF where particles are pinched against
the wall with a carrier flow. The only difference here is that the particle-containing
flow is pinched in between two fluid flows in this case; however, particles are still for-
ced to sample different streamlines depending on their size.
2.4.2 Hydrophoretic separation
Choi & Park defined hydrophoresis as the movement of suspended particles under the
influence of a microstructure-induced pressure field.87 Their work is based on the se-
condary flow effect first introduced by Stroock et al. to enhance mixing in micro-
channels.68-70 Mixing is performed in a channel with slanted ridges, which generate a
transverse pressure gradient resulting in a helical recirculation in the direction of the
flow, as shown in Fig. 7A. Particles present in the flow will also be influenced, and
are transported towards the walls due to the direction of the secondary flow effect,
schematically shown in Fig. 7B-C. An alternating pattern of slanted ridges on the bot-
tom and top of the channel is used to focus particles on one side of the channel (Fig.
7B). In a region with only slanted ridges on the bottom, particles align along one side
of the channel, due to the rotation of the helical flow (Fig. 7C). After alignment, par-
ticles can then be separated according to their sizes relative to the gap between slan-
ted obstacles at the top or bottom of the channel. Large particles align at the center
of the z-axis and follow the flow going up and down over the obstacles. Small parti-
cles are exposed to lateral pressure gradients along the width of the channel and fol-
low an oscillating path through the channel, as shown in Fig. 7D. Importantly, the
gap height limits the particle sizes which can be separated.87-89
During the cell cycle, cells pass through different stages representing, for example,
cell growth (G), DNA synthesis and mitosis (M). Cell size is indicative of where in
Chapter 2
48

the cycle a cell finds itself, and can therefore be used to select cells in the same stage.
Hydrophoresis was used to sort human leukemic monocyte lymphoma cells from the
U937 cell-line based on size. Leukemic cells in the early G0/G1- and late G2/M-pha-
ses, with diameters between 11 and 22 µm, were sorted in a channel with a 22-µm-
gap-height. Results showed that synchronization of early- and late-stage cells could
be performed. This method could be an advantageous approach for tumor cell detec-
tion and interaction studies with drugs.90
As in the work of Stroock,68, 69 a herringbone ridge structure in a microchannel was
used to generate a pressure gradient from the sides of the channel towards the center,
Separating Biological Particles in Flowing Microsystems
49
Figure 7 (A) Induction of a secondary helical flow pattern in a microchannel with an arrayof slanted ridges. (Figure adapted from Stroock et al. ref. 69) (B)-(D) Overview of the sepa-ration principle of hydrophoresis. Diagrams of channel cross-sections at different locationsdescribe the motions of large and small particles leading to their separation. Dark grey areasare obstacles (ridges) on the floor of the channel, light grey areas are obstacles (ridges) onthe ceiling of the channel. (B) Particles are aligned to one side of the channel by the lateralforces of the flow. (C) Particles are focused by the clockwise helical flow. (D) Large particlesremain focused in the area where no lateral pressure gradients are present. Small particles areexposed to lateral pressure gradients and are therefore transported in an oscillating patternas they follow the focusing and deviating flow. (Figure adapted from Choi et al. ref. 87).
Upwardflow
Diviationflow
Downwardflow
Focusingflow
Slanted obstacles
B C D
A

resulting in double helical flows in which hydrophoresis could be performed. When
using the herringbone structure, particles are focused in the center of the channel by
the helical flow and simultaneously centered on the z-axis by the obstacles. This ef-
fect was demonstrated with Jurkat cells.91 To study the behaviour of biconcave dis-
coid particles, samples containing red blood cells were introduced to a channel
containing a herringbone ridge array. Decreasing the height of the herringbone struc-
ture from 15.4 to 7.4 µm resulted in an increase in the number of red blood cells pre-
sent in the center of channel from ~57% to ~72% of the total cells present in the
channel.89 Focusing particles into parallel lines using parallel double helical flows
was accomplished by placing multiple herringbone arrays side by side in a channel.92
Particles which were were randomly distributed across the channel were rapidly fo-
cused into multiple lines in the direction of the flow. Since particles focus at the apex
of the herringbone structures, herringbone ridge arrays positioned laterally with res-
pect to one another in the direction of flow could be used to guide particles across the
channel in a controlled fashion.92
Hydrophoresis was also used in two examples in combination with other mechanisms
to perform separation. In the first example, λ-phage and micrococcus DNA were se-
parated in a device with a gap height of 1.2 µm.93 This gap height is between the 0.86-
and 1.45-µm radii of gyration of λ-phage and micrococcus DNA, respectively. Ho-
wever, DNA molecules need to be considered as spherical particles which can change
their conformation to form long strands. The small λ-phage could freely pass the gaps
and follow hydrophoretic alignment along one side of the channel. Large micrococ-
cus DNA first moved to the other side of channel along the slanted obstacle, before
changing conformation and passing the obstacles. To pass the obstacle, then, the DNA
has to change conformation, which costs energy. It was assumed that the obstacles
work as an energy barrier which can be exploited to separate DNA molecules, as the
conformational change of large DNA molecules costs more energy than that of small
DNA molecules.93 This is reminiscent of the entropic separation of DNA performed
by Han and Craighead in a microtrapping array.94
The second example used hydrophoresis to isolate and enrich white blood cells from
rat blood. Blood cells were focused on one one side of a channel with slanted obsta-
cles whose height was equal to half the channel height. These obstacles were located
on the top and bottom of the channel. The gap height (13 µm) in this region of the
Chapter 2
50

Separating Biological Particles in Flowing Microsystems
51
Part
icle
type
Fl
ow e
ffec
t Pa
rtic
le si
ze
Com
men
ts
Con
tinuo
us/
batc
h R
efer
ence
(s)
• Po
lym
er m
icro
sphe
res
Dea
n flo
w
• 1
- 20
μm
Test
ed w
ith d
iffer
ent g
eom
etrie
s C
ontin
uous
73
-79,
81,
86
• Po
lym
er m
icro
sphe
re
Hyd
roph
oret
ic se
para
tion
• 0.
5 –
20
μm
C
ontin
uous
87
-90,
92,
93
Bio
logi
cal p
artic
les
•
Neu
robl
asto
ma
cells
•
Glio
ma
cells
D
ean
flow
•
15 ±
5 μ
m d
iam
eter
•
8 ±
3 μm
Se
para
tion
Con
tinuo
us
83
• Si
ngle
stra
nded
DN
A
• D
oubl
e st
rand
ed D
NA
D
ean
flow
•
20 m
er
U
neve
n di
strib
uted
C
ontin
uous
84
, 85
• H
uman
leuk
emic
mon
ocyt
e ly
mph
oma
cell
line
(U93
7)
Hyd
roph
ores
is
• 11
– 2
2 μm
Ea
rly a
nd la
te p
hase
cel
l sep
arat
ion
Con
tinuo
us
90
• Ju
rkat
cel
ls
Hyd
roph
ores
is
• 11
.0 ±
1.4
μm
Fo
cusi
ng o
f cel
ls
Con
tinuo
us
91
• 48
.5 k
bp λ
-pha
ge D
NA
•
115
kbp
mic
roco
ccus
DN
A
Hyd
roph
ores
is a
nd
entro
pic
trapp
ing
• 0.
86 μ
m ra
dius
•
1.43
μm
radi
us
Sepa
ratio
n C
ontin
uous
93
Tab
le 3
.O
verv
iew
of
(bio
logi
cal)
par
ticl
es s
epar
ated
in
devi
ces
whe
re s
econ
dary
flo
w e
ffec
ts a
re p
rese
nt

channel was larger than the size of red and white blood cells. The placement of the
obstacles resulted in anisotropic fluidic resistance that generated lateral pressure gra-
dients to induce the helical flow recirculation for focusing the cells. Actual separation
was performed using a filtration principle similar to that described above, using slan-
ted obstacles on top and bottom of the channel which partially cover the width of the
channel. The resulting gap on one side of the channel could serve as filtration pore.
The 4-µm-high gap in this region had a dimension that fell between the sizes of red
and white blood cells, as red blood cells have diameters of 6-8-µm, a thickness of 2
µm, and are deformable. Therefore, small red blood cells passed through the gap and
remained focused, whereas large white blood cells were blocked by the obstacles and
passed through the filtration pore (20-µm wide and 7.8-µm high) on the other side of
the channel. A 210-fold enrichment of white blood cells was achieved with a proces-
sing rate of 4000 cells/s.88
2.5 Separation based on external forces influencing particles
Previously discussed separation mechanisms were based on solution flows in micro-
channels; however, there are several types of external forces that can be applied across
a microfluidic channel to influence and control particles susceptible to them. These
forces can be used to transfer particles from their original streamline into other stre-
amlines. If particles exhibit differences in susceptibility, external forces can often be
used to separate them. This section discusses separation of particles in laminar flows
by external forces and covers free-flow electrophoresis, acoustophoresis and magne-
tophoresis. Table 4 reviews the different inorganic and biological particles separated
using the approaches discussed in this section.
2.5.1 Free-flow Electrophoresis
The technique of free-flow electrophoresis (FFE) predates the introduction of Lab-on-
a-chip technology.95 However, FFE was one of the first techniques performed in a
microfluidic channel, exploiting the fact that well-defined flows of fluids can be ge-
nerated side by side without mixing. The first examples of FFE on a chip described
the analysis of labelled amino acids and proteins.96, 97 Recent papers by Kohlheyer etal.98 and Turgeon & Bowser99 thoroughly review the theory and applications of FFE,
and are referred to for more detailed information. Briefly, in FFE the continuously in-
troduced sample flow runs down a shallow, ribbon-like channel in between carrier
Chapter 2
52

buffer solution. An electric field is applied perpendicular to the flow to induce elec-
trophoretic movement of the analytes. The result is deflection of charged species from
the direction of flow, with the angle of deflection increasing as the electrophoretic mo-
bility and/or electric field strength increases. The original sample stream is effectively
split into several streams, each containing analyte having a different electrophoretic
mobility.
Three different operation modes of FFE have been reported on chip. The use of car-
rier buffers with a constant composition with respect to pH and electrical conducti-
vity results in separation of the sample analytes according to their mobility. This mode
is called free-flow zone electrophoresis (FFZE)100, and several examples exist on
chip.96, 97, 101, 102 Isoelectric focusing (IEF) was achieved in a microchannel with FFE
by using carrier electrolyte solutions with ampholytes, which led to a pH gradient
when an electric field was applied across the channel. The analyte migrated through
the pH gradient until reaching the pH at which it had no net charge, at which point it
stopped migrating. This mode is called free-flow isoelectric focussing (FFIEF).102, 103
The presence of membrane proteins gives rise to cell organelles with different iso-
electric points. Mitochondria from lysed HT-29 cells were focused at a pI between 4
and 5, while intact cells were attracted to the anode due to their negative surface char-
ges. Fluorescently tagged cell organelles, peroxisomes and mitochondria from HeLa
cell lysate were focused at pI values between 4 and 5 but were not separated, indica-
ting that they may have the same pI’s.104
In free-flow isotachophoresis (FFITP)105, 106 the sample flows in between a leading and
terminating carrier buffer containing ions with a higher and lower mobility than the
analyte, respectively. Rearrangement of samples containing several analytes into se-
parate bands in microfluidic devices was demonstrated using a mixture of fluorescein,
Eosin G and acetylsalicylic acid; the separation took less than 1 minute. The separa-
tion of a reaction mixture of myoglobin and fluoresceinisothiocyanate was also re-
ported, demonstrating the technique’s potential for sample preconcentration.105
2.5.2 Acoustic particle manipulation
Lining up particles and transferring them into other streamlines can also be done with
acoustic forces.107 Particles suspended in a fluid are influenced by acoustic waves di-
rected perpendicular to the flow direction. Acoustic or ultrasonic waves cause axial
Separating Biological Particles in Flowing Microsystems
53

acoustic radiation forces, Fr, influencing the particles and is given in Equation (2).
Where p0 is the acoustic pressure amplitude, Vc is the volume of the particle, λ is the
wavelength and k defined by 2π/λ and x is the distance from a pressure node. The
acoustic contrast factor, Equation 3, represented by ɸ depends on both the compres-
sibility of the particle (βc) and medium (βw) and the density of the particle (ρc) and
medium (ρw).
Particles in continuous flows influenced by acoustic forces move to the standing wave
pressure node or anti-node, which most notably depends on the contrast factor, i.e.
density and compressibility of the particle. If a particle has a higher density and/or is
less compressible compared to the medium it is suspended in, it will move towards
the nearest pressure node. If the medium has a higher density and/or is less com-
pressible than the particle, the particle moves towards the antinode, shown schema-
tically in Fig. 8A.108-110 Aligning particles on the nodes and antinodes was used to
translate particles from one solution into another while the two flows run side by side
Chapter 2
54
Figure 8 (A) Schematic representation of particles with different contrast factors aligned alongthe walls and in the center of the channel, respectively. (B) Cross-section of channel witherythrocytes and lipid particles collected on the pressure node (center) and antinodes (sides)of the acoustic wave standing in the channel, respectively. (Figures adapted from Laurell etal., ref. 107)
Flow
B
A
�� = − ( �02��
2� ) �(�, �) sin(2� � ) (2)
�(�, �) =5�� − 2�
2�� + � −��
� (3)

through the channel.111 Particles with the same acoustic contrast factors can be sepa-
rated based on sizes as the particle volume influences the acoustic forces, as shown
in Equation (2). Larger particles obtain a larger acoustic force and will thus move
faster in a field of standing waves.112, 113 The amount of wavelengths generated in the
channel determines the number of lines with focused (biological) particles, as parti-
cles are focused on nodes and anti-nodes of the waves. This obviously depends on the
wavelength of the acoustics but also on the width of the channel.108, 114 Employing
the amount of lines was exploited for raw milk lipid enrichment and depletion in a
channel splitting in three outlets. In 750-µm-wide and 1125-µm-wide channels two
and three half-wavelengths were generated applying the same excitation frequency
and input power. In the narrow-channel case lipids were focused on the anti-node and
lipid enriched milk was collected via the central outlet. In the wider-channel case the
central flow was depleted of lipids, however, small proteins, lactose and casein par-
ticles were still present. A beneficial effect from the lipids being transported on the
antinodes is that they don’t reach the walls and start clogging of the channel via ads-
option to the walls.115
One of the first publications of the Laurell group directly showed that this approach
was applicable to biological particles as erythrocytes and lipid vesicles suspended in
blood plasma were separated from each other, shown in Fig. 8B.116, 117 This method
was successfully used during open-heart surgery to separate lipid micro-emboli from
blood. The process was continuously performed with flowrates up to 0.5 mL min-1
whereas in conventional methods 400-500 mL needs to be collected to process in a
batch.117-119 Three streams of particles were generated using acoustic forces as erythro-
cytes were located on the pressure node in the center of the channel and lipid vesi-
cles were located on the anti-node near the walls. In a channel ending in three outlets
70% of the erythrocytes was collected in 1/3 of the original fluid while 80% of the
lipid vesicles were removed. Erythrocytes focussed in the center of the channel by
acoustic forces could also be washed.110 On one side of the channel washing buffer
was introduced via a side channel and via the opposing side channel buffer extracted.
The erythrocytes were shifted towards the side where fluid was extracted. However,
acoustic focussing was used to realign the cells in the center. Repeating this opera-
tion resulted in 58% recovery of the cells and removing 98.3% of the Evans Blue
present prior to washing. Recent work showed that the developed acoustic technique
can be used to process plasma fraction out of whole blood.120 The blood focussed in
Separating Biological Particles in Flowing Microsystems
55

the middle of the channel could be redrawn from the channel via outlets in the co-
verplate along the length of the channel. Different concentrations of blood are col-
lected via these outlets and plasma was collected at the end of the channel. The plasma
was of high enough quality for plasma transfusion and screened for prostate specific
antigen by coupling to an antibody microarray. Integration of the microarray on-chip
would generate a tool for clinical diagnostics.121, 122
Red blood cells and E. coli could be aligned and patterned by placing two transdu-
cers parallel or orthogonal to the channel, respectively. Interference of the two gene-
rated acoustic waves of orthogonal placed transducers resulted in nodes and antinodes
in a two dimensional pattern. In other words the acoustic waves act as tweezers to hold
cells on one position.123
Washing with acoustics can also be performed when introducing clean medium via
the central inlet of three inlets. The contaminated medium, introduced via the two
side inlets, remains at both sides due to the well-defined laminar flows. Antibody-
based affinity beads can be extracted from the contaminate medium employing the
acoustic focussing of the beads in the center of the channel. When placing more chips
in series beads can be extracted and washed when the bead suspension is guided to-
wards the outside inlets of the channel. This technique was used to extract viral pha-
ges bound to beads.124, 125
Acoustic forces have proven not only to be able to align particles but are also capa-
ble of trapping cells and avoid them to contact the walls.126 This was done with in a
channel with the height of half a wavelength and a reflector on top. Miniaturized
transducers were placed on the cross-section of the main channel, introducing the hy-
drodynamically focussed sample and side channels for perfusion of the trapped cells
with analyte for assays. First experiments demonstrated that rat spleen cells could be
trapped and hold on with acoustic trapping. Cell culturing experiments were perfor-
med with yeast strains, Saccharomyces cerevisiae, capable of producing yellow fluo-
rescent protein under influence of the LEU2 gene. Trapped cells were perfused with
cell medium and successfully cultured for 6 hours. A genetically modified neural stem
cell line from embryonic rat hippocampus, HiB5-GFP, was used for a viability assay.
Trapped cells were perfused with phosphate-buffered saline solution for 15 minutes
prior to viability test based on the acridine orange marker. The increased fluorescence
Chapter 2
56

signal revealed that cells were still viable, indicating that the acoustic technique is ap-
plicable to samples containing living cell and not harmful to them.126
Extracting particles with acoustic trapping was recently performed for forensic ana-
lysis of sexual assault evidence. Sperm cells were separated from fluid containing
female epithelial cell lysate, as acoustic forces are strong enough to retain sperm cells
while the lysate is unretained. The use of acoustic trapping was beneficial for further
DNA analysis (extraction, quantization, amplification and separation) as an enriched
sperm cell sample was obtained.127
Jung et al. demonstrated that eukaryotic yeast cells could be separated from viruses,
MS2 bacteriophage, as the yeast cells were focused by the acoustic forces and bac-
teriophage remained unaffected under the applied conditions. Yeast cells, 4-6 µm,
showed similar focusing conditions as 2-3 µm polystyrene particles, with the same
density, however, yeast obtains a lower compressibility.128
2.5.3 Magnetic particle manipulation
Besides acoustic and electrokinetic forces, particles can also be susceptible to hand-
ling with magnetic fields. Magnetic susceptible materials can be manipulated with
magnetic forces, this can be used for pumps, valves, mixing and manipulating parti-
cles as reviewed by Gijs129 and Pamme.130 Like other particles the surface of magne-
tic particles can be functionalized to perform for example dynamic DNA
hybridization131 or immunoassays.132, 133 Magnetic forces are in these examples used
to retain particles on a specific location in the channel. The analyte could interact
with the surface while the particles were retained by a magnet placed under the chip.
The first examples of separating magnetic particles involved simply separating par-
ticles from solution. This was done by retaining the particles on an electromagnet
and releasing the current when fresh buffer close to the particles.134 Another method
used an H-channel design where particles were introduced via one of the parallel
channels and focused on the wall with a magnet in the same plane as the channel.
Via the horizontal-connection channel a sample as large as the volume of the chan-
nel junction is transported towards the other parallel channel by placing the magnet
on the other side of the channel. The horizontal channel can be filled with reagents
to interact with the surface of the particles.135 With this method the particles are se-
parated from the original solution they were suspended in.
Separating Biological Particles in Flowing Microsystems
57

The differences in magnetic forces, Fmag, experienced by the particles can be used
to separate them. The Fmag depends on the externally applied flux density (B) and
its gradient in the field (∇.Β) induced by the magnet, the difference in magnetic sus-
ceptibility between the particle and the fluid (Δχ), the particle volume (V) and the
permeability of a vacuum (μ0) and can be written as Equation (4).
Magnetic particles can thus be separated on either size or magnetic susceptibility dif-
ferences.136-138 This was performed in continuous flow with a magnetic field in so cal-
led free-flow magnetophoresis. In a microchannel the clean buffer solution flows
parallel with the sample solution containing 2.0-µm- and 4.5-µm-diameter magnetic
particles, with susceptibilities of 1.12x10⁻⁴ and 1.6x10⁻⁴ m3 kg-1, respectively. A mag-
netic field perpendicular to the direction of flow was used to separate particles from
each other and from the sample solution also containing the non-magnetic particles,
shown in Fig. 9. The particles with the largest susceptibility were deflected over the
largest distance. It was observed that large agglomerates of magnetic particles were
deflected in a larger extent than separate particles, due to the larger size of the ag-
glomerate.136 Not only particles but also superparamagnetic droplets could be mani-
Chapter 2
58
Magnetic field
Buffer/reagents
Samplemixture
non-M, M(a), M(b)
M(b)
M(a)
non-M
Figure 9. Schematic representation of the separation of magnetic particles by free-flow mag-netophoresis. At the bottom right, the mixture of (non-) magnetic particles enters the channel,with the magnetic susceptibility of particles increasing in the order non-M<M(a)<M(b). Buf-fer solution is also introduced from the right. Separated particles leave the channel on the leftwith particles with the largest susceptibility deflected over the largest distance into the y-di-rection. The buffer was in more advance research replaced for different reagents to performbioanalytical procedures. (Figure adapted from Pamme et al., ref. 136)
���� =∆�(∇ ∙ �)�
�0 (4)

pulated with magnetic forces. It was shown that these magnetic droplets, which can
be used to carry biological materials, were deflected perpendicular to the flow and di-
rected in to specific outlet channels.139
In two parallel channels connected by a diagonal junction channel instead of a hori-
zontal channel in the H-shaped channel size separation of magnetic particles was per-
formed together with separation from the medium.138 In contrast to the H-shaped
channel135 the magnetic field is induced in the plane of the channel but with ring sha-
ped wires placed on top and under the channel. The generated force in the direction
of the junction channel separated magnetic particles on their sizes, with the largest
particles obtaining the largest deflection as expected from Equation 4.138
Improving the reproducibility of the separation was done by changing geometry of the
outlet into a tapered structure and increasing the flowrate.137 This movement of mag-
netic particles perpendicular to the direction of flow was exploited to perform bio-
analytical procedures on the particle surface. Magnetic particles cross different
reagents streams running side by side introduced through different inlets. This was
performed with a similar setup to the one shown in Fig. 9, however the buffer was re-
placed with the different reagents. A model binding assay was performed with strep-
tavidin-coated particles running sequentially through buffer, fluorescently-labelled
biotin solution and buffer.140 A mouse IgG-sandwich immunoassay could be perfor-
med when particles crossed two fluid steams for binding and were washed with buf-
fer after each binding step.141
The surface of magnetic-susceptible particles can be coated with antibodies which
bind to specific receptors of cells. After binding, the cells became magnetically sus-
ceptible and can be separated, this process is called immunomagnetic cell separation
and was used to separate leukocytes from whole blood.142 Integration of micropatterns
from magnetic material under a slight angle with the direction of the flow in a mi-
crofluidic channel was used to generate magnetic field gradients. The coated leuko-
cytes were deflected from their streamline by the magnetic field while other blood
components were transported in the direction of the flow.142 Xia et al. separated E.Coli bound to magnetic nanoparticles from red blood cells processing 10.000 cells s-
1 and was able to obtain separation efficiencies up to 80%. They used two inlets to in-
troduce the sample and clean running buffer, while placing the magnet in plane with
Separating Biological Particles in Flowing Microsystems
59

the channel.143
The native magnetic properties of blood components can be used to separate different
type of blood cells from whole blood.144 Separation of red and white blood cells was
performed in a channel where after the inlet a ferromagnetic wire is placed along the
length, dividing a part of the channel into two parallel channels as a wall. A uniform
magnetic field perpendicular to flow direction near the wire generates a high magnetic
field gradient. When the magnetic susceptibility of a particle is larger than the buf-
fer, the particle is attracted towards the wire and called a paramagnetic particle. If a
particle bears a smaller susceptibility than the buffer, the particle is repelled from the
wire and named diamagnetic particle. In the case of red and white blood cells, red
blood cells are attracted towards the wire and white blood cells repelled. At the end
of the channel three outlets were located to collect the separated red blood cells and
the depleted whole blood. This method used only “stage 1” and the outlet geometry
shown in Fig. 10A. Via the middle outlet 91.1% of the red blood cells collected after
being separated from diluted whole blood, shown in Fig. 10B.
It was shown that separation could be improved in a chip containing three areas (se-
paration stages) containing wires. The first area is an exact copy from the above sys-
tem. After this first separation stage the attracted cells are guided towards the center
o f
Chapter 2
60
Inlet
Outlets 1
2
3
Stage 1 Stage 2 Stage 3
A
Figure 10 (A) Schematic representation of a three-stage magnetic blood separator using em-bedded ferromagnetic wires. (B) Stream of red blood cells (RBC) leaving via outlet 2 usingonly stage 1. (C) Improved separation of red blood cells from whole blood using three-stageseparation. Red blood cells leaving via outlet 2 and white blood cells (WBC) entering outlets1 and 3. (Figures adapted from Han et al., ref. 143)
CB

Separating Biological Particles in Flowing Microsystems
61
Mic
ro p
artic
les
Sepa
ratio
n m
echa
nism
Pa
rtic
le si
ze
Com
men
ts
Con
tinuo
us/
batc
h R
efer
ence
(s)
• O
rgas
ol/p
olya
mid
e sp
here
s A
cous
toph
ores
is
• 5
μm d
iam
eter
•
Sepa
ratio
n fr
om m
ediu
m
Con
tinuo
us
108,
110
, 111
, 11
4 •
poly
amid
e sp
here
s
• 1.
9 μm
dia
met
er
• Fo
cusi
ng
Con
tinuo
us
109
• Su
perp
aram
agne
tic p
artic
les
Mag
neto
phor
esis
•
0.8
- 4.5
μm
di
amet
er
• Se
para
tion
from
med
ium
and
no
n-su
scep
tible
par
ticle
s C
ontin
uous
13
2, 1
34-1
38
Bio
logi
cal p
artic
les
•
HT-
29 c
ells
(Hum
an c
olon
ca
rcin
oma)
Fr
ee-f
low
isoe
lect
ric
focu
sing
•
N.A
. Fo
cusi
ng o
f cel
ls o
n IP
C
ontin
uous
10
4
• H
eLa
cells
Fr
ee-f
low
isoe
lect
ric
focu
sing
•
N.A
. Fo
cusi
ng o
f cel
ls o
n IP
C
ontin
uous
10
4
• R
aw m
ilk li
pids
A
cous
toph
ores
is
• N
.A.
Lipi
d en
richm
ent o
r dep
letio
n C
ontin
uous
11
5 •
Stre
ptav
idin
-coa
ted
bead
s A
cous
toph
ores
is
• 2.
8 μm
dia
met
er
Sepa
ratio
n un
boun
d m
ater
ial
Con
tinuo
us
124
• Su
perp
aram
agne
tic M
OA
C b
eads
A
cous
toph
ores
is
•
Sepa
ratio
n fr
om u
nbou
nd p
eptid
es
Bat
ch
125
• Sp
leen
cel
ls fr
om ra
ts
Aco
usto
phor
esis
•
N.A
. Tr
appi
ng
Bat
ch
126
• Y
east
(Sac
caro
myc
es c
erev
isia
e)
Aco
usto
phor
esis
•
N.A
. Tr
appi
ng fo
r cul
turin
g te
sts
Bat
ch
126
• R
at e
mbr
yoni
c hi
ppoc
ampu
s neu
ral
stem
cel
l lin
e H
iB5-
GFP
A
cous
toph
ores
is
• N
.A.
Trap
ping
for v
iabi
lity
test
s B
atch
12
6
• Sp
erm
cel
ls
• Fe
mal
e ep
ithel
ial c
ell l
ysat
e A
cous
toph
ores
is
• N
.A.
Trap
ping
, was
hing
and
sepa
ratio
n C
ontin
uous
12
7
• Y
east
(Sac
caro
myc
es c
erev
isia
e)
• M
S2 b
acte
rioph
age
Aco
usto
phor
esis
•
4-6
μm
• 30
nm
dia
met
er
Sepa
ratio
n C
ontin
uous
12
8
• E.
Col
i M
agne
toph
ores
is
•
Sepa
ratio
n fr
om re
d bl
ood
cells
C
ontin
uous
14
3
Tab
le 4
.O
verv
iew
of
(bio
logi
cal)
par
ticl
es s
epar
ated
usi
ng e
xter
nal
forc
es

the channel to flow in between two wires. The remaining fluid will flow around these
two wires for a second extraction step using the same principle, “stage 2” shown in
Fig. 10A. Before repeating this operation one more time the attracted cells in the
outer channels are guided towards the center stream of cells. The complete setup is
shown in Fig. 10A. The separation of red blood cells increased to 93.5% and cells
were collected in the center outlet, whereas 97.4% of the white blood cells were col-
lected in the outermost outlets, shown in Fig. 10B and C.144
The density of red and white blood cells is larger than the density of the medium they
are suspended in. Therefore, cells sediment in time, which becomes a problem when
running assays for longer period of time. This effect could be reduced by adding bo-
vine serum albumin to the medium.145
When ferromagnetic wires are embedded in the bottom of the channel the magnetic
susceptible (biological-) particle solution flows over the wires. However, the high
magnetic field gradients are still present and will thus affect the particles. With the
wire placed under an angle with the direction of flow white blood cells were separa-
ted from whole blood. White blood cells were deflected in the direction of the angle
of the wires when crossing the wires and are thus separated by lateral-driven mag-
netophoresis.146 Deposition of ferromagnetic dots on the bottom of a channel can be
used to extract red blood cells from blood running over the dots. With an external
applied magnetic field perpendicular to the flow a magnetic field gradient is induced
and red blood cells were trapped on the dots while other components continued with
the flow.147
2.6 Conclusion
As this review reveals, microfluidics now offers a wide variety of particle separation
techniques for situations where particles are the analyte of interest or interact with the
analyte. Separation can in both cases be performed to separate particles from other
particles and/or from media. The well-defined laminar flow patterns in specially de-
signed microfluidic devices can be exploited to guide different particles into different
streamlines. Furthermore, external forces can be used to influence particles to actively
switch streamlines. To study the separation mechanism involved, proof-of-principal
studies are generally first performed with well-defined nano- or microspheres. More
Chapter 2
62

advanced research will then focus on the application of a separation technique for
more biologically relevant particles, such as blood cells, bacteria and DNA. Pamme
also noted in her 2007 review that applications involving biological particles were be-
coming increasingly important for continuous flow separation approaches.10
Biological particles like (blood) cells and DNA are non-spherical and/or deformable.
In several studies, it has been observed – not surprisingly - that these types of parti-
cles do not behave like solid nano- or microspheres. In PFF25 and HDF,45 biconcave
discoid-shaped red blood cells aligned in the flow according to their shortest axis,
thickness. Red blood cells can pass through small gaps due to their thickness and de-
formability,88 and DNA strands can change conformation from coiled- to stretched-
form to pass through nanogaps.93 Table 5 gives an overview of the separation
mechanisms which were used to separated the different types of blood cells from
each other or from the plasma to obtain e.g. depleted or enriched samples. One con-
Separating Biological Particles in Flowing Microsystems
63
Cell type / size Separation technique Process* Reference Erythrocytes Pinched flow fractionation Blood constituents 25 2 x 6 – 8 μm Filtration Sample fluid 4 (biconcave discoids) Filtration Leukocytes 35
Hydrodynamic filtration Depletion for leukocyte enrichment 45 Hydrophoretic separation Depletion for leukocyte enrichment 88 Hydrophoresis Focussing 89 Acoustophoresis Washing/extracting from medium 110, 111, 114 Acoustophoresis Separation from phospholipids and enrichment 116, 117 Magnetophoresis Separation of 1.6 μm beads from sample 143 Magnetophoresis E. Coli 143 Magnetophoresis Whole blood 144 Magnetophoresis Trapping on ferromagnetic dots 147
Leukocytes Filtration Erythrocytes 35 7 – 15 μm diameter (Cross-flow) filtration Blood constituents 36, 37, 41, 43
Cross-flow filtration Exchange of medium 40 Hydrodynamic filtration Enrichment 45 Deterministic lateral displacement Blood 60, 61 Deterministic lateral displacement Healthy from malignant 60 Hydrophoretic separation Enrichment 88 Magnetophoresis Immunomagnetic separation from whole blood 142 Magnetophoresis Whole blood 146
Lymphocytes Deterministic lateral displacement Red blood cells and platelets 62 Monocytes Deterministic lateral displacement Red blood cells and platelets 62 Plasma Cross-flow filtration Whole blood 39
Deterministic lateral displacement Whole blood 62 Acoustophoresis Whole blood 120
Platelets Deterministic lateral displacement Leukocytes 58 2-4 μm diameter Deterministic lateral displacement Immunofluorescent labelling 59
Deterministic lateral displacement Study effect of heat & thrombin 61 Dean flows Depletion and enrichment 77
Whole blood Dean flows E. Coli 86
Table 5 Overview of the different separation mechanisms used to process blood. * Cell typeswere separated from the blood components given except when mentioned otherwise.

sideration is the reduction of cluster formation, as these tend to cause channel clog-
ging and do not behave like individual particles. This was observed, for instance,
with large agglomerates of magnetic particles, which were deflected to a larger ex-
tent than individual magnetic particles.136
The different separation mechanisms inspired by laminar flows can be used as tools
for research in a wide range of applications. For example, acoustic forces have pro-
ven themselves useful for clinical applications like intra- and postoperative blood
washing111 and the separation of sperm cells from sexual assault evidence during fo-
rensic analysis.127 Deterministic lateral displacement will likely find application in
the near future for the selection of specific cells for tissue engineering.63 These de-
velopments are excellent examples of the potential of microfluidic particle separation
techniques and their incorporation into multifunctional micro total analysis systems.148
2.7 References
A. Manz, D. J. Harrison, E. M. J. Verpoorte, J. C. Fettinger, A. Paulus, H. Ludi
and H. M. Widmer, J Chrom, 1992, 253-258.
D. J. Harrison, A. Manz, Z. N. Fan, H. Ludi and H. M. Widmers, Anal. Chem.,
1992, 64, 1926-1932.
L. J. Kricka, O. Nozaki, S. Heyner, W. T. Garside and P. Wilding, Clin. Chem.,
1993, 39, 1944-1947.
P. Wilding, J. Pfahler, H. H. Bau, J. N. Zemel and L. J. Kricka, Clin. Chem.,
1994, 40, 43-47.
O. Reynolds, Phil. Trans. R. Soc. Lond., 1883, 174, 935-982.
D. Janasek, J. Franzke and A. Manz, Nature, 2006, 442, 374-380.
A. Fick, Philosophical magazine and journal of science, 1855, 10, 30-35.
A. Einstein, Ann. d. Phys., 1905, 17, 549-560.
P. Tabeling, Introduction to microfluidics, Oxford University Press, Oxford,
2005.
N. Pamme, Lab Chip, 2007, 7, 1644-1659.
E. A. Dimarzio and C. M. Guttman, Macromol., 1970, 3, 131-146.
E. A. Dimarzio and C. M. Guttman, J Chrom, 1971, 55, 83-97.
C. M. Guttman and E. A. Dimarzio, Macromol., 1970, 3, 681-691.
H. Small, J. Col. Int. Sci., 1974, 48, 147-161.
G. Taylor, Proc. Roy. Soc., 1953, 219, 186-203.
Chapter 2
64
1.
2.
3.
4.
5.
6.
7.
8.
9.
10.
11.
12.
13.
14.
15.

R. Aris, Proc. Roy. Soc., 1956, 235, 67-77.
D. A. Beard, J Appl Phys, 2001, 89, 4667-4669.
E. Chmela, R. Tijssen, M. Blom, J. G. E. Gardeniers and A. van den Berg, Anal.
Chem., 2002, 74, 3470-3475.
Y. C. Lin and C. P. Jen, Lab Chip, 2002, 2, 164-169.
M. T. Blom, E. Chmela, R. E. Oosterbroek, R. Tijssen and A. van den Berg,
Anal. Chem., 2003, 75, 6761-6768.
J. C. Kraak, R. Oostervink, H. Poppe, U. Esser and K. K. Unger, Chromatogra-
phia, 1989, 27, 585-590.
D. Stein, F. H. J. van der Heyden, W. J. A. Koopmans and C. Dekker, PNAS,
2006, 103, 15853-15858.
M. Yamada, M. Nakashima and M. Seki, Anal. Chem., 2004, 76, 5465-5471.
Z. G. Wu, A. Q. Liu and K. Hjort, J. Micromech. Microeng., 2007, 17, 1992-
1999.
J. Takagi, M. Yamada, M. Yasuda and M. Seki, Lab Chip, 2005, 5, 778-784.
Y. Sai, M. Yamada, M. Yasuda and M. Seki, J Chrom A, 2006, 1127, 214-220.
T. Kawamata, M. Yamada, M. Yasuda and M. Seki, Electrophoresis, 2008, 29,
1423-1430.
M. A. Unger, H. P. Chou, T. Thorsen, A. Scherer and S. R. Quake, Science, 2000,
288, 113-116.
A. L. Vig and A. Kristensen, App. Phys. Lett., 2008, 93, 203507.
A. Jain and J. D. Posner, Anal. Chem., 2008, 80, 1641-1648.
Z. G. Wu, K. Hjort, G. Wicher and A. F. Svenningsen, Biomed. Microdev., 2008,
10, 631-638.
A. V. Larsen, L. Poulsen, H. Birgens, M. Dufva and A. Kristensen, Lab Chip,
2008, 8, 818-821.
H. Maenaka, M. Yamada, M. Yasuda and M. Seki, Langmuir, 2008, 24, 4405-
4410.
J. F. Edd, D. Di Carlo, K. J. Humphry, S. Koster, D. Irimia, D. A. Weitz and M.
Toner, Lab Chip, 2008, 8, 1262-1264.
P. Wilding, L. J. Kricka, J. Cheng, G. Hvichia, M. A. Shoffner and P. Fortina,
Anal. Biochem., 1998, 257, 95-100.
N. J. Panaro, X. J. Lou, P. Fortina, L. J. Kricka and P. Wilding, Biomol. Eng.,
2005, 21, 157-162.
P. K. Yuen, L. J. Kricka, P. Fortina, N. J. Panaro, T. Sakazume and P. Wilding,
Separating Biological Particles in Flowing Microsystems
65
16.
17.
18.
19.
20.
21.
22.
23.
24.
25.
26.
27.
28.
29.
30.
31.
32.
33.
34.
35.
36.
37.

Genome Res., 2001, 11, 405-412.
A. Groisman, C. Lobo, H. J. Cho, J. K. Campbell, Y. S. Dufour, A. M. Stevens
and A. Levchenko, Nat. Methods, 2005, 2, 685-689.
V. VanDelinder and A. Groisman, Anal. Chem., 2006, 78, 3765-3771.
V. VanDelinder and A. Groisman, Anal. Chem., 2007, 79, 2023-2030.
P. Sethu, A. Sin and M. Toner, Lab Chip, 2006, 6, 83-89.
X. Chen, D. F. Cui, C. C. Liu and H. Li, Sens. Act, B, 2008, 130, 216-221.
X. Chen, D. F. Cui, C. C. Liu, H. Li and J. Chen, Anal. Chim. Acta, 2007, 584,
237-243.
S. K. Murthy, P. Sethu, G. Vunjak-Novakovic, M. Toner and M. Radisic, Bio-
med. Microdev., 2006, 8, 231-237.
M. Yamada and M. Seki, Lab Chip, 2005, 5, 1233-1239.
M. Yamada and M. Seki, Anal. Chem., 2006, 78, 1357-1362.
R. Aoki, M. Yamada, M. Yasuda and M. Seki, Microfluid Nanofluid, 2009, 6,
571-576.
M. Yamada, K. Kano, Y. Tsuda, J. Kobayashi, M. Yamato, M. Seki and T. Okano,
Biomed. Microdev., 2007, 9, 637-645.
M. Yamada, J. Kobayashi, M. Yamato, M. Seki and T. Okano, Lab Chip, 2008,
8, 772-778.
C. H. Yang, Y. S. Lin, K. S. Huang, Y. C. Huang, E. C. Wang, J. Y. Jhong and C.
Y. Kuo, Lab Chip, 2009, 9, 145-150.
T. A. J. Duke and R. H. Austin, Phys. Rev. Lett., 1998, 80, 1552-1555.
C. F. Chou, O. Bakajin, S. W. P. Turner, T. A. J. Duke, S. S. Chan, E. C. Cox, H.
G. Craighead and R. H. Austin, PNAS, 1999, 96, 13762-13765.
M. Cabodi, Y. F. Chen, S. W. P. Turner, H. G. Craighead and R. H. Austin, Elec-
trophoresis, 2002, 23, 3496-3503.
D. Ertas, Phys. Rev. Lett., 1998, 80, 1548-1551.
L. R. Huang, E. C. Cox, R. H. Austin and J. C. Sturm, Anal. Chem., 2003, 75,
6963-6967.
L. R. Huang, E. C. Cox, R. H. Austin and J. C. Sturm, Science, 2004, 304, 987-
990.
D. W. Inglis, J. A. Davis, R. H. Austin and J. C. Sturm, Lab Chip, 2006, 6, 655-
658.
K. J. Morton, K. Loutherback, D. W. Inglis, O. K. Tsui, J. C. Sturm, S. Y. Chou
and R. H. Austin, PNAS, 2008, 105, 7434-7438.
Chapter 2
66
38.
39.
40.
41.
42.
43.
44.
45.
46.
47.
48.
49.
50.
51.
52.
53.
54.
55.
56.
57.
58.

K. J. Morton, K. Loutherback, D. W. Inglis, O. K. Tsui, J. C. Sturm, S. Y. Chou
and R. H. Austin, Lab Chip, 2008, 8, 1448-1453.
D. W. Inglis, J. A. Davis, T. J. Zieziulewicz, D. A. Lawrence, R. H. Austin and
J. C. Sturm, J. Immunol. Methods, 2008, 329, 151-156.
D. W. Inglis, K. J. Morton, J. A. Davis, T. J. Zieziulewicz, D. A. Lawrence, R.
H. Austin and J. C. Sturm, Lab Chip, 2008, 8, 925-931.
J. A. Davis, D. W. Inglis, K. J. Morton, D. A. Lawrence, L. R. Huang, S. Y.
Chou, J. C. Sturm and R. H. Austin, PNAS, 2006, 103, 14779-14784.
J. V. Green, M. Radisic and S. K. Murthy, Anal. Chem., 2009, 81, 9178-9182.
64. P. B. Howell, D. R. Mott, J. P. Golden and F. S. Ligler, Lab Chip, 2004, 4,
663-669.
A. P. Sudarsan and V. M. Ugaz, Lab Chip, 2006, 6, 74-82.
A. P. Sudarsan and V. M. Ugaz, PNAS, 2006, 103, 7228-7233.
Y. Yamaguchi, F. Takagi, T. Watari, K. Yamashita, H. Nakamura, H. Shimizu
and H. Maeda, Chem Eng J., 2004, 101, 367-372.
A. D. Stroock, S. K. W. Dertinger, A. Ajdari, I. Mezic, H. A. Stone and G. M.
Whitesides, Science, 2002, 295, 647-651.
A. D. Stroock, S. K. Dertinger, G. M. Whitesides and A. Ajdari, Anal. Chem.,
2002, 74, 5306-5312.
P. Sethu, L. L. Moldawer, M. N. Mindrinos, P. O. Scumpia, C. L. Tannahill, J.
Wilhelmy, P. A. Efron, B. H. Brownstein, R. G. Tompkins and M. Toner, Anal.
Chem., 2006, 78, 5453-5461.
J. Seo, M. H. Lean and A. Kole, App. Phys. Lett., 2007, 91, 033901.
J. Seo, M. H. Lean and A. Kole, J Chrom A, 2007, 1162, 126-131.
L. Y. Zeng, S. Balachandar and P. Fischer, J. Fluid Mech., 2005, 536, 1-25.
E. S. Asmolov, J. Fluid Mech., 1999, 381, 63-87.
S. Ookawara, R. Higashi, D. Street and K. Ogawa, Chem Eng J., 2004, 101,
171-178.
N. Oozeki, S. Ookawara, K. Ogawa, P. Lob and V. Hessel, Aiche Journal, 2009,
55, 24-34.
D. Di Carlo, J. F. Edd, D. Irimia, R. G. Tompkins and M. Toner, Anal. Chem.,
2008, 80, 2204-2211.
D. Di Carlo, D. Irimia, R. G. Tompkins and M. Toner, PNAS, 2007, 104, 18892-
18897.
A. A. S. Bhagat, S. S. Kuntaegowdanahalli and I. Papautsky, Lab Chip, 2008, 8,
Separating Biological Particles in Flowing Microsystems
67
59.
60.
61.
62.
63.
64.
65.
66.
67.
68.
69
70.
71.
72.
73.
74.
75.
76.
77.
78.
79.
1906-1914.
D. Di Carlo, Lab Chip, 2009, 9, 3038-3046.
X. L. Mao, S. Lin, C. Dong and T. J. Huang, Lab Chip, 2009, 9, 1583-1589.
X. L. Mao, J. R. Waldeisen and T. J. Huang, Lab Chip, 2007, 7, 1260-1262.
S. S. Kuntaegowdanahalli, A. A. S. Bhagat, R. Kumar and I. Papautsky, Lab
Chip, 2009, 9, 2973-2980.
K. Yamashita, Y. Yamaguchi, M. Miyazaki, H. Nakamura, H. Shimizu and H.
Maeda, Lab Chip, 2004, 4, 1-3.
Y. Yamaguchi, D. Ogura, K. Yamashita, M. Miyazaki, H. Nakamura and H.
Maeda, Talanta, 2006, 68, 700-707.
Z. G. Wu, B. Willing, J. Bjerketorp, J. K. Jansson and K. Hjort, Lab Chip, 2009,
9, 1193-1199.
S. Choi and J. K. Park, Lab Chip, 2007, 7, 890-897.
S. Choi, S. Song, C. Choi and J. K. Park, Lab Chip, 2007, 7, 1532-1538.
S. Choi, S. Song, C. Choi and J. K. Park, Small, 2008, 4, 634-641.
S. Choi, S. Song, C. Choi and J. K. Park, Anal. Chem., 2009, 81, 1964-1968.
S. Choi and J. K. Park, Anal. Chem., 2008, 80, 3035-3039.
C. H. Hsu, D. Di Carlo, C. C. Chen, D. Irimia and M. Toner, Lab Chip, 2008, 8,
2128-2134.
S. Choi, S. Song, C. Choi and J. K. Park, Anal. Chem., 2009, 81, 50-55.
J. Han and H. G. Craighead, Science, 2000, 288, 1026-1029.
K. Hannig, Fresenius Zeitschrift Fur Analytische Chemie, 1961, 181, 244-274.
D. E. Raymond, A. Manz and H. M. Widmer, Anal. Chem., 1994, 66, 2858-
2865.
D. E. Raymond, A. Manz and H. M. Widmer, Anal. Chem., 1996, 68, 2515-
2522.
D. Kohlheyer, J. C. T. Eijkel, A. van den Berg and R. B. M. Schasfoort, Elec-
trophoresis, 2008, 29, 977-993.
R. T. Turgeon and M. T. Bowser, Anal. Bioanal. Chem., 2009, 394, 187-198.
V. Kasicka, Z. Prusik, P. Sazelova, J. Jiracek and T. Barth, J Chrom A, 1998,
796, 211-220.
B. R. Fonslow and M. T. Bowser, Anal. Chem., 2006, 78, 8236-8244.
D. Kohlheyer, G. A. J. Besselink, S. Schlautmann and R. B. M. Schasfoort, Lab
Chip, 2006, 6, 374-380.
J. W. Albrecht and K. F. Jensen, Electrophoresis, 2006, 27, 4960-4969.
Chapter 2
68
80.
81.
82.
83.
84.
85.
86.
87.
88.
89
90.
91.
92.
93.
94.
95.
96.
97.
98
99.
100.
101.
102.
103.

H. Lu, S. Gaudet, M. A. Schmidt and K. F. Jensen, Anal. Chem., 2004, 76, 5705-
5712.
D. Janasek, M. Schilling, J. Franzke and A. Manz, Anal. Chem., 2006, 78, 3815-
3819.
V. N. Stone, S. J. Baldock, L. A. Croasdell, L. A. Dillon, P. R. Fielden, N. J.
Goddard, C. L. P. Thomas and B. J. T. Brown, J Chrom A, 2007, 1155, 199-205.
T. Laurell, F. Petersson and A. Nilsson, Chem. Soc. Rev., 2007, 36, 492-506.
A. Nilsson, F. Petersson, H. Jonsson and T. Laurell, Lab Chip, 2004, 4, 131-
135.
J. J. Shi, X. L. Mao, D. Ahmed, A. Colletti and T. J. Huang, Lab Chip, 2008, 8,
221-223.
P. Augustsson, L. B. Aberg, A. M. K. Sward-Nilsson and T. Laurell, Microchim.
Acta, 2009, 164, 269-277.
F. Petersson, A. Nilsson, H. Jonsson and T. Laurell, Anal. Chem., 2005, 77,
1216-1221.
S. Kapishnikov, V. Kantsler and V. Steinberg, J. Stat. Mech., 2006, 15.
F. Petersson, L. Aberg, A. M. Sward-Nilsson and T. Laurell, Anal. Chem., 2007,
79, 5117-5123.
M. Evander, A. Lenshof, T. Laurell and J. Nilsson, Anal. Chem., 2008, 80, 5178-
5185.
C. Grenvall, P. Augustsson, J. R. Folkenberg and T. Laurell, Anal. Chem., 2009,
81, 6195-6200.
F. Petersson, A. Nilsson, C. Holm, H. Jonsson and T. Laurell, The Analyst, 2004,
129, 938-943.
F. Petersson, A. Nilsson, C. Holm, H. Jonsson and T. Laurell, Lab Chip, 2005,
5, 20-22.
H. Jonsson, C. Holm, A. Nilsson, F. Petersson, P. Johnsson and T. Laurell, Ann-
als of Thoracic Surgery, 2004, 78, 1572-1578.
H. Jonsson, A. Nilsson, F. Petersson, M. Allers and T. Laurell, Perfusion-Uk,
2005, 20, 39-43.
A. Lenshof, A. Ahmad-Tajudin, K. Järås, A. M. Sward-Nilsson, L. Aberg, G.
Marko-Varge, J. Malm, H. Lilja and T. Laurell, Anal. Chem., 2009, 81, 6030–
6037.
K. Jaras, A. Ressine, E. Nilsson, J. Malm, G. Marko-Varga, H. Lilja and T. Lau-
rell, Anal. Chem., 2007, 79, 5817-5825.
Separating Biological Particles in Flowing Microsystems
69
104.
105.
106.
107.
108.
109.
110.
111.
112.
113.
114.
115.
116.
117.
118.
119.
120.
121.

K. Jaras, A. A. Tajudin, A. Ressine, T. Soukka, G. Marko-Varga, A. Bjartell, J.
Malm, T. Laurell and H. Lilja, Journal Of Proteome Research, 2008, 7, 1308-
1314.
J. Shi, D. Ahmed, X. L. Mao, S. Lin, A. Lawit and T. J. Huang, Lab Chip, 2009,
2009, 2890-2895.
J. Persson, P. Augustsson, T. Laurell and M. Ohlin, Febs J., 2008, 275, 5657-
5666.
P. Augustsson, J. Persson, S. Ekstrom, M. Ohlin and T. Laurell, Lab Chip, 2009,
9, 810-818.
M. Evander, L. Johansson, T. Lilliehorn, J. Piskur, M. Lindvall, S. Johansson, M.
Almqvist, T. Laurell and J. Nilsson, Anal. Chem., 2007, 79, 2984-2991.
J. V. Norris, M. Evander, K. M. Horsman-Hall, J. Nilsson, T. Laurell and J. P.
Landers, Anal. Chem., 2009, 81, 6089-6095.
Y. Jung, K. Fisher, K. D. Ness, K. A. Rose and R. P. Mariella, Anal. Chem.,
2008, 80, 8447-8452.
M. A. M. Gijs, Microfluid Nanofluid, 2004, 1, 22-40.
N. Pamme, Lab Chip, 2006, 6, 24-38.
Z. H. Fan, S. Mangru, R. Granzow, P. Heaney, W. Ho, Q. P. Dong and R. Kumar,
Anal. Chem., 1999, 71, 4851-4859.
J. W. Choi, C. H. Ahn, S. Bhansali and H. T. Henderson, Sens. Act, B, 2000, 68,
34-39.
J. W. Choi, K. W. Oh, J. H. Thomas, W. R. Heineman, H. B. Halsall, J. H. Nevin,
A. J. Helmicki, H. T. Henderson and C. H. Ahn, Lab Chip, 2002, 2, 27-30.
C. H. Ahn, M. G. Allen, W. Trimmer, Y. N. Jun and S. Erramilli, J Microelec-
tromech S, 1996, 5, 151-158.
S. Ostergaard, G. Blankenstein, H. Dirac and O. Leistiko, J Magn Magn Mater,
1999, 194, 156-162.
N. Pamme and A. Manz, Anal. Chem., 2004, 76, 7250-7256.
N. Pamme, J. C. T. Eijkel and A. Manz, J Magn Magn Mater, 2006, 307, 237-
244.
A. Weddemann, F. Wittbracht, A. Auge and A. Hutten, App. Phys. Lett., 2009,
94.
K. Zhang, Q. Liang, S. Ma, X. Mu, P. Hu, Y. Wang and G. Luo, Lab Chip, 2009,
9, 2992-2999.
S. A. Peyman, A. Iles and N. Pamme, Chem Comm, 2008, 1220-1222.
Chapter 2
70
122.
123.
124.
125.
126.
127.
128.
129.
130.
131.
132.
133.
134.
135.
136.
137.
138.
139.
140.

Separating Biological Particles in Flowing Microsystems
71
S. A. Peyman, A. Iles and N. Pamme, Lab Chip, 2009, 9, 3110-3117.
D. W. Inglis, R. Riehn, R. H. Austin and J. C. Sturm, App. Phys. Lett., 2004, 85,
5093-5095.
N. Xia, T. P. Hunt, B. T. Mayers, E. Alsberg, G. M. Whitesides, R. M. Wester-
velt and D. E. Ingber, Biomed. Microdev., 2006, 8, 299-308.
K. H. Han and A. B. Frazier, Lab Chip, 2006, 6, 265-273.
B. Y. Qu, Z. Y. Wu, F. Fang, Z. M. Bai, D. Z. Yang and S. K. Xu, Anal. Bioanal.
Chem., 2008, 392, 1317-1324.
J. Jung and K. H. Han, App. Phys. Lett., 2008, 93, 3.
C. Iliescu, G. L. Xu, E. Barbarini, M. Avram and A. Avram, Microsyst. Technol.,
2009, 15, 1157-1162.
A. Manz, N. Graber and H. M. Widmer, Sens. Act, B, 1990, 1, 244-248.
141.
142.
143.
144.
145.
146.
147.
148.

72