Embed Size (px)
Citation preview

University of Groningen
Cell biological aspects of drug-resistance in human small cell lung carcinoma cellsJong, Steven de
IMPORTANT NOTE: You are advised to consult the publisher's version (publisher's PDF) if you wish to cite fromit. Please check the document version below.
Document VersionPublisher's PDF, also known as Version of record
Publication date:1991
Link to publication in University of Groningen/UMCG research database
Citation for published version (APA):Jong, S. D. (1991). Cell biological aspects of drug-resistance in human small cell lung carcinoma cells.[S.n.].
CopyrightOther than for strictly personal use, it is not permitted to download or to forward/distribute the text or part of it without the consent of theauthor(s) and/or copyright holder(s), unless the work is under an open content license (like Creative Commons).
The publication may also be distributed here under the terms of Article 25fa of the Dutch Copyright Act, indicated by the “Taverne” license.More information can be found on the University of Groningen website: https://www.rug.nl/library/open-access/self-archiving-pure/taverne-amendment.
Take-down policyIf you believe that this document breaches copyright please contact us providing details, and we will remove access to the work immediatelyand investigate your claim.
Downloaded from the University of Groningen/UMCG research database (Pure): http://www.rug.nl/research/portal. For technical reasons thenumber of authors shown on this cover page is limited to 10 maximum.
Download date: 16-12-2021


Cell biological aspects of drug-resistance in human small cell lung carcinoma cells


Stelling en
behorende bij het proefschrift van S. de Jong
1 . Het effect van 1 mM adriamycine op de pentosefosfaatcyclus van een tumorcel heeft weinig cytotoxische relevantie. - Yeh et al. , Cancer Res 47: 5994-5999 (1987)
2. Zonder de feitelijke aantoning van cisplatin gelnduceerde adducten in mitochondrieel DNA lean uit het ontbreken van breuken in dat DNA niet worden gesteld, dat er geen reparatie van deze adducten in mitochondrien plaats vindt. - Singh et al. , Cancer Chemother Pharmacol 26: 97-100 (1990)
3 . De relevantie van topoisomerase II gerelateerde resistentie zoals gevonden in in-vitro modellen lean voor de in-vivo situatie het best bestudeerd worden in kleincellige longtumoren van patienten behandeld met monotherapie VP-16 of VM-26.
4. De rol van mitochondrien in tumorcellen en daarmee het effect van cytostatica op mitochondrien wordt onderschat.
5. Holden et al. zijn te voorbarig met hun conclusie, dat zowel de topoisomerase I als de topoisomerase II activiteit gelijk is in normaal- en tumorweefel. - Holden et al. , Biochemistry 29: 2127-2134 (1990)
6. Het in totale isolatie houden van HIV seropositieve chimpansees is 'primaatonterend'.
7. Een probleem van drie leanten benaderen is overtuigender dan drie maal van een leant.
8 . Het gebruik van de term bevrijdingsbeweging als synoniem van verzetsbeweging heeft menig gruwelijk regime in het zadel geholpen.
9. Bij de discussie over individualisering en differentiatie binnen het lesgeven wordt vergeten, dat dit al lang een feit was en is in het kleuteronderwijs (ondanks de klassegrootte).
10. Onderzoek aan resistentie in kleincellige longtumoren is een uitdaging voor wetenschappers, maar het is gewoon beter niet te roken.

1 1 . Een derotatie-beugel blokkeert alle bewegingen van de knie behalve de rotatie.
12. De betrokkenheid van de westerse wereld met politieke-, religieuze- en rassenconflicten in de derde wereld houdt op waar het koloniale schuldgevoel eindigt.
13. Dat Nederland de tweede hardhout-importeur ter wereld is geeft de hypocrisie van ons milieubeleid aan .
Groningen, 25 september 1991

RUKSUNIVERSITEIT GRONINGEN
Cell biological aspects of drug-resistance in human small cell lung carcinoma cells
Proefschrift
ter verkrijging van het doctoraat in de Geneeskunde aan de Rijksuniversiteit Groningen
op gezag van de Rector Magnificus Dr. S.K. Kuipers in het openbaar te verdedigen op woensdag 25 september 199 1
des namiddags te 2 .45 uur precies
door
Steven de Jong
geboren op 22 mei 1961 te Leeuwarden

Promo tores:
Referent:
Prof. Dr. N.H. Mulder
Prof. Dr. G.T. Robillard
Dr. E.G.E. de Vries
This study was carried out at the Division of Medical Oncology, Department of Internal
Medicine of the University Hospital of Groningen, the Netherlands and was supported by
grant 86-01 from the Dutch Cancer Foundation, Koningin Wilhelmina Fonds (KWF) anrl by
the Stichting Werkgroep Inteme Oncologie.
The printing costs were supported by kind contributions of the Stichting Werkgroep Inteme
Oncologie and Bristol-Myers Squibb BV.
Lay-out: S. de Jong
Druk: Stichting drukkerij C. Regenboog
VOORWOORD
Dit proefschrift is niet het werk van een persoon, maar is tot stand gekomen in
samenwerking met vele mensen.
Mijn promoter Nanno Mulder en mijn referent Liesbeth de Vries (Werkgroep Inteme
Oncologie) hebben de aanzet gegeven tot dit onderzoek en de uitvoering ervan op
enthousiaste wijze begeleid. Manuscripten werden door hen zeer snel gecorrigeerd, veel
sneller dan ik ze schreef. George Robillard, mijn andere promoter (Fysische Chemie, RUG)
heeft veel aandacht besteedt aan de NMR proeven en bij menig manuscript de laatste puntjes
op de i gezet. Beide promotores bedank ik voor de beoordeling van het proefschrift.
De andere leden van de Stichting Werkgroep lnterne Oncologie, Dirk Sleijfer en Pax
Willemse wil ik eveneens bedanken voor het mogelijk maken van dit onderzoek en van
internationale contacten. Willy Bruins-van der Weij , de secretaresse van de Werkgroep,
zorgde voor een snelle verwerking van manuscripten en de verbeteringen daaraan . Hetty Timmer-Bosscha en Coby Meijer (lab Ho) hebben menigmaal met raad en daad
bijgestaan en ervoor gezorgd, dat alle routine zaken in het lab geregeld werden, terwijl
Phuong Le, Gert-Jan Meersma en Tineke van der Sluis (lab Ho) zorg droegen voor de MTT
assays en mijn kweken vertroetelden tijdens vakanties.
Jan Zijlstra (Algemeen Inwendige Ziekten) heeft mij ingewijd in topoisomerase II en
was actief betrokken bij veel studies. Fred Kooistra had een belangrijk aandeel in het
opzetten van een topoisomerase assay zoals beschreven in hoofdstuk 6. Egbert Smit gaf
inhoud aan 'de diepere zin des topo' s' .
Hans de Vries en Marijke Holtrop (Fysiologische Chemie, RUG) hebben veel
geholpen bij het onderzoek aan mitochondrien in hoofdstuk 2. Koos Tamminga en Klaas Dijkstra (Fysische Chemie, RUG) hielpen bij het NMR apparaat. Gerda Horst (Klinische
lmmunologie) heeft me de 'western blotting' bijgedracht. Het Streeklab (Klinische
Immunologie) zorgde voor de Critidia kweken. Douwe van Sinderen (Moleculaire Genetica,
RUG) heeft voor alle plasmid pBR322 DNA gezorgd, hetgeen ons budget aardig ontlastte.
Wiebe Zeinstra heeft een aantal apparaten en Jan Brouwer een aantal tekeningen
gemaakt, terwijl Anne Wieringa, Jacob Pleiter en Bert Tebbes de foto's hebben verzorgd.
In lab C l heb ik gedurende kortere en langere tijd samengewerkt en -geleefd met
Geke Hospers, Phuong Le, Marie-Jose Los, Janke Prins en Murielle Sark, die voor een
ontspannen en prettige sfeer in het lab hebben gezorgd en natuurlijk Ate van der Zee, die het
begrip tumorbiopt zichtbaar heeft gemaakt voor mij en anderen. Tevens wil ik alle anderen
van de Werkgroep lnterne Oncologie bedanken voor dat wat onderzoek tot een leuke en
interessante bezigheid maakt.
Petra was het steunpunt thuis, die menig verpieterde maaltijd en 'eenzame' avond op
de koop toe heeft genomen.


CONTENTS
Introduction
Chapter 1 . Energy metabolism, adriamycin-resistance and NMR spectros- 9 copy: A review
I. Energy metabolism and adriamycin-resistance;
II. Energy metabolism studied with NMR spectroscopy
Chapter 2. Increased sensitivity of an adriamycin-resistant human small 33 cell lung carcinoma cell line to mitochondrial inhibitors. Biophys.Biochem.Res.Commun accepted.
Chapter 3 . NMR spectroscopy analysis of phosphorus metabolites and the 43 effect of adriamycin on these metabolite levels in an adriamycin
-sensitive and -resistant human small cell lung carcinoma cell line. Br.I.Cancer, 63: 205-2 12, 199 1 .
Chapter 4. Topoisomerases, new targets in cancer chemotherapy. 63 Med.Oncol .Tumor Pharmacother., 7: 1 1 - 1 8, 1990.
Chapter 5. Reduced DNA topoisomerase II activity and drug-induced DNA 77
cleavage activity in an adriamycin-resistant human small cell lung carcinoma cell line. Cancer Res., 50: 304-309, 1990.
Chapter 6. Topoisomerase II as a target of m-AMSA and VM-26 in atypical 93 multidrug resistant human small cell lung carcinoma cells. Submitted.

Chapter 7. Lack of cross-resistance to fostriecin in human small cell lung 1 1 1 carcinoma cell line with topoisomerase II related drug-
resistance. Cancer Chemother. Pharma col. accepted.
Chapter 8. Detection of DNA cross-links in tumor cells with the ethidium 1 19
bromide fluorescence assay. Int.J.Cancer 37: 557-56 1 , 1986.
Chapter 9. Effect of novobiocin on CDDP cytotoxicity and formation of DNA 131 interstrand cross-links and the role of topoisomerase II and
nuclear matrix proteins in a CDDP resistant small cell lung
carcinoma cell line. Submitted.
Chapter 10. Summary and conclusions
Chapter 1 1 . Samenvatting en conclusies
List of abbreviations
151
159
167

INTRODUCTION
The development of resistance to drugs such as adriamycin and cisplatin (CDDP) (fig. 1) is a major problem in cancer chemotherapy. Tumor cell lines with acquired drugresistance in-vitro can be used as models to study the mechanisms involved. A number of mechanisms have been described in adriamycin-resistant and CDDP-resistant cell lines.
In most cell lines the development of adriamycin-resistance is accompanied by crossresistance to a wide variety of functionally and structurally unrelated compounds. These multidrug resistant cell lines often exhibit decreased drug accumulation and increased overexpression of a membrane glycoprotein of 170,000 to 1 80,000 molecular weight, termed P-glycoprotein ( 1). Overexpression results from amplification of the mdr-1 gene encoding the P-glycoprotein and in low resistant cells solely from an increase in P-glycoprotein mRNA (2). This P-glycoprotein functions as an energy-dependent efflux pump to these unrelated cytotoxic drugs ( 1 ,3). In combination with these cytotoxic drugs verapamil reverses resistance in these cell lines (I ,4). In other resistant cell lines drug accumulation was reduced without P-glycoprotein overexpression (5-8). Possibly, other membrane proteins with a similar function as the P-glycoprotein are overexpressed (8).
In some adriamycin-resistant cell lines overexpressing the P-glycoprotein an increased free radical detoxification was found, resulting especially from an increase in glutathione Stransferase (9-1 1) . Changes in energy requirements and energy metabolism have been observed in one of these lines (12-14). Additionally, the DNA topoisomerase (Topo) II activity is reduced in these cell lines (15, I6) .
Topo II is a common target for a number of intercalative antitumor drugs such as adriamycin, m-AMSA (fig. I), ellipticine and mitoxantrone and the nonintercalative epipodophyllotoxins VP-I6 and VM-26 (fig. I) (I7,I8). These drugs interfere with the DNA breakage-reunion reaction of Topo II by stabilizing the Topo II-DNA complex, the cleavable complex (fig.2). The formation of the cleavable complex is supposed to play a role in the cytotoxicity of these drugs (19-21). Resistance to epipodophyllotoxins, ellipticine and mAMSA in cell lines that do not overexpress the P-glycoprotein , can be due to a decreased amount of Topo II as well as an altered Topo II sometimes in combination with a decreased drug accumulation (5,6,22-24). Camptothecin and actinomycin D interfere with the DNA breakage reaction of Topo I by stabilizing the Topo I-DNA complex, the cleavable complex in a similar manner as described for Topo II drugs (fig.2) ( 18). Resistance to camptothecin can also be due to a decline in Topo I amount and to an altered Topo I (25).
Mechanisms of resistance to CDDP have been studied in several cell lines with invitro acquired cisplatin resistance. Several mechanisms can be involved in the CDDP resistance such as a reduced drug accumula.tion, enhanced drug inactivation, decreased formation and/or repair of DNA interstrand and intrastrand cross-links and changed folate metabolism (26,27). No clear data are available whether Topo II is involved in CDDP

HO
I CH30 0 HO 0
'"'� HO NH2
IADRIAMYCINI
HJCO ,¢'''"' NH
eta N
lm-AMSAI
OH CO°'"'� I ICH3l2C HO 0 0 � 0
(� CH3 0 OH
OOCNH� CH30
I NOVOBIOCIN)
0
H R�o o� HO O OH
R = (�3 VP-16 R=O VM-26
[OSTRIECIN I
HJN \ I Cl Pt
HJN I \ Cl
I coo Pl
Figure 1. Structure of the most important drugs used in this thesis.
2
OH
CH20H
resistance. However, resistance to nitrogen mustard, a drug that also induces DNA
interstrand cross-links, was related to an increased Topo II activity in these cells (28).
Furthermore, novobiocin (fig. l) , an inhibitor of the Topo II catalytic activity, enhances the
effectivity of CDDP by increasing the formation of DNA interstrand cross-links (29).
In this thesis human small cell lung carcinoma cell lines with acquired drug-resistance
were studied. An adriamycin-resistant subline GLC4/ ADR and a CD DP-resistant subline
GLC4/CDDP have been established from the parental cell line GLC4• The cross-resistance
pattern of GLC4/ ADR is different from the cross-resistance pattern described for MDR, since
cross-resistance was observed to X-irradiation but not to colchicine (7,30). However, the
adriamycin accumulation is reduced in these cells (7). In GLC4/CDDP c�lls, the amount of
Pt bound to DNA and the number of DNA intrastrand cross-links has decreased, while no
changes in CDDP accumulation are found compared to the parental cell line GLC4 (31,32).
These cell lines are interesting models, since patients with small cell lung carcinomas
have an initially high response rate to combination chemotherapy, but eventually
chemotherapy fails as the carcinomas develop resistance to chemotherapy. Whether this is
due to the presence of an intrinsic resistant subpopulation within the tumor or a matter of
acquired resistance is unknown. In this thesis further insight in the mechanism involved in
the drug-resistance and ways to reverse drug-resistance are investigated which may improve
chemotherapeutic efficacy in the future.
Chapter 1 reviews the energy metabolism of tumor cells, the changes in energy
metabolism involved in adriamycin-resistant tumor cells and the possibility to use energy
metabolism inhibitors in combination with adriamycin. The advantage of the noninvasive
technique nuclear magnetic resonance spectroscopy to study the energy metabolism in drug
sensitive and drug-resistent tumor cells fa-vitro as well as in-vivo is described in the second
part of the review.
In chapter 2 the energy metabolism of GLC4/ ADR is described. The possibilities to
circumvent adriamycin-resistance in an atypical drug-resistant cell line (GLC4/ ADR) by
inhibitors of the energy metabolism are investigated.
Energy metabolism of tumor cells can be studied in-vivo with NMR spectroscopy.
This technique is applied to determine whether parameters of the energy metabolism can be
used to discriminate between continuous perfused drug-sensitive and drug-resistant cell lines,
GLC4 and GLC4/ADR, with or without adriamycin treatment (chapter 3).
In a previous study it was suggested that part of the adriamycin-resistance could be
due to a changed Topo II in GLC4/ ADR. Likewise, Topo II changes caused by physical
stress such as glucose deprivation or tumor hypoxia may be a drug-resistance mechanism in
in-vivo tumors. The role of Topo II in drug-resistance and as a drug-target of adriamycin,
VP-16, VM-26 and m-AMSA is reviewed in chapter 4.
In chapter 5 the Topo II changes in GLC4/ ADR are analyzed and the possibility of
P-glycoprotein overexpression in the resistant cell line is excluded.
3

DNA Topo1somerase I DNA Topo1somerase II
3' I I S' 3' I I S' s' I I 3' S' I I 3'
®-ii If-� 3' S' 3' s' s' 3' S ' 3'
I I .() II .() 3' s' 3' s' s' �3' s' 3' '""'''" -i f '""'"'"
agent agent r•1 !•l
3' S' 3' S' s' 3' s· 3'
Figure 2. Stimulation of cleavable complex formation induced by DNA topo-isomerase I or DNA topoisomerase II specific drugs.
4
The large differences in cross-resistance between VM-26 and m-AMSA required further study of Topo II in GLC4/ ADR. The amount of Topo I and II in GLC4 and GLC4/ ADR and the relation between Topo II as an intracellular drug-target and drugsensitivity is determined in both cell lines (chapter 6).
Differences in Topo II activities could make cell lines more or less susceptible to certain antitumor drugs. Fostriecin belongs to a new class of drugs which inhibit Topo II activity without cleavable complex formation. Chapter 7 describes the efficacy of fostriecin (fig.I) in cell lines with diverse Topo II activities. Besides GLC4 and GLC4/ADR, a CDDPresistant cell line GLC4/CDDP was used.
Topo II was essential in preventing DNA interstrand cross-links in nitrogen-mustard resistant cells. Till now, it was unknown whether Topo II had a similar role in CDDPresistance. Indirect evidence came from studies with novobiocin, an inhibitor of the Topo II
activity. In chapter 8 a method is described to measure directly DNA interstrand crosslinking by CDDP without radioactive labelling of the cells.
In chapter 9 the formation ofDNA-interstrand cross-links and the effect of novobiocin on these cross-links in both cell lines in a CD DP-resistant cell line, GLC4/CDDP, and in GLC4 are determined. The role of Topo II and chromatin structure in the CDDP-resistance is discussed.
Chapter 10 summarizes the results of our studies and ways for further investigations are indicated.
REFERENCFS
1 . Endicott, J.A., and Ling, V. The biochemistry of P-glycoprotein-mediated multidrug resistance. Annu.Rev.Biochem., 58: 137-171, 1989.
2. Bradley, G., Naik, M., and Ling, V. P-glycoprotein expression in multidrug-resistant human ovarian carcinoma cell lines. Cancer Res., 49: 2790-2796, 1989.
3. Horio, M., Gottesman, M.M., and Pastan, I. ATP-dependent transport of vinblastine in vesicles from human multidrug-resistant cells. Proc.Natl. Acad.Sci. USA, 85: 3580-3584, 1988.
4. Schuurhuis, G.J., Broxterman, H.J., Cervantes, A. , Van Heijningen, T.H.M., De Lange, J.H.M., Baak, J.P.A., Pinedo, H.M., and Lankelma, J. Quantitative determination of factors contributing to doxorubicin resistance in multidrug-resistant cells. J.Natl.Cancer Inst., 81 : 1 887- 1 892, 1989.
5. Ferguson, P.J., Fisher, M.H., Stephenson, J., Li, D., Zhou, B., and Cheng, Y. Combined modalities of resistance in etoposide-resistant human KB cell lines. Cancer Res., 48: 5956-5964, 1988.
6. Matsuo, K., Kohno, K., Takano, H., Sato, S., Kiue, A., and Kuwano, M. Reduction of drug accumulation and DNA topoisomerase II activity in acquired teniposide-resistant human cancer KB cell l ines. Cancer Res., 50: 5819-5824, 1990.
7. Zijlstra, J.G., de Vries, E.G.E., and Mulder, N.H. Multifactorial drug resistance in an
5

adriamycin-resistant human small cell lung carcinoma cell line. Cancer Res., 47: 1780-1784, 1987.
8. Marquardt, D, McCrone, S . , and Center, M.S. Mechanisms of multidrug resistance in HL60 cells: Detection of resistance-associated proteins with antibodies against synthetic peptides that correspond to the deduced sequence of P-glycoprotein. Cancer Res. , 50: 1426-1430, 1990.
9. Batist, G. , Tulpule, A., Sinha, B.K. , Katki, A.G. , Myers, C.E., and Cowan, K.H. Induction of an anionic glutathione-S-transferase in multi-drug resistant human breast cancer cells and in xenobiotic resistant preneoplastic l iver nodules induced by carcinogens. J .Biol . Chem., 261 : 1 5544-15549, 1986.
10. Sinha, B.K. , Katki, A.G., Batist, G., Cowan, K.H. , and Myers, C.E. Differential formation of hydroxyl radicals by adriamycin in sensitive and resistant MCT-7 human breast tumor cells: implications for the mechanism of action. Biochemistry, 26: 3776-3781 , 1987.
1 1 . Deffie, A.M., Alam, T., Seneviratne, C. , Beenken, S.W., Batra, J.K., Shea, T.C., Renner, W.D., and Goldenberg, G.J. Multifactorial resistance to adriamycin: relationship of DNA repair, glutathione transferase activity, drug efflux, and P-glycoprotein in cloned cell l ines of adriamycin-sensitive and -resistant P388 leukemia. Cancer Res. , 48: 3595-3602, 1988.
12. Cohen, J .S. , Lyon, R.C., Chen, C. , Faustino, P.J . , Batist, G., Shoemaker, M., Rubalcaba, E. , and Cowan, K.H. Differences in phosphate metabolite levels in drug-sensitive and -resistant human breast cancer cell l ines determined by 3 1P magnetic resonance spectroscopy. Cancer Res. , 46: 4087-4090, 1986.
1 3. Yeh, G.C., Occhipinti, S.J., Cowan, K.H., Chabner, B.A., and Myers, C.E. Adriamycin resistance in human tumor cells associated with marked alterations in the regulation of the hexose monophosphate shunt and its response to oxidant stress. Cancer Res., 47: 5994-5999, 1987.
14. Lyon, R.C., Cohen, J.S., Faustino, P.J. , Megnin, F., and Myers, C.E. Glucose metabolism in drug-sensitive and drug-resistant human breast cancer cells monitored by magnetic resonance spectroscopy. Cancer Res. , 48: 870-877, 1988.
1 5. Deffie, A.M., Batra, J.K., and Goldenberg, G .J. Direct correlation between DNA topoisomerase II activity and cytotoxicity in adriamycin-sensitive and -resistant P388 leukemia cell lines. Cancer Res. , 49: 58-62, 1989.
16. Sinha, B.K. , Haim, N., Dusre, L., Kerrigan, D., and Pommier, Y. DNA strand breaks produced by etoposide (VP-16,21 3) in sensitive and resistant human breast tumor cells: implications for the mechanism of action. Cancer Res. , 48: 5096-5100, 1988.
17 . Wang, J.C. DNA topoisomerases. Annu.Rev.Biochem., 54: 665-697, 1985. 1 8. Liu, L.F. DNA topoisomerasepoisons as antitumor drugs. Annu.Rev.Biochem., 58: 351-375,
1989. 19. Ross, W. , Rowe, T., Glisson, B., and Liu, L. Role of topoisomerase II in mediating
epipodophyllotoxin-induced DNA cleavage. Cancer Res. , 44: 5857-5860, 1984. 20. Covey, J.M., Kohn, K.W. , Kerrigan, D., Tilchen, E.J., and Pommier, Y. Topoisomerase
II-mediated DNA damage produced by 4'-(9-acridinylamino)-methanesulfon-m-aniside and related acridines in L l2 10 cells and isolated nuclei: relation to cytotoxicity. Cancer Res. , 48: 860-865, 1988.
2 1 . Rowe, T.C., Chen, G.L., Hsiang, Y.-H., and Liu, L.F. DNA damage b y antitumor acridines mediated by mammalian DNA topoisomerase II. Cancer Res., 46: 2021-2026, 1986.
22. Glisson, B., Gupta, R., Smallwood-Kentro, S. , and Ross, W.E. Characterization of acquired epipodophyllotoxin resistance in a Chinese hamster ovary cell line: loss of drug-stimulated DNA cleavage activity. Cancer Res. , 46: 1934-1938, 1986.
23. Pommier, Y., Kerrigan, D., Schwartz, R.E., Swack, J.A., and Mccurdy, A. Altered DNA topoisomerase II activity in Chinese hamster cells resistant to topoisomerase II inhibitors. Cancer Res., 46: 3075-3081, 1986.
24. Zwelling, L.A. , Hinds, M., Chan, D., Mayes, J . , Sie, K.L., Parker, E., Silberman, L.,
6
Radcliffe, A. , Beran, M., and Blick, M. Characterization of an amsacrine-resistant line of human leukemia cells. J.Biol.Chem., 264: 164 1 1 -16420, 1989.
25. Andoh, T., Ishii, K., Suzuki, Y., lkegami, Y., Kusunoki, Y. , Takemoto, Y., and Okada, K. Characterization of a mammalian mutant with a camptothecin-resistant DNA topoisomerase I. Proc. Natl . Acad.Sci. USA, 84: 5565-5569, 1987.
26. De Graeff, A., Slebos, R.J .C., and Rodenhuis, S. Resistance to cisplatin and analogues: mechanisms and potential clinical implications. Cancer Chemother. Pharmacol., 22:325-332, 1988.
27. Andrews, P.A., and Howell, S .B. Cellular pharmacology of cisplatin: perspectives on mechanisms of acquired resistance. Cancer Cells, 2:35-43, 1990.
28. Tan, K.B., Mattern, M.R., Boyce, R.A., and Schein, P.S. Elevated DNA topoisomerase II activity in nitrogen mustard-resistant human cells. Proc.Natl .Acad.Sci.USA, 84: 7668-7671 , 1987.
29. Eder, J .P., Teicher, B.A., Holden, S.A., Cathcart, K.N.S . , and Schnipper, L.E. Novobiocin enhances alkylating agent cytotoxicity and DNA ISC in a murine model. J. Clin. Invest., 79: 1 524-1 528, 1987.
30. Meijer, C. , Mulder, N.H., Timmer-Bosscha, H. , Zijlstra, J .G., and de Vries, E.G.E. Role of free radicals in an adriamycin-resistant human small cell lung cancer cell line. Cancer Res. , 47: 4613-4617, 1987.
3 1 . G.A.P.Hospers, N.H.Mulder, B. de Jong, L. de Leij, D.R.A.Uges, A.M.J. FichtingerSchepman, R.J.Scheper, E.G.E. de Vries. Characterization of a human small cell lung carcinoma cell line with acquired resistance to cis-diamminodichloroplatinum (II) in vitro. Cancer Res. 48: 6803-6807, 1988.
32. G.A.P.Hospers, E.G.E. de Vries, N.H.Mulder. The formation and removal of cisplatin (CDDP) induced DNA adducts in a CDDP sensitive and resistant human small cell lung carcinoma (hSCLC) cell line. Br.J. Cancer 6 1 : 79-82, 1990.
7

8

Chapter 1
ENERGY :METABOLISM, ADRIAMYCIN-RESISTANCE
AND NMR SPECTROSCOPY: A REVIEW.
I. Energy metabolism and adriamycin-resistance; II. Energy metabolism
studied with NMR spectroscopy
9

I. ENERGY METABOLISM AND ADRIAMYCIN-RFSISTANCE
INTRODUCTION
Tumor cells, like normal cells, derive ATP from glycolysis or from oxidative phosphorylation. However, energy metabolism in tumor cells differs from normal cells of the same tissue of origin, since tumor cells have a higher rate of glycolysis (fig.1) (1). A correlation has been observed between the rate of glycolysis and the tumor cell growth rate (1-3). In hepatoma and ascites tumor cells the initial enzyme of the glycolysis, hexokinase, plays an important role in maintaining a high rate of glycolysis (2,3). In these cells the increased hexokinase activity is accompanied by a change in the ratio of its cytosolic and mitochondria-bound form in favour of the latter (2-5). Probably, mitochondria-bound hexokinase can directly use ATP, produced during oxidative phosphorylation, to phosphorylate glucose (5) . Furthermore, the mitochondria bound hexokinase is 3.5 fold Jess sensitive to feedback inhibition by glucose-6-phosphate compared to cytosolic hexokinase (3,
5). Enhanced glucose utilization and lactate production is not essential to maintain growth
rates in tumor cells. When tumor cells are cultured in galactose-containing media they produce low levels of lactic acid compared to cells growing in glucose-containing media, although growth rates are similar (1). In addition, mutants have been isolated with reduced glucose uptake and glycolysis capacity with a similar proliferation rate as the wild-type cells (6). In the presence of high levels of glucose, the oxidation of glutamine to C02 in the citric acid cycle from mitochondria can provide up to 40% of the energy requirements of human HeLa cells (6). When glucose is absent from the culture media, glutamine oxidation can provide 98% of the energy requirements, but to maintain cell proliferation some other hexoses have to be present (8,9). The hexoses are metabolized in the pentose phosphate pathway into ribose and nucleic acids (8,9). The pentose phosphate pathway also provides NADPH to reduce glutathione, that operates as a protector from oxidative damage (fig. l) (10, 1 1). Glucose-6-phosphate dehydrogenase (G6PD), the first enzyme of this pathway, controls the activity of the pathway and its activity is a major source of NADPH (12).
Although high glycolytic rates have been observed in cultured tumor cells, it has been estimated that 40 to 60% of the total amount of ATP in human as well as murine tumor cells is still derived from oxidative phosphorylation ( 1 , 1 3, 1 4). Oxidative phophorylation can be described as follows (fig. l) (1). In the mitochondria acetyl-CoA is degraded to COz by the citric acid cycle which produces NADH and reduced flavins. Electrons of NADH and reduced flavins are transferred to 02 via a number of enzymes, the electron transport chain, pumping protons across the mitochondrial inner membrane, thus forming a proton gradient. The flow back of protons through the F0 unit of the F0F i-ATPase results in ATP synthesis
10

CYTOSOL
MITOCHONORION
GLUCOSE i
G-6-P I
--/"--::G-6-P-�::::----.111 6-PG - ---+ PENTOSE / � PHOSPHATE
I I I I I I I I I I I I I ...
NAOP NAO PH
� GSH GSSG
M Hz Oz HzO
PYRUVATE +-+LACTATE i
ACETYL CoA
i Fpz
IH+outll IWoutl IH+outl NADH oxx red ox�red ox red ox� HzO X Fp Coa Ycytb Cytc�ytcYCytaYcyta3
NAO+ red ox A'red ox red J\... oxA red 1/202
I ATPase I i
ATP
I I I ATPase I '""I -AT_Pas_e....,I
� i ATP ATP
Figure 1. Glycolysis, reactions of the pentose phosphate pathway, and free radical detoxification occur in the cytosol, whereas the reactions of the citric acid cycle and the oxidative phosphorylation take place only in the mitochondria. (See text for further explanation)
1 1

by the F1 unit. Mitochondrial respiration is due to the activity of cytochrome c oxidase (cytochrome aa3), the last enzyme complex of this chain, which transfers electrons to 02. Oxidative phosphorylation generates 32 and glycolysis 4 of the 36 molecules of ATP that are fonned when 1 molecule of glucose is completely oxidized to COz and H20 .
Mitochondria of "normal" and tumor cells contain mitochondrial-specific DNA. Human mitochondrial DNA contains genes coding for RNAs involved in mitochondrial protein synthesis and genes coding for 13 polypeptides involved in oxidative phosphorylation (15). The other mitochondrial proteins are nuclear gene products (15). Mitochondria of tumor cells differ from normal mitochondria in a number of ways, yet tumor mitochondria have a nonnal capacity to carry out oxidative phosphorylation ( 1-5, 16). The activity of enzymes involved in oxidative phosphorylation increases in the early G1 phase of human leukemic cells as well as the cellular ATP level ( 17). Inhibition of the mitochondrial protein synthesis results in a growth delay and eventually in a cell cycle block in early G1 (17). In addition, inhibition of the electron transport chain activity also prevents cells from entering the S-phase ( 18).
DRUGS INHIBITING THE ENERGY METABOLISM IN TUMOR CELLS
Glycolytic inhibitors. 2-Deoxyglucose is a glucose analogue that competitively inhibits cellular uptake and utilization of glucose. In the cell 2-deoxyglucose is phosphorylated into 2-deoxyglucose-6-phosphate, which inhibits hexose phosphate isomerase and the glycolytic pathway, leading to cell starvation. 2-Deoxyglucose inhibited cell growth of MCF7 human breast, FEM-X human melanoma cancer cells, and KB human cervical carcinoma cells, depending on the glucose concentration of the culture medium (19,20). A human colon carcinoma cell line with an impaired oxidative phosphorylation capacity is very sensitive to 2-deoxyglucose compared to three other human colon carcinoma cell lines (21).
Mitochondrial inhibitors. Lonidamine, an indazole carboxylic acid, inhibits the oxygen consumption and the aerobic and anaerobic glycolysis in several murine tumor cells (22,23). The inhibition of the energy metabolism may be a consequence of the structural damage to inner and outer mitochondrial membranes which results in a loss of mitochondrial hexokinase (23,24). Rhodamine-123 is retained longer in mitochondria of carcinoma cells and shows selective toxicity in carcinoma cells (16,25). The antitumor effect of rhodamine 123 in tumor cell lines probably depends on the mitochondrial membrane potential and the sensitivity of F0 Fi-ATPase activity for rhodamine 123 (26). Gossypol is differently effective on human melanoma, colon carcinoma and adenocarcinoma cell lines (27) . Gossypol interacts with mitochondria of tumor cells (28). The activity of lonidamine, gossypol and rhodamine-123 against human breast, pancreas, prostate, colon and cervix carcinoma cells have been compared (28). Gossypol and rhodamine- 123 are most effective against these tumor cells,
12
but rhodamine-123 inhibits human bone marrow colony formation completely in contrast to
gossypol (28).
Tetracyclines such as oxycycline and doxycycline, when continuously present, inhibit
proliferation in-vivo of hepatoma and solid Leydig cell tumors and in-vitro of human
prostatic and renal carcinoma cells and human leukemia cells ( 17,29-31). Inhibition of the
mitochondrial protein synthesis results in a decrease of some subunits of the enzyme
complexes involved in oxidative phosphorylation that are encoded on mitochondrial DNA.
A lack of oxidative ATP synthesis capacity occurs, which leads to a proliferation delay or
cell cycle block in early G1 ( 17). When the activity of the cytochrome c oxidase, a parameter
of the mitochondrial capacity, has reduced to 35 % and 50% by doxycycline treatment, there
is an arrest of proliferation of prostatic and renal carcinoma cells (31).
Ditercalinium, a bifunctional DNA intercalator, has a large effect on the
mitochondrial structure in Chinese hamster lung fibroblast cell Jines (32). Fibroblast cells deficient in mitochondrial respiration are resistant to ditercalinium compared to glycolysis
deficient cells. Recovery of mitochondrial respiration in revertants leads to an increase in
ditercalinium sensitivity. In L1210 mouse leukemia cells mitochondrial DNA levels and the
cytochrome c oxidase activity decreases after ditercalinium treatment, while no effect has
been observed on the nuclear DNA (32). Ethidium bromide and a berenil analogue, HOE
15030, accumulate in the mitochondria and specifically inhibit mitochondrial DNA synthesis
probably by intercalation in the DNA or binding in the DNA groove (33). HOE 15030
inhibits the mitochondrial but not the nuclear DNA topoisomerase (Topo) I activity which
may explain the mechanism of action of this drug (34,35).
The relative importance of glycolysis and oxidative phosphorylation for ATP
generation can explain the relative sensitivity to mitochondrial or glycolytic inhibitors. The
cells most dependent on mitochondrial respiration are most sensitive to mitochondrial
inhibitors (32), while cells primarily depending on glycolysis are more sensitive to inhibitors
of the glycolysis (20). However, these drugs are relatively non-cytotoxic, since high
concentrations and continuous incubations are needed to obtain cytotoxic effects on tumor
cells (19,21,24,25,27-33). Preferably, these drugs can be used in a combined treatment if
repair of damage induced by the other drug(s) is an energy-dependent process. Lonidamine
has already proven to have a synergistic effect on the cytotoxic effect of cisplatin, melphalan
and BCNU in MCF-7 cells (24). The continuous presence of doxycycline in combination with
intermittent treatment with adriamycin or 1-.B-D-arabinofuranosyl cytosine can delay relapse
of in-vivo rat leukemia (36).
ENERGY METABOLISM AND ADRIAMYCIN-RESISTANCE
P-glycoprotein related resistance. Cell lines selected in-vitro for resistance to
13

adriamycin, Vinca alkaloid or colchicine, exhibit the multidrug resistant (MDR) phenotype. In these resistant cells a � 170,000 kD P-glycoprotein is overexpressed (37). This Pglycoprotein functions as an energy-dependent efflux pump to different types of antitumor drugs (37,38). MDR resistance can be induced by changes in the cellular energy metabolism. Transient hypoxia of the cells has induced amplification of the P-glycoprotein gene and resistance to adriamycin in a murine tumor cell line (39), while P-glycoprotein gene amplification was absent in other human and murine tumor cell lines with hypoxia-induced adriamycin-resistance. Thus, DNA overreplication, gene amplification and drug-resistance induced by hypoxia appeared to be cell line dependent. The overexpression of the Pglycoprotein can also be responsible for changes in the cellular energy metabolism. In a vinblastine-resistant acute lymphoblastic human leukemic cell line cellular oxygen uptake has increased, while the sensitivity of mitochondria for vinblastine has decreased. Increased respiratory activity may be important for the activity of another drug-efflux mechanis or of the overexpressed P-glycoprotein in these cells (40). In four adriamycin-resistant SW-1573 human squamous cell lung carcinoma cell lines the cytosolic pH has increased as a function of adriamycin-resistance and overexpression of the P-glycoprotein (41), which may correlate with the increased lactate production of these cell lines (13).
Free radical detoxification. In certain adriamycin-resistant tumor cells expressing the MDR phenotype, an increased detoxification capacity can be found (42-45). The free radicals formed by the anthracycline adriamycin through NADPH depending cytochrome P-450 reductase can be detoxified by the glutathione redox cycle (42-46). The free radicals are detoxified by glutathione peroxidase, using glutathione as a hydrogen donor, while glutathione reductase that requires NADPH, is used to keep glutathione in its reduced, active form (fig. I). In adriamycin-resistant human breast cancer MCF-7 cells the kinetic properties of G6PD have been changed, since the V max of G6PD is 50-fold lower and the Km of G6PD for NADP+ is 10-fold reduced compared to its sensitive parental line, which may limit the conversion of adriamycin to a free radical by cytochrome P-450 (44). The 3-fold increase in glycolytic rate in resistant cells may be related to an increased detoxification capacity (47), since the activity of glutathione transferase, which shows peroxidase activity, is 45-fold increased in adriamycin-resistant MCF-7 cells (46). Resistance of P388 cells to another anthracycline daunorubicin has led to a 1 .4-fold increase in glucose-6-phosphate activity, a 2-fold increase in pentose phosphate shunt activity and an increase in glucose metabolism (48). In contrast, in adriamycin-resistant human squamous lung cancer SW-1573 cell lines the detoxification capacities have no correlations with the level of adriamycin-resistance ( 49). In addition, glycolytic rates correlate neither with the glutathione transferase activity nor with the degree of adriamycin-resistance in this cell line and in two human ovarian carcinoma cell lines (13) . Therefore, an increase in detoxification capacity in adriamycin-resistant cells may depend on the type of cell lines used in these studies.
Topo II related resistance. Some cell lines that have been made resistant to
14

epipodophyllotoxins (VP- 16 and VM-26), ellipticine or m-AMSA do not overexpress the P
glycoprotein (50-54). Cross-resistance to adriamycin, VP- 16, VM-26, mitoxantrone and m
AMSA is observed and sometimes drug accumulation is decreased. Topo II is a common
target for these types of antitumor drugs and resistance to these drugs has been attributed to
quantitative (52,54) or qualitative changes in Topo II in the resistant cells (50,5 1,53).
Changes in cellular energy metabolism can also induce Topo II related resistance.
Anoxia, the calcium ionophore A23 187, and 2-deoxyglucose have induced resistance to
adriamycin and etoposide in Chinese hamster ovary cells, (55,56). The resistance is at least
in part due to the depletion of Topo TI protein level during these glucose-regulated stresses
(57). The decline in Topo II was not a result of transcriptional regulation or ATP depletion
(57). Blockade of the Na+, K+ -A TPase pump by ouabain produced adriamycin-resistance
in human lung adenocarcinoma, colon adenocarcinoma and melanoma cells (58). Ouabain
decreased the adriamycin-induced Topo II mediated single-strand breaks. Thus, an altered
intracellular ionic environment or a change in energy metabolism by ouabain treatment can
reduce Topo II activity and consequently result in a reduced formation of drug-induced Topo
II-DNA complexes (58).
MODULATION OF ADRIAMYCIN-RESISTANCE BY DRUGS ACTING UPON TIIE
ENERGY METABOLISM OF TUMOR CELLS.
A number of MDR modifying drugs such as verapamil, bepridil and diltiazem that
increase drug-accumulation in P-glycoprotein overexpressing resistant cells, depress ATP
levels in adriamycin-resistant human ovarian and chinese hamster cancer cells but not in the
parental adriamycin sensitive cells (59). Daunorubicin and vincristine had no effect on the
ATP levels. Verapamil and the other MDR modifying drugs cause an increase in the lactate
production of adriamycin-resistant P-glycoprotein overexpressing human ovarian, human
breast, and human squamous cell lung cancer cells, but no increased lactate production is
found in the sensitive cells ( 13). The effect of verapamil has been observed at low as well as high extracellular pH. Daunorubicin and vincristine have no effect on the lactate
production. It has been estimated that verapamil induces an additional ATP consumption that
accounts for 10% of the cellular energy turnover in adriamycin-resistant human ovarian
cancer cells ( 13). In the presence of verapamil the cytosolic pH of adriamycin-resistant SW-
1573 cells decreases to the value that has been observed in the parental sensitive line (4 1).
The adriamycin-resistant MCF-7 cells with a three-fold increase in glycolytic rate (47) and
expressing the MDR phenotype (46), are 15-fold more sensitive to 2-deoxyglucose than the
adriamycin-sensitive cells, while the combination of 2-deoxyglucose and adriamycin has only
an additional effect in both cell lines ( 19). Other MOR cell lines were also consistently more
sensitive to 2-deoxyglucose (20). For MCF-7 cells, the most resistant line was the most
15

sensitive cell line to 2-deoxyglucose (20). The mitochondrial inhibitor rhodamine-123 is probably not able to reverse MDR,
because MDR cells are highly resistant to rhodamine-123 (60). The P-glycoprotein overexpression is mainly responsible for the rhodamine-123 resistance, since cells transfected with the mdr- 1 gene were also highly resistant to this drug (60). However, no crossresistance was observed to gossypol in MDR cells or in cells transfected with the MDR-1 gene (60).
No data are available on the effect of energy metabolism inhibitors in combination with drugs, that induce Topo II-DNA complexes, in Topo II related resistant cell lines. These combinations may be ineffective to increase the cytotoxicity of the drug-induced Topo 11-DNA complexes, since these complexes have to be processed intracellular in an energydependent manner (61). Dinitrophenol, an uncoupler of the oxidative phosphorylation, protects mouse L 12 10 and human HL60 leukemia cells against the effect of drug-induced Topo II-DNA complexes (61,62).
CONCLUSIONS
In tumor cells, ATP was synthesized by glycolysis as well as oxidative phosphorylation. Glycolytic and mitochondrial inhibitors showed antitumor activity at relatively high concentrations. In combination with other types of antitumor drugs such as adriamycin and alkylating agents these drugs can be more effective, especially if drug-efflux or repair of damage induced by the other drug(s) is an energy-dependent process. Inhibitors of the energy metabolism such as 2-deoxyglucose and gossypol or drugs such as verapamil which acts upon the energy metabolism by increasing the lactate production can be used to reverse adriamycin-resistance of MDR cell lines. However, glucose-regulated stresses can also induce adriamycin-resistance by a decline in Topo II amount in tumor cells. Till now, too few studies have been carried out examining the effect of drugs inhibiting the cellular energy metabolism in MDR and Topo II-related resistance to draw conclusions from.
Energy metabolism within tumor cells and in-vivo tumors that may be an indication for the appearance of drug-resistance, can be monitored with a noninvasive technique namely nuclear magnetic resonance (NMR) spectroscopy. NMR spectroscopy may also be useful to evaluate the effect of an inhibitor of the energy metabolism in a combination treatment in invitro tumor cells and in-vivo tumors.
1 6

II. ENERGY METABOLISM STUDIED WITH NMR SPECTROSCOPY
INTRODUCTION
NMR spectroscopy can be used to provide physiological and biochemical information
about cells and tissues in vitro and in vivo, because of its potential for noninvasive
measurements (63-65). The magnetic resonance spectrometer is a superconducting magnet
coupled to a transmitter and receiver. When atomic nuclei with an unpaired number of
protons or neutrons (1H, 13C, and 3 1P) are placed in a stationary magnetic field, it causes
the nuclear dipoles to orient themselves, so that the dipoles are aligned either with or against
the magnetic field (fig.2a). When, for instance, 31P nuclei are observed with NMR spectroscopy, each 31P nucleus will absorb and release the energy at specific frequencies
depending upon how the nucleus is shielded by its electrons as is shown for the three
phosphates in the ATP molecule (fig.3) . Therefore, a brief pulse of broad bandwidth radiofrequencies is transmitted, which stimulates the entire population of a given nucleus
(fig.2b). After transmission ends, the nuclei relax back to their initial state in the static
magnetic field and in doing so induce a signal in the receiver , called the free induction decay
(fig.2c) . The free induction decay is transformed into individual frequencies by Fourier
transformation and these frequencies are characteristic of the type of chemical bond in which
the nucleus is located (fig.2d and 3). A NMR spectrum is obtained by Fourier transformation
of an accumulated number of free induction decays, depending on the nuclei concentration
in a sample. The spectrum gives inform�tion about the identity of a resonance by the position
of the peak along the parts per million (ppm) axis in regard to a known frequency of a
reference, the chemical shift. The intensity of a resonance (the peak area) is linearly
proportional to the concentration. In fig.3 the chemical shift is the change in frequency in
ppm ( 1 ppm = 12 1.45 Hz) while the general resonance frequency of 3 1P nuclei is near
12 1.45 MHz in a magnetic field with a strength of 7 tesla . For 1H and 13C nuclei in a
magnetic field of 7 tesla the general resonance frequencies are 300 and 79.3 MHz, respectively. Thus, no interference between resonance frequencies of these three nuclei occur
in a NMR experiment. In intact cells, only most mobile molecules such as water, energy
sources, amino acids and fat can be detected, while membrane and protein components, or
phospholipids and DNA phosphates existing in a relatively bound state, exhibit very short
free induction decays and do either not appear at all or only as a broad baseline hump in the
1H and 3 1P NMR spectra. 1H and 3 1P constitute 100% of natural abundant hydrogen and
phosphorus, respectively, while 13C is a 1. 1 % natural abundant carbon compared to 98.9%
of 12C.
17

a b c d
� � iJ2ill.Ct2 RADIO- mm. '\ FREE �LJll u ll E ! FREQUENCY "V\J"'; �: I NDUCTION FOURIER illill._ PULSE ill©© j DECAY "\1\1'7 TRANS-
� � __. t FORMATION
MAGNETIC FIELO
Figure 2. Simplified schedule of NMR spectroscopy. (See text for explanation of the figures)
REF
0 0 0 I I I
-0 - P - 0 - P - 0 - P - O - AOENOSINE
-6 Y -6 P -6 a
Figure 3. 31 P NMR spectrum (121 .45 MHz) of a perchloric extract of human GLC4 small cell lung carcinoma cells. The top part of the illustration shows the three phosphates in ATP and their resonances in the spectrum are indicated. Peak assignments are: 1 , PC; 2, Pi; 3, GPE; 4, GPC; 5, PCr; 6, yATP; 7, 6ADP; 8, aADP; 9, aATP; JO, NAD; 1 1 , 6ATP.
18
1H, 13c, AND 3lp NMR SPECTROSCOPY OF IN-VITRO TUMOR CELIS
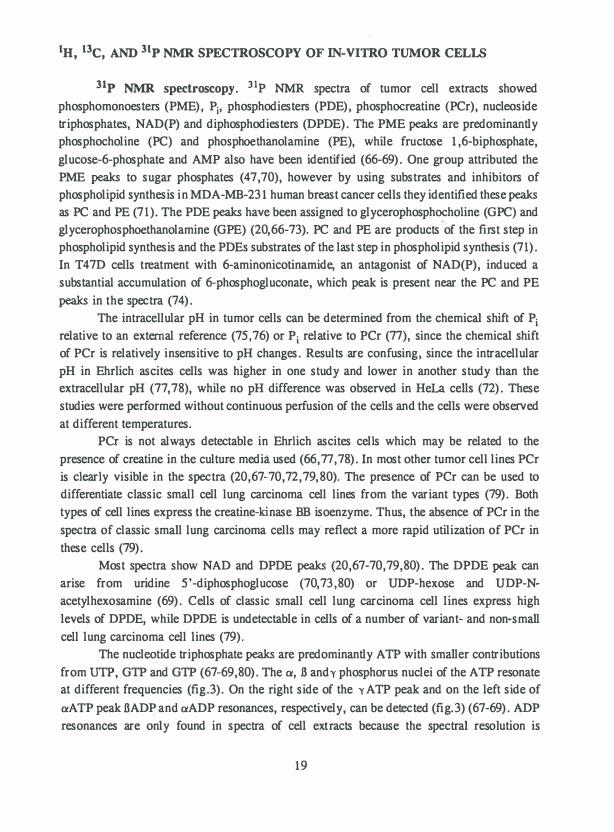
31p NMR spectroscopy. 3 1P NMR spectra of tumor cell extracts showed
phosphomonoesters (PME), Pi, phosphodiesters (PDE), phosphocreatine (PCr), nucleoside
triphosphates, NAD(P) and diphosphodiesters (DPDE). The PME peaks are predominantly
phosphocholine (PC) and phosphoethanolamine (PE), while fructose 1 ,6-biphosphate ,
glucose-6-phosphate and AMP also have been identified (66-69). One group attributed the
PME peaks to sugar phosphates ( 4 7 , 70), however by using substrates and inhibitors of
phospholipid synthesis in MDA-MB-23 1 human breast cancer cells they identified these peaks as PC and PE (7 1). The PDE peaks have been assigned to glycerophosphocholine (GPC) and
glycerophosphoethanolamine (GPE) (20,66-73). PC and PE are products of the first step in
phospholipid synthesis and the PDEs substrates of the last step in phospholipid synthesis (7 1).
In T47D cells treatment with 6-aminonicotinamide, an antagonist of NAD(P), induced a
substantial accumulation of 6-phosphogluconate , which peak is present near the PC and PE
peaks in the spectra (74).
The intracellular pH in tumor cells can be determined from the chemical shift of Pi relative to an external reference (75 , 76) or P i relative to PCr (77), since the chemical shift
of PCr is relatively insensitive to pH changes. Results are confusing , since the intracellular
pH in Ehrlich ascites cells was higher in one study and lower in another study than the extracellular pH (77,78), while no pH difference was observed in HeLa cells (72). These
studies were performed without continuous perfusion of the cells and the cells were observed
at different temperatures.
PCr is not always detectable in Ehrlich ascites cells which may be related to the
presence of creatine in the culture media used (66 , 77 , 78). In most other tumor cell lines PCr
is clearly visible in the spectra (20 ,67-70 ,72 ,79,80). The presence of PCr can be used to
differentiate classic small cell lung carcinoma cell lines from the variant types (79). Both
types of cell lines express the creatine-kinase BB isoenzyme. Thus, the absence of PCr in the
spectra of classic small lung carcinoma cells may reflect a more rapid utilization of PCr in
these cells (79).
Most spectra show NAD and DPDE peaks (20 ,67-70 ,79,80). The DPDE peak can
arise from uridine 5 '-diphosphoglucose (70,73 ,80) or UDP-hexose and UDP-N
acetylhexosamine (69). Cells of classic small cell lung carcinoma cell lines express high
levels of DPDE, while DPDE is undetectable in cells of a number of variant- and non-small
cell lung carcinoma cell lines (79).
The nucleotide triphosphate peaks are predominantly ATP with smaller contributions
from UTP, GTP and GTP (67-69,80). The a, .6 andy phosphorus nuclei of the ATP resonate at different frequencies (fig.3). On the right side of the y ATP peak and on the left side of
aA TP peak .BADP and aADP resonances, respectively , can be detected (fig.3) (67-69). ADP
resonances are only found in spectra of cell extracts because the spectral resolution is
19

enhanced by the addition of EDT A (67-69). To estimate the intracellular ATP level, the peak area of the BATP resonance has to be used. However, several cellular compartments have been described such as mitochondria that might influence the peak intensity of .BATP (81). The relative separations between the fi and ex, and the fi and y peaks of ATP in intact cells are proportional to the amount of ATP bound to Mg2+ (81 ,82). The fraction of total ATP that is not complexed to Mg2+ as well as the free Mg2+ concentration can then be calculated. In Ehrlich ascites tumor cells 12 % of total ATP is unbound to Mg2+ and the intracellular Mg2+ concentration is 0.4 mM (82).
In extracts of adriamycin-induced MDR MCF-7 cells PC and PE are two-fold reduced, GPC and GPE five-fold reduced, PCr five-fold increased and DPDE ten-fold reduced compared to the sensitive MCF-7 cells (70). In several MDR MCF-7 and KB cell lines ATP levels as well as PCr levels are increased in intact cells but not proportionally to the level of resistance (20). Similar results were obtained with MCF-7 and KB cells transfected with the mdr-1 gene (20). Almost no changes are observed in a mdr-1 transfected human melanoma cell line and in a actinomycin D-induced MDR chinese hamster lung carcinoma cell line. Thus, changes in cellular metabolism depend on the drug used to induce MDR. The direction of the changes in PDE in all cell lines studied is not directly resulting from MDR (20). If changes in PCr are characteristic of adriamycin-induced MDR is doubtful, since similar changes are observed between the classic and the variant small cell lung carcinoma cell lines (63,79).
13C NMR spectroscopy. The low natural abundance of 13C limits its utility, because long accumulation times are required. For assignments of specific metabolites in extracts 13C NMR can be useful to monitor these metabolites without spectral overlap. Resonances in the spectra have been assigned to taurine, glycine, alanine, glutamic acid, lactate, PE, PC, creatine and PCr (68,69). Myo-inositol has been detected in adriamycin resistant MCF7 cells and not in the wild-type cells (47). Myo-inositol may be a source for drug conjugation or detoxification (47). The sensitivity of 13C NMR spectroscopy to study metabolism of tumor cells in intact cells and cell extracts can be increased by the addition of 13C labeled metabolites such as [13C1]-glucose (47,84,85).
1H NMR spectroscopy. 1H NMR spectra of fibrosarcoma (RIF-1) tumor cells and of H-29 human colon adenocarcinoma cells (69) have shown various amino acids, nucleotides, creatine, PCr, PE, PC and lactate (68). Some peaks overlap but have been identified for the most part by shift-correlated two-dimensional NMR spectroscopy (68). In intact cells signal resolution is moderate due to the decreased motion of metabolites. Sharp peaks can be obtained by spin echo NMR spectroscopy. This technique improved spectral resolution in intact Friend leukemia cells (86). However, in hybrid neuroblastoma and glioma cells some metabolites had disappeared in the spectra obtained with spin echo NMR spectroscopy compared to regular NMR spectroscopy (87) .
1H NMR spectra ofMCF7 cell extracts show an elevated concentration of PCr, ATP,
20

creatine and ADP in adriamycin-resistant MCF7 cells compared to wildtype cells (88). Choline levels are similar in both cell lines, while PC and PE concentrations are higher in the wild-type cells. These results are similar to results obtained with 3 1P NMR spectroscopy in a previous study (70).
NMR SPECTROSCOPY OF CONTINUOUS PERFUSED TUMOR CELLS
Metabolite levels in intact cells can be continuously monitored by 13C and 31P NMR spectroscopy with various perfusion techniques. In-vitro studies with i�tact cells by NMR
spectroscopy necessitate enclosing a dense cell suspension in a small volume. Cells can be confined into a flat dialysis membrane (69). H-29 cells maintain viable in this system for more than 12 hours. More frequently used techniques consist of cells embedded in agarose gel threads (89,90) or proliferating in basement gel threads (91). Cells can also be cultured on polylysine coated agarose polyacrein microcarrier beads (92).
Gel threads. In the method described by Cohen et al. cells have been embedded in agarose gel threads (89,90). The narrow diameter of the threads allows rapid diffusion of metabolites and drugs, and this perfusion technique enables NMR studies of cellular metabolism. An inlet tube reaches to the bottom of the NMR tube and is wrapped around with a piece of sponge to restrain the threads in a small volume. They have applied this technique to various cell lines (47,70,71 ,79). In a study with human small cell lung cancers it appeared that the signal intensities of PCr did not change relative to the ATP signal intensities for over 24 h (79). Phospholipid metabolism has been observed in MDA-MB-231 cells by the addition of choline, ethanolamine and hemicholinium-3, an inhibitor of choline kinase (71). When the cells grow in media without ethanolamine, the PE resonance is not present in the spectra. However, these cells can still produce phosphatidylethanolamine by decarboxylation of phosphatidylserine. The PDEs have been assigned to GPC and GPE and are substrates of GPC phosphodiesterase, the last step in phospholipid degradation. At logphase there is a 2-fold increase in PC and PE peaks compared to confluency (71). Phosphate transfer rates can be measured in perfused T47D human breast cancer cells embedded in agarose threads by magnetization transfer techniques using 31P NMR spectroscopy (73). It has been estimated, that the creatine kinase reaction (PCr + ADP .... ATP + Cr) and the ATP synthesis from glycolysis contribute 15% each of the ADP to ATP turnover, while the major part of ADP to ATP turnover is contributed by the adenylate kinase reaction (2 ADP .... AMP + ATP) (73).
Quantitative 31P NMR spectra can be obtained from continuously perfused adriamycin-resistant and adriamycin-sensitive MCF7 cells in agarose threads at 37°C and a long repetition time to ensure complete spin relaxation (70). The differences between resistant and sensitive MCF7 cells were comparable with differences observed in extracts of both cell
21

lines (70). The catabolism of [13C]glucose and its major products has been observed by 13C NMR spectroscopy in perfused MCF7 cells (47). [13C]iactate is the only major metabolite Jin wild-type cells, while [13C]lactate and [13C]glucose are major peaks in the adriamycinresistant MCF7 cells. [13C]glucose utilization and [13C]iactate production are 3-fold increased in the adriamycin-resistant MCF7 cells. Using 13C as well as 31P NMR spectroscopy, it has been estimated that 60 % of the ATP production was derived from aerobic glycolysis in both cell lines (47). The effect of the glycolytic inhibitor 2-deoxyglucose on MCF7 cells can be studied by 3 1P and 13c NMR spectroscopy (19,93). The adriamycin-resistant MCF7 cells are 15-fold more sensitive to this glycolytic inhibitor and accumulate 2-deoxyglucose 6-phosphate 2-fold faster and to a higher level than wild-type cells. ATP and PCr depletion occurs to a greater extent and becomes irreversible earlier in resistant cells. 13c NMR spectroscopy of 13C labeled 2-deoxyglucose has confirmed that the phosphorylation rate of 2-deoxyglucose in resistant cells was increased as observed with 31P NMR spectroscopy (93). Basement membrane gel threads are composed of 30 % collagen, 60 % laminin, 5 % nidogen, 3 % heparin sulfate proteoglycan, and 1 % entactin (91). MDA-MB-231 cells embedded in the basement gel threads can be maintained for days under stable growing conditions and be monitored by NMR spectroscopy (91). Agarose gel threads can be used for anchorage independent cells, while the basement gel threads are only useful for anchorage dependent cells.
Agarose microcarrier beads. Anchorage dependent cells can be seeded on polylysine coated agarose polyacrolein microcarrier beads and cultured for several days (92). The effect of estrogen and tamoxifen, an antiestrogen, on the metabolism of estrogen responsive T47D cells has been studied by 13C and 31P NMR spectroscopy (84). The PC and nucleoside diphosphate level is higher in tamoxifen treated cells compared to estrogen treated cells. [13C]glucose has been added to the cells and the synthesis of 13C labeled metabolites was followed in time. The initial rate of [13C]iactate and [13C]glutamate formation are 2-fold reduced in the tamoxifen-treated cells, while [13C]alanine and [13C]glycerol 3-phosphate are undetectable in these cells in contrast to estrogen-treated cells (84). Actinomycin D and cycloheximide, inhibitors of mRNA and protein synthesis respectively, prevent the estrogeninduced changes in glucose metaboli�m of tamoxifen-treated cells as observed with 13C NMR spectroscopy after [13C]glucose has been added to the culture medium (85) . Adriamycin, daunomycin and actinomycin D induce an increase in the concentration of high energy phosphates (NTP) and a decrease in Pi concentration in these cells (80,85). An increase to 30-50 % was reached within 6 to 8 h after treatment and was mainly due to a specific increase in ATP and GTP. Cytosine arabinofuranoside or cisplatin did not induce an increase in NTP levels (80).
22
TUMOR METABOLISM IN ANIMALS OBSERVED BY 31P NMR SPECTROSCOPY
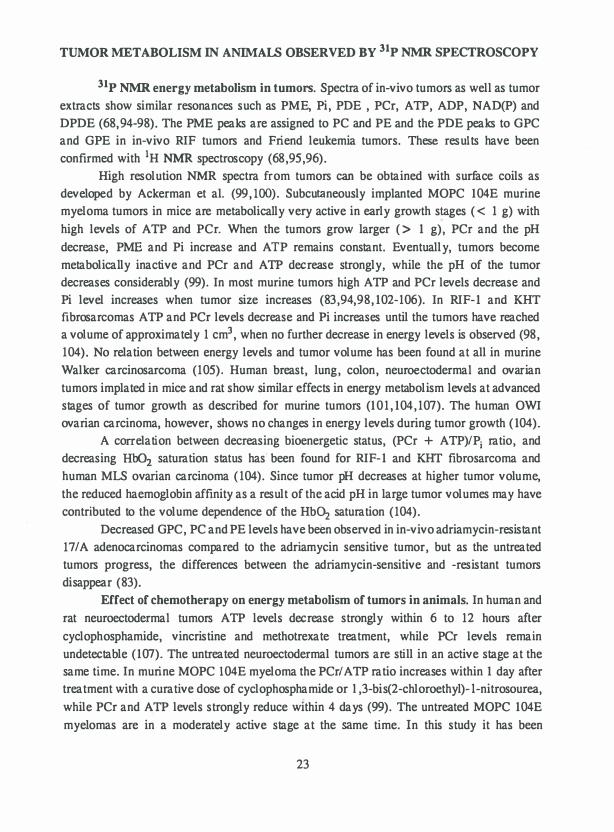
31 P NMR energy metabolism in tumors. Spectra of in-vivo tumors as well as tumor
extracts show similar resonances such as PME, Pi , PDE , PCr, ATP , ADP , NAD(P) and
DPDE (68,94-98). The PME peaks are assigned to PC and PE and the PDE peaks to GPC
and GPE in in-vivo RIF tumors and Friend leukemia tumors. These results have been
confirmed with 1H NMR spectroscopy (68 ,95 ,96).
High resolution NMR spectra from tumors can be obtained with surface coils as
developed by Ackerman et al. (99 , 100). Subcutaneously implanted MOPC 104E murine
myeloma tumors in mice are metabolically very active in early growth s!3-ges ( < 1 g) with
high levels of ATP and PCr. When the tumors grow larger ( > 1 g) , PCr and the pH
decrease , PME and Pi increase and ATP remains constant . Eventually, tumors become
metabolically inactive and PCr and ATP decrease strongly, while the pH of the tumor
decreases considerably (99). In most murine tumors high ATP and PCr levels decrease and
Pi level increases when tumor size increases (83 ,94,98 , 102-106). In RIF- 1 and KHT fibrosarcomas ATP and PCr levels decrease and Pi increases until the tumors have reached
a volume of approximately 1 cm3, when no further decrease in energy levels is observed (98 ,
104). No relation between energy levels and tumor volume has been found at all in murine
Walker carcinosarcoma (105) . Human breast , lung , colon , neuroectodermal and ovarian
tumors implated in mice and rat show similar effects in energy metabolism levels at advanced
stages of tumor growth as described for murine tumors (101, 104 ,107). The human OWI
ovarian carcinoma, however , shows no changes in energy levels during tumor growth ( 104) .
A correlation between decreasing bioenergetic status, (PCr + ATP)/Pi ratio , and
decreasing Hb02 saturation status has· been found for RIF- 1 and KHT fibrosarcoma and
human MLS ovarian carcinoma (104). Since tumor pH decreases at higher tumor volume,
the reduced haemoglobin affinity as a result of the acid pH in large tumor volumes may have
contributed to the volume dependence of the HbC>i saturation (104).
Decreased GPC , PC and PE levels have been observed in in-vivo adriamycin-resistant
17 I A adenocarcinomas compared to the adriamycin sensitive tumor , but as the untreated
tumors progress, the differences between the adriamycin-sensitive and -resistant tumors
disappear (83).
Effect of chemotherapy on energy metabolism of tumors in animals. In human and
rat neuroectodermal tumors ATP levels decrease strongly within 6 to 12 hours after
cyclophosphamide , vincristine and methotrexate treatment , while PCr levels remain
undetectable (107). The untreated neuroectodermal tumors are still in an active stage at the
same time. In murine MOPC 104E myeloma the PCr/ATP ratio increases within 1 day after
treatment with a curative dose of cyclophosphamide or l ,3-bis(2-chloroethyl)-l-nitrosourea,
while PCr and ATP levels strongly reduce within 4 days (99). The untreated MOPC 104E
myelomas are in a moderately active stage at the same time. In this study it has been
23

concluded, that the changed PCr/ ATP ratio must partially reflect the effect of the chemotherapy on energy metabolism within the tumor cells (99). ATP/Pi and PCr/Pi ratios in murine adriarnycin-sensitive mammary 17/A adenocarcinoma (83), RIF-1 fibrosarcoma (98), 9L gliosarcoma (103) and MXT mammary carcinoma (108) were increased after adriarnycin, cyclophosphamide, 1,3-bis(2-chloroethyl)-1-nitrosourea and cyclophoshamide treatment, respectively. The increase of these ratios after treatment has been explained by reenergization of the tumor, while untreated control tumors in these studies show declining ATP and PCr levels (83,98, 103, 108). Histology of 9L gliosarcomas shows that treated tumors have increased viable/necrotic cell ratio and a higher level of interstitial space compared to untreated tumors (103) . Thus, the occurrence of a reduction in ATP levels in some tumors (99, 107), and an increase in others after chemotherapy (83,98, 103 , 108) may be explained by differences in metabolic stage of the tumors when chemotherapy was started .
No differences in phosphorus metabolites have been observed between adriamycin treated and untreated adriamycin-resistant mammary 17 I A adenocarcinoma, while adriamycin had a large effect on the adriamycin-sensitive tumor as described above (83 , 102).
TUMOR METABOLISM IN HUMAN OBSERVED BY 31p NMR SPECTROSCOPY
Spectra of extracts of malignant and benign human breast tumors have been compared with spectra of extracts of noninvolved breast parenchymal specimens (109) and spectra of extracts of human malignant colon tumor tissues with its normal counterpart (1 10). Spectra of extracts of malignant and benign human tumors show major peaks that have been assigned to PE, PC, PCr, ADP, ATP, NAD(P) and DPDE (109, 1 10). Assignments are similar to those described for experimental tumors and tumor cell lines. In addition, a number of peaks near the PE and PC peaks have been detected . Significant changes in malignant and benign versus noninvolved tissue extracts have been found in the relative percentage of a-glycerol phosphate, 2,3-diphosphoglycerate, PE, GPE and PCr (109). The relative percentage of PME have been increased in malignant tumors relative to noninvolved tissue. PCr was elevated in benign tumors compared to malignant tumors and therefore benign tumors may be more aerobic (109). In malignant colon tumors relative percentage of ATP and PCr are decreased, while PMEs and PDEs are increased compared to normal colon tissue ( 1 10). The presence of glycerol-3-phosphogl ycerol, glycerol-3-phosphoserine and glycerol-3-phosphoinosi tol may represent a measurement of phospholipid metabolism in malignant colon tumors ( 1 10). PME, Pi, PDE, PCr and ATP resonances are observed in spectra of in-vivo tumors of patients (1 1 1-1 14). Some of these tumors have elevated PME levels compared to the tissue of origin which may be of diagnostic value (109, 1 10, 1 12-114), although this is not a universal feature of human tumors (65 , 1 1 1, 1 13). Till now only a few especially preliminary data are available of human tumor responses to chemotherapy observed by 31P NMR spectroscopy. These
24
tumors show increased as well as decreased ATP, PCr and PME levels (63-65, 1 1 1, 1 12, 1 14).
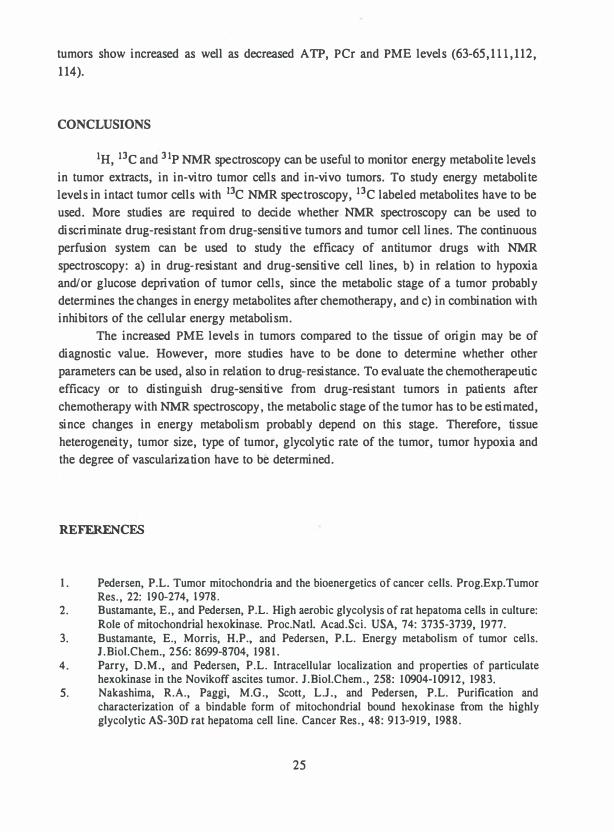
CONCLUSIONS
1H, 13c and 3 1P NMR spectroscopy can be useful to monitor energy metabolite levels
in tumor extracts, in in-vitro tumor cells and in-vivo tumors. To study energy metabolite
levels in intact tumor cells with 13C NMR spectroscopy, 13C labeled metabolites have to be
used. More studies are required to decide whether NMR spectrosco�y can be used to
discriminate drug-resistant from drug-sensitive tumors and tumor cell lines. The continuous
perfusion system can be used to study the efficacy of antitumor drugs with NMR spectroscopy: a) in drug-resistant and drug-sensitive cell lines, b) in relation to hypoxia
and/or glucose deprivation of tumor cells , since the metabolic stage of a tumor probably
determines the changes in energy metabolites after chemotherapy, and c) in combination with
inhibitors of the cellular energy metabolism.
The increased PME levels in tumors compared to the tissue of origin may be of
diagnostic value. However, more studies have to be done to determine whether other
parameters can be used, also in relation to drug-resistance. To evaluate the chemotherapeutic
efficacy or to distinguish drug-sensitive from drug-resistant tumors in patients after
chemotherapy with NMR spectroscopy , the metabolic stage of the tumor has to be estimated,
since changes in energy metabolism probably depend on this stage. Therefore, tissue
heterogeneity, tumor size, type of tumor, glycolytic rate of the tumor, tumor hypoxia and
the degree of vascularization have to be determined.
REFERENCES
1 . Pedersen, P .L. Tumor mitochondria and the bioenergetics of cancer cells. Prog.Exp. Tumor Res. , 22: 190-274, 1 978.
2. Bustamante, E., and Pedersen, P.L. High aerobic glycolysis of rat hepatoma cells in culture: Role of mitochondrial hexokinase. Proc.Natl. Acad.Sci. USA, 74: 3735-3739, 1977.
3. Bustamante, E., Morris, H.P., and Pedersen, P.L. Energy metabolism of tumor cells. J .Biol.Chem., 256: 8699-8704, 1981 .
4. Parry, D.M., and Pedersen, P.L. Intracellular localization and properties of particulate hexokinase in the Novikoff ascites tumor. J.Biol.Chem., 258: 10904-10912, 1983.
5. Nakashima, R.A., Paggi, M.G., Scott, L.J. , and Pedersen, P.L. Purification and characterization of a bindable form of mitochondrial bound hexokinase from the highly glycolytic AS-300 rat hepatoma cell line. Cancer Res. , 48: 9 13-919, 1988.
25

6. Pouyss�gur, I . , Franchi, A. , Salomon, J.-C. , and Silvestre, P. Isolation of a Chinese hamster fibroblast mutant defective in hexose transport and aerobic glycolysis: Its use to dissect the malignant phenotype. Proc. Natl .Acad.Sci. USA, 77: 2698-2701 , 1980.
7 . Zielke, H .R., Zielke, C.L., and Ozand, P.T. Glutamine: a major energy source fo r cultured mammalian cells. Federation Proc. , 43: 121-125, 1984.
8. Reitzer, L.I . , Wice, B.M., and Kennell, D. Evidence that glutamine, not sugar, is the major source for cultured HeLa cells. I.Biol .Chem., 254: 2667-2676, 1979.
9. Wice, B.M., Reitzer, L.I . , and Kennell, D. The continuous growth of vertebrate cells in the absence of sugar. I .Biol .Chem., 256: 7812-7819, 1981 .
10. Reitzer, L.J. , Wice, B.M., and Kennell, D. The pentose cycle. I .Biol. Chem. , 255: 5616-5626, 1980.
1 1 . Eggleston, L.V., and Krebs, H.A. Regulation of the pentose phosphate cycle. Biochem.J., 1 38: 425-435, 1974.
12. Rosemeyer, M.A. The biochemistry of glucose-6-phosphate dehydrogenase, 6-phosphogluconase and glutathione reductase. Cell Biochem.Funct. , 5: 79-95, 1987.
1 3. Broxterman, H .J . , Pinedo, H.M. , Kuiper, C.M., Schuurhuis, G.J . , and Lankelma, J. Glycolysis in P-glycoprotein-overexpressing tumor cell l ines. Effects of resistance-modifying agents. FEBS Lett. , 247: 405-410, 1989.
14. Nakashima, R.A., Paggi, M.G., and Pedersen, P.L. Contributions of glycolysis and oxidative phosphorylation to adenosine 5'-triphosphate production in AS-300 hepatoma cells. Cancer Res . , 44: 5702-5706, 1984.
1 5. Mariottini, P . , Chomyn, A. , Riley, M., Cottrell, B. , Doolittle, R.F., and Attardi, G. Identification of the polypeptides encoded in the unassigned reading frames 2, 4, 4L, and 5 of human mitochondrial DNA. Proc.Natl. Acad.Sci . USA, 83: 1563-1567, 1986.
16. Summerhays, I.C., Lampidis, T.J . , Bernal, S.D., Nadakavukaren, J.J. , Nadakavukaren, K.K., Shephard, S.D., and Chen, I.B. Unusual retention of rhodamine 123 by mitochondria in muscle and carcinoma cells. Proc.Natl. Acad.Sci. USA, 79: 5292-5296, 1982.
17. Van den Bogert, C., Muus, P . , Haanen, C. , Pennings, A., Melis, T.E. , and Kroon, A.M. Mitochondrial biogenesis and mitochondrial activity during the progression of the cell cycle of human leukemic cells. Exp.Cell Res. , 178: 143-153, 1988.
1 8. Olivotto, M. , and Paoletti, F. The role of respiration in tumor cell transition from the noncycling to the cycling state. I.Cell Physiol . , 107: 243-249, 1981 .
19. Kaplan, 0., Navon, G. , Lyon, R.C., Faustino, P.J . , Straka, E.J . , and Cohen, J .S. Effects of 2-deoxyglucose on drug-sensitive and drug-resistant human breast cancer cells: Toxicity and magnetic resonance spectroscopy studies of metabolism. Cancer Res., 50: 544-551 , 1990.
20. Kaplan, 0., Jaroszewski, J.W., Clarke, R., Fairchild, C.R., Schoenlein, P., Goldenberg, S . , Gottesman, M.M., and Cohen, J .S . The multidrug resistant phenotype: 31P nuclear magnetic resonance characterization and 2-deoxyglucose toxicity. Cancer Res . , 51 : 1638-1644, 199 1 .
2 1 . Modica-Napolitano, J.S., Steele, G.D., and Chen, L.B. Aberrant mitochondria in two human colon carcinoma cell l ines. Cancer Res. , 49: 3369-3373, 1989.
22. Floridi, A. , Paggi, M.G., Mat·cante. M.L., Silvestrini, B. , Caputo, A. , and De Martino, C. Lonidamine, a selective inhibitor of a•:1 ubic glycolysis of murine tumor cells. J .Natl .Cancer Inst. , 66: 497-499, 1980.
23. Floridi, A., Paggi, M.G., D'Atri, S., De Martino, C., Marcante, M.L. , Silvestrini, B., and Caputo, A. Effects of lonidamine on the energy metabolism of Ehrlich ascites tumor cells. Cancer Res. , 41 : 4661-4666, 1981 .
24. Rosbe, K.W., Brann, T.W. , Holden, S .A. , Teicher, B.A., and Frei III, E. Effect of lonidamine on the cytotoxicity of four alkylating agents in vitro. Cancer Chemother.Pharmacol. , 25: 32-36, 1989.
25. Lampidis, T.J . , Bernal, S.D., Summerhayes, I.C., and Chen, L.B. Selective toxicity of rhodamine 123 in carcinoma cells in vitro. Cancer Res., 43: 7 16-720, 1983.
26

26. Modica-Napolitano, J .S. , and Aprille, J.R. Basis for the selective cytotoxicity of rhodamine 123. Cancer Res . , 47: 4361-4365, 1987.
27. Tuszynski, G.P. , and Cossu, G. Differential cytotoxic effect of gossypol on human melanoma, colon carcinoma, and other tissue culture cell lines. Cancer Res . , 44: 768-771 , 1984.
28. Benz, C., Hollander, C . , Keniry, M., James, T.L., and Mitchell, M. Lactic dehydrogenase isozymes, 3 1P magnetic resonance spectroscopy, and in vitro antimitochondrial tumor toxicity with gossypol and rhodamine-123. J.Clin. Invest. , 79: 5 17-523, 1987.
29. Van den Bogert, C. , Dontje, B.H.J., Wybenga, J .J . , and Kroon, A.M. Arrest of in vivo proliferation of Zajdela tumor cells by inhibition of mitochondrial protein synthesis. Cancer Res . , 4 1 : 1943-1947, 1981 .
30. Van den Bogert, C. , Dontje, B.H.J., and Kroon, A.M. Arrest of in vivo growth of a solid Leydig cell tumor by prolonged inhibition of mitochondrial protein synthesis. Cancer Res . , 43: 2247-2251 , 1983.
31 . Van den Bogert, C . , Dontje, B.H.J., Holtrop, M. , Melis, T.E., Romijn, J .C . , Van Dongen, J.W., and Kroon, A.M. Arrest of the proliferation ofrenal and prostate carcinomas of human origin by inhibition of mitochondrial protein synthesis. Cancer Res . , 46: 3283-3289, 1986.
32. Segal-Bendirdjian, E. , Couland, D. , Roques, B.P., and Le Pecq, J-B. Selective loss of mitochondrial DNA after treatment of cells with ditercalinium (NSC 3351 53), an antitumor bis-intercalating agent. Cancer Res . , 48: 4982-4992, 1988.
33. Ishida, R., Nishizawa, N., Kothani, F., and Takahashi, T. Biochemical and genetic analysis of toxic effect of HOE 15030 in mammalian cells. Somat. Cell Mol.Genet. , 1 5: 279-288, 1989.
34. Fairfield, F.R., Bauer, W.R., and Simpson, M.V. Studies on mitochondrial type I topoisomerase and on its function. Biochim.Biophys.Acta, 824: 45-47, 1985.
35. Lazarus, G.M., Henrich, J.P., Kelly, W.G., Schmitz, S .A. , and Castora, F.J. Purification and characterization of a type I DNA topoisomerase from calf thymus mitochondria. Biochemistry, 26: 6195-6203, 1987.
36. Van den Bogert, Dontje, B.H.J., and Kroon, A.M. Doxycycline in combination chemotherapy of a rat leukemia. Cancer Res . , 48: 6686-6690, 1988.
37. Endirott, J .A. , and Ling, V. The biochemistry of P-glycoprotein-mediated multidrug resistance. Ann.Rev.Biochem. , 58: 137-17 1 , 1989.
38. Horio, M., Gottesman, M.M., and Pastan, I. ATP-dependent transport of vinblastine in vesicles from human multidrug-resistant cells. Proc.Natl. Acad.Sci. USA, 85: 3580-3584, 1988.
39. Luk, C.K., Veinot-Drebot, L., Tjan, E., and Tannock, I.F. Effect of transient hypoxia on sensitivity to doxorubicin in human and murine cell lines. I .Natl.Cancer Inst. , 82: 684-692, 1990.
40. Wright, L.C., Dyne, M., Holmes, K.T., Romeo, T., and Mountford, C.E. Cellular resistance to vinblastine is associated with altered respiratory function. Biochem.Int., 1 3: 295-305, 1986.
4 1 . Keizer, H.G. , and Joenje, H. Increased cytosolic p H i n multidrug-resistant human lung tumor cells: Effect of verapamil. I .Natl .Cancer Inst . , 8 1 : 706-709, 1989.
42. Batist, G., Tulpule, A. , Sinha, B.K., Katki, A .G. , Myers, C.E., and Cowan, K.H. Induction of an anionic glutathione-S-transferase in multi-drug resistant human breast cancer cells and in xenobiotic resistant preneoplastic liver nodules induced by carcinogens. J .Biol.Chem., 261 : 1 55444-15549, 1986.
43. Sinha, B.K., Katki, A.G. , Batist, G. , Cowan, K.H., and Myers, C.E. Differential formation of hydroxyl radicals by adriamycin in sensitive and resistant MCT-7 human breast tumor cells: implications for the mechanism of action. Biochemistry, 26: 3776-3781 , 1987.
2 7

44. Yeh, G.C., Occhipinti, S .J. , Cowan, K.H. , Chabner, B.A., and Myers, t .E. Adriamycin resistance in human tumor cells associated with marked alterations in the regulation of the hexose monophosphate shunt and its response to oxidant stress. Cancer Res. , 47: 5994-5999, 1987.
45. Kramer, R.A., Zakher, J., and Kim, G. Role of the glutathione redox cycle in acquired and de novo multidrug resistance. Science {Wash. , DC), 241 : 694-696, 1988.
46. Cowan, K.H. , Batist, G., Tulpule, A., Sinha, B.K., and Myers, C.E. Similar biochemical changes associated with multidrug resistance in human breast cancer cells and carcinogeninduced resistance to xenobiotics in rats. Proc.Natl .Acad.Sci. U.S.A., 83: 9328-9332, 1986.
47. Lyon, R.C., Cohen, J.S. , Faustino, P.J., Megnin, F. , and Myers, C.E. Glucose metabolism in drug-sensitive and drug-resistant human breast cancer cells monitored by magnetic resonance spectroscopy. Cancer Res. , 48: 870-877, 1988.
48. Gessner, T. , Vaughan, L.A., Beehler, B.C., Bartels, J., and Baker, R.M. Elevated pentose cycle and glucuronyltransferase in daunorubicin-resistant P388 cells. Cancer Res. , 50: 393 1-3927, 1990.
49. Keizer, H.G., Schuurhuis, G.J . , Broxterman, H.J., Lankelma, J . , Schoonen, W.G.E.J. , Van Rijn, J . , Pinedo, H.M., and Joenje, H. Correlation of multidrug resistance with decreased drug accumulation, altered subcellular drug distribution, and increased P-glycoprotein expression in cultured SW-1573 human lung tumor cells. Cancer Res., 49: 2988-2993, 1989.
50. Glisson, B., Gupta, R., Smallwood-Kentro, S . , and Ross, W. Characterization of acquired epipodophyllotoxin resistance in a chinese hamster ovary cell line: loss of drug-stimulated DNA cleavage activity. Cancer Res. , 46: 1934-1938, 1986.
5 1 . Estey, E.H., S ilberman, L., Beran, M . , Anderson, B.S., and Zwelling, L.A. The interaction between nuclear topoisomerase II activity from human leukemia cells, exogenous DNA and 4'-(9-acridinylamino)methane-sulfon-m-anisidide (m-AMSA) or 4-(4,6-0-ethylidene-B-Dglycopyranoside) (VP-16) indicates the sensitivity of the cells to the drugs. Biochem.Biophys.Res. Commun. , 144: 787-793, 1987.
52. Pommier, T., Kerrigan, D., Schwartz, R.E., Swack, J.A., and McCurdy, A. Altered DNA topoisomerase II activity in chinese hamster cells resistant to topoisomerase II inhibitors. Cancer Res. 46: 3075-3081 , 1986.
53 . Danks, M.K., Schmidt, C.A., Cirtain, M.C., Suttle, D.P., and Beck, W.T. Altered catalytic activity of and DNA cleavage by DNA topoisomerase II from human leukemic cells selected for resistance to VM-26. Biochemistry, 27: 8861-8869, 1988.
54. Ferguson, P.J., Fisher, M.H., Stephenson, J., Li, D-H. , Zhou, B-S . , and Cheng, Y-C. Combined modalities of resistance in etoposide-resistant human KB cell lines. Cancer Res., 48: 5956-5964, 1988.
55. Shen, J . , Hughes, C., Chao, C., Cai, J., Bartels, C., Gessner, T. , and Subjeck, J. Coinduction of glucose-regulated proteins and doxorubicin resistance in Chinese hamster cells . Proc.Natl .Acad .Sci . U.S.A., 84: 3278-3282, 1987.
56. Hughes, C.S. , Shen, J . , and Suhjeck, J.R. Resistance to etoposide induced by three glucoseregulated stresses in Chinese ovary cells. Cancer Res. , 49: 4452-4454, 1989.
57. Shen, J . , Subjeck, J.R., Lock, R.B. , dud Ross, W.E. Depletion of topoisomerase II in isolated nuclei during glucose-regulated stress response. Mol .Cell.Biol ., 9: 3284-3291 , 1989.
58. Lawrence, T.S., and Davis, M.A. The influence of Na+, K+ -pump blockade on doxorubicinmediated cytotoxicity and DNA strand breakage in human tumor cells. Cancer Chemother.Pharmacol . , 26: 163-167, 1990.
59. Broxterman, H.J., Pinedo, H.M., Kuiper, C.M., Kaptein, L.C.M., Schuurhuis, G.J . , and Lankelma, J. Induction by verapamil of a rapid increase in ATP consumption in multidrugresistant tumor cells. FASEB J. , 2: 2278-2282, 1988.
28
60. Jaroszewski, J.W., Kaplan, 0., and Cohen, J.S. Action of gossypol and rhodamine 123 on wild type and multidrug-resistant MCF-7 human breast cancer cells: 3 1 P nuclear magnetic resonance and toxicity studies. Cancer Res., 50: 6936-6943, 1990.
6 1 . Liu, L.F. DNA topoisomerase poisons as antitumor drugs. Ann.Rev. Biochem., 58: 351 -375, 1989.
62. Kaufman, S.C. Induction of endonucleolytic DNA cleavage in human acute myelogenous leukemia cells by etoposide, camptothecin, and other cytotoxic anticancer drugs: A cautionary note. Cancer Res., 49: 5870-5878, 1989.
63. Daly, P .F., and Cohen, J .S. Magnetic resonance spectroscopy of tumors and potential in vivo clinical applications: a review. Cancer Res. , 49: 770-779, 1989.
64. Steen, R.G. Response of solid tumors to chemotherapy monitored by in vivo 3 1P nuclear magnetic resonance spectroscopy: a review. Cancer Res. , 49: 4075-4085, 1989.
65. Bottemley, P.A. Human in vivo NMR spectroscopy in diagnostic medicine: clinical tool or research probe? Radiology, 170: 1 -15, 1989.
66. Navon, G., Ogawa, S., Shulman, R.G., and Yamane, T. 31P nuclear magnetic resonance studies of Ehrlich ascites tumor cells. Proc.Natl .Acad.Sci. USA, 74: 87-91 , 1977.
67. Evans, F.E., and Kaplan, N.O. 31P nuclear magnetic resonance studies of Hela cells. Proc.Natl .Acad.Sci USA, 74: 4909-4913, 1977.
68. Evanochko, W.T., Sakai, T.T., Ng, T.C., Krishna, N.R., Kim, H.D., Zeidler, R.B., Ghanta, V.K., Brockman, R.W., Schiffer, L.M., Braunschweiger, R.G., and Glickson, J.D. NMR study of in vivo RIF-1 tumors. Analysis of perchloric acid extracts and identification of 1H, 31p and 13C resonances. Biochim.Biophys.Acta, 805: 104-1 16, 1982.
69. Desmoulin, F., Galons, J.P., Canioni, P., Marvaldi, J . , and Cozzone, P.J. 31P nuclear magnetic resonance study of a human colon adenocarcinoma cultured cell line. Cancer Res., 46: 3768-3774, 1986.
70. Cohen, J .S. , Lyon, R.C., Chen, C., Faustino, P.J . , Batist, G . , Shoemaker, M., Rubalcaba, E. , and Cowan, K.H. Differences in phosphate metabolite levels in drug-sensitive and -resistant human breast cancer cell 1 ines determined by 31 P magnetic resonance spectroscopy. Cancer Res. , 46: 4087-4090, 1986.
7 1 . Daly, P.F., Lyon, R.C., Faustino, P.J . , and Cohen, J.S. Phospholipid metabolism i n cancer cells monitored by 31P NMR spectroscopy. I.Biol. Chem., 262: 14875-14878, 1987.
72. Navon, G., Navon, R., Shulman, R.G., and Yamane, T. Phosphate metabolites in lymphoid, Friend erythroleukemia, and HeLa cells observed by high-resolution 3 1P nuclear magnetic resonance. Proc.Natl.Acad.Sci USA, 75: 891-895, 1978.
73. Neeman, M., Rushkin, E., Kaye, A.M., and Degani, H. 31P-NMR studies of phosphate transfer rates in T47D human breast cancer cells. Biochim. Biophys. Acta, 930: 179-192, 1987.
74. Keniry, M.A., Hollander, C., and Benz, C.C. The effect of gossypol and 6-aminonicotinamide on tumor cell metabolism: a 3 1P-magnetic resonance spectroscopic study. Biochem.Biophys.Res.Commun. , 164: 947-953, 1989.
75. Roberts, J.K., Wade-Jardetzky, N., and Jardetzky, 0. Intracellular pH measurements by 3 1p nuclear magnetic resonance. Influence of factors other than pH on 3 1P chemical shifts. Biochemistry, 20: 5389-5394, 198 1 .
76. Moon, R.B . , and Richards, J.H. Deteremination of intracellular pH by 31P magnetic resonance. I.Biol.Chem., 248: 7276-7278, 1973.
77. Yushok, W.D., and Gupta, R.K. Phosphocreatine in Ehrlich ascites tumor cells detected by noninvasive 31P NMR spectroscopy. Biochem.Biophys.Res. Commun. 95: 73-81 , 1980.
78. Gillies, R.J., Ogino, T., Shulman, R.G. , and Ward, D.C. 31P nuclear magnetic resonance evidence for the regulation of intracellular pH by Ehrlich ascites tumor cells. J. Cell Biol., 95: 24-28, 1982.
29

79. Knop, R.H., Carney, D.N., Chen, C. , Cohen, J.S., and Minna, J .D. Levels of high energy phosphates in human lung cancer cell l ines by 3 1P nuclear magnetic resonance spectroscopy. Cancer Res. , 47: 3357-3359, 1987.
80. Neeman, M., Eldar, H. , Rushkin, E., and Degani, H. Chemotherapy-induced changes in the energetics of human breast cancer cells; 3 1 P- and 13C-NMR studies. Biochim.Biophys. Acta 1052: 255-263, 1990.
8 1 . Gupta, R.J. , and Yushok, W.D. Noninvasive 3 1P NMR probes o f free Mg2+, MgATP, and
MgADP in intact Ehrlich ascites tumor cells. Proc.Natl .Acad. Sci. USA, 77: 2487-2491 , 1980.
82. Gupta, R.J . , and Moore, R.D. 3 1P NMR studies of intracellular free Mg2+ in intact frog skeletal muscle. J .Biol .Chem., 255: 3987-3993, 1980.
83. Evelhoch, J .L., Keller, N.A., and Corbett, T.H. Response-specific adriamycin sensitivity markers provided by in vivo 3 1P nuclear magnetic resonance spectroscopy in murine mammary adenocarcinomas. Cancer Res . , 47: 3396-3401 , 1987.
84. Neeman, M., and Degani, H. Metabolic studies of estrogen- and tamoxifen-treated human breast cancer cells by nuclear magnetic resonance spectroscopy. Cancer Res., 49: 589-594, 1989.
85. Neeman, M., and Degani, H. Early estrogen-induced metabolic changes and their inhibition by actinomycin D and cycloheximide in human breast cancer cells: 31P and 13C NMR studies. Proc.Natl .Acad.Sci.USA, 86: 5585-5589, 1989.
86. Agris, P.F., and Campbell, I.D. Proton nuclear magnetic resonance of intact Friend leukemia cells: Phosphorylcholine increase during differentiation. Science, 2 16: 1325-1327.
87. Navon, G., Burrows, H .. and Cohen, J .S. Differences in metabolic levels upon differentiation of intact neuroblastoma X glioma cells observed by proton NMR magnetic resonance spectroscopy. FEBS Lett., 162: 320-323 .
88. Kaplan, 0., van Zijl, P.C., and Cohen, J.S. Information from combined 1H and 31P NMR studies of cell extracts : differences in metabolism between drug-sensitive and drug-resistant MCF-7 human breast cancer cells. Biochem.Biophys.Res.Commun. , 169: 383-90, 1990.
89. Foxall, D.L., and Cohen, J.S. NMR studies of perfused cells. J.Magn. Reson. , 52: 346-349, 1983.
90. Knop, R.H., Chen, C-W., Mitchell, J.B., Russo, A. , McPherson, S. , and Cohen, J .S. Metabolic studies of mammalian cells by 3 1P NMR using a continuous perfusion technique. Biochim.Biophys.Acta, 804: 275-284, 1984.
9 1 . Daly, P.F., Lyon, R.C., Straka, E.J . , and Cohen, J.S. 3 1P-NMR spectroscopy of human breast cancer cells proliferating in a basement membrane gel . FASEB J., 2: 2596-2604, 1988.
92. Neeman, M., Rushkin, E., Kadouri, A. , and Degani, H. Adaption of culture methods for NMR studies of anchorage dependent cells. Magn.Reson.Med. , 7: 236-242, 1988.
93. Navon, G., Lyon, R.C., Kaplan, 0., and Cohen, J.S. Monitoring the transport and phosphorylation of 2-deoxy-D-glucose in tumor cells in vivo and in vitro by 13C nuclear magnetic resonance spectroscopy. FEBS Lett., 247 : 86-90, 1989.
94. Sijens, P.E., Bovee, W.M.M.J., Seijkens, D. , Los, G., and Rutgers, D.H. In vivo 3 1P-nuclear magnetic resonance study of the response of a murine mammary tumor to different doses of gamma-radiation. Cancer Res., 46: 1427-1432, 1986.
95. Proietti, E. , Carpinelli, G., Di Vito, M., Belardelli, F., Gresser, I., and Podo, F. 3 1P-nuclear magnetic resonance analysis of interferon-induced alterations of phospholipid metabolites in interferon-sensitive and interferon-resistent Friend leukemia cell tumors in mice. Cancer Res . , 46: 2849-2857, 1986.
96. Podo, F. , Carpinelli, G., Di Vito, M., Giannini, M., Proietti, E., Fiers, W., Gresser, I., and Belardelli, F. Nuclear magnetic resonance analysis of tumor necrosis factor-induced alterations of phospholipid metabolites and pH in Friend leukemia cell tumors and fibrosarcomas in mice. Cancer Res. , 47: 6481-6489, 1987.
30

97. Sijens, P.E. , Bovee, W.M.M.J . , Seijkens, D. , Koole, P., Los, G . , and Rutgers, D.H. Murine mammary tumor response to hyperthermia and radiotherapy evaluated by in vivo 31P-nuclear magnetic resonance spectroscopy. Cancer Res . , 47: 6467-6473, 1987.
98. Li, S .I . , Wehrle, J.P., Rajan, S .S . , Steen, R.G., Glickson, J .D., and Hilton, J . Response of radiation-induced fibrosarcoma-1 in mice to cyclophosphamide monitored by in-vivo 31P nuclear magnetic resonance spectroscopy. Cancer Res. , 48: 4736-4742, 1988.
99. Ng, T.C., Evanochko, W.T., Hiramoto, R.N., Ghanta, V.K., Lilly, M.B., Lawson, A.J., Corbett, T.H., Durant, J.R. , and Glickson, J.D. 31P NMR spectroscopy of in vivo tumors. J .Magn.Reson. , 49: 271 -286, 1982.
100. Ackerman, J.J.H. , Grove, T.H., Wong, G.G. , Gadian, D.G. , and Radda, G.K. Mapping of metabolites in whole animals by P-3 1 NMR using surface coils. Nature, 283: 167-170, 1980.
101 . Evanochko, W.T., Ng, J.C., Glickson, l.D., Durant, J.R., and Corbett, T.H. Human tumors as examined by in vivo 31P NMR in athymic mice. Biochem.Biophys.Res.Commun., 109: 1346-1352, 1982.
102. Evanochko, W.T., Ng, J.C. , Lilly, M.B., Lawson, A.I., Corbett, T.H., Durant, J.R., and Glickson, l .D. In vivo 3 1P-NMR study of the metabolism of murine mammary 16/c adenocarcinomas and its response to chemotherapy, X-radiation, and hyperthermia. Proc.Natl.Acad.Sci. USA, 80: 334-338, 1983.
103. Steen, R.G., Tamargo, R.J . , McGovern, K.A., Rajan, S .S . , Brem, H. , Wehrle, J.P., and Glickson, J.D. In-vivo 31P nuclear magnetic resonance spectroscopy of subcutaneous GL gliosarcoma: effects of tumor growth and treatment with l ,3-bis(2-chloroethyl)-l -nitrosurea on tumor bioenergetics and histology. Cancer Res. , 48: 676-681 , 1988.
104. Rofstad, E.K., DeMuth, P., Fenton, B.M., and Sutherland, R.M. 31P nuclear magnetic resonance spectroscopy studies of tumor energy metabolism and its relationship to intracapillary oxyhemoglobin saturation status and tumor hypoxia. Cancer Res., 48: 5440-5446, 1988.
105. Stubbs, M. , Rodrigues, L.M. , and Griffiths, J.R. Growth studies of subcutaneous rat tumours: comparison of31P NMR spectroscopy, acid extracts and histology. Br.I.Cancer, 60: 701-707, 1989.
106. Buckman, D.K., Erickson, K.L., and Ross, B.D. Dietary fat modulation of murine mammary tumor metabolism studied by in vivo 31P nuclear magnetic resonance spectroscopy. Cancer Res . , 47: 563 1-5636, 1987.
107. Naruse, S . , Hirakawa, K., Horikawa, Y., Tanaka, C., Higuchi, T. , Ueda, S . , Nishikawa, H. , and Watari, H. Measurements of in vivo 31P nuclear magnetic resonance spectra in neuroectodermal tumors for the evaluation of the effects of chemotherapy. Cancer Res. , 45: 2429-2433, 1985.
108. Scheiber, C., Kiss, R., De Launoit, Y., Sijens, P., and Fruhling, I. Influence of hormonoand/or chemotherapy on the MXT mouse mammary tumor as monitored by 31P MRS. Eur.I .Cancer, 26: 244-251 , 1990.
109. Merchant, T.E., Gierke, L.W., Meneses, P. , and Glonek, T. 31P magnetic resonance spectroscopic profiles of neoplastic human breast tissues. Cancer Res . , 48: 5 1 12-5 1 18, 1988.
1 10. Kasimos, J.N., Merchant, T.E., Gierke, L.W., and Glonek, T. 31P magnetic resonance spectroscopy of human colon cancer. Cancer Res. , 50: 527-532, 1990.
1 1 1 . Ross, B . , Marshall , V., Smith, M., Barlett, S . , and Freeman, D . Monitoring response to chemotherapy of intact human tumours by 31P nuclear magnetic resonance. Lancet, 1 : 641-646, 1984.
1 12. Maris, J.M., Evans, A.E., McLaughlin, A.D., D'Angio, G.J., Bolinger, L. , Manos, H. , and Chance, B. 31P nuclear magnetic resonance spectroscopic investigation of human neuroblastoma in situ. N.Engl.J.Med . , 3 12: 1500-1505, 1985.
3 1
1 13 . Oberhaensli, R., Hilto-Iones, D. , Bore, P. , Hands, L., Rampling, R.P. , and Radda, G .K. Biochemical investigation of human tumours in vivo with phosphorus-3 1 magnetic resonance spectroscopy. Lancet, 2 : 8-1 1 , 1986.
1 14. Semmler, W., Gademann, G., Bachert-Baumann, P., Zabel, H.J., Lorenz, W.J., and Van Kaick, G. Monitoring human tumor response to therapy by means of P-3 1 MR spectroscopy. Radiology, 166: 533-539, 1988.
32

Chapter 2
INCREASED SENSITIVITY OF AN ADRIAMYCIN
RESISTANT HUMAN SMALL CELL LUNG
CARCINOMA CELL LINE TO MITOCHONDRIAL
INHIBITORS
S. de Jong 1 , M . Holtrop2, H . de Vries2, E .G.E. de Vries 1 and N.H. Mulder1 •
From the Division of Medical Oncology, Department of Internal Medicine1,
from the Department of Physiological Chemistry2, University of Groningen,
the Netherlands.
SUMMARY
The energy metabolism of an atypical multidnig resistant human small cell lung
carcinoma cell line (GLC/ADRJ was studied. The glycolytic rate was 30% reduced and the glucose-6-phosphate dehydrogenase activity 2-fold increased in GLC/ADR compared to the parental sensitive line (GLC.,). Although mitochondrial respiration activities were similar in
both cell lines, GLC/ADR was more sensitive to the antimitochondrial drugs doxycycline and
oligomycin, while cross-resistance was observed for the glycolytic inhibitor 2-deoxyglucose
and for the antimitochondrial drug rhodamine-123. Continuous incubation with doxycycline
induced a dramatic reduction of mitochondrial mRNAs in both cell lines, whereas a strong
reduction of the nuclear-coded mRNA for subunit IV of cytochrome c oxidase was induced
in GLC41ADR only. Incubation with doxycycline had an additive effect on the cytotoxicity of
adriamycin in both cell lines. Thus, a form of collateral sensitivity to antimitochondrial drugs may exist in atypical multidrug resistant cell lines.
33

INTRODUCTION
In adriamycin-resistant tumor cells changes in energy metabolism can occur due to the presence of energy-depending resistance mechanisms such as an increased detoxification capacity (1-3) and the overexpression of a 170 kD P-glycoprotein wich functions as an energy-dependent drug efflux pump (4,5). Both mechanisms can be involved in the so-called multidrug resistance (MDR).
Therefore, we have performed studies on the energy metabolism of an adriamycinresistant cell line GLC4/ ADR, that does not overexpress the P-glycoprotein, and of its sensitive parental cell line GLC4• In cells of this atypical MDR cell line GLC4/ ADR drug accumulation and Topo II is reduced, while there are no indications of an increased free radical detoxification capacity (6-8). In order to circumvent this atypical MDR, the sensitivity to inhibitors of the energy metabolism was determined in both cell lines, since changes in the glycolytic rate or the mitochondrial activity could make GLC4/ ADR cells more sensitive to inhibitors of glycolysis or to inhibitors of the mitochondrial activity, respectively, compared to GLC4 as was observed previously in a MDR cell line (3) as well as in other drug-resistant cell lines (9, 10).
MATERIALS AND METHODS Materials. Doxycycline was purchased from Sigma, oligomycin from Boehringer
Mannheim, adriamycin from Farmitalia Carlo Erba, rhodamine-123 from Kodak, and 2-deoxyglucose from Aldrich Chemicals.
Cell Lines. GLC4/ ADR was made resistant by stepwise increasing concentrations of adriamycin, until the cells were growing at a continuous drug level of 1 . 18 µM (6). Prior to experimental use, GLC4/ ADR was cultured without adriamycin for 20 days, at which time the resistance factor was maximal (8) . GLC4/ ADR and GLC4 grew in suspension culture and were cultured in RPMI 1640 medium (Gibco) supplemented with 10% fetal calf serum (FCS, Flow Lab) at 37°C in a humid atmosphere with 5 % C02• Doubling times for GLC4 and GLC4/ADR are 15 and 18 h, respectively (7). Cell lines were free of mycoplasma contamination as tested with Hoechst stain 33258.
Lactate and ATP measurements. Exponentially growing cells were harvested and washed twice in RPMI 1640 medium supplemented with 10% dialyzed FCS and resuspended in the same medium at a cell density of 1 .5xH>6 cells/ml. In RPMI 1640 medium 2 mM Lglutamine and 1 1. 1 mM D-glucose were included. Culture media and cells that were harvested at 4°C and washed once in ice-cold phosphate buffered saline were extracted with perchloric acid and supernatants neutralized with KOH and stored at -2D°C until assayed. Lactate concentrations in culture media and the intracellular ATP concentrations were determined enzymatically as described (1 1 , 12).
Oxygen consumption. Oxygen consumption rates were determined polarographically
34

at 30°C using a Clark-type electrode (Yellow Springs Instruments, OH) by the method of Nakashima (13) connected to a chart recorder which was calibrated between 0 and 100% saturation with nitrogen gas and atmospheric oxygen, respectively, at 3C>°C. The chart results were converted to ng atoms of oxygen/min using a conversion factor of 435 ng-atoms of oxygen/ml (13) .
Enzyme measurements. Exponentially growing cells were seeded at lxle>5 cells/ml and cultured in RPMI 1640 medium supplemented with 10% PCS at 37°C. At fixed points flasks were taken for enzyme measurements and for cell counting by hemocytometer using trypan blue exclusion. Cells were washed three times in phosphate-buffered saline and stored at -20°C before G6PD and cytochrome c oxidase activities were determined by spectrophotometric measurements at 2C>°C as described (14, 15). Protein concentrations were measured with the method of Bradford (16).
Drug sensitivity assay. Cells were seeded at lx lOS cells/ml in flasks and after the drug was added for continuous incubation, placed at 37°C in a humid atmosphere containing 5 % C02• Based on doubling times, cells were counted by hemocytometer after three days for GLC4 or four days for GLC4/ ADR. Trypan blue exclusion was used as an indicator of viable cells.
Northern blotting. Total cellular RNA was isolated from cells that were washed three �imes in phosphate-buffered saline and stored at -20°C according to the method of Bimboim (17). RNA samples were glyoxalated and run in 1 .25 % agarose gel in 10 mM sodium phosphate buffer pH 6.5. RNA was blotted on Gene Screen Plus. Hybridization at 37°C was performed as described previously (18). The probes were labelled with -[32P]-dCTP using the random primer technique (19). Hybridization probes used were: a cloned Xbal fragment of human placental mitochondrial DNA containing the entire gene for subunit II of cytochrome c oxidase (Cox II) ; a cDNA clone for the nuclear-coded subunit IV of human cytochrome c oxidase (Cox IV), a kind gift from Dr.M.Lomax; a cloned Xba I fragment of human placental mitochondrial DNA containing a significant part of the mitochondrial 16 S and 12 S genes; a plasmid containing the Xenopus laevis 28 S and 18 S rRNA genes, a kind gift from Dr.K.Kok.
Statistics. All results were expressed as means ± SD. Statistical significance was determined by use of the Student's t-test.
RESULTS
The rate of lactate production was 30% decreased in GLC4/ADR (table 1), while the omission of L-glutamine from the medium had no effect on the lactate production in both cell lines (results not shown). Probably, glutamine oxidation was inhibited by the high glucose concentration in this culture medium (10 mM) (20). Cellular ATP levels and the cellular
35

Table 1. Lactate production and ATP levels and oxygen consumption in GLC4 and
GLC4/ADR.
Lactate production1
ATP level
Controls
at 37°C at 30"C
+ oligomycin (12.5 µg/ml)
+ DNP (75 µM)
RCR
1) Expressed per min.
nmol/ lcl6 cells 1 1 . 13 ± 1 .02 (10)2 7.99 ± 0.8 1 (10)3 10.32 ± 1 .40 (6) 7.68 ± 0.68 (6)3 6.05 ± 0.56 (10) 6.03 ± 0.44 (12)
ng-atoms of oxygen/min/lcl6 cells 3 .43 ± 0.62 (5) 3 .28 ± 0.48 (6) 1 .04 ± 0.30 (5) 0.83 ± 0.24 (6) 4.66 ± 0.62 (5) 5.64 ± 1 .08 (6) 4.7 ± 0.9 (5) 7.2 ± 2.2 (6)3
2) Values are means ± SD, the number of experiments are listed in parentheses. 3) GLC4 versus GLC4/ADR: p < 0.025 by unpaired Student's t-test.
1 25 200
•
!trfA�l c5 ci f 1 00 160 ;;
E = a. � � ] :<:
0 75 120 Q. :i 0
< � I__l_! z � I c
"C
g 0 50 !-I 80 �
... / � E t Q-o--o-o t 0 25 Q 4-0 0 Q- � "'
0 O S 1 0 1 5
number of cells 110btml)
Figure 1. Cell density dependent G6PD (a/I) and cytochrome c oxidase activity (o,•) in GLC4 (o,cy and GLC4/ADR (•,•). Values are means of three to four different experiments ± SD.
36
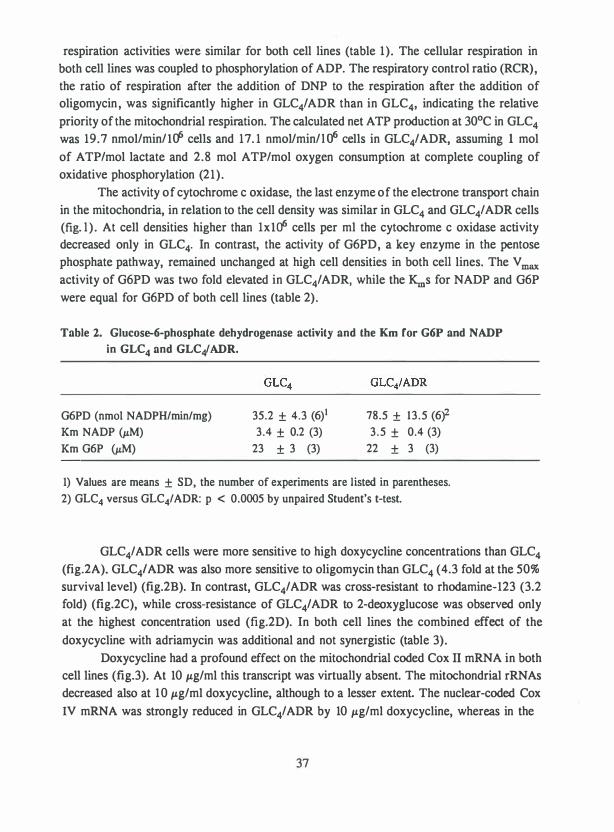
respiration activities were similar for both cell lines (table 1). The cellular respiration in both cell lines was coupled to phosphorylation of ADP. The respiratory control ratio (RCR), the ratio of respiration after the addition of DNP to the respiration after the addition of oligomycin , was significantly higher in GLC4/ ADR than in GLC4, indicating the relative priority of the mitochondrial respiration. The calculated net ATP production at 30°C in GLC4 was 19.7 nmol/min/Hfi cells and 17. 1 nmol/min/ l a6 cells in GLC4/ADR, assuming 1 mol of ATP/mol lactate and 2.8 mol ATP/mol oxygen consumption at complete coupling of oxidative phosphorylation (21).
The activity of cytochrome c oxidase, the last enzyme of the electrone transport chain in the mitochondria, in relation to the cell density was similar in GLC4 and GLC4/ ADR cells (fig. l) . At cell densities higher than lxHf cells per ml the cytochrome c oxidase activity decreased only in GLC4. In contrast, the activity of G6PD, a key enzyme in the pentose phosphate pathway, remained unchanged at high cell densities in both cell lines. The V max activity of G6PD was two fold elevated in GLC4/ ADR, while the Kuis for NADP and G6P were equal for G6PD of both cell lines (table 2).
Table 2. Glucose-6-phosphate dehydrogenase activity and the Km for G6P and NADP in GLC4 and GLC4/ ADR.
G6PD (nmol NADPH/min/mg) Km NADP (µM) Km G6P (µM)
35.2 ± 4.3 (6)1 3.4 ± 0.2 (3)
23 ± 3 (3)
78.5 ± 13.5 (6f 3.5 ± 0.4 (3)
22 ± 3 (3)
1) Values are means ± SD, the number of experiments are listed in parentheses. 2) GLC4 versus GLC4/ADR: p < 0.0005 by unpaired Student's t-test.
GLC4/ ADR cells were more sensitive to high doxycycline concentrations than GLC4 (fig.2A). GLC4' ADR was also more sensitive to oligomycin than GLC4 (4.3 fold at the 50% survival level) (fig.2B). In contrast, GLC4/ADR was cross-resistant to rhodamine-123 (3.2 fold) (fig.2C), while cross-resistance of GLC4/ADR to 2-deoxyglucose was observed only at the highest concentration used (fig.2D). In both cell lines the combined effect of the doxycycline with adriamycin was additional and not synergistic (table 3).
Doxycycline had a profound effect on the mitochondrial coded Cox II mRNA in both cell lines (fig.3). At 10 µg/ml this transcript was virtually absent. The mitochondrial rRNAs decreased also at 10 µg/ml doxycycline, although to a lesser extent. The nuclear-coded Cox IV mRNA was strongly reduced in GLC4/ ADR by 10 µg/ml doxycycline, whereas in the
37
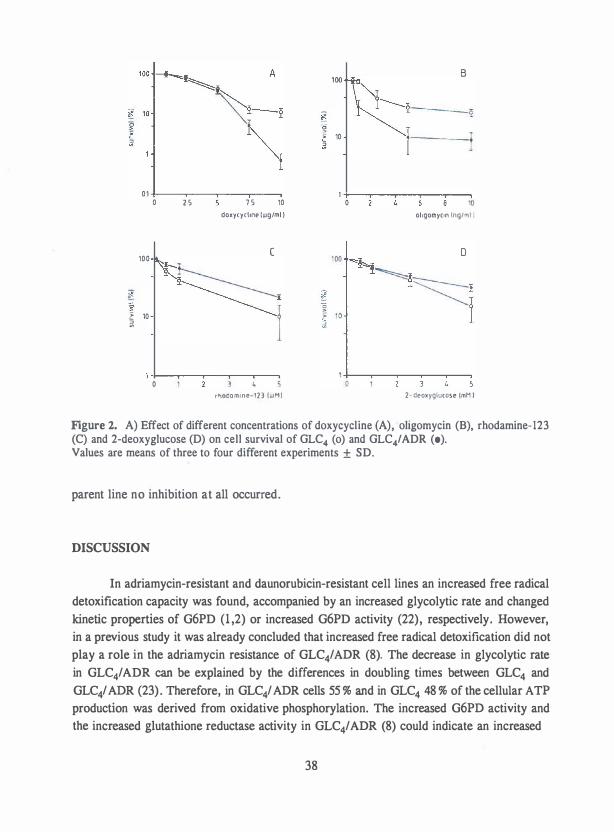
01 +---------r--� 0 2 5 7 5 10
doxycyclme tug/ml }
100 (
g � 10
1 +--,.---.---...----.--� 0
rhoaamrne-123 (iiMI
100 B
10
1 +-�-�-�--� 0
ol1gomycm ln9/ml I
1 +-�-�----� 0
2- deoxyglucose (mH I
Figure 2. A) Effect of different concentrations of doxycycline (A), oligomycin (B), rhodamine-123 (C) and 2-deoxyglucose (D) on cell survival of GLC4 (o) and GLC4/ADR (•). Values are means of three to four different experiments ± SD.
parent line no inhibition at all occurred.
DISCUSSION
In adriamycin-resistant and daunorubicin-resistant cell lines an increased free radical detoxification capacity was found, accompanied by an increased glycolytic rate and changed kinetic properties of G6PD (1 ,2) or increased G6PD activity (22), respectively. However, in a previous study it was already concluded that increased free radical detoxification did not play a role in the adriamycin resistance of GLC4/ADR (8). The decrease in glycolytic rate in GLC4/ ADR can be explained by the differences in doubling times between GLC4 and GLC4/ ADR (23) . Therefore, in GLC4/ ADR cells 55 % and in GLC4 48 % of the cellular ATP production was derived from oxidative phosphorylation. The increased G6PD activity and the increased glutathione reductase activity in GLC4/ ADR (8) could indicate an increased
38

Table 3. Survival after continuous incubation with doxycycline or adriamycin and with a combination or these drugs.
Doxycycline Adriamycin (nM) (µg/ml) 0 6 12 1 8
GLC4 0 100 90 46 1 8 2.5 84 73 (76)1 33 (39) 1 1 (15) 5.0 41 41 (37) 15 (19) 7 (7)
Adriamycin (µM) 0 0.6 1 .2 2.4
GLC4/ADR 0 100 93 74 44 2.5 74 7 1 (69) 53 (55) 32 (33) 5.0 41 30 (38) 28 (30) 14 (18)
Cells were continuously incubated with doxycycline and adriamycin. Control countings were standardized to 100 % , and the other cell countings were relative to control. Each result was the average of 3 independent experiments, with a SD of 2-15 % . 1) Numbers i n parenthesis, expected results assuming independent effect o f the drugs.
nucleic acid synthesis capacity via ribonucleotide reductase (24,25). This might be relatedto the increased repair of adriamycin-induced DNA breaks found in GLC4/ADR (6,8).
Doxycycline inhibits mitochondrial enzyme synthesis leading to a lack of oxidative
ATP synthesis and so to proliferation inhibition (26) , while oligomycin inhibits the oxidative
ATP synthesis directly. We suppose that the oxidative ATP synthesis is of higher importance
for GLC4/ADR explaining the increased sensitivity of GLC4/ADR to doxycycline and
oligomycin, the increased RCR and the maintenance of cytochrome c oxidase activity at high
cell densities as compared to GLC4• GLC4/ ADR was slightly cross-resistant to rhodamine-
123, while MDR cell lines overexpressing the P-glycoprotein were highly cross-resistant to this drug (27). The reduced glycolytic rate of GLC4/ ADR could account for its decreased
sensitivity to 2-deoxyglucose compared to GLC4• Our study showed for the first time an effect of doxycycline on mitochondrial and
nuclear transcript level. The most likely explanation for these effects is that in the presence
of doxycycline, RNA and ribosome breakdown in the mitochondria (28) is no longer
compensated by RNA synthesis. The increased effect of doxycycline on nuclear-coded
cytochrome c oxidase mRNA of GLC4/ ADR points at a strong interaction between nuclear
and mitochondrial transcriptional activity in GLC4' ADR.
39

1 2 3
Northern blot analysis of total R NA
GLC4/A D R
1 2 3
28 s
1 8 s 1 6 s
1 2 s
•
· -
1 2 3
Cox N
- Cox IT
1 2 3
Figure 3. Effect of doxycycline after a 24 h incubation on mitochondrial and nuclear transcripts of rRNAs (A) and cox II and IV (B). Equal amounts of RNA were present in each lane. Lane 1, control; lane 2, 5µg/ml doxycycline; lane 3, IO µg/ml doxycycline. Transcripts are indicated as follows: 28s, 1 8s (cytoplasmic rRNAs); 16s, 12s (mitochondrial rRNAs); cox IV (mRNA for cox IV); cox II (mRNA for cox II).
Combination therapy with doxycycline and adriamycin was effective in rat leukemia
(29) , whereas this combination had only an additional effect in GLC4 and GLC4/ADR. The
cross-resistance pattern of GLC4/ ADR (6, 7) was similar to that of HOE 15030 resistant BHK
cells showing cross-resistance to adriamycin , VP-16 and rhodamine-123 (30). Since
mitochondria are the targets of HOE 15030 this suggests , that adriamycin and VP-16 also
interact with mitochondria. The changed biochemical properties of the mitochondria may ,
therefore, be involved in the resistance of GLC4/ ADR to adriamycin. An increased
mitochondrial activity has been observed in vinblastine-resistant cells that overexpressed the
P-glycoprotein (31).
Our results suggest that mitochondria , although their exact relation to resistance is not
known, could be an interesting target for circumvention of adriamycin resistance, for instance by doxycycline.
40

REFERENCES
1 . Yeh, G.C., Occhipinti, S.J., Cowan, K.H., Chabner, B .A . , and Myers, C.E. (1987) Cancer Res. 47, 5994-5999.
2. Lyon, R.C., Cohen, J.S., Faustino, P.J. , Megnin, F. , and Myers, C.E. (1988) Cancer Res. 48, 870-877.
3 . Kaplan, 0., Navon, G., Lyon, R.C. , Faustino, P.J . , Straka, E.J . , and Cohen, J.S. (1988) Cancer Res. 50, 544-55 1 .
4 . Endicott, J .A., and Ling, V . (1989) Annu.Rev.Biochem. 58, 137-17 1 . 5. Broxterman, H.J., Pinedo, H.M., Kuiper, C.M., Schuurhuis, G.J. , and Lankelma, J . (1989)
FEBS Lett. 247, 405-410. 6. Zijlstra, J.G., De Vries, E.G.E., and Mulder, N.H. (1987) Cancer Res. 47, 1780-1784. 7 . De Jong, S . , Zijlstra, J .G. , De Vries, E.G.E., and Mulder, N.H. (1990) Cancer Res. 50,
304-309. 8. Meijer, C. , Mulder, N.H., Timmer-Bosscha, H., Zijlstra, J.G., and De Vries, E.G.E. (1987)
Cancer Res. 47, 4613-4617. 9. Modica-Napolitano, J.S., Steele, G.D., and Chen, L.B. (1989) Cancer Res. 49, 3369-3373. 10. Segal-Bendirdjian, E., Couland, D., Roques, B.P., and Le Pecq, J-B. (1988) Cancer Res.
48, 4982-4992. 1 1 . Hohorst, H.J. (1962) In: Methods of enzymatic analysis. H.U. Bergmeyer, editor, pp 266-
270, Academic Press, Inc., New York. 12. Trautschold, I . , Lamprecht, W., and Schweitzer, G. (1983) In: Methods of enzymatic
analysis. H.U. Bergmeyer, J. Bergmeyer, and M. Grabi (eds), Vol.7, pp.346-357, Verlag Chemie, Basel.
13. Nakashima, R.A., Paggi, M.G., and Pedersen, P.L. (1984) Cancer Res. 44, 5702-5706. 14. Deutsch, J. (1983) In: Methods of enzymatic analysis. H.U. Bergmeyer, J. Bergmeyer, and
M. Grabi (eds), Vol.3, pp. 190-197, Verlag Chemie, Basel. 15. Van den Bogert, C. , Dontje, B.H.J. , Holtrop, M., Melis, T.E., Romijn, J.C., Van Dongen,
J.W., and Kroon, A.M. (1986) Cancer Res. 46, 3283-3289. 16. Bradford, M.M. (1976) Anal.Biochem. 72, 248-254. 17. Birnboim, H.C. (1988) Nucl.Acids Res. 16, 1487-1497. 18. Church, G.M., and Gilbert, W. (1984) Proc.Natl .Acad.Sci. U.S.A. 8 1 , 1991-1995. 19. Feinberg, A.P. , and Vogelstein, B. (1983) Anal.Biochem. 132, 6-13 . 20. Reitzer, L.J., Wice, B.M., and Kennell, D. (1979) I .Biol.Chem. 254, 2669-2676. 2 1 . Harris, S.I . , Balaban, R.S . , and Mandel, L.J . (1980) Science 208, 1 148-1 150. 22. Gessner, T., Vaughan, L.A., Beehler, B.C., Bartels, C.J., and Baker, R.M. (1990) Cancer
Res. 50, 3921-3927. 23. Pedersen, P.L. (1978) Prog.Exp.Tumor Res. 22, 190-274. 24. Luthman, M., Eriksson, S., Holmgren, A., and Thelander, L. (1979) Proc. Natl .Acad.Sci.
U.S.A. 76, 2158-2162. 25. Castellot, J .J. Jr, Miller, M.R., Lehtomaki, D.M., and Pardee, A.B. (1979) I.Biol.Chem.
254, 6904-6908. 26. Van den Bogert, C. , Muus, P., Haanen, C. , Pennings, A. , Melis, T.E., and Kroon, A.M.
(1988) Exp.Cell Res. 178, 143-153. 27. Liley, D.T.J. , Wiggins, P.A., and Baguley, B.C. (1989) Eur.I.Cancer Clin. Oncol. 25,
1287-1293. 28. Attardi, G. and Schatz, G. (1988) Ann.Rev.Cell Biol. 4, 289-333. 29. Van den Bogert, Dontje, B.H.J., and Kroon, A.M. (1988) Cancer Res. 48, 6686-6690.
4 1

30. Ishida, R., Nishizawa, N., Kothani, F. , and Takahashi, T. (1989) Somat. Cell Mol.Genet. 15, 279-288.
3 1 . Wright, L.C., Dyne, M., Holmes, K.T., Romeo, T., and Mountford, C .E. (1986) Biochem.Int. 13 , 295-305.
42
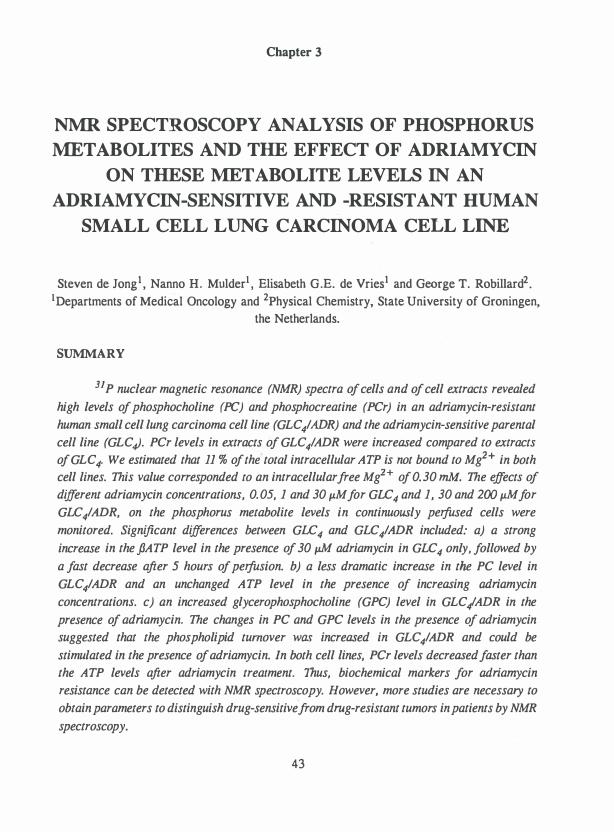
Chapter 3
NMR SPECTROSCOPY ANALYSIS OF PHOSPHORUS
METABOLITES AND THE EFFECT OF ADRIAMYCIN
ON THESE :MET ABO LITE LEVELS IN AN
ADRIAMYCIN-SENSITIVE AND -RESISTANT HUMAN
SMALL CELL LUNG CARCINOMA CELL LINE
Steven de Jong1 , Nanno H. Mulder1 , Elisabeth G.E. de Vries1 and George T. Robillard2
. 1Departments of Medical Oncology and
2Physical Chemistry, State University of Groningen,
the Netherlands.
SUMMARY
31 P nuclear magnetic resonance (NMR) spectra of cells and of cell extracts revealed
high levels of phosphocholine (PC) and phosphocreatine (PCr) in an adriamycin-resistant
human small cell lung carcinoma cell line (GLC/ADR) and the adriamycin-sensitive parental
cell line (GLC�. PCr levels in extracts of GLC/ADR were increased compared to extracts of GLC4. We estimated that 11 % of the' total intracellular ATP is not bound to Mg2+ in both cell lines. This value corresponded to an intracellular free Mg2+ of 0.30 mM. The effects of
different adriamycin concentrations, 0.05, 1 and 30 µMfor GLC4 and 1, 30 and 200 µMfor
GLC/ADR, on the phosphorus metabolite levels in continuously peifused cells were
monitored. Significant differences between GLC4 and GLC/ADR included: a) a strong
increase in theftATP level in the presence of 30 µM adriamycin in GLC4 only. followed by
a fast decrease after 5 hours of peifusion. b) a less dramatic increase in the PC level in
GLC/ADR and an unchanged ATP level in the presence of increasing adriamycin
concentrations. c) an increased glycerophosphocholine (GPC) level in GLC41ADR in the
presence of adriamycin. The changes in PC and GPC levels in the presence of adriamycin suggested that the phospholipid turnover was increased in GLC/ADR and could be
stimulated in the presence of adriamycin. In both cell lines, PCr levels decreased faster than the ATP levels after adriamycin treatment. Thus, biochemical markers for adriamycin
resistance can be detected with NMR spectroscopy. However, more studies are necessary to
obtain parameters to distinguish drug-sensitive from drug-resistant tumors in patients by NMR
spectroscopy.
43

INTRODUCTION
Changes in energy-metabolism may be involved in resistance. Cell lines selected invitro for resistance to adriamycin, Vinca alkaloid or colchicine, exhibit the multidrug resistant (MOR) phenotype. In these resistant cells a Mr 170,000 kD P-glycoprotein is
overexpressed (Riordan & Ling, 1985 ; Pastan & Gottesman, 1987). This P-glycoprotein functions as a energy-dependent efflux pump to different types of antitumor drugs (Riordan & Ling, 1986; Horio et al. , 1988). Increased free radical detoxification could also play a role
in adriamycin-resistance of these cells (Batist et al. , 1986; Sinha et al. , 1987). Since both mechanisms are associated with energy-dependent processes, expressing the MDR phenotype
may involve changes in energy requirements and energy metabolism. These changes have actually been observed in an adriamycin-resistant human breast cancer cell line (Cohen et al. ,
1986, Yeh et al. , 1987; Lyon et al. , 1988). Cell lines resistant to epipodophyllotoxins,
ellipticine and m-AMSA have also been established which do not overexpress the Pglycoprotein (Glisson et al. , 1986; Estey et al. , 1987; Pommier et al. , 1986, Beck et al. ,
1987, Ferguson et al. , 1988) . Cross-resistance to other drugs is still observed and sometimes
drug accumulation is decreased. It is unknown whether this so-called atypical MDR (Beck et al. , 1987) is accompanied by changes in energy requirements and energy metabolism.
In order to obtain biochemical characteristics for the atypical MDR phenotype we
focussed on metabolites of both energy metabolism (PCr, ATP and Pi) and phospholipid metabolism (GPC, phosphoethanolamine (PE) and PC) in an adriamycin-sensitive small cell
lung carcinoma cell line (GLC4) and an adriamycin-resistant subline (GLC4/ ADR), which exhibits the atypical MDR phenotype (Zijlstra et al. , 1987a; De Jong et al. , 1990).
Phosphorus metabolite levels in living cells can be monitored by 3 1P NMR spectroscopy. So
far, studies on the effect of adriamycin exposure on energy and lipid metabolism using 3 1P NMR were only done in in-vivo models of murine mammary 16/C and murine mammary
17/C adenocarcinomas (Evanochko et al. , 1983; Evelhoch et al. , 1987). In vitro studies on
cells using NMR spectroscopy necessitate trapping a dense cell suspension in a small volume.
We have used the method described by Cohen et al. ( 1986) in which cells were embedded
in agarose gel threads (Foxall & Cohen, 1983; Knop et al. , 1984). They have applied their
technique using 3 1P and 13c NMR spectroscopy to various cell lines (Cohen et al. , 1986; Lyon et al. , 1988; Daly et al. , 1987) . ln their studies with small cell lung cancers the signal
intensities of PCr did not change relative lo the ATP signal intensities for over 24 h (Knop et al. , 1987).
In the present study, 3 1P and 1H NMR spectroscopy was employed to monitor levels of energy and phospholipid metabolism in GLC4 and GLC4/ ADR cells. The effect of
adriamycin on these levels were monitored in continuously perfused cells using 3 1P NMR spectroscopy. The presence of phosphorus metabolites characteristic for atypical MDR and
the presence of response-specific markers of adriamycin-sensitivity and -resistance are
44

discussed.
MATERIAI..S AND METHODS
Materials. RPMI 1 640 medium was purchased from Gibco (Paisley, Scotland). Dulbecco's Modified Eagle's medium (DME), Fl2 medium and fetal calf serum (FCS) were
obtained from Flow Lab (Irvine, Scotland) , low melting agarose from FMC (Rockland, ME) and adriamycin from Farmitalia Carlo Erba (Milano, Italy).
Cell lines. GLC4, a human small cell lung carcinoma cell line, was derived from a pleural effusion in our laboratory and kept in continuous culture in RPMI 1640 medium supplemented with 10% FCS. GLC4/ ADR, a subline of the parental line, was made resistant
by stepwise increasing concentrations of adriamycin, until the cells were growing at a
continuous drug level of 1 . 18 µM. GLC4/ ADR was 44-fold more resistant to adriamycin than GLC4 after a 1 h exposure in the clonogenic assay (Zijlstra et al. , 1987a) . GLC4/ADR exhibited cross-resistance to several other drugs (Zijlstra et al. , 1987a; De Jong et al. , 1990; Meijer et al. , 1987), while the P-glycoprotein was not overexpressed in GLC4/ ADR (De Jong et al. , 1990). Prior to experimental use, GLC4/ ADR was cultured without adriamycin for 20 days, at which time the resistance factor was maximal (Meijer et al. , 1987). Both cell lines grow partly attached, partly floating and were cultured in RPMI 1 640 medium supplemented with 10% FCS at 37°C in a humid atmosphere with 5 % C02.
Cell perfusion. Cells (1-1 .5 x 108) were resuspended in DME/F12 medium (pH 7.4) and 10% FCS. The perfusion system was prepared as described previously (Foxall & Cohen,
1983; Knop et al. , 1984) with some modifications. Low-gelling agarose (0.8 ml in 0.9% NaCl) was added at 37°C to 1.6 ml of a cell suspension. Agarose strands were extruded
under light pressure through a teflon capillary tube (0.5 mm inside diameter) immersed in
an ice/water bath into an Wilrnad MRS tube (10 mm inside diameter) . The gel threads were
perfused by aspiration (1 .4 ml/min). A low perfusion rate was used in this study, since the
stability of the threads decreased in the presence of adriamycin. Consequently, the number of cells embedded in the threads had to be decreased to prevent partial acidification of the
cells. A number of layers of nylon gauzes were used instead of a piece of sponge to restrain the threads, resulting in a higher perfusion capacity. The perfusate from a 200-ml reservoir
consisted of DME/F12 and 10% FCS supplemented with penicillin ( 125 U/ml) and
streptomycin ( 125 U/ml). Oxygen (95 %) and C02 (5 %) were bubbled through the perfusate
in the reservoir. Cell extracts. Cell extracts were made from 1-2xl a8 cells. The extraction procedure
was performed at 4°C. Ice-cold perchloric acid (10%) was added to the pellet and the cell
mixture was vortexed at the beginning and the end of a 20 min period. The extracts were
neutralized with KOH, centrifuged to remove the KC104 precipitate, freeze-dried and
45

redissolved in D20 (Evans & Kaplan, 1977). 1H and 31p NMR spectroscopy. 31p NMR spectra (121 .4 MHz) of perfused cells at
37°C were obtained on a Varian VXR-300 spectrometer equipped with a VXR 5000 data station- Spectra were usually obtained from 1500 transients with a spectral window of ±
4000 Hz, 4K data points, a 65° pulse angle, a repetition rate of 2.25 sec and a line broadening of 20 Hz. All 31P chemical shifts in the spectra were set relative to PCr by setting the PCr signal to 0.00 ppm.
1H NMR spectra of cell extracts were obtained from 1000 scans at 10 °C with a 90° pulse angle and a repetition time of 3.4 sec under HDO decoupled conditions. 31P NMR spectra of cell extracts were obtained from 2000 scans at lCl°C with a 55° pulse angle and a repetition time of 40 sec under proton decoupled conditions. EDT A and diphenylphosphate were added to a final concentration of 10 mM and 0. 15 mM, respectively.
Since the relative separations between the B and a, and the B and '< peaks of ATP are proportional to the amount of ATP bound to Mg2+ , the fraction of total ATP that is not complexed to Mg2+ (</>) can be calculated (Gupta & Moore, 1980a) . The free Mg2+ concentration can then be calculated using the dissociation constant of MgATP (ATP complexed to magnesium) (Kd = 38 µM) and the formula [Mg2+] = Kd (q,-l - 1) (Gupta &
Moore, 1980a). Spectra of perfused cells were obtained 3 h after the perfusion was started, when no
major changes in the spectra occurred . Two spectra were collected to estimate peak areas and peak heights at t=O. Peale intensities of the different metabolites in spectra of cell extracts and in perfused cells were estimated by peak areas determined from computer simulated spectra using the deconvolution routine in the VXR-5000 software. Changes in the levels of the phosphorus metabolites in the presence or absence of adriamycin were estimated from resolution-enhanced spectra by comparing peak heights of the particular metabolite at different times. Peak heights of a given metabolite were expressed as a percent of the averaged peak height of this metabolite in the two spectra at t =O. At lower fields an underlying "hump" was absent in the spectra, which allowed the reliable and reproducible measurement of peak intensities. Using peak areas from resolution-enhanced spectra to estimate changes in metabolites did not give significantly different results.
Statistics. All results were expressed as means ± SD. Statistical significance was determined by use of the Student's t test
RESULTS
3Ip and 1H NMR spectra of cell extracts. Cell extracts were made from adriamycinsensitive (GLC4) and adriamycin-resistant (GLC4/ ADR) cells. Assignments were made on basis of data in the literature (Daly et al. , 1987; Evans & Kaplan, 1977; Evanochko et al. ,
46

b
5
2
•
Ref 9
I I I I I I I I I
, ,
-4 -6 -8 - 10 -1 2 -14 1 6 - 18 -20 ppm
Figure 1 . 3 1P NMR spectra (121 .45 MHz) of the perchloric extracts of GLC4 (A) and GLC4/ADR
(B). The pH (meter reading) was 7.8. Peak assignments are: 1 , PC; 2, Pi; 3, GPE; 4, GPC; 5, PCr;
6, yATP; 7, BADP; 8, aADP; 9, aATP; 10, NAD; 1 1 , BATP.
A
9.5 9.0 8.5 8.0 7.5 7.0 6.5 6.0 ppm
PC + C
I Cr PCr,
Cr
4.0 3.5 2.5 3.0 2.0 1 .5 1 .0 0.5 ppm
47
Figure 2. 1H NMR spectrum (300 MHz) of
the perchloric extract of GLC4/ ADR. The
pH was 7.4. The amplitude of the peaks in
the high field region (5.5-9.5 ppm) is 8-times that of the peaks in the low field
region (0-4 ppm) A, adenine; G, guanine; C,
cytosine; U, uracyl; PCr, phosphocreatine;
Cr, creatine; PC+ C, phosphorylcholine and
choline; Pro, proline; Glu, glutamic acid;
Gin, glutamine; Ala, alanine; Lac, lactate.
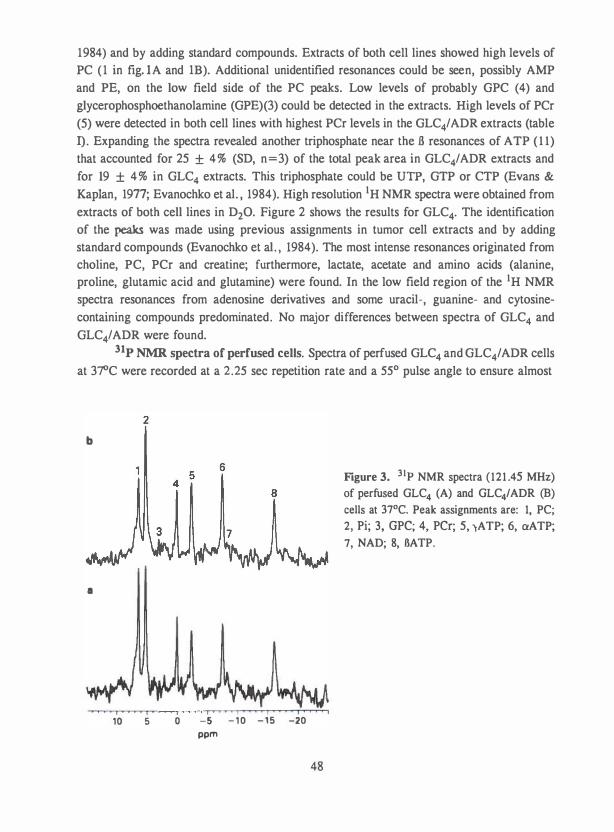
1984) and by adding standard compounds. Extracts of both cell lines showed high levels of PC ( 1 in fig. IA and lB). Additional unidentified resonances could be seen, possibly AMP
and PE, on the low field side of the PC peaks. Low levels of probably GPC (4) and
glycerophosphoethanolamine (GPE)(3) could be detected in the extracts. High levels of PCr
(5) were detected in both cell lines with highest PCr levels in the GLC4/ ADR extracts (table
I). Expanding the spectra revealed another triphosphate near the fi resonances of ATP ( 1 1)
that accounted for 25 ± 4 % (SD, n=3) of the total peak area in GLC4/ADR extracts and
for 19 ± 4 % in GLC4 extracts. This triphosphate could be UTP, GTP or CTP (Evans &
Kaplan, 1977; Evanochko et al. , 1984). High resolution 1H NMR spectra were obtained from
extracts of both cell lines in D20. Figure 2 shows the results for GLC4• The identification of the peaks was made using previous assignments in tumor cell extracts and by adding standard compounds (Evanochko et al. , 1984). The most intense resonances originated from choline, PC, PCr and creatine; furthermore, lactate, acetate and amino acids (alanine, proline, glutamic acid and glutamine) were found. In the low field region of the 1H NMR spectra resonances from adenosine derivatives and some uracil-, guanine- and cytosine
containing compounds predominated. No major differences between spectra of GLC4 and
GLC4/ ADR were found. 31P NMR spectra of perfused cells. Spectra of perfused GLC4 and GLC4/ ADR cells
at 37°C were recorded at a 2.25 sec repetition rate and a 55° pulse angle to ensure almost
b
•
10
2
5
5 4 6
- 1 0 - 1 5 -20 ppm
48
Figure 3. 3 1P NMR spectra (121 .45 MHz)
of perfused GLC4 (A) and GLC4/ADR (B) cells at 37°C. Peak assignments are: 1, PC;
2, Pi; 3, GPC; 4, PCr; 5, ,ATP; 6, aATP;
7, NAD; 8, 6ATP .

Table I. Phosphorus metabolite levels in extracts or GLC4 and GLC4'ADR (n=3).
PC
GPC
PCr
ATPb
aATPb
BATP"
GLC4
1 . 83 ± 0.44a 0 . 10 ± 0.05 0.7 1 ± 0. 1 8 1 .09 ± 0. 14 1 .56 ± 0. 1 1 1 .00
GLC4/ADR
1 .41 ± 0. 1 1 0. 13 ± 0.04 I . I I ± 0. 16d
1 .20 ± O.Q7 1 .66 ± 0 . 12 1 .00
a) Peak areas were obtained from spectra using a deconvolution routine (see "Materials and Methods") and were expressed relatively to the peak area of BATP (± SD).
b) ADP, NAO and some other triphosphates might be present. c) Some other triphosphates might be present. d) p < 0.025, GLC4 versus GLC4/ADR
Table II. Phosphorus metabolite levels in perfused GLC4 and GLC4/ADR cells (n= 6).
PC GPC
PCr
ATPb
aATPb
BATP"
GLC4
1 .96 ± 0.35 0.08 ± 0.09 0.64 ± 0. 1 8
1 .03 ± 0 . 15 1 .50 ± 0.26 1 .00
GLC4/ADR
1 .94 ± 0.29 0.09 ± 0. 13 0.54 ± 0 . 14 1 .21 ± o.2 1d
1 .76 ± 0.34 1 .00
a) Peak areas were obtained from spectra at t=O using a deconvolution routine (see "Materials and Methods") and were expressed relatively to the peak area of BATP ( ± SD).
b) ADP, NAD and some other triphosphates might be present. c) Some other triphosphates might be present. d) p < 0.05, GLC4 versus GLC4/ADR.
complete spin relaxation of the metabolites (fig.3). To estimate the relative levels of phosphorus metabolites in GLC4 and GLC4/ ADR we determined peak areas of the various metabolites (table II) in several spectra at t=O by computer simulation of the spectra using a deconvolution routine. Partially overlapping peaks could be separated using this program. The peak areas were expressed relative to that of the BA TP (8) resonance. Peak areas of Pi
49

(2) were not used, since Pi was also present in the medium we used. Peak area of ATP (5) was increased in GLC4/ ADR compared to GLC4. Since the peak areas are expressed relative to the .BA TP peak area, the increased area of the ATP reso�ance in GLC4/ ADR must be due to some component other than ATP. Comparing the extracts we concluded that ADP was this component.
Free ADP and Mg2+ in intact cells. Mg2+ modifies the equilibrium constant for the reactions catalyzed by creatine kinase and adenylate kinase that are important for energy metabolism (Lawson & Veech, 1979) . The spectra of perfused cells we had used to quantify relative levels of metabolites were also used to estimate the fraction of total ATP not bound to Mg2+ . This fraction was 0. 1 1 ± 0.01 in GLC4/ ADR and 0. 1 1 ± 0.02 in GLC4 cells. The free intracellular Mg2+ concentrations were calculated from these fractions as described in materials and methods and were 0.32 ± 0.03 mM and 0.30 ± 0.06 mM in GLC4/ADR and GLC4. The total ADP concentration (MgADP and free ADP) can be calculated from ATP, PCr and Cr concentrations in extracts, the intracellular pH and the assumed equilibrium constant Kck of the creatine kinase reaction at this Mg2+ concentration according to Lawsonet al. ( 1979) . The ATP concentration in extracts of both cell lines was 6 nmol/ ld'
cells (De Jong et al. , manuscript in preparation). The Cr/PCr ratio was calculated from 1H NMR spectra of extracts. For GLC4 and GLC4/ADR these ratios were 1 .33 ± 0. 12 (SD, n =3) and 1 .39 ± 0.37, respectively. Assuming that the intracellular and extracellular pH are equal (pH 7.3), the calculated total ADP concentration was = 0.15 nmol/ l d' cells for GLC4 and GLC4/ ADR.
Effect of adriamycin on energy metabolite levels of perfused GLC4 and
GLC4/ADR cells. Perfused cells were continuously exposed to 0.05 µM, 1 µM and 30 µM adriamycin (GLC4) and to 1 µM, 30 µM and 200 µM adriamycin (GLC4/ ADR) while the time course of the phosphorus metabolite levels was followed. Each 3 1P NMR spectrum was obtained by accumulating 1500 scans which took 1 h. Only significant changes are indicated.
PCr levels in the control (untreated GLC4 cells) increased to 130% of the initial value (t=2-12h, p < 0.05 versus t=O) (fig.4A). In the presence of 30 µM adriamycin, PCr levels decreased rapidly after 4 h (t=S-15 h, p < 0.01 versus control) and were almost undetectable at 15 h. In untreated GLC4/ ADR cells PCr levels did not increase significantly of the initial value, while with a high concentration of adriamycin (200 µM) PCr levels decreased after 4 h (t=5-15 h, p < 0.005 versus control) and became undetectable after 13 h (fig.4B). The standard deviations of PCr levels were rather large in adriamycin treated cells of both cell lines because the peak intensity was low and therefore more susceptible to noise.
Since the yA TP and a ATP resonances might contain some contributions from ADP, changes in height of the .BA TP resonance were used to determine the influence of adriamycin on ATP. ATP levels in untreated GLC4 cells increased to 140% of the initial value (t=4-15, p < 0.05 versus t=O) (fig.SA). In the presence of 30 µM adriamycin an increase to 175 % of the initial ATP level was seen within 5 to 6 h (t=2-7 h, p < 0.025 versus control), which
50

200
150 � � ·� 100 2! E
50
200
50
a
b
PCr
10 Time (hours)
PCr
Control - 1 fJ.M 0.05 fJ.M
15
JO fJ.M Control 1 fJ.M
200 fJ.M 10 15
Time (hours)
Figure 4. Effect of different adriamycin
concentrations on PCr levels in perfused
GLC4 (A) and GLC4/ADR (B) cells at 37"C.
After the 3 1P NMR spectra at t=O were
obtained, adriamycin was added to the
perfusate. Levels were obtained from peak
heights of the metabolite in the 3 1p NMR
spectra, as described in "Materials and Methods" .
A) control (-o-)., 0.05 /lM (-•- ), 1 µM
( -•- ) and 30 /lM ( - •· ) adriamycin; B)
control (-o- ), 1 µM (-o- ), 30 /lM (- • · ) and 200 /lM (- *··) adriamycin. Points, mean
of three experiments; bars, SD.
subsequently decreased to 20 % at 15 h (fig.SA and 6A). In untreated GLC4/ADR cells ATP
levels increased to 125 % of the initial value {t =3-15, p < 0.05 versus t=O) (fig.SB). With
200 µM adriamycin ATP dropped to undetectable levels at 15 h (t=6-15 h , p < 0.01 versus
control). Changes in yATP and aATP intensities in untreated and adriamycin treated GLC4
and GLC4/ ADR cells were almost identical to changes in BATP intensity (results not shown).
Neither the percentage of unbound ATP nor the intracellular Mg2+ concentration changed
in the presence of various concentrations of adriamycin.
The energy status of a cell could be described by the PCr/BATP ratio. We averaged
the results from 1 to 5 h, 6 to 10 h and 1 1 to 15 h for the different adriamycin
concentrations used (fig. 7). From this figure it could be concluded that the PCr level
decreased faster than the BA TP level in both cell lines in response to high adriamycin
concentrations, 30 µM for GLC4 (t =5-15 h, p < 0.01 versus control) and 200 µM for
GLC4/ADR (t= 10-15 h, p < 0.025 versus control) . With 0.05 µM adriamycin the PCr
level decreased faster than the BATP level i.n GLC4 cells (t= 10- 15h, p < 0.05 versus
control).
5 1
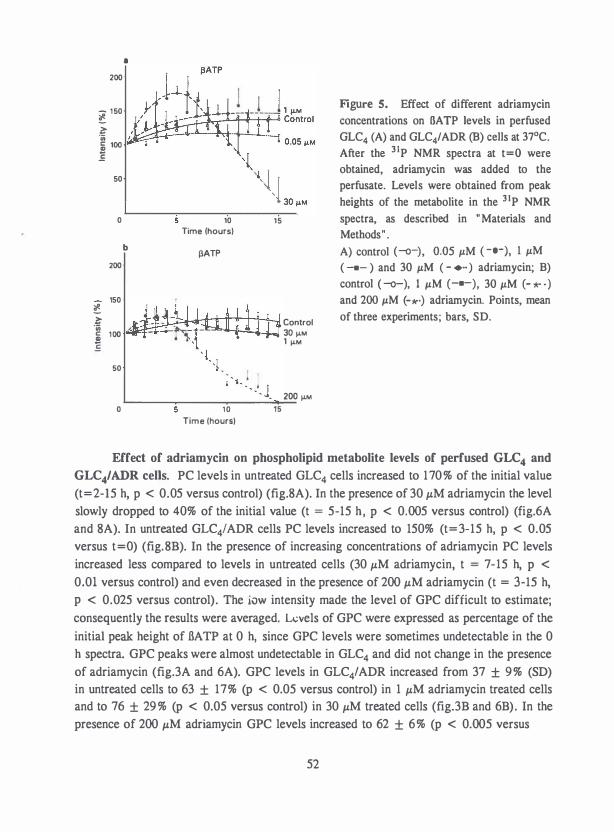
200
- 1 50 � .� ., i 100 .E
50
0
200
150 � � ·;;; c: 100 ! E
50
0
•
b
10 Time (hours)
�ATP
15
Li..J-H--ft--8---IH-� Control �-·--t-=:...&.....LJ 30 µM 1 µM
200 µM 10 15
Time (hours)
Figure S. Effect of different adriamycin
concentrations on ilATP levels in perfused
GLC4 (A) and GLC4/ADR (B) cells at 37°C .
After the 3 1P NMR spectra at t=O were
obtained, adriarnycin was added to the
perfusate. Levels were obtained from peak
heights of the metabolite in the 3 1P NMR
spectra, as described in "Materials and Methods" .
A) control (-o-), 0.05 µM ( -1-), I µM
( -•- ) and 30 µM ( - •·· ) adriarnycin; B) control ( -o-), I µM (-•-), 30 µM (- *" · ) and 200 µM (-:"··) adriarnycin. Points, mean
of three experiments; bars, SD.
Effect of adriamycin on phospholipid metabolite levels of perfused GLC4 and GLC4/ADR cells. PC levels in untreated GLC4 cells increased to 170 % of the initial value (t=2-15 h, p < 0.05 versus control) (fig.SA). In the presence of 30 µM adriamycin the level slowly dropped to 40% of the initial value (t = 5-15 h , p < 0.005 versus control) (fig.6A and SA). In untreated GLC4'ADR cells PC levels increased to 150% (t=3-15 h, p < 0.05 versus t=O) (fig.SB). In the presence of increasing concentrations of adriamycin PC levels increased less compared to levels in untreated cells (30 µM adriamycin, t = 7-15 h, p < 0.01 versus control) and even decreased in the presence of 200 µM adriamycin (t = 3-15 h, p < 0.025 versus control). The iow intensity made the level of GPC difficult to estimate; consequently the results were averaged. L.:vels of GPC were expressed as percentage of the initial peak height of BATP at 0 h, since GPC levels were sometimes undetectable in the 0 h spectra. GPC peaks were almost undetectable in GLC4 and did not change in the presence of adriamycin (fig.3A and 6A). GPC levels in GLC4/ADR increased from 37 ± 9 % (SD) in untreated cells to 63 ± 17% (p < 0.05 versus control) in 1 µM adriamycin treated cells and to 76 ± 29 % (p < 0.05 versus control) in 30 µM treated cells (fig.3B and 6B) . In the presence of 200 µM adriamycin GPC levels increased to 62 ± 6% (p < 0.005 versus
52
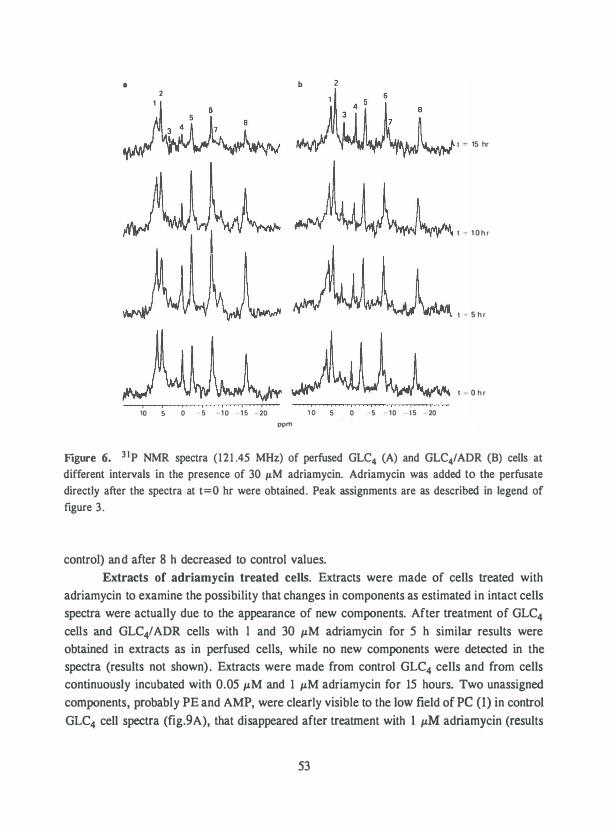
•
10
2 1
6
0 -5 -1 0 - 1 5 -20
ppm
b
1 - 15 hr
t � 1 0 h r
t - 5 h r
t 0 h r
1 0 0 - 5 -10 1 5 -20
Figure 6. 3 1P NMR spectra (121 .45 MHz) of perfused GLC4 (A) and GLC4/ADR (B) cells at
different intervals in the presence of 30 JLM adriamycin. Adriamycin was added to the perfusate
directly after the spectra at t=O hr were obtained. Peak assignments are as described in legend of
figure 3.
control) and after 8 h decreased to control values.
Extracts of adriamycin treated cells. Extracts were made of cells treated with
adriamycin to examine the possibility that changes in components as estimated in intact cells
spectra were actually due to the appearance of new components. After treatment of GLC4 cells and GLC4/ ADR cells with l and 30 µM adriamycin for 5 h similar results were
obtained in extracts as in perfused cells, while no new components were detected in the spectra (results not shown) . Extracts were made from control GLC4 cells and from cells
continuously incubated with 0.05 µM and 1 µM adriamycin for 15 hours. Two unassigned
components, probably PE and AMP, were clearly visible to the low field of PC (1) in control
GLC4 cell spectra (fig.9A), that disappeared after treatment with 1 µM adriamycin (results
53

a 1 .25
1.00 a.. t-<( 0.75 ca. >::: u a.. 0.50
0.25
0
b 1 .25
1 .00 a.. t- 0.75 <( ca. >::: u a.. 0.50
0.25
0
, .. :.:-�-: .. :- ----- Control ' -------._.:::-_:::_:----• 1 µM ' 1, --------· 0.05 f.LM ' ..... ..... ..... ' - - - - -1 30 µM
5 10 1 5 Time (hours)
..... --
- --=. --- --- Control ' ' ' ' ' 1 IJ.M ' -.. _ _ ,, - - 30 µM
' ' ' l '· -.. ' ' , I '• 200 µM
5 10 1 5 Time (hours)
Figure 7. Effect of different adriamycin
concentrations on the PCr/OATP ratio in
perfused GLC4 (A) and GLC4/ADR (B) cells
at 37°C. After the 3 1P NMR spectra at t=O were obtained, adriamycin was added to the
perfusate. Ratios were obtained from peak
heights of the metabolites in the 3 1p NMR
spectra, as described in " Materials and
Methods" and "Results" .
not shown). No new components were detected i n extract spectra o f control GLC4/ ADR cells (fig.9B) and extract spectra from cells after treatment with 1 and 30 µM adriamycin for 15
hours. 1H NMR spectra of these extracts showed no changes at all in the presence of adriamycin (results not shown) .
DISCUSSION
31p NMR spectra from perfused cells and extracts showed the same resonances. Several cellular compartments have been described such as mitochondria that might influence the peak intensity of fiATP (Gupta & Yushok, 1980b). However, phosphorus metabolite content in cellular extracts as determined by 3 1P NMR and biochemical analysis are in agreement (Desmoulin et al. , 1986). Furthermore, since spectral resolution was enhanced and complete relaxation of the phosphorus resonances spectra was obtained in our extracts, the significance of differences observed in peak areas relative to the J3ATP peak area is better indicated by comparing cell extracts. The relative PCr concentration was higher in extracts
54

a
200
150
� ::-'iii 100 c ., .£
50
0
b
200
150
� ::-'iii 100 c ., .£
50
0
b
PC
5 10
Time (hours) PC
5 10
Time (hours)
2 5
1 5
1 5
Rel
- 2 -4 -6
ppm
9
Figure 8. Effect of different adriamycin
concentrations on PC levels in perfused
GLC4 (A) and GLC4/ADR (B) cells at 37°C.
After the 3 1P NMR spectra at t=O were
obtained, adriamycin was added to the
perfusate. Levels were obtained from peak
heights of the metabolite in the 3 1P NMR
spectra as described in "Materials and
Methods" . A) control (-o-), 0.05 µM
( -• - ), 1 µM ( -•- ) and 30 µM ( - • · ) adriamycin; B) control (-o-), 1 µM <--), 30 µM (-•· ) and 200 µM (-* .) adriamycin.
Points, mean of three experiments; bars, SD.
1 1
I I 10 -12 - 14 - 16 -18 20
Figure 9. 31P NMR spectra (121 .45 MHz) of the perchloric extracts of GLC4 (A) and GLC4/ADR
(B) after 15 h. The pH was 7.8. Peak assignments are as described in the legend of figure 1 .
55
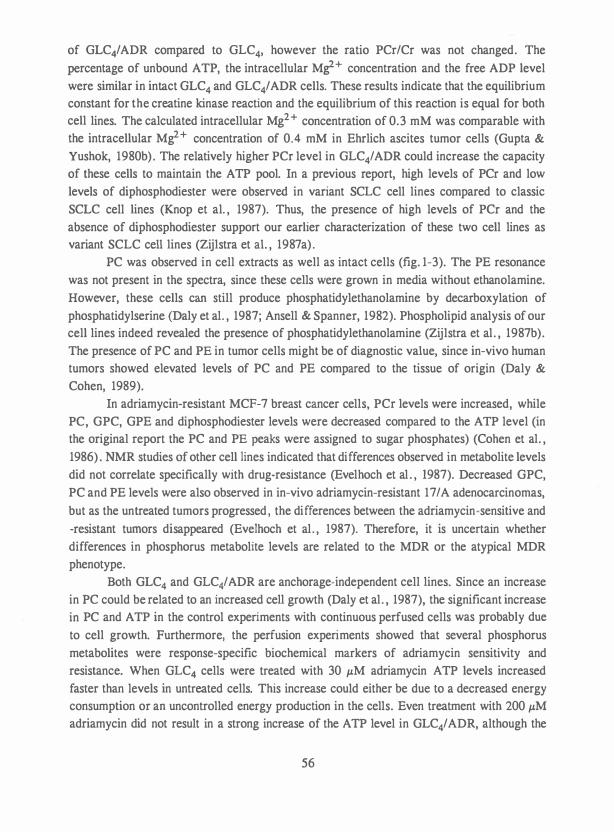
of GLC4/ ADR compared to GLC4, however the ratio PCr/Cr was not changed. The percentage of unbound ATP, the intracellular Mg2+ concentration and the free ADP level were similar in intact GLC4 and GLC4/ ADR cells. These results indicate that the equilibrium constant for the creatine kinase reaction and the equilibrium of this reaction is equal for both cell lines. The calculated intracellular Mg2+ concentration of 0.3 mM was comparable with the intracellular Mg2+ concentration of 0.4 mM in Ehrlich ascites tumor cells (Gupta &
Yushok, 1980b) . The relatively higher PCr level in GLC4/ADR could increase the capacity of these cells to maintain the ATP pool. In a previous report, high levels of PCr and low levels of diphosphodiester were observed in variant SCLC cell lines compared to classic SCLC cell lines (Knop et al. , 1987). Thus, the presence of high levels of PCr and the absence of diphosphodiester support our earlier characterization of these two cell lines as variant SCLC cell lines (Zijlstra et al. , 1987a) .
PC was observed in cell extracts as well as intact cells (fig. 1-3). The PE resonance was not present in the spectra, since these cells were grown in media without ethanolamine. However, these cells can still produce phosphatidylethanolamine by decarboxylation of phosphatidylserine (Daly et al. , 1987; Ansell & Spanner, 1982). Phospholipid analysis of our cell lines indeed revealed the presence of phosphatidylethanolamine (Zijlstra et al. , 1987b). The presence of PC and PE in tumor cells might be of diagnostic value, since in-vivo human tumors showed elevated levels of PC and PE compared to the tissue of origin (Daly &
Cohen, 1989). In adriamycin-resistant MCF-7 breast cancer cells, PCr levels were increased, while
PC, GPC, GPE and diphosphodiester levels were decreased compared to the ATP level (in the original report the PC and PE peaks were assigned to sugar phosphates) (Cohen et al. , 1986) . NMR studies of other cell Jines indicated that differences observed in metabolite levels did not correlate specifically with drug-resistance (Evelhoch et al . , 1987). Decreased GPC, PC and PE levels were also observed in in-vivo adriamycin-resistant 17 /A adenocarcinomas, but as the untreated tumors progressed, the differences between the adriamycin-sensitive and -resistant tumors disappeared (Evelhoch et al. , 1987). Therefore, it is uncertain whether differences in phosphorus metabolite levels are related to the MDR or the atypical MDR phenotype.
Both GLC4 and GLC4/ ADR are anchorage-independent cell lines. Since an increase in PC could be related to an increased cell growth (Daly et al. , 1987), the significant increase in PC and ATP in the control experiments with continuous perfused cells was probably due to cell growth. Furthermore, the perfusion experiments showed that several phosphorus metabolites were response-specific biochemical markers of adriamycin sensitivity and resistance. When GLC4 cells were treated with 30 µM adriamycin ATP levels increased faster than levels in untreated cells. This increase could either be due to a decreased energy consumption or an uncontrolled energy production in the cells. Even treatment with 200 µM adriamycin did not result in a strong increase of the ATP level in GLC4/ ADR, although the
56

level dropped to undetectable during the experiment in a way similar to ATP levels in GLC4 cells treated with 30 µM adriamycin. In both cell lines the PCr/ATP ratio decreased in response to high adriamycin concentrations. PCr was probably used to maintain the ATP pool at a stable level via creatine kinase as described in muscle (Bessman & Carpenter, 1985).
An interesting finding was the effect of adriamycin treatment on the PC and GPC level only in GLC4/ ADR cells. We could not confirm the increase in GPC levels in extracts. There are two possibilities. First, by using the continuous perfusion system GLC4/ ADR cells were physically stressed resulting in an increase in phospholipid turnover that was stimulated by adriamycin treatment. Secondly, the peak we saw, was not due to GPC but to a phospholipid component also resulting from an increased phospholipid turnover. In phospholipid synthesis, choline is converted to PC and further converted to phosphatidylcholine (Ansell & Spanner, 1982). This phospholipid is degradaded to GPC and then to choline by glycerophosphocholine phosphodiesterase (EC 3. 1 .4.2) (Ansell & Spanner, 1982; Morash et al. , 1988). The increased phospholipid turnover might be related to the reduced adriamycin accumulation in GLC4/ ADR cells. The reduced drug accumulation was not due to the increased activity of the P-glycoprotein (Zijlstra et al. , 1987a; De Jong et al. , 1990).
In human and rat neuroectodermal tumors ATP levels decreased strongly within 6 to 12 h after cyclophosphamide, vincristine and methotrexate treatment, while PCr levels remained undetectable (Naruse et al. , 1985). In MOPC 104E myeloma PCr/ATP ratio increased within 1 day after treatment with a curative dose of cyclophosphamide or l ,3-bis(2-chloroethyl)- l -nitrosourea, while PCr and ATP levels strongly reduced within 4 days (Ng et al . , 1982). In this study it was concluded, that the changed PCr/ATP ratio must partially reflect the effect of the chemotherapy on energy metabolism within the tumor cells. ATP/Pi and PCr/Pi ratios in adriamycin-sensitive mammary 17 I A adenocarcinoma (Evelhoch et al. , 1987), i n RIF-1 fibrosarcoma (Li et al. , 1988) and i n 9L gliosarcoma (Steen et al. , 1988) were increased after adriamycin, cyclophosphamide and l ,3-bis(2-chloroethyl)-1-nitrosourea treatment, respectively. The increase of these ratios after treatment was explained by reenergization of the tumor, while untreated control tumors in these studies showed declining ATP and PCr levels (Evelhoch et al . , 1987; Li et al. , 1988; Steen et al. , 1988). Untreated neuroectodermal tumors were still in an active stage which may explain the fast reduction in ATP levels 3 h after treatment with cyclophosphamide (300 mg/kg) (Naruse et al. , 1985), while an opposite effect of cyclophosphamide (300 mg/kg) was seen in RIF-1 fibrosarcoma (Li et al. , 1988). Untreated MOPC 104E myelomas were in a moderate active stage which may explain the slow decrease in ATP levels in 4 days (Ng et al. , 1982).
In our in-vitro experiments the continuous perfused cells were supplied with sufficient nutrients. Therefore, these results showed without any interference from reenergization that adriamycin treatment had an effect on the energy metabolism in the adriamycin-sensitive GLC4 tumor cells which resulted in an increase of cellular ATP. The strong decrease in ATP
57

and PCr levels after treatment were comparable with the effects of chemotherapy in in-vivo tumors that were in a metabolic active stage (Ng et al. , 1982; Naruse et al. , 1985). The same adriamycin concentration had no effect on ATP and PCr levels in the adriamycin-resistant GLC4/ ADR tumor cells compared to untreated GLC4/ ADR cells. To distinguish drugsensitive from drug-resistant tumors in patients, it will therefore be necessary to compare changes in phosphorus metabolite levels in tumors after treatment with an estimation of the changes in nucleoside triphosphates and PCr levels in this tumor that would occur without chemotherapeutic treatment, since the metabolic stage of a tumor probably determines the changes in phosphorus metabolites after chemotherapy. To obtain a reliable estimation, tissue heterogeneity, tumor size, type of tumor, the glycolytic rate of the tumor, tumor hypoxia and the degree of vascularization of a tumor have to be determined. Till now only a few often preliminary data are available on human tumor bioenergetics and responses to chemotherapy observed by NMR (Steen, 1989). The continuous perfusion system can be used to study the relation between hypoxia and/or glucose deprivation and chemotherapeutic effectivity in invitro experiments.
In conclusion, 31P NMR spectroscopy can be used in in-vitro experiments to reveal biochemical markers for adriamycin-resistance and -sensitivity. However, much more in-vitro and in-vivo studies with drug-sensitive and drug-resistant cells are necessary to obtain parameters to distinguish drug-sensitive from drug-resistant tumors in patients after chemotherapy by NMR spectroscopy.
REFERENCES
Ansell, G.B. & Spanner, S. (1982). Phosphatidylcholine, phosphatidylethanol-amine, and phosphatidylserine. In Phospholipids, Hawthorne, J .N. & Ansell, G .B. (eds) p . 1 . Elsevier Biomedical Press: Amsterdam.
Batist, G. , Tulpule, A., Sinha, B.K., Katki, A.G., Myers, C.E. & Cowan, K.H. (1986). Induction of an anionic glutathione-S-transferase in multi-drug resistant human breast cancer cells and in xenobiotic resistant preneoplastic liver nodules induced by carcinogens. J .Biol.Chem., 261 , 155444.
Beck, W.T., Cirtain, M.C., Danks, M.K. & 5 others (1987). Pharmacological molecular, and cytogenetic analysis of "atypical" multidrug-resistant human leukemic cells. Cancer Res. , 47, 5455 .
Bessman, S .P. & Carpenter, C.L. (1985). The creatine-creatine phosphate energy shuttle. Annu.Rev.Biochem., 54, 831 .
Cohen, J.S., Lyon, R.C. , Chen, C . & 5 others (1986). Differences i n pho1ihate metabolite levels in drug-sensitive and -resistant human breast cancer cell lines determined by 1P magnetic resonance spectroscopy. Cancer Res . , 46, 4087 .
58
Daly, P.F., Lyon, R.C., Faustino, P.J. & Cohen, J.S. (1987). Phospholipid metabolism in cancer cells monitored by 3 1P NMR spectroscopy. J .Biol.Chem., 262, 14875.
Daly, P.F. & Cohen, J.S. (1989). Magnetic resonance spectroscopy of tumors and potential in-vivo clinical applications: a review. Cancer Res. , 49, 770.
De Jong, S . , Zijlstra, J .G. , De Vries, E.G.E. & Mulder, N.H. (1990). Reduced DNA topoisomerase II activity and drug-induced DNA cleavage activity in an adriamycin-resistant human small cell lung carcinoma cell line. Cancer Res. , 50, 304.
Desmoulin, F., Galons, J.P., Canioni, P., Marvaldi, J. & Cozzone, P .J . ( 1986). 3 1P nuclear magnetic resonance study of human colon adenocarcinoma cultured cell line. Cancer Res. , 46, 3768.
Estey, E.H., Silberman, L. , Beran, M. , Anderson, B.S. & Zwelling, L.A. ( 1987). The interaction between nuclear topoisomerase II activity from human leukemia cells, exogenous DNA and 4'-(9-acridinylamino)methane-sulfon-m-anisidide (m-AMSA) or 4-(4,6-0-ethylidene-11-D-glycopyranoside) (VP-16) indicates the sensitivity of the cells to the drugs. Biochem.Biophys.Res.Cornmun., 144, 787.
Evanochko, W.T., Sakai, T.T., Ng, T.C. & 8 others (1984). NMR studr, of in vivo RIF-1 tumors. Analysis of perchloric acid extracts and identification of 1H, 3 P and 1 3C resonances. Biochim.Biophys.Acta, 805, 104.
Evanochko, W.T., Ng, J .C. , Lilly, M.B. & 4 others (1983). In vivo 3 1P-NMR study of the metabolism of murine mammary 16/c adenocarcinomas and its response to chemotherapy, X-radiation, and hyperthermia. Proc.Natl .Acad.Sci. USA, 80, 334.
Evans, F.E. & Kaplan, N.O. (1977). 3 1P nuclear magnetic resonance studies of Hela cells. Proc.Natl .Acad.Sci USA, 74, 4909.
Evelhoch, J.L., Keller, N.A. & Corbett, T.H. ( 1987). Response-specific adriamycin sensitivity markers provided by in vivo 3 1P nuclear magnetic resonance spectroscopy in murine mammary adenocarcinomas. Cancer Res. , 47, 3396.
Ferguson, P.J . , Fisher, M.H., Stephenson, J . , Li, D-H. , Zhou, B-S. & Cheng, Y-C. (1988). Combined modalities of resistance in etoposide-resistant human KB cell lines. Cancer Res. , 48, 5956.
Foxall, D.L. & Cohen, J.S. (1983). NMR studies of perfused cells. J.Magn. Reson., 52, 346.
Glisson, B. , Gupta, R. , Smallwood-Kentro, S. & Ross, W. (1986). Characterization of acquired epipodophyllotoxin resistance in a chinese hamster ovary cell line: loss of drug-stimulated DNA cleavage activity. Cancer Res. , 46, 1934.
Gupta, R.J . & Moore, R.D. ( 1980a). 3 1P NMR studies of intracellular free Mg2+ in intact frog skeletal muscle. I .Biol.Chem., 255, 3987.
Gupta, R.J. & Yushok, W.D. (1980b). Noninvasive 3 1P NMR probes of free Mg2+, MgATP, and MgADP in intact Ehrlich ascites tumor cells. Proc.Natl .Acad.Sci . USA, 77, 2487.
Guy, G.R. & Murray, A. ( 1982). Tumor promotor stimulation of phosphatidyl-choline turnover in Hela cells. Cancer Res. , 42, 1980.
59

Horio, M., Gottesman, M.M. & Pastan, I. (1988). ATP-dependent transport of vinblastine in vesicles from human multidrug-resistant cells. Proc.Natl .Acad. Sci. USA, 85, 3580.
Knop, R.H., Chen, C-W. , Mitchell, J .B., Russo, A. , McPherson, S. & Cohen, J.S. ( 1984). Metabolic studies of mammalian cells by 31P NMR using a continuous perfusion technique. Biochim.Biophys.Acta, 804, 275.
Knop, R.H . , Carney, D.N. , Chen, C. , Cohen, J.S. & Minna, J .D. (1987). Levels of high energy phosphates in human lung cancer cell lines by 3 1P nuclear magnetic resonance spectroscopy. Cancer Res . , 47, 3357.
Lawson, J .W.R. & Veech, R.L. ( 1979). Effects of pH and free Mg2+ on the Keq of the creatine kinase reaction and other phosphate hydrolyses and phosphate transfer reactions. J .Biol.Chem., 254, 6528.
Li, S.I . , Wehrle, J.P., Rajan, S.S. , Steen, R.G., Glickson, J .D. & Hilton, J. (1988). Response of radiation-induced fibrosarcoma-1 in mice to cyclophosphamide monitored by in-vivo 31P nuclear magnetic resonance spectroscopy. Cancer Res . , 48, 4736.
Lyon, R.C., Cohen, J .S. , Faustino, P.J . , Megnin, F. & Myers, C.E. (1988). Glucose metabolism in drug-sensitive and drug-resistant human breast cancer cells monitored by magnetic resonance spectroscopy. Cancer Res. , 48, 870.
Meijer, C . , Mulder, N.H . , Timmer-Bosscha, H . , Zijlstra, J .G. & De Vries, E.G.E. (1987). Role of free radicals in an adriamycin-resistant human small cell lung cancer cell line. Cancer Res. , 47, 4613.
Morash, S .C. , Cook, H.W. & Spence, M.W. (1988). Phosphatidylcholine metabolism in cultured cells: catabolism via glycerophosphocholine. Biochim.Biophys. Acta, 961 , 194.
Naruse, S . , Hirakawa, K . , Horikawa, Y. & 5 others (1985). Measurements of in vivo 3 1P nuclear magnetic resonance spectra in neuroectodermal tumors for the evaluation of the effects of chemotherapy. Cancer Res. , 45, 2429.
Ng, T.C., Evanochko, W.T., Hiramoto, R.N. & 6 others (1982). 31P NMR spectroscopy of in vivo tumors. J .Magnetic Resonance, 49, 271 .
Pastan, I . & Gottesman, M.M. (1987). Multiple-drug resistance i n human cancer. N.Engl .J.Med. , 3 16, 1388.
Pommier, T., Kerrigan, D. , Schwartz, R.E. , Swack, J.A. & McCurdy, A. (1986). Altered DNA topoisomerase II activity in chinese hamster cells resistant to topoisomerase II inhibitors. Cancer Res. , 46, 3075.
Riordan, J.R. & Ling, V. (1985). Genetic and biochemical characterization of multidrug resistance. Pharmacol.Ther. , 28, 5 1 .
Sinha, B.K., Katki, A.G. , Batist, G . , Cowan, K.H. & Myers, C.E. (1987). Differential formation of hydroxyl radicals by adriamycin in sensitive and resistant MCT-7 human breast tumor cells: implications for the mechanism of action. Biochemistry, 26, 3776.
60

Steen, R.G., Tamargo, R.J. , McGovern, K.A. & 4 others (1988). In-vivo 31P nuclear magnetic resonance spectroscopy of subcutaneous GL gliosarcoma: effects of tumor growth and treatment with 1 ,3-bis(2-chloroethyl)-1 -nitrosurea on tumor bioenergetics and histology. Cancer Res . , 48, 676.
Steen, R.G. (1989). Response of solid tumors to chemotherapy monitored by in vivo 31P nuclear magnetic resonance spectroscopy: a review. Cancer Res. , 49, 4075.
Yeh, G.C. , Occhipinti, S.J . , Cowan, K.H., Chabner, B.A. & Myers, C.E. (1987). Adriamycin resistance in human tumor cells associated with marked alterations in the regulation of the hexose monophosphate shunt and its response to oxidant stress. Cancer Res. , 47, 5994.
Zijlstra, J .G. , de Vries, E.G.E. & Mulder, N.H. (1987a). Multifactorial drug resistance in an adriamycin-resistant human small cell lung carcinoma cell line. Cancer Res . , 47, 1780.
Zijlstra, J .G. , de Vries, E.G.E., Muskiet, F.A.J . , Martini, I .A., Timmer-Bosscha, H. & Mulder, N.H. (1987b). Influence of docosahexaenoic acid in vitro on intracellular adriamycin concentrations in lymphocytes and human adriamycin-sensitive and -resistant small cell lung cancer cell lines, and on cytotoxicity in the tumor cell lines. Int.I.Cancer, 40, 850.
6 1

62
Chapter 4
TOPOISOMERASES, NEW TARGETS IN CANCER
CHEMOTHERAPY
J.G.Zijlstra, S. de Jong, E.G.E. de Vries, N.H.Mulder. Department of Internal Medicine, University Hospital Groningen, The Netherlands.
SUMMARY
The enzymes involved in the regulation of the three-dimensional structure of the DNA, DNA topoisomerase (I'opo) I and II, are important for the handling of DNA during vital cellular processes as translation, transcription and mitosis. The enzymes are currently being studied intensively, they are being biochemically characterized and their mechanism of action
is better understood. Empirically discovered antitumor drugs appear to interfere with these enzymes,
especially Topo JI. The DNA-Topo II complex, which is an intermediate in the normal enzyme
pathway, is stabilized by the drug andforms a "cleavable complex ", which appears to be
cytotoxic. The drugs involved are e.g. anthracyclines, epipodophyllotoxins and acridines. The central role of this enzyme offers the cell an opportunity for the development of resistance by
down-regulation of this enzyme or the production of resistant mutants, provided the
adaptation does not hamper other viral cell functions.
Knowledge of the working mechanism and the cellular regulation of the
topoisomerases might lead to the selection of most effective drugs and treatment schedules,
and to circumvention of drug-resistance.
63
INTRODUCTION
The newly described group of topologically active enzymes, the DNA topoisomerases,
are of great interest in clinical oncology (1). They appear to be the thus far unidentified
target of several empirically discovered chemotherapeutic anticancer drugs. DNA consists
of large molecules which are too long to be stored in the nucleus in a random way. As a
consequence of its length the molecule behaves as if it was fixed in space. The fixation, the
helical form and the involvement in complex processes such as transcription, induce torsional
strain in the DNA. The torsional strain which may play a role in the regulation of gene
expression has to be controlled for proper transcription . Replication of DNA induces knots
and catenations which have to be released before mitosis. For the handling of the DNA, the
storage, the torsional strain and the separation of strands, the cell needs a specialized system.
Topo I and II (for review see 2,3 ,4) are the enzymes which can adapt the DNA topologically and prepare it for DNA processing.
Recently this enzyme system has been shown to be involved in the mechanism of
action of several chemotherapeutic drugs (4,5). We will discuss the enzyme systems
especially with regard to this aspect and the possible relation to drug-resistance in tumor
cells.
TOPO I
Topo I breaks one DNA strand and passes the other strand, after which the break is
resealed. The linking number, i .e. the times one strand crosses the other, is changed in steps
of one.
The coding gene, TOP I , has been cloned and sequenced in yeast (6, 7). Also, a human
cDNA which encodes Topo I is cloned and sequenced (8). The single-copy gene is located
to chromosome 20q12-13.2 (9). The molecular weight of the major Topo I is approximately
100 kD. The enzyme is a monomer, not ATP dependent and sometimes inhibited by ATP.
The enzyme activity can be stimulated by Mg2+ . There is a salt optimum for the different
functions. A proteinase-resistant and a sensitive domain can be recognized ( 10).
In order to exhibit its function the enzyme preferably binds covalently to one 3'
phosphoryl group in a double-stranded DNA (1 1). Its most important function appears to be
the relaxation of supercoiled DNA. When one strand is nicked, Topo I can probably also
catenate/decatenate and knot/unknot (3). Catenation is the intertwining of two different
double-strand DNA molecules, knots are the result of intertwining of a DNA molecule in
itself.
In yeast mutations were induced in TOPI and TOP2 genes resulting in strains with
non-functional or temperature sensitive Topo I and Topo II. These studies revealed that Topo
64

I is non-essential . Topo I itself can be replaced by Topo II which takes care of the vital DNA
processing otherwise performed by Topo I (6,7, 12). Inhibition of Topo I in a human leukemic cell line by camptothecin resulted in decrease of RNA and DNA synthesis and cell death. However, cell death does not seem to be due to enzyme inhibition ( 13) . The cellular
process requiring the Topo I function is the synthesis of new RNA (14) and probably DNA from template DNA (15) . Topo I is found at sites of active transcription (16) . Possibly it acts as a swivel which prevents the need for circulation of the newly synthesized strand around
the template (15, 17) . Protein kinase C can activate the Topo I activity by phosphorylation
of Topo I (18) .
TOPO II
Topo II exhibits its function by breaking both DNA strands and passing another strand
after which the break is sealed. The linking number is changed by a factor two.
The coding gene has been called TOP2 when it was cloned and sequenced in yeast. The complete nucleotide sequence of the Drosophila Topo II gene has been determined (19). Two cDNA clones encoding a human 170 kD and a 1 80 kD Topo Il are isolated (20). The human 170 kD Topo II gene is localized on chromosome 17 (21). Topo II is isolated from
yeast, D-melanogaster, calf thymus, and murine and human cell lines. The MW is 150-180
kD, in vivo it is a homodimer (10,22-24). The enzyme is ATP and Mg2+-dependent (22).
The optimal concentration of KCl for catalytic activity of the human 180 kD Topo II was 20-
30 mM higher compared to the human 170 kD Topo II, while the 180 kD Topo II activity was less thermal stable (24).
Topo II can relax negatively as well as positively supercoiled DNA, it has the capacity to knot and unknot, and can catenate and decatenate double stranded DNA molecules
(2 ,3,4) . Topo II plays a role in most cellular processes involving DNA. Yeast mutant studies
revealed that Topo II is not essential during normal cell life. However, dividing cells with temperature sensitive Topo II mutants die during mitosis at nonpermissive temperatures
(12,25). Topo II appears to be essential for segregation of daughter molecules at mitosis (10, 1 5 ,26-28). The torsional stress regulation that has a gene regulatory function (29) can also be performed by Topo I (12,25). In non-mutated cells part of this function may be exhibited by Topo II (30). In initiation of replication and fork propagation Topo II might play a non-essential role (31). Topo II is probably also involved in DNA repair (32-34). The
cleavage of DNA occurs at specific sites which are DNase hypersensitive (35, 36). Topo II is a structural protein of the mitotic chromos�me scaffold, in the intact chromosome it is
located at the base of a DNA loop. Topo II might be identical with Scl (37-39). Sci is an immunologically defined protein of the nuclear matrix.
65
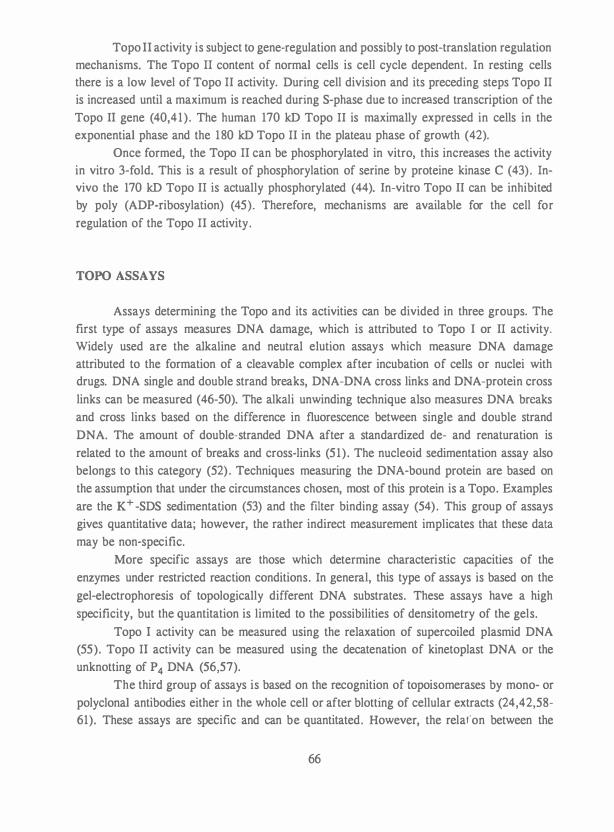
Topo II activity is subject to gene-regulation and possibly to post-translation regulation
mechanisms. The Topo II content of normal cells is cell cycle dependent. In resting cells
there is a low level of Topo II activity. During cell division and its preceding steps Topo II
is increased until a maximum is reached during S-phase due to increased transcription of the
Topo II gene (40,41) . The human 170 kD Topo II is maximally expressed in cells in the
exponential phase and the 180 kD Topo II in the plateau phase of growth (42). Once formed, the Topo II can be phosphorylated in vitro, this increases the activity
in vitro 3-fold. This is a result of phosphorylation of serine by proteine kinase C (43) . In
vivo the 170 kD Topo II is actually phosphorylated (44). In-vitro Topo II can be inhibited
by poly (ADP-ribosylation) (45). Therefore, mechanisms are available for the cell for
regulation of the Topo II activity.
TOPO ASSAYS
Assays determining the Topo and its activities can be divided in three groups. The
first type of assays measures DNA damage, which is attributed to Topo I or II activity.
Widely used are the alkaline and neutral elution assays which measure DNA damage
attributed to the formation of a cleavable complex after incubation of cells or nuclei with
drugs. DNA single and double strand breaks, DNA-DNA cross links and DNA-protein cross
links can be measured (46-50). The alkali unwinding technique also measures DNA breaks
and cross links based on the difference in fluorescence between single and double strand
DNA. The amount of double-stranded DNA after a standardized de- and renaturation is
related to the amount of breaks and cross-links (51). The nucleoid sedimentation assay also
belongs to this category (52) . Techniques measuring the DNA-bound protein are based on
the assumption that under the circumstances chosen, most of this protein is a Topo. Examples
are the K+ -SDS sedimentation (53) and the filter binding assay (54) . This group of assays
gives quantitative data; however, the rather indirect measurement implicates that these data
may be non-specific.
More specific assays are those which determine characteristic capacities of the
enzymes under restricted reaction conditions. In general, this type of assays is based on the
gel-electrophoresis of topologically different DNA substrates. These assays have a high
specificity, but the quantitation is limited to the possibilities of densitometry of the gels.
Topo I activity can be measured using the relaxation of supercoiled plasmid DNA
(55). Topo II activity can be measured using the decatenation of kinetoplast DNA or the
unknotting of P4 DNA (56,57). The third group of assays is based on the recognition of topoisomerases by mono- or
polyclonal antibodies either in the whole cell or after blotting of cellular extracts (24,42,58-61). These assays are specific and can be quantitated. However, the relar"on between the
66

amounts of immunologically recognized Topo molecules and the activity is not necessarily linear. For molecular genetic studies cDNA probes are available (6-9, l.9,20,24).
DRUG INTERACTIONS WITII TOPOISOMERASES
All types of topoisomerases are sensitive to interaction with drugs (5,62). Topo I is inhibited by camptothecin and camptothecin derivatives (13 ,58). Although it seems possible
to replace Topo I by Topo II, camptothecin is cytotoxic, probably by inducing a Topo I-DNA
complex (55,63), similar to drug interactions with Topo II described below. The formation of these complexes at replication forks probably induces the cytotoxicity (64). Trials using camptothecin as a chemotherapeutic drug were terminated due to toxicity (65). CPT- 1 1 , a
camptothecin derivative, shows cytotoxic activity against cells with pleiotropic drug
resistance. It might be of clinical importance that CPT-1 1 is not involved in this membrane based type of cellular resistance against "natural products" (58). CPT- 1 1 is now subject to
phase I trials. Topo I is inhibited by heparin in vitro in nuclear extracts (66). However, heparin does not enter the cell and can therefore not be used as a chemotherapeutic drug.
Topo I is also inhibited by the intercalators of the acridine group. Although the cytotoxicity of the acridines is usually attributed to Topo II inhibition, this Topo I inhibition needs further attention (67). Actinomycin-D stabilizes the Topo I-DNA complex leading to termination of
the transcription of ribosomal RNA, this might result in cytotoxicity (68). Several drugs in clinical use influence Topo II activity. The bacterial gyrase inhibitors
novobiocin and oxolinic or nalidixic acid derivatives inhibit the formation of a Topo II-DNA complex by inhibiting the enzyme activity (69,70). Inhibition of break formation by
novobiocin or ethidium bromide also reduces cytotoxicity (70). Another inhibitor of the Topo II activity is fostriecin (71).
A substantial amount of evidence has been gathered for the role of Topo II in the cytotoxic effect of chemotherapeutic drugs. The drugs involved are epipodophyllotoxins
(72,73), anthracyclines (47,74), acridines (24,47,48), mitoxantrone (75) and ellipticins
(24, 76). The first indications for a role of Topo II came from alkaline elution experiments
revealing that drug induced DNA breaks were associated with DNA protein cross-links
(47,49,50). The enzymatic nature of the reaction was suggested by the temperature sensitivity
and the saturability (77). Experiments with purified Topo II revealed that this enzyme was involved in the
formation of the DNA protein complex and the DNA protein related breaks (54,73,74). This
evidence leads to the hypothesis that Topo II is fixed on the DNA to form a cleavable complex. During the breakage-reunion reaction, Topo II can form a cleavable complex with
DNA with the covalent linking of each Topo subunit to each 5 '-phosphoryl end of the broken DNA through a phosphotyrosyl bond (54,78). These drugs then interfere with the breakage-
67

reunion reaction of Topo II by stabilizing this cleavable complex (54,70-74) , probably by interfering with the Topo II-mediated religation of DNA (79). In-vitro this results in DNA damage under protein denaturating circumstances, which is measured as protein dependent
strand breaks and DNA-protein cross-links in the alkaline elution assay (47). Now there is
evidence, that the covalent Topo II-cleaved DNA complex is an active intermediate in the enzyme's catalytic cycle (80).
Several lines of evidence support the cytotoxicity of these breaks. Related drugs from one family, such as the acridines, show a good correlation between the number of breaks and
cytotoxicity. The same is found for anthracyclines (48,54,73,78). A decreased amount of
breaks during quiescence also correlates with cytotoxicity in some cell lines (59,82). However, some findings need further investigation. The breaks induced by different types of drugs are not equally toxic (81). Breaks induced by adriamycin and mitoxantrone are more
toxic than VP-16 and m-AMSA induced breaks (8 1 , 83) . When Topo II activity is increased by oestrogen in human 0reast cai11,,c1 1,,c11�, "'"' 1.11�n. ..;a .... 15 ... i ..... reases as well as the
cytotoxicity of VP 16-213 and mAMSA (81). Increasing the number of breaks induced by
adriamycin in a breast cell line by oestrogen does not uniformly increase cytotoxicity (81) .
Fluctuations in the number of DNA strand breaks and the extent of cytotoxicity do not
always parallel each other during the different phases of the cell cycle. These findings
suggest additional factors determining the cytotoxicity of breaks (59, 8 1 , 83-86). These factors can be a better repair capacity as suggested for VP-16 and m-AMSA induced breaks, or unidentified cellular changes induced by the drug in addition to breaks, which increase the
toxicity (81 , 86).
Interference of the stabilized complex with the replication fork similar to the Topo
I-DNA complex might lead to toxicity (64 ) . The formation of non-viable DNA recombination
after sister chromatid exchange or other illegitimate recombinations induced by the cleavable
complex might induce toxicity (87, 88, 89) . The localization of the cleavable complex in the
genome can be of importance for the toxicity. Conformational changes in the DNA, as seen
during mitosis, transcription and replication might also influence cytotoxicity. Drugs which
intercalate with DNA and thus change the DNA conformation , have therefore a more
complex mode of action (80,83 ,85). This stability and reversibility is different for the groups
of drugs influencing the cytotoxicity of the cleavable complex (81 , 83, 86). In conclusion, cytotoxic drugs which interfere with topoisomerases stabilize a
cleavable complex which leads to the cytotoxic effect. The mechanism of this toxicity
remains to be elucidated .
TOPOISOMERASES AND DRUG-RESISTANCE
The postulated central role of Topo II in the cytotoxic mechanism of several drugs
68

offers the cell a good opportunity for defence against those drugs. Probably the most frequent
reason for Topo II related resistance is the physiological decrease of Topo II in the Go phase of the cell cycle. The decrease in Topo II and the relative resistance during quiescence has
been shown for several cell lines, human lymphocytes and murine tissues (60,82,89-91) . L12l0 cells remain sensitive to DNA breaking when quiescent, this cell line has no cell cycle
phases during which Topo II content is decreased. However, there is a reduced cytotoxicity of drugs indicating additional factors inducing toxicity (59).
For Topo I resistance there may be no cycle specificity. A human camptothecinresistant cell line has a decreased level of Topo I, but also the pure enzyme is less
camptothecin sensitive, suggesting a combined type of resistance ( 13,92). A Chinese hamster ovary cell line resistant to camptothecin also shows a combination of Topo I mutation and a declined Topo I content (93). In human lung carcinoma cell lines as well as a murine leukemia cell line resistant to camptothecin, the cellular Topo I content was decreased, while
the Topo II content was elevated (94-96).
A non-physiological decrease in drug-induced Topo II-DNA complexes would also
lead to a decreased cytotoxicity. This decrease could be due to an altered enzyme molecule
or a decrease in enzyme level, or a combination of both (85,96-104). There are studies with human and chinese hamster cell lines, showing that Topo II activity was unchanged in the
resistant cell lines, but the formation of the drug-induced cleavable-complex was decreased
(97, 102, 103) . In human KB cell lines, VP-16 and VM-26 resistance is a consequence of a
reduced cellular uptake of drug and a decreased Topo II content (105, 106).
In an amsacrine-resistant P388 leukemia cells the ratio between the 170 kD and the
1 80 kD Topo II was different compared to the wild type, since only the amount of 1 70 kD Topo II was reduced ( 104) . The enzymes were isolated and the cleavage activity of the 1 80
kD Topo II was four-fold less stimulated by VM-26 than DNA cleavage activity of the 170
kD Topo II (24) . Isolated Topo II from VM-26 (101 , 107, 108) and m-AMSA resistant human
leukemia cells (103) was more ATP-dependent (101 , 103 , 107 , 108), more ionic-strength dependent (103) and more temperature-sensitive (107) than Topo II from sensitive cells.
The reduced amount of Topo II could be due to rearrangement of one allele of the
Topo II gene and hypermethylation of the Topo II gene (96) or a decreased copy number of one allele and a mutation in the second allele leading to a reduction in Topo II mRNA (109).
In contrast, in a nitrogen mustard-resistant human cell Topo II activity was increased and the sensitivity for Topo II inhibitors was also increased (33). A change in the ratio of
170 and 180 kD Topo II in opposite direction was observed in the resistant cells, in which the amount of 1 80 kD Topo II was in1-reased (1 10)
Attention has to be paid to the factors influencing the cytotoxicity of Topo II related breaks, such as DNA conformational state ( 1 1 1), repair capacity ( 1 12, 1 13) and polyamine
content ( 1 14, 1 15). Important effects could be induced by agents as oestrogens (81), tumor
necrosis factor ( 1 16, 1 17) or protein kinase C stimulators (43, 1 18) and growth factors
69

(1 19, 120).
CONCLUSION
The recognition of topoisomerases as important intermediates in the cytotoxic effect
of several antitumor drugs has major implications for the development of pre-clinical and
clinical cancer chemotherapy.
New drugs can be developed with high affinity for topoisomerases. Also drug-resistant
types of topoisomerases can be used to select more effective drugs. Measurement of drug
sensitivity of patient material is theoretically also possible, but this will be difficult to
interpret by sampling errors and heterogeneity.
Knowledge about cell cycle specific drug-resistance might result in better timing of
therapy schedules. The understanding of the mechanism regulating Topo activity might offer
the possibility for influencing these mechanisms by increasing Topo activity and cytotoxicity.
As described above some tumor types respond to humoral factors as oestrogens, tumor
necrosis factor and growth factors with an increase in Topo II activity and sensitivity to
drugs.
The elucidation of part of the mechanism of action of several mostly empirically
discovered drugs might lead to the development of more active drugs and to therapy
schedules with combinations and sequences of drugs based on knowledge about
topoisomerases. Further research is necessary to elucidate the mechanism by which the
formation of a cleavable complex leads to cytotoxicity.
REFERENCES
1 . Epstein RJ : Topoisomerases in human disease. Lancet i, 52 1 (1988). 2. Wang JC: DNA topoisomerases. Ann Rev Biochem 54, 665 (1985). 3 . Wang JC: Recent studies of DNA topoisomerases. Biochim Biophys Acta 909, 1 (1987). 4. Liu LF: DNA topoisomerase poisons as antitumor drugs . Annu Rev Biochem 58, 35 1 (1989). 5 . Ross WE, Sull ivan DM, Chow K-C: Altered function of DNA topoisomerases as a basis for
antineoplastic drug action. In: Important advances in oncology 1988. De Vita VT, Hellman S, Rosenberg SA, eds. LB.Lippincott, Philadelphia, 1988.
6. Thrash C, Bankier AT, Barell BG, Sternglanz R: Cloning, characterization and sequence of the yeast DNA topoisomerase I gene. Proc Natl Acad Sci 82, 4374 (1985).
7 . Goto T, Wang JC: Cloning o f yeast TOP I , the gene encoding DNA topo-isomerase I , and construction of mutants defective in both DNA topoiso-merase I and DNA topoisomerase II. Proc Natl Acad Sci 82, 7 178 ( 1985).
8 . D'Arpa P, Machlin PS, Ratrie H, Rothfield NF, Cleveland DW, Earnshaw WC: cDNA cloning of human DNA topoisomerase I, catalytic activity of 67. 7-k DNA carboxyl-terminal
70

fragment. Proc Natl Acad Sci 85, 2543 (1988). 9. Juan C-C, Hwang J, Liu AA, Whang-Peng J, Knutsen T, Huebner K, Croce CM, Zhang H,
Wang JC, Liu LF: Human DNA topoisomerase I is encoded by a single-copy gene that maps to chromosome region 20ql 2-13.2. Proc Natl Acad Sci 85, 8910 (1988).
10. Riou J-F, Gabillot M, Philippe M, Schrevel J, Riou G: Purification and characterization of Plasmodium berghei DNA topoisomerase I and II: drug action, inhibition of decatenation and relaxation, and stimulation of cleavage. Biochemistry 24, 147 1 (1986).
1 1 . Been MD, Burgess RR, Champoux JJ: Nucleotide sequence preference at rat liver and wheate germ type 1 DNA topoisomerase breakage sites in duplex SV40 DNA. Nucleic Acid Res 12, 3097 (1984).
12. Uemura T, Yanagida M: Isolation of type I and II DNA topoisomerase mutants from fission yeast: single and double mutants show different phenotypes in cell growth and chromatin organization. EMBO J 3, 1737 (1984).
13 . Andoh T, Ishii K, Suzuki Y, lkegami Y, Kusunoki Y, Takemoto Y, Okada K: Characterization of a mammalian mutant with camptothecin-resistant DNA topoisomerase I. Proc Natl Acad Sci 84, 5565 (1987).
14. Zhang H, Wang JC, Liu LF: Involvement of DNA topoisomerase I in transcription of human ribosomal RNA genes. Proc Natl Acad Sci 85, 1060 (1988).
15. Yang L, Wold MS, Li JJ, Kelly TJ, Liu LF: Roles of DNA topoisomerases in Simian Virus 40 DNA replication in vitro. Proc Natl Acad Sci 84, 950 (1987).
16. Javaherian K, Liu LF: Association of eukaryotic DNA topoisomerase I with nucleosomes and chromosomal proteins. Nucleic Acid Res 1 1 , 461 (1983).
17 . Liu LF, Wang JC: Supercoiling of the DNA template during transcription. Proc Natl Acad Sci 84, 7024 (1987).
18 . Pommier Y, Kerrigan D, Hartman KD, Glazer RI: Phosphorylation of mammalian DNA topoisomerase I and activation by protein kinase C. J Biol Chem 265, 9418 (1990).
19. Wyckoff E, Natalie D, Nolan JM, Lee M, Hsieh T-S: Structure of the Drosophila DNA topoisomerase II gene. J Mol Biol 205, 1 (1989).
20. Chung TDY, Drake FH, Tan KB, Per SR, Crooke ST, Mirabell i CK: Characterization and immunological identification of cDNA clones encoding two human DNA topoisomerase II isoenzymes. Proc Natl Acad Sci USA 86, 9431 (1989).
2 1 . Tsai-Pflugfelder M , Liu LF, Liu AA, Tewey KM, Whang-Peng J , Knutsen T , Huebner K, Croce KM, Wang JC: Cloning and sequencing of cDNA encoding human DNA topoisomerase II and localization of the gene to chromosome region 17q21-22. Proc Natl Acad Sci 85, 7 177 (1988).
22. Osheroff N, Shelton ER, Brutlag DL: DNA topoisomerase II from Drosophila melanogaster. J Biol Chem 258, 9536 (1983).
23. Miller KG, Liu LF, Englund PT: A homogeneous type II DNA topoisomerase from Hela cell nuclei. J Biol Chem 258, 9334 (1983).
24. Drake FH, Hofmann GA, Bartus HF, Mattern MR, Crooke ST, Mirabelli CK: Biochemical and pharmacological properties of p 170 and p 180 forms of topoisomerase II. Biochemistry 28, 8 154 (1989).
25. DiNardo S, Voelkel K, Sternglanz R: DNA topoisomerase II mutant of Saccharomyces cerevisiae: topoisomerase II is required for segregation of daughter molecules at the termination of DNA replication. Proc Natl Acad Sci 8 1 , 2616 (1984).
26. Holm C, Goto T, Wang JC, Botstein D: DNA topoisomerase II is required at the time of mitosis in yeast. Cell 41 , 553 (1985).
27. Uemura T, Yanagida M: Mitotic spindle pulls but fails to separate chromo-somes in type II DNA topoisomerase mutants: uncoordinated mitosis. EMBO J 5, 1003 (1986).
28. Charron M, Hancock R. DNA topoisomerase II is required for formation of mitotic chromosomes in chinese hamster ovary cells: studies using the inhibitor 4'-

demethylepipodophyllotoxin 9-(4,6-0-thenylidene-Jl-D-glucopyranoside). Biochemistry 29, 9531 (1990).
29. Hirose S, Suzuki Y: In vitro transcription of eukaryotic genes is affected differently by the degree of DNA supercoiling. Proc Natl Acad Sci 85, 7 1 8 (1988).
30. Tsutsui K, Tsutsui K, Sakurai H, Shohmori T, Oda T: Levels of topoiso-merase II and DNA polymerase a are regulated independently in developing neuronal nuclei . Biochem Biophys Res Comm 138, 1 1 16 (1986).
3 1 . Nelson WG, Liu LF, Coffey DS: Newly replicated DNA is associated with DNA topoisomerase II in cultured rat prostatic adenocarcinoma cells. Nature 322, 1 87 (1986).
32. Mattern MR, Paone RF, Day III RS: Eukaryotic DNA repair is blocked at different steps by inhibitors of topoisomerases and of DNA polymerases a and 6. Biochim Biophys Acta 697, 6 (1982).
33. Tan KB, Mattern MR, Boyce RA, Schein PS: Elevated DNA topoisomerase II activity in nitrogen mustard-resistant human cells. Proc Natl Acad Sci 84, 7668 (1987).
34. Downes CS, Johnson RT: DNA topoisomerases and DNA repair. Bio Essays 8, 179 (1988). 35. Udvardy A, Schedl P, Sander M, Hsieh T-S : Topoisomerase II cleavage in chromatin. J Mo!
Biol 19 1 , 23 1 (1986). 36. Reitman M, Felsenfeld G: Developmental regulation of topoisomerase II sites and DNase !
hypersensitive sites in the chicken 6-globin locus. Mo! Cell Biol 10, 2774 (1990). 37. Gasser SM, Laroche T, Falquet J, Boy de la Tour E, Laemmli UK: Metaphase chromosome
structure: involvement op topoisomerase II. J Mol Biol 188, 613 (1986). 38. Berrios M, Osheroff N, Fisher PA: In situ localization of DNA topoiso-merase II, a major
polypeptide component of the drosophila nuclear matrix fraction. Proc Natl Acad Sci 82, 4142 (1985).
39. Adachi Y, Klis E, Laemmli UK: Preferential, cooperative binding of DNA topoisomerase II to scaffold-associated regions. EMBO J 8, 3997 (1989).
40. Hsiang Y-H, Wu H-Y, Liu LF: Proliferation-dependent regulation of DNA topoisomerase II in cultured human cells. Cancer Res 48, 3230 (1988).
41 . Heck MMS, Hittelman WN, Earnshaw WC: Differential expression of DNA topoisomerases I and II during the eukaryotic cell cycle. Proc Natl Acad Sci 85, 1086 (1988).
42. Woessner RD, Chung TDY, Hofmann GA, Mattern MR, Mirabelli CK, Drake FH, Johnson RK. Differences between normal and ras-transformed NIH-3T3 cells in expression of the l 70kD and 180 kD forms of topoisomerase II. Cancer Res 50, 2901 (1990).
43. Sahyoun N, Wolf M, Hesterman J, Hsieh T-S, Sander M, LeVine III H, Chang K-J, Cuatrecasas P: Protein kinase C phosphorylates topoisomerase II: topoisomerase activation and its possible role in phorbol ester-induced differentiation of HL-60 cells. Proc Natl Acad Sci 83, 1603 (1986).
44. Heck MMS, Hittelman WN, Earnshaw WC. In vivo phosphorylation of the 170 kDa form of eukaryotic DNA topoisomerase II. J Biol Chem 264, 15161 (1989).
45. Darby MK, Smitt B, Jongstra-Bilen J, Vosberg HP: Inhibition of calf thymus type II DNA topoisomerase by poly (ADP-ribosilation). EMBO J 4, 2129 (1985).
46. Kohn KW, Ewig RA, Erickson LC, Zwelling LA: Measurement of strand breaks and cross l inks by alkaline elution. In: DNA repair: A laboratory manual of research procedures. Friedberg EC, Hanawalt PC, eds . Marcel Dekker, New York, 198 1 .
47. Zwelling LA, Michaels S, Erickson LC, Ungerleider RS, Nichols M, Kohn KW: Proteinassociated deoxyribonucleic acid strand breaks in LI 210 cells treated with the deoxyribonucleic acid intercalating agents 4' -(9-acri-dinylamino)methanesulfon-m-anisidide and adriamycin. Biochemistry 20, 6553 (1981).
48. Nelson EM, Tewey KM, Liu LF: Mechanism of antitumor drug action: poisoning of mammalian DNA topoisomerase II on DNA by 4'-(9-acridinyl-amino)-methanesulfon-maniside. Proc Natl Acad Sci 8 1 , 1361 (1984).
72

49. Ross WE, Glaubiger DL, Kohn KW: Protein-associated DNA breaks in cells treated with adriamycin or ellipticin. Biochim Biophys Acta 5 19, 23 (1979).
50. Ross WE, Glaubiger DL, Kohn KW: Qualitative aspects of intercalator-induced DNA strand breaks. Biochim Biophys Acta 562, 4 1 (1979).
5 1 . Kanter PM, Schwartz HS: A fluorescence enhancement assay fo r cellular DNA damage. Mot Pharmacol 22, 145 (1982).
52 . Weniger P: An improved method to detect small amounts of radiation damage in DNA of eukaryotic cells. Int J Radiat Biol 36, 197 (1979).
53 . Trask DK, DiDonato IA, Muller MT: Rapid detection and isolation of covalent DNA/protein complexes: application to topoisomerase I and II. EMBO J 3, 671 (1984).
54. Liu LF, Rowe TC, Yang L, Tewey KM, Chen GL: Cleavage of DNA by mammalian DNA topoisomerase II. J Biol Chem 258, 15365 (1983).
55. Hsiang Y-H, Herzberg R, Hecht S, Liu LF: Camptothecin induces protein-linked DNA breaks via mammalian DNA topoisomerase I. J Biol Chem 260, 14873 (1985).
56. Liu LF, Davis JL, Calendar R: Novel topologically knotted DNA from bacteriophage P4 capsids: studies with topoisomerases. Nucleic Acids Res 9, 3979 (1981).
57. Marini JC, Miller KG, Englund PT: Decatenation of kinetoplast DNA by topoisomerase II. J Biol Chem 255, 4976 (1980).
58. Tsuruo T, Matsuzaki T, Matsushita M, Saito H, Yokokura T: Antitumor effect on CPT- 1 1 , a new derivative o f camptothecin, against pleiotropic drug-resistant tumors i n vitro and in vivo. Cancer Chemother Pharmacol 2 1 , 71 (1988).
59. Sullivan OM, Latham MD, Ross WE: Proliferation-dependent topoisomerase II content as a determinant of antineoplastic drug action in human, mouse and Chinese hamster ovary cells. Cancer Res 47, 3973 (1987).
60. Nelson WG, Cho KR, Hsiang Y-H, Liu LF, Coffey DS: Growth-related elevations of DNA topoisomerase II levels found in Dunning R3327 rat prostatic adenocarcinomas. Cancer Res 47, 3246 (1987).
6 1 . Drake FH, Zimmerman JP, McCabe FL, Bartus HF, Per SR, Sullivan OM, Ross WE, Mattern MR, Johnson RK, Crooke ST, Mirabelli CK: Purification of topoisomerase II from amsacrine-resistant P388 leukemia cells. J Biol Chem 262, 16739 (1987).
62. Drlica K, Franco RI: Inhibitors of DNA topoisomerases. Biochemistry 27, 2253 (1988). 63. Hsiang Y-H, Liu LF: Identification of mammalian DNA topoisomerase I as an intracellular
target of the anticancer drug camptothecin. Cancer Res 48, 1722 (1988). 64. Hsiang YH, Lihou MG, Liu LF: Arrest of replication forks by drug-stabilized topoisomerase
I-DNA cleavable complexes as a mechanism of cell killing by camptothecin. Cancer Res 49, 5077 (1989).
65. Gottlieb JA, Guarino AM, Call JB: Preliminary pharmacologic and clinical evaluation of camptothecin (NSC-100880). Cancer Chemother Rep 54, 461 (1970).
66. Ishii K, Futaki S, Uchiyama H, Nagasawa K, Andoh T: Mechanism of inhibition of mammalian DNA topoisomerase I by heparin. Biochem J 241 , 1 1 1 (1987).
67. Pommier Y, Covey JM, Kerrigan D, Markovits J, Pham R: DNA unwinding and inhibition of mouse leukemia L l210 DNA topoisomerase I by intercalators. Nucleic Acids Res 15, 671 3 (1987).
68. Trask DK, Muller MT: Stabilization of type I topoisomerase-DNA covalent complexes by actinomycin D. Proc Natl Acad Sci 85, 1417 (1988).
69. Ross WE: DNA topoisomerases as targets for cancer therapy. Biochem Pharmacol 34, 4191 (1985).
70. Yang L, Rowe TC, Liu LF: Identification of DNA topoisomerase II as an intracellular target of antitumor epipodophyllotoxins in Simian Virus 40-infected monkey cells. Cancer Res 45, 5872 (1985).
73
7 1 . Boritzki TJ, Wolfard TS, Besserer JA, Jackson RC, Fry DW: Inhibition of type II topoisomerase by fostriecin. Biochem Pharm 37, 4063 (1988).
72. Chen GL, Yang L, Rowe TC, Halligan BD, Tewey KM, Liu LF: Nonintercalative antitumor drugs interfere with the breakage-reunion reaction of mammalian DNA topoisomerase II. J Biol Chem 259, 13560 (1984).
73. Ross W, Rowe T, Glisson B, Yalowich J, Liu L: Role of topoisomerase II in mediating epipodophyllotoxin-induced DNA cleavage. Cancer Res 44, 5857 (1984).
74. Tewey KM, Rowe TC, Yang L, Halligan BD, Liu LF: Adriamycin-induced DNA damage mediated by mammalian DNA topoisomerase II. Science 226, 466 (1984).
75. Crespi MD, Ivanier SE, Genovese J, Baldi A: Mitoxantrone affects topoiso-merase activities in human breast cancer cells. Biochem Biophys Res Comm 1 36, 521 (1986).
76. Vilarem M-J, Gras M-P, Larsen C-J: BD40, an ellipticine-related DNA intercalative agent induces DNA-protein bridges in vivo. Nucleic Acids Res 12, 8653 (1984).
77. Zwelling LA, Kerrigan D, Michaels S, Kohn KW: Cooperative sequestration of m-AMSA in Ll210 cells. Biochem Pharmacol 3 1 , 3269 (1982).
78. Rowe TC, Chen GL, Hsiang Y-H, Liu LF: DNA damage by antitumor acridines mediated by mammalian DNA topoisomerase II . Cancer Res 46, 2021 (1986).
79. Robinson MJ, Osheroff N: Stabilization of the topoisomerase II-DNA cleavage complex by antineoplastic drugs: inhibition of enzyme-mediated DNA religation by 4' -(9-acridinylamino)methanesulfon-m-aniside. Biochemistry 29, 251 1 (1990).
80. Gale KC, Osheroff N: Uncoupling the DNA cleavage and religation activities of topoisomerase II with a single-stranded nucleic acid substrate: Evidence for an active enzymecleaved DNA intermediate. Biochemistry 29, 9538 (1990).
8 1 . Epstein RJ , Smith PJ : Estrogen-induced potentiation of DNA damage and cytotoxicity in human breast cancer cells treated with topoisomerase II-interactive antitumor drugs. Cancer Res 48, 297 (1988).
82. Robbie MA, Baguley BC, Denny WA, Gavin JB, Wilson WR: Mechanism of resistance of noncycling mammalian cells to 4' -(9-acridinylamino) methanosulfon-m-anisidide: comparison of uptake, metabolism, and DNA breakage in log- and plateau-phase Chinese hamster fibroblast cell cultures. Cancer Res 48, 3 10 (1988).
83 . Fox ME, Smith PJ: Long-term inhibition of DNA synthesis and the persistence of trapped topoisomerase II complexes in determining the toxicity of the antitumor DNA intercalators mAMSA and mitoxantrone. Cancer Res 50, 5813 (1990).
84. Chow K-C, Ross WE: Topoisomerase-specific drug sensitivity in relation to cell cycle progression. Mol Cell Biol 7, 3 1 19 (1987).
85. Pommier Y, Schwartz RE, Zwelling LA, Kerrigan D, Mattern MR, Charcosset JY, Jacquemin-Sablon A, Kohn KW: Reduced formation of protein-associated DNA strand breaks in Chinese hamster cells resistant to topoisomerase II inhibitors. Cancer Res 46, 61 1 (1986).
86. Caldecott K, Banks G, Jeggo P: DNA double-strand break repair pathways and cellular tolerance to inhibitors of topoisomerase II. Cancer Res 50, 5778 (1990).
87. Bae YS, Kawasaki J, Ikeda H, Liu LF: Illegitimate recombination mediated by calf thymus DNA topoisomerase II in vitro. Proc Natl Acad Sci 85, 2076 (1988).
88. Pommier Y, Kerrigan D, Covey JM, Kao-Shan C-S, Whang-Peng J : Sister chromatid exchanges, chromosomal aberrations, and cytotoxicity produced by antitumor topoisomerase II inhibitors in sensitive (DC3F) and resistant (DC3F/9-0HE) Chinese hamster cells. Cancer Res 48, 512 (1988).
89. Dillehay LE, Denstman SC, Williams JR: Cell cycle dependence of sister chromatid exchange induction by DNA topoisomerase II inhibitors in Chinese hamster V79 cells. Cancer Res 47, 206 (1987).
90. Heck MMS, Earnshaw WC: Topoisomerase II: a specific marker for cell proliferation. I Cell Biol 103, 2569 (1986).
74

9 1 . Markovits J , Pommier Y , Kerrigan D , Covey JM, Tilchen EI , Kohn KW : Topoisomerase 11-mediated DNA breaks and cytotoxicity in relation to cell proliferation and the cell cycle in NIH 3T3 fibroblasts and Ll210 leukemia cells. Cancer Res 47, 2050 (1987).
92. Kjeldsen E, Bonven BJ, Andoh T, Ishii K, Okada K, Bolund L, Westergaerd 0: Characterization of a camptothecin-resistant human DNA topoisomerase I. J Biol Chem 263, 3912 (1988).
93. Gupta RS, Gupta R, Eng B, Lock RB, Ross WE, Hertzberg RP, Caranfa MJ, Johnson RK: Camptothecin-resistant mutants of Chinese hamster ovary cells containing a resistant form of topoisomerase I. Cancer Res 48, 6404 (1988).
94. Sugimoto Y, Tsukahara S, Oh-hara T, lsoe T, Tsuruo T: Decreased expression of DNA topoisomerase I in camptothecin-resistant tumor cell lines as determined by a monoclonal antibody. Cancer Res 50, 6925 (1990).
95. Sugimoto Y, Tsukahara S, Oh-hara T, Liu LF, Tsuruo T: Elevated expression of DNA topoisomerase II in camptothecin-resistant tumor cell l ines. Cancer Res 50, 7962 (1990).
96. Tan KB, Mattern MR, Eng W-K, McCabe FL, Johnson RK: Nonreproductive rearrangement of DNA topoisomerase I and II genes:correlation with resistance to topoisomerase inhibitors. J Natl Cancer Inst 8 1 , 1732 (1989).
97. Glisson B, Gupta R, Smallwood-Kentro S, Ross W: Characterization of acquired epipodophyllotoxin resistance in a Chinese hamster ovary cell line: loss of drug-stimulated DNA cleavage activity. Cancer Res 46, 1934 (1986).
98. Pommier Y, Kerrigan D, Schwarts RE, Swack JA, Mccurdy A: Altered DNA topoisomerase II activity in Chinese hamster cells resistant to topoisomerase II inhibitors. Cancer Res 46, 3075 (1986).
99. Long BH, Musial ST, Brattain MG: DNA breakage in human lung carcinoma cells and nuclei that are naturally sensitive or resistant to etoposide and teniposide. Cancer Res 46, 3809 (1986).
100. Deffie AM, Batra JK, Goldenberg GJ: Direct correlation between DNA topoisomerase II activity and cytotoxicity in adriamycin-sensitive and -resistant P388 leukemia cell lines. Cancer Res 49, 58 (1989).
1 O I . Danks MK, Schmidt CA, Cirtain MC, Suttle DP, Beck WT: Altered catalytic activity of and DNA cleavage by DNA topoisomerase II from human leukemic cells selected for resistance to VM-26. Biochemistry 27, 8861 (1988).
102. Estey EH, Silberman L, Beran M, Andersson BS, Zwelling LA: The inter-action between nuclear topoisomerase II activity from human leukemia cells, exogenous DNA, and 4'-(9-acridinylamino)methanesulfon-m-aniside (m-AMSA) or 4-(4,6-0-ethylidene-8-Dglucopyranoside) (VP-16) indicates the sensitivity of the cells to the drugs. Biochem Biophys Res Comm 47, 787 (1987).
103 . Zwelling LA, Hinds M, Chan D, Mayes J, Sie KL, Parker E, Silberman L, Radcliffe A, Beran M, Blick M: Characterization of an amsacrine-resistant line of human leukemia cells. J Biol Chem 264, 1641 1 (1989).
104. Drake FH, Zimmerman JP, McCabe FL, Bartus HF, Per SR, Sullivan DM, Ross WE, Mattern MR, Johnson RK, Crooke ST, Mirabelli CK: Purification of topoisomerase II from amsacrine-resistant P388 leukemia cells. J Biol Chem 262, 16739 (1987).
105. Ferguson PJ, Fisher MH, Stephenson J, Li D, Zhou B, Cheng Y: Combined modalities of resistance in etoposide-resistant human KB cell lines. Cancer Res 48, 5956 (1988).
106. Matsuo K, Kohno K, Takano H, Sato S, Kiue A, Kuwano M: Reduction of drug accumulation and DNA topoisomerase II activity in acquired teniposide-resistant human cancer KB cell lines. Cancer Res 50, 5819_(1990).
107. Sullivan DM, Latham MD, Rowe TC, Ross WE: Purification and characterization of an altered topoisomerase II from a drug-resistant Chinese hamster ovary cell line. Biochemistry 28, 5680 (1989).
75
108. Danks MK, Schmidt CA, Deneka DA, Beck WT: Increased ATP requirement for activity of and complex formation by DNA topoisomerase II from human leukemia CCRF-CEM cells selected for resistance to teniposide. Cancer Commun I , 101 (1989).
109. Deffie AM, Bosman DJ, Goldenberg GJ: Evidence for a mutant allele of the gene for DNA topoisomerase II in adriamycin-resistent P388 murine leukemia cells. Cancer Res 49, 6879 (1989).
1 10. Tan KB, Mattern MR, Boyce RA, Schein PS: Unique sensitivity of nitrogen mustard-resistant human Burkitt's lymphoma cells to novobiocin. Biochem Pharm 37, 441 1 (1988).
1 1 1 . Estey E , Adlakha RC, Hittelman WN, Zwelling LA: Cell cycle stage dependent variations in drug-induced topoisomerase II mediated DNA cleavage and cytotoxicity. Biochemistry 26, 4338 (1987).
1 12 . Zijlstra JG, de Vries EGE, Mulder NH: Multifactorial drug resistance in an adriamycinresistant human small cell lung carcinoma cell line. Cancer Res 47, 1780 (1987).
1 13 . Deffie AM, Alam T, Seneviratne C, Beenken SW, Batra JK, Shea TC, Henner WD, Goldenberg GJ: Multifactorial resistance to adriamycin: relationship of DNA repair, glutathione transferase activity, drug efflux, and P-glycoprotein in cloned cell lines of adriamycin-sensitive and -resistant P388 leukemia. Cancer Res 48, 3595 (1988).
1 14. Dorr RT, Liddil JD, Gerner EW: Modulation of etoposide cytotoxicity and DNA strand scission in L1210 and 8226 cells by polyamines. Cancer Res 46, 3891 (1986).
1 15 . Pommier Y, Kerrigan D, Kohn K. Topological complexes between DNA and topoisomerase II and effects of polyamines. Biochemistry 28, 995 (1989).
1 16. Alexander RB, Nelson WG, Coffey DS: Synergistic enhancement by tumor necrosis factor of in vitro cytotoxicity from chemotherapeutic drugs targeted at DNA topoisomerase II. Cancer Res 47, 2403 (1987).
1 17 . Utsugi T , Mattern MR, Mirabelli CK, Hanna N. Potentiation of topoisomerase inhibitorinduced DNA strand breakage and cytotoxicity by tumor necrosis factor: enhancement of topoisomerase activity as a mechanism of potentiation. Cancer Res 50, 2636 (1990).
1 18. Zwelling LA, Hinds M, Chan D, Altschuler E, Mayes J, Zipf TF: Phorbol ester effects on topoisomerase II activity and gene expression in HL-60 human leukemia cells with different proclivities towards monocytoid differentiation. Cancer Res 50, 7 1 16 (1990).
1 19. Miskimins R, Miskimins WK, Bernstein H, Shimizu N: Epidermal growth factor-induced topoisomerase(s) . Exp Cell Res 146, 53 (1983).
120. Towatari M, Ito Y, Morishita Y, Tanimoto M, Kawashima K, Morishima Y, Andoh T, Saito H: Enhanced expression of DNA topoisomerase II by recombinant human granulocyte colonystimulating factor in human leukemia cells. Cancer Res 50, 7 198 (1990).
76

Chapter S
REDUCED DNA TOPOISOMERASE II ACTIVITY AND DRUG-INDUCED DNA CLEAVAGE ACTIVITY IN AN
ADRIAMYCIN-RESISTANT HUMAN SMALL CELL
LUNG CARCINOMA CELL LINE
Steven de Jong, Jan G. Zijlstra, Elisabeth G.E. de Vries and Nanno H. Mulder. From the Division of Medical Oncology, Department of Internal Medicine, University
Hospital, Oostersingel 59 , 9713 EZ Groningen, The Netherlands.
SUMMARY
In a previous study we suggested that, in addition to the reduced adriamycin accumulation , part of the resistance in an adriamycin resistant hwnan small cell lung carcinoma cell line (GLC/ADR) could be explained by supposing a changed adriamycin
DNA-Topo II interaction. The present study showed that the 1 70 kD P-glycoprotein was not overexpressed in GLC/ADR and that verapamil did not reverse the adriamycin resistance. GLC/ADR expressed cross-resistance to teniposide (VM-26), etoposide (VP-16), 4 '-(9-
acridinylamino) methanesulfon-m-anisidide (m-AMSA) and mitoxantrone. Further
investigations of the drug-Topo II interaction revealed that the decatenation activity of Topo
II was two- to three-fold reduced in both cellular and nuclear extracts from GLC/ADR. Topo
I activities appeared similar in extracts from GLC/ADR and the parental sensitive cell line
(GLC�. The slight increase in doubling time from 15 to 18 h, while the cell cycle distribution
remained unchanged, could not account for the reduced Topo II activity in GLC/ADR. VP-
16 and m-AMSA induced DNA cleavage was five-fold reduced in cellular extracts from
GLC/ADR. Inhibition of the decatenation activity of Topo II in the presence of VP-16 and m-AMSA was increased two-fold in the cellular extracts from GLC/ADR. Therefore, these
results suggest that resistance of GLC/ADR to adriamycin was in part due to the reduced
drug-induced fonnation of the c/eavable complex.
77
INTRODUCTION
Topo I and II are enzymes that regulate the topological configuration of DNA (for review, see Ref. 1 and 2) . Topo II is an ATP-dependent enzyme which catalyzes the breakage and reunion of duplex DNA allowing a second segment of DNA to pass through the break site and so changing the linking number of covalently closed circular DNA in steps of two (3). Studies in yeast, using Topo mutants, provide evidence that Topo II is involved in the segregation of DNA following the conclusion of replication and is essential for mitosis (4,5). The activity and amount of the enzyme fluctuates with cell cycle progression with peak activity and maximum content occurring during G2/M phase (6-12). Strong evidence is obtained, that mammalian Topo II is a common target for a number of intercalative(adriamycin, m-AMSA, ellipticine and mitoxantrone) and nonintercalative-antitumor drugs (VP-16, VM-26) (13-16) . During the breakage-reunion reaction, Topo II can form a cleavable complex with DNA with the covalent linking of each Topo subunit to each 5'phosphoryl end of the broken DNA through a phosphotyrosyl bond ( 17, 18) . These drugs then interfere with the breakage-reunion reaction of Topo II by stabilizing this cleavable complex. The formation of the cleavable complex and not the inhibition of the Topo II activity is supposed to play a role in the cytotoxicity of these drugs (13, 15, 19).
Since Topo II is a common target for different types of antitumor drugs, resistance to these drugs can be due to quantitative or qualitative changes in Topo II in the resistant cells. This has been demonstrated in cell lines that are resistant to epipodophyllotoxin (19,20), m-AMSA (21) and 2-methyl-9-hydroxy-ellipticine (22). These resistant cell lines are called atypical multidrug-resistant (MDR) cell lines. Resistance to adriamycin, however, is mostly associated with MDR. The MDR phenotype results from the overexpression of the mdr-1 gene which encodes the 170 kD P-glycoprotein (23 ,24). This P-glycoprotein functions as an energy-dependent efflux pump (25). Recently, reduced Topo II activities were found in adriamycin-resistant P388 leukemia cell lines and reduced drug-induced DNA cleavage in an adriamycin-resistant MCF7 human breast cancer cell line. These cell lines still exhibit the MDR phenotype (26-28) .
In our laboratory an adriamycin resistant human small cell lung carcinoma cell line (GLC4/ADR) has been established (29,30). In the present study more evidence is obtained that resistance in GLC4/ ADR is not associated with the MDR phenotype, and that the supposed change of the adriamycin-DNA-Topo II interaction in GLC4/ ADR (29) is probably due to a decreased Topo II activity in this cell line.
MA TERIAI.S AND METHODS
DNA and Chemicals. Cultures of Crithidia fasciculata were kindly provided by
78
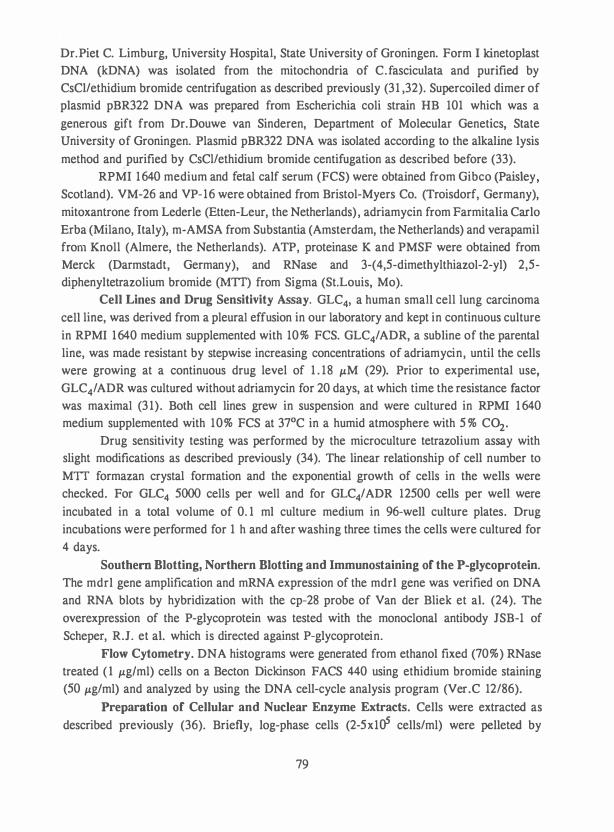
Dr.Piel C. Limburg, University Hospital, State University of Groningen. Form I kinetoplast DNA (kDNA) was isolated from the mitochondria of C.fasciculata and purified by CsCl/ethidium bromide centrifugation as described previously (31 ,32). Supercoiled dimer of plasmid pBR322 DNA was prepared from Escherichia coli strain HB 101 which was a
generous gift from Dr.Douwe van Sinderen, Department of Molecular Genetics, State University of Groningen. Plasmid pBR322 DNA was isolated according to the alkaline lysis
method and purified by CsCl/ethidium bromide centifugation as described before (33). RPMI 1640 medium and fetal calf serum (FCS) were obtained from Gibco (Paisley,
Scotland). VM-26 and VP-16 were obtained from Bristol-Myers Co. (Troisdorf, Germany),
mitoxantrone from Lederle (Etten-Leur, the Netherlands) , adriamycin from Farmitalia Carlo
Erba (Milano, Italy), m-AMSA from Substantia (Amsterdam, the Netherlands) and verapamil from Knoll (Almere, the Netherlands). ATP, proteinase K and PMSF were obtained from
Merck (Darmstadt, Germany), and RNase and 3-(4,5-dimethylthiazol-2-yl) 2,5-diphenyltetrazolium bromide (MTT) from Sigma (St.Louis, Mo).
Cell Lines and Drug Sensitivity Assay. GLC4, a human small cell lung carcinoma
cell line, was derived from a pleural effusion in our laboratory and kept in continuous culture
in RPMI 1640 medium supplemented with 10 % FCS. GLC4/ ADR, a sub line of the parental
line, was made resistant by stepwise increasing concentrations of adriamycin, until the cells were growing at a continuous drug level of 1 . 18 µM (29). Prior to experimental use,
GLC4/ ADR was cultured without adriamycin for 20 days, at which time the resistance factor was maximal (3 1) . Both cell lines grew in suspension and were cultured in RPMI 1 640 medium supplemented with 10% FCS at 37°C in a humid atmosphere with 5 % C02.
Drug sensitivity testing was performed by the microculture tetrazolium assay with slight modifications as described previously (34). The linear relationship of cell number to
MTT formazan crystal formation and the exponential growth of cells in the wells were checked. For GLC4 5000 cells per well and for GLC4/ ADR 12500 cells per well were
incubated in a total volume of 0. 1 ml culture medium in 96-well culture plates. Drug
incubations were performed for 1 h and after washing three times the cells were cultured for
4 days.
Southern Blotting, Northern Blotting and Immunostaining of the P-glycoprotein. The mdrl gene amplification and mRNA expression of the mdrl gene was verified on DNA and RNA blots by hybridization with the cp-28 probe of Van der Bliek et al. (24). The
overexpression of the P-glycoprotein was tested with the monoclonal antibody JSB-1 of
Scheper, R.J. et al. which is directed against P-glycoprotein.
Flow Cytometry. DNA histograms were generated from ethanol fixed (70%) RNase
treated ( 1 µg/ml) cells on a Becton Dickinson FACS 440 using ethidium bromide staining (50 µg/ml) and analyzed by using the DNA cell-cycle analysis program (Ver.C 12/86).
Preparation of Cellular and Nuclear Enzyme Extracts. Cells were extracted as
described previously (36). Briefly, log-phase cells (2-5x1<>5 cells/ml) were pelleted by
79
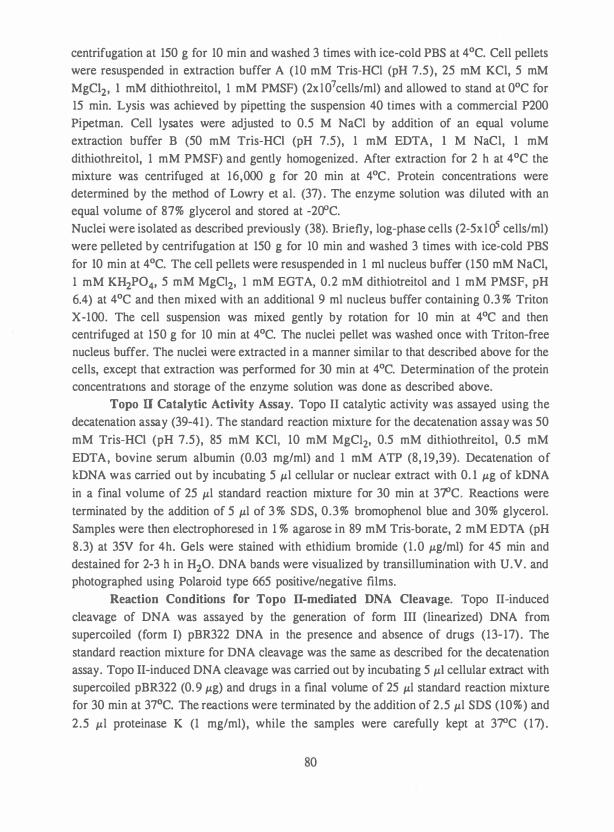
centrifugation at 150 g for 10 min and washed 3 times with ice-cold PBS at 4°C. Cell pellets were resuspended in extraction buffer A (10 mM Tris-HCl (pH 7.5), 25 mM KCl, 5 mM
MgC12, 1 mM dithiothreitol, 1 mM PMSF) (2xl07cells/ml) and allowed to stand at 0°C for 15 min. Lysis was achieved by pipetting the suspension 40 times with a commercial P200
Pipetman. Cell lysates were adjusted to 0.5 M NaCl by addition of an equal volume extraction buffer B (50 mM Tris-HCI (pH 7.5), 1 mM EDTA, 1 M NaCl, 1 mM
dithiothreitol, 1 mM PMSF) and gently homogenized. After extraction for 2 h at 4°C the mixture was centrifuged at 16,000 g for 20 min at 4°C. Protein concentrations were determined by the method of Lowry et al. (37) . The enzyme solution was diluted with an equal volume of 87% glycerol and stored at -200C. Nuclei were isolated as described previously (38). Briefly, log-phase cells (2-5xl<>5 cells/ml) were pelleted by centrifugation at 150 g for 10 min and washed 3 times with ice-cold PBS
for 10 min at 4°C. The cell pellets were resuspended in 1 ml nucleus buffer (150 mM NaCl,
1 mM KH2P04, 5 mM MgC12, 1 mM EGTA, 0.2 mM dithiotreitol and 1 mM PMSF, pH
6.4) at 4°C and then mixed with an additional 9 ml nucleus buffer containing 0.3 % Triton
X-100. The cell suspension was mixed gently by rotation for 10 min at 4°C and then centrifuged at 150 g for 10 min at 4°C. The nuclei pellet was washed once with Triton-free nucleus buffer. The nuclei were extracted in a manner similar to that described above for the cells, except that extraction was performed for 30 min at 4°C. Determination of the protein concentrations and storage of the enzyme solution was done as described above.
Topo II Catalytic Activity Assay. Topo II catalytic activity was assayed using the
decatenation assay (39-41). The standard reaction mixture for the decatenation assay was 50
mM Tris-HCI (pH 7.5), 85 mM KCl, 10 mM MgC12, 0.5 mM dithiothreitol, 0.5 mM
EDTA, bovine serum albumin (0.03 mg/ml) and 1 mM ATP (8, 19,39). Decatenation of kDNA was carried out by incubating 5 µl cellular or nuclear extract with 0. 1 µg of kDNA
in a final volume of 25 µl standard reaction mixture for 30 min at 37°C. Reactions were
terminated by the addition of 5 µl of 3 % SDS, 0.3% bromophenol blue and 30% glycerol.
Samples were then electrophoresed in 1 % agarose in 89 mM Tris-borate, 2 mM EDT A (pH
8.3) at 35V for 4h. Gels were stained with ethidium bromide (1 .0 µg/ml) for 45 min and destained for 2-3 h in H20. DNA bands were visualized by transillumination with U.V. and photographed using Polaroid type 665 positive/negative films.
Reaction Conditions for Topo II-mediated DNA Cleavage. Topo II-induced
cleavage of DNA was assayed by the generation of form III (linearized) DNA from supercoiled (form I) pBR322 DNA in the presence and absence of drugs (13-17) . The
standard reaction mixture for DNA cleavage was the same as described for the decatenation assay. Topo II-induced DNA cleavage was carried out by incubating 5 µI cellular extract with supercoiled pBR322 (0.9 µg) and drugs in a final volume of 25 µl standard reaction mixture
for 30 min at 37°C. The reactions were terminated by the addition of 2.5 µl SDS (10%) and
2.5 µl proteinase K (1 mg/ml), while the samples were carefully kept at 37°C (17) .
80

Following an additional incubation for 30 min at 37°C, 6 µl of 0.3 % bromophenol blue and
30% glycerol were added. Samples were analyzed by gel electrophoresis in 1 % agarose at 20 V for 16 h in a manner identical to the one used in the decatenation assay.
Topo I Catalytic Activity Assay. Topo I activity was assayed by relaxation of supercoiled pBR322 DNA (42) . The standard reaction mixture used for the Topo I activity assays was the same as described above for the Topo II assays, except that ATP was omitted.
Relaxation was carried out by incubating 5 µl cellular extract with supercoiled DNA (0.9 µg) in a final volume of 25 µI standard reaction mixture for 30 min at 37°C. Reactions were
terminated by the addition of 5 µI of 3 % SDS, 0.03 % bromophenol blue and 30% glycerol. Samples were then analyzed by gel electrophoresis in 1 % agarose at 20V for 16 h as described in the decatenation assay. Some stained gels (in 0. 1 µg ethidium bromide/ml) were
subjected to an additional 3 h of electrophoresis at 20V in the presence of 0. 1 µg ethidium bromide per ml to separate relaxed closed circles and nicked circles since ethidium bromide
increases the mobility of the relaxed closed circles relative to the nicked circles (43).
RESULTS
Sensitivity to Topo II Inhibiting Drugs. The continuous and 1 h ID50 values of
several Topo II inhibitors for the adriamycin-sensitive (GLC4) and the adriamycin-resistant
cell line (GLC4' ADR) were shown in table 1. GLC4/ ADR cells were highly resistant to
adriamycin (129-fold), VM-26 and VP-16 (70-fold) and much less resistant to mitoxantrone
(10-fold) and m-AMSA (5-fold). Relative resistance to drugs specific for MDR were
published previously (29).
P-glycoprotein Expression and Verapamil Reversal of Drug-resistance in GLC4
and GLC4' ADR. The cross-resistance pattern of GLC4/ ADR was not similar to the cross
resistance pattern described for MDR, although the cellular adriamycin accumulation was decreased (29). To obtain stronger evidence that the MDR phenotype is not expressed in
GLC4/ ADR, both GLC4 and GLC4/ ADR were analyzed for mdrl gene amplification, mRNA
overexpression of the mdrl gene and P-glycoprotein expression. Southern blotting did not
reveal mdrl gene amplification in both cell lines. No overexpression of mRNA of the mdrl gene was found and staining with JSB-1 was also negative for both cell lines (results not
shown) . In addition, verapamil which can reverse MDR did not reverse adriamycin-resistance
in GLC4/ ADR cells, but rather enhanced the toxicity of adriamycin in GLC4 cells (table 1) . The continuous presence of 10 µM verapamil reduced proliferation of both cell lines 0-10% .
Cell Growth Rates and Cell Cycle Distributions. Since Topo II levels in GLC4 and
GLC4/ ADR could be influenced by growth rates and cell cycle distributions, we analyzed
81

Table 1. Cross-resistance pattern or GLC4 and GLC4/ ADR to Topo II inhibitors.
Drug GLC4 GLC4/ADR relative ID50 (µM) resistanceb
continuous incubation Adriamycin 0.018 ± 0.006a 2.206 ± 0.840 122.6 VM-26 0.032 ± 0.005 2.304 ± 0.578 72.0 VP-16 0.288 ± 0.021 19. 165 ± 3 .786 66.5 m-AMSA 0.076 ± 0.003 0.386 ± O.o78 5. 1
1 h incubation Mitoxantrone O.o35 ± 0.007 0.337 ± 0.076 9 .6 Adriamycin 0.277 ± 0.051 33. 1 16 ± 1 1 .302 1 19.6 Adriamycin 0. 179 ± 0.032 27.588 ± 8.469 154.0 + 10 µM verapamil
a) 50% inhibiting dose in the microculture tetrazolium assay ± SD (n = 3). b) Relative resistance is the ratio of ID50 for the resistant cells to the ID50
for sensitive cells.
Table 2. Doubling times and cell cycle distribution or GLC4 and GLC4/ ADR.
Cell line Doubling time Cell cycle distribution (% ± SD)b
(h ± SD)a a, s
15.0 ± 0.5 36 ± 3 41 ± 2 1 8 . 1 ± 0.7 34 ± 3 44 ± 2
a) Determined graphically and defined as the number of hours required for cells log-phase growth to double in number. The number of cells per ml was determined using a counting chamber and values are the mean ± SD of four experiments.
b) Determined by flow cytometry as described in "Materials and Methods" . Values are the mean ± S D of four experiments.
G2 ± M
23 ± 3 22 ± 1
both for each cell line (table 2). The doubling time of GLC4/ ADR was only slightly increased compared to GLC4• Both cell lines grew exponential at cell densities from 0.5 to lOxlcf cells per ml. Cell cycle distributions of GLC4 and GLC4/ ADR were determined from DNA
82

histograms, generated by flow cytometry, with the cells in log-phase (2-Sxl !? cells/ml) as described for the preparation of cellular and nuclear enzyme extracts. The cell cycle distribution was similar for both cell lines. Plateau-phase cultures of both cell lines had a slightly increased fraction of cells in G1 .
Topo II and Topo I Catalytic Activity. Topo II catalytic activity was assayed by decatenation of kDNA networks (40, 4 1) . We determined Topo II activity in crude cellular extracts as well as in crude nuclear extracts from GLC4 and GLC4/ ADR in several different experiments, after the extract protein concentrations were adjusted to equivalence. In both cell lines the total cellular protein concentration was 1 .9 mg/107 cells (30). Topo II activities were two- to three-fold lower in crude cellular extracts from GLC4/ ADR than in extracts from GLC4 as could be seen by comparing band intensities of the minicircles in the serial dilutions (fig. I) . The bands near the top of the gel were products of incompletely decatenated kDNA such as dimers, trimers and small oligomers (41) . In the undiluted samples decatenation was slightly inhibited. In the absence of ATP decatenation of kDNA was undetectable (results not shown) . In crude nuclear extracts from GLC4/ADR Topo II activities were also reduced two to three-fold (fig.2). To exclude the possibility that the decrease in Topo II activity in extracts from GLC4/ ADR was an unspecific phenomenon, Topo I catalytic activities were determined in the same extracts. Topo I activities in extracts from GLC4 and GLC4/ ADR were compared by determining the highest dilution factor that was needed for the ATP independent relaxation of all supercoiled pBR322 DNA (42).
1 2 3 4 5 6 7 a g 1 0 1 1
- kDNA
- MINICIRCLES
Figure I. Topo II activity in cellular extracts from GLC4 and GLC4/ ADR. Topo II activity was monitored by the decatenation assay as described under Materials and Methods. Reaction mixtures (25 µI) containing 0. 1 µg of kDNA and various dilutions of cellular extracts from GLC4 (lanes 2-6)
or GLC4/ADR (lanes 7-1 1 ) were incubated for 30 min at 37°C and analyzed as described under Materials and Methods. The extract protein amounts added were: control, no extract protein (lane 1), 2 µg (lanes 2 and 7), 0.5 µg (Janes 3 and 8), 0.25 µg (lanes 4 and 9), 0. 13 µg (lanes 5 and 10), 0.063 µg (lanes 6 and 1 1) .
83

The Topo I activities were almost identical in cellular extracts (fig.3) and nuclear extracts
(results not shown) from both lines. The relaxation of supercoiled pBR322 was completely due to Topo I activity and not to endonuclease activity in these extracts, because all of the
newly formed relaxed circles appeared to be closed circles as determined by gel electrophoresis in the presence of ethidium bromide (results not shown) .
1 2 3 4 5 6 7 a g 1 0 1 1
- kDNA
- MINICIRCLES
Figure 2. Topo II activity in nuclear extracts from GLC4 and GLC4/ADR. Topo II activity in nuclear extract from GLC4 (lanes 2-6) and GLC4/ADR (lanes 7-1 1) was monitored by the decatenation assay as described in Fig. I . The extract protein amounts added were: control, no extract protein (lane 1), 0.090 µg (lanes 2 and 7), 0.045 µg (lanes 3 and 8), 0.0225 µg (lanes 4 and 9), 0.01 13 µg (lanes 5 and 10), 0.0056 µg (lanes 6 and 1 1).
1 2 3 4 5 6 7 a g 1 0 1 1
- I I
- I
Figure 3. Topo I activity in cellular extracts from GLC4 and GLC4/ ADR. The Topo I activity assay was done as described under Materials and Methods. Reaction mixture (25 µl) containing 0.9 µg of supercoiled pBR322 and various dilutions of the cellular extract from GLC4 (lanes 2-6) or GLC4/ ADR (lanes 7-1 1) were incubated for 30 min at 37°C and analyzed as described under Materials and Methods. The extract protein amounts added were: control, no extract protein (lane I), 0.0625 µg (lanes 2 and 7), 0.03 13 µg (lanes 3 and 8), 0.0156 µg (lanes 4 and 9), 0.0078 µg (lanes 5 and 10), 0.0039 µg (lanes 6 and 1 1) .
84
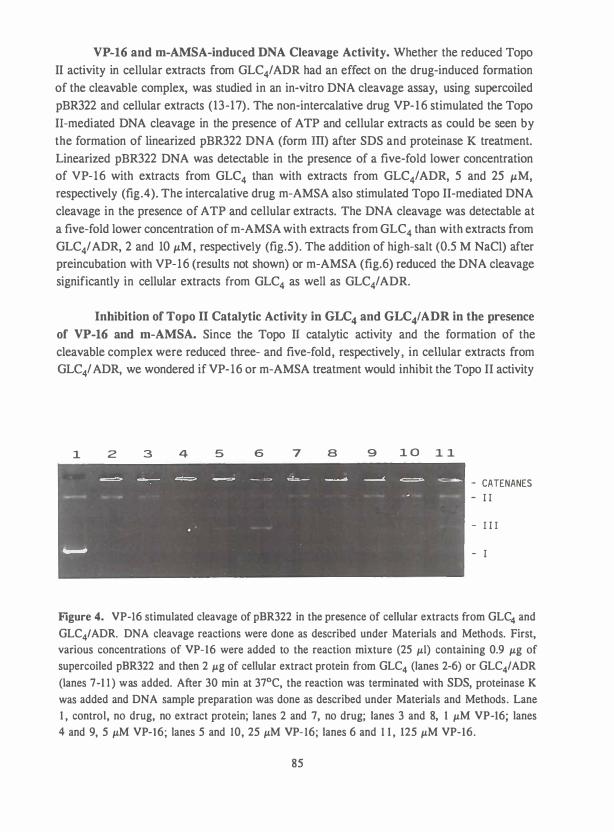
VP-16 and m-AMSA-induced DNA Cleavage Activity. Whether the reduced Topo
II activity in cellular extracts from GLC4/ADR had an effect on the drug-induced formation
of the cleavable complex, was studied in an in-vitro DNA cleavage assay, using supercoiled
pBR322 and cellular extracts (13-17). The non-intercalative drug VP-16 stimulated the Topo
II-mediated DNA cleavage in the presence of ATP and cellular extracts as could be seen by the formation of linearized pBR322 DNA (form Ill) after SDS and proteinase K treatment.
Linearized pBR322 DNA was detectable in the presence of a five-fold lower concentration of VP-16 with extracts from GLC4 than with extracts from GLC4/ADR, 5 and 25 µM, respectively (fig.4). The intercalative drug m-AMSA also stimulated Topo II-mediated DNA
cleavage in the presence of ATP and cellular extracts. The DNA cleavage was detectable at
a five-fold lower concentration of m-AMSA with extracts from GLC4 than with extracts from
GLC4/ ADR, 2 and 10 µM, respectively (fig.5). The addition of high-salt (0.5 M NaCl) after preincubation with VP-16 (results not shown) or m-AMSA (fig.6) reduced the DNA cleavage significantly in cellular extracts from GLC4 as well as GLC4/ ADR.
Inhibition of Topo II Catalytic Activity in GLC4 and GLC4/ ADR in the presence
of VP-16 and m-AMSA. Since the Topo II catalytic activity and the formation of the cleavable complex were reduced three- and five-fold, respectively , in cellular extracts from GLC4/ ADR, we wondered if VP-16 or m-AMSA treatment would inhibit the Topo II activity
1 2 3 4 5 6 7 a g 1 0 1 1
- CATENANES - I I
- I I I
- I
Figure 4. VP-16 stimulated cleavage of pBR322 in the presence of cellular extracts from GLC4 and
GLC4/ADR. DNA cleavage reactions were done as described under Materials and Methods. First, various concentrations of VP-16 were added to the reaction mixture (25 µI) containing 0.9 µg of supercoiled pBR322 and then 2 µg of cellular extract protein from GLC4 (lanes 2-6) or GLC4/ADR
(lanes 7-1 1 ) was added. After 30 min at 37°C, the reaction was terminated with SDS, proteinase K was added and DNA sample preparation was done as described under Materials and Methods. Lane 1 , control, no drug, no extract protein; lanes 2 and 7, no drug; lanes 3 and 8, 1 µM VP-16; lanes 4 and 9, 5 µM VP-16; lanes 5 and 10, 25 µM VP-16; lanes 6 and 1 1 , 125 µM VP-16.
85
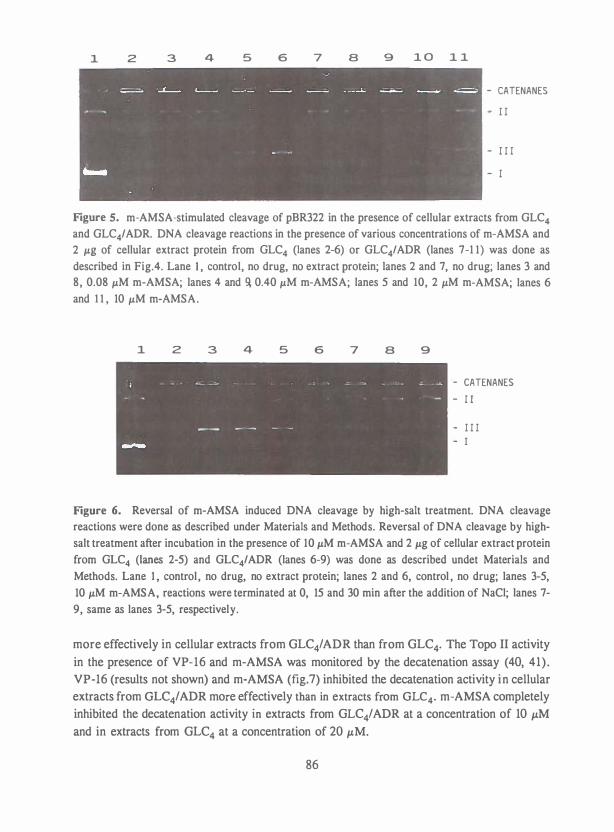
1 2 3 4 5 6 7 a g 1 0 1 1
- CATENANES - I I
- I I I - I
Figure 5. m-AMSA-stimulated cleavage of pBR322 in the presence of cellular extracts from GLC4 and GLC4/ADR. DNA cleavage reactions in the presence of various concentrations of m-AMSA and 2 µg of cellular extract protein from GLC4 (lanes 2-6) or GLC4/ADR (lanes 7-1 1) was done as described in Fig.4. Lane I , control, no drug, no extract protein; lanes 2 and 7, no drug; lanes 3 and 8, 0.08 µM m-AMSA; lanes 4 and � 0.40 µM m-AMSA; lanes 5 and 10, 2 µM m-AMSA; lanes 6 and I I , 10 µM m-AMSA.
1 2 3 4 5 6 7 a g
- CATENANES - I I
- I I I - I
Figure 6. Reversal of m-AMSA induced DNA cleavage by high-salt treatment. DNA cleavage reactions were done as described under Materials and Methods. Reversal of DNA cleavage by highsalt treatment after incubation in the presence of 10 µM m-AMSA and 2 µg of cellular extract protein from GLC4 (lanes 2-5) and GLC4/ADR (lanes 6-9) was done as described undet Materials and Methods. Lane I , control, no drug, no extract protein; lanes 2 and 6, control , no drug; lanes 3-5, 10 µM m-AMSA, reactions were terminated at 0, 15 and 30 min after the addition of NaCl; lanes 7-9, same as lanes 3-5, respectively.
more effectively in cellular extracts from GLC4/ ADR than from GLC4• The Topo II activity
in the presence of VP-16 and m-AMSA was monitored by the decatenation assay (40, 41) . VP-16 (results not shown) and m-AMSA (fig.7) inhibited the decatenation activity in cellular extracts from GLC4/ADR more effectively than in extracts from GLC4• m-AMSA completely inhibited the decatenation activity in extracts from GLC4/ ADR at a concentration of 10 µM
and in extracts from GLC4 at a concentration of 20 µM.
86

1 2 3 4 5 6 7 a g 1 0 1 1
- kDNA
- MINICIRCLES
Figure 7. Inhibition of the Topo II activity in cellular extracts of GLC4 and GLC4/ADR by mAMSA. Topo II activity was monitored by the decatenation assay, as described under Materials and Methods. Inhibition of the Topo II activity in the presence of various concentrations of m-AMSA and I µg of cellular extract protein from GLC4 (lanes 2-6) and GLC4/ADR (lanes 7-1 1) was done as
described in Fig. IO. Lane I , control, no drug, no extract protein; lanes 2 and 7, control, no drug; lanes 3 and 8, 5 µM m-AMSA; lanes 4 and 9, 10 µM m-AMSA; lanes 5 and 10, 20 µM m-AMSA; lanes 6 and 1 1 , 40 µM m-AMSA.
DISCUSSION
In an earlier study we described that the cross-resistance pattern of GLC4/ ADR was
different from the cross-resistance pattern of MDR cell lines (30) . In the present study we
showed that no mdrl gene amplification, mRNA overexpression of the mdrl gene or P
glycoprotein overexpression could be detected and that verapamil did not reverse the
resistance in GLC4/ ADR. Thus, resistance to adriamycin in GLC4/ ADR is probably not
associated with MDR. The reduced adriamycin accumulation in GLC4/ ADR might be due
to an alternative mechanism unrelated to P-glycoprotein that enhances drug efflux or
decreases drug binding. This alternative mechanism for reduced drug accumulation was also
suggested in studies with VP-16-resistant KB human carcinoma cells (20) , adriamycinresistant HT1080 human fibrosarcoma cells (44) and mitoxantrone-resistant WiDr human
colon carcinoma cells (45). Although cross-resistance to X-irradiation was observed, no
increased enzyme capacity for free radical detoxification could be detected in GLC4/ ADR (29, 30) . Rather an increased DNA repair may be involved in the resistance to adriamycin
and free radicals (29, 30).
We further investigated the supposition that part of the resistance was due to a
changed adriamycin-Topo II interaction, since the number of adriamycin induced DNA
double-strand breaks was still decreased after correction for the decreased adriamycin
87

accumulation (29). Sensitivity to other Topo II inhibitors was determined and revealed that GLC4/ ADR was also cross-resistant to VM-26, VP-16, mitoxantrone and m-AMSA, although relative resistances were quite different (table 1) . The Topo I and II catalytic activities were determined in nuclear and cellular extracts. Topo II catalytic activity was two- to three-fold lower in GLC4/ADR than in GLC4, with comparable results for cellular and nuclear extracts in several different experiments, while Topo I activities were almost equal in extracts from both cell lines. Thus, the differences in Topo II catalytic activity were not due to an overall decrease of nuclear proteins in cellular extracts or to a decrease of Topo I and II activities in nuclear extracts from GLC4/ ADR cells. Changes in growth kinetics could not account for this reduction in Topo Il activity, because doubling time of GLC4/ ADR was only slightly increased while the cell cycle distribution remained unchanged. Quiescent cells of GLC4 and GLC4/ADR did not accumulate primarily in the Gi-phase of the cell cycle. This result suggests that both cell lines have a rather low ability to enter the G0-G 1 phase, in which the cellular level of Topo II is probably regulated (8, 1 1 , 12) .
In-vitro (13-15) and in-vivo (7-1 1 , 46, 47) studies revealed that protein-linked single and double stranded breaks were due to the stimulation of Topo II-mediated DNA cleavage by VP-1 6 and m-AMSA. Therefore these two drugs were used in this study. VP-16 and mAMSA-induced DNA cleavage activities were five-fold lower in extracts from GLC4/ ADR than in GLC4 and were Topo II-mediated as high-salt treatment reduced DNA cleavage in a time dependent manner (14-16) . We concluded that the formation of the cleavable complex, and not the drug-induced inhibition of the catalytic activity, might play a role in the resistance to adriamycin, because the activity was more strongly inhibited (two-fold) in extracts from GLC4/ADR. These results were in agreement with previous reports (15, 16, 18, 2 1) . In the undiluted extracts used in the decatenation assay and in the extracts used in drug-induced DNA cleavage assay, catenation activity was also observed probably due to the presence of a catenating protein (48, 49). The reduced Topo II catalytic activity and in addition the decreased formation of the cleavable complex could account for resistance of GLC4/ADR to adriamycin, VP-16, VM-26, mitoxantrone and m-AMSA, since all these drugs have Topo II as a common target (13-16) . In other studies with VP-16-resistant KB human carcinoma cells (20), adriamycin-resistant P388 mouse leukemia (27) and m-AMSA-resistant P388 mouse leukemia (50), Topo II catalytic activities were also reduced in the resistant cells, while in adriamycin-resistant MCF7 human breast cancer cells DNA cleavage activity in extracts was reduced (28). However, in contrast to GLC4/ADR, both the adriamycinresistant P388 cells as well as the adriamycin-resistant MCF7 cells exhibited the MDR phenotype, while the glutathione transferase activities were also increased (26, 28) . In a nitrogen mustard-resistant human lymphoma cell line, the resistance was associated with an increased Topo II activity as well as an increased sensitivity to Topo II inhibitors (51). Thus, changes in Topo II activity are related to changes in the cytotoxicity of Topo II inhibitors. In other studies with VM-26-resistant chinese hamster cells (19) , m-AMSA-resistant HL-60
88

human leukemia (21) and 9-hydroxyellipticine-resistant Chinese hamster cells (22) Topo IT catalytic activity remained unchanged, while the formation of the cleavable complex was
reduced. Studies are now in progress to evaluate, wether the decreased Topo II activity in extracts from GLC4/ ADR is due to a mutational change in Topo II or to a reduced amount
of Topo II protein. In conclusion, the results suggest that GLC4/ ADR expresses a multifactorial drug
resistance phenotype, which is different from the MDR phenotype. Furthermore, the adriamycin-resistance of GLC4/ ADR may in part be due to a decreased Topo II activity and a reduced formation of the cleavable complex.
Acknowledgements The authors wish to thank P.Borst, A.M.v.d.Bliek and T.v.d.Velde-Koerts
(Nederlands Kanker Instituut, Amsterdam, The Netherlands) for determination of P
glycoprotein gene amplification and expression. We thank Dr.George T. Robillard for critical reading of the manuscript.
REFERENCES
1 . Wang, J.C. DNA topoisomerases. Ann.Rev.Biochem., 54: 665-697, 1985. 2 . Wang, J.C. Recent studies of DNA topoisomerases. Biochim.Biophys.Acta, 909 : 1 -9 , 1987. 3 . Liu, L.F., Liu, C.C., and Alberts, B.M. Type II DNA topoisomerases: Enzymes that can
unknot a topologically knotted DNA molecule via a reversible double-strand break. Cell, 19: 697-707, 1980.
4. DiNardo, S., Voelkel, K., and Sternglanz, R. DNA topoisomerase II mutant of Saccharomyces cerevisiae: topoisomerase II is required for segregation of daughter molecules at the termination of DNA replication. Proc. Natl . Acad.Sci. , 8 1 : 2616-2620, 1984.
5. Uemura, T., and Yanagida, M. Isolation of type I and II DNA topoisomerase mutants from fission yeast: single and double mutants show different phenotypes in cell growth and chromatin organization. EMBO J . , 3: 1737-1744, 1984.
6. Heck, M.M.S . , Hittelman, W.N., and Earnshaw, W.C. Differential expression of DNA topoisomerase I and II during the eukaryotic cell cycle. Proc. Natl.Acad.Sci. , 85: 1086-1090, 1988.
7 . Chow, K. -C. , and Ross, W .E. Topoisomerase-specific drug sensitivity in relation to cell cycle progression. Mol .Cell.Biol., 7: 3 1 19-3 123, 1987.
8 . Sullivan, D .M. , Glisson, B .S . , Hodges, P.K., Smallwood-Kentro, S . , and Ross, W.E. Proliferation dependence of topoisomerase II mediated drug action. Biochemistry, 25: 2248-2256, 1986.
9. Zwelling, L.A., Estey, E., Silberman, L., Doyle, S . , and Hittelman, W.N. Effect of cell proliferlation and chromatin conformation on intercalator-induced, protein-associated DNA cleavage in human brain tumor cells and human fibroblasts. Cancer Res. , 47: 251-257, 1987.
89

10. Estey, E. , Adlakha, R.C., Hittelman, W.N., and Zwelling, L.A. Cell cycle stage dependent variations in drug-induced topoisomerase II mediated DNA cleavage and cytotoxicity. Biochemistry, 26: 4338-4344, 1987.
1 1 . Sullivan, D.M., Latham, M.D. , and Ross, W.E. Proliferation-dependent topoisomerase II content as a determinant of antineoplastic drug action in human, mouse and Chinese hamster ovary cells. Cancer Res. , 47: 3973-3979, 1987.
12. Hsiang, Y-M., Wu, H-Y., and Liu, L.F. Proliferation-dependent regulation of DNA topoisomerase II in cultured human cells. Cancer Res . , 48: 3230-3235, 1988.
1 3 . Nelson, E.M., Tewey, K.M., and Liu, L.F. Mechanism of antitumor drug action: poisoning of mammalian DNA topoisomerase II on DNA by 4'-(9-acridinyl-amino)-methanesulfon-maniside. Proc.Natl .Acad.Sci . , 8 1 : 1361-1365, 1984.
14. Tewey, K.M., Chen, G.L., Nelson, E.M. , and Liu, L.F. Intercalative antitumor drugs interfere with the breakage-reunion reaction of mammalian DNA topoisomerase II. J.Biol .Chem., 259: 9182-9 1 87, 1984.
15. Chen, G.L., Yang, L. , Rowe, T.C., Halligan, B.D., Tewey K.M., and Liu, L.F. Nonintercalative antitumor drugs interfere with the breakage-reunion reaction of mammalian DNA topoisomerase II. J .Biol .Chem., 259: 13560- 13566, 1984.
16. Tewey, K.M., Rowe, T.C., Yang, L., Halligan, B.D., and Liu, L.F. Adriamycin-induced DNA damage mediated by mammalian DNA topoisomerase II. Science, 226: 466-468, 1984.
17. Liu, L.F., Rowe, T.C. , Yang, L., Tewey, K.M., and Chen, G.L. Cleavage of DNA by mammalian DNA topoisomerase II. J.Biol .Chem., 258: 15365-15370, 1983.
18 . Rowe, T.C., Chen, G.L. , Hsiang, Y.-H. , and Liu, L.F. DNA damage by antitumor acridines mediated by mammalian DNA topoisomerase II. Cancer Res . , 46: 2021-2026, 1986.
19. Glisson, B., Gupta, R. , Smallwood-Kentro, S. , and Ross, W.E. Characterization of acquired epipodophyllotoxin resistance in a Chinese hamster ovary cell line: loss of drug-stimulated DNA cleavage activity. Cancer Res. , 46: 1934-1938, 1986.
20. Ferguson, P.J . , Fisher, M.H., Stephenson, J . , Li, D., Zhou, B . , and Cheng, Y. Combined modalities of resistance in etoposide-resistant human KB cell lines. Cancer Res . , 48: 5956-5964, 1988.
2 1 . Estey, E.M., Silberman, L., Beran, M . , Andersson, B.S. , and Zwelling, L.A. The interaction between nuclear topoisomerase II activity from human leukemia cells, exogenous DNA, and 4' -(9-acridinylamino )methanesulfon-m-aniside (m-AMSA) or 4-( 4,6-0-ethylidene-BD-glucopyranoside) (VP-16) indicates the sensitivity of the cells to the drugs. Biochem.Biophys.Res. Commun. , 144: 787-793, 1987.
22. Pommier, Y., Kerrigan, D., Schwartz, R.E., Swack, J.A., and McCurdy, A. Altered DNA topoisomerase II activity in Chinese hamster cells resistant to topoisomerase II inhibitors. Cancer Res . , 46: 3075-308 1 , 1986.
23. Robinson, l .B., Chin, J.E., Choi, K., Gros, P., Housman, D.E. , Fojo, A., Shen, D-W., Gottesman, M.M., and Pastan, I. Isolation of human mdr DNA sequences amplified in multidrug-resistant KB carcinoma cells. Proc. Natl . Acad.Sci . USA, 83: 4538-4542, 1986.
24. Van der Bliek, A.M., van der Velde-Koerts, T., Ling, V., and Borst, P. Overexpression and amplification of five genes in multidrug-resistant Chinese hamster ovary cell line. Mol .Cell.Biol . , 63: 167 1-1678, 1986.
25. Horio, M., Gottesman, M.M., and Pastan, I. ATP-dependent transport of vinblastine in vesicles from human multidrug-resistant cells. Proc.Natl. Acad.Sci. USA, 85: 3580-3584, 1988.
26. Deffie, A.M., Alam, T., Seneviratne, C . , Beenken, S.W. , Batra, J .K., Shea, T.C .:nr , W.D., and Goldenberg, G.J. Multifactorial resistance to adriamycin: relation· , uf DNA repair, glutathione transferase activity, drug efflux, and P-glycoprotein in ' ..,, J cell lines of adriamycin-sensitive and ·resistant P388 leukemia. Cancer Res . , 48: 3: 1602, 1988.
90

27. Deffie, A.M., Batra, J.K., and Goldenberg, G.J. Direct correlation between DNA topoisomerase II activity and cytotoxicity in adriamycin-sensitive and -resistant P388 leukemia cell lines. Cancer Res . , 49: 58-62, 1989.
28. Sinha, B.K., Haim, N., Dusre, L., Kerrigan, D., and Pommier, Y. DNA strand breaks produced by etoposide (VP-16,2 13) in sensitive and resistant human breast tumor cells: implications for the mechanism of action. Cancer Res. , 48: 5096-5100, 1988.
29. Zijlstra, J .G. , de Vries, E.G.E., and Mulder, N.H. Multifactorial drug resistance in an adriamycin-resistant human small cell lung carcinoma cell line. Cancer Res. , 47: 1780-1784, 1987.
30. Meijer, C . , Mulder, N.H. , Timmer-Bosscha, H. , Zijlstra, J .G. , and de Vries, E.G.E. Role of free radicals in an adriamycin-resistant human small cell lung cancer cell line. Cancer Res . , 47: 4613-4617, 1987.
3 1 . Simpson, A.M., and Simpson, L . Isolation and characterization ofkinetoplast DNA networks and minicircles from Crithidia fasciculata. J .Protozool . , 2 1 : 774-781 , 1974.
32. Englund, P.T. The replication of kinetoplast DNA networks in Crithidia fasciculata. Cell, 14: 157-168, 1978.
33. Maniatis, F. , Fritsch, E.F., and Sambrook, J . Molecular cloning: a laboratory manual . Cold Spring Harbor Laboratory, Cold Spring Harbor, N.Y., 1982.
34. Timmer-Bosscha, H., Hospers, G.A.P. , Meijer, C., Mulder, N.H. , Muskiet, F.A.J . , Martini, I .A. , Uges, D.R.A., and D e Vries, E.G.E. The influence o f docosahexaenoic acid on cisplatin resistance in a human small cell lung carcinoma cell line. J .Natl.Cancer Inst. , 8 1 : 1069-1075, 1989.
35. Scheper, R.J . , Bulte, J.W.M., Brakkee, J.G.P., Quak, J.J. , Van der Schoot, E. , Balm, A.J.M., Meijer, C.J.L.M., Broxterman, H.J. , Kuiper, C.M., Lankelma, J . , and Pinedo, H.M. Monoclonal antibody JSB-1 detects a highly conserved epitope on the P-glycoprotein associated with multi-drug-resistance. Int.J.Cancer, 42: 389-394, 1988.
36. Crepsi, M.D. , lvanier, S.E. , Genovese, J . , and Baldi, A. Mitoxantrone affects topoisomerase activities in human breast cancer cells. Biochim. Biophys.Res.Commun., 136: 521 -528, 1986.
37. Lowry, O.H. , Rosebrough, N.J . , Farr, A.L. , and Randall, R.J. Protein measurement with the folio-phenol reagent. J .Biol .Chem., 193: 265-275, 195 1 .
38. Filipski, J . , and Kohn, K.W. Ellipticine-induced protein-associated DNA breaks in isolated L l 2 1 0 nuclei. Biochem.Biophys.Acta, 698: 280-286, 1982.
39. Duguet, M., Lavenot, C., Harper, F., Mirambeau, G., and De Recondo, A.-M. Topoisomerases from rat liver: physiological variations. Nucleic Acids Res . , 1 1 : 1059-1075, 1983.
40. Marini, J .C. , Miller, K.G., and Englund, P.T. Decatenation of kinetoplast DNA by topoisomerase II. J .Biol.Chem., 255: 4976-4979, 1980.
4 1 . Miller, K . G . , Liu, L.F., and Englund, P.T. A homogeneous type I I DNA topoisomerase from Hela cell nuclei. J.Biol .Chem., 256: 9334-9339, 198 1 .
42. Liu, L.F. , and Miller, K.G. Eukaryotic DNA topoisomerases: Two forms of type I DNA topoisomerases from Hela cell nuclei. Proc.Natl.Acad.Sci.USA, 78: 3487-3491 , 1 98 1 .
43 . Martin, S .R., McCowbrey Jr., W.K., Mcconaughy, B.L., Young, L.S. , Been, M.D., Brewer, B.J., and Champoux, J.J. Multiple forms of rat liver type I topoisomerase. Meth.Enzymol. , 100: 137- 144, 1983.
44. Slovak, M.L. , Hoeltge, G.A., Dalton, W.S., and Trent, J .M. Pharmacological and biological evidence for differing mechanisms of doxorubicin resistance in two human tumor cell lines. Cancer Res. , 48: 2793-2797, 1988.
45. Dalton, W.S. , Cress, A.E., Alberts, D.S. , and Trent, J .M. Cytogenetic and phenotypic analysis of a human colon carcinoma cell line resistant to mitoxantrone. Cancer Res., 48: 1 882-1 888, 1988.
9 1

46. Yang, L. , Rowe, T.C., Nelson, E.M., and Liu, L.F. In vivo mapping of DNA topoisomerase II-specific cleavage sites on SV40 chromatin. Cell, 41 : 127-132, 1985.
47. Epstein, R.J . , and Smith, P.J. Estrogen-induced potentiation of DNA damage and cytotoxicity in human breast cancer cells treated with topoisomerase II-interactive antitumor drugs. Cancer Res . , 48: 297-303, 1988.
48. Hsieh, T., and Brutlag, D. ATP-dependent DNA topoisomerase from D.melanogaster reversibly catenates duplex DNA rings. Cell, 2 1 : 1 15-125, 1980.
49. Riou, G.F., Gabillot, M., Barrois, M., Breitburd, F., and Orth, G. A type-II DNA topoisomerase and a catenating protein from the transplantable VXZ carcinoma. Eur.J.Biochem., 146: 483-488, 1985.
50. Drake, F.H., Zimmerman, J.P. , McCabe, F.L., Bartus, H.F., Per, S.R., Sullivan, D.M., Ross, W.E., Mattern, M.R., Johnson, R.K., Crooke, S.T., and Mirabelli, C.K. Purification oftopoisomerase II from amsacrine-resistant P388 leukemia cells. I.Biol .Chem., 262: 16739-16747, 1987.
5 1 . Tan, K.B. , Mattern, M.R., Boyce, R.A., and Schein, P.S. Elevated DNA topoisomerase II activity in nitrogen mustard-resistant human cells. Proc.Natl .Acad.Sci. USA, 84: 7668-7671 , 1987.
92

Chapter 6
TOPOISOMERASE II AS A TARGET OF VM-26 AND m-AMSA IN ATYPICAL MULTIDRUG RESISTANT
HUMAN SMALL CELL LUNG CARCINOMA CELLS
Steven de Jong, Alfred J. Kooistra , Elisabeth G.E. de Vries, Nanno H. Mulder, and Jan G. Zijlstra.
From the Division of Medical Oncology, Department of Internal Medicine, University Hospital, Oostersingel 59 , 97 13 EZ Groningen, The Netherlands.
SUMMARY
DNA topoisomerase (Topo) II inhibitors such as adriamycin, etoposide (VP-16),
teniposide (VM-26), 4 '-(9-acridinylamino)-methanesulfon-m-aniside (m-AMSA) and mitoxantrone, stimulate the formation of cleavable complexes with Topo II covalently bound to DNA. The adriamycin-resistant small cell lung carcinoma cell line, GLC/ADR, showed
large differences in cross-resistance to these Topo II inhibitors. GLC/ADR cells
demonstrated a reduced Topo II activity and a reduced adriamycin accumulation without overexpressing the mdr1 gene or containing detectable levels of the P-glycoprotein compared to the parental GLC4 cells (De Jong et al. , Cancer Res. , 50: 304, 1990). In the present
study, 59.5-fold resistance to VM-26 and 4-fold resistance to m-AMSA was observed in
GLC/ADR after an incubation for 1 h. The resistance to both drugs was analyzed at the
level of Topo II with the IC" -SDS precipitation assay. VM-26 and m-AMSA induced cleavable complex formation was reduced in GLC/ADR compared to GLC4 cells. The reduction was
related to the degree of resistance to each drug. In isolated nuclei of GLC/ADR, however,
a similar reduction in cleavable complexes was observed with VM-26 as with m-AMSA. These
results suggest that a cellular mechanism is involved in the resistance to VM-26. Following
the removal of VM-26, the cleavable complexes in GLC/ADR cells disappeared at least 2-
fold faster than in GLC4 cells, a 50 3 decline within 20 min versus 40 to 60 min. After m
AMSA treatment, the rate of disappearance was equal in both cell lines, a 50 % decline in
10 to 20 min. The amount of cleavable complexes induced by high drug concentrations was
2-fold lower in cells and nuclei of GLC/ADR compared to GLC4• In addition, immunoblots
showed that the amount of 1 70 kD Topo II was three-fold lower in GLC/ADR, whereas the
93

amount of Topo I was similar in both cell lines. A 180 kD Topo II was also present in both
cell lines. No changes in ATP-dependence of Topo II catalytic activity nor in cleavable
complex fonnation was found in nuclear extracts of both cell lines after Topo II activities were equalized. The cross-resistance to m-AMSA is probably due to the decreased amount
of the 1 70 kD Topo II and not to an altered Topo II, while in addition to this mechanism other mechanisms such as a decreased drug accumulation and an increased rate of cleavable
complex disappearance can be involved in the cross-resistance to VM-26 of GLC/ADR.
INTRODUCTION
A number of intercalators, including adriamycin, m-AMSA, ellipticine and
mitoxantrone, and nonintercalative epipodophyllotoxins such as VP-16 and VM-26 are Topo
II inhibitors. These drugs stabilize the Topo II-DNA (cleavable) complex (1-4) probably by interfering with the Topo II-mediated religation of DNA (5,6). A general correlation between the level of drug-induced cleavable complex formation and cytotoxicity exists (7-10), although this relation is not the same for different types of drugs (8 , 1 1) .
Topo I and Topo II are enzymes that regulate the topological configuration of DNA
(12, 13). Topo II probably plays a role in DNA replication (14) and DNA recombination (15) and is associated with the nuclear matrix (16, 17) . To perform its catalytic activity under normal conditions, the ATP-dependent Topo II dimer covalently binds to DNA. The transient
double-stranded DNA break is held together by the Topo II dimer covalently bound to the 5'end of each nicked strand, allowing another DNA double strand to pass and then the DNA double-strand break rapidly religates (12, 13) .
A number of cell lines with acquired resistance to these Topo II inhibitors have been described. A well described resistance mechanism is the overexpression of the 170 kD P
glycoprotein, an energy-dependent efflux pump of the Topo II inhibitors and other
functionally unrelated drugs (1 8-20). In several other resistant cell lines, that do not express the multidrug resistant phenotype, various mechanisms have been found such as a reduced levels of Topo II and/or an altered Topo II sometimes in combination with a reduced drug
accumulation (21-28). The degree of resistance to VM-26 or VP-16 can differ considerably
from that to m-AMSA depending on the drug used to induce resistance (21 ,22,24,26). m
AMSA induced DNA cleavage activity of purified Topo II from these cells was distinct from
VP-16 induced DNA cleavage (26) . Drug-induced cleavable complex formation was associated with the cytotoxicity in these sensitive and resistant cells (2 1 ,26,28) .
Previously, we have described an adriamycin-resistant human small cell lung carcinoma cell line (GLC4/ADR) (29,30). The degree of resistance to adriamycin, VP-16 and
VM-26 is considerably higher than to m-AMSA and mitoxantrone (29). GLC4/ ADR does not
overexpress the P-glycoprotein, although adriamycin accumulation is reduced . Furthermore,
94

the Topo II activity is decreased in the resistant cells (29,30). In the present study, we have investigated the resistance to VM-26 and m-AMSA on the level of Topo II. The formation
of cleavable complexes and their rate of disappearance are determined in intact cells and compared to the cytotoxicity of these drugs. Cleavable complex formation in nuclei is also
measured to exclude differences in drug accumulation. The amount of topoisomerases, the
ATP dependence of Topo II catalytic activity and the DNA cleavage activity in GLC4 and
GLC4/ ADR are determined to detect quantitative and qualitative Topo II changes.
MATERIALS
DNA and Chemicals. Form I k.inetoplast DNA (kDNA) was isolated from the mitochondria of Crithidia fasciculata as described previously (29). Supercoiled dimer of plasmid pBR322 DNA, prepared from Escherichia coli strain HB 101 , was a generous gift
from Dr.Douwe van Sinderen, Department of Molecular Genetics, State University of
Groningen.
RPMI 1640 medium was obtained from Gibco (Paisley, Scotland) and fetal calf serum
from Sanbio (Uden, the Netherlands). [3H]-Thymidine was from New England Nuclear
(Boston, MA). VM-26 was purchased from Bristol-Myers Co. (Troisdorf, Germany), mitomycin C from Christiaen (Etten-Leur, the Netherlands) and nitrogen-mustard (NH:z) from
Boots (Hilversum, the Netherlands). m-AMSA was a generous gift from Warner Lambert (Amsterdam,the Netherlands). ATP, proteinase K and phenylmethanesulfonyl fluoride
(PMSF) were obtained from Merck (Darmstadt, Germany) , and camptothecin and 3-(4,5-dimethylthiazol-2-yl) 2,5-diphenyltetrazolium bromide (MTT} from Sigma (St.Louis, Mo).
Cell Lines and Drug Sensitivity Assay. GLC4 is a human small cell lung carcinoma
cell line and GLC4/ ADR a subline of the parental line that was made resistant by stepwise increasing concentrations of adriamycin, until the cells were growing at a continuous drug
level of 1 . 18 µM. Both cell lines were cultured in RPMI 1640 medium supplemented with
10% fetal calf serum at 37°C in a humid atmosphere with 5 % C02 (29). Prior to
experimental use, GLC4/ ADR was cultured without adriamycin for 20 days, at which time the resistance was maximal (29) .
Drug sensitivity testing was performed with the microculture tetrazolium assay with slight modifications as described previously (3 1). The linear relationship of cell number to
MTT formazan crystal formation and the exponential growth of cells in the wells were checked. For GLC4 5000 cells per well and for GLC4/ ADR 12500 cells per well were
incubated in a total volume of 0. 1 ml culture medium in 96-well culture plates. When drug
incubations were performed for 30 min or 1 h , cells were washed three times and then
cultured for 4 days. Each drug concentration was tested in quadruplicate.
K+ -SDS Precipitation of Protein-DNA Complexes. The formation of covalent Topo
95

II-DNA complexes in intact cells and isolated nuclei was quantified using the K+ -SDS precipitation assay as described previously (10) . Cells were labeled for 24 h with 3Hthymidine (2 Ci/mmol) to a final concentration of 0.4 µCi/ml. One h prior to drug-treatment cells were washed two times with culture medium and resuspended in fresh medium to a final concentration of H>5 cells/ml. In the experiments with isolated nuclei, cells were washed with PBS and nuclei were isolated as described below and resuspended in Triton-free nucleus buffer. The cells and the nuclei were treated with various concentrations of VM-26 or mAMSA for 1 h. Following drug treatment, cells and nuclei were pelleted at 900 g for 3 min . Media were removed and cells and nuclei were lysed by the addition of 1 ml of a prewarmed (65°C) lysis solution (1 .25 % SDS, 5mM EDTA (pH8.0) , and 0.4 mg/ml salmon sperm DNA) . After 10 min 250 µl 325 mM KCl was added and the suspension was vigorously vortexed for 15 s which gave reproducible fragmentation of DNA in untreated as well as drug-treated cells. l ml of the lysate was transferred to a 1 .5 ml Eppendorf tube and the sample was cooled on ice for 10 min and centrifuged for 10 min at 4°C in a microfuge. The pellet was resuspended in l ml of a wash solution (10 mM Tris-HCl (pH 8 .0) , 100 mM KCl, l mM EDTA and 0. 1 mg/ml salmon sperm DNA) by heating at 65°C for 10 min with periodic mixing. The tubes were then placed on ice for 10 min and centrifuged. The pellet was resuspended in 1 ml of a wash solution at 65°C for 10 min, then the tubes were placed on ice for 10 min and centrifuged. The pellet was resuspended in 500 µ1 H20 at 65°C and added to 4 ml picofluor-30 (Packard) for radioactivity measurements. 100 µl of the lysate of each sample was also combined with 4 ml picofluor-30 and the radioactivity was counted to calculate the total amount of radioactivity present in 1 ml lysate. The amount of coprecipitated 3H-DNA was expressed as the percentage of the total amount of radioactivity present in 1 ml lysate.
To determine the rate of disappearance of drug-induced cleavable complexes in both cell lines, the cells were incubated with VM-26 or m-AMSA for 1 h. One sample was centrifuged at high speed for 3 min and the sample was lysed as described in the K+ -SDS precipitation assay. The other samples were centrifuged at 150 g for 10 min and resuspended in drug-free culture media. The precipitation assay as described above was performed at various times after wash out of the drugs.
SDS-Polyacrylamide Gel Electrophoresis and Western Blotting. SDSpolyacrylamide gel electrophoresis was performed according to the procedure of Laemmli (32). Proteins were stained with 0. 1 % Coomassie brilliant blue R250 in 45 % (v/v) methanol and 10% acetic acid . For Western blotting proteins were transferred from acrylamide gel onto nitrocellulose paper at 125 mA for 4 h at 4°C by using a dry-blot system (Ancor, Denmark). Topo II was detected using a polyclonal rabbit antiserum against human Topo II which was kindly provided by Dr. Leroy Liu, Johns Hopkins University. Topo I was detected with a systemic sclerosis patient's serum (33,34) kindly provided by Dr. Piet C. Limburg, University Hospital, Groningen. The Bio-Rad Immun-blot assay kit (Bio-Rad,
96

Richmond, CA) which uses goat anti-rabbit and goat anti-human alkaline phosphatase conjugates was used to detect Topo I and Topo II in the Western blots.
Preparation of Nuclei and Nuclear Enzyme Extracts. Nuclei were isolated from log-phase cells (2-5x10
5 cells/ml) as described previously (29) . The nuclei pellet was
resuspended in nucleus buffer ( 150 mM NaCl, 1 mM KH2P04, 5 mM MgCI2, 1 mM EGTA, 1 .0 mM dithiotreitol and 1 mM PMSF), pH 6.4 and an equal volume of nucleus buffer containing 0.55 M NaCl was added (final [NaCl] = 0.35 M). Nuclear protein was extracted from the nuclei for 30 min at 4°C and then the mixture was centrifuged at 16,000 g for 20 min at 4°C. Protein concentrations were determined by the method of Bradford (36). The enzyme solution was diluted with an equal volume of 87% glycerol and stored at -2<1'C until assayed.
Topo Il Catalytic Activity Assays. Topo II catalytic activity in nuclear extracts was assayed with the decatenation assay (21 ,37). The standard reaction mixture used for the Topo II activity assays was 50 mM Tris-HCI (pH 7.5), 85 mM KCl, 10 mM MgC12, 0.5 mM dithiothreitol, 0.5 mM EDTA, bovine serum albumin (0.03 mg/ml) and ATP when indicated. Decatenation of 0.4 µg of kDNA was carried out as described previously (29).
Reaction Conditions for Topo Il-mediated DNA Cleavage. Topo II-induced cleavage of DNA was assayed by the generation of form III (linearized) DNA from supercoiled (form I) pBR322 DNA in the presence and absence of drugs ( 1-4). The standard reaction mixture for DNA cleavage was the same as described for the decatenation assay. Topo II-induced DNA cleavage was carried out as described previously (29), and the reaction was stopped with SDS and proteinase K at final concentration of 1 % and 0.5 mg/ml, respectively.
Statistics. All results were expressed as means ± SD. Statistical significance was determined by use of the Student's t-test.
RESULTS
Sensitivity of GLC4 and GLC4/ ADR to VM-26 and m-AMSA. The nonintercalator VM-26 and the intercalator m-AMSA were chosen for this study to further analyze the differences in the degree of resistance to these drugs (29) . Figure 1 shows the cytotoxicity of VM-26 and m-AMSA after a 1 h incubation in GLC4 and GLC4/ ADR cells. The degree of resistance to VM-26 and m-AMSA in GLC4/ ADR after a 1 h incubation was similar to the degree of resistance after continuous incubation (table 1).
VM-26 and m-AMSA Induced Topo Il-DNA Complexes in Intact Cells. Druginduced cleavable complex formation in intact cells was measured with the K+ -SDS precipitation assay after a drug-incubation for 1 h at 37°C. In both cell lines, cleavable
97

100
75 � iii 50 > > � I/)
25
0
A T !i� N � �J ,
0.1
l"l T �""'T i---�,! i 10 100
VM-26 (µ.M)
B 6 ,__. 1"-6 ��
�\I T N i\ l� T
l\T i\r
m-AMSA
I\T i'l � l
10 (µ.M)
Figure 1. Survival of GLC4 and GLC4/ADR to VM-26 (A) and m-AMSA (B) after a 1 h incubation at 37°C. Cell survival was determined with the microculture tetrazolium assay in the presence of VM-26 and m-AMSA in GLC4 (o) and GLC4/ADR (•). Values are the mean ± SD of three experiments, each performed in quadruplicate.
complexes formation was induced by VM-26 and m-AMSA in a concentration dependent manner (fig.2). At a VM-26 concentration of 0.2 /LM, an increase in cleavable complex formation was observed in GLC4 cells, whereas only a VM-26 concentration as high as 5 /LM generated an increase in cleavable complex formation in GLC4/ADR cells (fig. 2A) . In similar experiments with m-AMSA, an increase in cleavable complex formation in GLC4 cells was observed at a drug concentration of 0.2 /LM and in GLC4/ADR cells at a drug concentration of 1 /LM (fig. 2B). At high VM-26 and m-AMSA concentrations within the range of the ID50 for GLC4/ ADR, the amount of the cleavable complexes in both cell lines reached a plateau level, which was lower in GLC4/ADR cells (fig .2) . At the ID50 concentration of VM-26 for each cell line (1 h incubation, table 1), the calculated percentage of coprecipitated 3H-DNA in GLC4 and GLC4/ ADR cells was 15. 1 ± 3.9 and 27 ± 0.5 (p < 0.0025, GLC4 versus GLC4/ADR), respectively, and in case of incubation with m-AMSA 42 ± 7.5 and 23. 1 ± 1 .4 (p < 0.0025, GLC4 versus GLC4/ADR), respectively. Thus, stimulation of the cleavable complex formation by these drugs was related to the cytotoxicity of these drugs in the sensitive as well as in resistant cell line.
VM-26 and m-AMSA Induced Topo II-DNA complexes in Isolated Nuclei. To circumvent the effect of possible differences in drug accumulation between GLC4 and GLC4/ ADR, the drug-induced cleavable complexes formation in isolated nuclei was measured
98

Table I. Cross-resistance to VM-26 and m-AMSA after different incubation times and to alkylating agents.
Drug GLC4 GLC4/ADR relative IDso (µM)a resistanceb
l h incubation VM-26 0.40 ± 0. 15 24.62 ± 10.7 1 60. 1° m-AMSA l .32 ± 0.30 5.28 ± l .56 4.0C
continuous incubation VM-26 0.032 ± 0.005 2.304 ± 0.578 n.o•,d
m-AMSA 0.076 ± 0.003 0.386 ± O.Q78 5 . lc,d
Mitomycin C 0.03 1 ± 0.009 0.039 ± 0.017 1 .3 Camptothecin 0.005 ± 0.001 0.007 ± 0.002 l .3
30 min incubation NH2 4.81 ± 1 .40 3.79 ± 0.70 0.8
a) 50% inhibiting dose in the microculture tetrazolium assay. Values are the mean ± SD of three experiments. b) Relative resistance is the ratio of ID50 for the resistant cells to the ID50 for sensitive cells. c) p < 0.01 GLC4 versus GLC4/ADR d) Results from ref.29
following drug-incubation for 1 h at 37 °C. Cleavable complex formation induced by VM-26 in nuclei of GLC4 and GLC4/ ADR was comparable with the cleavable complex formation induced by m-AMSA in these nuclei (fig.3) . However, the amount of drug-induced cleavable complexes in nuclei was decreased compared to the amount of complexes in intact cells. This finding was consistent with previous reports (9) and was probably due to the isolation procedure. Results in nuclei treated with VM-26 were different to the findings in whole cells, as the differences in VM-26 induced cleavable complex formation between GLC4 and GLC4/ ADR were less distinct in nuclei than in whole cells (fig. 2 and 3). In contrast, the differences in m-AMSA induced cleavable complex formation between GLC4 and GLC4/ADR were almost similar in nuclei and whole cells (fig. 2 and 3) .
Disappearance of Topo Il-DNA Complexes in Intact Cells. The rate of disappearance of cleavable complexes following drug removal was determined in GLC4 and GLC4/ ADR cells after incubation with 5 and 50 µM VM-26, respectively, for 1 h. These concentrations induced similar amounts of cleavable complexes in both lines. Following the removal of VM-26, the cleavable complexes in GLC4 cells disappeared slowly with a decline to 50 % of the initial complex level within 40 to 60 min (fig.4). In contrast, in GLC4/ ADR
99

80 � <i 5 60 I I [T)
"O 40 Ul .x. £ I c 20 ijj 0 a.
0
A
l l l/1-1 T/l .---·
r/� / /! __ .--
0 0.2 5 25 VM-26 (µM)
125 0
B
T T 0-0 T/1 i 0 /1 T
b T---t------! �/i �
0.2 5 25 m-AMSA (µM)
Figure 2. Cleavable complex formation in whole GLC4 and GLC4/ADR cells induced by VM-26 (A) and m-AMSA (B). Cells were treated for 1 h at 37"C with various drug concentrations and cleavable complex formation induced by VM-26 or m-AMSA in GLC4 (o) and in GLC4/ADR (•) was quantitated with the K+ -SDS precipitation assay as described in "Materials and Methods". Values are the mean ± SD of four experiments, each performed in duplicate.
40 � <i 30 � I I ,.., "O 20 Ul .x. £ I c 10 ijj 0 a.
0 0
A
T T�o 0 l
//1 T/ T �� I--! �t---1 5 25 125 0
VM-26 (µ.M)
B
!/ ;i;/l T b----.1. T---i ! T---!
--·---�
5 25 1 25 m-AMSA (µ.M)
Figure 3. Cleavable complex formation in isolated nuclei of GLC4 and GLC4/ADR induced by VM-26 (A) and m-AMSA (B). Nuclei were isolated as described in "Materials and Methods" . Nuclei were then treated for 1 h at 37°C with various drug concentrations and cleavable complex formation induced by VM-26 or m-AMSA in GLC4 (o) in GLC4/ADR (•) was quantitated with the K+-sns precipitation assay as described in "Materials and Methods" . Values are the mean ± SD of four to five experiments, each performed in duplicate.
100

cells a rapid decline to 50 % occurred within 20 min (fig.4) . In GLC4/ADR cells a
background level was achieved after 90 min, whereas the level in GLC4 cells after 1 80 min was still different from the background level in GLC4/ADR cells (p < 0.05).
Similar experiments were performed with m-AMSA. GLC4 and GLC4/ ADR cells were treated with 1 and 5 µM m-AMSA, respectively, for 1 h . These were the ID50 concentrations of m-AMSA for each cell line (1 h incubation, table 1). Following the removal of m-AMSA, there was a rapid loss of complexes in GLC4 and GLC4/ ADR cells (fig.4). In both cell lines a decline to 50 % of the initial level occurred within 10 to 20 min. In GLC4 and GLC4/ ADR cells background levels were reached within 60 min. A similar rate of disappearance was observed when GLC4 cells were incubated with 5 µM m-AMSA (results not shown) .
hnmunodetection of Topo I and Topo II. To determine whether the changes in Topo II activity in nuclear extracts in GLC4/ ADR cells (29) was due to quantitative or qualitative changes of Topo II, the amount of Topo II in both cell lines was determined with Western blotting. The amount of 170 kD Topo II was 3-fold reduced in 0.35 M salt nuclear extracts as well as nuclear lysates from GLC4/ADR compared to GLC4 (fig.SA) . Another
100
� BO
Cl c c 60 iii E � 40 </) c 0 iii � 20
0 0
A
-l l""'T
l�T ��-! i'-.....T 1 1� T
30
·----- -0 1 !�-•�-·�-� 60 90
... J. J.
120 1 50 180 time after VM-26 removal (min)
B
cf 0 30 60 90 120
time after m-AMSA removal (min)
Figure 4. Disappearance of cleavable complexes in GLC4 and GLC4/ ADR cells in time following VM-26 (A) and m-AMSA (B) removal . Cells were treated for 1 h at 37"C with various drug concentrations and at various times after drug removal, cleavable complexes remaining were quantitated with the K+ -SOS precipitation assay as described in "Materials and Methods". Results were expressed as the percentage of cleavable complexes remaining after GLC4 cells (o) were treated with 5 µM VM-26 or 1 µM m-AMSA and in GLC4/ADR cells (•) with 50 µM VM-26 or 5 µM mAMSA. Values are the mean ± SD of four to five experiments, each performed in duplicate.
101
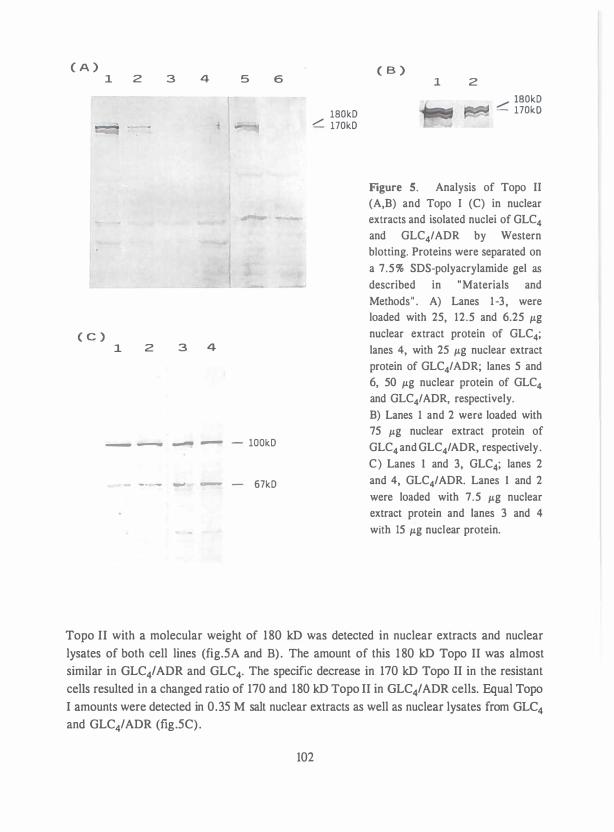
( A )
( C )
1 2
1
3
2
4
3 4
5 6
- - - - - lOOkD
-· - - - - 67kD
180kD -::::_ 170kD
( B ) 1 2
_,..,. 180kD - 170k0
Figure S. Analysis of Topo II (A,B) and Topo I (C) in nuclear extracts and isolated nuclei of GLC4 and GLC4/ADR by Western blotting. Proteins were separated on a 7.5% SDS-polyacrylamide gel as
described in "Materials and Methods" . A) Lanes 1 -3 , were loaded with 25, 12.5 and 6.25 µ.g nuclear extract protein of GLC4; lanes 4, with 25 µ.g nuclear extract protein of GLC4/ ADR; lanes 5 and 6, 50 µ.g nuclear protein of GLC4 and GLC4/ADR, respectively. B) Lanes 1 and 2 were loaded with 75 µ.g nuclear extract protein of GLC4 and GLC4/ ADR, respectively . C) Lanes 1 and 3, GLC4; lanes 2 and 4, GLC4/ADR. Lanes 1 and 2 were loaded with 7.5 µ.g nuclear extract protein and lanes 3 and 4
with 15 µ.g nuclear protein.
Topo II with a molecular weight of 180 kD was detected in nuclear extracts and nuclear lysates of both cell lines (fig.SA and B) . The amount of this 1 80 kD Topo II was almost similar in GLC4/ ADR and GLC4. The specific decrease in 170 kD Topo II in the resistant cells resulted in a changed ratio of 170 and 180 kD Topo II in GLC4/ADR cells. Equal Topo I amounts were detected in 0.3S M salt nuclear extracts as well as nuclear lysates from GLC4 and GLC4/ADR (fig.SC) .
102

Characterization of Topo II in Nuclear Extracts from GLC4 and GLC4/ ADR.
The possibility that a mutated Topo II was present in GLC4/ ADR cells was investigated. No differences in ATP dependence of the Topo II catalytic activity were observed in nuclear extracts from GLC4 and GLC4/ADR with equalized Topo II catalytic activity (fig.6) . The maximal Topo II catalytic activity was maximal reached at 0.5 mM ATP.
VM-26 and m-AMSA induced formation of the cleavable complex was studied in an in-vitro DNA cleavage assay, using nuclear extracts of both cell lines with equalized Topo II catalytic activities. DNA cleavage activities in the extracts from GLC4 and GLC4/ ADR were similarly sensitive to stimulation by VM-26 (fig. 7) . In nuclear extracts of both cell lines, Topo II-mediated DNA cleavage by VM-26 was higher in the presence of ATP than in the absence of ATP (fig. 7) With m-AMSA identical results were obtained (results not shown).
Drug Sensitivity in Relation to Topo II Activity. The cytotoxicity to NH2, mitomycin C and camptothecin has been related to Topo II activities in cells (37-39) . However, GLC4/ADR showed no collateral sensitivity to NH2 or to mitomycin C (table 1) . GLC4/ ADR and GLC4 were also equally sensitive for camptothecin, a specific inhibitor of Topo I that stabilizes the Topo I-linked DNA single strand breaks (40) .
1 2 3 4 5 6 7 8 9 10 11 12 13 14 15 - kDNA
- M I N I C I RCLES
Figure 6. Concentration dependence of ATP for Topo II catalytic activity in nuclear extracts of GLC4 and GLC4/ADR. Topo II catalytic activity in nuclear extracts of GLC4 and GLC4/ADR was equalized in the presence of 1 mM ATP and then catalytic activity of Topo II was assayed by decatenation of kDNA at different ATP concentrations as described in "Materials and Methods" . Lane I , control, no nuclear extract protein; lanes 2-8, 0.04 µg nuclear extract protein of GLC4 with 0,
0.05, 0 . 1 , 0.25, 0.5, 1 .0, and 2 .0 mM ATP, respectively; lanes 9-15, 0.09 µg nuclear extract protein of GLC4/ADR with 0, 0.05, 0. 1 , 0.25, 0.5, 1 .0, and 2.0 mM ATP, respectively.
103
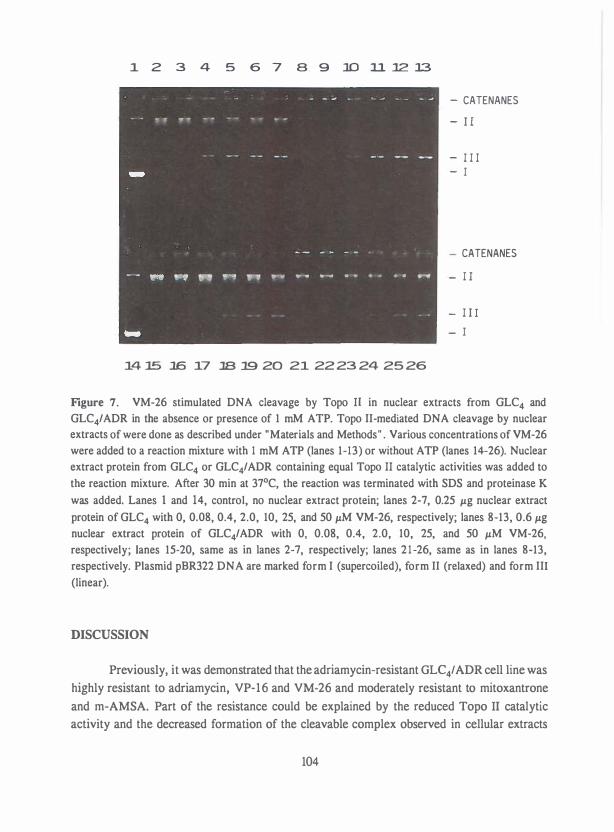
1 2 3 4 5 6 7 a g 10 u. 12 13
- CATENANES
- I I
- I I I - I
- CATENANES
- I I
- I I I
- I
14 15 l.6 17 lB 19 20 21 22 23 24 25 26
Figure 7. VM-26 stimulated DNA cleavage by Topo II in nuclear extracts from GLC4 and GLC4/ADR in the absence or presence of 1 mM ATP. Topo II-mediated DNA cleavage by nuclear extracts of were done as described under "Materials and Methods" . Various concentrations of VM-26 were added to a reaction mixture with 1 mM ATP (lanes 1-13) or without ATP (lanes 14-26). Nuclear extract protein from GLC4 or GLC4/ADR containing equal Topo II catalytic activities was added to the reaction mixture. After 30 min at 37°C, the reaction was terminated with SDS and proteinase K was added. Lanes l and 14, control, no nuclear extract protein; Janes 2-7, 0.25 µg nuclear extract
protein of GLC4 with 0, 0.08, 0.4, 2.0, 10, 25, and 50 µM VM-26, respectively; Janes 8-13, 0.6 µg nuclear extract protein of GLC4/ADR with 0, 0.08, 0.4, 2.0, 10, 25, and 50 µM VM-26, respectively; Janes 15-20, same as in Janes 2-7, respectively; lanes 2 1 -26, same as in lanes 8-13, respectively. Plasmid pBR322 DNA are marked form I (supercoiled), form II (relaxed) and form III (linear).
DISCUSSION
Previously, it was demonstrated that the adriamycin-resistant GLC4/ ADR cell line was
highly resistant to adriamycin, VP-16 and VM-26 and moderately resistant to mitoxantrone
and m-AMSA. Part of the resistance could be explained by the reduced Topo II catalytic
activity and the decreased formation of the cleavable complex observed in cellular extracts
104

of these cells (29). In the present study, the resistance to VM-26 and m-AMSA was further analyzed at the level of Topo II to investigate whether GLC4/ ADR cells contained an altered Topo II with different sensitivities to these drugs. VM-26 and m-AMSA induced Topo IlDNA complex formation in whole cells and isolated nuclei was determined with the K+ -SDS precipitation assay . This assay was specific for Topo II-DNA complexes, since previous reports showed that VM-26 and m-AMSA induced protein-linked single and double stranded breaks in-vitro as well as in-vivo were due to Topo II-mediated DNA cleavage (1-3, 10,4 1 ,42).
The amount of Topo II-DNA complexes induced by VM-26 and m-AMSA in GLC4 and GLC4/ ADR cells after a l h incubation generally corresponded to the cytotoxicity. A 25-fold difference in VM-26 induced cleavable complex formation was found, while GLC4/ ADR was 60-fold resistant to VM-26 compared to GLC4. With m-AMSA a 5-fold decline in cleavable complex formation and a 4-fold resistance was found in GLC4/ ADR. However, the difference in cleavable complex formation in isolated nuclei of GLC4 and GLC4/ ADR was the same after incubation with VM-26 or m-AMSA. These results suggested the involvement of a cellular component in the resistance of GLC4/ ADR to VM-26. Earlier, it was shown that the adriamycin accumulation in GLC4/ ADR cells was decreased, although these cells demonstrated no overexpression of the P-glycoprotein (29,30). Similar findings were described for VP-16 and VM-26 resistant cells (22,23). Thus, an additional mechanism in the resistance of GLC4/ADR to VM-26 could be the decreased accumulation of this drug. The reduced drug accumulation in GLC4/ ADR cells might be related to the expression of a membrane protein with minor sequence homology to the P-glycoprotein recently demonstrated in adriamycin-resistant human leukemia cells (43) .
At the ID50 concentration of VM-26 for each cell line, more cleavable complexes were formed in GLC4/ ADR than in GLC4 cells, while the opposite was seen at the ID50 concentration of m-AMSA. This result with VM-26 could be explained by the increased rate of disappearance of VM-26 induced cleavable complexes in GLC4/ ADR compared to GLC4 cells following drug removal, whereas an equal rate of disappearance was observed in these cell lines following m-AMSA removal. The increased disappearance rate of VM-26 induced cleavable complexes in GLC4/ ADR cells might be due to an altered drug distribution or an altered drug efflux. The fast loss of VM-26 and m-AMSA induced cleavable complexes observed in GLC4 as well as in GLC4/ ADR cells was also found in other human and chinese hamster cells (8,44,45). Our results are consistent with cleavable complex reversibility described in other in-vitro and in-vivo studies (1-3,42), but they do not rule out the possibility of DNA repair. Previously, removal of adriamycin induced DNA double-strand breaks was demonstrated in GLC4/ADR but not in GLC4 (30). In that study, however, an adriamycin concentration was used that induced different levels of DNA damage in the two cell lines (30) . An increased loss of adriamycin induced DNA double-strand breaks was also detected in two adriamycin-resistant P388 cell lines expressing the MDR phenotype (46).
105

The lower level of m-AMSA induced cleavable complexes at a the ID50 concentration
in GLC4/ ADR compared to GLC4 cells may be due to other types of DNA damage or to a
saturation in the detection of protein-DNA complexes by the K+ -SDS precipitation assay at
high drug concentrations. Discrepancies in the relation of VP-16 or m-AMSA induced DNA
cleavage with the cytotoxicity were also observed in other studies comparing chinese hamster
cell lines resistant to VP-1 6 (24,47) and a chinese hamster ovary cell line hypersensitive to
Topo II inhibitors (44) with their parental cell lines . Reasons for this lack of correlation
between sensitive and resistant cells were a different rate of disappearance of cleavable
complexes ( 1 1 ,44) and a changed level of sister chromatid exchange (38,47). The reduced amount of the 1 70 kD Topo II in nuclear extracts and nuclear lysates
of GLC4/ ADR compared to GLC4 was in accordance with results from an earlier study
showing that the Topo II catalytic activity was reduced two- to three-fold in nuclear extracts
of GLC4/ ADR (29). The reduced amount of Topo II also explained the reduced level of
drug-induced cleavable complexes in intact cells and nuclei at high drug concentrations. A
1 80 kD Topo II was detected in nuclear extracts and 1 ysates of both cell lines and the amount
of this enzyme remained unchanged comparing GLC4 with GLC4/ ADR. A decrease in the
amount of 170 kD Topo II and not in the amount of 1 80 kD Topo II were also observed in
m-AMSA resistant P388 leukemia cells (25). The 1 80 kD Topo II was present in other cell
lines (26,48,49). Recently, both the 170 kD and the 1 80 kD Topo II isoenzyme have been
isolated and characterized and the isoenzymes were found to share extensive nucleotide and
predicted peptide homology (25 ,49,50). These studies also showed that the 170 kD Topo II
was maximally expressed in cells in the exponential growth phase and the 1 80 kD Topo II
in the plateau phase of growth and that the cleavage activity of the 1 80 kD Topo II was four
fold less stimulated by VM-26 than DNA cleavage activity of the 170 kD Topo II (49) . Another study showed that the efficacy of Topo II inhibitors was related to a higher
proportion of the 170 kD Topo II as well as a higher amount of this Topo II (48). A change
in the ratio of 170 and 1 80 kD Topo II in opposite direction was observed in NH2 resistant
human Burkitt's lymphoma cells, in which the amount of 1 80 kD Topo II was increased (5 1) . The presence of the equal amounts of the 1 80 kD Topo II in GLC4 and GLC4/ADR cells
might explain the same sensitivity to NH2•
The same amounts of Topo I in GLC4 and GLC4/ ADR and the almost identical
sensitivity for camptothecin were in agreement with the equal Topo I activities formerly
observed in nuclear extracts (29) . Thus, the decreased level of Topo II was not compensated
by an increased Topo I level as was demonstrated in m-AMSA resistant P388 cells (39) . Reduced Topo II catalytic activities and amounts of Topo II were also found in VP-16 and
m-AMSA resistant cell lines (22,23,25 ,39) and in two multidrug resistant cell lines with
acquired resistance to adriamycin (52) . The reduced amount of Topo II could be due to
rearrangement of one allele of the Topo II gene and hypermethylation of the Topo II gene
(39) or a decreased copy number of one allele and a mutation in the second allele leading to
106

a reduction in Topo II mRNA (53) . Further studies were performed to determine if GLC4/ ADR cells contained an altered
Topo II. VM-26 resistant (21 ,54), m-AMSA-resistant (26) and 9-hydroxyellipticine resistant cells (27) were resistant to drug-induced cleavable complex formation despite the unchanged Topo II amounts or activities. Topo II from VM-26 (28,54,55) and m-AMSA resistant cells (28) was more ATP-dependent (26,28,54,55), more ionic-strength dependent (26) and more temperature sensitive (28) than Topo I I from sensitive cells. Topo II of GLC4/ ADR cells, however, was probably not altered , since the catalytic activity and DNA cleavage activity of the enzyme in nuclear extracts showed neither an increased ATP-dependency nor an altered drug-induced cleavable complex formation. In contrast to findings in GLC4/ ADR cells, an increased sensitivity to mitomycin C was observed in 9-hydroxyellipticine-resistant Chinese hamster cells (38) which might be related specifically to an altered Topo II.
In this study we found, that the amount of the 170 kD Topo II was reduced in GLC4/ ADR, which can explain the resistance to m-AMSA completely, whereas other cellular mechanisms such as drug accumulation and removal of cleavable complexes are involved in the resistance to VM-26. The reduced amount of the 170 kD Topo II in GLC4/ ADR cells need further genetic analysis.
ACKNOWLEDGMENTS
We thank Dr. Leroy Liu for the polyclonal antibody against human Topo II, Dr. Piet Limburg for the systemic sclerosis patient's serum to detect human Topo I and Dr. Douwe van Sinderen for supplies of supercoiled pBR322 DNA.
REFERENCES
1 . Nelson, E.M. , Tewey, K.M., and Liu, L.F. Mechanism of antitumor drug action: poisoning of mammalian DNA topoisomerase II on DNA by 4'-(9-acridinyl-amino)-methanesulfon-maniside. Proc. Natl . Acad. Sci. USA, 8 1 : 1361-1365, 1984.
2 . Tewey, K.M., Chen, G.L., Nelson, E.M. , and Liu, L.F. Intercalative antitumor drugs interfere with the breakage-reunion reaction of mammalian DNA topoisomerase II. J . Biol. Chem. , 259: 9 1 82-9 187, 1984.
3 . Chen, G.L., Yang, L. , Rowe, T.C., Halligan, B .D . , Tewey K.M. , and Liu, L.F. Nonintercalative antitumor drugs interfere with the breakage-reunion reaction of mammalian DNA topoisomerase II. J . Biol. Chem. , 259: 13560-13566, 1984.
4. Tewey, K.M., Rowe, T.C., Yang, L., Halligan, B.D. , and Liu, L.F. Adriamycin-induced DNA damage mediated by mammalian DNA topoisomerase II. Science, 226: 466-468, 1984.
5 . Osheroff, N . Effect of antineoplastic agents on the DNA cleavage I religation reaction of eukaryotic topoisomerase II: inhibition of DNA religation by etoposide. Biochemistry, 28:
107

6 157-6160, 1989. 6. Robinson, M.J . , and Osheroff, N. Stabilization of the topoisomerase II-DNA cleavage
complex by antineoplastic drugs: inhibition of enzyme-mediated DNA religation by 4'-(9-acridinylamino )-methanesulfon-m-aniside. Biochemistry, 29: 251 1 -2515, 1990.
7. Ross, W., Rowe, T., Glisson, B . , and Liu, L. Role of topoisomerase II in mediating epipodophyllotoxin-induced DNA cleavage. Cancer Res . , 44: 5857-5860.
8. Epstein, R.J . , and Smith, P .J. Estrogen-induced potentiation of DNA damage and cytotoxicity in human breast cancer cells treated with topoisomerase II-interactive antitumor drugs. Cancer Res . , 48: 297-303, 1988.
9 . Covey, J.M., Kohn, K.W. , Kerrigan, D . , Tilchen, E.J . , and Pommier, Y. Topoisomerase II-mediated DNA damage produced by 4'-(9-acridinylamino)-methanesulfon-m-aniside and related acridines in L1210 cells and isolated nuclei: relation to cytotoxicity. Cancer Res . , 48: 860-865, 1988.
10. Rowe, T.C. , Chen, G.L., Hsiang, Y.-H . , and Liu, L.F. DNA damage by antitumor acridines mediated by mammalian DNA topoisomerase II. Cancer Res . , 46: 202 1-2026, 1986.
1 1 . Fox, M.E., and Smith, P .J. Long-term inhibition of DNA synthesis and the persistence of trapped topoisomerase II complexes in determining the toxicity of the antitumor DNA intercalators mAMSA and mitoxantrone. Cancer Res. , 50: 5813-58 18, 1990.
12. Wang, J.C. DNA topoisomerases. Annu.Rev.Biochem. , 54: 665-697, 1985 . 1 3 . Liu, L.F. DNA topoisomerase poisons as antitumor drugs . Annu . Rev. Biochem. , 5 8 : 35 1-
375, 1989. 14. Nelson, W.G., Liu, L.F., and Coffey, D.S. Newly replicated DNA is associated with DNA
topoisomerase II in cultured rat prostatic adenocarcinoma cells. Nature 322: 187-189, 1986. 15 . Sperry, A.O. , Blasquez, V.C., and Garrard, W.T. Dysfunction of chromosomal loop
attachment sites: illegitimate recombination linked to matrix association regions of topoisomerase II. Proc. Natl . Acad. Sci. USA, 86: 5497-5501 , 1989.
16. Berrios, M., Osheroff, N., and Fisher, P.A. In-situ localization of DNA topoisomerase II: a major polypeptide component of the Drosophila melanogaster nuclear matrix fraction. Proc. Natl . Acad. Sci. USA, 82: 4142-4146, 1985.
17. Gasser, S.M., Laroche, T., Falquet, J., Boy de la Tour, E., and Laemmli, U .K. Metaphase chromosome structure: involvement of topoisomerase II. J . Mol . Biol . , 188: 613-629, 1986.
18 . Endicott, J .A . , and Ling, V. The biochemistry of P-glycoprotein-mediated multidrug resistance. Annu. Rev. Biochem. , 58: 137- 171 , 1989.
19 . Horio, M., Gottesman, M.M. , and Pastan, I. ATP-dependent transport of vinblastine in vesicles from human multidrug-resistant cells. Proc. Natl . Acad. Sci. USA, 85: 3580-3584, 1988.
20. Ueda, K. , Cardarelli, C. , Gottesman, M.M., and Pastan, I. Expression of a full-length cDNA for the human mdrl gene confers resistance to colchicine, doxorubicin and vinblastine. Proc. Natl . Acad. Sci. USA, 84: 3004-3008, 1987.
2 1 . Glisson, B . , Gupta, R . , Smallwood-Kentro, S . , and Ross, W.E. Characterization of acquired epipodophyllotoxin resistance in a Chinese hamster ovary cell line: loss of drug-stimulated DNA cleavage activity. Cancer Res . , 46: 1934-1938, 1986.
22. Ferguson, P.J . , Fisher, M.H., Stephenson, J., Li, D., Zhou, B., and Cheng, Y. Combined modalities of resistance in etoposide-resistant human KB cell lines. Cancer Res . , 48: 5956-5964, 1988.
23 . Matsuo, K., Kohno, K., Takano, H . , Sato, S . , Kiue, A., and Kuwana, M. Reduction of drug accumulation and DNA topoisomerase II activity in acquired teniposide-resistant human cancer KB cell lines. Cancer Res. , 50: 5819-5824, 1990.
24. Spiridonidis, C.A., Chatterjee, S . , Petzold, S.J., and Berger, N.A. Topoisomerase 11-dependent and -independent mechanisms of etoposide resistance in Chinese hamster cells. Cancer Res . , 49: 644-650, 1989 .
108

25. Drake, F.H., Zimmerman, J .P. , McCabe, F.L., Bartus, H.F., Per, S .R. , Sullivan, D.M., Ross, W.E., Mattern, M.R. , Johnson, R.K., Crooke, S .T., and Mirabelli, C.K. Purification of topoisomerase II from amsacrine-resistant P388 leukemia cells. J. Biol. Chem. , 262: 16739-16747, 1987.
26. Zwelling, L.A. , Hinds, M., Chan, D. , Mayes, I . , Sie, K.L., Parker, E., Silberman, L. , Radcliffe, A. , Beran, M., and Blick, M. Characterization of an amsacrine-resistant line of human leukemia cells. J . Biol . Chem. , 264: 1641 1-16420, 1989.
27. Pommier, Y., Kerrigan, D., Schwartz, R.E., Swack, I .A. , and McCurdy, A. Altered DNA topoisomerase II activity in Chinese hamster cells resistant to topoisomerase II inhibitors. Cancer Res . , 46: 3075-308 1 , 1986.
28. Sullivan, D.M., Latham, M.D. , Rowe, T.C., and Ross, W.E. Purification and characterization of an altered topoisomerase II from a drug-resistant Chinese hamster ovary cell line. Biochemistry, 28: 5680-5687, 1989.
29. De Jong,S . , Zijlstra, J .G. , de Vries, E.G.E. , and Mulder, N.H. Reduced DNA topoisomerase II activity and drug-induced DNA cleavage activity in an adriamycin-resistant human small cell lung carcinoma cell line. Cancer Res. , 50: 304-309, 1990.
30. Zijlstra, J .G., de Vries, E.G.E., and Mulder, N.H. Multifactorial drug resistance in an adriamycin-resistant human small cell lung carcinoma cell line. Cancer Res . , 47: 1780-1784, 1987.
3 1 . Timmer-Bosscha, H . , Hospers, G.A.P., Meijer, C . , Mulder, N.H., Muskiet, F.A.J . , Martini, I .A. , Uges, D.R.A. , and De Vries, E.G.E. The influence of docosahexaenoic acid on cisplatin resistance in a human small cell lung carcinoma cell line. J. Natl. Cancer Inst., 8 1 : 1069-1075, 1989.
32. Laemmli, U .K. Cleavage of structural proteins during the assembly of the head of bacteriophage T4. Nature (Lond.), 227: 680-685, 1970.
33 . Shero, J .H. , Bordwell, B . , Rothfield, N.F., and Earnshaw, W.C. High titers of autoantibodies to topoisomerase I (ScL-70) in sera from scleroderma patients. Science, 23 1 : 737-740, 1986.
34. Maul, G.G. , Jimenez, S .A. , Riggs, E., and Ziemnicka-Kotula, D. Determination of an epitope of the diffuse systemic sclerosis marker antigen DNA topoisomerase I: sequence similarity with retroviral p3oi:ag protein suggests a possible cause for autoimmunity in systemic sclerosis. Proc. Natl. Acad. Sci. USA, 86: 8492-8496, 1989.
35. Bradford, M.M. A rapid and sensitive method for the quantitation of microgram quantities of protein utilizing the principle of protein-dye binding. Anal. Biochem., 72: 248-254, 1976.
36. Marini, J .C. , Miller, K.G., and Englund, P.T. Decatenation of kinetoplast DNA by topoisomerase II. J. Biol. Chem. , 255: 4976-4979, 1980.
37. Tan, K.B., Mattern, M.R., Boyce, R.A., and Schein, P.S. Elevated DNA topoisomerase II activity in nitrogen mustard-resistant human cells. Proc. Natl . Acad. Sci. USA, 84: 7668-767 1 , 1987.
38. Pommier, Y. , Kerrigan, D., Covey, J .M., Kao-Shen, C . , and Whang-Peng, J. Sister chromatid exchanges, chromosomal aberrations, and cytotoxicity produced by antitumor topoisomerase II inhibitors in sensitive (DC3F) and resistant (DC3F/9-0HE) Chinese hamster cells. Cancer Res., 48: 512-5 16, 1988.
39. Tan, K.B., Mattern, M.R., Eng, W.-K., McCabe, F.L., and Johnson, R.K. Nonreproductive rearrangement of DNA topoisomerase I and II genes:correlation with resistance to topoisomerase inhibitors. J. Natl . Cancer Inst. , 8 1 : 1732-1735, 1989.
40. Hsiang, Y-H . , and Liu, L.F. Identification of mammalian DNA topoisomerase I as an intracellular target of the anticancer drug camptothecin. Cancer Res. , 48: 1722-1726, 1988.
4 1 . Yang, L . , Rowe, T.C., and Liu, L.F. Identification o f DNA topoisomerase I I as an intracellular target of antitumor epipodophyllotoxins in simian virus 40-infected monkey cells. Cancer Res . , 45: 5872-5876, 1985.
109

42. Hsiang, Y-H. , and Liu, L.F. Evidence for the reversibility of cellular DNA lesion induced by topoisomerase II poisons. J. Biol. Chem. , 264: 9713-9715, 1989.
43. Marquardt, D, McCrone, S., and Center, M.S. Mechanisms of multidrug resistance in HL60 cells: Detection of resistance-associated proteins with antibodies against synthetic peptides that correspond to the deduced sequence of P-glycoprotein. Cancer Res . , 50: 1426-1430, 1990.
44. Caldecott, K . , Banks, G . , and Jeggo, P. DNA double-strand break repair pathways and cellular tolerance to inhibitors of topoisomerase II. Cancer Res . , 50: 5778-5783, 1990.
45. Robbie, M.A., Baguley, B.C., Denny, W.A., Gavin, J.B., and Wilson, W.R. Mechanism of resistance of noncycling mammalian cells to 4'-(9-acridinylamino)-methanesulfon-maniside: Comparison of uptake, metabolism, and DNA breakage in log- and plateau-phase chinese hamster fibroblast cell cultures . Cancer Res . , 48: 3 10-3 19, 1988 .
46. Deffie, A.M., Alam, T., Seneviratne, C. , Beenken, S.W., Batra, J .K. , Shea, T.C., Renner, W.D., and Goldenberg, G .J . Multifactorial resistance to adriamycin: relationship of DNA repair, glutathione transferase activity, drug efflux, and P-glycoprotein in cloned cell l ines of adriamycin-sensitive and -resistant P388 leukemia. Cancer Res . , 48: 3595-3602, 1988.
47. Chatterjee, S., Trivedi, D., Petzold, SJ., and Berger, N.A. Mechanism of epipodophyllotoxin-induced cell death in poly(adenosine diphosphate-ribose) synthesisdeficient V79 Chinese hamster cell lines. Cancer Res. , 50: 2713-271 8, 1990.
48. Woessner, R.D., Chung, T.D.Y., Hofmann, G.A., Mattern, M.R. , Mirabelli, C.K., Drake, F .H. , and Johnson, R.K. Differences between normal and ras-transformed NIH-3T3 cells in expression of the l 70kD and 180 kD forms of topoisomerase II. Cancer Res . , 50: 2901-2908, 1990.
49. Drake, F.H., Hofmann, G.A., Bartus, H.F. , Mattern, M.R., Crooke, S.T. , and Mirabelli, C.K. Biochemical and pharmacological properties of p l 70 and p 1 80 forms of topoisomerase II. Biochemistry, 28: 8 154-8160, 1989.
50. Chung, T.D.Y., Drake, F.H., Tan, K.B., Per, S.R. , Crooke, S .T. , and Mirabelli, C .K. Characterization and immunological identification of cDNA clones encoding two human DNA topoisomerase II isoenzymes. Proc. Natl . Acad. Sci. USA, 86: 943 1-9435, 1989 .
5 1 . Tan, K.B. , Mattern, M.R. , Boyce, R.A., and Schein, P.S. Unique sensitivity o f nitrogen mustard-resistant human Burkitt's lymphoma cells to novobiocin. Biochem. Pharm. 37: 441 1-4413, 1 988.
52. Deffie, A.M. , Batra, J .K., and Goldenberg, G.J. Direct correlation between DNA topoisomerase II activity and cytotoxicity in adriamycin-sensitive and -resistant P388 leukemia cell lines. Cancer Res. , 49: 58-62, 1989.
53. Deffie, A.M., Bosman, D.J., and Goldenberg, G.J. Evidence for a mutant allele of the gene for DNA topoisomerase II in adriamycin-resistent P388 murine leukemia cells. Cancer Res . , 49: 6879-6882, 1989.
54. Danks, M.K., Schmidt, C.A., Cirtain, M.C. , Suttle, D.P., and Beck, W.T. Altered catalytic activity of and DNA cleavage by DNA topoisomerase II from human leukemic cells selected for resistance to VM-26. Biochemistry, 27: 8861-8869, 1988.
55. Danks, M.K., Schmidt, C.A., Deneka, D.A . , and Beck, W.T. Increased ATP requirement for activity of and complex formation by DNA topoisomerase II from human leukemia CCRF-CEM cells selected for resistance to teniposide. Cancer Commun., 1: 101 -109, 1989.
1 10
Chapter 7
LACK OF CROSS-RESISTANCE TO FOSTRIECIN IN
A HUMAN SMALL CELL LUNG CARCINOMA CELL
LINE WITH TOPOISOMERASE II RELATED DRUG-
RESISTANCE
Steven de Jong, Jan G. Zijlstra, Nanno H. Mulder, Elisabeth G.E. de Vries.
Division of Medical Oncology, Department of Internal Medicine, University Hospital,
Groningen, The Netherlands.
SUMMARY
Cells with a decreased DNA topoisomerase (Topo) II activity are resistant for several drugs such as epipodophyllotoxins, anthracyclines and acridines which require Topo II as an intermediate. Those drugs are cytotoxic due to the formation of a cleavable complex between
drug, Topo II and DNA. Fostriecin belongs to a new class of drugs which inhibit Topo II activity without cleavab/e complex formation. We tested fostriecin in three human small cell
lung carcinoma cell lines. GLC4 is the parent line. GLC/ADR is its atypical multidrug
resistant subline which is resistant to several Topo II inhibitors due to a decreased Topo II
activity. GLC/CDDP is its cisplatin resistant subline with an increased Topo II activity. The
Topo II activity is 100% in GLC4, 35% in GLC/ADR and 130% in GLC/CDDP. The ID50 offostriecin in the microculture tetrazolium assay with continuous incubation is 11 .2, 4.1 and
14.9 µ.M, respectively. Resistance to fostriecin is not connected with resistance to methotrexate, although both drugs are supposed to enter the cell by the same carrier.
Sensitivity to etoposide (VP-16) is related to the Topo II activity, since GLC/ADR is cross
resistant to VP-16, while GLC/CDDP is more sensitive for VP-16 compared to GLC4. Both GLC/ADR and GLC/CDDP are cross-resistant to a camptothecin analogue, a drug that
stimulates the formation of a Topo I-DNA complex. Our results indicate an inverse relation
between Topo II activity andfostriecin sensitivity. However, further studies are required to
establish this relation.
1 1 1

INTRODUCTION
The existence or the development of drug resistance is a major clinical problem. Basic
research has revealed several mechanisms by which tumor cells acquired drug-resistance (1-4). One of these mechanisms is centered around Topo II (4-6) .
Topo I and II are nuclear enzymes regulating the topological configuration of DNA
(4,7). Topo II binds covalently with DNA, breaks both DNA strands, passes another part of double stranded DNA through the break and reseals the break (4,6,7). Several drugs exhibit
their cytotoxicity in conjunction with Topo II (5). Epipodophyllotoxins, anthracyclines,
acridines and others stabilize the cleavable complex between Topo II and DNA. This
complex is called the cleavable complex because under protein denaturing circumstances in
vitro this complex disintegrates and DNA strand breaks can be detected. The formation of
this complex rather than the inhibition of the catalytic activity of Topo II is supposed to be
the cytotoxic lesion (5) . Therefore, cells with a decreased Topo II content or a mutant Topo
II will be less susceptible to Topo II mediated cytotoxicity. This defence mechanism has been
identified in several drug-resistant cell lines (8-12) . Until now, no countermeasures reversing
this type of resistance have been identified .
Although most Topo II functions can be substituted by Topo I, the Topo II activity
is vital at mitosis in order to segregate DNA strands (13) . Cells with a decreased Topo II
activity at mitosis may therefore be collateral sensitivity to drugs which inhibit the catalytic
activity of Topo II. Drugs stimulating cleavable complex formation inhibit catalytic activity
only at highly cytotoxic concentrations (5). Recently, fostriecin and merbarone were
described to exhibit cytotoxicity and to inhibit Topo II without forming a cleavable complex
( 14-17). Novobiocin also inhibits eukaryotic Topo II catalytic activity in nuclear extracts and
in intact cells ( 18, 19) probably by acting as a competitive inhibitor of ATP (20). The
decreased Topo II activity in these cells can be partially compensated by an increase in Topo
I activity ( 10,21) . This can also lead to collateral sensitivity to drugs such as camptothecin,
a drug which stimulates the formation of a Topo I-DNA complex (21). In order to investigate whether a decreased Topo II renders cells more susceptible for
non-cleavable complex forming Topo II inhibitors or to Topo I inhibitors, we tested the
cytotoxicity of fostriecin in three human small cell lung cancer (hSCLC) cell lines with a
different Topo II content. We used a variant type cell line, GLC4, its atypical multidrug
resistant descendant GLC4/ADR and its cisplatin resistant descendant GLC/CDDP (1 1 ,21-24).
MATERIALS AND METHODS
Drugs and DNA substrates. Fostriecin was a gift of Parke Davis (Ann Arbor, MI)
1 12

and SKF 104864-A a gift of Smith Kline & French, (King of Prussia, PA). VP-16 was obtained from Bristol-Myers SAE (Madrid, Spain) , methotrexate from Lederle (Etten-Leur, the Netherlands), and novobiocin from Sigma (St.Louis, MO). Form I kinetoplast DNA (kDNA) was isolated from the mitochondria of C.fasciculata by CsCl/ethidium bromide centrifugation as described previously (1 1).
Cell lines. GLC4 is a hSCLC cell line derived from a pleural effusion and kept in continuous culture in RPMI 1640 supplemented with 10% fetal calf serum. GLC4/ADR, a subline of the parental line, was made resistant by stepwise increasing concentrations of adriamycin (22). GLC4/ ADR shows an atypical multidrug resistant phenotype with resistance to vincristine, vindesine, VP-16, m-AMSA and adriamycin without overexpression of mdr1 mRNA and gp170 (1 1).
GLC4/CDDP was derived from GLC4 after long-term continuous incubations with cisplatin until a stable resistance factor of 6.4 was obtained. This cell line was extensively described previously (23) .
Drug sensitivity assay. The microculture tetrazolium assay (MT A) was performed as described previously (1 1). Shortly, exponentially growing cells were incubated in 96-well culture plates with various concentrations of fostriecin for four days. For GLC4 5 ,000 cells, for GLC4/ADR 12,500 cells and for GLC4/CDDP 15,000 cells per well were incubated. After four days 20 µl of MTT solution (5 mg MTT/ml PBS) was added to each well for 3.5 h. The plates were washed and the formazan crystals were dissolved in 100% dimethyl sulfoxide. The extinction was read using a scanning microtiterwell spectrophotometer. At least 3 separate experiments were performed in quadriplicate at each tested concentration.
Preparation of nuclear enzyme extracts. Nuclei were isolated as described previously (1 1). Briefly, log-phase cells (3-8xl a5 cells/ml) were pelleted by centrifugation at 150 g for 10 min and washed 3 times with ice-cold PBS for 10 min at 4°C. The cell pellets were resuspended in 1 ml nucleus buffer ( 150 mM NaCl, 1 mM KH2P04, 5 mM MgC12, 1 mM EGTA, 0.2 mM dithiotreitol and 1 mM PMSF, pH 6.4) at 4°C and then mixed with an additional 9 ml nucleus buffer containing 0.3 % Triton X-100. The cell suspension was mixed gently by rotation for 10 min at 4°C and then centrifuged at 150 g for 10 min at 4°C. The nuclei pellet was washed once with Triton-free nucleus buffer and resuspended in Triton-free nucleus buffer. The nuclei were extracted for 30 min at 4°C after addition of an equal volume of nucleus buffer containing 0.55 M NaCl was added (final [NaCl] = 0.35 M). Protein concentrations were determined by the method of Bradford (25). The enzyme solution was diluted with an equal volume of 87% glycerol and stored at -2D°C.
Decatenation assay. Topo II catalytic activity was assayed using the decatenation assay as described previously (1 1). The standard reaction mixture for the decatenation assay was 50 mM Tris-HCI (pH 7.5), 85 mM KC!, 10 mM MgC12, 0.5 mM dithiothreitol, 0.5 mM EDTA, bovine serum albumin (0.03 mg/ml) and 1 mM ATP. Decatenation of 0.4 µg of kDNA was carried out as described previously ( 1 1). Gels were stained with ethidium
1 13
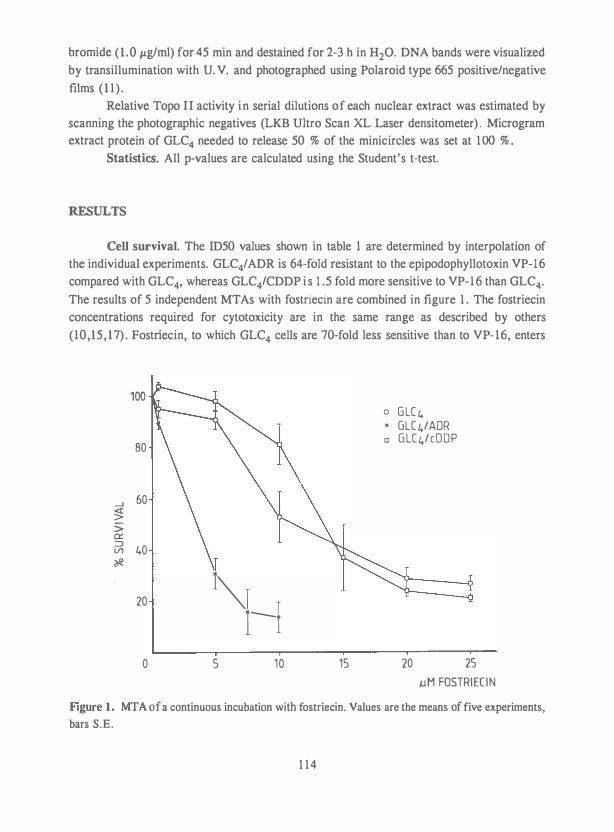
bromide ( 1 .0 µg/ml) for 45 min and destained for 2-3 h in H20. DNA bands were visualized
by transillumination with U. V. and photographed using Polaroid type 665 positive/negative
films ( 1 1 ) .
Relative Topo II activity in serial dilutions of each nuclear extract was estimated by
scanning the photographic negatives (LKB Ultro Scan XL Laser densitometer) . Microgram
extract protein of GLC4 needed to release 50 % of the minicircles was set at 1 00 % . Statistics. All p-values are calculated using the Student's t-test.
RESULTS
Cell survival. The ID50 values shown in table 1 are determined by interpolation of
the individual experiments. GLC4/ADR is 64-fold resistant to the epipodophyllotoxin VP-1 6
compared with GLC4, whereas GLC4/CDDP i s 1 .5 fold more sensitive to VP-1 6 than GLC4•
The results of 5 independent MT As with fostriecin are combined in figure 1 . The fostriecin
concentrations required for cytotoxicity are in the same range as described by others
(10,15, 17) . Fostriecin, to which GLC4 cells are 70-fold less sensitive than to VP-16, enters
100
BO
_J 60 � > 0:: � 40 �
20
0
J
I�l r-I
5 10 15
o G LC 4 * GLC 4/ADR o G LC 4/ c O D P
20 25 � M FOSTRIECIN
Figure 1. MTA of a continuous incubation with fostriecin. Values are the means of five experiments,
bars S.E.
1 14

Table 1. Topo II activity and the cytotoxicity of topo I and topo II inhibitors and methotrexnte in three hSCLC cell lines.
VP-16 0. 159 ± O.Q25 Fostriecin 1 1 .2 ± 3 .8 Methotrexate 0.054 ± 0.028 Novobiocin 1 87 ± 34 SKF 104864-A 0.007 ± 0.002
Topo II 100
10.2 ± 2.4d
4. 1 ± o.8d
0. 140 ± 0.037d
298 ± 1 8d
0.024 ± o.012d
Relative activity (% )0
0 . 106 ± o.02d
14.9 ± o.8d
0.079 ± 0.020 244 ± 28d
0.020 ± o.0 1 1d
a) 50% inhibiting dose in the microculture tetrazolium assay after continuous drug exposure (mean ± SD).
b) number in parentheses, number of experiments from which determinations are made
c) Topo II activities in nuclear extracts as determined with the decatenation assay. Photographic negatives were densitometrically scanned as described in "Materials and Methods" . Values are the mean ± SD of three experiments.
d) p < 0.05, GLC4 versus GLC4/ADR or GLC4/CDDP.
(n=3)b
(n=5) (n= 4) (n=3) (n=3)
the cell via the reduced folate carrier system which is also utilized for transport of the
antifolate methotrexate (26) . GLC4'ADR is 2.7-fold more sensitive to fostriecin and 2.5-fold
resistant to the methotrexate compared with GLC4• In contrast GLC4/CDDP shows 1 .3-fold
cross-resistance to fostriecin and 1 .4-fold resistance to methotrexate compared with GLC4•
Both GLC4/ ADR and GLC4/CDDP are slightly cross-resistant to novobiocin, 1 .6-fold and
1 .3-fold, respectively. The degree of resistance to the water-soluble camptothecin analogue
SKF 104864-A is 3 .5-fold in GLC4/ADR and 2.9-fold in GLC4/CDDP compared with
GLC4.
Quantification of Topo JI activity. The results of three independent experiments to
determine Topo II activity in 0.35 M NaCl nuclear extracts are shown in table 2. Extract
protein concentrations were adjusted to equivalence and the Topo II activities of the extracts
were determined by densitometrically scanning the band intensities of monomer circles in
serial dilutions. Compared with GLC4, GLC4/CDDP has an increased Topo II activity and
1 15

GLC4/ADR has a decreased Topo II activity. The slightly different growth rates but similar
cell cycle distributions can not account for the observed differences in Topo II activities in
the three cell lines (chapter 5 and 9 of this thesis) .
DISCUSSION
In the hSCLC cell line GLC4 and its adriamycin-resistant and CDDP-resistant
sublines, fostriecin is cytotoxic at concentrations comparable to those found to be toxic in
other cell lines (10, 15 , 17). This model supports our assumption that cell lines with different
Topo II activities should be more or less susceptible to fostriecin. The cell line with the
lowest Topo II activity, GLC4/ADR, was found to be most sensitive for fostriecin. This
increased sensitivity is probably not due to an increased uptake of fostriecin by the reduced
folate carrier system (27), since GLC4/ ADR shows cross-resistance to methotrexate rather
suggesting a decreased uptake capacity of this carrier system. The relation between VP-16
cytotoxicity and Topo II activity is the reverse of which is observed with fostriecin. It
therefore appears that the mechanism of action of fostriecin is different from VP-16, a drug
which stimulates the cleavable complex formation (4) . The results are compatible with results
obtained with purified Topo II which showed that fostriecin acts as an inhibitor of the Topo
II catalytic activity ( 14). VP-16 resistant human nasopharyngeal cell lines with decreased
Topo II activities were collateral sensitive to 4'-DMEP-ME, a synthetic analogue of VP-16,
which only inhibits Topo II activity (10).
Novobiocin had a synergistic effect on the cytotoxicity of CDDP (27-29) and a Phase
I clinical trial of novobiocin had been performed (30) . However, GLC4/ADR as well as
GLC4/CDDP were cross-resistant to novobiocin. The cross-resistance of GLC4/ADR may
be due to a decreased uptake of the drug. Novobiocin was a less effective enhancer of the
CDDP cytotoxicity in GLC4/CDDP than in GLC4 (chapter 9 of this thesis). Since both
novobiocin and fostriecin are inhibitors of the Topo II activity but probably in a different
manner (14), fostriecin in combination with CDDP may also have a synergistic effect on the
cytotoxicity. Especially in cells with a decreased Topo II activity as observed in GLC4/ADR
and other cell lines resistant to epipodophyllotoxins, anthracyclines and acridines this
combination may be effective.
No increased sensitivity to the Topo I inhibitor SKF 104864-A is observed in
GLC4/ADR, probably as the decreased Topo II activity in GLC4/ADR was not compensated
by an increase in Topo I activity (1 1). Actually, GLC4/ADR as well as GLC4/CDDP are
cross-resistant to SKF 104864-A, possibly as a result of the increased doubling times of these
cell lines compared to GLC4. Similar results were obtained with camptothecin (chapter 6 and
9 of this thesis).
The step in the enzymatic pathway of Topo II which is inhibited by fostriecin remains
1 1 6

to be elucidated. Furthermore, the inverse relation between Topo II activity and fostriecin
has to be established in other cell lines with Topo II related resistance. The different mechanism of action of fostriecin resulting in collateral sensitivity may prove to be of value for the treatment of tumors with acquired or intrinsic Topo II related resistance, possibly in combination with CDDP.
REFERENC�
1 . Curt, G.A., Clendeninn, N.J . , Chabner, B.A. Drug resistance in cancer. Cancer Treat.Rep. , 8 1 : 87-99, 1984.
2 . Endicott, J .A. , and Ling, V . The biochemistry of P-glycoprotein-mediated multidrug resistance. Annu.Rev.Biochem., 58: 137-17 1 , 1989.
3. Moscow, J .A., and Cowan, K.H. Multidrug Resistance. J .Natl .Cancer Inst. , 80: 1 4-20, 1988. 4. Liu, L.F. DNA topoisomerase poisons as antitumor drugs. Annu.Rev. Biochem. , 58: 351-
375, 1989. 5 . Ross, W.E., Sull ivan, D.M. , and Chow, K .C . Altered function of DNA topoisomerases as
a basis for antineoplastic drug action. In: Important advances in oncology 1988. DeVita VT, Hellman S, Rosenberg SA, eds. J.B. Lippincott, Philadelphia, 1988.
6. Zijlstra, J.G., de Jong, S . , de Vries, E.G.E., and Mulder, N.H. Topoisomerases, new targets in cancer chemotherapy. Med.One.Tumor Pharmacother., 7: 1 1- 18, 1990.
7. Wang, J.C. DNA topoisomerases. Annu.Rev.Biochem 54: 665-697, 1985. 8. Danks, M.K., Schmidt, C.A. , Cirtain, M.C., Suttle, D.P. , and Beck, W.T. Altered catalytic
activity of and DNA cleavage by topoisomerase II from human leukemic cells selected for resistance to VM26. Biochemistry, 27: 8861-8869, 1988.
9 . Deffie, A.M., Batra, J .K. , and Goldenberg, G.J. Direct correlation between DNA topoisomerase II activity and cytotoxicity in adriamycin-sensitive and -resistant P388 leukemia cell lines. Cancer Res . , 49: 58-62, 1989.
10. Ferguson, P.J . , Fisher, M.H., Stephenson, J . , Li, D. , Zhou, B . , and Cheng, Y . Combined modalities of resistance in etoposide-resistant human KB cell lines. Cancer Res . , 48: 5956-5964, 1988.
1 1 . De Jong, S . , Zijlstra, J .G., de Vries, E.G.E., and Mulder, N.H. Reduced DNA topoisomerase II activity and drug-induced DNA cleavage activity in extracts from an adriamycin resistant human small cell lung carcinoma cell line. Cancer Res . , 50: 304-309, 1990.
12 . Spiridonidis, C.A., Chatterjee, S . , and Petzold, S .J . Topoisomerase II- dependent and -independent mechanisms of etoposide resistance in chinese hamster cell lines. Cancer Res. , 49: 644-650, 1989.
1 3 . Holm, C. , Goto, T., Wang, J .C . , and Botstein, D . DNA topoisomerase I I i s required at the time of mitosis in yeast. Cell, 4 1 : 553-563, 1985.
14. Boritzki, T.J. , Wolfard, T.S., Besserer, J .A. , and Jackson, R.C., and Fry, D.W. Inhibition of type II topoisomerase by fostriecin. Biochem.Pharm. , 37: 4063-4068, 1988.
15. Drake, F.H. , Hofmann, G.A., Mong, S.M., O'Leary Bartus, J., Hertzberg, R.P., Johnson, R.K., Mattern, M.R., and Mirabelli, C.K. In vitro and intracellular inhibition of topoisomerase II by the antitumor agent merbarone. Cancer Res . , 49: 2578-2583, 1989.
1 17

16. Leopold, W.R., Shillis, J .L., Mertus, A.E., Nelson, J.M., Roberts, B.J., and Jackson, R.C. Anticancer activity of the structurally novel antibiotic CI-920 and its analogs. Cancer Res., 44: 1928-1932, 1984.
17. Scheithauer, W., Von Hoff, D.D., Clark, G.M., Shillis, J.L., and Elslager, E.F. In vitro activity of the novel antitumor antibiotic fostriecin (CI-920) in a human tumor cloning assay. Eur.J.Cancer Clin. Oncol., 22: 92 1 -926, 1986.
1 8 . Tan, K.B., Mattern, M.R., Boyce, R.A., and Schein, P .S . Unique sensitivity of nitrogen mustard-resistant human Burkitt lymphoma cells to novobiocin. Biochem. Pharm. 37: 441 1 -4413, 1988.
19. Gellert, M., O'Dea, M.H. , ltoh, T., and Tomizawa, J .I. Novobiocin and coumermycin inhibit DNA supercoiling catalyzed by DNA gyrase. Proc.Natl .Acad.Sci. USA, 73: 4474-4478, 1976.
20. Hsieh, T., and Brutlag, D. ATP-dependent DNA topoisomerase from D.melanogaster reversibly catenates duplex DNA rings. Cell, 2 1 : 1 15-125, 1980.
2 1 . Tan, K.B., Mattern, M.R., Eng, W.-K., McCabe, F.L., and Johnson, R.K. Nonreproductive rearrangement of DNA topoisomerase I and II genes:correlation with resistance to topoisomerase inhibitors. J .Natl . Cancer Inst 8 1 : 1732-1735, 1989.
22. Zijlstra, J .G. , de Vries, E.G.E., and Mulder, N.H. Multifactorial drug resistance in an adriamycin-resistant human small cell lung carcinoma cell line. Cancer Res., 47: 1780-1784, 1987.
23. Hospers, G.A.P., Mulder, N.H., de Jong, B., de Ley, L., Uges, D.R.A., FichtingerSchepman, A.M.J ., Scheper, R.J ., and de Vries, E.G.E. Characterization of a human small cell lung carcinoma cell line with acquired cisplatin resistance in vitro. Cancer Res. , 48: 6803-6807, 1988.
24. De Jong, S. , Timmer-Bosscha, T., De Vries, E.G.E., and Mulder, N.H. Increased topoisomerase II activity in a cisplatin resistant cell line. Proc.AACR 3 1 : 1996, 1990.
25. Bradford, M.M. A rapid and sensitive method for the quantitation of microgram quantities of protein utilizing the principle of protein-dye binding. Anal.Biochem. , 72: 248-254, 1976.
26. Fry, D.W., Besserer, J .A., and Boritzki, T.J . Transport of the antitumor antibiotic CI-920 into L l 2 10 leukemia cells by the reduced folate carrier system Cancer Res . , 44: 3366-3370, 1984.
27. Eder, J .P., Teicher, B.A., Holden, S.A., Cathcart, K.N.S . , and Schnipper, L.E. Novobiocin enhances alkylating agent cytotoxicity and DNA interstrand crosslinks in a murine model. J. Clin. Invest., 79: 1524-1528, 1987.
28. Eder, J.P., Teicher, B.A., Holden, S.A., Cathcart, K.N.S . , Schnipper, L.E., and Frei III, E. Effect of novobiocin on the antitumor activity and tumor cell and bone marrow survivals of three alkylating agents. Cancer Res., 49: 595-598, 1989.
29. Eder, J.P., Teicher, B.A., Holden, S.A., Senator, L., Cathcart, K.N.S., and Schnipper, L.E. Ability of four potential topoisomerase II inhibitors to enhance the cytotoxicity of cisdiamminedichloroplatinum (II) in Chinese hamster ovary cells and in an epipodophyllotoxinresistant subline. Cancer Chemother. Pharmacol ., 26: 423-428, 1990.
30. Eder, J.P., Wheeler, C.A., Teicher, B.A., and Schnipper, L.E. A Phase I clinical trial of novobiocin, a modulator of alkylating agent cytotoxicity. Cancer Res., 5 1 : 5 10-5 13, 1991 .
1 18

Chapter 8
DETECTION OF DNA CROSS-LINKS IN TUMOR
CELLS WITH THE ETHIDIUM BROMIDE
FLUORESCENCE ASSAY
S. de Jong, J .G.Zijlstra, H.Timmer-Bosscha, N.H.Mulder, E.G.E. de Vries.
Division of Medical Oncology, Department of Internal Medicine, University Hospital,
Groningen, The Netherlands.
SUMMARY
Until now the fluorescence assay with ethidium bromide was only used on pure DNA.
This assay depends on the difference in fluorescence between single and double-stranded
DNA. lnterstrand cross-links of DNA are measured by the return of fluorescence of douhle
stranded DNA after heat denaturation at pH 12. Under these conditions denatured DNA gives very low fluorescence. In this study this assay was applied to tumor cells. The mouse Ehrlich
Ascites tumor cell line (EAT) and a human small cell lung carcinoma line (GLC,,J were
incubated 4 hr, 3'11C, with the DNA cross-linking agent cisplatin (CDDP). The samples of
whole cells were thereafter resuspended in potassium phosphate buffer with 10 mM EDTA,
4 M NaCl, 0. 1 % Sarkosyl pH 7.2. for 16 hr, at 3'11C. Measurements were peifonned with
a spectrofluorometer with excitation wavelength 525 nm, emission wavelength 580 nm. There
was a linear relationship for CDDP concentrations 0-150 µM and the extent of DNA
interstrand cross-links in EAT (r = 0.958). In GLC4 there was a linear relationship at low
CDDP concentrations 0-50 µM (r = 0.968) while between 50-150 µM a plateau was
reached. RNase added to the lysate of whole cells had no influence on the extent of DNA
intersirand cross-links. This assay was compared with the alkaline elution assay. Results were
identical. The advamage of the ethidiwn bromide fluorescence assay however, is that it is faster and easier and no radioactive labeling of cells is needed which can be of value in slow
growing human tumor cells or cells in Go-
1 19

INTRODUCTION
A large number of cytostatic agents reacts with cellular DNA leading to inactivation
of DNA as a template for replication. An effective mode of interference with the
reproduction potential of tumor cells seems to be the formation of DNA interstrand
cross-links (Erickson et al. , 1978; Laurent et al. , 198 1 ; Zwelling et al . , 1981). Therefore
methods to detect and quantitate these changes have been extensively studied (Pera et al. ,
198 1 ; Roberts and Friedlos, 1981) .
The alkaline elution assay (AEA) and the DNA renaturation method analyze DNA
damage indirectly, while direct separation and visualization of interstrand cross-linked versus
not cross-linked DNA is performed with the alkaline sucrose sedimentation and with the
density labelled hybrid DNA method (Pera et al. , 198 1 ; Roberts and Friedlos, 1981).
LePecq and Paoletti showed that, after intercalating with double-stranded
polynucleotides, ethidium bromide (EB) has a 20 to 25 fold increased fluorescence (LePecq
and Paoletti, 1966). Furthermore they found that EB binds quantitatively to DNA and RNA
(LePecq and Paoletti, 1967), at pH 8.0. Thus, DNA and RNA contents of cells or tissues
could be determined (Beers and Wittliff, 1975). This method has been found to be sensitive,
as 0.01 µg/ml of DNA can still be detected (LePecq and Paoletti, 1966).
DNA denatured by heating and cooling no longer increases the fluorescence of EB
at alkaline pH (Morgan and Pulleyblank, 1974). The high specificity for double-stranded
DNA makes it possible to detect interstrand cross-links in DNA at alkaline pH (Lown and
Begleiter, 1976; Morgan and Pulleyblank, 1974). As DNA interstrand cross-links can serve
as a nucleation point for rapid renaturation (Lown and Begleiter, 1976) their presence leads
to a return of fluorescence enhancement. Until now the ethidium bromide fluorescence assay
(EFA) has only been applied to purified DNA (Brent, 1984; Lown and Begleiter, 1976;
Morgan and Pulleyblank, 1974). The addition of this assay as detection technique for damage
induced by cytostatic agents in cellular DNA could be of importance as no radioactive
labelling is needed for this assay.
In this report we describe the application of the ethidium fluorescence assay (EFA)
on tumor cells. Also its ability to detect DNA interstrand cross-links produced by CDDP in
a human and a murine cancer cell line is compared with that of the AEA assay.
MATERIAl.S AND METHODS
Chemicals. DNA from salmon sperm (type III) , DNase I (type I) from bovine
pancreas and N-sarcosylsarcosine sodium salt were purchased from Sigma. RNase from
bovine pancreas was obtained from Boehringer Mannheim. Ethidium bromide
(2, 7-diamino-9-phenylphenanthridine 10-ethyl bromide) from Serva, heparin (5000 IU/ml)
120

from Leo and CDDP from Bristol Myers SEA Madrid, Spain. Cell cultures and drug exposure. GLC4, a human small cell lung carcinoma cell
line, was derived from a pleural effusion in our laboratory and kept in culture for more than 2 years. It is a hyperploid cell line growing partly attached, partly floating with a doubling time of 26 hr. GLC4 and the mouse Ehrlich ascites tumor cell line (EAT) were maintained
in the exponential growth phase, in RPMI 1640 supplemented with 10% FCS at 37°C in a
humidified atmosphere with 5 % C02•
The cells were incubated with CDDP concentrations from 0 to 150 µM in RPMI 1640, 10% FCS for 4 hr at 37°C. After exposure to CDDP the cells were washed three times with ice-cold phosphate-buffered saline (PBS: 0. 15 M NaCl, 0. 71 mM KH2P04 and 4.28 mM K2HP04).
Ethidium bromide fluorescence assay. To 200 µl lysing solution containing 4 M
NaCl, 50 mM KH2P04, 10 mM EDTA and 0. 1 % (W/V) sarkosyl(pH 7 .2) , 40 µl of the
drug-exposed EAT (± 3x1<>5 cells) or GLC4 (± l x loS cells) was added. If necessary, the relative fluorescence of DNA in the lysate was determined by adding 20 µl RNase (2 mg/ml) . The relative fluorescence of RNA in the lysate was determined by adding 25 µl DNase (0.5 mg/ml) and 30 mM MgC12 to the lysing solution. Lysis was carried out for 16 hr at 37°C. After lysing 25 µl heparin (500 IU/ml) was added for 20 min at 37°C. Sodium dodecyl sulphate could not be used in this assay, as precipitation occurred otherwise. Thereafter, 3
ml of a ethidium bromide solution containing EB (10 µg/ml), 20 mM K2HP04 and 0.4 mM
EDTA (pH 12.0) was carefully added to the lysates (Brent, 1984; Lown and Begleiter, 1976; Morgan and Pulleyblank, 1974). DNA and RNA were then denatured by heating at lOO°C for 5 min and rapidly cooled to room temperature. The samples were kept in the dark and measured immediately, because ethidium itself will cleave DNA slowly, in the presence of light and oxygen (Lown and Begleiter, 1976) .
The percentage cross-linked DNA was determined by measuring the difference in fluorescence of denatured control cell lysate and the denatured drug treated sample using the
formula:
ft - fn
x 100 % 1 - fn
where C1 = the percentage interstrand cross-linked DNA in treated cells; ft = the
fluorescence fraction after heat-denaturation in treated cells; fn = the fluorescence fraction after heat denaturation in untreated cells, the fractions (ft and fn) are calculated as the ratio: fluorescence after heat denaturation I fluorescence without heat denaturation.
Pure DNA (salmon sperm) was treated the same way as the lysates. Fluorescence was
measured in 1 cm2 cuvettes at room temperature in a Kontron Spectrofluorometer SFM 23/B.
121

The excitation wavelength was 525 nm, the emission wavelength 580 nm . Alkaline Elution Assay. The procedure was essentially the same as extensively
described earlier (Kohn et al. , 1981) . Routinely the procedure minimizing DNA-protein cross-links was used. Instead of an internal standard an external standard was used. As external standard an untreated and a 1250 Rad X-irradiated standard (Philips, Eindhoven, 1 .5 mA 200 kV, 0.5 mm Cu/Al filter 920 Rad/min) was assayed. Each sample was assayed in duplicate.
After incubation, cells were cooled to 0°C and layered on a mixed cellulose ester filter (Millipore SSWP 02500 pore size 3.0 µm) and washed twice with 10 ml ice cold PBS. Cells were lysed on the filter using 3 ml 0.02 M Na 2 D EDTA, pH 9.7 with 2 % SDS, 0.5 mg/ml proteinase K for 15 min (Sigma, cat. no. P0390) . Washing and lysing solutions were allowed to flow through gravity. Elution buffer 0.02 M Na2 EDTA, pH 12.4 0. 1 % SDS was pumped with a flow rate of 0.05 ml/min. Seven 2.5 ml fractions were collected. The fractions and pump dried filters were dissolved in Picofluor 30 and radioactivity was counted. Radioactivity remaining on the filter after each fraction was plotted on a logarithmic scale against the elution volume.
Cross-links were calculated as reduction of elution speed after 12 ml elution volume of a 1250 Rad treated sample expressed as Rad equivalent (Kohn et al. , 1981) .
RFSULTS
Comparison of the emission and excitation spectra of the fluorescence complexes.
The emission spectra of pure DNA and of the lysates of GLC4 and EAT are almost equal. Optimal fluorescence of the DNA (or RNA) EB complexes is found at 580 nm with or without correction for the fluorescence of the EB solution. The EB solution has a slightly different emission optimum at 585 nm (results not shown).
The excitation spectra of pure DNA and the lysates have small differences between 275 and 325 nm, but in the area around 520 nm, where measurements must be done according to LePecq and Paoletti (1967), excitation spectra are equal with an excitation optimum at 525 nm with correction for the fluorescence of the EB solution. The EB solution has a different excitation spectrum with an optimum at 475 nm (results not shown).
Further measurements were done with excitation wavelength at 525 nm and emission wavelength at 580 nm.
Effect of increasing the EB concentration on the fluorescence complexes. When the EB concentration is raised from 10 to 50 µg/ml this does not effect the emission spectra and optimum. The excitation spectra however, changed slightly and the excitation optimum, after correction for the fluorescence of the EB solution is shifted with increasing
122

concentrations from 525 nm to 530 nm (results not shown).
Comparison of the relative fluorescence of untreated and RNase treated
denatured pure DNA, GLC4 and EAT cell lysates. Lysate plus and minus denaturation
and RNase treated lysates showed the same excitation optimum at 525 nm and emission
optimum at 580 nm. The relative fluorescence of denatured samples was decreased
dramatically. Treatment with RNase gave an overall decrease of fluorescence. In the
denatured lysate of GLC4 a peak was seen at 290 nm and in its native lysate an increased
relative fluorescence was found at the same wavelength. For lysates of EAT the results were
identical (results not shown) .
The effect of increasing pH on the fluorescence of denatured pure DNA and
denatured GLC4 and EAT cell lysates. By raising the pH of the EB solution from 1 1 .6
to 12.0, the fluorescence of denatured pure DNA and denatured GLC4 and EAT cell lysates,
expressed as the percentage fluorescence of the same native sample, decreased (results not
shown).
e.: 100 c: QI u "' QI L. 0 -= .....
60
40
20
0 -f"":.._�.,.....-�---.��--r��--.-����� 0 5 10 15 20 25 30
)Jg DNA / assay
123
Figure 1. Standard curve for pure DNA fluorescence in the EB solution (with pH 12). DNA was denatured by heating to 1 OO"C for 5 min, followed by rapid cooling. Fluorescence of30 µg native DNA was arbitrarily set on 100. (•) native DNA, (o) denatured DNA.

l!l 100 c: cu u "' cu ..... 0 ::I ;:
60
40
20
0 10 20 3.0 4.0 5.0 6.0 10 number of cells (x105 )
Figure 2. Standard curves for the relative fluorescence of different numbers of EAT and GLC4 cells. Relative fluorescence was set on 100 with 30 µglml . (-... -) native EAT, (--ll--) RNAse treated EAT, (--ti--) DNAse treated EAT, f ... ) native GLC4,
f-o-) RNAse treated GLC4,
to7 DNAse treated GLC4.
Standard measurements of fluorescence of pure DNA and of DNA and RNA in
GLC4 and EAT cell lines. The standard curve for native and denatured pure DNA showed
a linear relationship between the relative fluorescence and increasing DNA concentration until 20 µg DNA (fig. 1). Increasing numbers of GLC4 and EAT cells gave a linear relationship
with the increasing fluorescence in both native, DNase treated and RNase treated cell lysates (fig. 2). The fluorescence of native GLC4 cell lysates was 2.5 fold higher than the fluorescence of native EAT cells using the same number of cells. The sum of the
fluorescence of DNase and RNase treated cell lysates of GLC4 or EAT gave almost the same fluorescence as the native cell lysates of the same cell numbers. Therefore, using RNase or
DNase is sufficient for observing DNA or RNA respectively, in the cell lysates. With a cell
number over 106 the lysing solution may be too viscous to get a proper mixing with the EB
solution.
Detection of DNA interstrand cross-links in native and RNase treated cells of GLC4 and EAT. CDDP formed DNA interstrand cross-links in native and RNase treated cell lysates of both cell lines. Adding RNase had little effect on the percentage cross-links
124

in cells of GLC4 (fig. 3). This could mean that the percentage cross-linked RNA was almost
the same as the percentage cross-linked DNA. There was a linear relationship between the
percentage cross-linked DNA and CDDP concentrations from 0 to 50 µM (r = 0.968). From
50 to 150 µM CDDP a plateau was reached in both native and RNase treated cells of GLC4• In cells of EAT the percentage of DNA interstrand cross-links was not the same for
native and RNase treated cell Iysates (fig. 3). Adding RNase raised the percentage of
cross-Jinks. There was a linear relationship between the percentage cross-Jinked DNA and
the CDDP concentration from 0 to 150 µM in both native (r = 0.958) and RNase treated cell
lysates of EAT. At high CDDP concentration (150 µM) the percentage cross-links was
almost the same in cell lysates of GLC4 and EAT (fig. 3).
Detection of interstrand cross-links in cells of GLC4 and EAT by AEA. The AEA
also showed a linear relationship between Radequivalents, which is correlated with the
number of cross-links in DNA at low CDDP concentrations from 0 to 50 µM in GLC4 cells
and a plateau at higher CDDP concentrations from 50 to 150 µM (fig. 4). In EAT cells there
was a linear relationship between Radequivalents and CDDP concentrations from 0 to 150
µM. At high CDDP concentrations (150 µM) the amount of Radequivalents in EAT cells was
'ii. 4 0 <( z 0 "CJ w -"' c 30
I VI VI
f: LJ
20
10
0 25 50 100 150 concentration of c DDP (uM)
Figure 3. Relation between concentration of COOP and the percentage cross-l inked DNA of EAT
and GLC4 , measured by ethidium fluorescence assay. �) EAT, (-ll-) RNAse treated EAT, f--) GLC4, (-o-) RNAse treated GLC4.
125

..... c QJ c � :::> CT QJ
"'O 0 er
1 2 50
� 000
750
500
2 50
0 25 50 100 150 concentration cDDP (uMJ
Figure 4. Relation between Radequivalents, which is correlated with the number of cross-links in DNA, and concentration of CDDP in (•) EAT cells and (•) GLC4 cells measured with the alkaline elution assay.
half of those in GLC4 cells. In both assays (EFA and AEA) detection of cross-links is still possible at a CDDP concentration of 10 µM. Both assays have a comparable sensitivity.
The effect of single-strand breaks on EB fluorescence. Irradiation of GLC4 cells
with 250-2000 Radequivalents after 4 hr incubation with 140 uM CDDP gave from 250-750
Radequivalents no difference compared to an unirradiated control. From 1 000-2000
Radequivalents the fluorescence decreased with 25 % (results not shown).
DISCUSSION
In this study the possibility to detect DNA interstrand cross-links in whole cells with the EFA was evaluated. The results were comparable with the results for pure DNA with the
same assay if certain conditions were taken into account (Brent, 1984; Lown and Begleiter, 1976; Morgan and Pulleyblank, 1974). Firstly, a cell lysing solution with a high salt
concentration is used to dissociate and denature proteins (apart from DNase and RNase)
bound to DNA and RNA (LePecq and Paoletti, 1966), and to get the optimal binding of
ethidium bromide to the intercalated site that is specific for double-stranded polynucleotides
126

(LePecq and Paoletti , 1966; LePecq and Paoletti, 1967). To the lysing solution EDTA is
added to prevent DNase activity (Beers and Wittliff, 1975). After cell lysis, heparin is added to displace DNA from nuclear proteins and to form complexes with these nuclear proteins (Karsten and Wollenberger, 1977) .
The excitation and emission spectra are almost the same for pure DNA and GLC4-
and EAT cells. The difference at 290 nm excitation occurring in the native and denatured cell
lysates of GLC4 disappeared with RNase treatment. This suggests that the higher
fluorescence in the cell lysates is due to RNA which has a higher fluorescence enhancement than DNA at this excitation wavelength.
The EB concentration used was 10 µg/ml as recommended by LePecq and Paoletti
( 1966). A higher EB concentration resulted in changed excitation spectra most probably due
to binding to other polynucleotides in the double-stranded configuration and at the same time
rise in free EB (Morgan and Paetkau, 1972) .
The assay has to be performed at alkaline pH to obtain EB fluorescence (Morgan and
Pulleyblank, 1974). The tests are performed with a pH 12.0 of the EB solution. By raising
the pH of this solution from 1 1 .6 to 12.0 the fluorescence of all denatured samples decreases most probably as a result of the disappearance of short intrastrand duplex structures (Morgan and Paetkau, 1972). Further increase of the pH, however, could denature double-stranded
polynucleotides and it could decrease the fluorescence of the native cell lysates more than the fluorescence of the denatured cell lysates (Morgan and Pulleyblank, 1974). The standard
curve for pure DNA shows a linear relationship for denatured DNA at low DNA
concentrations (fig. 1). Therefore the cell number used per assay was kept rather low, this
also avoids clump formation in the lysing period.
For estimation of the percentage of interstrand cross-linked DNA, the cell lysates
were treated with RNase to avoid errors due to RNA. In both cell lines tested CDDP gave cross-links. The amount of cross-links in GLC4 was higher than in EAT at clinical relevant
CDDP concentrations (0-50 µM), but in GLC4 a plateau is reached at CDDP concentrations
of 50-150 µM. The amount of interstrand cross-links measured was not influenced by RNase
treatment.
The same results with the alkaline elution technique are found for both cell lines after
CDDP treatment. The results of EFA and AEA are not quantitatively comparable as the
assays depend on different methods. The advantage of the EF A over the AEA is that the
assay is easier, faster and that no radioactive labelling or irradiation is necessary to detect
DNA interstrand cross-links. In case of concomitant single-strand breaks and cross-links it can be difficult to detect DNA interstrand cross-Jinks correctly with the AEA. The EFA can
avoid this problem as only cross-links can be detected with this assay. Induction of single strand breaks with 250-750 Radequivalents had no influence on the amount of cross-links
detected and over 1000 Radequivalents resulted in a 25 % decrease. The fact that no
radioactive labelling is needed makes the test clinically relevant as it is applicable to slow
127
growing human tumor cells and cells in G0•
REFERENCES
Beers, P.C., Wittliff, J.L., Measurement of DNA and RNA in mammary gland homogenates by the ethidium bromide technique. Anal.Biochem., 63, 433-441 , 1975.
Brent, T.P., Suppression of cross-link formation in chloorethylnitrosourea-treated DNA by activity in extracts of human leukemic lymphoblasts. Cancer Res., 44, 1 887-1892, 1984.
Erickson, L.C., Zwelling, L.A., Ducore, J.M., Sharkey, N.A., Kohn, K.W., Differential cytotoxicity and DNA cross-linking in normal and transformed human fibroblasts treated with cis-diamminedichloroplatinum (II). Cancer Res., 4 1 , 2791 -2794, 1978.
Karsten, U., Wollenberger, A., Improvements in the ethidium bromide method for direct fluorometric estimation of DNA and RNA in cell and tissue homogenates. Anal .Biochem., 77, 464-470, 1977.
Kohn, K.W., Ewig, R.A.G., Erickson, L.C., Zwelling, L.A., Measurement of strand breaks and crosslinks by alkaline elution. In: Friedberg, E.C. , Hanawalt, P.C. (eds}, A laboratory manuel of research prC'cedures. Vol. 1, Part B, pp 379-401 , Marcel Dekker, Inc., New York, 198 1 .
Laurent, G. , Erickson, L.C., Sharkey, N.A., Kohn, K.W., DNA cross-linking and cytotoxicity induced by cis-diamminedichloro platinum (II} in human normal and tumor cell lines. Cancer Res., 41, 3347-335 1 , 198 1 .
Lown, J.W., Begleiter, A., Johnson, D . , Morgan, A.R., Studies related to antitumor antibiotics. Part V. Reactions of mitomycin C with DNA examined by ethidium fluorescence assay. Can.J.Biochem., 53, 1 10-1 19, 1976.
LePecq, J .B. , Paoletti, C., A new fluorometric method for RNA and DNA determination. Anal .Biochem. , 17, 100-107, 1966.
LePecq, J.B., Paoletti, C. , A fluorescent complex between ethidium bromide and nucleic acids. J .Mol.Biol . , 27, 87-106, 1967.
Morgan, A.R., Paetkau, V., A fluorescence assay for DNA with covalty linked complementary sequences. Can.J.Biochem., 50, 210-217, 1972.
Morgan, A.R., Pulleyblank, D.E., Native and denatured DNA, cross-linked and palindromic DNA and circular covalently-closed DNA analysed by a sensitive fluorometric procedure. Biochem.Biophys.Res.Commun., 6 1 , 396-403, 1974.
Pera, M.F., Rawlings, C.J., Shackleton, J . , Roberts, I.I., Quantitative aspects of the formation and loss of DNA interstrand crosslinks in Chinese hamster cells following treatment with cis-diamminedichloroplatinum (II) (cisplatin). Comparison of results from alkaline elution, DNA renaturation and DNA sedimentation studies. Biochim.Biophys.Acta, 655, 152-166, 198 1 .
128
Roberts, J .J . , Friedlos, F., Quantitative aspects of the formation and loss of RNA interstrand crossl inks in Chinese hamster cells following treatment with cis-diamminedichloro platinum (II) (cisplatin). I . Proportion of DNA-Platinum reactions involved in DNA crosslinking. Biochim.Biophys.Acta, 655, 146-15 1 , 198 1 .
Zwelling, L.A., Michaels, S . , Schwartz, H. , Dobson, P.O., Kohn, K.W., DNA cross-linking as an indicator of sensitivity and resistance of mouse L 1210 leukemia to cis-diamminedichloro platinum (II) and L-phenylalamine mustard. Cancer Res., 4 1 , 640-649, 198 1 .
129

130

Chapter 9
EFFECT OF NOVOBIOCIN ON CDDP
CYTOTOXICITY AND FORMATION OF DNA
INTERSTRAND CROSS-LINKS AND THE ROLE OF
TOPOISOMERASE II AND NUCLEAR MATRIX
PROTEINS IN A CDDP-RESISTANT SMALL CELL
LUNG CARCINOMA CELL LINE
Steven de Jong, Hetty Timmer-Bosscha. Elisabeth G.E. de Vries, and Nanno H. Mulder.
Division of Medical Oncology, Department of Internal Medicine, University Hospital,
Groningen, The Netherlands.
SUMMARY
Studies were performed to determine whether novobiocin can be used to reverse
cisplatin (CDDP) resistance. Continuous incubation with JOO µM novobiocin enhanced the
cytotoxicity of a 2 h CDDP treatment I. 9-fold in a human small cell lung carcinoma cell line
GLC4, but had no effect on the CDDP cytotoxicity in the CDDP resistant subline GLC/CDDP. Incubation with 200 µM novobiocinfor 5 h enhanced the CDDP cytotoxicity
in GLC4 and GLC/CDDP 4. 1 and 2. 8-fold, respectively. Novobiocin heightened the
formation of DNA interstrand cross-links (/SC) 2. 7-fold in GLC4 and 1.4-fold in GLC/CDDP. Differences in efficacy of novobiocin, an inhibitor of DNA topoisomerase (I'opo) 11 catalytic activity, may be due to a changed Topo 11. GLC/CDDP showed cross
resistance to nitrogen-mustard (2. 7-fold), mitomycin C (5. 0-fold), novobiocin (1.3/old) and
camptothecin (5.0-fold) but an increased sensitivity was observed for VP-16 (0. 7fold). Topo
I activities were similar in nuclear extracts (0.35 M NaCl) of GLC4 and GLC/CDDP,
whereas Topo 11 activities were 1 .3-fold increased in extracts from GLC4!CDDP. Western blotting showed no changes in Topo I or Topo 11 amount in nuclei or nuclear extracts
between both cell lines. Chromatin in nuclei of GLC/CDDP was more sensitive to
micrococcal nuclease digestion compared to GLC4. In addition, gel electrophoresis of
proteins revealed that the amount of a 56 kD protein was 2-fold increased in nuclei and
nuclear matrices from GLC/CDDP. The reduced efficacy of novobiocin to increase the
1 3 1

CDDP cytotoxicity as well as the DNA /SC in GLC/CDDP compared to GLC4 may be due
to the increased Topo II activity in these cells. The increase m Topo II activity, in amount
of a 56 kD nuclear matrix protein and in sensitivity to chromatin digestion in GLC/CDDP suggest a role of the nuclear matrix at the level of adduct formation.
INTRODUCTION
CDDP is an effective chemotherapeutic agent for the treatment of a variety of human cancers. However, the development of CDDP resistance is a major cause of treatment failure. Mechanisms of resistance to CDDP have been studied in several cell lines with invitro acquired CDDP resistance. These mechanisms are reduced drug accumulation, enhanced drug inactivation, decreased formation and/or repair of DNA interstrand and intrastrand cross-links and changed folate metabolism ( 1 ,2).
Novobiocin may be used to reverse CDDP resistance. A number of studies showed, that novobiocin has a synergistic effect on the cytotoxicity of CDDP (3 ,4,5). This enhanced cytotoxicity correlates with an increased formation of DNA ISC by CDDP (3). Ciprofloxacin has a similar effect as novobiocin (5). Novobiocin as well as ciprofloxacin are inhibitors of the Topo II catalytic activity (5,6). In combination with alkylating agents such as nitrogen mustard (NHz), novobiocin also has a synergistic effect on the cytotoxicity of these drugs (3,4,6). This synergistic effect was observed in a NH2 sensitive as well as a resistant human Burkitt's lymphoma cell line (6) . m-AMSA and etoposide VP- 16) , drugs that stimulate the formation of the Topo II-DNA (cleavable) complex, have an additive (5 ,7) or a slightly antagonistic (8) effect on the cytotoxicity of CDDP. Camptothecin and .B-lapachone, drugs that stimulate the formation of the Topo I-DNA complex , have an additive cytotoxic effect with CDDP (8). However, the role of topoisomerases in DNA repair is still unknown.
Topo I and II are enzymes that regulate the topological configuration of DNA (9, 10) .
Topo I is an ATP-independent enzyme inducing single-strand DNA breakage and probably participates in replication and transcription (9, 10). Topo II is an ATP-dependent enzyme and is probably involved in the segregation of DNA following the conclusion of replication and is essential for mitosis (1 1 - 13). Topo II is a structural protein of the mitotic chromosome scaffold and is also a component of the interphase nuclear matrix , located at the base of a DNA loop during DNA synthesis ( 1 4) .
Recently, a CDDP resistant small cell lung carcinoma cell line (GLC4/CDDP) has been established. The amount of Pt bound to DNA and the number of DNA intrastrand crosslinks is reduced in GLC4/CDDP, while no changes in CDDP accumulation are found compared to the parental cell line GLC4 ( 15- 1 7) . In the present study, we have investigated whether novobiocin can be used to reverse CDDP resistance. DNA ISC formation in time is determined in the presence of novobiocin . Furthermore, Topo I and II amount and activity,
132

nuclease sensitivity of chromatin and protein composition of the nuclear matrix are studied
in both cell lines.
MATERIAL.5 AND METHODS
DNA and Chemicals. Form I kinetoplast DNA (kDNA) was isolated as described
previously ( 18) from the mitochondria of Crithidia fasciculata and supercoiled dimer of plasmid pBR322 DNA, prepared from Escherichia coli strain HB 101 , was a generous gift
from Dr. Douwe van Sinderen, Department of Molecular Genetics, State University of Groningen.
RPMI 1640 medium was obtained from Gibco (Paisley , Scotland) and fetal calf serum (FCS) from Sanbio (Uden, the Netherlands). CDDP was purchased from Bristol Myers SAE
(Madrid, Spain), and camptothecin, novobiocin, DNase I, RNase, 3-(4,5-dimethylthiazol-2-
yl) 2 ,5-diphenyltetrazolium bromide (MTI) from Sigma (St.Louis, Mo). Mitomycin C was
obtained from Christiaen (Etten-leur, the Netherlands) and NH2 from Boots (Hilversum, the Netherlands).
Cell Lines and Drug Sensitivity Assay. GLC4 and GLC4/CDDP, a CDDP resistant
subline were cultured in RPMI 1640 medium supplemented with 10% FCS at 37°C in a
humid atmosphere with 5 % C02• To maintain resistance, GLC4/CDDP cells were exposed
to 75 µg/ml CDDP for 1 h at intervals of 2 months.
Drug sensitivity testing was performed by the microculture tetrazolium assay (MT A)
with slight modifications as described previously ( 19). The linear relationship of cell number to MTT formazan crystal formation and the exponential growth of cells in the wells were checked. For GLC4 5000 cells per well and for GLC4'CDDP 15000 cells per well were
incubated in a total volume of 0. 1 ml culture medium in 96-well culture plates. When drug
incubations were performed for a short period as indicated, cells were washed three times
and then cultured for 4 days. Each drug concentration was tested in quadruplicate.
DNA ISC. Cells were exposed to novobiocin for 5 h prior to and during a 2 h
CDDP treatment at 37°C. Cells were washed 3 times with drug-free medium and incubated
in this medium for various time periods at 37°C. Then, cells were washed two times with
PBS at 0°C and the pellets were resuspended and divided into two parts. The frequency of DNA ISC formed was measured with the ethidium bromide fluorescence assay as described
by de Jong et al (20) . Briefly, after lysate for 15 h and the addition of the ethidium bromide
(10 µg/ml), in one part of each sample the DNA was denatured by boiling and rapidly
cooling down again, the other part was kept at room temperature. The fluorescence of both parts was measured immediately in a Kontron spectrofluorometer (excitation 525 nm,
emission 580 nm). The percentage double stranded DNA (%), proportional to the number
of ISC DNA induced, was calculated as previously described (20) .
1 33

Preparation of Nuclear Enzyme Extracts. Nuclei were isolated form log-phase cells
(3-8x1<>5 cells/ml) as described previously ( 18). The nuclei pellet was resuspended in nucleus buffer (150 mM NaCl, 1 mM KH2P04, 5 mM MgC12, 1 mM EGTA, 1 .0 mM dithiotreitol
and 1 mM PMSF), pH 6.4, at 4°C and an equal volume of nucleus buffer containing 0.55 M NaCl was added (final [NaCl] = 0.35 M). Nuclear protein was extracted from the nuclei for 30 min at 4°C and then the mixture was centrifuged at 16,000 g for 20 min at 4°C. Protein concentrations were determined by the method of Bradford (21). The enzyme solution
was diluted with an equal volume of 87% glycerol and stored at -2D°C until assayed. Topo I and II Catalytic Activity Assays. Topo I activity in nuclear extracts was
assayed by relaxation of supercoiled pBR322 DNA (22) . The standard reaction mixture used for the Topo I activity assays was 50 mM Tris-HCl (pH 7.5), 85 mM KCl, 10 mM MgCl2, 0.5 mM dithiothreitol, 0.5 mM EDTA and bovine serum albumin (0.03 mg/ml). Relaxation was carried out as we have described previously ( 18). Topo II catalytic activity in nuclear
extracts was assayed using the decatenation assay (23-25). The standard reaction mixture for
the decatenation assay was the same as described for the Topo I assays except that 1 mM
ATP was added (18) . Agarose gels were photographed under UV-transillumination with Polaroid type 665
positive/negative film and the photographic negatives were scanned with an LKB Ultroscan
laser densitometer and analyzed with the LKB GelScan software program. Microgram extract protein of GLC4 needed to release 50 % of the minicircles was set at 100 % .
Flow Cytometry. DNA histograms were generated from ethanol fixed (70%) RNase
treated (40 µg/ml) cells on a Becton Dickinson FACS 440 using propidium iodide (40 µglml) and analyzed by using the DNA cell-cycle analysis program (Ver.C 12/86).
SDS-Polyacrylamide Gel Electrophoresis and Western Blotting. SDSpolyacrylamide gel electrophoresis was performed according to the procedure of Laemmli (26). Proteins were stained with 0. 1 % Coomassie brilliant blue R250 in 45 % (v/v) methanol
and 10% acetic acid. To perform Western blotting proteins were transferred from acrylamide
gel onto nitrocellulose paper at 125 mA for 4 h at 4°C by using a dry-blot system (Ancos, Denmark) . Topo II was detected using a polyclonal rabbit antiserum against human Topo II,
which was kindly provided by Dr. Leroy Liu , Johns Hopkins University. Topo I was detected using a systemic sclerosis patient's serum (27,28), which was kindly provided by Dr. Piel C. Limburg, University Hospital, Groningen . The Bio-Rad Immun-blot assay kit
(Bio-Rad, Richmond, CA) which uses goat anti-rabbit and goat anti-human alkaline
phosphatase conjugates was used to detect Topo I and Topo II in the Western blots.
Chromatin Digestion. Nuclei were isolated as described above. Chromatin digestion
was performed according to Wierowski et al. (29) with some modifications and DNA fluorescence was determined as described by Bimboim et al (30) . The nuclei pellet was washed once with digestion buffer (IO mM NaCl, 10 mM Tris-HCI, 3mM MgC12, 0.2 mM CaC12) , pH 7.4 and the pellet was resuspended in digestion buffer at 4°C. The DNA
134

concentration in the nuclei suspension was determined after lysis of chromatin in lysis buffer (9 M ureum, 10 mM NaOH, 2.5 mM cyclohexanediaminetetracetate and 0. 1 % SOS) as described below and the nuclei suspension was adjusted to 50 µg DNA/ml with digestion
buffer. The nuclei suspension and the enzyme stock solution were prewarmed to 37°C for
4-5 min before adding the enzyme solution. Samples of 0.2 ml each were removed at various times during incubation at 37°C and 0.2 ml of ice-cold 30 mM Na2EDTA was added to stop
the chromatin digestion. Then 0.2 ml of lysis buffer was added and incubation was allowed to proceed for 10 min. After 0.4 ml of 1 M glucose and 14 mM mercaptoethanol was added,
lysates were mixed till a homogeneous solution was obtained. To these lysates 1 .5 ml of a solution of ethidium bromide (6. 7 µg/ml) was added. Fluorescence was measured with
excitation at 520 nm and emission at 580 nm. Isolation of Nuclear Matrices. Nuclei were isolated as described above. Nuclear
matrices were isolated according to the method of Fernandes et al. (3 1). Purified nuclei were
resuspended in l ml of low salt buffer at 4°C (10 mM Tris-HCl (pH 7), 1 mM MgCl2, 10
mM NaCl and l mM PMSF). One ml of high salt buffer (low salt buffer with 3 M NaCl)
was added over a period of 1 h to yield a final concentration of 1 .5 M NaCL After an additional 30 min on ice, the samples were then kept at 37°C and the DNA was digested with
100 units DNase. Samples were centrifuged and the pellets washed once with 1 ml high salt buffer ( 1 .5 M NaCl), once with l ml low salt buffer containing 1 % Triton X-100 and then immediately resuspended and washed with 1 ml of low salt buffer.
Statistics. All results were expressed as means ± SD. Statistical significance was
determined by use of the Student's t-test.
RESULTS
Effect of Novobiocin on CDDP Cytotoxicity. The sensitivities of GLC4 and GLC4/CDDP to CDDP in combination with non-cytotoxic concentrations of novobiocin were determined with the MT A and the ID50 values were shown in table 1. GLC4 was more sensitive to continuous incubation with novobiocin than GLC4/CDDP (table 2). In the
combination experiments, low novobiocin concentrations resulting in less then 10 % growth
inhibition were used, namely 100 µM for GLC4 and 100 or 150 µM for GLC4/CDDP. The
continuous presence of 100 µM novobiocin in the culture media of the MT A for an additional
4 days increased the cytotoxicity of CDDP 1 .9-fold in GLC4 (table 1 and fig. IA), while no effect of this novobiocin concentration or a novobiocin concentration of 150 µM on the CDDP cytotoxicity was detected in GLC4/CDDP (table 1 and fig. lB).
To determine whether higher novobiocin concentrations would have a stronger effect
on the CDDP cytotoxicity and whether novobiocin had to be present after the incubation with
CDDP, we changed the novobiocin incubation time. Cells were exposed to novobiocin for
135

Table 1. Effect or novobiocin scheduling on the m50 or CDDP.
Drug GLC4 GLC4/CDDP IDso (µM)
CDDP (2 h) 4.5 ± 1 .4 33.6 ± 6.0 + 100 µM novobiocin (continuous) 2.3 ± o.5b 34.8 ± 17.3
COOP (2 h) 5.8 ± 0.4 40.6 ± 4.9 + 200 µM novobiocin (5 h) 1 .4 ± O. lb 14.3 ± 4.8b
a 50% inhibiting dose in the microculture tetrazolium assay. Values are the mean ± SD of three experiments, each performed in quadruplicate.
b p < 0.05, COOP treatment versus COOP treatment with novobiocin.
1 00
� 80
co 60 > > .... :J Cf) 40
20
0
A
""' �"I l
0
\l"-o r l\I T !\, j''o�
!"T l !-......., T i
2 4 6 8 1 0
CDDP (µ.M)
B
\ Tr T ti--�J • l
0 20 40 60 80 100
CDDP (µ.M)
Figure 1. Effect of the continuous presence of fixed concentrations of novobiocin on the cytotoxicity
of COOP. GLC4 (A) was preincubated with 100 µM novobiocin and GLC4/CDDP (8) with 150 µM novobiocin for 3 h and concurrent with CDDP for 2 h. Novobiocin remained present in the culture media after CDDP was washed out. A) CDDP only (o); CDDP with novobiocin (•); B) CDDP only (A); CDDP with novobiocin (.-.). Values are the mean ± SD of three experiments, each performed in quadruplicate.
136

IU > > 5 (/)
1 00
80
60
40
20
A B
200 400 600 800 1000 0 200 400 600 800 1 000 novob1oc1n (µ.M) novob1oc1n (µ.M)
Figure 2. Effect of a 5 h incubation with various concentrations of novobiocin on the cytotoxicity of CDDP in GLC4 (A) and GLC4/CDDP (B). Cells were preincubated for with novobiocin for 3 h and concurrent with a fixed CDDP concentration, 2.5 JLM for GLC4 and 10 JLM for GLC4/CDDP for 2 h. A) novobiocin only (o); CDDP with novobiocin (•); B) novobiocin only (t.); CDDP with novobiocin (.o.). Values are the mean ± SD of three experiments, each performed in quadruplicate.
3 h prior to and during a 2 h CDDP treatment and then the two drugs were washed out. Both cell lines were similarly sensitive to a 5 h incubation with novobiocin (table 2 and fig.2A and
B). Variable novobiocin concentrations were used in combination with a fixed CDDP
concentration, 2.5 µM for GLC4 and 10 µM for GLC4/CDDP (fig.2A and B). These CDDP concentrations resulted in a 10-20 % growth inhibition in each cell line. A novobiocin
concentration of 200 µM showed an optimal increase of the CDDP cytotoxicity in GLC4 (fig.2A), while 300 µM novobiocin had an optimal effect in GLC4/CDDP (fig.2B). A fixed novobiocin concentration of 200 µM enhanced the CDDP cytotoxicity 4.2 fold in GLC4 and 2.9 fold in GLC4/CDDP (table 1 and fig.3A and B).
Effect of Novobiocin on DNA ISC. The kinetics of DNA ISC after CDDP treatment
with or without 200 µM novobiocin were studied in GLC4/CDDP and GLC4 cells. DNA ISC were measured with the ethidium bromide fluorescence assay (20) . The cell viability of both cell lines was unchanged 24 h after incubation with novobiocin and CDDP as determined
with trypan blue exclusion (results not shown) . In GLC4 cells DNA ISC did not change in
time after CDDP removal (fig.4A), whereas DNA ISC increased in time when cells had been
incubated with CDDP and novobiocin (fig.4B). DNA ISC in GLC4 cells were not
137

1 00
� 80
Iii 60 > ·::;: � (/) 40
20
0
A
-o -'-.... �T
\ � 1"'-r J 0 • l
\'- � !..._I --· -·-·
0 2 4 6 8 10
CDDP (µ,M)
B
0 20 40 60 80 100
CDDP (µ,M) Figure 3. Effect of a 5 h incubation with 200 µM novobiocin on the cytotoxicity of CDDP in GLC4 (A) and GLC4/CDDP (B). Cells were preincubated with novobiocin for 3 h and concurrent with variable concentrations of CDDP for 2 h. A) CDDP only (o); CDDP with novobiocin (•); B) CDDP only (ti); CDDP with novobiocin (•). Values are the mean ± SD of three experiments, each performed in quadrupl:cate.
significantly increased at t=O h but significantly increased at all CDDP concentrations at t=4 h ( 1 .6-fold) and 24 h (2.65-fold) after treatment with CDDP and novobiocin compared to CDDP treatment without novobiocin (fig.4A and B). In GLC4/CDDP cells DNA ISC
changed in time only at the highest CDDP concentration used after CDDP removal (fig.4C)
and changed in time at all CDDP concentrations used when cells were treated with CDDP
and novobiocin (fig.4D). DNA ISC in GLC4/CDDP cells were not significantly increased at t=O h but significantly increased at higher CDDP concentrations at t =4 ( 1 .35-fold) and 24 h ( 1 .44-fold) after treatment with CDDP and novobiocin compared to treatment with CDDP only (fig.4C and D). No significant differences in DNA ISC formation after CDDP treatment was observed between GLC4 (fig.4A) and GLC4/CDDP (fig.4C). In conclusion, DNA ISC formation was stronger enhanced by novobiocin in GLC4 than in GLC4/CDDP
which may be due to different Topo II activity in these cell lines.
Cross-resistance Properties of GLC4/CDDP cells. The sensitivity of GLC4 and
GLC4/CDDP cells to several drugs whose cytotoxic activities can be related to Topo I or
Topo II levels, was determined with the MTA and the rn50 values were shown in table 2.
GLC4/CDDP cells were cross-resistant to mitomycin C (5-fold) , nitrogen-mustard (2.7-fold),
138

40
� 30 0 "O Q) � 20 � u; I Q) 10 :g 0 "O
40
� 30 0 "O � 20 � u; I Q) :g 10
.g
A
1 6.7
c
1 6.7
33 67 COOP (µ.M)
67 100 COOP (µ.M)
1 T
1 00
200
C:J t=O C:J t=4
B
1 6.7
D
1 6.7
1.2
1.2 1.2
33 67 COOP (µ.M)
1,2
67 1 00 COOP (µ.M)
c=i t=24
1.2
2
100
1.2
200
Figure 4. DNA ISC in GLC4 (A,B) and GLC4/CDDP (C,D) as a function of time after CDDP
incubation with or without 200 µ.M novobiocin. Cells were incubated with CDDP for 2 h (A,C) or were preincubated with novobiocin for 3 h and concurrent with variable concentrations of CDDP for 2 h (B,D) and the DNA ISC were measured at t=O, 4 and 24 h after drugs were removed. Values are the mean ± SD of three experiments, each performed in duplicate. 1) p < 0.05, t=4 or t=24 versus t=O at a similar CDDP concentration in figure A, B, C or D. 2) p < 0.05, CDDP treatment
versus CDDP and novobiocin treatment of GLC4 cells (A versus B) or GLC4/CDDP cells (C versus D) at a similar CDDP concentration and a similar time after drug removal.
139
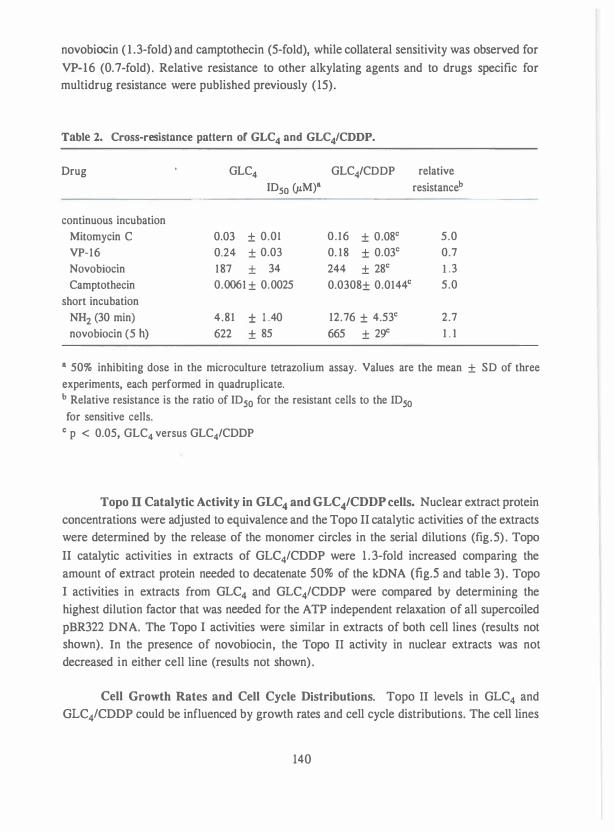
novobiocin ( 1 .3-fold) and camptothecin (5-fold), while collateral sensitivity was observed for
VP-16 (0.7-fold) . Relative resistance to other alkylating agents and to drugs specific for multidrug resistance were published previously (15).
Table 2. Cross-resistance pattern of GLC4 and GLC4/CDDP.
Drug GLC4 GLC4/CDDP relative IDso (µM)a resistanceh
continuous incubation Mitomycin C 0.03 ± 0.01 0 . 16 ± 0.08° 5.0 VP-16 0.24 ± 0.03 0. 1 8 ± 0.03° 0.7 Novobiocin 1 87 ± 34 244 ± 28° 1 .3 Camptothecin 0.0061 ± 0.0025 0.0308± 0.0144° 5.0
short incubation NH2 (30 min) 4.81 ± 1 .40 12. 76 ± 4.53° 2.7 novobiocin (5 h) 622 ± 85 665 ± 29" 1 . 1
a 50% inhibiting dose in the microculture tetrazolium assay. Values are the mean ± SD of three experiments, each performed in quadruplicate. h Relative resistance is the ratio of ID50 for the resistant cells to the ID50 for sensitive cells.
c p < 0.05, GLC4 versus GLC4/CDDP
Topo II Catalytic Activity in GLC4 and GLC4/CDDP cells. Nuclear extract protein
concentrations were adjusted to equivalence and the Topo II catalytic activities of the extracts were determined by the release of the monomer circles in the serial dilutions (fig.5) . Topo
II catalytic activities in extracts of GLC4/CDDP were 1 . 3-fold increased comparing the
amount of extract protein needed to decatenate 50% of the kDNA {fig.5 and table 3) . Topo
I activities in extracts from GLC4 and GLC4/CDDP were compared by determining the
highest dilution factor that was needed for the ATP independent relaxation of all supercoiled
pBR322 DNA. The Topo I activities were similar in extracts of both cell lines (results not shown). In the presence of novobiocin, the Topo II activity in nuclear extracts was not decreased in either cell line (results not shown) .
Cell Growth Rates and Cell Cycle Distributions. Topo II levels in GLC4 and GLC4/CDDP could be influenced by growth rates and cell cycle distributions. The cell lines
140

grew exponentially at cell densities from I to 10x1<>5 cells per ml. Cell doubling times were 16 h for GLC4 and 19 h for GLC4/CDDP. Cell cycle distributions of GLC4 and
GLC4/CDDP were determined with the cells in log-phase (3-8x1<>5 cells/ml) and appeared to be similar in both cell lines (table 3).
� 100
!7 � <( z 80 0 .Y
;)j u 60 (J) ..... ro c 40 <IJ
...... ro u p (J) 20 u
0 # 0.00 0.03 0.06 0.09 0. 1 2
µ,g protein/assay
Figure 5. Topo II activities in nuclear extracts from GLC4 (o) and GLC4/CDDP (11). Topo II activities as determined with the decatenation assay and densitometrically scanning of photographic negatives as described in "Materials and Methods" . Values are the mean ± SD of three experiments.
Topo I and II Content. To determine whether the increased Topo II activity was
caused by an increase in its nuclear content, the amount of Topo I and II in 0.35 M NaCl nuclear extracts as well as whole nuclear lysate was measured by immunoblotting. No differences in amounts of Topo II were detectable nor was the ratio 170 kD versus 180 kD Topo II changed (fig.6A). Topo I amounts were also similar in both cell lines (fig.6B).
DNase I and Micrococcal Nuclease Sensitivity of Chromatin. Differences in
chromatin structure between GLC4 and GLC4/CDDP was determined by comparing the
sensitivity of nuclei of both cell lines to nuclease digestion. The sensitivity to digestion with 0. 1 unit DNase I per µg of DNA was similar in isolated nuclei of GLC4 and GLC4/CDDP (fig. 7). However, the sensitivity to digestion with a concentration of 0. 1 unit micrococcal
nuclease per µg of DNA was increased in nuclei of GLC4/CDDP compared to GLC4 (fig. 7),
while nuclei of both cell lines were similarly sensitive to a concentration of 0.5 unit DNase
I or micrococcal nuclease per µg of DNA (results not shown).
1 4 1
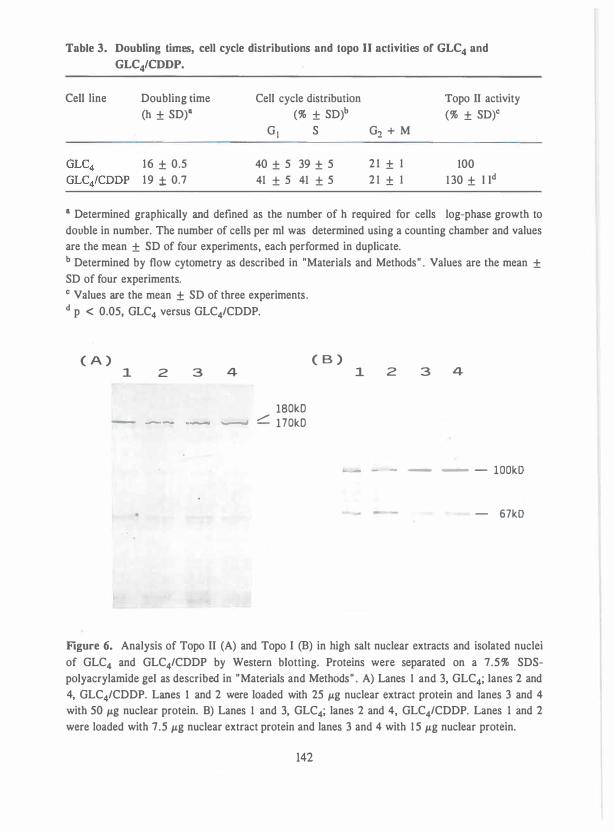
Table 3. Doubling times, cell cycle distributions and topo II activities or GLC4 and GLC4/CDDP.
Cell line Doubling time (h ± SD)•
16 ± 0.5 19 ± 0.7
Cell cycle distribution (% ± SD)b
G1 S G2 + M
40 ± 5 39 ± 5 2 1 ± 1 41 ± 5 41 ± 5 2 1 ± 1
Topo II activity (% ± SD)0
100 1 30 ± l ld
a Determined graphically and defined as the number of h required for cells log-phase growth to double in number. The number of cells per ml was determined using a counting chamber and values are the mean ± SD of four experiments, each performed in duplicate. b Determined by flow cytometry as described in "Materials and Methods" . Values are the mean ± SD of four experiments. c Values are the mean ± SD of three experiments. d p < 0.05, GLC4 versus GLC4/CDDP.
( A ) 1 2 3 4
180k0 - -- ·- __, c. 1 70k0
( B ) 1 2 3 4
� - - - - - l OOkD
- 67kD
Figure 6. Analysis of Topo II (A) and Topo I (B) in high salt nuclear extracts and isolated nuclei of GLC4 and GLC4/CDDP by Western blotting. Proteins were separated on a 7.5% SDSpolyacrylamide gel as described in "Materials and Methods" . A) Lanes 1 and 3, GLC4; lanes 2 and 4, GLC4/CDDP. Lanes 1 and 2 were loaded with 25 µg nuclear extract protein and lanes 3 and 4 with 50 µg nuclear protein. B) Lanes 1 and 3, GLC4; lanes 2 and 4, GLC4/CDDP. Lanes 1 and 2 were loaded with 7.5 µg nuclear extract protein and lanes 3 and 4 with 1 5 µg nuclear protein.
142

Q) u c Q) u (/) QJ 0 :J
100
80
60
40
20
o �-�����-����� 0 1 0 20 30 40 50 60
Figure 7. Sensitivity of chromatin of GLC4 (o,e) and GLC4/CDDP (t.,•) to digestion with micrococcal nuclease (o,ll) or DNase I (•,•) . Nuclei isolation and the chromatin digestion (0. 1 unit nuclease per µg of DNA) were performed as described in "Materials and Methods" . Values are the mean ± SD of four experiments.
Protein Analysis of Nuclei and Nuclear Matrices. Staining of a SDS-polyacrylamide gel revealed a 2-fold increase in the amount of a 56 kD protein in total nuclear lysates of GLC4/CDDP compared to GLC4 (fig.8) . In isolated nuclear matrices the
protein was still present and 2-fold increased in GLC4/CDDP compared to GLC4 as detected
with gel electrophoresis (fig.8) .
DISCUSSION
A number of mechanisms for drug-resistance have been detected in CDDP resistant
cell lines. Until now, only a few drugs are available that can enhance the CDDP cytotoxicity
in CDDP resistant cell lines such as D,L-buthionine-(S ,R)-sulfoximine that induces glutathione depletion and aphidicolin that inhibits DNA polymerase a ( 1 , 16,32,33).
Novobiocin may be another enhancer of CDDP cytotoxicity in CDDP resistant cell lines. This drug has already proven to enhance CDDP cytotoxicity in sensitive cell lines (3-5) which correlated with an increased formation of CDDP-induced DNA ISC (3). A Phase I
trial of novobiocin has already been performed (34). Novobiocin is a known inhibitor of
143

1 2 3 4 5 6 7 a
- 205kD
- 1 16kD
- 97kD
- 66kD
- 45kD
Figure 8. SDS-polyacrylamide electrophoresis gel of proteins present in whole nuclei and nuclear matrices of GLC4 and GLC4/CDDP. Nuclei and nuclear matrices of GLC4 (lanes 1-3 and 7) and GLC4/CDDP (lanes 4-6 and 8) were isolated as described in "Materials and Methods" . Proteins were electrophoresed on a 7.5% SDS polyacrylamide gel and stained with Coomassie blue R-250. Lanes 1-3 and 4-6 were loaded with 25, 12.5 and 6.25 µg nuclear protein, repectively. Lanes 7 and 8 were loaded with 5 µg nuclear matrix protein. The arrow indicates the 56 kD protein.
bacterial Topo II, DNA gyrase, by acting as a competitive inhibitor of ATP (35). It also
inhibits eukaryotic Topo II catalytic activity in nuclear extracts and in intact cells (6,36),
although effects on other enzyme systems may occur at high novobiocin concentrations (37) .
In our study we investigated whether novobiocin could enhance CDDP cytotoxicity in the CDDP resistant cell line GLC4/CDDP. A modified schedule of Eder et al. (3) with a longer preincubation time and the continuous presence of 100 µM novobiocin for four days enhanced the CDDP cytotoxicity only in GLC4. A novobiocin concentration of 200 µM, while novobiocin was omitted from the culture medium after CDDP incubation, enhanced
CDDP cytotoxicity in both cell lines, but most pronounced in GLC4. In GLC4 the
cytotoxicity of 2.5 µM CDDP was 47 ± 8 % enhanced in the continuous presence of 100
µM novobiocin for four days (fig. IA), 32 ± 10 % in the presence of 100 µM novobiocin
for 5 h and 74 ± 6 % in the presence of 200 µM novobiocin for 5 h (fig.2A). Using the 5
h novobiocin schedule, the increase in the number of DNA ISC after removal of CDDP and novobiocin compared to CDDP treatment was also more distinct in GLC4. Differences in cell growth rate could not account for the 1 .6-fold increase in DNA ICL in GLC4 at 4 h after
removal of CDDP and novobiocin compared to CDDP treatment. Thus, the effect of
144

novobiocin on CDDP cytotoxicity was less dependent on the post-incubation time but more
dependent on the novobiocin concentration preceding and concurrent with CDDP. These
results also suggests that novobiocin has an effect on the formation of DNA ISC and not on repair. Similar results were obtained in chinese hamster ovary cells (3). In that study, however, it was concluded that novobiocin had to be present after CDDP treatment to increase DNA ISC formation, probably because only a 1 h preincubation with novobiocin was used (3). The amount of DNA ISC was similar in GLC4 and GLC4/CDDP, which is comparable with previous results from our laboratory ( 15 , 19). In those studies, differences in DNA ISC had only been detected at relatively high doses, with an increased incubation time and at a different time after drug removal (15, 16, 19) .
The reduced efficacy of novobiocin in GLC4/CDDP could be related to changes on
the level of Topo II which was further investigated. Topo I activities were similar in both cell lines, whereas Topo II activities were increased 1 . 3-fold in GLC4/CDDP in spite of the reduced growth rate of this cell line compared to GLC4. Western blots using anti-Topo II antibodies showed that GLC4 and GLC4/CDDP had similar amounts of Topo II in nuclear extracts and nuclear lysates. The catalytic activity of Topo II, however, can be regulated by its level of phosphorylation. Isolated Topo II was phosphorylated by protein kinase C
resulting in an increase in Topo II activity (38,39). Phosphorylation of Topo II was also detected in intact cells (40,41). Constantinou et al. found that Topo II of HL-525 leukemia cells showed a higher level of phosphorylation and a higher activity, while the Topo II in these cells was less sensitive to novobiocin compared to Topo II of HL-205 leukemia cells (40) . Therefore, the increased Topo II activity in nuclear extracts of GLC4/CDDP may be
due to a higher level of phosphorylated Topo II in these cells. This could also explain the cross-resistance to novobiocin and an increased sensitivity to VP-16 of GLC4/CDDP compared to GLC4 and the reduced efficacy of novobiocin to enhance DNA ISC and CDDP cytotoxicity.
GLC4/CDDP cells were highly cross-resistant to camptothecin, although Topo I activities and amounts of Topo I were similar in both cell lines. Therefore, it is unlikely, that
camptothecin will be an effective enhancer of CDDP cytotoxicity in GLC4/CDDP cells (8).
Significant levels of cross-resistance to NH2 and mitomycin C, drugs that produce DNA ISC,
were found in GLC4/CDDP. These results agreed with findings in other CDDP resistant cell lines (33,42). It is known, that the 170 kD and 1 80 kD Topo II isoenzymes have different
biochemical, genetical and immunological characteristics (43,44), which may be important for the resistance to NH2 (45) . However, a similar ratio of 170 kD and 1 80 kD Topo II was detected in the immunoblots of GLC4 and GLC4/CDDP. Raji-NH2 cells with a 10-fold resistance to NH2 had a 3-fold increase in Topo II activity (46). The amount of 170 kD Topo II was almost unchanged, while the 180 kD Topo II was markedly increased in the Raji-NH2
cells which may explain the hypersensitivity of these cells to novobiocin (6,45). Specific non-histone proteins such as Topo II may establish the active state of a gene
145

and control the topological constraints different from inactive regions (47). Micrococcal
nuclease digestion of chromatin allows an estimation of the amount of transcriptionally active
and inactive domains of chromatin in both cell lines by comparing kinetics of digestion (48) . Chromatin of GLC4/CDDP was more sensitive to micrococcal nuclease digestion than GLC4 as was observed in the Raji-NH2 cell line compared to sensitive Raji cell line (46). Protein analysis showed that the amount of a 56 kD nuclear matrix protein was raised in GLC4/CDDP. The nuclear matrix protein we described may be related to DNA binding or
CDDP-DNA binding proteins recently described (49,50). Nuclear DNA-binding proteins of 33, 40, 56 kD and 66 kD were observed only in tumor cells and possibly have a regulatory role (49).
The nuclear matrix contains specific binding sites for some of the enzymes involved in DNA replication including DNA polymerase a, DNA primase, and Topo II (47) . This dynamic scaffolding system is also associated with other fundamental processes such as DNA
transcription and repair. Furthermore, the nuclear matrix serves an important role in DNA
organization and nuclear structure, since DNA loop domains are attached at their bases to the nuclear matrix (47) by a process in which Topo II is involved (5 1 ,52). Therefore, the increased Topo II activity and the increased amount of a 56 kD nuclear matrix protein in GLC4/CDDP may control the chromatin structure to increase its accessibility for enzymes involved in repair of platinum DNA monoadducts resulting in a decreased level of DNA platination found in GLC4/CDDP (15, 16). Topo II as well as Topo I could also be involved in DNA repair that takes place more rapidly at active genes than at bulk DNA (53). NH2 and methylnitrosourea adducts were preferentially repaired from actively transcribed genes
compared to the inactive genes and the noncoding region in Chinese hamster ovary cells and
rat insulinoma cells (54,55). A phenomenon that may be present in GLC4/CDDP, since
repair of platinated DNA was observed in both GLC4 and GLC4/CDDP, whereas only
GLC4/CDDP became more sensitive to CDDP after inhibition of DNA repair (16) . DNA
repair of active genes could also explain why some other CDDP resistant cell lines can
tolerate more platinum DNA adducts than the parental sensitive cell line (56,57). Further investigations will be necessary to determine Topo II phosphorylation, the DNA binding characteristics of the nuclear matrix protein and DNA repair of active genes in GLC4/CDDP.
In conclusion, novobiocin can be used to enhance the CDDP induced DNA ISC and cytotoxicity in GLC4 as well as GLC4/CDDP, but was not a specific modulator of CDDP
resistance. The increase in Topo II activity, in amount of a 56 kD nuclear matrix protein and
in chromatin digestion in GLC4/CDDP suggest a role of the nuclear matrix at the level of adduct formation.
ACKNOWLEDGMENTS
We wish to thank Dr. Leroy Liu for the polyclonal antibody against human Topo II,
146

Dr. Piet Limburg for the systemic sclerosis patient's serum to detect human Topo I and Dr. Douwe van Sinderen for supplies of supercoiled PBR322 DNA. We also thank Gert Jan
Meersma and Phuong Le for technical assistance.
REFERENCFS
1 . D e Graeff, A . , Slebos, R.J .C. , and Rodenhuis, S . Resistance to cisplatin and analogues: mechanisms and potential clinical implications. Cancer Chemother. Pharmacol. , 22: 325-332, 1988.
2. Andrews, P.A. , and Howell, S.B. Cellular pharmacology of cisplatin: perspectives on mechanisms of acquired resistance. Cancer Cells, 2: 35-43, 1990.
3 . Eder, J.P., Teicher, B.A., Holden, S.A., Cathcart, K.N.S. , and Schnipper, L.E. Novobiocin enhances alkylating agent cytotoxicity and DNA ISC in a murine model. J. Clin. Invest. , 79: 1524-1528, 1987.
4. Eder, J.P., Teicher, B.A. , Holden, S.A., Cathcart, K.N.S., Schnipper, L.E., and Frei III, E. Effect of novobiocin on the antitumor activity and tumor cell and bone marrow survivals of three alkylating agents. Cancer Res . , 49: 595-598, 1989.
5 . Eder, J.P., Teicher, B.A., Holden, S.A., Senator, L . , Cathcart, K.N.S., and Schnipper, L.E. Ability of four potential topoisomerase II inhibitors to enhance the cytotoxicity of cisdiarnminedichloroplatinum (II) in Chinese hamster ovary cells and in an epipodophyllotoxinresistant subline. Cancer Chemother. Pharmacol . , 26: 423-428, 1990.
6. Tan, K.B., Mattern, M.R., Boyce, R.A., and Schein, P.S. Unique sensitivity of nitrogen mustard-resistant human Burkitt's lymphoma cells to novobiocin. Biochem. Pharm. 37: 44 1 1-4413, 1988.
7. Tsai, C.M., Gazdar, A.F., Venzon, D.J. , Steinberg, S.M., Dedrick, R.L., Mulshine, J.L., and Kramer, B.S. Lack of in vitro synergy between Etoposide and cisdiarnminedichloroplatinum (II). Cancer Res., 49: 2390-2397, 1989.
8. Katz, E.J. , Vick, J.S, Kling, K.M. , Andrews, P.A., and Howell, S .B. Effect of topoisomerase modulators on cisplatin cytotoxicity in human ovarian carcinoma cells. Eur. J. Cancer, 26: 724-727, 1990.
9. Wang, J.C. DNA topoisomerases. Annu. Rev. Biochem., 54: 665-697, 1985. 10. Wang, J.C. Recent studies of DNA topoisomerases. Biochim. Biophys. Acta, 909: 1-9, 1987. 1 1 . Liu, L.F. , Liu, C.C., and Alberts, B .M. Type II DNA topoisomerases: Enzymes that can
unknot a topologically knotted DNA molecule via a reversible double-strand break. Cell, 19: 697-707, 1980.
12. DiNardo, S . , Voelkel, K., and Sternglanz, R. DNA topoisomerase II mutant of Saccharomyces cerevisiae: topoisomerase II is required for segregation of daughter molecules at the termination of DNA replication. Proc. Natl . Acad. Sci. USA, 8 1 : 2616-2620, 1984.
1 3 . Uemura, T . , and Yanagida, M. Isolation of type I and I I DNA topoisomerase mutants from fission yeast: single and double mutants show different phenotypes in cell growth and chromatin organization. EMBO J. , 3: 1737-1744, 1984.
14. Nelson, W.G., Liu, L.F. , and Coffey, D.S. Newly replicated DNA is associated with DNA topoisomerase II in cultured rat prostatic adenocarcinoma cells. Nature, 322: 1 87-189, 1986.
15 . G.A.P.Hospers, N.H.Mulder, B. de Jong, L. de Leij, D.R.A.Uges, A.M.J. FichtingerSchepman, R.J.Scheper, E.G.E. de Vries. Characterization of a human small cell lung
147

carcinoma cell line with acquired resistance to cis-diamminodichloroplatinum (II) in vitro. Cancer Res. 48: 6803-6807, 1988.
16. C.Meijer, N.H.Mulder, G.A.P.Hospers, D.R.A.Uges, E.G.E.de Vries. The role of glutathione in resistance to cisplatin in a human small cell lung cancer cell line. Br. J. Cancer, 62: 72-77, 1990.
17. G.A.P.Hospers, E.G.E. de Vries, N.H.Mulder. The formation and removal of cisplatin (CDDP) induced DNA adducts in a CDDP sensitive and resistant human small cell lung carcinoma (hSCLC) cell line. Br. J . Cancer 6 1 : 79-82, 1990.
1 8 . De Jong, S . , Zijlstra, J.G., de Vries, E.G.E., and Mulder, N.H. Reduced DNA topoisomerase II activity and drug-induced DNA cleavage activity in an adriamycin-resistant human small cell lung carcinoma cell line. Cancer Res . , 50: 304-309, 1990.
19. Timrner-Bosscha, H. , Hospers, G.A.P., Meijer, C., Mulder, N.H., Muskiet, F.A.J. , Martini, I .A., Uges, D.R.A., and de Vries, E.G.E. The influence of docosahexaenoic acid on cisplatin resistance in a human small cell lung carcinoma cell line. J. Natl . Cancer Inst. , 8 1 : 1069-1075, 1989.
20. De Jong, S., Zijlstra, J .G., Timmer-Bosscha, H., Mulder, N.H., and de Vries E.G.E. Detection of DNA cross-links in tumor cells with the ethidium bromide fluorescence assay. Int. J. Cancer, 37: 557-561 , 1986.
2 1 . Bradford, M.M. A rapid and sensitive method for the quantitation of microgram quantities of protein utilizing the principle of protein-dye binding. Anal . Biochem. , 72: 248-254, 1976.
22. Liu, L.F., and Miller, K.G. Eukaryotic DNA topoisomerases: Two forms of type I DNA topoisomerases from Hela cell nuclei. Proc. Natl . Acad. Sci. USA, 78: 3487-349 1 , 198 1 .
23. Duguet, M., Lavenot, C. , Harper, F., Mirambeau, G. , and De Recondo, A-M. Topoisomerases from rat liver: physiological variations. Nucleic Acids Res . , 1 1 : 1059-1075, 1983.
24. Marini, J .C. , Miller, K.G . , and Englund, P.T. Decatenation of kinetoplast DNA by topoisomerase II. J . Biol. Chem., 255: 4976-4979, 1980.
25. Miller, K.G., Liu, L.F., and Englund, P.T. A homogeneous type II DNA topoisomerase from Hela cell nuclei. J. Biol. Chem., 256: 9334-9339, 198 1 .
26. Laemrnli, U.K. Cleavage of structural proteins during the assembly of the head of bacteriophage T4. Nature (Lond.), 227: 680-685, 1970.
27. Shero, J .H., Bordwell, B., Rothfield, N.F., and Earnshaw, W.C. High titers of autoantibodies to topoisomerase I (ScL-70) in sera from scleroderma patients. Science, 23 1 : 737-740, 1986.
28. Maul, G.G., Jimenez, S.A., Riggs, E., and Ziemnicka-Kotula, D. Determination of an epitope of the diffuse systemic sclerosis marker antigen DNA topoisomerase I: sequence similarity with retroviral p3()&ag protein suggests a possible cause for autoimmunity in systemic sclerosis. Proc. Natl . Acad. Sci. USA, 86: 8492-8496, 1989.
29. Wierowski, J . V., Thomas, R.R., and Wheeler, K.T. DNA repair kinetics in mammalian cells following split-dose irradiation. Radiat. Res . , 98: 242-253, 1984.
30. Birnboim, H.C. , and Jevcak, J.J. Fluorometric method for rapid detection of DNA strand breaks in human white blood cells produced by low doses of radiation. Cancer Res . , 41 : 1 889-1892, 198 1 .
3 1 . Fernandes, D.J . , Smith-Nanni, C. , Paff, M T. , and Neff, T-A.M. Effects of antileukemia agents on nuclear matrix bound DNA replication in CCRF-CEM leukemia cells. Cancer Res. , 48: 1 850- 1 855, 1988.
32. Masuda, H., Ozols, R.F., Lai,G .M. , Fojo, A., Rothenberg, M., and Hamilton, T.C. Increased DNA repair as a mechanism of acquired resistance to cis-diamminodichloroplatinum (II) in human ovarian cancer cell lines. Cancer Res . , 48: 571 3-57 16, 1988.
33. Andrews, P.A., Murphy, M.P. , and Howell, S.B. Characterization of cisplatin-resistant COLO 3 16 human ovarian carcinoma cells. Eur. J. Cancer Clin. Oneal . , 25: 619-625, 1989.
148

34. Eder, J.P., Wheeler, C.A., Teicher, B.A., and Schnipper, L.E. A Phase I clinical trial of novobiocin, a modulator of alkylating agent cytotoxicity. Cancer Res . , 5 1 : 5 10-513 , 199 1 .
35. Gellert, M., O'Dea, M.H., Itoh, T., and Tomizawa, I.I. Novobiocin and coumermycin inhibit DNA supercoiling catalyzed by DNA gyrase. Proc. Natl . Acad. Sci. USA, 73: 4474-4478 , 1976.
36. Hsieh, T., and Brutlag, D. ATP-dependent DNA topoisomerase from D.melanogaster reversibly catenates duplex DNA rings. Cell, 2 1 : 1 15-125, 1980.
37. Downes, C.S . , and Johnson, R.T. DNA topoisomerases and DNA repair. BioEssays, 8: 179-1 84, 1988.
38. Sahyoun, N., Wolf, M. , Besterman, J . , Hsieh, T., Sander, M., LeVine, H., Chang, K.J., and Cuatrecasas, P . Protein kinase C phosphorylates topoisomerase II: Topoisomerase activation and its possible role in phorbol ester-induced differentiation of HL-60 cells. Proc. Natl . Acad. Sci. USA, 83 : 1603-1607, 1986.
39. Saijo, M., Enomoto, T., Hanaoka, F., and Ui, M. Purification and characterization of type II DNA topoisomerase from FM3A cells: phosphorylation of topoisomerase II and modification of its activity. Biochemistry, 29: 583-590, 1990.
40. Constantinou, A. , Henning-Chubb, C . , and Huberman, E. Novobiocin- and phorbol-12-myristate-13-acetate induced differentiation of human leukemia cells associated with a reduction in topoisomerase II activity. Cancer Res. , 49: 1 1 10-1 1 17, 1989.
4 1 . Heck, M.M.S . , Hittelman, W.N., and Earnshaw, W.C. In vivo phosphorylation of the 170 kDa form of eukaryotic DNA topoisomerase II. J. Biol. Chem., 264: 15161-15164, 1989.
42. Fram, R.J . , Woda, B.A., Wilson, J.M., and Ribochaud, N. Characterization of acquired resistance to cis-diamminedichloroplatinum{II) in BE human colon carcinoma cells. Cancer Res . , 50: 72-77, 1990.
43. Drake, F.H., Hofmann, G.A., Bartus, H.F., Mattern, M.R., Crooke, S .T. , and Mirabelli, C.K. Biochemical and pharmacological properties of p 170 and p 1 80 forms of topoisomerase II. Biochemistry, 28: 8154-8160, 1989.
44. Chung, T.D.Y., Drake, F.H., Tan, K.B., Per, S .R. , Crooke, S .T. , and Mirabelli, C.K. Characterization and immunological identification of cDNA clones encoding two human DNA topoisomerase II isoenzymes. Proc. Natl. Acad. Sci. USA, 86: 943 1-9435, 1989.
45. Tan, K.B., Per, S.R., Boyce, R.A., Mirabelli, C.K., and Crooke, S.T. Altered expression and transcription of the topoisomerase II gene in nitrogen mustard-resistant human cells. Biochem. Pharm., 37: 4413-4416, 1988.
46. Tan, K.B., Mattern, M.R., Boyce, R.A., and Schein, P.S. Elevated DNA topoisomerase II activity in nitrogen mustard-resistant human cells. Proc. Natl . Acad. Sci. USA, 84: 7668-7671 , 1987.
47. Pienta, K.J . , Partin, A.W., and Coffey, D.S. Cancer as a disease of DNA organization and dynamic cell structure. Cancer Res. , 49: 2525-2532, 1989.
48. Telford, D .J., and Stewart, B. W. Micrococcal nuclease: its specificity and use for chromatin analysis. Int. J. Biochem., 2 1 : 127-137, 1989.
49. Law, M.L., Gao, J . , and Puck, T.T. A nuclear protein associated with human cancer cells binds preferentially to a human repetitive DNA sequence. Proc.Natl .Acad.Sci. USA, 86: 8472-8476, 1989.
50. Chu, G. , and Chang, E. Cisplatin-resistant cells express increased levels of a factor that recognizes damaged DNA. Proc. Natl. Acad. Sci. USA, 87: 3324-3327, 1990.
5 1 . Adachi, Y., Kas, E., and Laemmli, U.K. Preferential, cooperative binding of DNA topoisomerase II to scaffold-associated regions. EMBO J . , 8: 3997-4006, 1989.
52. Almouzni, G., and Mechali, M. Assembly of spaced chromatin involvement of ATP and DNA topoisomerase activity. EMBO J . , 7: 4355-4365, 1988.
53. Stevnsner, T., Jones, J . , and Bohr, V.A. Topoisomerases are involved in preferential DNA repair of actively transcribed genes. Proc. Am. Assoc. Cancer Res . , 3 1 : 26, 1990.
149

54. Wassermann, K., Kohn, K.W., and Bohr, V.A. Heterogeneity of nitrogen mustard-induced DNA damage and repair at the level of the gene in Chinese hamster ovary cells. J. Biol. Chem., 265: 1 3906-13913, 1990.
55. LeDoux, S.P., Patton, N.J . , Nelson, J .W., Bohr, V.A., and Wilson, G.L. Preferential DNA repair of alkali-labile sites within the active insulin gene. J. Biol. Chem., 265: 14875-14880, 1990.
56. Eastman, A., and Schulte, N. Enhanced DNA repair as a mechanism of resistance to cisdiamminedichloroplatinum(Il). Biochemistry, 27: 4730-4734, 1988.
57. Strandberg, M.C., Bresnick, E., and Eastman, A. The significance of DNA cross-linking to cis-diamminechloroplatinum (11)-induced cytotoxicity in sensitive and resistant lines of murine L1210 cells. Chem. Biol. Interact. , 39: 169-180, 1982.
150

Chapter 10
SUMMARY AND CONCLUSIONS
Adriamycin and CDDP are effective chemotherapeutic agents for the treatment of a
variety of human cancers. However, the development of resistance to these drugs is a major cause of treatment failure. In this thesis, mechanisms involved in the resistance to adriarnycin or CDDP and ways to reverse drug-resistance are described. These studies have been
performed in the human small cell lung carcinoma cell line GLC4 and in the sublines
GLC4/ ADR and GLC4/CDDP with in-vitro acquired drug-resistance to adriamycin and CDDP, respectively.
The review in chapter 1 describes the energy metabolism in and the efficacy of energy metabolism inhibitors on tumor cells in relation to adriarnycin-resistance. Although high glycolytic rates had been observed in tumor cells, part of the ATP synthesis still took place in the mitochondria by oxidative phosphorylation. Both glycolytic and mitochondrial inhibitors showed cytotoxic activity but only at relatively high concentrations. These drugs
may be more effective in combination with adriamycin or CDDP. Adriarnycin in combination with these drugs or other drugs acting upon the energy metabolism such as veraparnil can
reverse the resistance, particularly when this adriamycin-resistance is due to an energy
dependent mechanism. On the other hand, glucose-regulated stress can induce adriamycinresistance in tumor cells by a decline in DNA topoisomerase (fopo) II.
Metabolites of energy and phoshoplipid metabolism in in-vitro tumor cells and in-vivo
tumors can be monitored with a noninvasive technique, namely nuclear magnetic resonance spectroscopy (second part of chapter 1). The energy metabolism of and the effect of antitumor drugs on energy metabolites in tumor cells can be studied by embedding the cells
in agarose gel threads or seeding the cells on agarose microcarrier beads. Till now, only a
few studies have compared drug-resistant with drug-sensitive tumor cell lines with conflicting
results. In in-vivo tumors the effect of chemotherapy on the energy metabolism probably
depends on the metabolic stage of the tumor. Tissue heterogeneity, tumor size, type of
tumor, glycolytic rate of the tumor, tumor hypoxia and the degree of vascularization have to be determined in order to be able to estimate this stage, to evaluate chemotherapeutic efficacy and to discriminate between sensitive and resistant tumors.
The energy metabolism of GLC4 and GLC4/ ADR cells is described in chapter 2. The
glucose-6-phosphate dehydrogenase activity was 2-fold increased in GLC4/ ADR compared
to GLC4 cells whereas the kinetic properties of the enzyme remained unchanged. This change
151

in activity is possibly related to an increased DNA repair in these cells. Mitochondrial
respiration activities were similar in both cell lines. Despite this, GLC4/ ADR was collaterally sensitive to the antimitochondrial drugs doxycycline and oligomycin but cross-resistant to
rhodamine-123 and the glycolytic inhibitor 2-deoxyglucose. Comparable reduction of mitochondrial mRNAs in both cell lines was detected after continuous incubation with high doxycycline concentrations, whereas a strong reduction of the nuclear-coded mRNA for
subunit IV of cytochrome c oxidase was detected in GLC4/ ADR only. This effect may
account for the increased sensitivity of GLC4/ ADR compared to GLC4 at higher doxycycline
concentrations. Doxycycline had an additive effect on the cytotoxicity of adriamycin in both
cell lines. Thus, a form of collateral sensitivity to antimitochondrial drugs can exist in
atypical multidrug resistant cells. 31P NMR spectroscopy has been used to monitor energy and phospholipid metabolites
in GLC4 and GLC4/ADR cells (chapter 3) . Spectra of continuously perfused cells that were embedded in agarose gel threads, revealed almost similar levels of phosphocholine, phosphocreatine and ATP in both cell lines. Corresponding results were observed in spectra
of cell extracts. No differences were observed between extracts with 1 H NMR spectroscopy. The intracellular free Mg
2+ concentration in these cell lines were also comparable. Adriamycin had different effects on the phosphorus metabolite levels in continuously perfused GLC4 and GLC4/ ADR cells. A strong increase in the ATP level in the presence of
adriamycin followed by a fast decrease after 5 hours of perfusion was observed in GLC4
only. In both cell lines, however, phosphocreatine levels decline faster than the ATP levels
after adriamycin treatment. The less dramatic increase in the phosphocholine level and the
increase in the glycerophosphocholine level in GLC4/ ADR in the presence of increasing adriamycin concentrations suggested that the phospholipid turnover was stimulated in GLC4/ ADR. Hence, biochemical markers for adriamycin- resistance of GLC41 ADR can be detected with NMR spectroscopy.
In chapter 4 Topo I and Topo II are reviewed. These enzymes, involved in the
regulation of the three-dimensional structure of the DNA, are important for the handling of DNA during vital cellular processes such as translation, transcription and mitosis. Antitumor drugs such as anthracyclines (adriamycin) , epipodophyllotoxins (VP-16 and VM-26),
acridines (m-AMSA) and ellipticines interfere with Topo II. The DNA-Topo II complex or cleavable complex, which is an intermediate in the normal enzyme pathway, is stabilized by
these drugs and the increased cleavable complex formation appears to be cytotoxic. The
development of resistance to these drugs can be due to down-regulation of Topo II or to an altered Topo II, which is less sensitive to these drugs but has an unchanged catalytic activity.
Camptothecin and actinomycin D stabilize the Topo I-DNA complex or cleavable complex in a similar manner as described for Topo II drugs. Resistance to camptothecin can also be due to a decline in Topo I amount or to an altered Topo I . Knowledge of the working mechanism and the cellular regulation of the topoisomerases may lead to the selection of the
152
most effective drugs and treatment schedules, and to circumvention of drug resistance. In chapter 5 , further analysis of the mechanisms involved in the adriamycin-resistance
of GLC4/ ADR is described. Although drug-accumulation was reduced in GLC4/ ADR, these cells did not overexpress the 170 kilodalton (kD) P-glycoprotein neither did verapamil
reverse the adriamycin-resistance. GLC4/ADR was cross-resistant to VM-26, VP-16, m
AMSA and mitoxantrone. The Topo II catalytic activity and the drug-induced DNA cleavage activity were reduced in salt extracts from GLC4/ ADR compared to GLC4, whereas Topo
I activities appeared similar in extracts from both cell lines. The reduced Topo II activity in GLC4/ ADR was not related to changes in doubling time or cell cycle distribution. Therefore,
these results suggest that resistance of GLC4/ ADR to adriamycin was in part due to the reduced drug-induced formation of the cleavable complex.
The difference in degree of resistance to VM-26 and m-AMSA, 59.5 and 4-fold respectively, was investigated at the level of Topo II (chapter 6). The decrease in VM-26 and
m-AMSA induced cleavable complex formation in GLC4/ ADR compared to GLC4 cells was
related to the degree of resistance to these drugs. In isolated nuclei of GLC4/ ADR, however, the reduction in cleavable complex formation was similar with VM-26 and m-AMSA. Thus,
part of the resistance to VM-26 is due to a cellular mechanism probably a decreased drug accumulation. Following the removal of VM-26, the cleavable complexes disappeared faster in GLC4/ ADR than in GLC4 cells, whereas after m-AMSA treatment, a similar rate of disappearance was found in both cell lines. The amount of cleavable complexes induced by
high drug concentrations of both drugs in cells and nuclei was lower in GLC4/ ADR than in GLC4• These results were comparable with immunoblottings which showed that the amount
of 170 kD Topo II was reduced in GLC4/ ADR. A 170 kD and a 1 80 kD Topo II were detected in both cell lines. Topo II was not altered in GLC4/ ADR, since the ATP-dependence of Topo II catalytic activity and the VM-26 and m-AMSA-induced cleavable complex
formation were similar in salt extracts of both cell lines after Topo II activities were
equalized. Therefore, the cross-resistance to m-AMSA of GLC4/ ADR is probably due to the
decreased amount of the 170 kD Topo II and not to an altered Topo II, while other cellular
mechanisms such as a decreased drug accumulation are also involved in the cross-resistance
to VM-26. Chapter 7 describes the cytotoxicity of fostriecin in three cell lines with diverse Topo
II activities, namely GLC4, GLC4/ADR and the CDDP-resistant subline, GLC4/CDDP.
Fostriecin belongs to a new class of drugs that inhibits Topo II activity without cleavable
complex formation. An increased sensitivity to fostriecin was related to a decreased Topo Il activity in these cell lines, whereas with VP-16 an opposite relation was observed. Resistance
to fostriecin was not related to resistance to methotrexate, although both drugs enter the cell by the same carrier. Both GLC4/ ADR and GLC4/CDDP were cross-resistant to a
camptothecin analogue, which stimulates the Topo I-DNA complex formation. Our results
indicate an inverse relation between Topo II activity and fostriecin sensitivity. However,
153

further studies are required to establish this relation.
A fluorescence assay with ethidium bromide has been set up to detect CDDP induced DNA interstrand cross-links in intact cells (chapter 8). This assay depends on the difference in fluorescence between single and double stranded DNA. DNA interstrand cross-links were
measured by the return of fluorescence of dsDNA after heat denaturation at pH 12. Under
these conditions denatured DNA gave very low fluorescence. In mouse Ehrlich Ascites tumor cells DNA interstrand cross-links correlated with the CDDP concentration, while in GLC4
cells a plateau was reached at high CDDP concentrations. RNase added to the lysate of whole cells or low levels of single-strand DNA breaks had no effect on the extent of DNA
interstrand cross-links. Compared with the alkaline elution assay, results were identical. The
advantage of the ethidium bromide fluorescence assay, however, is that it is faster and easier
without requiring radioactive labeling of cells which can be of value in slowly growing human tumor cells or cells in G0.
In chapter 9 the effect of novobiocin, an inhibitor of the Topo II catalytic activity, on the cytotoxicity of CDDP was correlated with the increase in DNA interstrand cross-links in GLC4 and in the CDDP-resistant subline GLC4/CDDP. A short incubation with 200 µM novobiocin enhanced the CDDP cytotoxicity and DNA interstrand cross-link formation to a greater extend in GLC4 than in GLC4/CDDP cells. The decrease in efficacy of novobiocin
in GLC4/CDDP could be connected to the increased Topo II catalytic activity in these cells.
The amount of Topo II, however, was equal in both cell lines suggesting an increased Topo
II phosphorylation in GLC4/CDDP cells. GLC4/CDDP showed cross-resistance to nitrogen mustard and mitomycin C, both drugs form DNA interstrand cross-links, and to novobiocin but an increased sensitivity to VP-16. Although the Topo I activities and Topo I amounts
were similar in GLC4 and GLC4/CDDP, the latter was cross-resistant to camptothecin. The
chromatin structure of GLC4/CDDP was changed, as an increased sensitivity to micrococcal nuclease digestion of nuclei and an increased amount of a 56 kD protein in nuclei and nuclear
matrices was observed in these cells. Thus, the resistance to CDDP is probably a multifactorial type of resistance. The increased Topo II activity and the changed chromatin structure suggest a role of the nuclear matrix at the level of platinum adduct formation.
We conclude that inhibitors of the energy metabolism are effective in human small cell lung carcinoma cell lines, while antimitochondrial drugs were even more effective in the
atypical multidrug resistant subline GLC4/ ADR. Still, these drugs can be more useful in
combination with other drugs interfering with energy-dependent repair of DNA damage or energy-dependent resistance mechanisms. The decreased drug accumulation in GLC4/ ADR
cells and the increased Topo II activity in GLC4/CDDP may be such mechanisms. Differences in energy metabolism between our sensitive and adriamycin-resistant cells
were not detected with NMR spectroscopy but that may be due to the insensitivity of this method. On the other hand, the steady state levels of metabolites can be similar, whereas the energy flux in the cells may differ. 1 3C-labeled compounds or magnetization transfer
154

techniques can be used to study this flux. The different effects of adriamycin on the energy metabolites in GLC4 and GLC4/ ADR cells may have clinical relevance. In in-vivo tumors,
however, the metabolic stage is a major determinant of this drug effect. The metabolic stage may also have an effect on the amount of Topo II in the cells. The continuous perfusion
system with agarose gel threads can be used to simulate these metabolic stages in in-vitro tumor cells in relation to the effect of the drug or to evaluate the efficacy of inhibitors of the
energy metabolism. Part of the drug-resistance in GLC4/ ADR was due to a decreased Topo II level and
activity. Studies are required to determine how these cells cope with the reduced Topo IT activity. Further insight in phosphorylation of Topo II in intact cells which regulates the
enzyme activity is necessary to correlate the function of Topo II with the cellular amounts
of this enzyme in tumor cells. The amount, the activity and the phosphorylation level of Topo I may interact with the function of Topo II and should be involved in such a study. It is likely, that more types of Topo II do exist which may differ in type of regulation or drugsensitivity. Genetic analysis should be performed to explain the down-regulation of Topo II in resistant cells and to detect different types of Topo II. The reduced Topo II level and
activity in GLC4/ ADR can make these cells more vulnerable to certain inhibitors of the Topo
II catalytic activity such as fostriecin. Stimulation of the Topo II expression in cells by growth factors may be another approach to reverse resistance.
Another part of the resistance to adriamycin of GLC4/ ADR was due to a decreased adriamycin accumulation. The ATP-dependence of this mechanism should be investigated and
photoaffinity labeling studies with ATP have to be performed to identify and isolate the
membrane protein(s) involved in this process. Raising antibodies against isolated membrane fragments of GLC4 and GLC4/ ADR to detect differences in proteine composition may be another approach. The relative importance of the decreased drug-accumulation and of the
reduced Topo II level at low levels of drug-resistance should be determined in low resistant sub lines from GLC4/ ADR, that have been obtained during the establishment of GLC4/ ADR
by stepwise increasing the concentration of adriamycin. Whether Topo I and Topo IT are
potential targets of antitumor drugs in human solid tumors and whether the topoisomerases
can be involved in drug-resistance of these tumors is currently under investigation. Novobiocin was less effective in GLC4/CDDP cells which can be related to the
increased Topo II activity in these cells. To determine the Topo II activity in GLC4 and
GLC4/CDDP cells more accurately, the phosphorylation of Topo II also in the presence of
CDDP should be measured in intact cells. The regulation of this phosphorylation by
oncogenes or protein kinases may be studied through the use of antisense
oligodeoxynucleotides to inhibit the expression of a specific protein. The changed chromatin structure of GLC4/CDDP can be further analyzed by isolation and characterization of the 56
kD protein and by determining the DNA-binding or platinum-DNA adduct binding capacity
of the protein. Whether preferential repair of actively transcribed genes is involved in CDDP-
155

resistance can be observed by measuring the recovery of mRNA expression of certain genes or repair of a DNA fragment within an active gene after CDDP treatment. Inhibitors of Topo II such as fostriecin which differ functionally from novobiocin and inhibitors of Topo I I phosphorylation may be used in combination with CDDP to reverse COOP-resistance more effectively.
Till now, it is unknown which mechanisms are involved in the process of cell death after treatment with adriamycin or CDDP. Insight in this process may also indicate possible mechanisms of drug-resistance.
Conclusions. In this thesis further insight in the mechanisms of drug-resistance and ways to reverse the resistance are obtained . An increased sensitivity to mitochondrial inhibitors and a different effect of adriamycin on phospholipid metabolites was observed in the adriamycin-resistant cell line GLC4/ ADR compared to the adriamycin-sensitive parental line GLC4• These findings are in contrast to those in multidrug-resistant cell lines that overexpress the P-glycoprotein and are highly cross-resistant to mitochondrial inhibitors. The reduced adriamycin-accumulation in GLC4/ ADR cells is not due to an overexpression of the P-glycoprotein , whereas verapamil does not reverse the adriamycin-resistance of these cells. Therefore, a mechanism to reduce drug-influx or to increase drug-efflux is present in GLC4/ADR cells which possibly has a low affinity to mitochondrial inhibitors. Whether the mitochondria and the phospholipid metabolisme are involved in this resistance-mechanism and whether mitochondrial inhibitors are also effective in other atypical multidrug-resistant cell lines needs further investigation. Although we were able to distinguish between drugsensitive and drug-resistant cells with NMR spectroscopy, more studies should be performed with drug-resistant cell lines to obtain drug-resistance specific markers. The insensitivity of NMR spectroscopy yet limits its clinical application.
In addition to a decreased drug-accumulation, part of the adriamycin-resistance of GLC4/ ADR cells is due to a reduction in the amount and the catalytic activity of cellular Topo II, resulting in less drug-induced cleavable complexes in these cells. The loss of Topo II catalytic activity is not compensated by an increase in Topo I catalytic activity in these cells. The high cross-resistance to VM-26 and VP-16 observed in GLC4/ADR cells probably results from a decreased drug-accumulation as well as from a reduced amount of Topo II,
whereas the low cross-resistance to m-AMSA is only due to a reduced amount of Topo II. No evidence is found, that in GLC4/ ADR cells an altered Topo II is present with a diminished sensitivity to these drugs. The reduced Topo II catalytic activity may be the cause of the increased sensitivity of GLC4/ ADR cells to fostriecin, an inhibitor of the Topo II
catalytic activity, compared to GLC4 cells. Furthermore, a CDDP-resistant cell line GLC4/CDDP with an increased Topo II catalytic activity is less sensitive to fostriecin than GLC4• The changed chromatin structure and the increased Topo II catalytic activity in GLC4/CDDP cells suggest a role of the nuclear matrix at the level of DNA interstrand cross-
156

link and other platinum adduct formations. Unfortunately, novobiocin, an inhibitor of the
Topo II catalytic activity, was a less effective enhancer of the CDDP cytotoxicity in GLC4/CDDP than in GLC4 cells, which may result from differences in Topo II phosphorylation. Thus, resistance to adriamycin is due to other multifactorial mechanisms in comparison with the resistance to COOP in human small cell lung carcinoma sublines.
157

158

Chapter 1 1
SAMENVATTING EN CONCLUSIES
Doxorubicine (adriamycine) en cisplatine (CDDP) zijn effectieve cytostatica voor de behandeling van verschillende type tumoren in patienten. Een belangrijke reden voor het falen van de behandeling op langere termijn is echter, dat de tumoren ongevoelig (resistent) worden voor deze cytostatica.
In een groot aantal gekweekte tumorcellijnen, die resistent zijn gemaakt tegen adriamycine, is aangetoond, dat een membraaneiwit met een molecuul gewicht van 170 kilodalton (kD) tot 180 kD tot overexpressie komt. Dit worden multidrug-resistente cellijnen
genoemd. Dit eiwit, het P-glycoprotei'ne, zorgt ervoor dat cytostatica uit de eel gepompt wordt. Meer P-glycoprotei"ne in de celmembraan betekent dat de accumulatie van cytostatica verlaagd wordt in de resistente cellen t.o. v. de gevoelige cell en. De adriamycine-resistente cellijnen zijn kruis-resistent voor etoposide (VP-16), teniposide (VM-26) en een aantal andere cytostatica. In een dee] van deze resistente cellijnen wordt tevens een betere bescherming
tegen vrije radicalen, die afkomstig zijn van adriamycine, gevonden. Dit kan leiden tot veranderingen op het gebied van energie metabolisme in de tumorcellen .
DNA topoisomerase (Topo) II is een eiwit, dat de structuur van het DNA in cellen stabiliseert. Topo II is nu het doelwit van een aantal cytostatica, zoals adriamycine, mAMSA, mitoxantrone, VM-26 en VP-16. Deze middelen hebben het meeste effect op cellen, die bezig zijn hun DNA te verdubbelen als voorstadium voor de celdeling, waarbij
tumorcellen zich relatief snel delen t.o.v. andere type cellen. In een aantal VP-16 en mAMSA resistente tumorcellijnen is een verlaging van de Topo II hoeveelheid gevonden, die
soms gepaard gaat met een verandering van Topo II, waardoor het eiwit minder gevoelig is geworden voor de genoemde cytostatica. In sommige van deze cellijnen is tevens een
verlaging in cytostatica accumulatie gevonden zonder dat het P-glycoprotei"ne tot overexpressie was gekomen. Dit worden de atypische multidrug-resistente cellijnen genoemd.
In cellijnen, die resistent zijn gemaakt tegen CDDP, zijn verschillende resistentie
mechanismen gevonden, zoals een verlaagde CDDP accumulatie, een toegenomen inactivatie van CDDP, een verlaagde formatie en/of een verhoogde reparatie van COOP geinduceerde
DNA interstrengs en intrastrengs cross-links. Niet bekend is of Topo II een rol speelt in de CDDP resistentie maar we! , dat novobiocine, een remmer van de Topo II katalytische
activiteit, zowel de effectiviteit van CDDP als de formatie van DNA interstrengs cross-links
verhoogt.
1 59

In dit proefschrift is gekeken naar de mechanismen, die de resistentie tegen adriamycine en CDDP kunnen veroorzaken, en naar mogelijkheden om de resistentie op te heffen. Het onderzoek is verricht in de volgende modellen: de humane kleincellige
longcarcinoma cellijn GLC4 en de twee sublijnen GLC4/ADR en GLC4/CDDP, die resistent
zijn tegen respectievelijk adriamycine en CDDP. Het literatuuroverzicht in hoofdstuk 1 beschrijft het energie metabolisme in
tumorcellen en de effectiviteit van remmers van dit metabolisme op tumorcellen in relatie tot adriamycine-resistentie. Hoewel hoge glycolyse snelheden zijn gevonden in tumorcellen ,
vindt een deel van de ATP syn these nog steeds plaats in de mitochondrien via oxidatieve fosforylering . Zowel remmers van de glycolyse als van de mitochondriele activiteit
vertoonden een antitumor effect, maar alleen bij hoge concentraties. Deze remmers zouden
effectiever kunnen zijn in combinatie met adriamycine of CDDP. De adriamycine-resistentie kan opgeheven worden door een combinatie van adriamycine met deze remmers of met
andere stoffen, die het metabolisme belnvloeden, zoals verapamil, vooral wanneer de
adriarnycine-resistentie wordt veroorzaakt door een energie-afhankelijk mechanisme. Aan de andere kant kan een glucose tekort adriamycine-resistentie induceren in tumorcdlijnen door middel van een verlaging van de Topo II hoeveelheid in deze cellen .
Metabolieten van het energie metabolisme en het fosfolipide metabolisme kunnen in
intacte gekweekte tumorcellen en in tumoren in-vivo gemeten worden met behulp van nietinvasieve nucleaire magnetische resonantie (NMR) spectroscopie (tweede deel van hoofdstuk 1) . De tumorcellen kunnen in een klein volume gehouden worden door de cellen in te bedden in dunne agarose geldraden of door de cellen te laten hechten op kleine agarose bolletjes. Tot
nu toe zijn er weinig studies met NMR spectroscopie gedaan om resistente en gevoelige
tumor cellijnen te vergelijken of om het effect van cytostatica op het energie metabolisme te
bestuderen. Dit leverde tegengestelde resultaten op. In tumoren in-vivo is het effect van
chemotherapie op het energie-metabolisme van de tumor waarschijnlijk afhankelijk van het metabole stadium van de tumor. De weefsel heterogeniteit, tumor grootte, type tumor, glycolyse activiteit, zuurstof beschikbaarheid en de mate van doorbloeding in een tumor zullen bepaald moeten worden om het metabole stadium van een tumor te schatten, zodat de
effectiviteit van de chemotherapie te evalueren is en onderscheid gemaakt kan worden tussen
resistente en gevoelige tumoren in de toekomst.
Het energie metabolisme van GLC4 en GLC4/ ADR cellen is beschreven in hoofdstuk 2. De glucose-6-fosfaat dehydrogenase activiteit was 2 maal verhoogd in GLC4/ ADR, terwijl
de kinetische eigenschappen van het enzym onveranderd bleven. De verandering in activiteit zou gerelateerd kunnen zijn aan de toegenomen DNA reparatie in de resistente cellen. De
mitochondriele respiratie activiteit was gelijk in beide cellijnen. Desondanks is GLC4/ ADR
gevoeliger voor de antimitochondriele stoffen doxycycline en oligomycine, terwijl lage kruis
resistentie optrad tegen rhodamine-123 en tegen een remmer van de glycolyse, 2-
deoxyglucose. Door de continue incubatie met doxycycline nam de hoeveelheid
160
mitochondriele mRNA's af in beide cellijnen, terwijl een afname van het in de kemgecodeerde mRNA voor subeenheid IV van cytochroom c oxidase alleen optrad in GLC4/ ADR cellen. Dit laatst genoemde effect zou verantwoordelijk kunnen zijn voor de grotere gevoeligheid van GLC4/ ADR cellen voor hoge doxycycline concentraties.
Doxycycline had een additief effect op de cytotoxiciteit van adriamycine in beide cellijnen. Een toegenomen gevoeligheid voor antimitochondriele middelen kan dus aanwezig zijn in
cellijnen met een afwijkende resistentie tegen verscheidene cytostatica. 3 1P NMR spectroscopie is gebruikt om het energie en fosfolipide metabolisme in
GLC4 en GLC4/ ADR cellen te bestuderen (hoofdstuk 3). De cellen waren ingebed in agarose
geldraden en het medium rond de cellen werd continue ververst. Heide cellijnen bevatten
dezelfde hoeveelheid fosfocholine, fosfocreatine en ATP en hetzelfde resultaat werd verkregen met extracten van cellen. De intracellulaire vrije [Mg2+1 concentratie was eveneens gelijk in beide cellijnen. Adriamycine had verschillende effecten op de fosfaat metabolieten van GLC4 en GLC4/ADR cellen. Een sterke toename in ATP hoeveelheid werd
gevonden in GLC4 direct na toevoeging van adriamycine aan het medium, wat gevolgd werd door een snelle afname 5 uur na toevoeging. In beide cellijnen nam het fosfocreatine niveau eerder af dan het ATP niveau na adriamycine toevoeging. De minder sterke toename van de
fosfocholine hoeveelheid en de toename in de glycerofosfocholine hoeveelheid in GLC4/ ADR cellen t.o.v. GLC4 suggereerde een verhoogd fosfolipide turnover in de resistente cellen.
Biochemische markers voor adriamycine-resistentie kunnen dus met NMR spectroscopie
ondekt worden. In hoofdstuk 4 wordt een literatuur overzicht gegeven van Topo I en II. Deze eiwitten
zijn betrokken bij de regulatie van de drie dimensionale structuur van het DNA en zijn belangrijk bij het hanteren van DNA tijdens vitale cellulaire processen zoals translatie, transcriptie en mitose. Cytostatica zoals anthracyclines (adriamycine), epipodophyllotoxines
(VM-26 en VP-16), acridines (m-AMSA) en ellipticines grijpen aan op Topo II. Het Topo II-DNA complex oftewel het splitsbaar complex, wat een normaal intermediair in de
katalytische reactie van het enzym is, wordt gestabiliseerd door deze cytostatica. Deze
toename in splitsbare complexen en niet de remming van de Topo II katalytische activiteit
leidt waarschijnlijk tot celdood. Resistentie tegen deze cytostatica kan veroorzaakt worden door een verlaging in de intracellulaire hoeveelheid Topo II of door een veranderd Topo II
dat minder gevoelig is voor deze cytostatica, maar dat nog wel dezelfde activiteit heeft.
Camptothecine en actinomycine D stabiliseren het Topo I-DNA complex, eveneens splitsbaar
complex genoemd, op dezelfde wijze als cytostatica bij Topo II. Resistentie tegen
camptothecine wordt veroorzaakt door een verlaagde hoeveelheid Topo I of door een
veranderd Topo I, dat minder gevoelig is voor dit cytostaticum. Meer kennis over het
werkingsmechanisme en de regulatie van topoisomerasen in de eel zou kunnen leiden tot
effectievere cytostatica en behandelingsschema's en tot het opheffen van resistentie.
In hoofdstuk 5 zijn de mechanismen, die betrokken zijn bij de adriamycine resistentie
161

van GLC4/ ADR, verder beschreven. Hoewel de accumulatie van cytostatica in GLC4/ ADR cellen verlaagd is, brengen deze cellen het 170 kD P-glycoproteine niet tot overexpressie en
heeft verapamil geen effect op de mate van resistentie. GLC4/ ADR was kruis-resistent tegen
VP-16, VM-26, m-AMSA en mitoxantrone. De Topo II katalytische activiteit en de vorming
van splitsbaar complexen o. i . v. cytostatica waren verlaagd in zout extracten van GLC4/ ADR, terwijl de Topo I katalytische activiteit gelijk was in beide cellijnen. De verlaagde Topo II
activiteit in GLC4/ ADR was niet gerelateerd aan veranderingen in de verdubbelingstijd of de celcyclus verdeling. Deze resultaten wijzen erop dat de resistentie tegen adriamycine van GLC4/ ADR gedeeltelijk veroorzaakt wordt doordat minder splitsbare complexen gevormd
kunnen worden.
Het grote verschil in resistentie tegen VM-26 en m-AMSA, respectievelijk 59.5 en 4. 1 maal, is onderzocht op het niveau van Topo II (hoofdstuk 6). De afname in door VM-26
en m-AMSA geinduceerde splitsbare complexen in hele cellen stond in verhouding tot de resistentie tegen deze cytostatica. In kemen van GLC4/ ADR werd evenwel eenzelfde verlaging in hoeveelheid splitsbare complexen gevonden met VM-26 als met m-AMSA. Een
deel van de resistentie tegen VM-26 wordt dan ook veroorzaakt door een cellulair
mechanisme, wat waarschijnlijk een verlaagde accumulatie van VM-26 in de resistente cellen is. Wanneer VM-26 verwijderd wordt uit het medium, verdwijnen de splitsbare complexen sneller in GLC4/ ADR cellen dan in GLC4 cellen, terwijl na incubatie met m-AMSA de
snelheid van verdwijning van de complexen gelijk was in beide cellijnen. De hoeveelheid splitsbare complexen bij hoge cytostatica concentraties in cellen en gelsoleerde kemen was
lager in GLC4/ ADR dan in GLC4 cellen. Deze resultaten zijn vergelijkbaar met de resultaten
van immunoblottings, die een verlaging van de hoeveelheid Topo II met een molecuul
gewicht van 170 kD in GLC4/ADR aangaven . Een Topo II met een molecuul gewicht van 1 80 kD was detecteerbaar in beide cellijnen. Topo II was waarschijnlijk niet veranderd in GLC4/ADR, omdat de ATP-afhankelijkheid van de Topo II katalytische activiteit en de vorming van splitsbare complexen door VM-26 en m-AMSA gelijk was in cellijnen, wanneer
dezelfde Topo II activiteiten werden gebruikt. Kruis-resistentie tegen m-AMSA wordt waarschijnlij k veroorzaakt door een verlaagde hoeveelheid Topo II met een molecuul gewicht
van 170 kD, terwijl andere mechanismen zoals een verlaagde accumulatie van cytostatica en
een snellere verdwijning van de complexen eveneens een rol spelen in de kruis-resistentie tegen VM-26.
Hoofdstuk 7 beschrijft de cytotoxiciteit van fostriecine in drie cellijnen met verschillende Topo II activiteiten, namelijk GLC4, GLC4/ ADR en GLC4/CDDP. Fostriecine behoort tot een nieuwe groep van cytostatica, die de Topo II katalytische activiteit remmen zonder stimulatie van de splitsbare complex formatie. Toenemende gevoeligheid tegen
fostriecine was gerelateerd aan afnemende Topo II katalytische activiteit, terwijl met VP-16
een tegenovergestelde relatie met de Topo II katalytische activiteit werd gevonden.
Resistentie tegen fostriecine correleerde niet met de resistentie tegen methotrexaat, hoewel
162

beide cytostatica door dezelfde transport syteem warden opgenomen in de eel. Zowel
GLC4/ ADR als GLC4/CDDP waren kruis-resistent tegen een camptothecine analoog, die de Topo I-DNA complex formatie stimuleert. Deze resultaten wijzen erop, dat er een omgekeerde relatie is tussen fostriecine gevoeligheid en de Topo II activiteit in een eel. Er
zijn echter meer studies nodig om deze relatie te kunnen bewijzen. Een fluorescentie assay met ethidium bromide is ontwikkeld om door CDDP
geinduceerde DNA interstrengs cross-links in cellen te detecteren (hoofdstuk 8). De assay
is gebaseerd op het verschil in fluorescentie tussen enkel- en dubbelstrengs DNA. DNA
interstrengs cross-links werden gemeten aan de hand van de fluorescentie van opnieuw gevormd dubbelstrengs DNA nadat eerst het DNA enkelstrengs is gemaakt door verwarming
bij een pH van 12. Hoe meer DNA interstrengs cross-links aanwezig waren hoe meer dubbelstrengs DNA weer gevormd kan warden na verwarming. Onder deze condities geeft enkelstrengs DNA zeer weinig fluorescentie. In muize Ehrlich Ascites tumorcellen correleerde het percentage DNA interstrengs cross-links met de CDDP concentratie, terwijl met GLC4 cellen een plateau werd bereikt met hogere CDDP concentraties. Toevoeging van RNase aan de cellysaten of !age hoeveelheden enkelstrengs breuken hadden geen effect op het percentage DNA interstrengs cross-links. Dezelfde resultaten werden verkregen met de alkalische elutie assay. Een voordeel van de ethidium bromide fluorescentie assay is dat deze
sneller en gemakkelijker is, terwijl bovendien geen radioactieve labelling van cellen nodig is, hetgeen een voordeel is bij langzaam groeiende humane tumor cellen en bij cellen in de
G0 fase. In hoofdstuk 9 is het effect van novobiocine, een remmer van de Topo II katalytische
activiteit, op de CDDP cytotoxiciteit en DNA interstrengs cross-links beschreven. Een korte incubatie met 200 µM novobiocine verhoogde de CDDP cytotoxiciteit en de DNA interstrengs cross-links in grotere mate in GLC4 dan in GLC4/CDDP cellen. De lagere
effectiviteit van novobiocine in GLC4/CDDP kan in verband staan met de verhoogde Topo
II katalytische activiteit in deze cellen. De hoeveelheid Topo II was echter gelijk in beide
cellijnen, hetgeen een toegenomen fosforylatie van Topo II suggereert in GLC4'CDDP,
waardoor het enzym actiever wordt in deze cellen. GLC4/CDDP was kruis-resistent tegen
stikstof mosterd en mitomycine C, die beide DNA interstrengs cross-links vormen, en tegen novobiocine maar was gevoeliger voor VP-16. Ondanks de gelijke katalytische activiteit en
hoeveelheid Topo I in de beide cellijnen, was GLC4/CDDP kruis-resistent tegen camptothecine. De chromatine structuur van GLC4/CDDP cellen is veranderd, aangezien de
gevoeligheid voor micrococcus nuclease digestie van de kemen was toegenomen en de
hoeveelheid van een 56 kD eiwit in kernen en kernmatrices verhoogd was t.o. v. GLC4• De
resistentie tegen CDDP wordt waarschijnlijk bepaald door meerdere factoren, waarbij de
toegenomen Topo II katalytische activiteit en de veranderde chromatine structuur suggereren,
dat de kemmatrix een rol zou kunnen spelen op het niveau van platinum adduct formatie.
Uit onze studies blijkt, dat remmers van het energie metabolisme effectief zijn in
163
humane kleincellige longcarcinoma cellijnen en dat antimitochondriele middelen zelfs
effectiever waren in GLC4/ ADR cellen. Deze middelen kunnen echter beter gebruikt worden
in combinatie met andere cytostatica door het remmen van de energie-afhankelijke reparatie
van DNA schade of van energie-afhankelijke resistentie mechanismen. De verlaagde
accumulatie van cytostatica in GLC4/ ADR en de toegenomen Topo II activiteit in
GLC4/CDDP kunnen zulke mechanismen zijn.
Verschillen in energie metabolisme in onbehandelde gevoelige- en adriamycine
resistente cellen werden niet ondekt met NMR spectroscopic. Dit kan komen door de
ongevoeligheid van de methode. Aan de andere kant kan de hoeveelheid metaboliet hetzelfde
zijn in beide cellijnen, terwijl de snelheid van energie aanmaak en verbruik wel verschillend
is. Deze snelheid kan bepaald worden m.b.v. [13C]-gelabelde componenten of een speciale
NMR techniek. De verschillende effecten van adriamycine op de energie metabolieten in
GLC4 en GLC4/ADR zou klinische relevantie kunnen hebben. Helaas is in tumoren in-vivo
het metabole stadium van een tumor een beslissende factor voor het effect van cytostatica op
energie metabolieten. Het systeem van de agarose geldraden kan gebruikt worden om deze
metabole stadia te simuleren in tumorcellen in relatie tot het effect van het cytostaticum. Een
andere mogelijkheid van dit systeem is de evaluatie van de werkzaamheid van remmers van
het energie metabolisme.
Een deel van de resistentie in GLC4/ ADR cellen werd veroorzaakt door de verlaagde
activiteit en hoeveelheid Topo II. Studies zijn nodig om te bepalen hoe deze cellen
opgewassen zijn tegen de verlaging van Topo II. Meer inzicht in de Topo II fosforylatie in
cellen, wat de enzym activiteit belnvloedt, is nodig om de functie van Topo II te correleren
met de cellulaire hoeveelheid van het enzym. Topo I kan de Topo II activiteit compenseren
en dus moet de fosforylatie van Topo I in cellen betrokken worden in zo'n studie. Het is
aannemelijk, dat meerdere typen Topo II bestaan, die verschillen in de manier van regulatie
en cytostatica gevoeligheid. Genetische analyses zijn nodig om de verlaging in Topo II te
verklaren en de verschillende typen Topo II aan te tonen. Deze Topo II verlaging in
GLC4/ ADR kan deze cellen gevoeliger maken voor sommige remmers van de Topo II katalytische activiteit zoals fostriecin. Een andere mogelijkheid om de resistentie op te heffen
zou de toepassing van groei-factoren kunnen zijn, die de intracellulaire hoeveelheid Topo II
kunnen verhogen.
Een antler deel van de adriamycine resistentie van GLC4/ ADR werd veroorzaakt door
een verlaagde accumulatie van adriamycine in deze cellen. De ATP afhankelijkheid van dit
mechanisme zou onderzocht moeten worden en m.b.v. labellings studies met ATP analogen
zouden de membraan eiwitten betrokken bij dit mechanisme aangetoond en gelsoleerd kunnen
worden. Een andere mogelijkheid is het maken van antilichamen tegen geisoleerde
membraanfragmenten om verschillen tussen GLC4 en GLC4/ ADR aan te tonen. Het relatieve
belang van de verlaagde cytostatica accumulatie dan we! de verlaagde Topo II hoeveelheid
bij lage niveaus van resistentie kan bepaald worden in laag resistente sublijnen van
164

GLC4/ ADR, die verkregen zijn tijdens �e ontwikkeling van GLC4/ ADR via stapsgewijze
verhoging van de concentratie adriamycine. Of Topo I en Topo II potentiele doelwitten voor
cytostatica in solide tumoren in-vivo kunnen zijn en of topoisomerasen betrokken zijn bij resistentie in deze tumoren wordt reeds onderzocht.
Novobiocine was minder effectief in GLC4/CDDP cellen wat gerelateerd zou kunnen zijn aan de verhoogde Topo II activiteit in deze cellen. Om de Topo II activiteit in GLC4 en GLC4/CDDP nauwkeuriger te bepalen, zou de Topo II fosforylatie en de regulatie daarvan
gemeten moeten worden, eventueel in de aanwezigheid van CDDP. De veranderde
chromatine structuur in GLC4/CDDP kan verder onderzocht worden door het 56 kD eiwit te isoleren en de DNA-bindende of de platinum-DNA adduct bindende capaciteit van het
eiwit te bepalen. Of een verhoogde reparatie van actieve genen betrokken is bij CDDP resistentie kan gemeten worden door te kijken naar het herstel van de mRNA expressie van bepaalde belangrijke genen na incubatie met CDDP. Remmers van de Topo II katalytische
activiteit zoals fostriecine en remmers van de Topo II fosforylatie zouden de CDDP resistentie effectiever kunnen opheffen.
Er is weinig bekend over de mechanismen, die betrokken zijn bij het proces van celdood na incubatie met adriamycine of CDDP. Meer kennis over dit proces zou nieuwe
resistentie mechanismen of mogelijkheden om de resistentie op te heffen kunnen opleveren.
Conclusies. In dit proefschrift worden de mechanismen betrokken bij resistentie en de mogelijkheden om die resistentie op te heffen beschreven. Een toegenomen gevoeligheid
voor mitochondriele remmers en een veranderd effect van adriamycine op het fosfolipide metabolisme is gevonden in the adriamycine-resistent cellijn GLC4/ ADR ten opzichte van de adriamycine-gevoelige cellijn GLC4. Deze resultaten zijn tegengesteld aan de resultaten, die
gevonden zijn in resistente cellijnen, die het P-glycoproteine verhoogd tot expressie brengen en die zeer resistent zijn tegen mitochondriele remmers. Ondanks de verlaagde adriamycinaccumulatie in GLC4/ ADR cellen is er geen verhoging van de P-glycoproteine expressie in
deze cellen en heeft verapamil geen effect op de resistentie. Er is dus een ander mechanisme
in deze cellen, dat het naar binnenlopen van adriamycine voorkomt dan wel het naar buitenpompen bevordert, maar dat minder effectief is voor mitochondriele remmers. Of de
mitochondrien en het fosfolipide metabolisme betrokken zijn bij de resistentie en of mitochondriele remmers ook effectiever zijn in andere atypische multidrug-resistente cellijnen
moet nog verder onderzocht worden . Hoewel wij een onderscheid konden maken tussen de
resistente en de gevoelige cellijn m.b.v. NMR spectroscopie zijn er meer studies met
resistente cellijnen nodig om resistentie-specifieke kenmerken te verkrijgen. De ongevoeligheid van NMR spectroscopie beperkt echter tot op heden de klinische toepassing
ervan.
Naast een verlaagde cytostatica-accumulatie wordt een deel van de adriamycine
resistentie van GLC4/ ADR veroorzaakt door een verlaging in de hoeveelheid en de
165
katalytische activiteit van cellulaire Topo II, waardoor minder cytostatica-geinduceerde
splitsbare complexen in deze cellen gevormd kunnen worden. Het verlies van Topo II katalytische activiteit wordt niet gecompenseerd door een toename in Topo I katalytische
activiteit. De hoge kruis-resistentie voor VM-26 en VP-16 wordt waarschijnlijk veroorzaakt door een verlaagde drug-accumulatie en een verlaging in de hoeveelheid Topo II, terwijl de geringe kruis-resistentie voor m-AMSA alleen wordt veroorzaakt door een verlaging in de hoeveelheid Topo IT. Er zijn geen aanwijzingen, dat in GLC4/ ADR cellen het Topo II veranderd is, waardoor het enzym minder gevoelig zou worden voor cytostatica. De verlaagde katalytische activiteit van Topo II zou de oorzaak kunnen voor de toegenomen
gevoeligheid van GLC4/ ADR cellen voor fostriecine, een remmer van de katalytische
activiteit van Topo II, in vergelijking met GLC4 cellen. Bovendien is een CDDP-resistente cellijn GLC4/CDDP met een verhoogde katalytische activiteit van Topo II minder gevoelig
voor fostriecine dan GLC4• De veranderde chromatine structuur en de toegenomen katalytische activiteit van Topo II zou erop kunnen wijzen, dat de nucleaire matrix een rol speelt bij de formatie van DNA interstrengs cross-links en andere platinum adducten. Helaas versterkte novobiocin, een remmer van de katalytische activiteit van Topo II, de cytotoxiciteit van CDDP in mindere mate in GLC4/CDDP dan in GLC4 cellen, wat een gevolg kan zijn van een verschil in Topo II fosforylatie. Resistentie voor adriamycine in humane kleincellige long carcinoma sublijnen wordt dus veroorzaakt door andere multifactoriele mechanismen dan de resistentie voor CDDP.
166

LIST OF ABBREVIATIONS
AEA,
CDDP,
DME,
DNP,
DPDE,
EB,
EFA,
EGTA,
FCS,
GPC,
GPE,
G6PD,
G6P,
hSCLC
ID50,
ISC,
kD
kDNA,
m-AMSA
MDR,
MTT
NH2,
NMR,
PBS,
PC,
PCr,
PDE,
PE,
Pi,
PME
PMSF,
RCR,
SDS,
Topo,
VM-26,
VP-16,
alkaline elution assay
cisplatin
Dulbecco's modified Eagle
2,4-dinitrophenol
diphosphodiesters
ethidium bromide
ethidium bromide fluorescence assay
ethylenebis (oxyethylenenitrilo) tetraacetic acid
fetal calf serum
glycerophosphocholine
gl ycerophosphoethanolamine
glucose-6-phosphate dehydrogenase
glucose-6-phosphate
human small cell lung cancer
drug dose required to induce 50% growth inhibition
interstrand cross-links
kilodalton
kinetoplast DNA
4' -(9-acridinylamino )-methanesulfon-m-aniside
multidrug resistance
3-(4,5-dimethylthiazol-2-yl) 2,5-diphenyltetrazolium bromide
nitrogen-mustard
nuclear magnetic resonance
phosphate-buffered saline (0. 14 M NaCl, 2.7 mM KC!, 6.4 mM Na2HP04
and 1 .5 mM KH2P04, pH 7.4)
phosphocholine
phosphocreatine
phosphodiesters
phosphoethanolamine
inorganic phosphate
phosphomonoesters
phenylmethanesulfonyl fluoride
respiratory control ratio
sodium dodecyl sulphate
DNA topoisomerase
teniposide
etoposide
167