Embed Size (px)
Citation preview
UNIVERSITY OF GHANA
PATIENTS SATISFACTION WITH QUALITY HEALTHCARE IN
GHANA: A COMPARATIVE STUDY BETWEEN UNIVERSITY OF
GHANA AND UNIVERSITY OF CAPE COAST HOSPITALS
BY
KOFI ADUO-ADJEI
(10443307)
THIS THESIS IS SUBMITTED TO UNIVERSITY OF GHANA, LEGON IN
PARTIAL FULFILMENT OF THE REQUIREMENT FOR THE AWARD
OF MPHIL IN HEALTH SERVICES MANAGEMENT DEGREE
JULY, 2015
University of Ghana http://ugspace.ug.edu.gh

i
DECLARATION
I here-by declare that this thesis is the result of my own original work and that no part of it has
been presented for another degree in this university or elsewhere.
……………………………… …………….........
KOFI ADUO-ADJEI DATE
(1044307)
University of Ghana http://ugspace.ug.edu.gh

ii
CERTIFICATION
I here-by declare that the preparation and presentation of the thesis was supervised in accordance
with the guidelines on supervision of thesis laid down by the University of Ghana.
……………..... ..……………......
DR. ALBERT AHENKAN DATE
(SUPERVISOR)
University of Ghana http://ugspace.ug.edu.gh

iii
DEDICATION
This research work is dedicated to my Late mother Mrs Beatrice Adjei and my father Pastor
Abraham Kwame Adjei.
University of Ghana http://ugspace.ug.edu.gh

iv
ACKNOWLEDGEMENT
It is said that „turtles advance only when they stick their necks out‟, a typical reality with respect
to this thesis. On my own, I could not have stuck my neck out without the support,
encouragement and mentoring of certain individuals. To that extent, I am exceptionally grateful
to my supervisor Dr. Albert Ahenkan, through whose motivation and good counsel, I have come
this far in my pursuit of knowledge.
I wish to acknowledge Professor Kwame Ameyaw Domfeh (UGBS), Professor Yaw Afari
Ankomah and Dr. Joshua Amo-Adjei respectively of University of Cape Coast for their
motivations and directives. My appreciation also goes to the Administrators of the University of
Ghana and the University of Cape Coast hospitals for their official permission and guide during
my data collection. Moreover, I am grateful to the patients of the above-mentioned hospitals for
their time and concern to respond to issues in my instrument.
To my siblings: Lydia and Faustina who served as positive models before me, they are ever
appreciated. Special gratitude goes to my father Pastor Abraham Kwame Adjei who sacrificed
his pension benefits to support my education. In the course of this thesis, I benefited from the
fruitful discussions and encouragements I often had with colleagues in the department,
particularly Odoom, Raymond, Charles, Richmond and my thanks to Carnegie writing centre for
editorial assistance. Finally, I wish to acknowledge Miss Mabel Owusuaa Asantewaa for her
emotional support, encouragement and prayers.
University of Ghana http://ugspace.ug.edu.gh

v
TABLE OF CONTENTS
Contents Page DECLARATION ..............................................................................................................................
CERTIFICATION .......................................................................................................................... ii
DEDICATION ............................................................................................................................... iii
ACKNOWLEDGEMENT ............................................................................................................. iv
TABLE OF CONTENTS ................................................................................................................ v
LIST OF TABLES ....................................................................................................................... viii
LIST OF FIGURES ....................................................................................................................... ix
LIST OF ABBREVIATIONS ......................................................................................................... x
ABSTRACT ................................................................................................................................... xi
CHAPTER ONE ............................................................................................................................. 1
1.0 INTRODUCTION .................................................................................................................... 1
1.1 Background to the Study ....................................................................................................... 1
1.1.2 Patient satisfaction with healthcare ................................................................................ 2
1.1.3 The context of patient satisfaction in quality healthcare delivery ................................. 4
1.2 Problem Statement ................................................................................................................ 6
1.3 Study Objectives ................................................................................................................... 9
1.3.1 General Objective .......................................................................................................... 9
1.3.2 Specific Objectives ........................................................................................................ 9
1.4 Hypotheses ............................................................................................................................ 9
1.5 Research Question .............................................................................................................. 10
1.6 Significance of the Study .................................................................................................... 10
1.8 Limitation of the Study ....................................................................................................... 11
1.9 Definition of Terms............................................................................................................. 11
1.10 Chapter Organization ........................................................................................................ 12
CHAPTER TWO .......................................................................................................................... 14
2.0 THEORETICAL FRAMEWORK AND LITERATURE REVIEW ...................................... 14
2.1Theoretical Evidence ........................................................................................................... 14
2.1.1 Service quality. ............................................................................................................ 14
2.1.2 Technical and functional quality model. ...................................................................... 16
2.1.4 Synthesized model of service quality .......................................................................... 21
2.1.5 Performance only model .............................................................................................. 22
University of Ghana http://ugspace.ug.edu.gh

vi
2.1.6 Ideal value model of service quality ............................................................................ 23
2.1.7 Model of perceived service quality and satisfaction .................................................... 24
2.1.7 Service quality, customer value and customer satisfaction model .............................. 25
2.1.8 Internal service quality model ...................................................................................... 26
2.1.9 (The Selected Model) SERVQUAL model ................................................................. 27
2.2 Patients satisfaction and quality healthcare in the context of Ghana. ............................. 30
2.3 Justification for the model selection ............................................................................... 31
2.3.2 Tenets to the Model ..................................................................................................... 34
2.4 Healthcare ........................................................................................................................... 35
2.5 Quality Healthcare .............................................................................................................. 35
2.6 Patient Satisfaction.............................................................................................................. 37
2.6.1 The historical context of patient satisfaction ............................................................... 38
2.7 Patients perception on constituents of service quality ........................................................ 42
2.8 Conclusion .......................................................................................................................... 43
CHAPTER THREE ...................................................................................................................... 45
3.0 METHODOLOGY ................................................................................................................. 45
3.1 Research Approach ............................................................................................................. 45
3.2 Study Design ....................................................................................................................... 45
3.3 Scope of the study ............................................................................................................... 46
3.4 Study Population ................................................................................................................. 47
3.5 Study Setting ....................................................................................................................... 47
3.6 Sampling ............................................................................................................................. 48
3.7 Data Collection Instruments ............................................................................................... 49
3.8 Sources of Data ................................................................................................................... 51
3.9 Data Analysis and Management ......................................................................................... 51
3.10 Pre- testing and Piloting of Instrument ............................................................................. 53
3.11 Ethical Consideration ........................................................................................................ 53
3.12 Field Experience ............................................................................................................... 54
CHAPTER FOUR ......................................................................................................................... 55
4.0 PRESENTATION AND ANALYSIS OF RESULTS ............................................................ 55
4.1 Socio-demographic characteristics ..................................................................................... 55
4.2 Dimensions of service quality and patient satisfaction ....................................................... 57
4.3 Predictors of service quality dimension on patent satisfaction ........................................... 59
4.4 Constituents of service quality ............................................................................................ 60
University of Ghana http://ugspace.ug.edu.gh

vii
4.5 Comparison of patient‟s perception on service quality....................................................... 62
CHAPTER FIVE .......................................................................................................................... 64
5.0 DISCUSSION OF RESULTS ................................................................................................ 64
5.1 Demographic Background .................................................................................................. 64
5.2 Predictors of service quality on Patient satisfaction ........................................................... 65
5.2.1 Empathy ....................................................................................................................... 66
5.2.2 Communication ............................................................................................................ 66
5.2.3 Culture.......................................................................................................................... 67
5.2.4 Tangibles .......................................................................................................................... 68
5.2.5 Priority ......................................................................................................................... 69
5.3 Constituent patients perception on quality healthcare ........................................................ 70
5.3.1 Timeliness .................................................................................................................... 70
5.3.2 Staff performance......................................................................................................... 71
5.3.3 Service Improvement ................................................................................................... 72
5.3.4 Satisfactory Services .................................................................................................... 72
5.4 Comparison of patient‟s perception on service quality of UGH and UCH ........................ 73
5.4.1 Empathy ....................................................................................................................... 73
5.4.2 Tangibles ...................................................................................................................... 74
5.4.3 Priority ......................................................................................................................... 75
5.5 Conclusion .......................................................................................................................... 75
CHAPTER SIX ............................................................................................................................. 77
6.0 SUMMARY, CONLCUSIONS AND RECOMMENDATIONS........................................... 77
6.1 Summary of main findings.................................................................................................. 77
6.2 Conclusion .......................................................................................................................... 78
6.3 Contribution to Knowledge................................................................................................. 79
6.4 Recommendation ................................................................................................................ 80
6.5 Limitations and opportunities for Future Research ............................................................ 80
REFERENCES ............................................................................................................................. 82
APPENDIX A: SAMPLE QUESTIONARIES AND IN-DEPTH INTERVIEW GUIDE ......... 110
APPENDIX B: ETHICAL CLEARANCE ................................................................................. 117
University of Ghana http://ugspace.ug.edu.gh

viii
LIST OF TABLES
Table 2.1: Synthesis of Quality Healthcare Models................................................................. 16
Table 4.1: Socio-demographic Characteristic.......................................................................... 56
Table 4.2: Dimension of Service quality on Patients Satisfaction.......................................... 58
Table 4.3: A multiple linear regression on dimension of service quality on
Satisfaction...............................................................................................................................
60
Table 4.4: An independent t-test comparing of perceptions patients service quality
dimensions that clearly predict patient‟s satisfaction of service at UGH and
UCH..........................................................................................................................................
63
University of Ghana http://ugspace.ug.edu.gh

ix
LIST OF FIGURES
Fig. 1.0: Conceptual Framework for measuring overall healthcare quality
adapted from the SERVQUAL Model..................................................................
33
University of Ghana http://ugspace.ug.edu.gh

x
LIST OF ABBREVIATIONS
BI Behaviour Intentions
CMS Centre for Medicare and Medicaid Services
CRHD Central Regional Health Directorate
ENT Ear and Nose Therapy
FA Factor Analysis
GHS Ghana Health Service
IOM Institute of Medicine
ISSER Institute of Social Statistics and Economic Research
MOH Ministry of Health
NHS National Health Service
OPD Out-Patients Department
OSQ Overall Service Quality
SERVPERF Service Performance
SERVQUAL Service Quality
SOP Standard of Operating Procedure
SPSS Statistical Package for Social Science
UCH University of Cape Coast Hospital
UGH University of Ghana Hospital
UK United Kingdom
WHO World Health Organisation
University of Ghana http://ugspace.ug.edu.gh

xi
ABSTRACT
Over the decades, Ghana‟s Ministry of Health has resolved to continuously improve the quality
of healthcare and to enhance clients/patients satisfaction in the most cost-effective manner in
Ghana. However, there are key challenges that confront the implementation of these objectives
in some hospitals, according to the Ghana Health Service 2010 (GHS) evaluation report of
patient‟s satisfaction with quality healthcare delivery. The purpose of this study was to examine
patient‟s satisfaction with quality healthcare in Ghana, comparing healthcare services at the
University of Ghana and the University of Cape Coast hospital.
A modified version of the SERVQUAL model was used as the data collection instruments,
which was administered to a sample of 218 patients receiving healthcare at the OPD of the two
university hospitals. A principal component analysis, multiple linear regression, independent
Ttest and a manual thematic analysis were used in the data presentation and analysis.
The results show that empathy, communication, culture, tangibles and priority are key predictors
of patients‟ satisfaction with quality healthcare. More so, in some interviews, the patients noted
that timeliness, staff performance, service improvement and satisfactory services are relevant for
ensuring service quality to patients at the hospital. A comparative analysis revealed that
empathy, tangibles and priority were dimensions of service quality that pose a difference in
healthcare delivery at the two-university hospital.
The author recommends that the university hospital management should develop policies based
on the communication, empathy, culture, tangibles, and priority, which will ensure the patients‟
satisfaction with quality healthcare.
University of Ghana http://ugspace.ug.edu.gh

1
CHAPTER ONE
1.0 INTRODUCTION
Introduction
This chapter presents the background to the study, statement of the research problem, research
objectives and research questions. The chapter further discusses the significance, the scope,
limitations as well as the chapter organization of the study.
1.1 Background to the Study
In recent years, findings in developed countries on quality healthcare delivery have increasingly
influenced developing nations in assessing the quality of their healthcare systems. Outcomes
have received special prominence as a measure of quality healthcare (WHO, 2012). Assessing
outcomes has merit both as an indicator for the effectiveness of different health interventions and
as part of a monitoring system directed to improve the quality of care as well as to detect its
deterioration (Epstein, 1990; Blumenfeld, 1993). Quality assessment studies over the decades
usually measure one of three types of outcomes thus costs, medical outcomes and patients
satisfaction (Turkson, 2009; Aldana et al, 2012).
Studies in healthcare have indicated that patients satisfaction has gained greater importance,
specifically in developing countries. It is both a service quality indicator and a quality
component. Strong healthcare systems enable healthcare providers to deliver better quality and
value to patients (Radhika et al, 2007; Camgoz-Akdag & Zineldin, 2010). Again, patient
satisfaction has become the latest trend of study. It has been realized, that in order to have a
better competitive advantage or best practice in the healthcare industry, the perception of patients
for quality has to be measured deeply and the quality strategies should be set as priority by
management of healthcare facilities (Camgoz-Akdag & Zineldin, 2010).
University of Ghana http://ugspace.ug.edu.gh

2
According to WHO (2014), good service delivery is a pivotal element of any health system and
is crucial to the achievement of health-related Millennium Development Goals. Therefore,
service delivery is a necessary input to population health status, coupled with other factors,
including social determinants of health. However, the preciseness of an organization and the
content of health services differ from one country to another, thus in any well-functioning health
system, the network of service delivery and provision should be characterized by the following:
comprehensiveness, accessibility, continuity, co-ordination and efficiency. This signifies a
systematic approach to health services organization in which the primary level is usually in the
context of a local health system, which acts as a driver for the healthcare delivery system as a
whole.
1.1.2 Patient satisfaction with healthcare
The perspective of the patient‟s view is becoming more integrated in the process of improving
healthcare systems. Patient satisfaction is the level of contentment that patients experience
having used a service (MOH, 2007). More so, patient care is the primary function of every
hospital (GHS, 2010). It is one of the yardsticks to measure the effectiveness, where
effectiveness of a hospital is related to the provision of quality care. Swamy (1997) indicates that
patient satisfaction is the real testimony to the efficiency of hospital administration. As a hospital
serves all the members of the society, the expectations of users differ from one individual to
another because everyone carries a particular set of thoughts, feelings and needs. Hence, the
determination of a patient‟s real feeling is very difficult to measure. Notwithstanding, it is the
responsibility of hospital staff to create a conducive environment that will make the patient
comfortable in receiving care (Wensing et al, 2012).
University of Ghana http://ugspace.ug.edu.gh

3
Generally, patient satisfaction is defined as the patient‟s view of services received and the results
of the treatment (Kleinman, 2012). Some programme evaluators used service quality to enhance
the healthcare provider‟s ability to render services that meet the patient‟s need. There is a
uniform acknowledgement by society on the importance of the views of users in assessing
services. The healthcare sector has used range of methods to identify the views of patients.
Dansky and Milles (2007) state that from a management perspective, patient satisfaction with
healthcare is important for various reasons. First, satisfied patients are more likely to maintain a
consistent relationship with a specific provider. Second, by identifying sources of patient
satisfaction, an organization can address system weaknesses, thus improving its risk
management. Third, satisfied patients are more likely to follow specific medical regimens and
treatment plans. Patient satisfaction measurement adds to important information on system
performance, thus contributes to the organizations total performance index.
Moreover, patient satisfaction measures the gap between the service expected and experienced
from the patient‟s perspective. It has become an instrumental part of the hospital/clinic
management strategies across the globe. Moreso, the quality assurance and accreditation process
in most countries require that the satisfaction of patients be measured on a regular basis (Fekadu
et al, 2011). Competitiveness among healthcare organizations depends on patients‟ satisfaction,
which is created by responding to patient views and needs (Zineldin, 2006).
There is an increasing need to improve quality in healthcare delivery. A study by Brent et al.,
(2013), indicates that the Centres for Medicare and Medicaid Services (CMS), hospitals, and
insurance providers alike are striving to better define and measure quality of healthcare. A major
component of quality of healthcare is patient satisfaction. They further indicate that patient
satisfaction is critical to how well patients do; research has identified a clear link between patient
University of Ghana http://ugspace.ug.edu.gh
4
outcomes and service quality. Baltussen et al (2002) indicates that from the patient‟s perspective,
the supply of drugs is a very vital determinant for the utilization of health service and healthcare
quality in Burkina Faso.
In Ghana, the Ministry of Health in their five-year programme of work indicated that the
patient‟s satisfaction is prime to health service delivery and quality care (MOH, 2006). The
Ministry further identified that improving patient satisfaction and the quality of healthcare is one
of its five key objectives of the health sector reforms in Ghana. Again, Turkson (2009),
envisages that patients‟ satisfaction and quality of care might be improved through paying more
attention to the perspectives of the patient, improving the competencies and skills of providers
and improving the working environment by better management, provision of medical equipment,
supplies and motivation of staff (Fekadu, 2011).
1.1.3 The context of patient satisfaction in quality healthcare delivery
Service quality is the pivotal force for business sustainability (Carlzon, 1987; Kumasey, 2014) in
today‟s competitive global marketplace. Moreover, it is recognized that high quality service is
instrumental for the success of the firm/industry (Rust and Oliver, 1994), when other factors
have been considered, it leads to customer loyalty (Lewis, 1994) and higher profitability
(Gundersen et al., 1996). Therefore, it is a key strategy for customer-focused firms to measure
and monitor customer satisfaction.In the healthcare literature, different hospitals provide the
same type of services, but they do not provide the same quality of services (Youseff et al., 1996;
Lichtenberg, 2010; Yousapronpaiboon and Johnson, 2013). The quality of service, both technical
and functional, is a key ingredient in the success of service organizations (Gronroos, 1984). In
addition, customers today are more aware of alternatives being offered and rising standards of
service. Over the years, these changes have increased their expectations (Lim & Tang, 2000),
University of Ghana http://ugspace.ug.edu.gh

5
coupled with the pressure of competition and the increasing necessity to deliver to the
satisfaction of patients. Therefore, the elements of quality control, quality service and
effectiveness of medical treatment have become vitally important (Friedenberg, 1997). Many
service providers, with help from the research community, are beginning to realize that ensuring
customer satisfaction is a key element in their marketing strategy and a crucial determinant of
long-term viability and success (Andaleeb, 1998). Quality healthcare is difficult to measure
owing to its inherent intangibility, heterogeneity and inseparability features (Conway &
Willcocks, 1997). Butler et al. (1996) reiterate Zeithaml (1981, pp. 186-190) that patients‟
participating in production, performance and quality evaluations are affected by their actions,
moods and cooperativeness. Healthcare is dynamic, considerable and the competition is
increasing with time dimension as an influencing factor (Gilbert et al., 1992).
Some previous studies have indicated that service quality and satisfaction are distinct constructs
in healthcare (Bitner, 1990; Aldana et al, 2001; Adrienne & Sinclair, 2002). Patient‟s satisfaction
is influenced by two factors such as experience and expectations with service performance (Yin,
1990). Crosby et al., (1990), demonstrate that the decisions to have a continuing relationship
with the service provider is influenced by customer‟s past satisfaction. Again, a satisfied
customer/client tends to maintain their consumption pattern and will consume similar healthcare
products or services. Thus, patient satisfaction has become an important indicator of quality and
future revenue (Fornel, 1992; Andreassen, 1994). The healthcare delivery system in many
developing countries are facing major challenges of quality care, however, Ghana faces three
major challenges: improving quality, increasing access, and reducing costs (Owusu-Frimpong et
al, 2010).
University of Ghana http://ugspace.ug.edu.gh

6
Over the years, the Ministry of Health (MOH) in Ghana has been concerned about quality of
care, which has a strong resultant effect on client satisfaction, but the pace of improvements in
the quality of care has been slow, partially because quality improvement activities have received
inadequate priority. However, there have been efforts to research into quality of healthcare
service, which has patient satisfaction as an indicator and institutionalization of quality assurance
in Ghanaian health facilities (GHS, 2010). These were initiated through a project from 1993-
1996 and then from 1998-1999 in the Upper West Region and in some facilities in the Eastern
and Volta Regions as a result of complaints about the quality of care given by health workers and
the level of satisfaction of patients. Poor quality of healthcare, and for that matter, low client
satisfaction result in loss of patients‟ lives, revenue, material resources, time, morale, staff,
recognition, trust and respect as well as individuals‟ and communities‟ apathy towards the health
services, all of which contribute to lowered effectiveness and efficiency in the Ghanaian
healthcare system (Turkson, 2009).
1.2 Problem Statement
Until recently, the establishment of quality standards was delegated to the medical profession.
Not surprisingly, quality is defined in terms of technical delivery of care by clinicians (Bara et al.
2012). Analeeb (2001) reveals that the recent literature (in the developed countries) emphasizes
the importance of the patient‟s perspective. However, hospital administrators, insurance
companies, community groups and researchers have all begun to recognize the value of the
insights that patients can provide (Shewchuk & Carney, 1994; Analeeb, 2001; Turkson, 2009;
WHO, 2013).
In assessing healthcare service quality, criteria such as technical, functional (Babakus &
Mangold, 1992; Hasen et al, 2008) or technical and process-related (Zeithaml & Bitner, 2000)
University of Ghana http://ugspace.ug.edu.gh

7
should be applied. Weitzman (1995) suggests that quality healthcare can be defined in
relationship to (1) the technical aspects of care, (2) the interpersonal relationship between
practitioner and patient, and (3) the amenities of care. If patient-centred evaluations are to be
effectively used, especially in a technically complex sector such as healthcare that reflects
credence-based services, (i.e., services that are difficult to evaluate by the patient), it may be
unreasonable to expect patients to provide quality ratings based on technical merits of the
service. Instead, subjective criteria must be used, understood, and translated into objective
performance parameters. For developing countries, using any such criteria to assess service
quality introduces additional challenges given the inadequate research and the variety of
contextual factors that must be better understood (Best & Neuhauser, 2011). The sparse literature
on the measurement of quality healthcare service in Ghana and in other developing countries has
warranted this study.
Research on patient satisfaction with quality healthcare can be traced to the late 20th
century.
During this era the focus of most publications was on patient satisfaction as a condition to be
satisfied in order to reach desirable clinical outcomes (Andaleeb, 1998).
Aldana et al (2001), studied client expectation, degree of satisfaction and quality healthcare
provided in rural Bangladesh. A total of 1,913 persons chosen by a systematic random sampling
were successfully interviewed immediately after having received care in government health
facilities. The findings indicated that the most powerful predictor for client satisfaction with the
government services was provider behaviour, especially respect and politeness. Furthermore, a
reduction in waiting time (on average to 30min) was more important to clients than a
prolongation of the quite short (from a medical standpoint) consultation time (on average 2
minutes, 22 seconds), it further indicated that 75% of clients were being satisfied.
University of Ghana http://ugspace.ug.edu.gh

8
Moreover, factors affecting patient satisfaction and healthcare quality were also studied which
brought out some immediate factors that ensure client satisfaction (Zeithaml & Bitner, 2000;
Tucker & Adams, 2001; Naidu, 2007). However, Zineldin et al., (2006), examined major factors
affecting satisfaction and addressed the question whether patients in Kazakhstan evaluate
healthcare similarly or differently from patients in Egypt and Jordan.
Again, extant studies have been done on service quality and patient satisfaction in a comparative
approach of private and public hospitals (Leatherman & Sutherland, 2003; Bradshaw &
Bradshaw, 2004; Hansen et al, 2008; Owusu-Frimpong et al, 2010). However, empirical
literature indicates that little has been done on perception of patients on quality of service by
hospitals (Duggirala et al, 2010; Suki et al, 2011).
In Ghana, many of the studies on healthcare quality have often focused on the quality award
dimensions (GHS, 2003; Osei et al., 2005; MOH, 2007b; Atinga et al, 2011). Studies conducted
in public hospitals over the years provide substantive evidence that the quality of health services
is inadequate both by objective measures in the opinion of patients and by healthcare providers
(GHS, 2008; MOH, 2007b). Moreover, research on quality healthcare has generally reported
poor service delivery with respect to long waiting time, a frequent shortage of drugs and the poor
attitude of health providers as factors militating against patients‟ satisfaction with quality
healthcare in Ghana (Turkson, 2009; Atinga et al, 2011). In view of this, the continuous
monitoring and evaluation of the policyholder‟s views on the quality of healthcare is necessary
for quality improvement purposes, which will provide some kind of feedback to health
professionals and policy makers (Bara et al., 2012). An extensive empirical search revealed that
a single study has been conducted on patients‟ satisfaction with quality healthcare in a
University of Ghana http://ugspace.ug.edu.gh
9
comparative approach with focus on institutional facilities (University hospitals) in Ghana
(Esiam, 2013). The novelty of this study is to assess patient‟s satisfaction with the university
health service (university hospital), which is emergent in healthcare provision in Ghana. In this
regard the purpose of this study is to examine patient‟s satisfaction with quality healthcare in
Ghana, a comparative study between the University of Ghana and University of Cape Coast
hospitals.
1.3 Study Objectives
1.3.1 General Objective
The main objective of the study is to examine the patient‟s satisfaction with quality healthcare in
Ghana, a comparative analysis of the University of Ghana and the University of Cape Coast
hospitals.
1.3.2 Specific Objectives
1. To assess key service quality dimensions that are good predictors of patient‟s satisfaction.
2. To determine the patient‟s perception on what constitute service quality in the two
hospitals.
3. To compare patient perceptions of service quality dimensions at the two University
Hospitals.
1.4 Hypotheses
1. Ha: Communication is a significant predictor of Patients satisfaction
H0: Communication is not a significant predictor of Patients satisfaction
2. Ha: Empathy is a significant predictor of Patients satisfaction
H0: Empathy is not a significant predictor of Patients satisfaction
3. Ha: Priority is significant predictor of Patients satisfaction
University of Ghana http://ugspace.ug.edu.gh

10
H0: Priority is not a significant predictor of Patients satisfaction
4. Ha: Tangibles is significant predictor of Patients satisfaction
H0: Tangibles is not a significant predictor of Patients satisfaction
5. Ha: Culture is significant predictor of Patients satisfaction
H0: Culture is not a significant predictor of Patients satisfaction
1.5 Research Question
1. What constitutes perception of service quality among patients in the two university
hospital?
1.6 Significance of the Study
The quality of service has a very strong significant influence on the patient‟s overall perception
of quality care delivery. Service quality offers a healing environment where the patient is more
likely to continue utilizing services provided by the provider (Fottler et al., 2002; Atinga et al
2011). Many studies on patient satisfaction with quality of care often place emphasis on
communication, provider courtesy, support/care, environment of the facility and waiting time as
important tools in measuring quality care. In recent times, many writers of service quality have
been concerned with the nature and trend of customer-service provider relationship (Turner,
2011; Atinga et al, 2011; Steinwach & Hughes, 2012; Peprah, 2014;). This study reveals to
service providers of the two institutional facilities the functional quality of their services, that is,
it shows the patients‟ views of the quality of care they are receiving. This is important because
even the best technical competence is worthless if it does not satisfy patients (Bielen &
Demoulin, 2007). By understanding and documenting the patent‟s views, providers will be more
aware of what is required of them.
University of Ghana http://ugspace.ug.edu.gh

11
The study also identifies the dimensions of service quality that are rated worst by the patients,
thus indicating areas in which the service providers have weaknesses and the need to improve
dimensions that are more highly rated.
Again, this study also emphasizes in which areas of service quality dimensions the two facilities
differ, so that management and service providers can learn from each other‟s experiences and
this will further provide a model that will be a working plan which will serve as a baseline policy
for service delivery in institutional hospital facilities since it presents dynamics quite different
from purely public and private health facilities.
The study contributes to health policy-making by documenting good practices to help hospital
policy-makers pick out and apply lessons learned, to ensure a successful strategy of patient‟s
satisfaction in all form of health service delivery.
Finally, it also adds to existing literature on patient‟s satisfaction and quality healthcare as well
as the pool of knowledge on the healthcare literature (Baker et al, 2008).
1.8 Limitation of the Study
Despite its significance, the study has some limitations. First, the researcher could not interview
all the targeted patients. This was due to difficulty in getting to them for an interview. Second,
due to time and resource constraints, the study could not be carried out in other university
hospitals in Ghana. However, the limitations mentioned did not affect the results of the study in
anyway.
1.9 Definition of Terms
Patients: refers to people waiting at Out-patient-Department of the various units in the hospitals.
University of Ghana http://ugspace.ug.edu.gh

12
Satisfaction: is defined as the patient‟s experiences of services provided at the various hospitals.
Quality: refers to the patient‟s acceptable standards of care delivered to them at the various
facilities.
Healthcare: refers service provision (delivery) to patients at the hospitals.
Dimension: Key service quality elements that predicts patient‟s satisfaction.
Tangibles: indicates the physical surrounding of the hospitals understudy.
Responsiveness: refers to the willingness of the staff to help patients and provide prompt
healthcare service.
Reliability: refers to the ability of staff to provide service dependably.
Empathy: the caring attitude staff to patients at the hospital.
Culture: refers the language and religious barriers in healthcare delivery.
Assurance: refers to the knowledge and courtesy as well as the trust of staff to patients‟.
Communication: this indicates the provider patients‟ interaction.
Priority: this dimension indicates how university staff are prioritize in health service provision
Affordability and Accessibility: this indicated the availability of the healthcare service in terms
of financial access and proximity of facility to patients.
1.10 Chapter Organization
Chapter one introduces the entire study, beginning with a general background to the study,
patient‟s satisfaction and quality healthcare. It covers the problem statement, objectives and
research questions. This chapter also discusses the significance of study and the chapter
dispositions of the study.
The second chapter of the study focuses on the discussion of theories relevant to patient‟s
satisfaction and quality healthcare. An eclectic review of relevant empirical literature is also
University of Ghana http://ugspace.ug.edu.gh
13
contained in this chapter. The literature review conducted was based on the objectives of the
study and this enabled the study to be grounded on empirical evidence in the literature so that
cogent findings and conclusion were drawn based on the stands of existing literature.
In Chapter three, the researcher discusses the research methodology of the study. Again, this
chapter explains and justifies the research paradigm under which the methods for the study were
selected. It also covers sources of data, sampling techniques and the instrumentation, the study
population and the scope of the study are explained in addition to the data gathering procedure
and ethical considerations. This methodological chapter indicates the appropriateness of the
methods to ensure a systematic approach that a scientific study of this calibre demands.
Chapter four presents findings together with the discussions; this enables readers to follow the
connection between the objectives of the study and research questions, the literature review,
theoretical framework and the responses from respondents. More so, the prominent factors that
affect quality healthcare and these are made clear with the regression model.
The Chapter five of the study summarizes and concludes the entire study. The necessary
recommendations are made to inform policy action and directives to ensure quality healthcare in
Ghana.
University of Ghana http://ugspace.ug.edu.gh

14
CHAPTER TWO
2.0 THEORETICAL FRAMEWORK AND LITERATURE REVIEW
Introduction
This chapter discusses theories in service quality that informed the conceptual basis for the
framework of the study. It also contains review of empirical literature relevant to the study. This
chapter has two main parts; the first part examines theoretical and the model foundations of the
study as well as the selected model. The second part reviews empirical literature in accordance
with the objectives of the study. This is to enable the researcher to meaningfully connect findings
in the empirical literature to the findings from the field, in order to draw conclusions for the
study. The overarching themes of the literature review are: the concept of service quality, the
dimension of the service quality in relation to patient satisfaction and many more.
2.1Theoretical Evidence
In this section, the theoretical foundation for the study is laid in order to give an empirical theory
base for the study.
2.1.1 Service quality
Firms, industries and hospitals provide services in order to reach customers with the needed
products and services. However, Kotler and Keller (2009), define service as „any intangible act
or performance that one party offers to another that does not result in the ownership of anything‟.
The service provided can be a tangible and an intangible offer by one party to another in
exchange of money for pleasure and satisfaction.
Quality is an ideal characteristic that consumers look for in any service transaction and product
sale (Solomon, 2009). Quality is also defined as „the totality of features and characteristics of a
product or services that bear on its ability to satisfy stated or implied needs‟ (Kotler et al., 2002).
University of Ghana http://ugspace.ug.edu.gh
15
Service quality in the management and marketing literature is defined as the extent to which
customers' perceptions of service meet and/or exceed their expectations (Zeithaml et al. (1990)
cited in Bowen and David, 2005, p. 340). Thus service quality can intend to be the way in which
customers are served in an organization that could be good or poor. According to Parasuraman
(1988), service quality is defined as the differences between customer expectations and
perceptions of service. Again, he argues that in measuring service quality, the difference between
perceived and expected service is a valid way that could make management identify gaps in what
they offer as services. The overarching aim of providing quality services is to satisfy customers.
Thus measuring service quality is a better way to dictate whether the services are good or bad
and whether the customers will be or are satisfied with it. Furthermore, Haywood (1988) lists in
his study: „three main components of service quality, called the 3 “Ps” of service quality‟
(Physical facilities on processes and procedures, Personal behaviour on the part of serving staff,
and Professional judgment on the part of serving staff) (Nitin et al, 2005; Gunawardane, 2011).
There are extant theories/models used in the studies on service quality which is applied to
different field of study ranging from healthcare, corporate business, education, banking,
telecommunication. A further empirical synthesis reveals that nine of these models have been
used predominantly in the study of quality healthcare and these models are tabulated below.
University of Ghana http://ugspace.ug.edu.gh
16
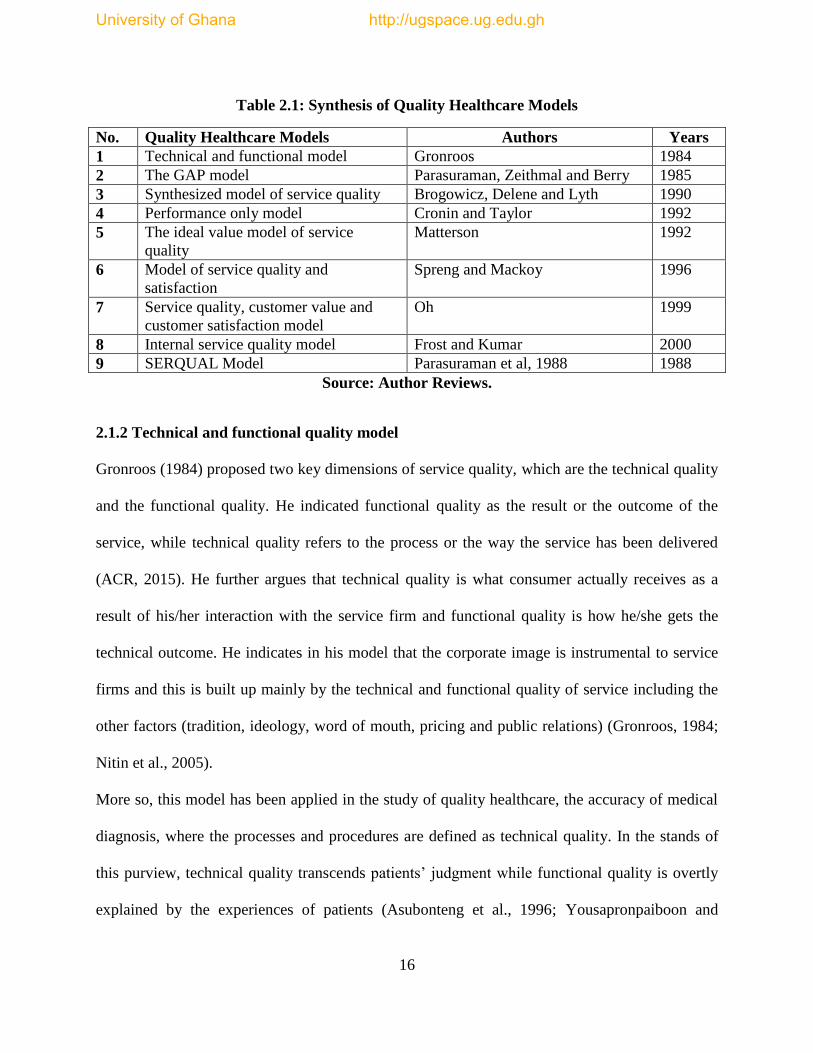
Table 2.1: Synthesis of Quality Healthcare Models
No. Quality Healthcare Models Authors Years
1 Technical and functional model Gronroos 1984
2 The GAP model Parasuraman, Zeithmal and Berry 1985
3 Synthesized model of service quality Brogowicz, Delene and Lyth 1990
4 Performance only model Cronin and Taylor 1992
5 The ideal value model of service
quality
Matterson 1992
6 Model of service quality and
satisfaction
Spreng and Mackoy 1996
7 Service quality, customer value and
customer satisfaction model
Oh 1999
8 Internal service quality model Frost and Kumar 2000
9 SERQUAL Model Parasuraman et al, 1988 1988
Source: Author Reviews.
2.1.2 Technical and functional quality model
Gronroos (1984) proposed two key dimensions of service quality, which are the technical quality
and the functional quality. He indicated functional quality as the result or the outcome of the
service, while technical quality refers to the process or the way the service has been delivered
(ACR, 2015). He further argues that technical quality is what consumer actually receives as a
result of his/her interaction with the service firm and functional quality is how he/she gets the
technical outcome. He indicates in his model that the corporate image is instrumental to service
firms and this is built up mainly by the technical and functional quality of service including the
other factors (tradition, ideology, word of mouth, pricing and public relations) (Gronroos, 1984;
Nitin et al., 2005).
More so, this model has been applied in the study of quality healthcare, the accuracy of medical
diagnosis, where the processes and procedures are defined as technical quality. In the stands of
this purview, technical quality transcends patients‟ judgment while functional quality is overtly
explained by the experiences of patients (Asubonteng et al., 1996; Yousapronpaiboon and
University of Ghana http://ugspace.ug.edu.gh

17
Johnson, 2013). However, some studies have indicated that most clients are not able to make
justifiable assessment of the technical quality due to their lack of general technical knowledge on
attributes (empathy, reliability, affordability and responsiveness etc) primary used in the
evaluation of health service quality (Wiesniewski & Wiesniewski, 2005, Devebakan, 2005;
Atinga et al, 2011). In spite of the popularity of the technical and functional quality models, it
does not ensure effective representation of all views of patients; this led to the development of
the GAP model (James, 2004; Bart Lariviere, 2014).
2.1.3 The GAP model
Parasuraman, Zeithaml and Berry (1985) propose that service quality is a key function of the
differences between expectation and perception along the quality dimension. This model was
developed based on a gap analysis. The various gaps in the model are visualized as:
i. Gap1: Difference between consumers‟ expectation and management‟s perceptions of those
expectations, thus not knowing what consumers expect (Parasuraman et al., 1985; Nitin et al.,
2005; Gunawardane, 2011).
ii. Gap2: Difference between management‟s perceptions of consumer‟s expectations and service
quality specifications, thus improper service-quality standards (Dabholker et 2000, Drain, 2001).
iii. Gap3: Difference between service quality specifications and service actually delivered, that is
the service performance gap (Groonroos 1984; Matterson, 1992; Nitin et al., 2005).
iv. Gap4: Difference between service delivery and the communications to consumers about
service delivery, thus whether promises match delivery (Parasuraman et al., 1988; Groonroos,
1984; Nitin et al., 2005).
University of Ghana http://ugspace.ug.edu.gh

18
v. Gap5: Difference between consumer‟s expectation and perceived service. This gap depends on
the size and direction of the four gaps associated with the delivery of service quality on the
marketer‟s side (Parasuraman et al., 1988; Nitin et al., 2005).
Based on this model, service quality is a function between perception and expectation. They
further refine their subsequent scale named SERVQUAL for measuring customers‟ perceptions
of service quality (Parasuraman et al., 1988; Nitin et al., 2005). In this study, the original ten
dimensions of service quality are collapsed in to five dimensions: reliability, responsiveness,
tangibles, assurance (communication, competence, credibility, courtesy, security) and empathy,
which captures access and understanding/knowing the customers. In 1991, the SERVQUAL
model was revised with the focus of replacing „should‟ word by „would‟ and by reducing the
total number of items to 21 in their 1994 study; however, the five dimensional structures remain
the same. Furthermore, in this empirical research, the authors characterized and further
delineated the four gaps identified in their research of 1985. This resulted in the extended service
quality model; in this extended model most factors involve communication and control process,
which was implemented in organizations to manage employees (Nitin et al, 2005; Frost &
Kumar, 2000).
The Parasuraman et al., (1988) model was used in the study of service quality in the healthcare
industry (Rose et al., 2004; Taner & Antony, 2006; Saunders et al, 2009; Peprah, 2013). In a
study by Pena et al, (2013) aimed at studying the quality in health services with the objective to
measure the satisfaction of users, adopted the parasuraman et al, (1985) Gap Model. This
theoretical model was based on the analysis of perceptions and expectations of users of health
services, based on the five dimensions: reliability, responsiveness, tangibility, empathy and
assurance (Gonclaves et al., 2014). The study further indicated the difference between the
University of Ghana http://ugspace.ug.edu.gh
19
expected service and the received service. Gaps or shortcomings were derived that may be the
main obstacles for users to perceive the provision of such services with quality. It was realized,
by the use of the psychometric scale called Service Quality (SERVQUAL) in some studies about
patient‟s satisfaction, very interesting results were obtained in the institutions in which it was
employed. Furthermore, the findings revealed the essence of improving existing models of
service evaluation and the importance of measuring patients‟ satisfaction with services of health
institutions (Parasuraman et al,1985; Babakus & Mangold, 1992; Goncalves, 2014).
Again, a study by Owusu-Frimpong et al (2010) studied patients' satisfaction with access to
private and public healthcare centres in London. The findings indicated that public patients were
dissatisfied with the service climate factors as opposed to private counterparts (Kumaraswamy,
2012; Ramez, 2012). Generally, the study resolved that users of both public and private
healthcare are faced with major problems in accessing healthcare. However, a study by
Wisniewski and Wisniewski (2005) applied a modified SERVQUAL instrument, consisting of
19 variables, for a colonoscopy clinic in Scotland. The study resolved that even though patient
overall satisfaction with the services was high, improvements were needed in specific
dimensions of service, especially the reliability dimension (Ramez, 2012).
However, aside the fact that the SERVQUAL model (Parasuraman et al., 1985,1988, 1991) was
applicable in most fields of studies, it has been criticized by some authors (Ramez, 2012). These
criticisms are based on its conceptual and operational aspects. In their work, they proposed a
SERVQUAL model based on the theory of conformation/disconfirmation, however, a number of
researchers in marketing argued that both disconfirmation theory and the expectation scores have
any substantial effect on customer satisfaction, (Carman, 1990; Cronin & Taylor, 1994; Teas,
1994; Buttle, 1996; Sharma & Gupta, 2004; Nai-Hwa et al., 2008). In contrast, the perception
University of Ghana http://ugspace.ug.edu.gh

20
scores (SERVPERF) have been extensively recommended for measuring service quality as it has
a higher predictive validity of customers' satisfaction, (Cronin & Taylor, 1992; Babakus &
Mangold, 1992; Cadott et al, 1987; Lee et al, 2000; Luk & Layton, 2004; Sharma & Gupta,
2004; Baumann, et al, 2007; Ramez, 2012; Kumaraswamy, 2012).
Furthermore, some researchers have questioned the dimensionality and universality of the
SERVQUAL model. It is further argued that the instrument could not be a generic measure for
all service industries. However, it needs to be customized to fit the nature of a specific service or
a specific nation (Carman, 1990; Babakus & Mangold, 1992; Buttle, 1996; Mels et al., 1997;
Andaleeb, 2001; Ramez, 2012; Kumaraswamy, 2012). On health service, Piligrimiene and
Buciuniene (2005) note that the dimensions for measuring the quality of healthcare are proposed
by various researchers. Coulthard (2004), in his study offered a comprehensive synthesis for the
service quality researches since 1998. She further resolved that extant research is needed to
control or inhibit the methodological, interpretative and conceptual biases of SERVQUAL
instrument (Sharma & Gupta, 2004; Kumaraswamy, 2012).
Amidst the criticism of the validity and reliability of the SERVQUAL instrument, it is argued
that it remains a vital model for measuring service quality (Buttle, 1996; Kumaraswamy, 2012).
With respect to quality healthcare delivery, Babakus and Mangold (1992), reached the similar
conclusion and indicated that the SERVQUAL model, is a standard instrument for measuring
functional quality, which is reliable and valid for the hospital environment and variety of other
service industries (Nitin et al, 2005; Sharma & Gupta, 2004; Kumaraswamy, 2012; Ramez,
2012; Bart Lariviere, 2014).
University of Ghana http://ugspace.ug.edu.gh

21
2.1.4 Synthesized model of service quality
Brogowicz, Delene and Lyth (1990), added to the gap model by postulating that a service quality
gap may exist even when a customer has not yet experienced the service at delivery but learned
about it through advertising or through word of mouth, or other media communications.
Therefore, it was again added that there is a need to incorporate potential customers‟ perceptions
on service quality offered as well as actual customers‟ perceptions of service quality experienced
(Nitin et al., 2005) in measuring service quality. In this model there is an attempt to integrate a
traditional managerial framework, service design, operations and marketing activities. The main
focus of this model is to identify the key dimensions associated with service quality in a
traditional managerial framework of planning, implementation and control (Nitin et al, 2005;
Gunawardane, 2011). The synthesized model of service quality, in totality considers three
factors, thus company image, external influences and traditional marketing activities as the
factors influencing technical and functional quality expectations (Groonroos 1984; Nitin et al.,
2005; Gunawardane, 2011). This model was adopted by Joshi et al., (2013) in a study to identify
the components of primary health care service delivery models for populations and this model
has been effective in improving access, quality and coordination of healthcare. Based on a
systematic review of the literature, including published sources between 1990 and 2011, the
findings indicate that healthcare services are affordable, appropriate and acceptable to the target
groups. Specialist workers improved co-ordination between the different health care services as
well as the service responding to the social needs of clients through case management. Quality of
care was improved by training in cultural sensitivity and the appropriate use of interpreters.
Therefore the elements of this model most frequently associated with improved access,
coordination and quality of care were case management, the use of specialist refugee health
University of Ghana http://ugspace.ug.edu.gh

22
workers, interpreters and bilingual staff. These findings have implications for workforce
planning and training. However, Cronin and Taylor (1992) criticize this model indicating that it
needs empirical validation in the service quality literature. Furthermore, it was noted that this
model ought to be reviewed for a different type of service settings. In this regard the
performance model was conceptualized to study service quality in the healthcare industry.
2.1.5 Performance only model
The later part of the nineteenth century saw the immense effort of Cronin and Taylor (1992) to
conceptualize and measure service quality, its direct relationship with consumer satisfaction and
the intention to purchase. Since they argued the framework of Parasuraman et al. (1985), with
respect to issues on conceptualization and measurement of service quality and developed the
performance- only model noted as SERVPERF model. In their work, the computed difference
score was compared with the perception score to conclude that perceptions only constitute a
better predictor of service quality (Cronin & Taylor, 1992; Dabholkar et al., 1996; Dabholkar et
al., 2000; Ladhari, 2008; Ramez, 2012). They further illustrate that service quality is the basis of
consumer attitude and that the performance only measure of service quality is an enhanced
means of measuring service quality.
Their study observed that SERVQUAL confounds satisfaction and attitude. It was therefore
stated that service quality can be conceptualized as „similar to an attitude‟, and can be
fundamentally be operationalized by the adequacy-importance model (Zeithaml, 1981; Nitin et
al., 2005). Particularly, they opined that Performance instead of „Performance-Expectation‟
determines service quality. This model was adapted by Oslen et al., (2013), to compare the
performance-only and the importance-performance model. Their study seeks to determine better
predictors of pediatric healthcare quality and more successful methods for improving the quality
University of Ghana http://ugspace.ug.edu.gh

23
of care provided to children. Fourteen paediatric healthcare centres serving approximately
250,000 patients in 70,000 households in three West Central Florida counties were sampled for
the study. Moreso, a cross-sectional design approach was used to determine the importance and
performance of 50 paediatric healthcare attributes and four global assessments of pediatric
quality healthcare. An exploratory factor analysis revealed five dimensions of care (physician
care, access, customer service, timeliness of services, and healthcare facility) for effectively
measuring healthcare quality. Again, the study indicated that the importance-performance
multiplicative additive model was a better predictor of paediatric health care quality. That is, the
importance-performance model is superior for measuring and providing a deeper understanding
of paediatric quality healthcare and a better method for improving the quality of care provided to
children and therefore indicated the performance only model was a better predictor of quality
healthcare (Oslen et al, 2013)In a study by D‟ Souza and Sequeira (2012) they examined the
performance only model using quality management factors, patient service quality factors and
critical success factors on performance. The main findings revealed that there is a significant
relationship between service quality factors and performance. Overall, the study recommended
healthcare organization to improve their performance with respect to service quality that is
patients-centred. However, this model has been criticized based on the fact that findings cannot
be generalized for all types of service settings. More so, the quantitative relationship between
consumer satisfaction and service quality need to be established with a model (Matterson, 1992;
Nitin et al, 2005).
2.1.6 Ideal value model of service quality
This model was a follow-up to the performance model by Cronin and Taylor, 1992. The ideal
value model of service quality was postulated by Matterson (1992), who indicated „expectation is
University of Ghana http://ugspace.ug.edu.gh

24
essentially treated as belief about having desired attributes as the standard for evaluation‟.
However, Nitin et al (2005), argue for value approach to service quality, modeling it as an
outcome of satisfaction process. Moreso, this model suggests the use of a perceived ideal
standard against which the experience is compared. Again, the model indicates an implicit
negative disconfirmation on a pre-conscious value level with satisfaction based on a higher
attitude level. The negative disconfirmation is the key determinant of consumer satisfaction and
the model‟s emphasis on the fact that more attention should be given to the cognitive processes
through which service concepts are formed and measured by consumers. Steinwach and Hughes
(2012) adopted the ideal model of service quality in the study of patient safety and quality based
on empirical evidence from nurses. The study indicates that certain social factors thus financing
systems as well as organizational structures and processes, health technologies and personal
behaviours affect access to health care and ultimately quality and cost of healthcare. The study
recommended the operational role of nurses in ensuring patient safety and general health quality
in USA. The main challenge of the model is that fewer number of items are used for value and
customer satisfaction. There is a need to define these items for all types of service settings when
this model is applied in every service quality study (Dobholkar, 1996; Spreng & Mackoy, 1996).
2.1.7 Model of perceived service quality and satisfaction
Based on these key weaknesses of the ideal value model of service quality, Spreng and Mackoy
(1996) conceptualize the perceived service quality and satisfaction model to enhance the
understanding of the constructs on perceived service quality and consumer satisfaction. The
model aims at modifying Oliver‟s (1993) model. The main tenets of the model outline the effect
of expectations, perceived performance desires, desired congruency and expectation
disconfirmation on overall service quality and customer satisfaction (Nitin et al., 2005). These
University of Ghana http://ugspace.ug.edu.gh

25
variables were measured based on a set of ten attributes of advising, which are: convenience in
making an appointment, friendliness of the staff, the advisor listened to my questions, the advisor
provided accurate information, the knowledge of the advisor, the advice was consistent, advisor
helped in long-range planning, the advisor helped in choosing the right courses for career,
advisor was interested in personal life, and the officers were professional. This model was
adopted by Esian et al, (2012) to explore the application of the original SERVQUAL scale in the
context of public health care services in Romania. The findings indicate that the tangibles
dimension followed by responsiveness dimension and reliability dimension registered the biggest
gap score. In contrast, Nitin et al (2005) and Oh (1999), indicate that findings need to be
generalized for different self-service options. Again, demographic variables, price and physical
environment are not considered in this model (Piper & Lamb, 2014).
2.1.8 Service quality, customer value and customer satisfaction model
Oh (1999), proposes an integrative model of service quality, customer value and customer
satisfaction. The main focus of this model is on the post-purchase decision process; this model
incorporated key variables as service quality, perception and quality, consumer satisfaction,
customer value and intentions to repurchase. Furthermore, in this model, word of mouth
communication is conceptualized as a direct combined function of perceptions, value satisfaction
and re-purchase intentions. It presents empirical evidence that customer value has a significant
role in customer‟s post-purchase decision-making process. It is basically an immediate
antecedent to customer satisfaction and re-purchase intentions. The main findings indicate that
perceived price has a negative influence on perceived customer value and thus have no
relationship with perceived service quality. Haque et al (2012) conducted a conceptual survey
using this model to study the impact of customer perceived service quality on customers‟
University of Ghana http://ugspace.ug.edu.gh

26
satisfaction for Private Health Centres in Malaysia. In this survey, they indicate that patient
satisfaction could be achieved through implementation of various support procedures as well as
increasing the facilities that are patient-centered. The study further recommends that this
conceptual model needs further investigation in the area of quality healthcare studies. Other
authors criticize this model on generalization for different types of service settings and further
indicate that the variables are measured through relatively fewer items (Frost & Kumar, 2000;
Santos, 2003).
2.1.9 Internal service quality model
This model was developed by Frost and Kumar (2000); it is based on the concept of the GAP
model (Parasurman et al., 1985). The model proposes the key dimensions and their relationships
that determine service quality among internal customers (front-line staff) and internal suppliers
(support staff) within a large service organization (Nitin et al, 2005; Gunawardane, 2011). The
first internal gap shows the difference in support staff‟s perception (internal supplier) of front-
line staff‟s expectation (internal customers). The second internal gap is the significant difference
between service quality specifications and the service actually delivered resulting in an internal
service performance gap. The third internal gap focuses on the front-line staff (internal
customers). The gap is based on the difference between front-line staff‟s expectations and
perceptions of support staff‟s (internal supplier) service quality. Gunawardane (2009) in an
exploratory study in the health care management industry aimed at investigating whether the
dimensions of internal service quality are dependent on the nature of the internal service
relationship. The results revealed that in almost all surveys of external and internal service
quality, „Reliability‟ and „Responsiveness‟ turned out to be the overall significantly leading
factors in the internal service quality from the internal customer point of view. However, this
University of Ghana http://ugspace.ug.edu.gh

27
model was not generalized for all types of internal environments and the effect of changes from
the external environment on the model was not considered thus the weakness of the model
(Soteriou & Stavrinides, 2000; Zhu, Wymer & Chen, 2002).
2.10 (The Selected Model) SERVQUAL model
Parasuraman et al., (1988), developed the SERVQUAL model which is a multi-item scale used
to assess perceptions of customers on service quality in service and retail businesses. This scale
decomposes the notion of service quality into five main dimensions as earlier indicated. These
dimensions are:
i. Reliability: The model defines this dimension, as weather the company is reliable in providing
the service. Does it provide as promised? More so, reliability reflects a company‟s consistency
and certainty in terms of performance. Again, reliability is the most important dimension for the
consumer of services.
ii. Tangibility: In this regard, Parasuraman et al (1988) describes tangibility mainly as how the
service provider‟s physical installations, equipment and people are. Since there is no physical
element to be assessed in services, customers often trust the tangible evidence that surrounds it
when making their individual assessment.
iii. Responsibility: The key issue raised here is whether company employees are helpful and
capable of providing fast service. Furthermore, is it responsible for measuring company and
employee receptiveness towards client.
iv. Empathy: This dimension deals with the capacity of a person to experience another‟s
feelings. Again, it raises the question does the service company provide careful and personalized
attention?
University of Ghana http://ugspace.ug.edu.gh
28
v. Assurance: With assurance, knowledge and courtesy of employees and their ability to inspire
trust and confidence by customers.
This model has been applied in the study of healthcare quality in the healthcare literature. In a
study to assess the quality of physiotherapy services, Curry and Sinclair (2002), used the
SERVQUAL model in three physiotherapy services in Dundee, Scotland. In this study, they
considered the ten original criteria for evaluation and combined them into five; tangibles,
reliability, responsiveness, assurance (including competence, courtesy, credibility, and security)
and empathy (including access, communication, and understanding). The findings indicated, that
the services were highly appreciated by customers even though it was realized that the perception
gaps were slightly negative and services could be improved. Their study proved that assurance
and empathy were very important for quality healthcare.
More so, Jabnoun and Chaker (2003), in their study compared public and private hospitals in the
United Arab Emirate. The Factor analysis of the results revealed five dimensions thus empathy,
tangibles, reliability, responsiveness and supporting skills. The study found that there is
significant differences between private and public hospitals in terms of overall service quality in
empathy, tangibles, reliability and administrative responsiveness dimensions. Their findings
indicate that public hospitals are perceived to be better than private hospitals on service quality.
Yesilada and Direktor (2010), used the SERVQUAL model to compare the quality of healthcare
between public and private hospitals in Northern Cyprus. In their study they found that there
were three critical quality dimensions; reliability–confidence, empathy and tangibles. Moreover,
their study also observed that both private and public hospitals failed to offer the expected
service quality but public hospitals provided a lower quality of care than the private hospitals.
University of Ghana http://ugspace.ug.edu.gh

29
They therefore recommended that for both public and private hospitals, further investigations
should be made to find out the underlying causes of the underlying gaps identified within the
organizations and suggest solutions to managers to close the gaps and provide high quality
services to their customers.
Irfan and Ijaz (2011) conducted an empirical study to compare the quality of healthcare services
delivered by the public and private hospitals to gain patient satisfaction in Pakistan. For this
purpose the SERVQUAL instrument was used to measure the patients satisfaction about service
quality delivered in these hospitals. In their work it is noted that private hospitals are delivering
better quality of services to their patients as compared to public hospitals.
Ramez (2012), employed the SERVQUAL model to evaluate service quality of healthcare
providers in Bahrain, the primary objective of the study was to ascertain the relationship between
the dimensions of service quality and patients' satisfaction, analysing the behavioral intention of
patients. He revealed that empathy, responsiveness and tangible dimensions had the largest
influence on the overall service quality. He therefore concluded that there is a positive and
significant relationship between overall service quality (OSQ) as well as patients' satisfaction
(SAT) and their behavior intention (BI).
In a cross-sectional survey by Essiam (2013) the study adopted the SERVQUAL dimensions to
examine the quality dimensions and patient satisfaction with healthcare delivery in a Public
University hospital. The findings indicated that patients‟ satisfaction is best explained by
perceived responsiveness, followed by perceived empathy, perceived assurance, perceived
tangibility, and perceived reliability. The study further recommended that findings would be of
interest to hospital administrators, policy makers, stakeholders and academics investigating the
University of Ghana http://ugspace.ug.edu.gh

30
main relationships between the SERVQUAL dimensions and patient satisfaction using the
hierarchical regression model.
Aghamolaei et al., (2014), conducted a cross sectional study in the Bandar Abbas Shahid
Mohammadi Hospital in the south of Iran. All 96 participants in this study were provided with a
SERVQUAL questionnaire. Wilcoxon and Kruskal-Wallis tests were used to analyse the data.
The findings indicated that service quality gaps were seen in all five-service quality dimensions
and the overall quality of service. In this study, 56.1% of participants defined the quality of
services as average. It was recommended that policy action must be taken to decrease the gap
score between the perception and expectation of the patients.
2.2 Patients satisfaction and quality healthcare in the context of Ghana.
Ghanaians perceive the quality of health services as sub-standard and therefore choose
alternative sources of treatment (Turkson, 2009). The trust and confidence is undermined by
frequent shortages of drugs and medical supplies, long queues, the absence of emergency
services and poor staff behaviour. This has resulted in low utilization of health services despite
the substantial investment aimed at improving access to health services in Ghana (Shield
Workpackage Report, 2007; Gyapong et al, 2007).
However, others perceive the quality of healthcare in Ghana to be high. Turkson (2009), looked
at the quality of healthcare delivery in a rural district of Ghana and found that generally the
quality of healthcare delivery was perceived to be high for most of the indicators used. That is
ninety percent of the respondents were satisfied or very satisfied with the care given during their
visit to the health facility. The participants however perceived poor attitude of some health
workers, long waiting times, high cost of services, inadequate staff, policy of payment for health
University of Ghana http://ugspace.ug.edu.gh
31
services, frequent referrals to hospitals, and lack of ambulances at facilities as being detrimental
to effective delivery of quality healthcare.
Furthermore, another study by Atinga et al (2011), examined how communication, provider
courtesy, support/care, environment of the facility and waiting time significantly predict patients‟
satisfaction with the quality of healthcare in two hospitals located in northern Ghana. They
observed that the five-factor model, support/care, environment of the facility and waiting time
determine patients‟ satisfaction with quality of healthcare delivery. The explanatory power of the
dependent variable was explained by 51 percent in the regression model.
Peprah (2014) conducted a study at Sunyani Regional Hospital in Ghana to assess patients‟
satisfaction using the SERVQUAL model by Parasuraman et al, (1998). The SERVQUAL
instrument was adapted and modified to capture the relevant data. A total of 214 patients were
sampled for the study. The study analysed for descriptive statistics and patients satisfaction were
determined by the service quality gap. The study results indicate that the overall satisfaction of
the patients concerning service quality of the hospital was good. Again, the study recommends
policy action to improve service delivery in communication/interpersonal relationship, assurance
and responsiveness dimensions. However, tangibility and empathy were esteemed high by
patients in their satisfaction in assessing quality healthcare at Sunyani Regional Hospital.
2.3 Justification for the model selection
The selected conceptual framework explains basically the underlying process of service quality,
which is applied to guide this study. Concentrating on the perception of the patient only, thus the
expectation was removed from the modified model suited for the study. This is congruent with
the fact that perceptions are usually a good measure of patient satisfaction with quality healthcare
delivery (Pakdil & Harwood, 2005; Naidu, 2009; Drain, 2001). After defining the concept of
University of Ghana http://ugspace.ug.edu.gh

32
service quality, the researcher needed a model for measuring the quality level of services. The
model was expected to spell-out the attributes that require improvement in order to enhance
quality, identify the degree or amount of improvement required and identify how the impact of
service quality improvement efforts can be assessed (WHO, 2014).
Again, this model can be used on a regular basis to track patients‟ perceptions of healthcare
quality of a hospital compared with its competitors. Once data have been analysed they can be
visually presented so that it is easier to identify strengths and weaknesses relative to competition.
More so, it provides the opportunity for a firm (hospital) to assess its service quality performance
on the basis of each dimension individually as well as the overall dimensions of service quality.
Furthermore, the model can be used in various service setting and provides a basic skeleton that
can be adapted to fit the specific attributes of a particular organization (hospital). It is applicable
across different empirical context, various countries and cultural backgrounds.
With these concerns the Parasuraman et al. (1988) SERVQUAL model was chosen and it was
modified to include four-dimensions, making it nine dimensions for assessing healthcare quality.
The four dimensions were added due to the operational service provision style of the university
hospital that is predominantly focused on the university community. Decisions to modify the
SERVQUAL instrument were based on the relevance of the questions to the context of university
hospital services and on the ability of patients to respond to the questions without experiencing
confusion or undue frustration.
University of Ghana http://ugspace.ug.edu.gh

33
2.3.1 CONCEPTUAL FRAMEWORK FOR THE STUDY
Fig. 1.0: Conceptual Framework for measuring quality healthcare
Adapted from the SERVQUAL MODEL
Parasuraman et al, 1988.
Figure 1.0 presents the conceptual framework for measuring quality healthcare of the study.
Thus patients of the university hospital perceive quality healthcare based on the nine service
quality dimensions in the model and these dimensions predicts patient‟s satisfaction with quality
healthcare in the university hospitals. The model reveals direct relationship from perceived
service quality towards the service quality dimensions and flows to patient‟s satisfaction.
Service quality
Dimensions
Tangibles
Responsiveness
Reliability
Empathy
Culture
Assurance
Communication
Priority
Affordability &
Accessibility
Perceived
service quality
Patients
Satisfaction
University of Ghana http://ugspace.ug.edu.gh

34
2.3.2 Tenets to the Model
The main dimensions to this model are discussed below in terms of perceived service quality,
tangibles, responsiveness, reliability, empathy, culture, assurance, communication, priority,
accessibility and affordability as well as patient‟s satisfaction.
Perceived service quality: Patients has some perception on the healthcare service they receive,
either based on experience or rumors. This variable measures the various perceptions of patients
on quality health in the university hospitals.
Tangibles: This dimension measures the physical environment of the hospital in relation to the
Out - Patient Department. The nature of the equipment used at the hospital.
Responsiveness: This dimension deals with the caring nature of the staff, meaning how helpful
are the staff?
Reliability: It involves trust in the services, in terms of performing services according to the
Standard of Operating Procedures (SOP‟s) and consistency in care delivery.
Empathy: Responsiveness involves the interest of the patients at the heart of the staff, it also
answers the issue weather the staff have the interest of patient at heart.
Culture: Provision of service is hinged on culture, which is reflective of the language, ethnicity
preference. This dimension looks at the culture paradigm that is entailed in healthcare delivery in
the university hospitals.
Assurance: In assurance dimension the efficiency of the hospital is observed, it also measures
weather the staff are well trained. The hospital has skilled staff to deliver services.
Communication: Communication is a tool for service improvement. It deals with whether staff
gives adequate information about the process of healthcare delivery.
University of Ghana http://ugspace.ug.edu.gh

35
Priority: Priority is given to some patients in healthcare delivery and therefore this dimension is
centred on the proper care given to students and university staff in the healthcare delivery at the
university hospitals.
Accessibility and Affordability: The accessibility dimension looks at the geographical location
of the hospital, the environment being friendly, patients-centred and the approachability of staff.
This dimension also deals with the financial barrier that prevents patients from accessing
healthcare at the hospital
Patient’s satisfaction: Generally, this measures how satisfied patients are with the quality of
healthcare service provided and the preparedness of patients to visit the facility again.
2.4 Healthcare
Healthcare is defined as the medical diagnosis, treatment, as well as prevention of disease,
illness, injury, physical and other mental impairments in humans (WHO, 2008). Again,
practitioners in medicine, chiropractic, dentistry, nursing, pharmacy, allied health and other care
providers who deliver healthcare service adopt this definition. They refer to health as the work
done in providing primary care, secondary care and tertiary care, as well as in public health.
Furthermore, healthcare is conventionally regarded as an important determinant in promoting the
general health and wellbeing of people around the world (WHO, 2010).
2.5 Quality Healthcare
The Institute of Medicine (IOM) in 2001, heralded the crusade to address the gaps between
actual and recommended quality healthcare standards in the United States of America. This
move coincided with a similar movement in the UK, which had been gathering pace since 1997
(Oliver, 2005). Initially, this quality healthcare approach was „regarded as something best left to
a few maverick enthusiasts‟ (Fillingham, 2008, p. 3) rather than an essential capability for all
University of Ghana http://ugspace.ug.edu.gh

36
healthcare staffs and patients. Today, the quality healthcare initiative theme is growing in stature
after the WHO clarion calls for improved quality healthcare delivery in 2008 (WHO, 2008). This
reinforces the continuous capacity building to ensure the best quality healthcare delivery in
developing countries. Eccles et al., (2009) indicate that healthcare professionals are
heterogeneous in the definition of quality healthcare, however, patients agree on the terms that
any service improvement that satisfies patient demands, clinical needs, patient and carer wants
are quality.
There have been some debates over the definition of quality healthcare in the literature whether
defining quality healthcare should be in the perspectives of patients or the service providers
(Yildi & Demirors, 2012). Collins and Joyce (2008), in an attempt to summarize the recent
debates on quality healthcare definition and issues on the healthcare system in Ireland, which
have come to the fore through media exposure, based their study on a systematic review of
media opinion and reports. Their findings stipulate that quality healthcare definition should be
patients centred, since the healthcare facilities are mandated to provide healthcare as a service.
Once patients within the hospital are satisfied with services then quality healthcare is achieved.
However, some studies have looked at quality healthcare from different perspectives and this is
reflected below.
Spencer et al (2014) observed why hospitals vary in the quality of care delivered to patients in
the USA. The study examined the Agency for Healthcare Research and Quality‟s innovative
Inpatient Quality Indicators and pooled 2006–08 State Inpatient Database records from eleven
states. The findings indicated that privately insured patients had lower risk-adjusted mortality
rates than did Medicare enrollees for twelve out of fifteen quality measures examined. It further
stipulated that Medicare patients appeared particularly vulnerable to receiving inferior care and
University of Ghana http://ugspace.ug.edu.gh

37
recommended that in order to help reduce care disparities, public payers and hospitals should
measure quality healthcare for different insurance groups and monitor differences in treatment
practices within hospitals. Again, Esian et al., (2012), explored quality healthcare improvement
at individual, group and organizational levels and identified the restraining forces using
formative evaluation, and the implications for current UK policy, particularly quality,
innovation, productivity and prevention. A total of 11 multi-disciplinary groups drawn from the
NHS England Healthcare Trusts (self-governing operational groups) were sampled. The results
showed that there was a limited focus on patient-centred services in the eleven groups and
therefore directed managers and policy makers to undertake an evaluative health policy to
improve healthcare quality centred on patients‟ needs.
2.6 Patient Satisfaction
The advent of the patient‟s rights movement fuelled the debate over the relationship between
patient satisfactions as a valuation of the process of care versus the standard of technical care
(Williams, 1994). As a result, the use of patient satisfaction measures in the health sector became
increasingly widespread. For example, assessing patient satisfaction has been mandatory for
French hospitals since 1998; this is used to improve the hospital environment, patient amenities
and facilities in a consumerist sense, but not necessarily to improve care (Boyer et al., 2006; Gill
& White, 2009). However, it is extremely difficult to categorically define patient satisfaction due
to the inconclusive evidence in literature (Larsson & Wilde-Larsson, 2009; Naidu et al, 2009;
Peakash, 2010; Gosh, 2013). Crowe et al. (2002), in their work identify 37 studies investigating
methodological issues and 138 studies investigating the determinants of satisfaction. They
indicate that there is an agreement that the definitive conceptualization of satisfaction with
healthcare has still not been achieved and that understanding the process by which a patient
University of Ghana http://ugspace.ug.edu.gh

38
becomes satisfied or dissatisfied remains unanswered. More so, they suggest that satisfaction is a
relative concept and that it only implies adequate service. Furthermore, Crowe et al. (2002) and
Urden (2002), separately point out that patient satisfaction is a cognitive evaluation of the service
that is emotionally affected, and it is therefore an individual subjective perception. However,
patient satisfaction is grounded as part of health outcome quality, which encompasses the clinical
results, economic measures and health related quality of life (Heidegger et al., 2006; Gill &
White, 2009).
2.6.1 The historical context of patient satisfaction
Hulka et al. (1970), took the initial steps to measure patient satisfaction in the healthcare area
with the aim of developing the „Satisfaction with Physician and Primary Care Scale. Ware and
Snyder (1975), followed with their “Patient Satisfaction Questionnaire‟, targeted at assisting with
the planning, administration and evaluation of health service delivery programmes. In the late
1970s, Larsen et al developed the „Client Satisfaction Questionnaire‟(1979) with eight-item scale
for assessing general patient satisfaction with healthcare services; this scale was superseded by
their „Patient Satisfaction Scale‟ (1984) (Gill & White, 2009). Finally, Parasuraman et al.,
(1985), conceptualized service quality using a disconfirmation model that compares customer
expectations and perceptions (Yousapronpaiboon and Johnson, 2013). Based on this model,
Garvin (1988), used a much more aggressive and strategic approach by defining quality along
eight dimensions; performance, features, reliability, conformability, durability, serviceability,
aesthetics, and perceived quality to measure patient satisfaction with service quality. In addition,
Anderson (1995) measured the quality of services provided by a public university health clinic,
using a 15-item instrument representing the five dimensions of SERVQUAL. According to her
findings, all the five dimensions measured negatively, assurance being most negatively
University of Ghana http://ugspace.ug.edu.gh
39
measured. Based on these results, Anderson made some recommendations for the budgeting of
future quality improvement projects according to ratings to certain aspects of outpatient care than
other inpatient services (Tangcharoensathienm et al., 1999; Yousapronpaiboon and Johnson,
2013). More so, some studies have been undertaken to assess perceived service quality in the
hospital sector in different countries. Thus, Boshoff and Gray (2004) adapted this model for a
study on customer satisfaction and loyalty among patients in the private healthcare industry in
South Africa and revealed that SERVQUAL dimensions, namely nursing staff empathy,
assurance and tangibles, impact positively on patients‟ loyalty. Cohen (1996) asserts that
consumers of healthcare services frequently rank communication and interpersonal aspects of the
healthcare experience highest in importance.
Rao et al., (2006) surveyed inpatients and outpatients who visited primary health centres,
community health centres, district hospitals and female district hospitals in the state of Uttar
Pradesh, the most populous state of India. They identified five dimensions of service quality –
medicine availability, medical information, staff and doctor behaviour and hospital
infrastructure. Patients‟ perception of service quality was found to be marginally better than
average. For outpatients, doctor behaviour was the key determinant of patient satisfaction.
Kumari et al. (2009), examined patients attending the outpatient department (OPD) of
government allopathic health facilities of Lucknow district, the capital city of Uttar Pradesh.
Although the overall satisfaction of the patient was satisfactory, there were deficiencies in certain
areas such as short OPD hours, availability of drinking water, availability of clean toilets and
doctor–patient communication.
In addition, Nwankwo et al., (2010), found that public hospitals are providing largely
unsatisfactory service to the patients in regards to doctor‟s responsiveness, length of getting an
University of Ghana http://ugspace.ug.edu.gh

40
appointment time, access to core treatment and hours of operation (Yousapronpaiboon and
Johnson, 2013; Bisschoff and Clapton, 2014). Again, Zaim et al (2010) indicate the important
criteria for measuring service quality in the hospitals in Turkey is the patient‟s view. The study
confirmed that tangibility, reliability, courtesy and empathy are significant for customer
satisfaction, while responsiveness and assurance were not. Sodani et al., (2014), measured the
satisfaction of patients visiting the outpatient department (OPDs) of a district hospital, a civil
hospital, a community health center and primary health center of eight selected districts of
Madhya Pradesh, India. They observed an increase in the satisfaction of patients with the
behaviour of doctors and staff at lower-level facilities compared to higher-level facilities.
Sharma et al (2004) assessed the patient satisfaction level visiting the OPD in a premier multi-
specialty hospital of North India and concluded that the patients were satisfied with the doctor,
nurses and paramedical staff. However, a certain percentage of patients opined that doctors had
shown little interest to listen to patients‟ problems and often used technical terms to explain their
illness or consequences. The majority of the patients in the survey were satisfied with the basic
amenities, but the services were found costly. Nekoei-Moghadam and Amiresmaili (2011)
examined the service quality in hospitals of Kerman University of Medical Sciences and found
that the largest discrepancy between patients‟ expectations and perception were in the tangibles
dimension. Responsiveness was the second followed by reliability, assurance and empathy.
(Yousapronpaiboon & Johnson, 2013) According to Al-Hawary et al. (2011), hospitals in Jordan
that had a high perceived quality was based on hospital staff (including academic/professional
qualifications and sound medical experience), comfortable accommodations for in-patients and
caring staff (including doctors, nurses, and health professionals) but that lower perceived quality
at the hospital was due to an insufficient number of pharmacy outlets to dispense medicine as
University of Ghana http://ugspace.ug.edu.gh

41
well as long waiting times to see the doctor and expensive medicine. In reaction patients are
most tolerant to factors related to the tangible dimension and least tolerant to factors related to
the reliability dimension (Ariffin & Aziz, 2008; Yousapronpaiboon & Johnson, 2013).
Al-Hawary (2011), in an exploratory survey studied the health care services quality of hospitals
in Jordan and Saudi Arabia and found that tangibles and accessibility were better provided in
Saudi Arabia hospitals. Furthermore, tangibility was found to be perceived better in the hospitals
in Jordan. Again, Ceelik and Sehribanoglu (2012), indicate that the tangible service quality
dimension had the single largest effect on the contentment perception of patients in Turkey‟s
hospitals; empathy and reliability were found to have lower effects in an experimental study.
Zarei et al. (2012), through a cross sectional design studied service quality in hospitals in Iran
and evaluated the service quality from the patients‟ view.
They found that the highest expectations and perceptions were related to the tangibles dimension
and the lowest expectation and perception related to the empathy dimension. Mekoth et al.,
(2012), studied the OPD of a public hospital in Goa and observed the quality of physicians and
clinical support staff as key determinants of patient satisfaction. However, the quality of non-
clinical staff was not found to affect patient satisfaction.
Moreover, Yousapronpaiboon and Johnson (2013), indicated that SERVQUAL‟s five latent
dimensions had a significant influence on the overall service quality. They further observed
responsiveness had most influence; followed by empathy, tangibles, assurance and finally
reliability. First, given that responsiveness was the strongest predictor of service quality, the
policy implication is that hospital out-patient employees can exercise strong influence over
perceived quality by giving sincere and detailed information about service conditions, by being
willing to help and by offering fast and efficient service to out-patients. Senarath et al., (2014)
University of Ghana http://ugspace.ug.edu.gh

42
evaluated patient satisfaction using eight dimensions: interpersonal care, efficiency, competency,
comfort, physical environment, cleanliness, personalized information, general instructions. The
study revealed that patients were satisfied with interpersonal care, but less satisfied with comfort,
environment, sanitation and general and personal instructions.
2.7 Patients perception on constituents of service quality
Perceptions are vital measures of health service quality in the context of patient satisfaction with
healthcare delivery in Ghana. Improving service quality in health care has gained considerable
attention in the past decade because proper delivery of care leads to better health outcomes for
the patients. Generally, it is argued that patients‟ perception of actual services delivered
determine the service quality of a hospital. Moreover, perceptions refer to the consumers‟
evaluation of the service provider. Therefore, if the customers‟ performance perceptions exceed
the customers‟ expectations, the service provider provides quality service (Turkson, 2009; GHS,
2010; Yousapronpaiboon & Johnson, 2013). John (1991) noted that perceptions of service
quality in hospitals could be improved through improving communication between patients and
healthcare providers. Patients are the ultimate arbiters of quality and given that perceived quality
is a key antecedent of perceived value and satisfaction judgments, hospitals are increasingly
interested in conducting such quality assessments (Fornell et al, 1996; Yousapronpaiboon &
Johnson, 2013). In quest by patients to assess the quality of healthcare delivery, Carman (2000),
pointed out that perception of service quality is an attitude, and that the attitude is a function of
some combination of attributes that a patient considers to be components of quality. The
attributes can be divided into two sets, thus functional, which includes measures such as
ambiance and provider attentiveness; and technical, such as outcome that describes how the
service is delivered. Thus, there exists a link between perceived service quality and patient
University of Ghana http://ugspace.ug.edu.gh

43
satisfaction. More so, findings from Alrubaiee and Alkaaida (2011) and Ramez (2012) indicate
that patient perception of quality healthcare has a strong and positive relationship with patient
satisfaction.
Abdallah (2014), in his quest to understand how vulnerable lower income patients make health
care decisions and define quality of care based on a survey and a focus group discussion in the
United States indicates that perception and views of patient on service quality can be categorized
into: patient-centred care, timely and efficient care, quality and range of services. Patient
perception on patient-centred care noted that treating them in a hospital environment with respect
and dignity as well as designing the service delivery to be equitable and fair are the building
blocks on quality healthcare. Timely and efficient care was a key perception of patients on
service quality: as the study revealed that quality care centred on structural elements of care
rather than outcomes. Thus the study centered on a more service-oriented view of quality: were
the services timely, efficient, well organized, and available when it was needed. Patients
perceived quality and range of service as essential aspects of quality based on the physician‟s
competence, which was judged based on thoroughness and a clear intent to help the patient. The
physician‟s ability to communicate with patients was considered to be an essential aspect of
quality, particularly the doctor‟s ability to explain things to the patients.
2.8 Conclusion
Historically, a number of studies have been conducted on patient satisfaction and quality
healthcare delivery. The review of the relevant literature was hinged on the objectives of the
study as well as on the broad spectrum of patient satisfaction in Ghana. In the area of dimension
of service quality, various dimensions have been used in the measurement of service quality in
relation to quality healthcare delivery. These dimensions are good predictors of service quality in
University of Ghana http://ugspace.ug.edu.gh

44
the healthcare industry depending on the significant contribution in defining patient satisfaction
with quality healthcare delivery in Ghana.
On service quality constituents, the eclectic literature review indicated that patients have
conceptualized service quality in their different jurisdiction depending on the service received.
The perceptions of the patients are vital in evaluating quality healthcare delivery in Ghana. The
reviews stipulate that perceptions are varied but health providers should strategically provide
services that are patient-centred.
University of Ghana http://ugspace.ug.edu.gh

45
CHAPTER THREE
3.0 METHODOLOGY
Introduction
This chapter discusses the methodological issues involved in the study. It begins by defining the
broad paradigm within which the study is situated. This section further discusses the approach
that was used to address the research questions. These methods are captured as the research
approach, design, the sampling and sampling technique, sample size, study site, instrumentation,
source of data, data collection procedure and analysis.
3.1 Research Approach
The mixed-method approach was adopted for the study. This approach ensured an in-depth
explanation of the contextual dynamics of patient‟s satisfaction with quality healthcare in Ghana.
Creswell and Clark (2007), note that the mixed-method research approach ensures a triangulated
multilevel model that addresses different levels of analysis (macro and micro) within a system.
According to Teddlie and Tashakkori (2009), mixed-method promotes a clearer and more
explicit understanding of the social issue in relation to education, health, culture, and lifestyle.
3.2 Study Design
The main focus of the study is to compare patient‟s perceptions of the two facilities in service
delivery, the process and the quality of services delivered to patients at the two hospitals. The
study therefore adopted a comparative design. This selected design is appropriate for the study
based on the fact that the study units are homogenous in nature. Thus comparing as well as
contrasting their characteristics in the model makes it vital for policy implication on quality
healthcare service in Ghana. This is grounded in Mills et al (2006), indicating that the underlying
goal of comparative study-design analysis is to search for similarity and variance in the sample
University of Ghana http://ugspace.ug.edu.gh

46
of study either being heterogeneous or homogenous in characteristics. More so, imbedded in the
work is the exploratory study design adopted for the quantitative approach. Gay (1992) states
that exploratory design involves the collection of data in order to test hypothesis or answer
research questions concerning the current status of the subject under investigation. Creswell
(2007) indicates that exploratory research enables a researcher to gain familiarity with a
phenomenon and acquire new insight in order to formulate a more precise problem or develop a
hypothesis. The qualitative section identifies with Creswell (2007) and Neuman (2007) as it
enabled the researcher identify the general assumption underlying quality healthcare from the
perspective of the patients.
More so, the study adopts the case study design for the qualitative paradigm. This design refers
to an empirical inquiry that investigates a contemporary phenomenon within its real-life context;
when the boundaries between phenomenon and context are not clearly evident and in which
multiple sources of evidence are used (Yin, 1984: Barbie, 2004). As indicated by Barbie (2004),
the leverage in using the case study design is that it enables the researcher to closely examine
data within its real-life, natural context in order to obtain detailed understanding of the issues
under study. The advantages of the case study design are congruent with the aim of the study in
doing a detailed, micro-level analysis of patients in relation to quality healthcare delivered by the
two institutional facilities under study.
3.3 Scope of the study
The study was defined within the scope of assessing patient satisfaction with quality healthcare
at the two university hospitals. Within this scope, the study examined patient perception of
quality healthcare. Moreover, it also explored what constitutes service quality in the context of
University of Ghana http://ugspace.ug.edu.gh

47
the two hospitals and also examined key service quality dimensions as an important measure of
quality healthcare by the patients.
3.4 Study Population
The study purposefully centred on patients who are predominantly sick people from all walks of
life with diverse professional, educational, religious and ethnic backgrounds. Since these
facilities are all institutional-based, there was the possibility of capturing responses from students
and staff accessing healthcare.
3.5 Study Setting
University of Ghana hospital (UGH) was established in 1955. It is currently located at the staff
village community of the university campus. The facility provides general services to students,
staff and the surrounding communities. The facility has staff strength of 120 professionals
working in the various fields of healthcare delivery. The UGH have several sections: the Out-
Patient Department (OPD), the Medical laboratory, the Male and Female ward. Again, utilization
of the service is annually decreasing from 1,516 in 2011 to 1,203 in 2012 and 1,012 in
2013(OPD Annual Report, 2013). Service delivery within the University of Ghana hospital has
been a great concern to students, faculty and the surrounding community. The quality of
healthcare in this hospital has come under intense administrative and clinical scrutiny. Moreover,
the service of the hospital was rated as not efficient according to Ghana Health Service Report on
hospital service quality assessment (GHS, 2012). Therefore, there is the need to delve more into
patients‟ satisfaction with the quality healthcare so that the hospital can know the best strategies
to adopt in order to meet their old glorious image of efficient service delivered to the patients.
University of Ghana http://ugspace.ug.edu.gh

48
University of Cape Coast hospital is also located on the University of Cape Coast campus. The
hospital was started in 1962 as a clinic located close to the female Adehye Hall. The hospital has
several sections: the Out-Patient Department (OPD), the Medical laboratory, the Male and
Female ward and provides service to both the university and the surrounding communities. The
hospital has a staff strength of 128 professionals. Utilization by patients is increasing yearly from
2,045 in 2009 to 2,500 in 2010 and 3,540 in 2012 to 3,064 in 2013 (UCC Hospital Annual report,
2013). The University of Cape Coast hospital is selected because in their five-year strategic plan,
the university has resolved to provide quality healthcare delivery to students, senior members
and the surrounding communities and by the year 2017 this will be achieved with an extensive
research on providing the services that is patient centred (DPQA, 2012). However, the
performance appraisal by the regional health directorate rated the hospital as the best in service
quality based on an assessment by patients in the region (GHS, 2012; CRHD, 2013). Based on
this rating the study sought to compare the University of Ghana Hospital to University of the
Cape Coast hospital.
3.6 Sampling
The study employed a two-stage sampling procedure based on stratified and convenient sampling
techniques for the survey. Using the stratified sampling procedure for the first phase, it was
helpful due to the stratification of the already existing units in the two facilities. Stratified
sampling procedure ensures a uniform representativeness of all units in the two hospitals. Babie
(2004) reveals that stratified sampling helps researchers to strategically avoid biases in the
selection of study units. The two facilities have eight clusters and these are patients at the records
section, pharmacy, maternal and child health, X-ray, physiotherapy, laboratory, E.N.T and the
consultancy services clusters. From each cluster, patients were conveniently selected for the
University of Ghana http://ugspace.ug.edu.gh

49
survey. The selection was based on the existing survey approach (where patients after assessing
the service could best explain and analyse the quality of the service delivered). However,
perception informed the assessment of service delivered to the patient‟s. Records at the two Out-
Patients Department (records section, pharmacy, maternal and child health, X-ray,
physiotherapy, laboratory, E.N.T and the consultancy services) constituted 520 patients
attendance on a daily basis (270 for the UGH and 250 for the UCH). With reference to these
figures the researcher selected 218 patients based on the fisher formula for selection of sample
size. Thus 110 and 108 respondents for UGH and UCH respectively.
In the interview (qualitative) approach, the purposive sampling procedure was adopted. Thus
purposive sampling procedure enabled the study to have an intensive analysis of the study units.
Neuman (2011) reveals that it is often used in comparative research to make a study informative
due to the unique selection of cases appropriate for characteristics of the units under study. The
average time for the interview was one hour each for fifteen (15) patients (7 patients from UG
hospital and 8 patients from UCC hospital). Babie (2004), indicates that a sample size of 15 and
above in a qualitative study is well grounded for theory and in-depth inductive analysis of the
study units.
3.7 Data Collection Instruments
The quantitative approach used structured questionnaires. The use of questionnaires was relevant
to this study because it is in sync with the view of Kerlinger (1973), which indicates that
questionnaires are widely used for collecting data in research because it is developed to answer
questions, it is an effective instrument for securing factual information about practices and
decisions of subjects. The structured questionnaire was chosen due to the fact that it assisted the
researcher to access vital information about what patients defined as quality in healthcare in
University of Ghana http://ugspace.ug.edu.gh

50
order to critically discuss the patient‟s perspectives on quality healthcare. Again, this instrument
is predominantly used for quantitative surveys (Turner, 2011). The questionnaire was based on
the SERVQUAL scale modified to suit the study. It was divided into two main sections. Section
one dealt with demographic background of respondents while section two measured the service
quality perceptions of patients. On the service quality dimensions, the questions were categorized
into the nine dimensions of service quality as adopted for the study – Tangibility, Reliability,
Responsiveness, Assurance, Empathy, Accessibility and Affordability, Priority, Culture and
Communication. For the purpose of rating, a five-point likert scale was used, ranging from
„Strongly Disagree =1.0 –1.49, Disagree = 1.50 –2.49, Neutral = 2.50 –3.49, Agree = 3.50 –
4.49, Strongly Agree = 4.50–5.0‟. This format has been recommended for healthcare surveys
(Elbeck, 1987; Steiber, 1989; Scales et al, 2009).
The qualitative paradigm involved the use of an in-depth interview guide. This was constructed
based on the research question. The in-depth interviews allowed the researcher to seek answers
to the research question posed for the study. It also helped the researcher to grasp the
perspectives and thoughts of patients regarding service quality in healthcare delivery. The
instrument was carefully chosen for two reasons. One, it is qualitative data collection instruments
and given the fact that the second objective of the study is rooted in the qualitative paradigm the
instrument was appropriate. Two, the selected instrument is a useful tool in conducting
explanatory and descriptive studies (Neuman, 2007). These tools allowed the researcher to
extract the perspectives, thoughts and feelings of respondents in order to meet the objectives of
the study.
University of Ghana http://ugspace.ug.edu.gh

51
3.8 Sources of Data
The primary source of data was the questionnaire administered to the patients in order to rate
quality of service provision based on the Likert scale. The questionnaire was structured based on
the hypothesis and the research question, which is reflective of the objectives of the study, and
the interview guide also provided primary data from the sampled patients for the qualitative
section of the study.
3.9 Data Analysis and Management
The data for the study was analysed both quantitatively and qualitatively. Thus data generated
from the structured questionnaire was analysed with Statistical Package for Social Science (IBM
SPSS Version 21). Statistical techniques such as the T-test were used to compare the means of
the two facilities. A Principal Component Analysis was used to reduce the dataset in order to
proceed with factor analysis. Thus factor Analysis (FA) which was consequently performed on
thirty-two (32) variables and the output is presented in Table 4.2. As a prelude to employing the
Factor Analysis in this study, the sampling adequacy and the factorability of the data were
examined to ensure that all assumptions were met for the Factor Analysis. In ensuring the
factorability of the data, the Bartlett‟s test of sphericity and the Kaiser-Meyer-Olkin (KMO)
measures of sampling adequacy were examined. According to Tabachnick and Fidell (2001), the
Bartlett‟s test of sphericity should be significant at (p<0.05) for the FA to be considered
appropriate while the KMO index ranges from 0-1, with 0.6 recommended as the minimum value
for a good FA. For this study, the Bartlett‟s test of sphericity was found to be very significant
(p=0.00) while the KMO index of 0.919 confirmed the suitability of the data for Factor Analysis.
Factors with eigenvalue greater than 1.00 and items with factor loadings greater than 0.50 have
been recommended to be significant and included in the analysis. The Cronbach‟s alpha was
University of Ghana http://ugspace.ug.edu.gh

52
used to examine the reliability of the scale used and the extent to which the variables contribute
in explaining a factor. This enabled the researcher have a full control of the key dimensions that
relate to service quality in a regression model and to know the effect of the various independent
variables (dimensions) on patient satisfaction being the dependent variable. A multiple linear
regression has the ability to explore the relationship between one continuous dependent variable
and a number of independent variables or predictors (usually continuous) (Pallant, 2005; Brant,
2007).
The transcribed data from the interviews were analysed manually using the thematic and cross-
case analysis. This helped the study identify the various re-occurring themes that best explain the
patient‟s decision and feeling on quality healthcare. The interview comprised fifteen patients,
maximum of seven at each hospital. Among the fifteen patients who participated in the
interview, seven were females and eight were males. Creswell (1998) has recommended that 10-
25 participants can lead to a saturation point in phenomenological studies. Guest et al (2006),
have observed that a sample of six interviews and more „may [be] sufficient to enable
development of meaningful themes and useful interpretations‟ (p.78). The recorded interviews
were performed by the manual approach, where major emerging themes were identified for
analyses and discussion.
To ensure effective management of data, the researcher adopted a data management plan. The
data management plan comprised data recording, data coding and classification, data storage,
and data security. In order to store data for the analysis, the researcher assigned unique codes to
all data after recording. The purpose of the coding was for easy identification of responses.
University of Ghana http://ugspace.ug.edu.gh

53
Depending the on study units from which the data was collected, a coding system was generated.
For the quantitative aspect data codes were indicated according to the questionnaire numbers
(UCQ1 for data from UCH and UGQ1 for data from UGH). The transcribed data from UCH
were coded as UCIDI and UGIDI for UGH respectively. On security of the data the interview
responses were sky-derived into the personal account of the researcher and again it was backed-
up on an external hard drive with protected passwords.
3.10 Pre- testing and Piloting of Instrument
The questionnaire and interview guide were pre-tested at Valley View university hospital with a
sample of 20 patients, considerable attention was given to constructing clear and unambiguous
questions. Valley View hospital was selected due to the fact that it shares identical characteristics
with study area, being an institutional hospital. The instruments were refined based on feedback
obtained and value loaded. More so, the pre-testing indicated that patients perceived some of the
items included in the scale to be redundant. Because this redundancy led to frustration and low
response rates, the researcher with input from the supervisor agreed to reduce the number of
items. Furthermore, pre-testing the instrument was necessary based on the stance of Neuman
(2007), noting that pre-testing of instrument checks for glitches in wording of questions, lack of
clarity of instructions, in fact, anything that could impede the instrument's ability to collect data
in an economical and systematic fashion.
3.11 Ethical Consideration
Ethical clearance and approval to conduct this research was obtained from the Ethics Committee
on Humanities at the Institute for Social Statistics and Economic Research (ISSER), University
of Ghana. More so, a copy of the research proposal, a cover letter, instruments and an
introductory letter from my department was added to the request. The university ethically cleared
University of Ghana http://ugspace.ug.edu.gh

54
the study to be conducted at the designated hospitals. Participation was voluntary and the
information provided was treated with the utmost regard for confidentiality and anonymity.
Furthermore, since this survey was a low-risk research, consent was based on implied consent
and did not require a written consent for the survey. However, a written consent was sought from
the participant for the in depth interview. Patients involved in the interview were treated with the
dignified privacy during the interview process and were made to consent to their participation
before the process started.
3.12 Field Experience
Generally, the main challenge faced during the field data collection was the unwillingness of
patients to respond to the questionnaire. This was largely attributed to the fact that patients had
spent long hours at the hospital queuing at the OPD. Moreover, there were some respondents
who dropped-out of the study along the course of answering the questions. These respondents
felt the questions were too many and they could not stay any longer to complete them. The
researcher printed and administered questionnaire in excess of 30, to make up for the non-
response.
University of Ghana http://ugspace.ug.edu.gh
55
CHAPTER FOUR
4.0 PRESENTATION AND ANALYSIS OF RESULTS
Introduction
This chapter of the study presents the main results, thus the thematic areas of the presentation
involve: socio-demographic characteristics of patients, service quality dimensions and patient
satisfaction as well as comparative analysis of perceptions of UGH and UCH patients on quality
healthcare.
4.1 Socio-demographic characteristics
A total of 218 respondents were sampled for the study as indicated in table 4.1. In all, 110
respondents representing 49.5 percent of the sample size were selected from the University of
Ghana Hospital (UGH) and 108 respondents consisting of 50.5 percent were selected from the
University of Cape Coast Hospital. Females constituted a larger proportion of the sample size
(53.2%) and the males were 46.8 percent. The results indicate that 42.7 percent of the
respondents are middle/senior high school graduates, while 28.9 percent and 15.1 percent were in
the tertiary institution and Junior High School respectively. The results further revealed that 6.9
and 6.0 percent of the respondents had primary and non-formal education respectively. Again,
the demographic results indicated that 45(20.6%) of the respondents were students, 17% were
traders were traders (Businessmen) and 15.1% unemployed. However, farmers constituted 14.2
percent and 14.7 percent were Government employees. A total of 82.5 percent of the respondents
were between 18 and 50 years. On the other hand, 10.6 percent were within the age 51 and
61years and 15(6.9 percent) were 62 years and above. A greater percentage of 74.3 had utilized
the hospital between 2 and 4 times, more so, 18.8 percent had visited between 5 and 7 times and
6.9 percent had utilized the facilities over 8 times.
University of Ghana http://ugspace.ug.edu.gh

56
Table 4.1: Socio-demographic Characteristics of Respondents (N=218)
Demographic Variable Categories Frequency
N=218
Percentage
(%)
Hospitals UCH 110 49.5
UGH 108 50.5
Gender
Male 102 46.8
Female 116 53.2
None 13 6.0
Primary 15 6.9
Junior High/JSS 33 15.1
Educational Level Senior High/Middle School 93 42.7
Tertiary 63 28.9
Other 1 0.5
Unemployed 33 15.1
Trader/Businessman 37 17.0
Farmer 31 14.2
Employment Status Government Employee 32 14.7
Private Sector Employee 25 11.5
Student 45 20.6
Other Specify 15 6.9
18-28 years 83 38.1
29-39 years 57 26.1
Age 40-50 years 40 18.3
51-61 years 23 10.6
62 years and above 15 6.9
2-4 times 162 74.3
Number of visits 5-7 times 41 18.8
8 times and more 15 6.9
Source: Field data (2014)
University of Ghana http://ugspace.ug.edu.gh

57
4.2 Dimensions of service quality and patient satisfaction
Service quality in the healthcare literature is underlined by several attributes that decomposed
into unique dimensions, which then significantly predict the outcome of the overall quality
healthcare delivery based on patient satisfaction. These attributes were loaded on nine
dimensions that eclectically underpin the overall service quality in the two University hospitals
(tangibility, reliability, responsiveness, assurance, empathy, communication, culture, priority and
accessibility and affordability). In order to extract relevant dimensions as good predictors of
overall service quality, an exploratory factor analysis was performed in order to assess the best
dimensions of service quality. The principal component analysis with varimax rotation was
employed in ensuring the factorability of the data. The results of the dimension are presented in
Table 4.2. The first factor (Factor I) measured the Empathy aspect of the healthcare service
quality. The factor comprised issues as staff welcome patients weakness, staff has patients
interest at heart, more so, staff are responsive, they understand patients specific needs as well as
being caring to patients. This factor accounted for the highest variation with an eigenvalue of
10.6, which is equivalent to 38.2% of the total variance. The second factor captured issues on
communication of staff to patients at the two university hospitals. The factor loadings under
Factor II include doctor‟s willingness to answer questions of patients, giving adequate
information on treatment and health condition of patients and patients receiving adequate
information on test that they have to undergo. The factor accounted for an eigenvalue of 1.87,
which amounts to 6.68% of the total variance. The third factor (Factor III) was termed as
Culture, which is one key dimension to patient‟s satisfaction with healthcare service quality at
the university hospitals. Items examined under this factor were; staff at the hospital use a
language patients understands, they do not discriminate based on religion, as well as the location
University of Ghana http://ugspace.ug.edu.gh

58
being accessible to patients of different ethnic and cultural background. This factor explained
1.60(eigenvalue) of the variance, which represents 5.74% of the total variance. Factor IV,
indicated the Tangibles dimension, determines patient‟s satisfaction with quality healthcare of
patients in the university hospitals. Factors that loaded on tangibles included hospital having up-
to-date facilities and also modern looking equipment. This factor explained 1.45 of the variance,
which represent 5.17% of the total variance. The last factor (Factor V) measured issues related to
Priority. The individual loadings here include university workers and students do not join queues
to seek healthcare services, moreover, they are given special care at the hospital. This factor
accounted for 1.25 of the eigenvalue, which is equivalent to 4.48% of the total variance.
Table 4.2: Dimension of Service quality on Patients Satisfaction
Factor Statements Loadings Eigen
values
% of
variance
explained
Cronbach
alpha (α)
I Empathy
Staff welcomes patients‟
weaknesses
0.78
Staff has patients‟ interest at heart 0.72 10.6 38.2 0.84
Staff respond immediately when
called by patients
0.70
Staff understand patient specific
needs at the hospital
0.66
Staff at the hospital are caring to
patients
0.63
Staff promptly deliver service 0.63
II Communication
Doctors are willing to answer
questions relating to illness
0.79
Patients were given adequate
information on their treatment
0.77 1.87 6.68 0.85
Patients were given adequate
information on their health
condition
0.72
Patients received adequate
explanation regarding any test
undertaken
0.68
University of Ghana http://ugspace.ug.edu.gh

59
III Culture
Staff use language patients
understand
0.75
Staff at the hospital does not
discriminate based on religion
0.74 1.60 5.74 0.75
Staff at the hospital does not
discriminate based on ethnic
background
0.66
Location of the hospital is
accessible
0.55
IV Tangibles
The hospital has up-to-date facilities 0.80
The hospital has modern looking
equipment
0.70 1.45 5.17 0.70
V Priority
University workers and students do
not join queues to seek healthcare
services
0.84
University workers and students are
given special care at the hospital
0.68 1.25 4.48 0.71
Total Variance Explained 60.3
Source: Field data (2014)
4.3 Predictors of service quality dimension on patent satisfaction
A multiple linear regression model was used to determine the predictive effect of the five
dimensions of service quality (independent variables) from the factor analysis on patient
satisfaction (dependent variable) using a p<0.05 as a statistical criterion. The model exhibited an
adjusted R2
value of 0.56. Thus this model is fitted in explaining 56% of the variations of the
dimensions of service quality on patients‟ satisfaction. Consequently, all the five variables were
good predictors of patient satisfaction with service quality in the university hospitals and their t-
values indicated that these dimensions are strong predictors of patient‟s satisfaction. Results
from Table 4.3 indicated that „Empathy‟ (β=0.09) is statistically a significant predictor of patient
satisfaction of both university hospitals since its p-value (0.003) does not exceed a significant P-
University of Ghana http://ugspace.ug.edu.gh
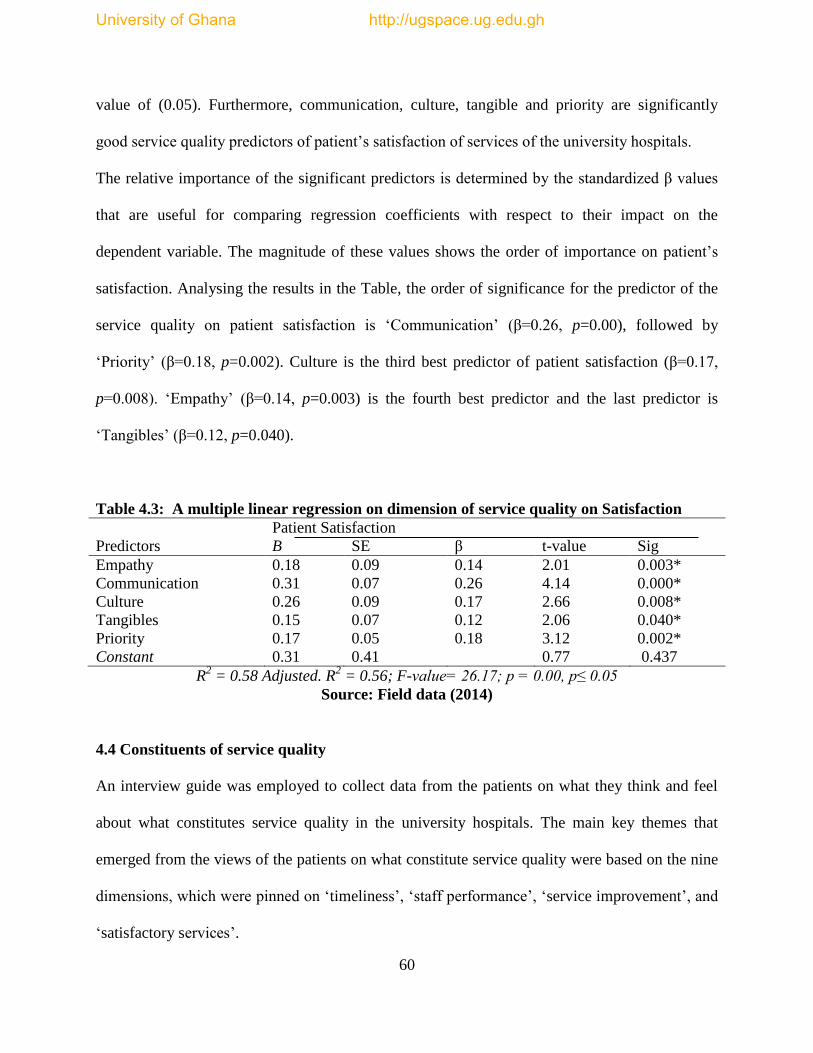
60
value of (0.05). Furthermore, communication, culture, tangible and priority are significantly
good service quality predictors of patient‟s satisfaction of services of the university hospitals.
The relative importance of the significant predictors is determined by the standardized β values
that are useful for comparing regression coefficients with respect to their impact on the
dependent variable. The magnitude of these values shows the order of importance on patient‟s
satisfaction. Analysing the results in the Table, the order of significance for the predictor of the
service quality on patient satisfaction is „Communication‟ (β=0.26, p=0.00), followed by
„Priority‟ (β=0.18, p=0.002). Culture is the third best predictor of patient satisfaction (β=0.17,
p=0.008). „Empathy‟ (β=0.14, p=0.003) is the fourth best predictor and the last predictor is
„Tangibles‟ (β=0.12, p=0.040).
Table 4.3: A multiple linear regression on dimension of service quality on Satisfaction
Patient Satisfaction
Predictors B SE β t-value Sig
Empathy 0.18 0.09 0.14 2.01 0.003*
Communication 0.31 0.07 0.26 4.14 0.000*
Culture 0.26 0.09 0.17 2.66 0.008*
Tangibles 0.15 0.07 0.12 2.06 0.040*
Priority 0.17 0.05 0.18 3.12 0.002*
Constant 0.31 0.41 0.77 0.437
R2 = 0.58 Adjusted. R
2 = 0.56; F-value= 26.17; p = 0.00, p≤ 0.05
Source: Field data (2014)
4.4 Constituents of service quality
An interview guide was employed to collect data from the patients on what they think and feel
about what constitutes service quality in the university hospitals. The main key themes that
emerged from the views of the patients on what constitute service quality were based on the nine
dimensions, which were pinned on „timeliness‟, „staff performance‟, „service improvement‟, and
„satisfactory services‟.
University of Ghana http://ugspace.ug.edu.gh

61
Patients saw timeliness as a key determinant of service quality in the university hospitals. Thus
they were of the view that time is an essential commodity to healthcare delivery and therefore
indicated quality health service delivery hinges on time (time staff report to start work, time in
accessing other essential care such laboratory tests, X-ray and the long waiting time at the OPD
to take history). A greater percentage of the patients shared this view, as one noted:
“....time is money, we come and join this long queue for so
many hours and they come only to order us around. They
think we come here because we want, if not sickness what
will bring me here. They should come to work early so this
the queue can move fast”(Male patients, Taxi driver, Aged
25).
Furthermore, patients outlined staff performance as another essential variable constituting quality
healthcare in the university hospital setting. They noted that professional knowledge and in-
service training boost performance of staff in providing quality healthcare to patients. A review
of the findings revealed that staff with higher professional development are cautions in
healthcare delivery as they ensure strict ethical and professional guidelines in the service
delivery to patients. The majority of the patients stressed the need for excellent performance by
staff. A respondent indicated:
“They need to work hard and perform all the medical procedure
right, in fact their supervisors should also monitor them that
they perform all the task according to the required procedure
for quality healthcare delivery, they can do better, since they
have the people” (Female, Housewife, Aged 34).
Again, patients indicated that service improvement is an underlying component of quality
healthcare. It was noted that quality of service is fueled by persistent improvement in services
rendered by the various departments in the hospital, thus this improvement is reflective in the
attitudes of service providers, the service delivery process, logistics provision and the
University of Ghana http://ugspace.ug.edu.gh
62
professional and ethical training of staff. Almost all respondents were of the view that service
improvement is a necessity for patient satisfaction with quality healthcare.
“.....they always do this assessment, but the service is the same,
they should work to improve the service delivery, that is what
we want”(Female, Seamstress, Aged 45).
Finally, patients deemed satisfactory service as the crux of quality health service in the university
hospitals. Thus, patients are of the view that service quality should be satisfactory in terms of the
constituents of healthcare. They further indicated that staff at the university hospitals are
averagely delivering service to the acceptable satisfaction of patients. A greater number of the
patients were affirmative to this view as one observed:
“Well their service is normal compared to some government
hospital in Ghana, but they can do more, since all the medical
knowledge is produced in the university”(Male, Baker, Aged 39).
4.5 Comparison of patient’s perception on service quality
An independent t-test was used to compare the perception of patient‟s satisfaction on dimensions
in service quality of University of Ghana (UGH) and University of Cape Coast hospital (UCH).
Results from Table 4.4 indicate that there were significant differences between the mean
perception of patients of UGH and UCH on empathy, tangibles and priority dimension at a
p=value of 0.005. However, the mean perception of patients on communication and culture
dimensions of service quality are not significantly different at a p=value of 0.005.
University of Ghana http://ugspace.ug.edu.gh

63
Table 4.4: An independent t-test Comparing of perceptions patients service quality
dimensions that clearly predict patient’s satisfaction of service at UGH and UCH.
Empathy Mean Std t-static p-value
UGH 3.41 0.83
UCH 4.52 0.73 2.94 0.004*
Communication
UGH 3.83 0.89 0.05 0.958
UCH 3.84 0.86
Culture
UGH 4.11 0.70 0.55 0.580
UCH 4.16 0.64
Tangibles
UGH 3.39 0.83 1.97 0.050*
UCH 4.56 0.81
Priority
UGH 3.04 1.06 5.60 0.000*
UCH 4.51 0.97
Scale: Strongly Disagree =1.0–1.49, Disagree = 1.50–2.49, Neutral = 2.50–3.49, Agree = 3.50–
4.49, Strongly Agree = 4.50–5.0
Source: Field data, 2014
University of Ghana http://ugspace.ug.edu.gh
64
CHAPTER FIVE
5.0 DISCUSSION OF RESULTS
Introduction
This chapter discusses the results of the study. The discussion takes into consideration the
objectives of the study and its relation to literature that was reviewed with the modified
SERVQUAL model. Again, the discussion was presented in the order of the following
objectives: predictors of service quality and patient satisfaction, constituent of service quality
and the comparison of the quality healthcare of UGH and UCH.
5.1 Demographic Background
The demographic findings indicate that females largely utilized the two hospitals in accessing
healthcare services in diverse ways. This finding confirms studies by (Doyal, 2001; Say and
Raine, 2007; GLSS, 2008; Abane & Adu-Gyamfi, 2013), who also observed that healthcare
utilization is influenced by several factors all over the world and predominant among these
factors are gender, educational level, economic status and age. Again, the result reveals that
patients with higher levels of education thus those from the senior secondary school level
upwards also utilized out-patients services of the University of Ghana hospital and University of
Cape Coast hospital extensively. This corroborates the findings of Correa-de-Araujo et al (2005)
Maurer (2006) and Nicholas et al., (2007), which suggest that there is a significant relationship
between education level and health care utilization, with people of higher levels of education
sharing higher levels of healthcare utilization. Thus, the highly educated persons in societies are
conscious of their health and therefore make higher investment in their health.
University of Ghana http://ugspace.ug.edu.gh

65
However, majority of the patients are students due the fact that these hospitals are owned and
managed by the universities. Therefore, most of the students access services due to the proximity
of the hospitals to their campuses. Studies have indicated that residence is a strong determinant
of utilization of health services. People close to health facilities are more likely to access
healthcare on time (GDHS, 2008; Lahana, et al, 2011)
Furthermore, an approximated figure of 83 percent of patients were between 18 and 50 years,
This result is a clear indication that age is a significant determinant in the utilization of
healthcare as observed in previous studies (GLSS Report, 2008; GDHS, 2008; Arthur, 2012;
Abane & Adu-Gyamfi, 2013).
In assessing quality of service the constant and persistent use of the service by customer is key to
service evaluation (Porter et al., 2014). The demographic information revealed that seventy-four
percent (162) of the patients have utilized service at the two university hospitals between 2-4
times, indicating that they are well-placed to assess the quality of services rendered by the
hospital.
5.2 Predictors of service quality on Patient satisfaction
The multiple linear regression model gives adequate and significant results, indicating empathy,
communication, culture, tangibles and priority are the significant predictors of patients
satisfaction in the university hospitals in Ghana. This objective was designed to examine the best
predictors of perceived service quality dimensions on patient satisfaction.
University of Ghana http://ugspace.ug.edu.gh

66
5.2.1 Empathy
Patients perceived empathy as a relevant service quality dimension that deals with how staff
emotionally responds to the care of patients. Perceived empathy involves how staff welcomes the
patient‟s weakness. This dimension clearly spells out how staff respond to patients needs and
promptly deliver services on time. Again, it further defines how caring staff are to patients and
have the patient‟s interests at heart. Patients perceived that empathy is a key determinant for
patients satisfaction, thus patients are sensitive to how staff treat them and care for their ill health
at UGH and UCH. This finding confirms studies by Zaim et al., (2010) who indicate that
empathy is a significant service quality measure of patients satisfaction with healthcare delivery
at public hospitals in Turkey. More so, Yousapronpaiboon and Johnson (2013), indicate that
empathy is a one of the five latent dimensions that had significant influence on service quality.
The regression model revealed that a unit increase in empathy by management of the university
hospitals will increase the patient‟s satisfaction with quality healthcare by fourteen percent. In
hypothesis II, empathy is noted as a significant predictor of patient‟s satisfaction.
5.2.2 Communication
The most important predictor of patient satisfaction in this study was the dimension
„Communication‟ which indicates how patients receive adequate information and explanations
about the tests they had to undergo. Moreover, staff especially medical doctors give elaborate
information on the treatment and health condition of patients. Communication is a key
determinant of quality healthcare, since patients are able to engage with staff and effectively
discuss personal health matters that affect their health. Through this approach medical staff are
able to educate patients on how to make good choices affecting their health. The regression
analysis indicates that a unit increase in communication will increase the patient‟s satisfaction
University of Ghana http://ugspace.ug.edu.gh

67
with service delivered in the university hospitals in Ghana by twenty-six percent as evidenced
from both UGH and UCH. Furthermore, John (1991) alleged that service quality perceptions in
hospitals could be improved through improving communication between patients and healthcare
providers (Yousapronpaiboon and Johnson 2013). Again, Rao et al, (2006), Kumari et al, (2009)
and Sharma et al, (2010), indicate that doctor-patients communication is a key determinant of
quality healthcare and if upheld in hospitals will ensure patients‟ satisfaction. The university
hospital serves the most elite class, who are senior members (lectures and senior administrators),
senior and junior staff, dependents of the university workers, and the public around the university
environment, they are therefore conscious about their health and engage doctors and medical
staff in effective interpersonal communication on issues pertaining to their health.
Perceived communication was hypothesized to be a significant predictor of patient‟s satisfaction
and the linear regression model revealed communication as a good predictor of patient‟s
satisfaction.
5.2.3 Culture
Generally, in the Ghanaian context, culture is defined as the way of life of an individual and it
includes clothes, food and societal arrangements. Osei and Addei (2012), state that culture
comprises everything that a person in a community does. Thus, all activities of a community
combine to create the culture of the people. Perceived culture as dimension of quality healthcare
entails medical staff discriminating according to religion, language and ethnic background.
Medical staff are sensitive to cultural standards in healthcare delivery to patients. Patients
therefore indicated that staff uses language that they can easily understand in writing of medical
history, and drug administration. It was further perceived by patients that there is no form of
discrimination based on religion, class or ethnicity in the healthcare delivery at the university
University of Ghana http://ugspace.ug.edu.gh
68
hospitals in Ghana. Furthermore, studies by Schouten et al., (2008); Harmsen et al, (2010) reveal
that patients with a culturally different background evaluate the received health care as quality
indicator, as medical staff overcome all communication gaps to provide care to satisfy the
patient‟s need of healthcare. This empirical finding is substantiated by the study.
Again, a unit increase in culture will increase patients‟ satisfaction by seventeen percent, this is
thus a relevant factor, that the management of the university hospital needs to capitalize on this
dimension to provide an excellent patient-centred service. Therefore, culture is a significant
predictor of patient‟s satisfaction as based on the linear regression model.
5.2.4 Tangibles
Tangibles constitute the vital component that deals with the physical surrounding of the
hospitals, thus the hospital should have up-to-date facilities, modern-looking equipment as well
as adequate seating for patients. These facilities in some way influence the personal judgment of
patients to perceive that healthcare delivery is of a quality standard. The patients revealed that
physical facilities in relation to equipment and logistics ensure patients welfare hence perceived
quality healthcare in the university hospitals. This finding is noted earlier in studies by Al-
Hawary, (2011); Ceelik and Sehribanoglu, (2012); Senarath et al., (2014) that tangibility in terms
of physical environment, cleanliness, seating and modern clinical equipment has a larger effect
on perception of quality healthcare of hospital in Jordan and Turkey. Perceived tangibility is a
significant dimension for patient satisfaction with quality healthcare delivery, as the model
indicates a unit increase in tangibles will increase patients‟ satisfaction of service by twelve
percent. Thus tangibility is a good predictor of service quality for patients‟ satisfaction with
quality healthcare at the university hospitals in Ghana. Consequently, the alternative hypothesis
University of Ghana http://ugspace.ug.edu.gh
69
is upheld based on the linear regression, that tangible is a significant predictor of patients
satisfaction.
5.2.5 Priority
Perceived priority is relevant for quality healthcare, as observed by the Agency for Healthcare
Research and Quality (AHRQ) in 2005. Thus it was noted that in healthcare delivery, special
care should be given to rural folks, those with low income, minorities, children and the elderly as
well as those with special healthcare needs (MOH, 2007; GHS, 2008; Turkson, 2009). However,
in this study „priority‟ was captured as university workers and students do not join queues, and
they are given a special service at the hospital based on the fact the hospitals were established to
serve the university community. Patients perceive that priority care is significant for quality
healthcare and therefore in these special environment (university compound) management should
concentrate in providing senior and junior members with efficient and timely care to ensure
effective teaching and learning. Andersen (1995) and Aghamolaei et al., (2014) confirm that
priority care in specialized institutional hospitals promote a sense of ownership by staff and
workers who always feel proud to utilize services at these hospital. Thus they are of the view that
quality healthcare is delivered to them since the medical staff also understand the core mandate
of the institution of which all are workers. Moreso, the multiple linear regression supports the
alternative hypothesis that priority is a significant predictor of patient satisfaction. The model
further reveals that a unit increase in priority will increase patient satisfaction with quality
healthcare by eighteen percent.
University of Ghana http://ugspace.ug.edu.gh
70
5.3 Constituent patients perception on quality healthcare
There are various approaches to what is termed quality healthcare in the view of patients and in
most instances these are operationalized on scales for evaluating service quality. However, the
main drive of this objective is to allow patients express their views, natural understanding on
what they perceive as quality healthcare based on a qualitative approach. The findings revealed
four key headings for discussion based on the individual responses of the patients.
5.3.1 Timeliness
Patients were vociferous on time as a key element constituting service quality in the university
hospitals. They emphasised that time is of essential value to patients and therefore staff should
take note of the long waiting-time at the OPD, the pharmacy and the laboratory section. Patients
stressed that staff should be consistent in service delivery as they express their dissatisfaction
with what patients termed „intentional delay‟ thus nurses at the OPD were found delaying
patients intentionally with the excuse of reducing the pressure on the medical doctors.
“Sometimes we come very early in the morning, hoping to have
early care but the nurses take a long time to set up the OPD
section and taking of history too. Moreso, they bring their
relatives and friends out of the queues and serve them first,
keeping us here for a very long time, it is too bad for a university
hospital to do that” (Female patient, Trader, Aged 36).
Long waiting-time is a challenge to hospital management and patients, as patients become
frustrated and always complain about how to make management aware of how such delays affect
them. However, management are struggling to find out the best strategy in the delivery of
services to avoid keeping patients for long at the hospital. Aldana et al., (2001) confirms that a
significant reduction in waiting time is more significant to patients satisfaction in healthcare
delivery. Moreso, Atinga et al., (2011) confirmed that waiting time is an important tool of
University of Ghana http://ugspace.ug.edu.gh

71
measuring perceived quality healthcare from the perspective of patients who utilize healthcare
service.
5.3.2 Staff performance
Effective work performance in every organization is relevant for service delivery. In this regard,
senior administrators and management boards provide the necessary logistics to make sure staff
provide the needed service. Patients share this view, as they observe that quality healthcare is
hinged on work performance by staff, thus the commitment of staff to duty and the task at the
hospital is relevant for the delivery of healthcare. It was realized that some nurses at the OPD as
well as the doctors are committed to patient care as they carefully engage them to know what
really are their health needs. One respondent noted:
“........when they see the patients are in pain they try all possible
best to help the patients. Some of the nurses who are willing to
help, even go to the extent of calling others to help them to give
some knowledge and assistance on how certain things are done in
medical history writing. Some of the doctors consult a lot to help
patients” (Male patients, Civil servants, Aged 54).
Performance of staff at the hospital is deemed the centre of quality healthcare, most patients
assess the quality of care based on the enthusiasm and the commitment that medical staff attach
to care in the process of healthcare delivery. Crosby (1990) maintains that staff performance of
service influences patients‟ perception of quality healthcare delivery in a hospital. Moreover, the
performance model further indicate that staff performance and consumer attitudes are the prime
measure of service quality (Cronin &Taylor, 1992; Ladhari, 2008; Ramez, 2012). Furthermore,
Al-Hawary et al., (2011) observe that hospitals in Jordan with high-perceived service quality is
based on hospital staff performance. This reveals that indeed the performance by staff at the
hospital is key to measuring quality healthcare.
University of Ghana http://ugspace.ug.edu.gh
72
5.3.3 Service Improvement
In measuring quality healthcare, improvement in service delivery is relevant to patient-care at the
hospital. Patients were of the view that university hospital management should intermittently
evaluate the service that they provide at the OPD, the pharmacy and other departments and vary
the services to satisfy the interest of patients. It was revealed that hospital management keeps
outmoded equipment for a long time in providing services but a yearly replacement of some
equipment will enable the staff to provide efficient service at the university hospital. The
following narration illustrates typical views of the respondents:
“..........they are good in service provision but there should be new
and modern equipment such as digital thermometers to give the
best of temperature figures, sometimes, their figures are not the
correct figures after a second check”(Male patients, Teacher,
Aged 45).
Improvement in service is linked to measuring quality healthcare, some studies reveal that a
customer-oriented service provides its service in the interest of the customers and therefore
improves their activities based on the demands of the customer (Matterson, 1992; Nitin et al.,
2005; Turkson, 2009; Yildi & Demirors, 2012). Alrubaiee et al.,(2011) and Ramez (2012)
confirm that a patient‟s perception of service improvement has a strong contribution on quality
healthcare resulting in patient satisfaction with healthcare delivery.
5.3.4 Satisfactory Services
Service satisfaction is the sole interest of every customer in accessing services of any kind. Thus,
patients are of the view that a university hospital should provide service based on the patient‟s
charter, where the needs of the patients are catered for in healthcare delivery. They further note
that service provision should be satisfactory to patients, however it was revealed that patients
University of Ghana http://ugspace.ug.edu.gh

73
were satisfied with the services that staff provides at the OPD. In this stance, one respondent
indicated that:
“The staff treat us well and fine, the doctors talk to as so well.
Sometimes, if you want to use the washrooms, the nurses are
ready to help you, show you the directions to the washroom. The
nurses talk to you with respect and they show maturity towards
their activity. I am quite happy with the service delivered”
(Female patient, Trader, Aged 38).
This finding is confirmed by some studies which indicate that satisfied patients will have a
revisit intention to the facilities based on the service provided to them (Akbaba 2006; Spencer et
al, 2014). However, Nwankwo et al., (2010) found that providing unsatisfactory service in
regards to doctor‟s responsiveness, length of getting an appointment, access to core treatment
and hours of operation could negatively impact a patient‟s satisfaction with quality healthcare
(Yousapronpaiboon and Johnson, 2013).
5.4 Comparison of patient’s perception on service quality of UGH and UCH
The key focus of this objective is to compare patient‟s satisfaction with healthcare service of the
two university hospitals since their core-mandate is identical in service provision. In addition, it
is aimed at identifying the strengths and weaknesses of either facility to serve as a policy guide
to the University Health Services (UHS) in Ghana.
5.4.1 Empathy
The findings indicated that patients strongly agreed staff at the University of Cape Coast hospital
(UCH) are more empathetic to patients‟ needs than medical staff at the University of Ghana
Hospital (UGH). In addition, it is believed that majority of the OPD patients at UCH are from the
surrounding communities of the university and these communities serve as social and clinical
research laboratory for most departments in the university. Therefore medical staff show more
care and ensure that their interest is at heart in welcoming their weakness in order not to breach
University of Ghana http://ugspace.ug.edu.gh

74
the community-university relationship. However, Peprah (2014) asserts that empathy was
esteemed by patients in assessing service quality in his study conducted at Sunyani Regional
Hospital. In contrast, patients at University of Ghana hospital were neutral when assessing staff
empathy towards patients. They indicated that some of the medical staff especially some nurses
and laboratory assistant are so rude and even do not give them the needed attention when patients
are weak, as the nurses always say „patients are never pleased so why worry’. This was
confirmed by Gyapong et al., (2007); Turkson, (2009) that poor attitudes of staff, thus not
showing empathy can result in low utilization of health services despite the substantial
investment aimed at improving access to health services in Ghana.
5.4.2 Tangibles
Patients at UGH remained neutral in noting that the physical surrounding, the medical equipment
and the facilities at the hospital are not modern and up-to date. They revealed that a university
hospital of such status should have efficient medical equipment to aid quality healthcare delivery
since it is run as a private hospital by not subscribing to National Health Insurance Scheme
therefore paying for the high cost of service means there should be better healthcare delivery
aided with modern facilities and equipment. However, at UCH patients strongly agreed that,
there is the need for improvement in the seating arrangement for patients. Moreso, they were of
the view that the OPD is too crowded on Wednesday and Thursday due to hospital staff and
management meetings on these days, which delay service provision with long waiting times
coupled with floors and corridors cleaning. However, this finding is supported by the study of
Nekoei-Moghadam and Amiresmaili (2011) which note that tangible is a significant predictor of
patient satisfaction with quality healthcare at Kerman University of Medical Sciences hospital
and recommended that management of the hospital should raise the face of the physical structure
University of Ghana http://ugspace.ug.edu.gh

75
of hospitals as it promotes the confidence of patients in quality healthcare delivery. Again,
(Boyer et al., 2006; Zaim et al., 2010; Jaap van den Heuvel et al, 2013) confirm that tangible is a
key determinant by patients in assessing quality healthcare.
5.4.3 Priority
Patients at the UCH strongly agreed that priority was given to university workers and students
who access healthcare service at the hospital. Thus they indicated that they have special doctors
who serve university staff on Mondays and Thursdays. Moreover, they do not join queues with
non-university patients. At the pharmacy, there is a special section created for university workers
and students to serve them with the drugs on time, this helps to reduce the long waiting time by
staff of the university at the hospital in order for them to attend to other institutional demands.
However, patients at the UGH who are university workers revealed that they were neutral on
priority as a key dimension. They noted that only university lecturers and their families are given
that special care which is even based on selectivity while other staff of the university are made to
join the queues at the OPD, consulting rooms and pharmacy. It was realized that priority is not
given to university workers and staff (Senior and Junior members) at the hospital. This finding
collaborates with studies by Camgoz-Akdag and Zineldin (2011), who indicated that priority
services are relevant for measuring quality healthcare and therefore significant for patient‟s
satisfaction with healthcare delivery (John, 1991; Fornell et al, 1996).
5.5 Conclusion
The focus of the Ghana Health Service policy strategy on quality healthcare in Ghana is to
provide patients with their healthcare-needs based on patient-care services. This chapter provided
the discussion on the results of patients perceived service quality dimensions of UGH and UCH.
The discussion focused on the predictors of service quality that influence patient satisfaction.
University of Ghana http://ugspace.ug.edu.gh

76
This discussion further revealed that communication, priority, empathy, tangibles and culture are
key predictors of patient satisfaction supported by the empirical evidence on quality healthcare.
Moreover, the natural assessment of service quality by the patients identified as timeliness, staff
performance, service improvement and satisfactory service were discussed with the basis in
literature. Finally, a comparative discussion of UGH and UCH revealed that empathy, tangibles
and priority are significant in service delivery at the two university hospitals as the disparities in
patients assertion of the service quality was discussed.
University of Ghana http://ugspace.ug.edu.gh
77
CHAPTER SIX
6.0 SUMMARY, CONLCUSIONS AND RECOMMENDATIONS
Introduction
Patient‟s satisfaction with quality healthcare is pivotal to healthcare delivery in Ghana. The
Ministry of Heath together with service providers (Ghana Health Services, Teaching hospitals,
University Health Services, Christian Health Services) are key-runners to achieving quality
healthcare by providing patient-centred care to patients. This study was undertaken to first,
assess key service quality dimensions that are good predictors to patients satisfaction with
quality healthcare delivery in the university hospitals with the emerging restructuring of the
University Health Service to a formal healthcare service provision agency in Ghana. Second, to
determine patient‟s perception on what constitutes service quality in the two-university hospitals
and lastly to compare perception of patients on quality healthcare thus, UGH and UCH.
Multiple theoretical views were synthesized to broaden the outlook of the study where
quantitative and qualitative (questionnaires, in-depth interviews and content analysis) approaches
legitimately combined or mixed in a single study to enhance an in-depth analysis of the study.
Consequently, this resulted in a multi-method analysis, which helped to enhance the breadth and
depth of the study. In this chapter, highlights on the summary of key findings, conclusions,
contributions to knowledge and recommendations are presented.
6.1 Summary of main findings
Result from the study showed that females greatly utilize healthcare service at University of
Ghana and University of Cape Coast hospitals. Furthermore, the majority of the patients
accessing healthcare are educated to Senior High levels of education. However, students form a
larger number of the patients who access OPD services at the university hospitals in Ghana.
University of Ghana http://ugspace.ug.edu.gh

78
Patients‟ satisfaction with quality healthcare is influenced by a number of service quality
dimensions that is dependent on the type of facility under study (Zineldin, 2011). The study
revealed that communication, empathy, culture, tangibles and priority are good predictors of
patient satisfaction with quality healthcare in university hospitals in Ghana.
Furthermore, in-depth interviews with patients indicated that in their views what constitute
service quality in the hospital are timeliness, where patients were of the opinion that there are
long waiting-time at the OPD, the pharmacy and the laboratory sections. Staff performance in
relation to effective duty and task delivery was highlighted as relevant for service quality in the
university hospitals. Service improvement in healthcare delivery on timely basis and satisfactory
services to patients were identified as key constituents for service quality in the university
hospitals.
However, in comparing patients‟ perception of service quality dimension of the two university
hospitals, it was realized that empathy, tangibles and priority were the significant dimensions
that patients had varied perception, which were statistically different based on the healthcare
provision at University of Ghana and University of Cape Coast hospitals. Respondents therefore
indicated that addressing the differences could better place these hospitals in providing services
that are patients-centred.
6.2 Conclusion
Patient satisfaction with quality healthcare in Ghana is one of the key objectives of the five-year
programme of work (5YPOW) of MOH, GHS, teaching hospitals and university health service in
providing a patient-centred care at the various hospitals in Ghana. In this view, there is a
mandatory institutional requirement to publicly display the patient charter in order to keep
University of Ghana http://ugspace.ug.edu.gh
79
medical staff on their toes in providing patient-centred care, the commitment to this intervention
seem unsatisfactory. There is the need to allow for stringent health system interventions which
should include financing, planning, service delivery, monitoring and evaluation to effectively
provide service that is centred on patients interest in the university hospitals in Ghana.
The findings further underscore the need for university health services to promulgate a specified
patients charter in sync with the standards of Ghana Health Services and WHO patients‟ charter
to assure their patients on how distinct services are provided to ensure patient satisfaction with
healthcare delivery.
6.3 Contribution to Knowledge
First, this study is one of the first studies to have explored patient‟s satisfaction with quality
health in Ghana employing a comparative analysis of two university hospitals. It therefore
provides other researchers the opportunity to study service quality of both public and private
university hospitals and the impact on the individual patient‟s satisfaction with quality healthcare
in Ghana.
Existing studies on patient satisfaction with quality healthcare in Ghana had largely focused
clinical quality (Bowers et al., 1994; Brown, 2007; Chahal & Kuamari, 2010; Delle, 2013).
Others looked at hospital governance and the impact of patient satisfaction, however, there is
limited evidence on the comparative approach to quality healthcare at hospitals in Ghana
(Turkson, 2009: Atinga et al., 2011; Peprah, 2014). This study therefore adds to the expanding
literature on the comparative approach to service quality strategies of hospitals in Ghana and the
impact on patients‟ satisfaction with quality healthcare.
University of Ghana http://ugspace.ug.edu.gh
80
6.4 Recommendation
Drawing on the key findings of the study, it is recommended that the following could have
implications for policy. First, the university hospital management should draw up policies based
on the communication, empathy, culture, tangibles, and priority which will help ensure patients
satisfaction with healthcare delivery at the hospital since the above five dimensions appear to be
the best predictors of patients‟ satisfaction.
Again, while the university hospitals make efforts at improving the service quality at the
hospitals, there is the need to make a conscious effort at also improving medical staff
performance on the job, by conducting timely performance appraisals to evaluate work
performance specifically at UGH. In addition, it will be relevant for management to provide
services that are satisfactory to patients as well as to improve the quality of infrastructure, taking
into account location of facilities and services at UCH.
Finally, priority care is a pillar for quality healthcare delivery and therefore UGH should
considered this dimension in their service provision.
6.5 Limitations and opportunities for Future Research
Studies of this nature are likely to be limited in some respects. However, since academic studies
are generally intended to contribute to, rather than terminate or consummate knowledge, the
limitations of this study which are highlighted here present opportunities for further research in
advancing knowledge on patients satisfaction with quality healthcare in Ghana.
The use of the SERVQUAL scale by Parasuraman et al (1988) in assessing service quality of the
hospital is challenging, since the scale was developed for assessing service quality in marketing
and it is eurocentric by nature. Therefore, there is the need for future studies to construct another
scale to study the service quality in the university hospitals or preferably develop a standardized
University of Ghana http://ugspace.ug.edu.gh

81
scale that take into account the demographics of Ghanaian hospitals in assessing quality
healthcare and the impact on patients satisfaction.
Finally, due to resource constraints, only two university hospitals were adopted for the study,
however, future studies should concentrate on other private and public university hospitals in
Ghana.
University of Ghana http://ugspace.ug.edu.gh

82
REFERENCES
Abdallah, A. (2014). Implementing quality initiatives in healthcare organizations: drivers and
challenges. International Journal of Health Care Quality Assurance, 27(3),166
-181.
Adrienne, C., & Sinclair, E. (2002). Assessing the quality of physiotherapy services using
Servqual. International Journal of Health Care Quality Assurance, 15(5),197 -
205.
Adu-Gyamfi, A.B., & Abane A.M. (2013). Utilization of health care facilities among residents
of Lake Bosomtwe basin of Ghana. European International Journal of Science
and Technology, 2(4),131-142.
Aghamolaei, T. Eftekhaari, T.E. Rafati, S. Kahnouji, K. Shamsieh, A. Mohammad, E. S.,
Kahnouji, A. & Hosein, S.H. (2014). Service quality assessment of a southern
Iran with SERVQUAL technique: Patients perspective. Journal of Management
of Health, 34(3), 234-248.
Al-Hawary, S. I., Alghanim, S.A., & Mohammad, A.M. (2011). Quality level of health care
service provided by King Abdullah educational hospital from patient's viewpoint.
Journal of Contemporary Research in Business, 2(11), 552-572.
Aldana, J. M., Piechulek H., & Al-Sabir A. (2001). Clients satisfaction and quality healthcare
in rural Bangladesh. Bulletin of the World Health Organization, 12(9), 512-517
University of Ghana http://ugspace.ug.edu.gh

83
Aldana, J.M., Piechulek, H. & Al-Sabir, A. (2012). Patients care with healthcare in public
hospitals in Bangaladesh. Journal of Health Policy and Planning, 13(3), 320-
342.
Akbar, A. K., Mey, L. P., & Fie, D. Y. G. (2006). Measuring service quality and customer
satisfaction of the hotels in Malaysia: Malaysian, Asian and non-Asian hotel
guests. Journal of Hospitality and Tourism Management, 13(2), 144-160.
Alrubaiee, L. & Alkaaida, F. (2011). The mediating effect of patient satisfaction in the patients'
perceptions of healthcare quality - Patient trust relationship. International
Journal of Marketing Studies, 3(1), 103-127.
Andaleeb, S.S. (2001). Service Quality Perceptions and Patient Satisfaction: a Study of
Hospitals in a Developing Country. Social Science and Medicine, 52(3), 1359-
1370.
Andaleeb, S.S. (1998). Determinants of customer satisfaction with hospitals: A managerial
model. International Journal of Healthcare Quality Assurance, 11(6), 181-197.
Andreassen R. M. (1995). Revisiting the behavioral model and access to medical care: does it
matter? Journal of Health and Social Behavior, 36(1),1-10.
Anderson, E. A. (1995). Measuring service quality at a university health clinic. International
Journal of Health Care Quality Assurance, 8(2), 32-37.
University of Ghana http://ugspace.ug.edu.gh

84
Ariffin, A.A.M., & Aziz, N.A. (2008). Determining the service quality dimensions and zone of
tolerance for hospital services in Malaysia. The Business Review, 10(2), 164-
169.
Arthur, E. (2012). Wealth and antenatal care use: implications for maternal health care utilization
in Ghana. Health Economics Review, 2(14), 526-548.
Asubonteng, P. McCleary, K. J., & Swan, J. E. (1996). SERVQUAL revisited: a critical review of
service quality. The Journal of Services Marketing, 10(6), 2-18.
Atinga, R.A., Abekah-Nkrumah, G. & Domfeh, K.A. (2011). Managing healthcare quality: a
necessity of patient satisfaction. International Journal of Healthcare Quality
Assurance, 24 (7), 548-563.
Babakus, E. & Mangold, W.G. (1992). Adapting the SERVQUAL scale to hospital services: an
empirical investigation. Health Services Research, 26 (2), 767-786.
Babbie, E.R. (2004). The Basics of Social Research (6th
ed.). Cengage Learning.
Baker, C. Akgun, H.S., & Al Assaf, A.F. (2008). The role of expectations in patient assessments
of hospital care: an example from a university hospital network, Turkey.
International Journal of Health Care Quality Assurance, 21(4), 343-355.
Baltussen, R. M. P. M., Yé, Y., Haddad, S., & Sauerborn, R. S. (2002). Perceived quality of care
of primary health care services in Burkina Faso. Health policy and planning,
17(1), 42-48.
University of Ghana http://ugspace.ug.edu.gh

85
Bara, A. C., Van den Heuvel, W.J.A., Maarse, J.A.M., & Van Dijk J. P. (2012). User‟s
satisfaction with the Romanian health care system: an evaluation of recent health
care reforms. European Journal of Public Health, 12(4), 39- 44.
Bart Lariviere A. K. (2014). How technical and functional service quality drive consumer
happiness. Journal of Service Management, 25(1), 30 - 48.
Baumann, C. Burton, S., Elliott, G. & Kehr, H. M. (2007). Prediction of attitude and behavioural
intentions in retail banking. International Journal of Bank Marketing, 25(2),
102-116.
Bendapudi, N., & Berry, L. L. (1997). Customers' motivations for maintaining relationships with
service providers. Journal of retailing, 73(1), 15-37.
Best M. & Neuhauser, D. (2011). Heroes and martyrs of quality and safety: Quality safety health
care. 19(5), 466-468.
Bielen, F., & Demoulin, N. (2007). Waiting time influence on the satisfaction-loyalty relationship
in services. Managing Service Quality: An International Journal, 17(2), 174-
193.
Bitner, M. J. (1990). Evaluating service encounters: the effects of physical Surroundings and
employee responses. Journal of Marketing, (54), 69-82.
Blumenfeld S.N. (1993). Quality assurance in transition. Papua New Guinea Medical Journal,
36(2), 81- 89.
Bisschoff, C., & Clapton, H. (2014). Measuring customer service in a private hospital. Problems
and Perspectives in Management. 12(4), 44-54
University of Ghana http://ugspace.ug.edu.gh

86
Boshoff, C., & Gray, B.(2004). The relationships between service quality, customer satisfaction
and buying intentions in the private hospital industry. South African Journal of
Business Management. 35(4), 27-37.
Bowen, J.T., & David E. (2005). Service Quality Blackwell encyclopaedic, Dictionary of human
resource management, Pl 341, 340P. 4th edition Pearson education limited.
Bowers, M.R., Swan, J.E., & Koehler, W.F. (1994). What attributes determine quality and
satisfaction with healthcare delivery? Healthcare Management Review, 19(4),
49-55.
Boyer L. & Francois P. (2006). Perception and use of the results of patient satisfaction surveys
by care providers in a French teaching hospital. International Journal of Quality
in Health care, 18(5), 359-364.
Brant, R. (2007). Quality healthcare management in the aged care facilities. Journal of
Healthcare Quality Assurance, 74(3), 432-452.
Bradshaw, P.L. & Bradshaw G. (2004). Health Policy for Healthcare Professionals. SAGE,
London.
Brent, M. J., Morris, M.D., Alex A., Jahangir, M. D., Manish K., & Sethi, M.D. (2013). Patient
satisfaction: An emerging health policy issue. Journal of American Academy of
Orthopaedic Surgeons, 16(7), 905-912.
Brown, C. (2007). Where are the patients in the quality of health care? International Journal for
Quality in Health Care, 19(3), 125-136.
University of Ghana http://ugspace.ug.edu.gh

87
Brogowicz, A. A., Delene, L. M., & Lyth, D. M. (1990). A synthesised service quality model
with managerial implications. International Journal of Service Industry
Management, 1(1), 27-45.
Butler, D., Oswald, S. & Turner, D. (1996). The effects of demographics on determinants of
perceived health care service quality. Journal of Management in Medicine,
10(5), 8-20.
Buttle, F. (1996). Servqual: review, critique, research agenda. European Journal of Marketing,
30(1), 8–32.
Cadott, E., Woodruff, R. & Jenkins, R. (1987). Expectations and norms in Models of consumer
satisfaction. Journal of Marketing Research, 24(4), 305-314.
Camgöz-Akdag, H., & Zineldin, M. (2010). Quality of health care and patient satisfaction: An
exploratory investigation of the 5Qs model at Turkey. Clinical Governance: An
International Journal, 15(2), 92-101.
Camgoz-Akdag H., Zineldin M. & Vasicheva V., (2011). Measuring, evaluating and improving
hospital quality parameters/dimensions – an integrated healthcare quality
approach. International Journal of Health Care Quality Assurance, 24(8), 654-
662.
Carlzon J., (1987). Moments of truth, Cambridge, MA: Bllinger Publishing Company.
Carman, J.M. (2000). Patient perceptions of service quality: combining the dimensions. Journal
of Services Marketing, 14(4) 337-382.
University of Ghana http://ugspace.ug.edu.gh
88
Çelik, H.E., & Şehribanoğlu, S. (2012). Partial least square (PLS) path modeling and its
application: Evaluation of patient satisfaction with service quality
(SERVQUAL). African Journal of Business Management, 6(12), 4536-4542.
Central Regional Health Directorate (2013). Quality Assessment of Hospital Report, Ghana
Health Service. GHS, Accra.
Chahal, H., & Kumari, N. (2010). Development of multidimensional scale for healthcare service
quality (HCSQ) in Indian context. Journal of Indian Business Research, 2(4),
230-255.
Cohen, G. (1996). Age and health status in a patient satisfaction survey. Social Science and
Medicine, 42 (7), 85-93.
Collins, C.G., & Joyce, P. (2008). Focus on quality in healthcare in Ireland. International
Journal of Health Care Quality Assurance, 21(2) 219 - 228.
Conway, T., & Willcocks, S.(1997). The role of expectations in the perceptions of healthcare
quality: developing conceptual model. International Journal of Health Care
Quality Assurance, 10(3),131-140.
Correa-de-Araujo, R., McDermott, K. & Moy, E. (2005), Gender differences across racial and
ethnic groups in the quality of care for diabetes, Women Health Issue. 16(2), 56-
65.
Coulthard, L.J.M. (2004). Measuring service quality: A review and critique of research using
SERVQUAL. International Journal of Market Research, 46 (4), 479-497.
University of Ghana http://ugspace.ug.edu.gh

89
Coulter, R. A., & Ligas, M. (2000). The long good‐bye: The dissolution of customer‐service
provider relationships. Psychology & Marketing, 17(8), 669-695.
Creswell, J. W. (2007). Qualitative inquiry and research design: Choosing among five traditions
(2nd Ed). Thousand Oaks, CA: Sage.
Creswell, J. W., & Clark, P. V. L. (2007). Designing and Conducting mixed methods research.
Thousand Oaks, CA: Sage.
Creswell, J.W. (1998). Qualitative Inquiry and Research Design Choosing Among Five
Traditions. Thousand Oaks, CA: Sage Publications.
Cronin Jr, J. J., & Taylor, S. A. (1994). SERVPERF versus SERVQUAL: reconciling
performance-based and perceptions-minus-expectations measurement of
service quality. The Journal of Marketing, 125-131.
Cronin Jr, J. J., & Taylor, S. A. (1992). Measuring service quality: a reexamination and
extension. The journal of marketing, 55-68.
Crosby, L.A., Evans, K., & Cowles, D. (1990). Relationship quality in services selling: an
interpersonal influence perspective. Journal of Marketing, 54(2), 68-81.
Crowe, R., Gage, H., Hampson, S., Hart, J., Kimber, A., Storey, L. & Thomas, H. (2002). The
measurement of satisfaction with healthcare: implications for practice from a
systematic review of the literature. Health Technology Assessment, 6(32), 221-
244.
University of Ghana http://ugspace.ug.edu.gh

90
D‟Souza, S.C., & Sequeira, A.H., (2012). Measuring the customer-perceived service quality in
health care organization: A case study. Journal of Health Management, 14(1),
27- 41.
Curry, A., & Sinclair, E. (2002). Assessing the quality of physiotherapy services using
SERVQUAL. International Journal of Health Care Quality Assurance, 15(5),
197-205.
Dabholkar, P. A., Thorp, D. I., & Rentz, J. O. (1996). A Measure of service quality for retail
stores: Scale development and validation. Journal of the Academy of Marketing
Science, 24(2), 3-16.
Dabholker, P.A., Shephered, C.D. & Thorpe, D.L. (2000). A conceptual framework for service
quality: an investigation of critical conceptual and measurement issues through a
longitudinal study. Journal of Retailing, 76 (2), 139-173.
Dansky, K. H., & Milles, J. (2007). Patient Satisfaction with Ambulatory healthcare services:
waiting time and filling time. Health Service Administration, 42(2), 165-177.
Delle, E. (2013). The Influence of Perception of Organizational Politics on Employee Job
Involvement and Turnover Intentions: Empirical Evidence from Ghanaian
Organizations. European Journal of Business and Management, 5(9),151-160.
Department of Performance and Quality Assurance (2012). A Five-year Strategic Plan Report.
University of Cape Coast, Ghana.
University of Ghana http://ugspace.ug.edu.gh

91
Devebakan, N. & Aksarayli, M. (2005). The usage of SERVQUAL scores for the measurement
of quality of perceived service in health facilities and implementation of private
Altinordu hospital. Journal of Institute of Social Sciences, 5(1), 38-53.
Doyal, L. (2001). Sex, gender and health: the need for a new approache. British Medical Journal.
323(3), 1061-1063.
Drain, M. (2001). Quality improvement in primary care and the importance of patient
perceptions. Journal of Ambulatory Care Management, 14 (2), 30-46.
Duggirala, M., Rajendran, D. & Anantharaman, R. N. (2010). Patient-perceived dimensions
Benchmarking: International Journal of Patient care, 15(5), 560-583.
Eccles M.P., Armstrong, D., Baker, R., Cleary, K., Davies, H., & Davies, S. et al. (2009). An
implementation research agenda. Implementation Science, 4(18), 234-253.
Elbeck, M. (1987). An approach to client satisfaction measurement as attribute of health service
quality. Health Care Management Review, 12(3), 47-52
Epstein, A. (1990). Sounding board: the outcomes movement, will it get us where we want to
go? New England Journal of Medicine, 323 (4), 266–269.
Esain, A.E., Williams, S.J., Sandeep G., Caley, L. & Cooke, M.W. (2012). Healthcare quality
improvement-policy implications and practicalities. International Journal of
Health Care Quality Assurance, 25 (7) 565 – 585.
University of Ghana http://ugspace.ug.edu.gh
92
Essiam, J.O. (2013). Service quality and patients satisfaction with healthcare delivery: Empirical
evidence from patients of the out patient department of a public university
hospital in Ghana. European Journal of Business and Management, 5(28), 288-
395.
Fekadu, A., Andualem M, & Yohannes, H. M. (2011). Assessment of clients satisfaction with
health service delivery At Jimma Unversity Specialized Hospital. Ethopian
Journal of Health Sciences, 21(2), 101-109.
Fillingham, D. (2008). Lean healthcare. Kingsham Press, UK.
Fornell, C., Johnson, M., Anderson, E. , Cha, J. & Bryant, B. (1996). The American customer
satisfaction index: Nature, purpose, and findings. Journal of Marketing, 60(4), 7-
18.
Fottler, M. D., & Blair, J.D. (2002). Introduction: New concepts in health care stakeholder
management theory and practice. Health Care Management Review, 27(2), 40–
51.
Friedenberg, R. V., (1997). Communication consultants in political campaigns: Ballot box
warriors. Westport, CT: Praeger Publishers.
Frost, F. A., & Kumar, M. (2000). SERVQUAL - an internal adaptation of the gap model in
large service organization. Journal of Services Marketing, 14(5), 358-377.
Garvin, D. (1988). Managing quality. New York: Macmillan.
Gay, L.R. (1992). Educational research: consequences of analysis and application (4th edition).
New York: McMillan Publishing Company.
University of Ghana http://ugspace.ug.edu.gh

93
Ghana Health Service (2003). Annual Report. Accra: Ghana Health Service.
Ghana Health Service (2008). Annual Report. Accra: Ghana Health Service.
Ghana Health Service (2010). The Health Sector in Ghana: Facts and Figure. Accra: Ghana
Health Service.
Ghana Health Service (2012). Holistic Assessment of Health Sector Programme of Work. Ghana
Health Service Annual Report. Accra: Ministry of Health.
Ghana Statistical Service (2008). Ghana Living Standards Survey Report of The Fifth Round
(GLSS 5).
Ghana Statistical Service (GSS), Ghana Health Service (GHS), and ICF Macro (2009). Ghana
Demographic and Health Survey 2008. Accra, Ghana: GSS, GHS, and ICF
Macro.
Gilbert, F.W., Lumpkin, J.R.& Dant, R.P. (1992), Adaptation and customer expectations of
health care options. Journal of Health Care Management, 12 (3), 46-55.
Gill, L. & White, L. (2009). A critical review of patient satisfaction. Leadership in Health
Services, 22(1), 8 -19.
Goncalves, C., Biscaia, R., Correia, A. & Diniz, A. (2014). An examination of intentions of
recommending fitness centers by user members. The Journal of Physical
Education, 20(4), 384-391
Gosh, D. E. (2013). U.S. Patient Care Policy No. 3,409, 223. Washington, DC: U.S. Patent and
Trademark Office.
University of Ghana http://ugspace.ug.edu.gh
94
Groonroos, C. (1984). A service quality model and its market implication. European Journal of
Marketing, 18(4), 36-44.
Guest, G., Bunce, A. & Johnson, L. (2006). How many interviews are enough? An experiment
with data saturation and variability. Field Methods, 18,59-82.
Gunawardane, G. (2009). Relationship between dimensions of internal service quality and the
nature of the internal service encounter - A study in the healthcare industry.
California Journal of Operations Management, 7(1), 21-30.
Gunawardane G. (2011). Reliability of the internal service encounter. International Journal of
Quality & Reliability Management, 28(9), 1003-1018.
Gundersen, M.G., Heide, M., & Olsson, U.H. (1996). Hotel guest satisfaction among business
travelers: What are the important factors? Cornell Hotel & Restaurant
Administration Quarterly, 37(2), 72-78.
Gyapong, J., Garshong, B., Akazili, J., Aikins, M., Agyepong, I., & Nyonator, F. (2007). Critical
Analysis of Ghana‟s Health System: With a focus on equity challenges and the
National Health Insurance. SHIELD Work package 1 Report NDPC.
Hansen, P.M, Peters. D.H, & Niayesh, H. (2008). Measuring and managing progress in the
establishment of basic health services: The Afghanistan health sector balanced
scorecard. International Journal Health Planning Management, 23(3), 107-127.
University of Ghana http://ugspace.ug.edu.gh

95
Haque, A. K. M., Sarwar, A. A. M., Yasmin, F., Anwar, A., & Nuruzzaman (2012). The impact
of customer perceived service quality on customer satisfaction for private health
centre in Malaysia: a structural equation modeling approach. Information
Management and Business Review, 4(5), 257-267.
Harmsen, M., Gaal S., Van Dulmen, S., de Feijter, E., Giesen, P., & Jacobs, A. (2010). Patient
safety in Dutch primary care: a study protocol. Implementation Science, 5(50),
332-346.
Haywood-Farmer, J. (1988). A conceptual model of service quality. International Journal of
Operations and Production Management, 8(6), 9-29.
Heidegger, T., Saal, D. & Nuebling, M. (2006). Patient satisfaction with anaesthesia care: what is
patient satisfaction, how should it be measured, and what is the evidence for
assuring high patient satisfaction. Best Practice and Research Clinical
Anaesthesiology, 20(2), 331-346.
Hulka, B.S., Zyzanski, S.1., Cassel, J.C. & Thompson, S.J. (1970). Scale for the measurement of
satisfaction with medical care: Modifications in content, format and scoring.
Medical Care, 12(6), 11-18.
IOM- Committee on quality of care in America. (2001). Crossing the Quality Chasm: a new
health system for the 21st century. National Academy Press. Washington.
Irfan, S.M., & Ijaz, A. (2011). Comparison of service quality between private and public
hospitals: Empirical evidences from Pakistan. Journal of Quality and Technology
Management, 4(1), 1-22.
University of Ghana http://ugspace.ug.edu.gh
96
Jabnoun, N., & Chaker, M. (2003). Comparing the quality of private and public hospitals.
Managing Service Quality. 13(4), 290-299.
John J., (1991). Patient satisfaction: The impact of past experience. Journal of Health Care
Marketing, 12(3), 56-64.
Joshi, K. P., Finin, T., & Yesha, Y. (2013). Integrated lifecycle of IT services in a cloud
environment. In proceedings of the third international conference on the Virtual
Computing Initiative. International Journal of Computing, 23(3), 23-34.
Kerlinger, F. N.(1973). The mythology of educational research: The methods approach. School
and Society, 88(1). 149-151.
Kleinman, A., (2012). Rebalancing academic psychiatry: why it needs to happen-and soon. The
British Journal of Psychiatry, 20 (1) 421-422.
Kotler, P., Armstrong, G., Saunders, J. & Wong, V., (2002). Principle of marketing, (3rd
eds).
John Wiley & Sons.
Kotler, P. & Keller, K. L. (2009). Marketing management (13th eds). Victoria University Press.
New Jersey.
Kumaraswamy, S. (2012). Service quality in healthcare centres: An empirical study.
International Journal of Business and Social Science, 3(16), 141-150.
Kumasey, A. S. (2014). Service Quality and Customer Satisfaction: Empirical Evidence from the
Ghanaian Public Service. European Journal of Business and Management, 6(6),
172-181.
University of Ghana http://ugspace.ug.edu.gh

97
Kumari, R., Idris, M., Bhushan, V., Khanna, A., Agarwal, M., & Singh, S. (2009). Study on
patient satisfaction in the government allopathic health facilities of Lucknow
district, India. Indian Journal of Community Medicine, 34(1), 35-51.
Ladhari, R. (2008). Alternative Measure of Service Quality: Review Journal of Healthcare
Policy, 33(3), 22-34.
Lahana, E., Pappa E., & Naikas D. (2011). Do place of residence and ethnicity affect health
services utilization? Evidence from Greece. International Journal for Equity in
Health, 34(2), 23-45.
Larsson, G. & Wilde-Larsson, B. (2010). Quality of care and patient satisfaction: A new
theoretical and methodological approach. International Journal of Health Care
Quality Assurance, 23(2), 228-247.
Leatherman, S., & Sutherland, K. (2003). The quest for quality in the NHS: A mid term
evaluation of the ten-year quality agenda. The Stationery Office.
Lee, H., Lee, Y. & Yoo, D. (2000). The determinants of perceived service quality and its
relationship with satisfaction. Journal of Service Marketing, 14 (3), 217-231.
Lewis, B.R. (1994), In Meidan, A., Lewis, B.R., & Moutinho, L. (Eds), Service Quality: Recent
Developments in Financial Services; Financial Services Marketing: A Reader,
London: The Dryden Press.
Lim, P. & Tang, N. (2000). A study of patient‟s expectations and satisfaction in Singapore
hospitals. International Journal of Health Care Quality Assurance, 13 (7), 290-
299.
University of Ghana http://ugspace.ug.edu.gh

98
Lichtenberg, F. R. (2010). The quality of medical care, behavioral risk factors, and longevity
growth. International Journal of Health Care Finance and Economics,11(1), 1-
34.
Luk, S. T., & Layton, R. (2004). Managing both outcome and process quality is critical to quality
of hotel service. Total Quality Management, 15(3), 259-278.
Matterson J., (1992). A service quality model based on an ideal value standard. International
Journal of Service Industry Management, 3(3), 18-33.
Maurer, J. (2006). Socioeconomic and Health Determinants of Health Care Utilization Among
Elderly Europeans: A New Look at Equity, Intensity and Responsiveness in Ten
European Countries. HEDG Working Paper 06/08 ISSN 1751-197.
Mekoth, N, G. Babu, Y., Dalvi, N. Rajanala, K. & Nizomadinov, C. (2012). Service encounter
related process quality, patient satisfaction and behavioral. Intentional Journal of
Management, 6(4), 333-350.
Mels, Y. & Fobi, D. (1997). The validation of the generic service quality dimensions: an
alternative approach. Journal of Retailing and Consumer Services, 8(6), 311-
324.
Mills, M., Van de Bunt, G.G. & de Bruijn, J. (2006). Comparative research persistent problems
and promising solutions. International Journal of sociology. 21(5), 619–631.
Ministry of Health (2006). Independent Review of Programme of Work – 2006, Accra. Ministry
of Health.
University of Ghana http://ugspace.ug.edu.gh
99
Ministry of Health (2007). Independent Review of Programme of Work – 2006. Accra: Ministry
of Health.
Ministry of Health (2007b). Quality Healthcare Delivery Assessment Report. Accra. Ministry of
Health.
Nai-Hwa, L., Shu-Luan. K. & Hsai, H. (2008). The effects of service quality dimensions on
customer satisfaction across different service types: Alternative differentiation as
a moderator. Advances in Consumer Research, 35 (2), 522-532.
Naidu, A. (2009). Factors affecting patients satisfaction and healthcare. International Journal of
Health Care Quality Assurance, 22(4), 366-381.
Nekoei-Moghadam, M. & Amiresmaili, M., (2011). Hospital services quality assessment.
International Journal of Health Care Quality Assurance, 24(1), 57-66.
Neuman, W. L. (2007). Basics of social research: quantitative and qualitative approaches (2nd
education, Boston: Pearson/Allyn and Bacon.
Neuman, W.L. (2011), Social Research Methods: Qualitative and Quantitative Approaches, 7th
education, Pearson/Allyn and Bacon, Boston.
Nicholas, L., Barton, P. L., Glazner, J., & McCollum, M. (2007). Diabetes, minor depression and
health care utilization and expenditures: a retrospective database study Cost
Effectiveness and Resource Allocation. Journal of medicine, 5(4), 123-134.
Nitin S. and Deshmukh, S.G. (2005). Service quality models: a review. International Journal of
Quality & Reliability Management, 22(9), 913-949.
University of Ghana http://ugspace.ug.edu.gh
100
Nwankwo, N. S., Frimpong, O., & Dason, B. (2010). Measuring Service Quality and Patient
Satisfaction with Access to Public and Private Healthcare Delivery. International
Journal of Public Sector Management, 23(3), 203- 220.
Oh H. (1999). Service quality, customer satisfaction, and customer value: A holistic approach.
Journal of marketing, 56(3), 23-36.
Oliver, A. (2005). The English National Health Service, 1975-2005. Health Economics. 14, S75-
S99.
Oliver, R.L. (1993). A conceptual model of service quality and service satisfaction: compatible
goals, different concepts, in Swartz, T.A., Bowen, D.E. and Brown, S.W. (Eds),
Advances in Services Marketing and Management, 2(4) 65-85.
Osei R., & Addei G.H., (2012). Re-definition of culture, perspective from traditional Ghana.
Journal of Sociology, 63(4), 234-253.
Osei, I., Garshong, B., Owusu Banahene, G., Gyapong, J., Tapsoba, P., Askew, I., Ahiadeke, C.,
Killian, R. & Bonku, E. (2005), The Ghanaian Safe Motherhood Programme:
Evaluating the Effectiveness of Alternative Training Models and Other
Performance Improvement Factors on the Quality of Maternal Care and Client
Outcomes, Health Research Unit, Ghana Health Service, 23-38.
Oslen, R.M., Byrant, C.A., McDemont, R. J., & Ortinau, D. (2013). The better model to predict
and improve pediatric healthcare quality: performance or importance-
performance? Healthcare Management Care Review. 38(4), 317-324.
University of Ghana http://ugspace.ug.edu.gh

101
Owusu-Frimpong, N., & Dason, B. (2010). Patient satisfaction, service quality and with access to
private healthcare delivery. International Journal of Public Sector Management,
23(3), 203-220.
Pakdil, F., & Harwood, T.M. (2005). Patient satisfaction in a pre-operative assessment clinic: an
analysis using SERVQUAL dimensions. Total Quality Management, 16(3),15-
30.
Pallant, J. (2005), SPSS Survival Manual (2nd ed.), UK Open University Press.
Parasuraman, A., Berry, L. L., & Zeithaml, V. A., (1991). Refinement and reassessment of the
SERVQUAL scale. Journal of Retailing, 67(4), 420–450.
Parasuraman, A., Zeithaml, V. A., & Berry, L. L. (1985). A conceptual model of service quality
and its implications for future research. Journal of Marketing, 49(4), 41-50.
Parasuraman, A., Zeithaml, V. A., & Berry, L. L. (1988). SERVQUAL: A multiple-item scale
for measuring customer perceptions of service quality. Journal of Retailing,
64,12–40.
Pena, G. K., Elliott, M. N., Morales, L. S., Algazy, J. I., Kravitz, R. L., Broder, M. S., ... &
McGlynn, E. A. (2013). Health information on the Internet: accessibility, quality,
and readability in English and Spanish. Jamal Journal, 285(20), 2612-2621.
Peakash, B. (2010). Patient satisfaction in healthcare surgery. Journal of Cutaneous and
Aesthetic Surgery, 3(3), 151-155.
University of Ghana http://ugspace.ug.edu.gh

102
Peprah, A. A. (2013), Health Care Delivery in Sub-Saharan Africa: Patients‟ satisfaction and
perceived service quality, A case study of Sunyani Regional Hospital in Ghana.
Hospital Management, 18(2), 67–82.
Peprah, A.A.(2014). Determinant of Patients‟ Satisfaction at Sunyani regional Hospital. Ghana
International Business and Social Research, 4(1), 96-108.
Piligrimiene, Z. and Buciuniene, I., (2005). Healthcare quality evaluation: Medical marketing
approach. Organizaciju Vadyba Sisteminiai Tyrimal, 34(16) 127- 140.
Piper, N. & Lamb, D. (2014). The patients experience: measuring the quality care in the Defence
Medical Services. British Medical Journal, 106(2), 155-163.
Porter, J. E., Cooper, S. J., & Sellick, K. (2014). Family presence during resuscitation (FPDR):
Perceived benefits, barriers and enablers to implementation and practice.
International Emergency Nursing, 22(2), 69–74.
Radhika, V., Assaf, R.R., & Al-Assaf, A. F. (2007). Making patient safety and quality
improvement act of 2005 work. Journal for Healthcare Quality Assurance,
12(4), 12-25.
Ramez, W.S., (2012). Patients‟ perception of healthcare quality, Satisfaction and behavioral
intention: An empirical study in Bahrain. International Journal of Business and
Social Science, 3(18), 131-141.
Rao, M. Clarke, A. Sanderson, C. & Hammersley R. (2006). Patients' own assessments of quality
of primary care compared with objective records based measures of technical
quality of care: Cross Sectional Study. British Medical Journal, 33(19), 355-375.
University of Ghana http://ugspace.ug.edu.gh

103
Rose, R.C., Uli, J., Abdul, M., & Ng, K. L. (2004). Hospital service quality: a managerial
challenge. International Journal of Healthcare Quality Assurance, 17(3), 146–
159.
Reynolds, K. E., &, Beaty, S. E. (1999). Customer benefits and company consequences of a
retail-customer relationship. Journal of Retailing, 75 (1), 11-32.
Rust, R.T., & Oliver, R.L. (1994). Service quality: insights and managerial implications from the
frontier. In Rust, R.T. & Oliver, R.L. (Eds), Service quality: New directions in
theory and practice, 241-268. UK Allyn/Beacon.
Scale J., Terry R and Torres M. (2009). Are teachers ready to integrate science concepts into
secondary agriculture programs? Journal of Agricultural education, 50(2), 100-
111.
Santos, J. (2003). E-service quality: a model of virtual service quality dimensions. Managing
Service Quality, 13(3), 233-246.
Saunders, M., Lewis, P. & Thornhill, A. (2009). Research methods for business students. UK,
Allyn/Beacon.
Say, L. & Raine, R. (2007). A systematic review of inequalities in the use of maternal health care
in developing countries: examining the scale of the problem and the
importance of context. Bulletin of the World Health Organization, 85(10), 733-
820.
University of Ghana http://ugspace.ug.edu.gh

104
Schouten, L.M., Hulscher M.E., van Everdingen J.J., Huijsman R., & Grol R. (2008). Evidence
for the impact of quality improvement collaboratives: Systematic review. British
Medical Journal, 33(6), 1482-1494.
Senarath, U., Wickramage, K. & Peiris, S. L. (2014). Prevalence of depression and its associated
factors among patients attending primary care settings in the post-conflict
northern province in Sri Lanka: A cross-sectional study. BMC Psychiatry, 14(1),
85-96.
Sharma B. M., & Cyril de Run, E. (2010). Private healthcare quality: applying a SERVQUAL
model. International Journal of Healthcare Quality Assurance, 23(7), 658-673.
Sharma, R.D., and Gupta, M. (2004). Patient satisfaction in public out patient health care
services. The Journal of Health Management, 6(1), 23-45.
Shewchuk, R. M., & Carney, L. W. (1994). The great gap. Physicians' perceptions of patient
service quality expectations fall short of reality. Journal of Health Care
Marketing, 14(2), 32-39.
Sodani, P. R. & Kalpa S., (2014) A Study on Patient satisfaction at a multi super specialty
hospital in Delhi, Hospital Topics, 92(1), 1-6.
Solomon, M. R. (2009). Consumer behaviour: buying, having, and being, (8th eds), Upper
Saddle River, N.J.: Pearson Prentice Hall.
Soteriou, A.C. & Stavrinides, Y. (2000). An internal customer service quality data envelopment
analysis model for bank branches. International Journal of Bank Marketing,
18(5), 226-52.
University of Ghana http://ugspace.ug.edu.gh
105
Spencer, R., & Campbell, S.M. (2014). Tools for primary care patient safety: A narrative review.
Journal Healthcare Quality and Assurance 32(3), 324-339.
Spreng, R.A. & Mackoy, R.D. (1996). An empirical examination of a model of perceived service
quality and satisfaction. Journal of Retailing, 72(3) 201-214.
Steiber, S.R. (1989). Preventing pitfalls in patient surveys. Health Care Strategic Management,
4(2), 13-16.
Steinwach, D.M., & Hughes, R.G. (2012). Patient safety and quality: An evidence-based
handbook for nurses. Agency for Quality Healthcare Research and Quality,
USA.
Suki, N. M., Lian, C.C J. & Suki, N.M., (2011). Do patients‟ perceptions exceed their
expectations in private healthcare settings? International Journal of Health Care
Quality Assurance, 24 (1), 42-56.
Swamy, A.V.(1997). A Simple test of the nutrition-based efficiency wage model. Journal of
Development Economics, 53(3), 85-98.
Tabachnick, B.G. & Fidell, L.S. (2001). Using multivariate statistics (5th ed.), Allyn & Beacon,
Needham Heaights.
Taner, T. & Antony, J. (2006). Comparing public and private hospital care service quality in
Turkey. International Journal Healthcare Quality Assurance. 19(2), 233-246.
University of Ghana http://ugspace.ug.edu.gh

106
Tangcharoensathienm, V., Bennett, S., Khongswatt, S., Supacutikul, A. & Mills, A. (1999).
Patient satisfaction in Bangkok: the impact of hospital ownership and patient
payment status. International Quality Health Care , 11 (4),309-317.
Teas, R. K. (1994). Expectations, performance evaluation and consumers‟ perceptions of quality.
Journal of Marketing, 57(5), 18-34.
Teddlie, C. & Tashakkori, A. (2009). Foundations of mixed methods research. Thousand Oaks,
CA: Sage Publications.
Tucker, J.L. & Adams, S.R. (2001). Incorporating patients‟ assessment of satisfaction and
quality: an integrative model of patients‟ evaluations of their care. Managing
Service Quality, 11(4), 272-286.
Turkson, P.K. (2009). Perceived quality of healthcare delivery in a rural district of Ghana.
Ghana Medical Journal, 43(2), 65–70.
Turner, P. (2011). Quality in health care and globalization of health services: accreditation and
regulatory oversight of medical tourism companies. International Journal of
Quality Healthcare. 23(1), 1-7.
Van den Heuvel, J., Gerard, C., Niemeijer, R., & Does, J.M.M., (2013). Measuring healthcare
quality: the challenges. International Journal of Health Care Quality
Assurance, 26 (3), 269 – 278.
University of Cape Coast Hospital Annual Report (2013). Assessment and Performance
Appraisal, Annual Release. University of Cape Coast, Ghana.
University of Ghana http://ugspace.ug.edu.gh

107
Urden, L. D. (2002). Patient satisfaction measurement: Current issues and implications.
outcomes Management, 7(2), 194–200.
Ware, J.E. & Snyder, M.K. (1975). Dimensions of patient attitudes regarding doctors and
medical care services. Medical Care,13(8), 669-682.
Wensing, M. J., Laurant, M. G., Franx, G. C., Jacobs, A. J., & Versteeg, M. H. (2012). Factors
associated with the impact of quality improvement collaboratives in mental
healthcare: an exploratory study. Implementation Science, 7(1),34-54.
Weitzman, B.C. (1995). Health care delivery in the United States, (5th ed.). Berlin: Springer.
Williams, B. (1994). Patient satisfaction: a valid concept? Social Science and Medicine, 38(1),
509-516.
Wisniewski, M. & Wisniewski, H. (2005). Measuring service quality in a Hospital colposcopy
clinic. International Journal of Health Care Quality Assurance, 18(3), 217- 228.
World Health Organization (2008). Healthcare quality measures-Statewide quality report.
Geneva: World Health Organization.
World Health Organization (2010). Primary healthcare: Now more than Ever. Geneva: World
Health Organization.
World Health Organization (2012). Patient Safety Research a guide for developing training
programmes. Geneva: World Health Organization.
World Health Organization (2013). Quality of care: a process for making strategic choices in
health systems. Geneva: World Health Organization.
University of Ghana http://ugspace.ug.edu.gh

108
World Health Organization (2014). Ten facts on Patients Safety. Geneva: World Health
Organization.
Yesilada, F. & Direktor, E. (2010). Health care service quality: a comparison of public and
private hospitals. African Journal of Business Management, 4(1), 962-971.
Yildiz, O., & Demirors, O., (2012). Measuring health care process quality with software quality
measures. Studies in Health Technology and Informatics, 180(1), 1005-1009.
Yin, R. K. (1990). Case study research: Design and methods. Beverly Hills, California: Sage.
Yin, R. K., (1984). Case study research: Design and methods. Beverly Hills, Carlifornia: Sage.
Yousapronpaiboon, K., C., & Johnson, W. (2013). Measuring hospital out-patient service quality
in Thailand. Leadership in Health Services 26 (4), 338-355.
Youssef, M.A., Boyd, J. & Williams, E., (1996). The impact of TQM on firms‟ responsiveness:
an empirical study. Total Quality Management, 7(1), 127-144.
Zaim, H. , Bayyurt, N. & Zaim, S. (2010). Service quality and determinants of customer
satisfaction in hospitals: Turkish experience The International Business and
Economics Research Journal, 9(5), 513-528.
Zarei, A., Arab, M., Froushani, A.R., Rashidian, A., Tabatabaei, S.M.G., (2012). Service quality
of private hospitals: The Iranian patients‟ perspective. BMC Health Services
Research, 12(1), 31-46.
University of Ghana http://ugspace.ug.edu.gh

109
Zeithaml V.A., (1981). How consumer evaluation processes differ between goods and services,
reprinted in Lovelock, C. (1991), Services Marketing, 2nd Edition, Upper Saddle
River, New Jersey: Prentice Hall.
Zeithaml, V. A., & Bitner, M. J. (2000). Services marketing. New York: McGraw-Hill.
Zeithaml, V.A., Parasuraman, A., & Berry, L.L. (1990), Delivering Quality Service: Balancing
Customer Perceptions and Expectations, , New York, NY: The Free Press
Zhu, F. X., Wymer, W., & Chen, I. (2002). IT-based services and service quality in consumer
banking. International Journal of Service Industry Management, 13(1), 69-90.
Zineldin, M. (2006). The quality of healthcare and patient satisfaction: an exploratory
investigation of the 5Qs model at some Egyptian and Jordanian medical clinics,
International Journal of Healthcare Quality Assurance, 19(1), 60-92.
University of Ghana http://ugspace.ug.edu.gh
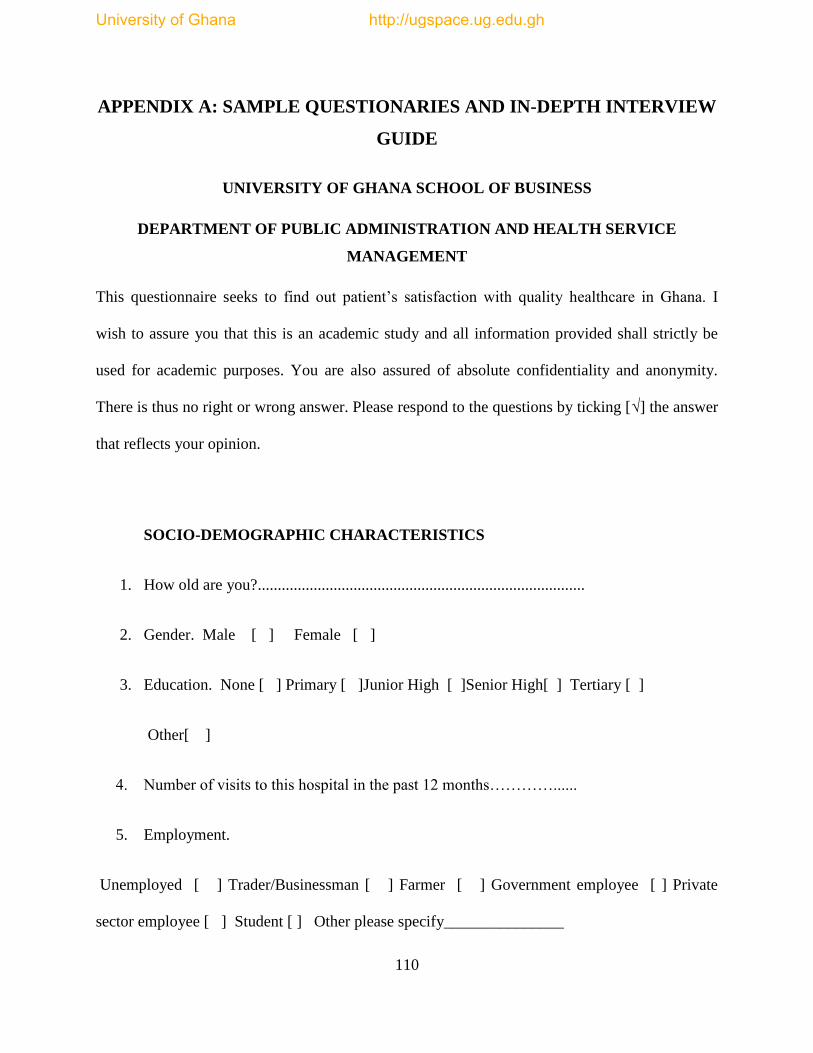
110
APPENDIX A: SAMPLE QUESTIONARIES AND IN-DEPTH INTERVIEW
GUIDE
UNIVERSITY OF GHANA SCHOOL OF BUSINESS
DEPARTMENT OF PUBLIC ADMINISTRATION AND HEALTH SERVICE
MANAGEMENT
This questionnaire seeks to find out patient‟s satisfaction with quality healthcare in Ghana. I
wish to assure you that this is an academic study and all information provided shall strictly be
used for academic purposes. You are also assured of absolute confidentiality and anonymity.
There is thus no right or wrong answer. Please respond to the questions by ticking [√] the answer
that reflects your opinion.
SOCIO-DEMOGRAPHIC CHARACTERISTICS
1. How old are you?..................................................................................
2. Gender. Male [ ] Female [ ]
3. Education. None [ ] Primary [ ]Junior High [ ]Senior High[ ] Tertiary [ ]
Other[ ]
4. Number of visits to this hospital in the past 12 months…………......
5. Employment.
Unemployed [ ] Trader/Businessman [ ] Farmer [ ] Government employee [ ] Private
sector employee [ ] Student [ ] Other please specify_______________
University of Ghana http://ugspace.ug.edu.gh

111
PART II – SERVICE QUALITY DIMENSIONS AND MEASUREMENT.
For the following questions, Please choose from the options provided below, what best suits your
response to the questions. Please Tick [√] where appropriate. On a scale of 1 to 5, rate the quality
healthcare of the hospital based on strongly disagree to strongly agree.
Strongly Disagree (SD) = 1.0–1.49, Disagree (D)=1.50–2.49, Neutral (N)= 2.50–3.49,
Agree(A)= 3.50–4.49, Strongly Agree(SA)= 4.50–5.0.
SD D N A SA
No. Tangibility
6 The hospital has up to date facilities.
7 The physical environment of the hospital is appealing.
8 The hospital has modern-looking equipment.
9 There is availability of adequate seating at the hospital.
Reliability
10 The staff provides service on scheduled time.
11 Doctors/staff are professional and competent.
12 Medical procedures were performed correctly the first
time.
13 There is consistency in duty performance by staff at the
hospital.
University of Ghana http://ugspace.ug.edu.gh
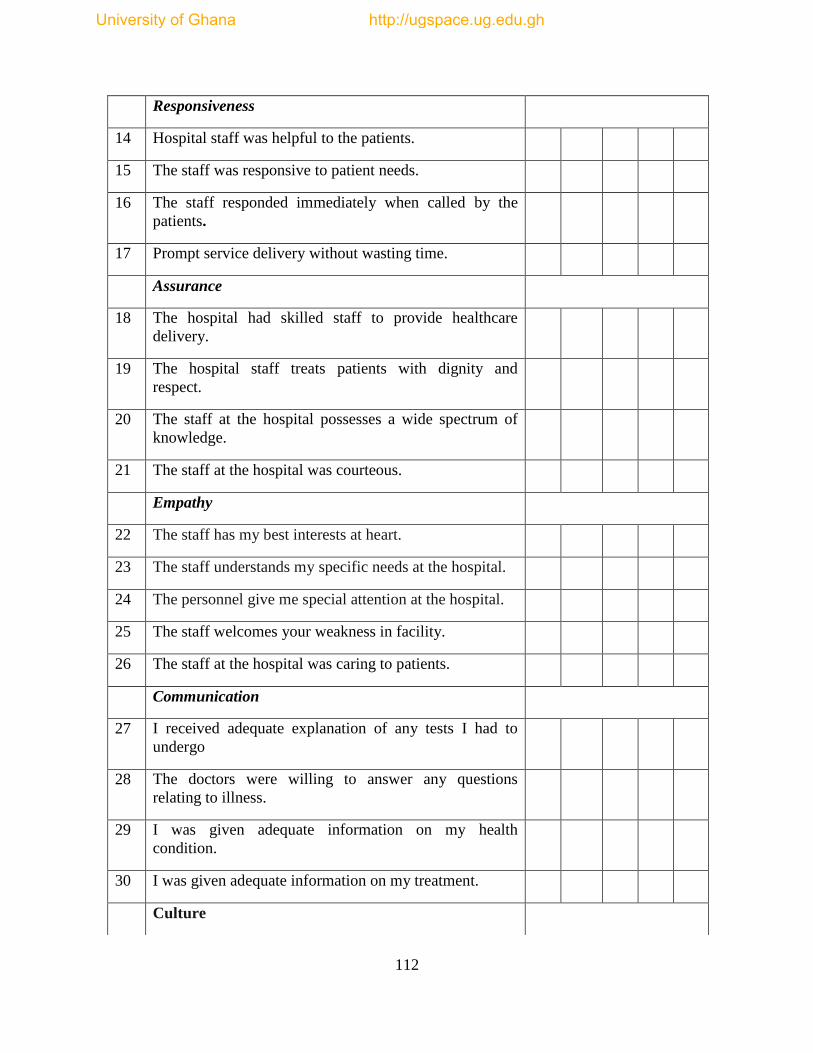
112
Responsiveness
14 Hospital staff was helpful to the patients.
15 The staff was responsive to patient needs.
16 The staff responded immediately when called by the
patients.
17 Prompt service delivery without wasting time.
Assurance
18 The hospital had skilled staff to provide healthcare
delivery.
19 The hospital staff treats patients with dignity and
respect.
20 The staff at the hospital possesses a wide spectrum of
knowledge.
21 The staff at the hospital was courteous.
Empathy
22 The staff has my best interests at heart.
23 The staff understands my specific needs at the hospital.
24 The personnel give me special attention at the hospital.
25 The staff welcomes your weakness in facility.
26 The staff at the hospital was caring to patients.
Communication
27 I received adequate explanation of any tests I had to
undergo
28 The doctors were willing to answer any questions
relating to illness.
29 I was given adequate information on my health
condition.
30 I was given adequate information on my treatment.
Culture
University of Ghana http://ugspace.ug.edu.gh

113
31 The hospital Staff do not discriminate based ethnic
backgrounds
32 The Staff use language patients understand.
33 The staff at the hospital does not discriminate based on
your religion.
Priority
34 University workers and students are given special care at
the hospital.
35 University workers and students are given special care at
the hospital.
Accessibility and Affordability
36 The location of the hospital is accessible
37 The charge for services at the hospital is affordable
Patient Satisfaction
38 I am satisfied with healthcare service delivered in this
hospital.
University of Ghana http://ugspace.ug.edu.gh
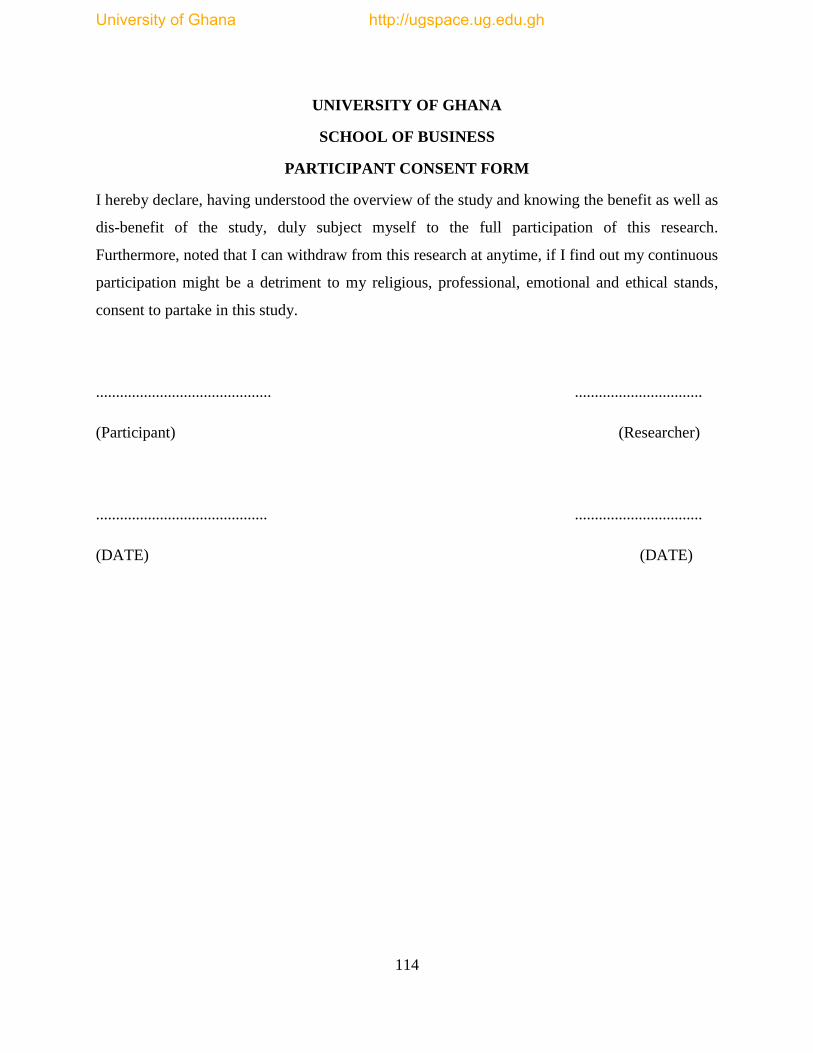
114
UNIVERSITY OF GHANA
SCHOOL OF BUSINESS
PARTICIPANT CONSENT FORM
I hereby declare, having understood the overview of the study and knowing the benefit as well as
dis-benefit of the study, duly subject myself to the full participation of this research.
Furthermore, noted that I can withdraw from this research at anytime, if I find out my continuous
participation might be a detriment to my religious, professional, emotional and ethical stands,
consent to partake in this study.
............................................ ................................
(Participant) (Researcher)
........................................... ................................
(DATE) (DATE)
University of Ghana http://ugspace.ug.edu.gh

115
IN DEPTH INTERVIEW
OVERVIEW
This interview seeks to find out patient‟s satisfaction with quality healthcare in Ghana. I wish to
assure you that this is an academic study and all information provided shall strictly be used for
academic purposes. You are also assured of absolute confidentiality and anonymity. There is
thus no right or wrong answer. Please respond to the questions in this interview.
Socio-demographic Information
1. What is your age?
2. What is your religion?
3. Where do you come from?
4. How many times have you visited this hospital?
Service quality dimension
5.What constitute service quality to you in this hospital?
a. What is your view on the physical facilities and appearance of personnel; tools or
equipment use to provide the Service? Probe
b. Is the service provided reliable? Probe
c. How responsive are the hospital personnel to care? Probe
d. Are you assured of quality healthcare? How? Probe
e. Are the staff empathetic to patients? How? Probe
University of Ghana http://ugspace.ug.edu.gh
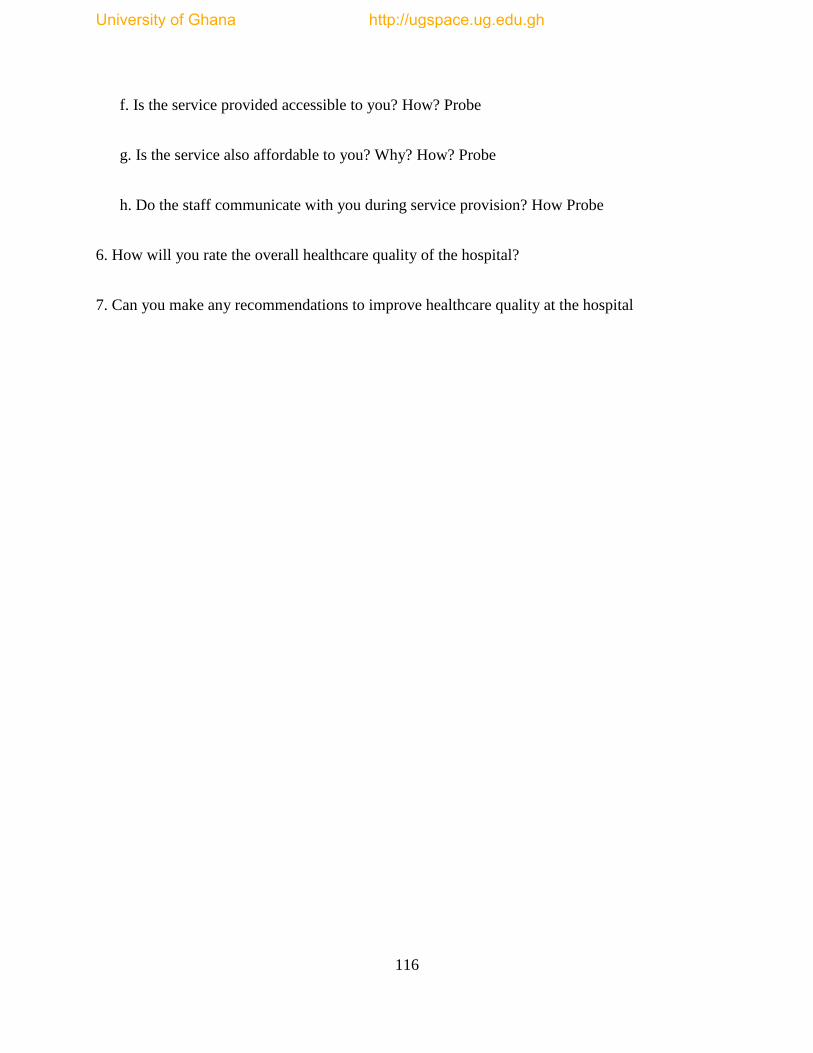
116
f. Is the service provided accessible to you? How? Probe
g. Is the service also affordable to you? Why? How? Probe
h. Do the staff communicate with you during service provision? How Probe
6. How will you rate the overall healthcare quality of the hospital?
7. Can you make any recommendations to improve healthcare quality at the hospital
University of Ghana http://ugspace.ug.edu.gh

117
APPENDIX B: ETHICAL CLEARANCE
University of Ghana http://ugspace.ug.edu.gh


