Embed Size (px)
Citation preview

This document consists of 25 printed pages, 3 blank pages and 2 Inserts.
DC (SJF/DJ) 32369/6© UCLES 2011 [Turn over
UNIVERSITY OF CAMBRIDGE INTERNATIONAL EXAMINATIONSGeneral Certificate of Education Ordinary Level
READ THESE INSTRUCTIONS FIRST
Write your Centre number, candidate number and name in the spaces provided.Write in dark blue or black pen.You may use a soft pencil for any diagrams, graphs or rough working.Do not use staples, paper clips, highlighters, glue or correction fluid.DO NOT WRITE IN ANY BARCODES.
Section AAnswer all questions.Section BAnswer one question.
Sketch maps and diagrams should be drawn whenever they serve to illustrate an answer.Insert 1 contains Photograph A for Question 3. Insert 2 contains Figs 10 and 11 for Question 7, and Figs 15, 16 and 17 for Question 8.The Survey Map Extract and the Inserts are not required by the Examiner.
At the end of the examination, fasten all your work securely together.The number of marks is given in brackets [ ] at the end of each question or part question.
GEOGRAPHY 2217/21
Paper 2 October/November 2011
2 hours 15 minutes
Candidates answer on the Question Paper.
Additional Materials: Calculator Ruler Protractor Plain paper
1:25 000 Survey Map Extract is enclosed with this Question Paper.
*7187841496*
2
2217/21/O/N/11© UCLES 2011
ForExaminer’s
Use
Section A
Answer all questions in this section.
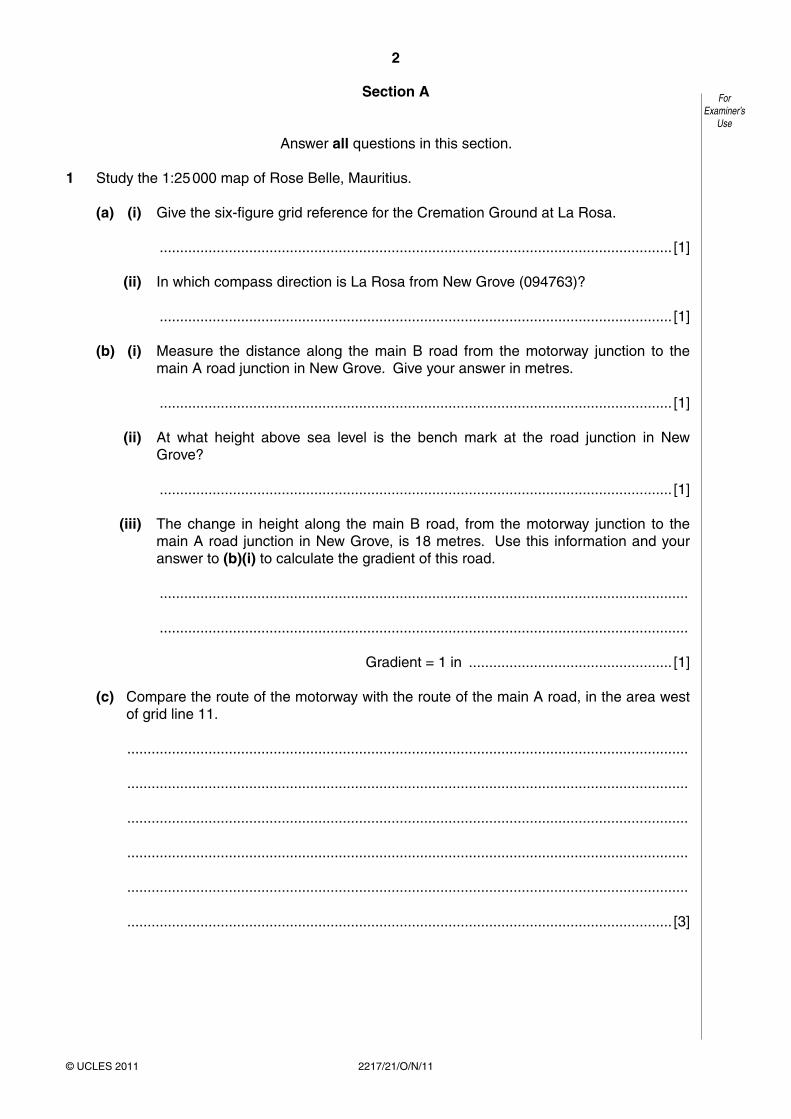
1 Study the 1:25 000 map of Rose Belle, Mauritius.
(a) (i) Give the six-figure grid reference for the Cremation Ground at La Rosa.
.............................................................................................................................. [1]
(ii) In which compass direction is La Rosa from New Grove (094763)?
.............................................................................................................................. [1]
(b) (i) Measure the distance along the main B road from the motorway junction to the main A road junction in New Grove. Give your answer in metres.
.............................................................................................................................. [1]
(ii) At what height above sea level is the bench mark at the road junction in New Grove?
.............................................................................................................................. [1]
(iii) The change in height along the main B road, from the motorway junction to the main A road junction in New Grove, is 18 metres. Use this information and your answer to (b)(i) to calculate the gradient of this road.
..................................................................................................................................
..................................................................................................................................
Gradient = 1 in .................................................. [1]
(c) Compare the route of the motorway with the route of the main A road, in the area west of grid line 11.
..........................................................................................................................................
..........................................................................................................................................
..........................................................................................................................................
..........................................................................................................................................
..........................................................................................................................................
...................................................................................................................................... [3]
3
2217/21/O/N/11© UCLES 2011 [Turn over
ForExaminer’s
Use
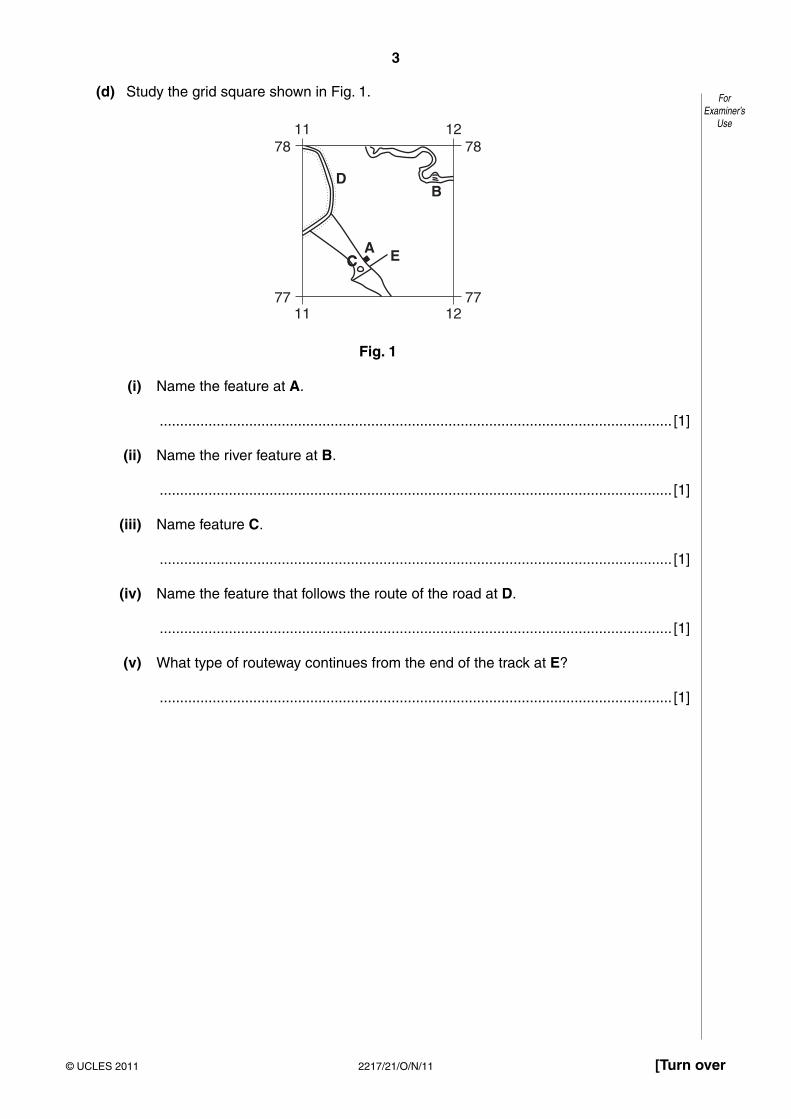
(d) Study the grid square shown in Fig. 1.
781211
1211
78
BD
EA
7777
CC
Fig. 1
(i) Name the feature at A.
.............................................................................................................................. [1]
(ii) Name the river feature at B.
.............................................................................................................................. [1]
(iii) Name feature C.
.............................................................................................................................. [1]
(iv) Name the feature that follows the route of the road at D.
.............................................................................................................................. [1]
(v) What type of routeway continues from the end of the track at E?
.............................................................................................................................. [1]
4
2217/21/O/N/11© UCLES 2011
ForExaminer’s
Use
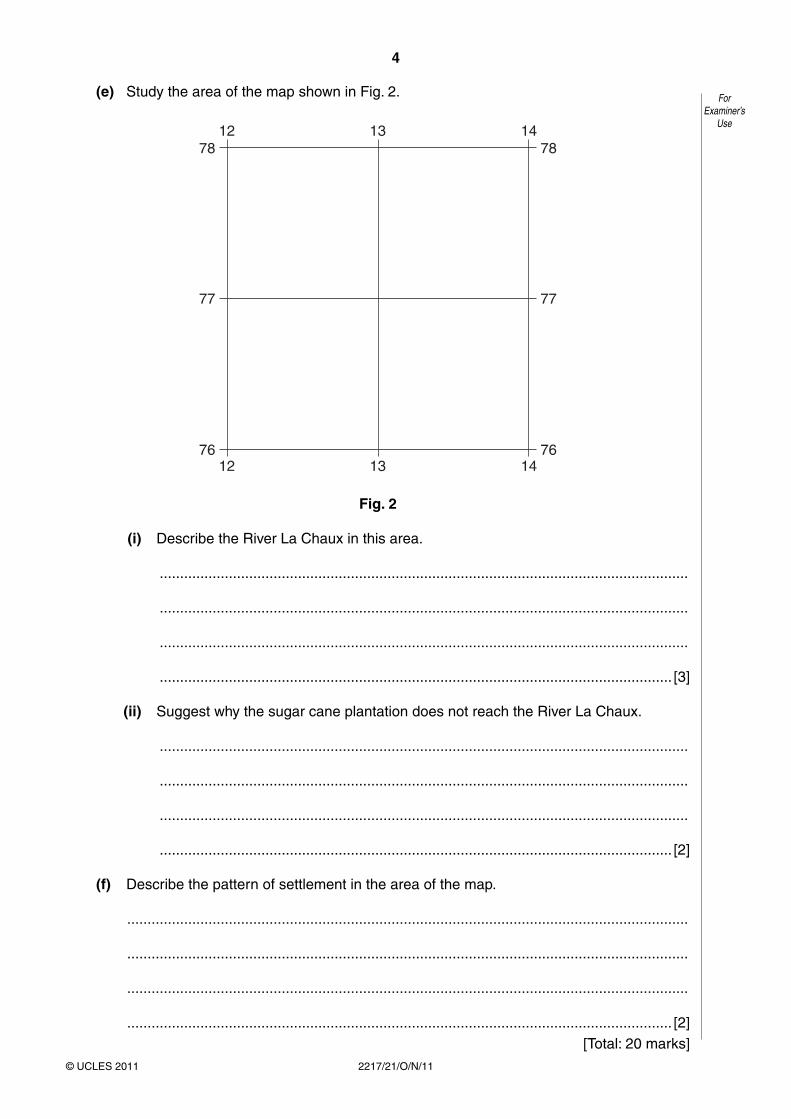
(e) Study the area of the map shown in Fig. 2.
78141312
141312
78
7777
7676
Fig. 2 (i) Describe the River La Chaux in this area.
..................................................................................................................................
..................................................................................................................................
..................................................................................................................................
.............................................................................................................................. [3]
(ii) Suggest why the sugar cane plantation does not reach the River La Chaux.
..................................................................................................................................
..................................................................................................................................
..................................................................................................................................
.............................................................................................................................. [2]
(f) Describe the pattern of settlement in the area of the map.
..........................................................................................................................................
..........................................................................................................................................
..........................................................................................................................................
...................................................................................................................................... [2][Total: 20 marks]

5
2217/21/O/N/11© UCLES 2011 [Turn over
BLANK PAGE
PLEASE TURN OVER FOR QUESTION 2.

6
2217/21/O/N/11© UCLES 2011
ForExaminer’s
Use
2 Study Fig. 3, which shows changes in numbers of refugees and internally displaced persons (IDPs) between April and September 2009, in central Africa.
Definitions of key words
Refugee – A person who has fled to a different country to escape a danger or problem.IDP – A person who has fled to another part of the same country.
AtlanticOcean
IndianOcean
TANZANIA
KENYA
ETHIOPIA
GREAT HORN OF AFRICA
CHAD, CAMEROON,ROC, CAR,
GABON REGION
GREAT LAKES REGION
GREATLAKES
REGIONRegions of Africa
SOMALIA
DJIBOUTIDJIBOUTI1,456 / no IDPs1,456 / no IDPs
DJIBOUTI
ERITREAERITREA145 / no IDPs145 / no IDPsERITREA
SUDAN
CHAD
12,500 /
CENTRALAFRICAN REPUBLIC
CAMEROON
REPUBLICOF CONGOGABON
RWANDA
UGANDADEMOCRATICREPUBLIC OF CONGO
BURUNDI
974 / no IDPs
145 / no IDPs
1,456 / no IDPs
2,269 / no IDPs
27,407 / no IDPs
25,793 /
1,749
no Change / 779,027
10 /
no Change /no IDPs
no Change /no IDPs
38,984
15,621 / 39,923
96 / 250,000
25,200
25,273 /no change
10,875 / no change
9,568 /no change
0 900450
km
N
Increase in refugeesDecrease in refugeesIncrease in IDPsDecrease in IDPs
Key
Fig. 3
(a) (i) Which country had the largest:
• increase in refugee numbers;
...........................................................................................................................
• decrease in refugee numbers?
....................................................................................................................... [2]
(ii) How many countries had a decrease in the number of IDPs?
.............................................................................................................................. [1]

7
2217/21/O/N/11© UCLES 2011 [Turn over
ForExaminer’s
Use
(iii) Name a country on the west coast of Africa that has no IDPs.
.............................................................................................................................. [1]
(iv) In which three countries could refugees arrive on foot from Somalia?
.............................................................................................................................. [1]
(b) Fig. 4 shows the percentage of total refugees in the three regions shown on Fig. 3.
Total Refugees
Great Hornof Africa
Great Lakes
Chad,Cameroon,ROC, CAR,
Gabon
Total IDPs
Fig. 4
(i) Use the data from Table 1 to show the total IDPs on Fig. 4.
Table 1
Great Horn of AfricaGreat Lakes RegionChad, Cameroon, ROC, CAR, Gabon Region
70%27%
3%
[2]
(ii) Which region has the largest number of displaced people?
.............................................................................................................................. [1]
[Total: 8 marks]

8
2217/21/O/N/11© UCLES 2011
ForExaminer’s
Use
3 Study Photograph A (Insert 1) of a rural location in Zimbabwe.
(a) Describe the relief of the area.
..........................................................................................................................................
..........................................................................................................................................
...................................................................................................................................... [2]
(b) Apart from buildings, what evidence is there of human activity in this area?
..........................................................................................................................................
..........................................................................................................................................
...................................................................................................................................... [3]
(c) Study Fig. 5, a sketch map of the area. Photograph A was taken from the position shown.
Townshipwith shopand mill
Teachers’houses
Teachers’houses
Secondaryschool
Sports ground
Position of photographer
Key
Direction of photograph
Not to scale
Primaryschool
Church
Dirt road
Fig. 5

9
2217/21/O/N/11© UCLES 2011 [Turn over
ForExaminer’s
Use
(i) What are the buildings shown in the photograph?
.............................................................................................................................. [1]
(ii) Name four other services that are available in this settlement.
..................................................................................................................................
..................................................................................................................................
..................................................................................................................................
.............................................................................................................................. [2]
[Total: 8 marks]

10
2217/21/O/N/11© UCLES 2011
ForExaminer’s
Use
4 Study Fig. 6, a climate graph for a place in Africa. Complete the paragraphs below.
0J M M J S
months
NF A J A O D
100
11
Maximum temperatureMaximum temperature
Minimum temperatureMinimum temperature
Maximum temperature
Minimum temperature
rain
fall
(mm
)av
erag
e da
ilysu
nshi
ne (
hour
s)
tem
pera
ture
(°C
)
15
10
5
0
25
20
10 8 7 7 7 7 7 9 10 1010
Fig. 6
Highest temperatures are experienced in ……………………………………………… and
…………………………………………, when the maximum is 23 °C. The lowest minimum
temperature of ……………… °C occurs from June to August.
In January there are ……………… hours of sunshine per day, with a temperature range for
that month of ………………°C
Rainfall is unlikely except in ………………………………, ……………………………… and
………………………………………… . The rainfall total is only ……………… mm, making
this a ……………………………………… climate.
The location is in the …………………………………………… hemisphere. [8]
[Total: 8 marks]

11
2217/21/O/N/11© UCLES 2011 [Turn over
ForExaminer’s
Use
5 Fig. 7 shows two types of weathering.
Physicalweathering by____________
____________weathering byplant growth
plant rootwater
Fig. 7
(a) (i) Complete the labels on Fig. 7. [2]
(ii) For one of the examples shown on Fig. 7, describe how the crack in the rock will be enlarged by the weathering process.
..................................................................................................................................
..................................................................................................................................
.............................................................................................................................. [2]
(b) Using the axes below, sketch a graph to show that, in a moist environment, chemical weathering increases as temperature increases. You should also label the axes of the graph.
[2]
(c) Suggest how industrial pollution can cause an increase in weathering.
..........................................................................................................................................
..........................................................................................................................................
..........................................................................................................................................
...................................................................................................................................... [2][Total: 8 marks]
12
2217/21/O/N/11© UCLES 2011
ForExaminer’s
Use
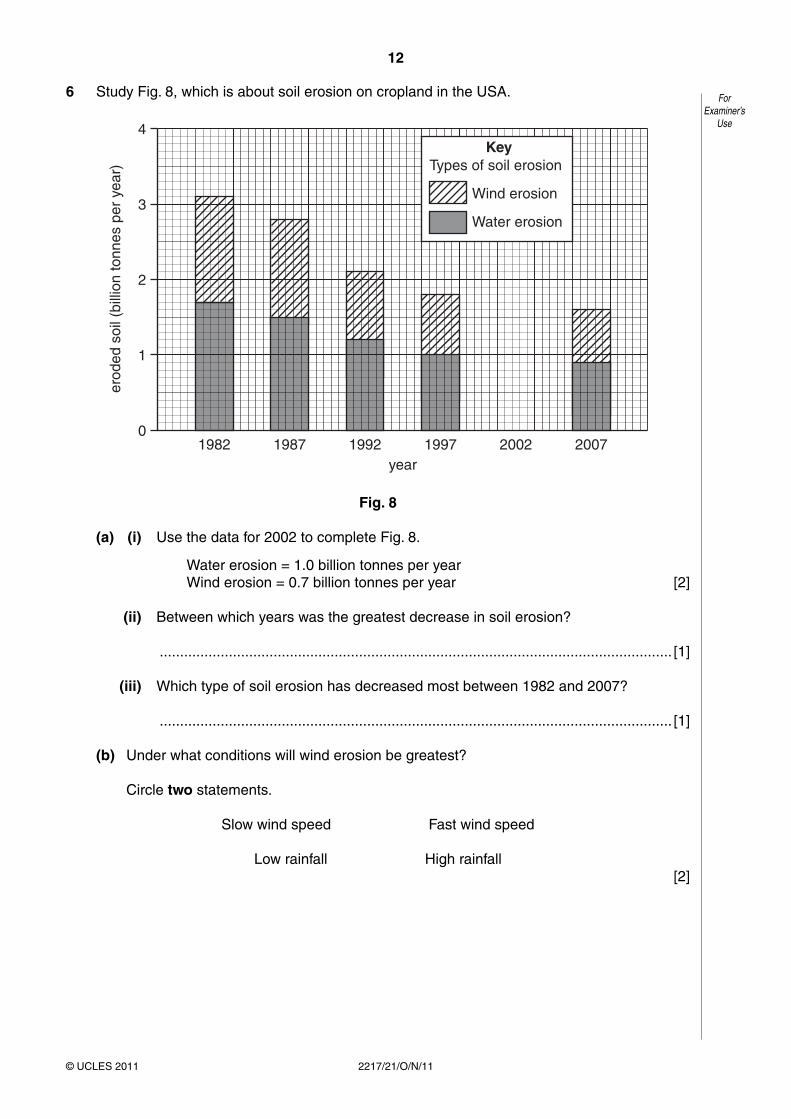
6 Study Fig. 8, which is about soil erosion on cropland in the USA.
1987 1992 1997year
2002 20070
1982
1
erod
ed s
oil (
billi
on to
nnes
per
yea
r)
2
3
4
Wind erosion
Types of soil erosionKey
Water erosion
Fig. 8
(a) (i) Use the data for 2002 to complete Fig. 8.
Water erosion = 1.0 billion tonnes per year Wind erosion = 0.7 billion tonnes per year [2]
(ii) Between which years was the greatest decrease in soil erosion?
.............................................................................................................................. [1]
(iii) Which type of soil erosion has decreased most between 1982 and 2007?
.............................................................................................................................. [1]
(b) Under what conditions will wind erosion be greatest?
Circle two statements.
Slow wind speed Fast wind speed
Low rainfall High rainfall[2]

13
2217/21/O/N/11© UCLES 2011 [Turn over
ForExaminer’s
Use
(c) Fig. 9 describes some of the methods that have been used in the USA to decrease soil erosion.
Government policy in the USA has encouraged soil conservation. Farmers have been paid to plant grass or trees on fragile cropland with 14 million hectares being transferred to permanent vegetation cover by 1990.
Alternative cultivation methods are also being used. By 1994, 26% of planted cropland was under mulch tillage. This is when crop residue is left on the soil surface.
Fig. 9
Name two soil conservation methods described in Fig. 9.
..........................................................................................................................................
...................................................................................................................................... [2]
[Total: 8 marks]

14
2217/21/O/N/11© UCLES 2011
ForExaminer’s
Use
Section B
Answer one question in this section.
7 Students in a class in Beijing, China, were learning about the sphere of influence of settlements and services.
(a) (i) Which one of the following is the correct definition of ‘sphere of influence’?Tick your choice in the table below.
Definition Tick ✓
area around a town or shop
area where people have migrated from
area where people go to work in a town
area served by a settlement or service
area next to a particular service
[1]
(ii) Why does the sphere of influence vary between different sized settlements?
..................................................................................................................................
..................................................................................................................................
..................................................................................................................................
..................................................................................................................................
..................................................................................................................................
.............................................................................................................................. [3]

15
2217/21/O/N/11© UCLES 2011 [Turn over
ForExaminer’s
Use
Some of the students decided to investigate the sphere of influence of their school. They agreed to test the following hypotheses:
Hypothesis 1: The number of students coming to our school decreases as distance from the school increases.
Hypothesis 2: Students travel to school in different ways but most travel by car.
(b) To collect data to test these hypotheses the students produced a questionnaire which they showed to their teacher. This is shown in Fig. 10 (Insert 2).
(i) Their teacher did not give a positive response about the questionnaire. Suggest one weakness of each question.
Question 1 ................................................................................................................
..................................................................................................................................
Question 2 ................................................................................................................
..................................................................................................................................
Question 3 ................................................................................................................
.............................................................................................................................. [3]
(ii) The students changed the questionnaire on the advice of their teacher. Their amended version is shown in Fig. 11 (Insert 2). The students decided to ask 10% of all the students in the school to complete their
questionnaire. This would result in 125 questionnaires being completed.
Do you think that this is an appropriate sample size? Explain your answer.
..................................................................................................................................
..................................................................................................................................
..................................................................................................................................
.............................................................................................................................. [2]
(iii) Describe a suitable method of selecting the students to complete the questionnaire in order to get a fair, representative sample.
..................................................................................................................................
..................................................................................................................................
..................................................................................................................................
.............................................................................................................................. [2]
16
2217/21/O/N/11© UCLES 2011
ForExaminer’s
Use
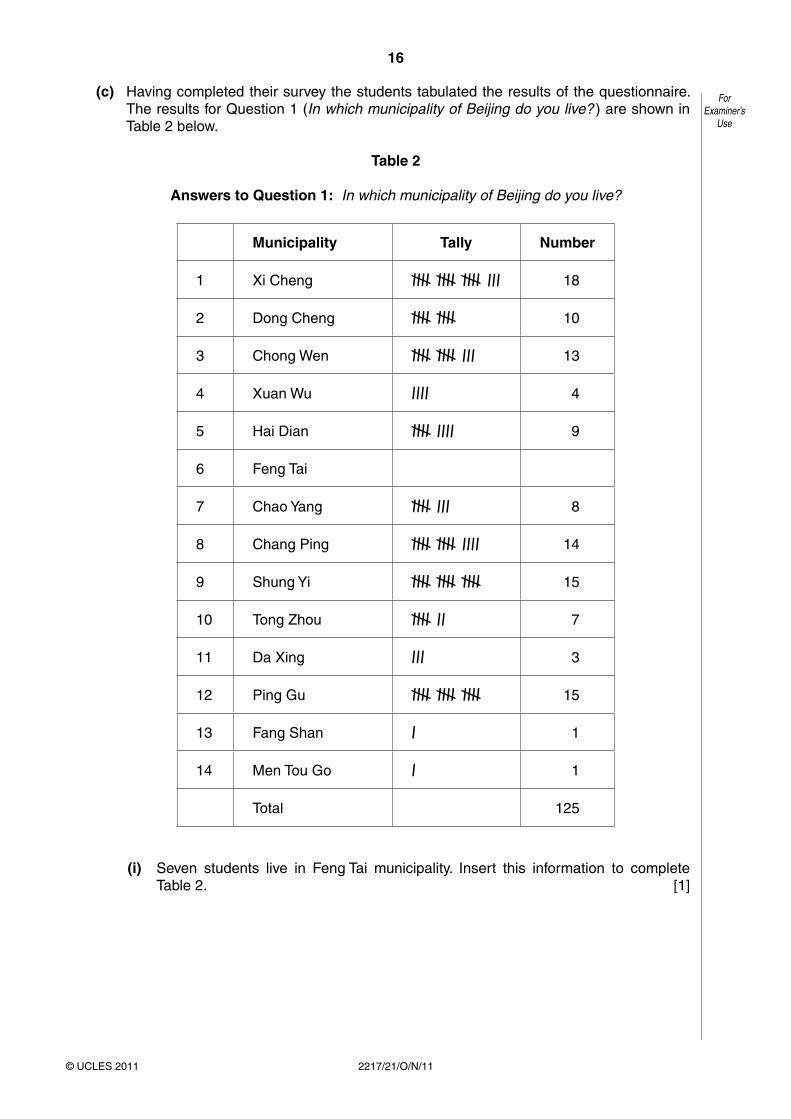
(c) Having completed their survey the students tabulated the results of the questionnaire. The results for Question 1 (In which municipality of Beijing do you live? ) are shown in Table 2 below.
Table 2
Answers to Question 1: In which municipality of Beijing do you live?
Municipality Tally Number
1 Xi Cheng llll llll llll lll 18
2 Dong Cheng llll llll 10
3 Chong Wen llll llll lll 13
4 Xuan Wu llll 4
5 Hai Dian llll llll 9
6 Feng Tai
7 Chao Yang llll lll 8
8 Chang Ping llll llll llll 14
9 Shung Yi llll llll llll 15
10 Tong Zhou llll ll 7
11 Da Xing lll 3
12 Ping Gu llll llll llll 15
13 Fang Shan l 1
14 Men Tou Go l 1
Total 125
(i) Seven students live in Feng Tai municipality. Insert this information to complete Table 2. [1]

17
2217/21/O/N/11© UCLES 2011 [Turn over
ForExaminer’s
Use
The students displayed the results for Question 1 in two different types of map.These are shown in Fig. 12 (below) and Fig. 13 (on page 18).
14
8 9
12
10
1113
6
5 7
1 234
0 50
km
Pictogram to show where students travel from
Large-scale mapof central municipalities
Key to municipalities
Key
Municipality1 Xi Cheng2 Dong Cheng3 Chong Wen4 Xuan Wu5 Hai Dian6 Feng Tai7 Chao Yang8 Chang Ping9 Shung Yi10 Tong Zhou11 Da Xing12 Ping Gu13 Fang Shan14 Men Tou Go
Location of school
Tiananmen Square– centre of city
= 1 student
1 2
34
100
Fig. 12
(ii) Complete Fig. 12 by inserting the number of students who live in Tong Zhou municipality. [1]

18
2217/21/O/N/11© UCLES 2011
ForExaminer’s
Use
1414
8 9
1212
1010
11111313
5 7
14
8 9
12
10
1113
6
5 7
1 234
0 50
km
Choropleth map to show where students travel from
Large-scale mapof central municipalities
Location of school
Tiananmen Square– centre of city
Key
0 – 4
5 – 9
10 – 14
15 – 19
1 22
34
2
34
100
Fig. 13
(iii) Complete Fig. 13 by shading the municipality of Xi Cheng. [1]

19
2217/21/O/N/11© UCLES 2011 [Turn over
ForExaminer’s
Use
(iv) Give two advantages of each type of map for showing data.
Pictogram:
Advantage 1: ............................................................................................................
..................................................................................................................................
Advantage 2: ............................................................................................................
..................................................................................................................................
Choropleth map:
Advantage 1: ............................................................................................................
..................................................................................................................................
Advantage 2: ............................................................................................................
.............................................................................................................................. [4]
(v) Do you agree with Hypothesis 1: The number of students coming to our school decreases as distance from the school increases ?
Explain your conclusion and support your answer with data from Figs 12 and 13.
..................................................................................................................................
..................................................................................................................................
..................................................................................................................................
..................................................................................................................................
..................................................................................................................................
..................................................................................................................................
..................................................................................................................................
.............................................................................................................................. [4]

20
2217/21/O/N/11© UCLES 2011
ForExaminer’s
Use
(d) Table 3, below, shows the results of Question 2 (How do you usually travel to school? ) in the questionnaire.
Table 3
Answers to Question 2: How do you usually travel to school?
Method of travel Number of students Percentage
Bus 45 36
Car 39 31
Train 37
Bike 3 2
Walk 1 1
Total 125 100
(i) Complete the table by calculating the percentage of students who travel to school by train. [1]
(ii) Use the results from Table 3 to complete the pie graph, Fig. 14 below. [2]
Answers to Question 2: How do you usually travel to school?
Key
Bus
Car
Train
Bike
Walk
Fig. 14

21
2217/21/O/N/11© UCLES 2011 [Turn over
ForExaminer’s
Use
(iii) The students decided that Hypothesis 2: Students travel to school in different ways but most travel by car was incorrect.
Give three pieces of evidence to support this conclusion.
1 ...............................................................................................................................
..................................................................................................................................
2 ...............................................................................................................................
..................................................................................................................................
3 ...............................................................................................................................
.............................................................................................................................. [3]
(iv) Suggest two ways that the fieldwork investigation could have been extended to find out more about the students’ journeys to school.
1 ...............................................................................................................................
..................................................................................................................................
2 ...............................................................................................................................
.............................................................................................................................. [2]
[Total: 30 marks]

22
2217/21/O/N/11© UCLES 2011
ForExaminer’s
Use
8 A class of students were studying how to use weather recording instruments.
(a) What instrument would they use to measure the following?
Temperature ……………………………………….
Relative humidity ………………………………………. [2]
One student noticed that the weather was forecast to change considerably the next day, so he decided to take some measurements to investigate the extent of these changes.
He decided to test the following hypotheses:
Hypothesis 1: There is a relationship between changes in atmospheric pressure and change in rainfall.
Hypothesis 2: There is a relationship between changes in atmospheric pressure and change in wind speed and wind direction.
He decided to take measurements of rainfall, wind speed, wind direction, cloud type and amount of cloud cover. He would take these measurements every four hours at 07.00, 11.00, 15.00 and 19.00. He also decided to take readings of atmospheric pressure every hour.
(b) The student also decided to take one set of measurements at 12.00 hours on the day before his investigation (Day 1) and another set at 12.00 on the day after his investigation (Day 3).
Suggest why the student decided to take measurements over three days.
..........................................................................................................................................
..........................................................................................................................................
..........................................................................................................................................
...................................................................................................................................... [2]
23
2217/21/O/N/11© UCLES 2011 [Turn over
ForExaminer’s
Use
(c) He used the following measuring equipment: rain gauge, anemometer, wind vane, barometer and a diagram of cloud types.
(i) In the space below, draw a labelled diagram of a rain gauge. Explain how the student made his measurements.
..................................................................................................................................
..................................................................................................................................
..................................................................................................................................
.............................................................................................................................. [4]
(ii) Fig. 15 (Insert 2) and Fig. 16 (Insert 2) show an anemometer and wind vane. Explain how they measure wind speed and wind direction.
Anemometer:
..................................................................................................................................
..................................................................................................................................
..................................................................................................................................
..................................................................................................................................
Wind vane:
..................................................................................................................................
..................................................................................................................................
..................................................................................................................................
.............................................................................................................................. [4]

24
2217/21/O/N/11© UCLES 2011
ForExaminer’s
Use
(iii) The barometer in Fig. 17 (Insert 2), measures atmospheric pressure. Explain how and why the index pointer on the barometer is used.
..................................................................................................................................
..................................................................................................................................
..................................................................................................................................
.............................................................................................................................. [2]
(iv) What unit is used to measure cloud cover?
.................................................................... [1]
(d) The recording sheet of the student’s fieldwork is shown in Table 4, below.
Table 4
Student’s recording sheet
Day 1 Day 2 Day 3
Time 12.00 6.00 7.00 8.00 9.00 10.00 11.00 12.00 13.00 14.00 15.00 16.00 17.00 18.00 19.00 20.00 21.00 12.00
Atmosphericpressure(millibars)
1015 1012 1009 1005 1000 998 997 996 994 992 994 1000 1005 1012 1015 1018 1022
Rainfall(mm) 0 0 3 5 1 0
Wind speed(km per hr) 3 8 26 43 20 5
Winddirection
SouthEast
SouthEast
South SouthWest
South SouthEast
Cloud type Cumulus CirrusAlto-
stratusNimbostratus
Stratus Cirrus
Cloud cover 2 4 6 7 6 3
(i) Look at the barometer in Fig. 17 and use this to fill in the atmospheric pressure at 12.00 hours on Day 1. [1]
25
2217/21/O/N/11© UCLES 2011 [Turn over
ForExaminer’s
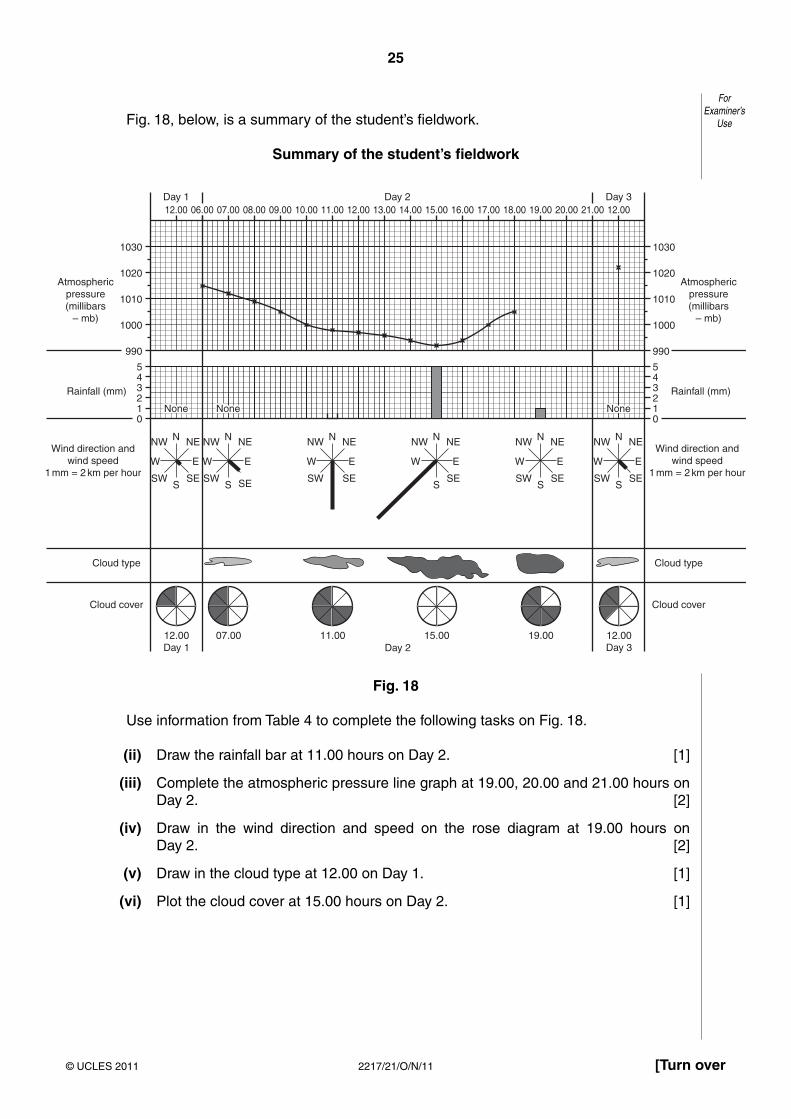
Use Fig. 18, below, is a summary of the student’s fieldwork.
Summary of the student’s fieldwork
990
1000
1010
1020Atmospheric
pressure(millibars
– mb)
Atmosphericpressure(millibars
– mb)
1030
12.00 06.00 07.00 08.00 09.00 10.00 11.00 12.00 13.00 14.00 15.00 16.00 17.00 18.00 19.00 20.00 21.00 12.00Day 1 Day 3Day 2
990
1000
1010
1020
1030
0NoneNone NoneNone NoneNoneNone
NNW
WWind direction and
wind speed1 mm = 2 km per hour
Wind direction andwind speed
1 mm = 2 km per hour
Cloud type
Cloud cover
12.00Day 1 Day 2
Cloud type
Cloud cover
E
SW
NE
SES
NNW
W E
SW
NE
SES
NNW
W E
SW
NE
SE
NNW
W E
NE
SES
NNW
W E
SW
NE
SES
NNW
W E
SW
NE
SES
None None
321
54
Rainfall (mm)Rainfall (mm)
0
321
45
07.00 11.00 19.00 12.00Day 3
15.00
Fig. 18
Use information from Table 4 to complete the following tasks on Fig. 18.
(ii) Draw the rainfall bar at 11.00 hours on Day 2. [1]
(iii) Complete the atmospheric pressure line graph at 19.00, 20.00 and 21.00 hours on Day 2. [2]
(iv) Draw in the wind direction and speed on the rose diagram at 19.00 hours onDay 2. [2]
(v) Draw in the cloud type at 12.00 on Day 1. [1]
(vi) Plot the cloud cover at 15.00 hours on Day 2. [1]

26
2217/21/O/N/11© UCLES 2011
ForExaminer’s
Use
(e) Having completed his comparison table the student looked again at his hypotheses.
(i) He decided that Hypothesis 1: There is a relationship between changes in atmospheric pressure and change in rainfall was true.
Describe the relationship between atmospheric pressure and rainfall. Support your description with data from Fig. 18.
..................................................................................................................................
..................................................................................................................................
..................................................................................................................................
..................................................................................................................................
..................................................................................................................................
.............................................................................................................................. [3]
(ii) He also decided that Hypothesis 2: There is a relationship between changes in atmospheric pressure and change in wind speed and wind direction was true.
How did wind speed and wind direction change as atmospheric pressure changed? Support your answer with data from Fig. 18.
..................................................................................................................................
..................................................................................................................................
..................................................................................................................................
..................................................................................................................................
..................................................................................................................................
..................................................................................................................................
..................................................................................................................................
.............................................................................................................................. [4]
[Total: 30 marks]

27
2217/21/O/N/11© UCLES 2011
BLANK PAGE

28
2217/21/O/N/11© UCLES 2011
BLANK PAGE
Copyright Acknowledgements:
Question 2 Fig. 3 © http://www.unhcr.org/refworld/country,,,,TCD,,4ae811515.0.html.Question 3 Photograph A © James Harper © UCLES.Question 6 Fig. 8 © http://www.soils.umn.edu/academics/classes/soil2125/img/10wner.jpg; 9/1/10.
Permission to reproduce items where third-party owned material protected by copyright is included has been sought and cleared where possible. Every reasonable effort has been made by the publisher (UCLES) to trace copyright holders, but if any items requiring clearance have unwittingly been included, the publisher will be pleased to make amends at the earliest possible opportunity.
University of Cambridge International Examinations is part of the Cambridge Assessment Group. Cambridge Assessment is the brand name of University of Cambridge Local Examinations Syndicate (UCLES), which is itself a department of the University of Cambridge.