Embed Size (px)
Citation preview

UNIVERSITY OF CALIFORNIA,
IRVINE
Effect of Vertical Component of Ground Motion on Dual System Tall Buildings
THESIS
submitted in partial satisfaction of the requirements
for the degree of
MASTER OF SCIENCE
in Civil Engineering
by
Shima Ebrahimi
Thesis Committee:
Associate Professor Farzin Zareian, Chair
Adjunct Professor Farzad Naeim
Professor Lizhi Sun
2016

© 2016 Shima Ebrahimi

ii
DEDICATION
To
My parents and husband
In recognition of their worth

iii
Table of Contents Table of Figures ......................................................................................................................................... v
Table of Tables......................................................................................................................................... vii
ACKNOWLEDGMENTS ............................................................................................................................ viii
ABSTRACT OF THE THESIS ..................................................................................................................... ix
Chapter 1 ..................................................................................................................................................... 1
INTRODUCTION ......................................................................................................................................... 1
1.1 Literature Review ....................................................................................................................... 3
1.2 Scope and Organization of This Study .................................................................................... 6
Chapter 2 ..................................................................................................................................................... 8
Structural Modeling .................................................................................................................................. 8
2.1 Building Overview: ......................................................................................................................... 8
2.2 Modeling Technique: ..................................................................................................................... 8
2.2.1 Modeling Technique to Capture Effect of VCGM: ............................................................. 11
2.2.3 Core Wall Modeling: .............................................................................................................. 15
2.2.4 Coupling Beams Modeling: .................................................................................................. 18
2.2.5 Moment Frame Beam and Column Modeling: .................................................................. 19
2.2.6 Basement Wall and Below Second Floor Slab Modeling: ............................................... 19
2.3 Model Validation:.......................................................................................................................... 20
2.3.1 Modal Analysis: ...................................................................................................................... 20
2.3.2 Time History Analysis: ......................................................................................................... 21
2.4 Revised Perform 3D Model for Slab Response: ...................................................................... 24
Chapter 3 ................................................................................................................................................... 25
3.1 Time History Analysis:................................................................................................................. 25
3.2 Ground Motions: ........................................................................................................................... 25
3.3 Defining Intensity Measure: ....................................................................................................... 35
3.4 Response to Earthquake Ground Motions: .............................................................................. 36
3.4.1 Axial Force: ............................................................................................................................. 37
3.4.2 Inter-Story Drifts: .................................................................................................................. 43
3.4.3 Story Shear: ............................................................................................................................ 46
3.4.4 Slab Response analysis:........................................................................................................ 49
Chapter 4 ................................................................................................................................................... 60
SUMMARY AND CONCLUSIONS.............................................................................................................. 60

iv
4.1 Summary ........................................................................................................................................ 60
4.2 Conclusion and observations ..................................................................................................... 61
Bibliography ............................................................................................................................................. 63

v
Table of Figures
Figure 2-1: Three-Dimensional Rendering of Structure From OpenSees Model ................................. 10
Figure 2-2: Typical Plan View at Level 2 and Above .............................................................................. 11
Figure 2-3: Difference Between 1st- and 2nd-Order P-Delta ................................................................... 15
Figure 2-4: Material Stress-Strain Relationships (Tuna 2012). ............................................................ 17
Figure 2-5: Sketch of Core Walls Modeling in OpenSees ........................................................................ 17
Figure 2-6: Coupling Beams Shear-Displacement Backbone Curve (Moehle, et al. 2011) .................. 18
Figure 2-7: Below-Ground Diaphragm Meshing ..................................................................................... 20
Figure 2-8: Comparison of Inter-Story Drift Ratios in H1 (East–West) Direction. .............................. 22
Figure 2-9: Comparison of Inter-Story Drift Ratios in H2 (North–South) Direction. .......................... 23
Figure 2-10: Typical Floor Diaphragm Meshing ..................................................................................... 24
Figure 3- 1: Axial Force on Exterior and Interior Columns for Group 1 ............................................... 38
Figure 3- 2: Axial Force on Exterior and Interior Columns for Group 2 ............................................... 38
Figure 3- 3: Axial Force on Exterior and Interior Columns for Group 3 ............................................... 39
Figure 3- 4: Axial Force on Exterior and Interior Columns for Group 4 .............................................. 39
Figure 3- 5: Axial Force on Shear Walls for Group 1 .............................................................................. 40
Figure 3- 6: Axial Force on Shear Walls for Group 2 .............................................................................. 40
Figure 3- 7: Axial Force on Shear Walls for Group 3 .............................................................................. 41
Figure 3- 8: Axial Force on Shear Walls for Group 4 .............................................................................. 41
Figure 3- 9: Max Inter-Story Drift Ratio for Group 1 .............................................................................. 44
Figure 3- 10: Max Inter-Story Drift Ratio for Group 2 ............................................................................ 44
Figure 3- 11: Max Inter-Story Drift Ratio for Group 3 ............................................................................ 45
Figure 3- 12: Max Inter-Story Drift Ratio for Group 4 ............................................................................ 45
Figure 3- 13: Max Story Shear Ratio for Group 1 .................................................................................... 47

vi
Figure 3- 14: Max Story Shear Ratio for Group 2 .................................................................................... 47
Figure 3- 15: Max Story Shear Ratio for Group 3 .................................................................................... 48
Figure 3- 16: Max Story Shear Ratio for Group 4 .................................................................................... 48
Figure 3- 17: Vertical Acceleration at Mid-Span at Corner Slab for Group 1 .......................................... 51
Figure 3- 18: Vertical Acceleration at Mid-Span at Corner Slab for Group 2 ........................................ 52
Figure 3- 19: Vertical Acceleration at Mid-Span at Corner Slab for Group 3 ........................................ 53
Figure 3- 20: Vertical Acceleration at Mid-Span at Corner Slab for Group 4 ........................................ 54
Figure 3- 21: Vertical Displacement at Mid-Span at Corner Slab for Group 1 ...................................... 56
Figure 3- 22: Vertical Displacement at Mid-Span at Corner Slab for Group 2 ...................................... 57
Figure 3- 23: Vertical Displacement at Mid-Span at Corner Slab for Group 3 ...................................... 58
Figure 3- 24: Vertical Displacement at Mid-Span at Corner Slab for Group 4 ...................................... 59

vii
Table of Tables
Table 3-1: Ground Motion Groups Summary .......................................................................................... 26
Table 3-2: Summary of Ground Motions of Group 1: Acceleration Information .................................. 27
Table 3-3: Summary of Ground Motions of Group 1: Moment Magnitude and
Closest Distance ......................................................................................................................................... 28
Table 3-4: Summary of Ground Motions of Group 2: Acceleration Information .................................. 29
Table 3-5: Summary of Ground Motions of Group 2: Moment Magnitude and Closest Distance ....... 30
Table 3-6: Summary of Ground Motions of Group 3: Acceleration Information .................................. 31
Table 3-7: Summary of Ground Motions of Group 3: Moment Magnitude and Closest Distance ....... 32
Table 3-8: Summary of Ground Motions of Group 4: Acceleration Information .................................. 33
Table 3-9: Summary of Ground Motions of Group 4: Moment Magnitude and Closest Distance ....... 34
Table 3- 10: Equations for magnification factor of Interior column axial load due to vertical
component of ground motions ................................................................................................................. 42
Table 3- 11: Equations for magnification factor of exterior column axial load due to vertical
component of ground motions ................................................................................................................. 42
Table 3- 12: Equations for magnification factor of shear wall axial load due to vertical component of
ground motions ......................................................................................................................................... 42
Table 3- 13: Equations for magnification factor of max IDR ratio due to vertical component of
ground motions ......................................................................................................................................... 46
Table 3- 14: Equations for magnification factor of story shear ratio due to vertical component of
ground motions ......................................................................................................................................... 49

viii
ACKNOWLEDGMENTS
I would like to express the deepest appreciation to my committee chair, Professor Farzin
Zareian, who has the attitude and the substance of a genius: he continually and convincingly
conveyed a spirit of adventure in regard to research, and an excitement in regard to teaching.
Without his guidance and persistent help, this dissertation would not have been possible.
I would also like to thank Professor Farzad Naeim and Dr.Zeyneb Tuna whose vast
knowledge in the area of computational modeling and structural behavior provided
direction and a source of inspiration.
I would like to thank Professor Lizhi Sun, whose work demonstrated to me and concern the
support in Structural Engineering and Technology. His work in this field was always
transcend academia and provide a quest for our times.
Lastly, I would like to thank my family , friends, and colleagues for their continuous
support. Their love and encouragement is unprecedented.

ix
ABSTRACT OF THE THESIS
Effect of Vertical Component of Ground Motion on Dual System Tall Buildings
By
Shima Ebrahimi
Master of Science in Civil Engineering
University of California, Irvine, 2016
Associate Professor Farzin Zareian, Chair
This study presents the influence of vertical component of ground motion on the response
of a tall building; earthquakes with reverse fault and strike-slip with short or far distance to
the fault are considered. The main focus has been on the change of structural response due to
inclusion of vertical exitation in the analysis.
The first part of this study discusses the description of the structural model and modeling
techniques in detail which is based on Model 2B of PEER’s Case Studies of the Seismic
Performance of Tall Buildings (Moehle, et al. 2011). All elements are modeled with specific
effective stiffness and nonlinear materials to capture the accurate behavior of the building
under the nonlinear response history analysis. Backbone curves of the components is
presented. The model is validated by comparing the behavior of the structural model for this

x
study and the response of the Model 2B of PEER’s Case Studies of the Seismic Performance
of Tall Buildings (Moehle, et al. 2011).
The second part of this thesis focuses on the nonlinear response history analysis, the ground
motion selection and information on the selected records. The effect of vertical component
of the ground motion on the structural behavior is discussed in detail by comparing the
structural response due to the lateral components of the ground motion and the structural
response due to all three components of the ground motion. The structural response includes
the following parameters: maximum inter-story drift ratio, the axial force of columns and
shear walls, story shear, peak floor vertical acceleration and peak floor vertical displacement.
Equations for estimating the effect of vertical components of ground motions on tall
buildings are presented based on the results.

1
Chapter 1
INTRODUCTION
The standard practice in earthquake analysis of buildings is to ignore the vertical component
of ground motions and analyze the structure under the horizontal components of the ground
motion. However, an emerging body of evidence shows that the vertical component of
ground motions can have a destructive effect on structures, especially given individual site
conditions.
The vertical-to-horizontal ratio (V/H) of peak ground acceleration (PGA), is a strong function
of the source to site distance, local site conditions and natural periods as well as relativity
weaker function of the faulting mechanism, magnitude, and sediment depth (Bozorgnia &
Campbell, 2004).
The standard engineering rule-of-thumb for estimating vertical component of ground
motion for design of structure is assuming V/H =2/3. However, this “rule of thumb” is
imprecise for near-fault moderate and large-magnitude earthquakes (Friedland, Power, &
Mayes, 1997). In fact, acceleration records from the January 17, 1994, Northridge
earthquake in the United States, the January 17, 1995, Hyogoken earthquake in Japan, and
the February 22, 2011, Christchurch earthquake in New Zealand, among others, clearly show
that the vertical component of ground motion magnitude can be as large as or exceed the
horizontal component.
The reason for the traditional privileging of horizontal ground motion is that the attenuation
relationship was always performed for the entire range of magnitudes and epicentral

2
distances instead of concentrating on individual intervals. Thus, the outcomes had a smaller
V/H ratio (Papazoglou & Elnashai, 1996). The use of a constant value of 2/3 for V/H over the
entire period range of engineering interest is still recommend in united states by some
engineering guideline (FEMA-356 2000) even with all the evidence that have refuted this
assumption . Although, European Communities (1993), permitted V/H to vary with period
in the European Building Code (EC8), but primarily for reducing V/H from 2/3 at short
periods to 1/2 at long periods. The 1997 Uniform Building Code (UBC-97) acknowledged the
fact that V/H is dependent on source-to-site distance at relatively short distances and
suggested using site-specific vertical response spectra for sites located close to active faults.
However, neither Uniform Building Code (UBC-97) nor International Building Code (IBC-
2000) offers guidance on the design of the vertical spectrum (Bozorgnia and Campbell 2004)
In the past, two arguments have been made against the importance of the effect of the
vertical component of the ground motion. First, standard, properly designed structures are
already designed with a large factor of safety in the vertical direction. Second, the peaks of
strong vertical motion have low energy content. Both of these claims can be refuted. It is
contended that the relationship between structural and excitation periods are more
important than energy content. Also, from observation, it is evident that structures designed
base on code requirement can fail due to strong vertical ground motion (Papazoglou &
Elnashai, 1996).
Many experienced engineers think that vertical earthquake motion should be factored into
the design of structures. Consideration of vertical earthquake motions in the design of

3
bridges in high seismic zones was recommended by Friedland, Power, and Mayes (Friedland,
Power and Mayes 1997). Bozorgnia and Campbell say that modified spectra must be used
for vertical component of ground motion because calculating the vertical spectrum by using
2/3 of the horizontal spectrum underestimates the effect of the vertical component for short-
and long-period structures and overestimates that effect for medium-period structures
(Bozorgnia and Campbell 2016).
1.1 Literature Review
Earthquakes like Kobe 1995, Northridge 1994, Loma Prieta 1989, and Kalamata 1986
changed our perspective on the vertical component of ground motion. One of the most
comprehensive studies of these records has been done by Papazoglou and Elnashai(1996).
In Northridge, where a V/H as high as 1.79 was recorded, a Holiday Inn which had sustained
structural damage was investigated. A significant number of columns experienced shear
failure. This analysis was based on the fact that the RC frame vibrated in the first mode of
the structure, and there was no sign of torsional failure. Papazoglou and Elnashai (1996)also
concluded that larger reduction in column shear capacity is projected for higher stories
because they experience a greater relative change in preexisting axial force specially in
vibration in the first vertical mode.
The Kobe earthquake was a unique earthquake with respect to observing strong vertical
motion. Large V/H ratios, as well as PGA, were recorded over long epicentral distances (≥ 45
km). After this earthquake, considerable attention was given to a large number of steel box
4
columns. It was concluded that because there was no evidence of bending deformation of
the plates in the box columns, the axial response in the box columns was mainly tensile. The
Kalamata earthquake was a near-field earthquake (< 9km) with a focal depth of 7 km and a
magnitude of 5.7 on the Richter scale. The result of these unique conditions was a V/H ratio
as high as 1.26. The field records indicated noticeable structural damage due to the vertical
component of ground motion. This damage included an RC pedestal cracked at mid-height,
signifying possible tensile failure. Moreover, there were significant number of shear-
compression failures in columns and shear walls, despite the fact that in those buildings,
bending failure was expected. In addition to studying field evidence, researchers have made
efforts toward analyzing the effects of vertical ground motions. Some of the main ones are
explained briefly below:
Iyengar and Shinozuka (1972) investigated the behavior of self-weight and vertical
acceleration on medium-tall structures. The structures were modeled as cantilevers. Their
primary findings were that self-weight and acceleration could either increase or decrease
the peak response. In most cases this difference is considerable. In a frame structure, a
vertical acceleration effect could be more prominent in beam behavior
Iyengar and Sahia (1977) used modal superposition to evaluate the effect of vertical ground
motion on the response of cantilever structures. They concluded that in the analysis of
towers, the vertical component should be included in the design.
Antoniou (1997)Analyzed an eight-story RC building which was designed based on a design
acceleration of 0.3 g and a high ductility class of EC8 (CEN 2005a). The author concluded
that on roof displacement and inter-story drift, vertical acceleration has no effect, and the
results are the same as if one had solely considered horizontal acceleration. However, a

5
significant increase in axial force in columns can lead to the growth of tensile force. The
fluctuation of axial force due to vertical acceleration can cause shear failure in columns.
Munshi and Ghosh (1998) studied the nonlinear behavior of a 12-story RC building in
earthquake conditions. The building showed accelerating motions in both the horizontal and
vertical planes. A minor rise in the maximum deformation was seen when the vertical
ground motion was included. According to this study, the wall-frame system is not sensitive
to vertical acceleration
Collier and Elnashai (2001)investigated the behavior of a four-story reinforced concrete
structure by a particular simplified method for a combination of vertical and horizontal
acceleration. The primary purpose of this study was to determine the influence of ground
motions in conjunction with various V/H and time intervals between peak acceleration of
vertical and horizontal motions on the vertical period of the structure. This study showed
that the amplitude of both horizontal and vertical motion can have a major effect on the
vertical period of vibration.
Shakib and Fuladgar (2003), by modeling a 2D one-story structure resting on a sliding
support, studied the behavior of pure-friction base isolated asymmetric building affected by
the vertical component of ground motion. Based on this study, the lateral behavior of the
pure-friction base, when isolated, is significantly affected by vertical acceleration. Moreover,
when the structure is subjected to vertical and horizontal accelerations simultaneously, the
torsional behavior of the structure increases noticeably in the moderate range of
eccentricities.
Mwafy and Elnashai (2006) did a substantial study on three RC frame groups with different
characteristics, including a 12-story regular frame, an eight-story frame-wall building, and

6
an eight-story irregular structure. Each structure has four different design levels, generating
a total of 12 structures. This study showed that vertical acceleration has more effect on high-
rise buildings than low-rise buildings. The authors indicated that the axial load in columns,
as well as curvature ductility demand, will increase up to 45% and 60% higher, respectively,
when the vertical component of an earthquake is included.
1.2 Scope and Organization of This Study
The purpose of this study is to investigate the sensitivity of structural response to the strong
vertical ground motion. Specifically, this thesis will compare the structural response to
lateral ground accelerations (X and Y) against the structural response to all orthogonal
components of ground accelerations (X, Y, and Z). In other words, what difference does the
inclusion of the vertical component make in a time history analysis.
The parameters of interest are:
Story drift
Story shear
Axial force of critical columns
Slab vertical displacement at mid-span
Slab vertical acceleration at mid-span
Chapter 2 explores the analytical modeling and summary of response results for modeling
validation. Chapter 3 focuses on the nonlinear response history analysis, the ground motion
selection procedure, and information on the selected records. The structural response of the

7
structure under the selected ground motion is then evaluated in detail. Chapter 4 then
presents the conclusions of this study.

8
Chapter 2
Structural Modeling
In order to investigate the effects of vertical components of earthquakes on the responses of
tall buildings, Model 2B of PEER’s Case Studies of the Seismic Performance of Tall Buildings
(Moehle, et al. 2011) has been modeled in the OpenSees program. This Chapter describes
details of this model.
2.1 Building Overview:
The building includes 42 stories above ground and four stories below ground, with a roof
and penthouse. A core wall and four-bay SMFs at the building’s perimeter on all sides were
considered as a lateral-force resisting system. Core walls were built with L-shaped walls
connected by coupling beams. The four-story podium has a 16-inch-thick basement wall
around it. Figures 2-1 and 2-2 show the 3-D view and typical plan view of the structure,
respectively.
2.2 Modeling Technique:
According to Model 2B of PEER’s Case Studies of the Seismic Performance of Tall Buildings
(Moehle, et al. 2011) , a three-dimensional nonlinear model of the building was modeled
using OpenSees software. The model only contains the building’s lateral force-resisting
system (i.e., the gravity system was excluded). The seismic masses equivalent to the dead
load have been assigned to tops of columns and shear walls in proportion to their tributary

9
area. The mass associated with the ground level and below is ignored. Concrete shear walls
and concrete special moment frames are modeled from the foundation level to the penthouse
and roof levels, respectively. The diaphragms at the ground floor and below are modeled
with a finite element mesh to account for their in-plane stiffness. The diaphragms above
ground level are modeled as rigid diaphragms by slaving the horizontal translation degrees
of freedom. Ground motions are input at the top of the mat foundation. The foundation is
idealized as rigid by providing lateral and vertical supports at the top of the foundation. The
lateral resistance of the soil surrounding the subterranean walls is ignored.

10
Figure 2-1: Three-Dimensional Rendering of Structure From OpenSees Model

11
Figure 2-2: Typical Plan View at Level 2 and Above
2.2.1 Modeling Technique to Capture Effect of VCGM:
2.2.1.1 Second-order P-Delta:
Structural engineers usually would not ignore the P-Delta effect while performing the
stability analysis and design slender member, tall structure or any structure which
experiences significant gravity loads along with lateral force. In the conventional first-order
structural analysis, the equilibrium is expressed by the un-deformed structure’s geometry.
For a linearly elastic structure, since the relationship between external force and
displacement is proportional, the unknown deformation can be computed directly.
However, second-order analysis requires an iterative procedure to obtain the solution.
Linear elastic analysis is not accurate because it does not account for the permanent
deformation of the building. Therefore, the analysis progresses in a step-by-step incremental

12
method, using the structure’s deformed geometry acquired by iterative cycles of the
calculation. Figure-2-3 shows the significant difference between first-order and second-
order analysis. A simple method, known as the amplification method, and which is
commonly used to capture second-order effects, is to magnify just the response obtained
from the first-order analysis by an magnification factor is 1/ (1-P/Pcr), where P is the axial
load and Pcr is the elastic buckling load of the considered member. In the case of massive
gravity loading—e.g., during an earthquake, with a strong vertical component of ground
motion—the accuracy of capturing the actual P-Delta effect reduces significantly, and the
result which was obtained from the Amplification Method becomes unreliable. In such a
case, the iterative P-delta analysis must be performed to predict the actual effect on the
structure. OpenSees is capable of performing the iterative P-Delta analysis to represent the
actual second-order effect on the structure. A simple example of a cantilever column has
been analyzed by this means in OpenSees; it has been verified by hand-calculation for up to
three iteration cycles.

13
Example:
Height, L =240 in
E = 29000 ksi
I = 40000 in^4
Vertical Load, P =600 Kips
Horizontal Load, H = 300 Kips
First Iteration
M = H × L = 72000 Kips − in
the lateral displacement (Δ1) at the column top is:
Δ1 = ML2
3EI = 1.1917 in
Also, the vertical load P acting on displaced Δ1 column tip resulting in the generation of the
additional moment M1 at the base.
M1 = P × Δ1 = 715.02 Kips − in
the total moment “Mt1” at the base of the column = (M+M1) = 72715.02 Kips-in
The modified horizontal displacement “Δ2” experiences the first modified moment Mt1
Δ2 = Mt1L2
3EI= 1.203 in

14
Second Iteration
Now, “P” which stands for vertical load takes action on the newly displaced column tip; (Δ2 -
Δ1) causes an additional moment M2 at the base
M2 = P × (Δ2 − Δ1) = 67.8 Kips − in
𝑀𝑡2 = (M + M1 + M2) = (Mt1 + M2) = 72782.82 Kips − in
Δ3 = Mt2 L
2
3EI = 1.2046 in
Third Iteration
M3 = P × (Δ3 – Δ2) = 0.96 Kips − in
Mt3 = M + M1 + M2 + M3 = 72783.78 Kips − in
Δ4 =𝑀𝑡3𝐿2
3𝐸𝐼= 1.2047 in

15
Figure 2-3: Difference Between 1st- and 2nd-Order P-Delta
2.2.3 Core Wall Modeling:
Flexural behavior of the core walls was captured by using nonlinear vertical fiber elements
which represent the behavior of steel reinforcement and concrete. The shear behavior was
counted by modeling it as elastic perfectly plastic stress-strain curve. For fiber elements, the
section’s unconfined cover was ignored. A modified Mander model (Mander et al., 1988) was
used for the confined concrete stress-strain relationship. The tensile strength of the concrete
was ignored. Confining ratios were calculated according to ACI 318 (2008), section21.4.4.
The steel stress-strain relationship is based on the material specifications for A706
reinforcing steel. The expected yield strength of 70 ksi and an ultimate strength of 105 ksi
in both compression and tension were considered. Steel properties were modeled based on
the Giuffre-Menegotto-Pinto model. For the core wall’s inelastic in-plane shear behavior, the
effective shear modulus was chosen to be 20% of the concrete expected elastic modulus 𝐸𝐶 ,
which has been defined in ACI 318–08. (ACI 318-08. 2008) To characterize the core walls’

16
expected shear strength, the ultimate shear strength 𝑉𝑢𝑙𝑡was determined as 1.5 times 𝑉𝑛,
which the nominal shear capacity is as defined in ACI 318-08. The described modeling
approach is based on Model 2B of PEER’s Case Studies of the Seismic Performance of Tall
Buildings (Moehle, et al. 2011). Figure 2-4 shows material stress-strain relationships which
were used in modeling. Each Shear wall was modeled as a column with fiber elements and
rigid beams with very large I and A (100 times stiffer than shear walls). Figure2-5 describes
how the walls were modeled in OpenSees. Displacement-based elements were used to model
shear wall elements. All elements were divided into three elements for results Accuracy.

17
Figure 2-4: Material Stress-Strain Relationships (Tuna 2012).
Column
Rigid Beam Node
Rigid Beam
Figure 2-5: Sketch of Core Walls Modeling in OpenSees

18
2.2.4 Coupling Beams Modeling:
Coupling beams were modeled with the same approach as Model 2B of PEER’s Case Studies
of the Seismic Performance of Tall Buildings (Moehle, et al. 2011) using two elastic beam–
column elements connected at midspan by a nonlinear shear spring with envelope
properties defined based on test results by Naish (2010). The effective stiffness of elastic
portion is 𝐸𝐼𝑒𝑓𝑓 = 0.20𝐸𝐼𝑔. Figure 2-6 shows properties of the shear hinge. More details
on material properties can be obtained in (Deger and Yang 2015); (Tuna 2012), and (Ghodsi,
et al. 2010).
Figure 2-6: Coupling Beams Shear-Displacement Backbone Curve (Moehle, et al. 2011)

19
2.2.5 Moment Frame Beam and Column Modeling:
Components of Moment resisting frames were modeled with elastic elements with nonlinear
fiber section as concentrated plasticity hinges and plastic length zones at each end. The
elastic portions of the moment frame elements were modeled with the cross-section
properties and the stiffness modification factors based on ASCE 41-06, such that 𝐸𝐼𝑒𝑓𝑓 =
0.35𝐸𝐼𝑔 (flexural, for beams), 𝐸𝐼𝑒𝑓𝑓 = 0.70𝐸𝐼𝑔 (flexural, for columns), and GA = 1.0GAg
(shear). Plastic hinge length was calculated based on the work of Paulay and Priestley
(1992) with the Radau Hinge Integration method based on the work of Scott and Fenves
(2006).
2.2.6 Basement Wall and Below Second Floor Slab Modeling:
Basement walls are modeled as elastic finite elements with their effective stiffness values
𝐸𝐼𝑒𝑓𝑓 = 0.80𝐸𝐼𝑔 .Slabs were modeled as elastic shell elements with 25 percent of total
stiffness. Both basement walls and slabs were modeled based on Model 2B of PEER’s Case
Studies of the Seismic Performance of Tall Buildings (Moehle, et al. 2011). The figure shows
how the diaphragms were meshed to capture the structure’s true behavior. Figure 2-7 shows
below-ground diaphragm meshing.

20
Figure 2-7: Below-Ground Diaphragm Meshing
2.3 Model Validation:
As previously mentioned, this building is Model 2B of PEER’s Case Studies of the Seismic
Performance of Tall Buildings (Moehle, et al. 2011). For the purpose of this research, this
building was remodeled in OpenSees. The OpenSees program analyzes data more quickly
and in a more advanced way than Peform3D. As well, it can capture the iterative P-Delta
effect, a capability missing from Perform3D.
2.3.1 Modal Analysis:
Both periods were obtained by the programs Perform 3D (2007) and OpenSees from the
models before the nonlinear analyses were performed. The frame beams, columns, and
coupling beams reflected a reduced stiffness, as described in above sections when calculating
the period. However, the core shear walls were modeled using the uncracked properties of
concrete. Table 2-1 shows a summary of the periods obtained for Building2B.

21
Table 2: Period Summary from the Computer Models
Period
Vibration Mode Perform 3D OpenSees Dominant direction
1 4.27 sec. 4.30 sec. Translation mode on X
direction
2 3.87 sec. 3.91 sec. Translation mode on Y
direction
3 2.34 sec. 2.36 sec. Torsional mode
2.3.2 Time History Analysis:
Systematic analyses were conducted to validate structural responses of the OpenSees’s
model using Perform3D’s model at four levels of ground shaking intensity, namely, SLE25,
SLE43, DBE, and MCE, with return periods of 25, 43, 475, and 2475 years, respectively. Each
hazard level includes 15 pairs (i.e., two horizontal components) of ground motions.To
compare the overall responses of these two models, inter-story drifts were investigated.
Inter-story drift profiles of OpenSees’s model and Perform 3D’s model (Figures 2-8 and 2-9)
showed that each engine’s mean and individual GM results are very to each other.

22
Mean Individual GM
Figure 2-8: Comparison of Inter-Story Drift Ratios in H1 (East–West) Direction.

23
Mean Individual GM
Figure 2-9: Comparison of Inter-Story Drift Ratios in H2 (North–South) Direction.

24
2.4 Revised Perform 3D Model for Slab Response:
In order to assess the effect of the vertical components of ground motions on slabs, a model
was built in Perform3D which had semi-rigid diaphragms on the roof, the 24th floor, the 10th
floor, and the 2nd floor. The diaphragms were modeled with a finite element mesh to account
for their in-plane stiffness and out-of-plane response. By modeling the selected floors, not
only the difference in slab responses can be evaluated in terms of change of floor levels but
also, it would help preventing numerical issues on analysis as well as reducing the analysis
time significantly with respect to the full semi-rigid model. The slabs were reinforced
concrete and were assumed to behave like horizontal shear walls. Therefore, as ASCE 41-13
suggests, the Effective Stiffness of 50% was assumed for in-plane and out-of-plane stiffness.
Figure 2.10 shows how these floors were meshed in Perform3D.
Figure 2-10: Typical Floor Diaphragm Meshing

25
Chapter 3
Analyses, Results, and Discussion 3.1 Time History Analysis:
Nonlinear response history analysis (NRHA) was performed on the model both including and
excluding the vertical component of ground motions. This has been done in OpenSees and
using Newmark’s integration method. Unconditional stability in Newmark’s method is
satisfied, where β= 0.25 and ϒ= 0.5. Furthermore, 2.5% damping is assumed. The first
horizontal mode and the 20% of the first period were used to calculate damping coefficients.
3.2 Ground Motions:
Papazoglou et al. (1996) have provided a broad review of structural damage attributable to
the vertical motion for analysis of typical structures under horizontal and combined
horizontal-vertical excitation based on previous earthquake records. These records have
shown the importance of the vertical component of ground motion, which is currently
ignored in the conventional design of buildings. These field observations can be used to
compute the response of structures under these real earthquake records using dynamic time
history analysis. The records were selected with respect to their fault type (strike-slip;
reverse) and their distance to the fault (near-field ground motions, far-field ground
motions). Only records from earthquakes with magnitude 6 and above which are recorded
on soil class C or D have been considered. Table 3-1 shows the group records in more detail.

26
Table 3-1: Ground Motion Groups Summary
Group Distance Fault
1 0-10 Strike-Slip
2 10-25 Strike-Slip
3 0-10 Reverse
4 10-25 Reverse
Among 190 usable records, 120 records were selected, 30 per group. The following tables
display essential characteristics of the ground motions, including magnitude, PGAs, V/H, and
the closest distance to the fault.

27
Table 3-2: Summary of Ground Motions of Group 1: Acceleration Information
Year Event Station PGA (g) Hor.1 Hor.2 Vert
V/H
1992 "Erzican_ Turkey" "Erzincan" 0.50 0.39 0.23 0.47
1995 "Kobe_ Japan" "KJMA" 0.83 0.63 0.34 0.41
1995 "Kobe_ Japan" "Takarazuka" 0.70 0.61 0.43 0.61
2002 "Denali_ Alaska" "TAPS Pump Station #10" 0.33 0.30 0.24 0.72
2000 "Tottori_ Japan" "SMNH01" 0.62 0.73 0.64 0.87
2000 "Tottori_ Japan" "TTRH02" 0.77 0.94 0.79 0.84
2003 "Bam_ Iran" "Bam" 0.81 0.63 0.97 1.20
2010 "Darfield_ New
Zealand" "GDLC" 0.76 0.71 1.25 1.63
2010 "Darfield_ New
Zealand" "HORC" 0.45 0.48 0.81 1.70
1995 "Kobe_ Japan" "Nishi-Akashi" 0.48 0.46 0.39 0.80
1999 "Duzce_ Turkey" "Lamont 1058" 0.11 0.08 0.07 0.69
1999 "Duzce_ Turkey" "Lamont 1059" 0.14 0.15 0.10 0.66
1999 "Duzce_ Turkey" "IRIGM 487" 0.28 0.30 0.23 0.76
1979 "Imperial Valley-06" "Agrarias" 0.29 0.19 0.47 1.64
1979 "Imperial Valley-06" "Bonds Corner" 0.60 0.78 0.53 0.68
1979 "Imperial Valley-06" "Chihuahua" 0.27 0.25 0.22 0.80
1979 "Imperial Valley-06" "EC County Center FF" 0.21 0.24 0.24 1.04
1979 "Imperial Valley-06" "El Centro Array #5" 0.53 0.38 0.59 1.12
1979 "Imperial Valley-06" "El Centro Array #6" 0.45 0.45 1.90 4.22
1979 "Imperial Valley-06" "El Centro Array #7" 0.34 0.47 0.58 1.23
1979 "Imperial Valley-06" "El Centro Array #8" 0.61 0.47 0.47 0.77
1979 "Imperial Valley-06" "El Centro Differential
Array" 0.35 0.48 0.77 1.60
1979 "Imperial Valley-06" "Holtville Post Office" 0.26 0.22 0.26 1.00
1995 "Kobe_ Japan" "Port Island (0 m)" 0.35 0.29 0.57 1.63
1999 "Kocaeli_ Turkey" "Yarimca" 0.23 0.32 0.24 0.75
1999 "Duzce_ Turkey" "Duzce" 0.40 0.51 0.35 0.67
2010 "Darfield_ New
Zealand" "DSLC" 0.26 0.24 0.32 1.23
2010 "Darfield_ New
Zealand" "LINC" 0.46 0.39 0.91 1.98
2010 "Darfield_ New
Zealand" "ROLC" 0.39 0.32 0.71 1.82
2010 "Darfield_ New
Zealand" "IWTH20" 0.30 0.21 0.87 2.92

28
Table 3-3: Summary of Ground Motions of Group 1: Moment Magnitude and Closest Distance
Year Event Station Mw Distance
1992 "Erzican_ Turkey" "Erzincan" 6.69 0
1995 "Kobe_ Japan" "KJMA" 6.9 0.94
1995 "Kobe_ Japan" "Takarazuka" 6.9 0
2002 "Denali_ Alaska" "TAPS Pump Station #10"
7.9 0.18
2000 "Tottori_ Japan" "SMNH01" 6.61 5.83
2000 "Tottori_ Japan" "TTRH02" 6.61 0.83
2003 "Bam_ Iran" "Bam" 6.6 0.05
2010 "Darfield_ New Zealand"
"GDLC" 7 1.22
2010 "Darfield_ New Zealand"
"HORC" 7 7.29
1995 "Kobe_ Japan" "Nishi-Akashi" 6.9 7.08
1999 "Duzce_ Turkey" "Lamont 1058" 7.14 0.21
1999 "Duzce_ Turkey" "Lamont 1059" 7.14 4.17
1999 "Duzce_ Turkey" "IRIGM 487" 7.14 2.65
1979 "Imperial Valley-06" "Agrarias" 6.53 0
1979 "Imperial Valley-06" "Bonds Corner" 6.53 0.44
1979 "Imperial Valley-06" "Chihuahua" 6.53 7.29
1979 "Imperial Valley-06" "EC County Center FF" 6.53 7.31
1979 "Imperial Valley-06" "El Centro Array #5" 6.53 1.76
1979 "Imperial Valley-06" "El Centro Array #6" 6.53 0
1979 "Imperial Valley-06" "El Centro Array #7" 6.53 0.56
1979 "Imperial Valley-06" "El Centro Array #8" 6.53 3.86
1979 "Imperial Valley-06" "El Centro Differential Array"
6.53 5.09
1979 "Imperial Valley-06" "Holtville Post Office" 6.53 5.35
1995 "Kobe_ Japan" "Port Island (0 m)" 6.9 3.31
1999 "Kocaeli_ Turkey" "Yarimca" 7.51 1.38
1999 "Duzce_ Turkey" "Duzce" 7.14 0
2010 "Darfield_ New Zealand"
"DSLC" 7 5.28
2010 "Darfield_ New Zealand"
"LINC" 7 5.07
2010 "Darfield_ New Zealand"
"ROLC" 7 0
2010 "Darfield_ New Zealand"
"IWTH20" 7 6.11

29
Table 3-4: Summary of Ground Motions of Group 2: Acceleration Information
Year Event Station PGA (g) Hor.1 Hor.2 Vert
V/H
1979 "Imperial Valley-06" "Cerro Prieto" 0.17 0.16 0.21 1.25
1992 "Landers" "Coolwater" 0.28 0.42 0.18 0.42
1992 "Landers" "Joshua Tree" 0.27 0.28 0.18 0.64
1992 "Landers" "Morongo Valley Fire
Station" 0.22 0.16 0.16 0.73
2000 "Tottori_ Japan" "OKY004" 0.82 0.54 0.17 0.21
2010 "Darfield_ New Zealand" "DFHS" 0.47 0.51 0.37 0.73
2010 "Darfield_ New Zealand" "Heathcote Valley Primary
School " 0.58 0.63 0.30 0.48
1990 "Manjil_ Iran" "Abbar" 0.51 0.50 0.54 1.05
2000 "Tottori_ Japan" "SMNH02" 0.32 0.58 0.37 0.65
1979 "Imperial Valley-06" "Calexico Fire Station" 0.28 0.20 0.19 0.70
1987 "Superstition Hills-02" "El Centro Imp. Co. Cent" 0.36 0.26 0.13 0.36
1987 "Superstition Hills-02" "Westmorland Fire Sta" 0.17 0.21 0.23 1.10
1987 "Superstition Hills-02" "Imperial Valley Wildlife
Liquefaction Array" 0.18 0.21 0.40 1.94
1995 "Kobe_ Japan" "Amagasaki" 0.28 0.33 0.34 1.05
1995 "Kobe_ Japan" "Fukushima" 0.18 0.22 0.20 0.92
1999 "Kocaeli_ Turkey" "Duzce" 0.31 0.36 0.21 0.57
1999 "Duzce_ Turkey" "Bolu" 0.74 0.81 0.20 0.25
2000 "Tottori_ Japan" "SMN002" 0.18 0.15 0.11 0.60
2010 "El Mayor-Cucapah_ Mexico" "Chihuahua" 0.25 0.20 0.28 1.12
2010 "El Mayor-Cucapah_ Mexico" "MICHOACAN DE OCAMPO" 0.54 0.41 0.80 1.49
2010 "El Mayor-Cucapah_ Mexico" "RIITO" 0.40 0.38 0.67 1.69
2010 "El Mayor-Cucapah_ Mexico" "EJIDO SALTILLO" 0.15 0.15 0.18 1.15
2010 "El Mayor-Cucapah_ Mexico" "El Centro -Imperial & Ross" 0.37 0.38 0.27 0.71
2010 "El Mayor-Cucapah_ Mexico" "El Centro Differential Array" 0.51 0.55 0.31 0.56
2010 "Darfield_ New Zealand" "Christchurch Cashmere
High School" 0.23 0.25 0.30 1.18
2010 "Darfield_ New Zealand" "Pages Road Pumping
Station" 0.22 0.20 0.32 1.42
2010 "Darfield_ New Zealand" "Christchurch Resthaven " 0.26 0.24 0.21 0.81
2010 "Darfield_ New Zealand" "Riccarton High School " 0.19 0.23 0.31 1.32
2010 "Darfield_ New Zealand" "Styx Mill Transfer Station " 0.18 0.17 0.23 1.33
2010 "El Mayor-Cucapah_ Mexico" "Westside Elementary
School" 0.28 0.26 0.24 0.86

30
Table 3-5: Summary of Ground Motions of Group 2: Moment Magnitude and Closest Distance
Year Event Station Mw Distance
1979 "Imperial Valley-06" "Cerro Prieto" 6.53 15.19
1992 "Landers" "Coolwater" 7.28 19.74
1992 "Landers" "Joshua Tree" 7.28 11.03
1992 "Landers" "Morongo Valley Fire Station" 7.28 17.36
2000 "Tottori_ Japan" "OKY004" 6.61 19.72
2010 "Darfield_ New Zealand" "DFHS" 7 11.86
2010 "Darfield_ New Zealand" "Heathcote Valley Primary School "
7 24.36
1990 "Manjil_ Iran" "Abbar" 7.37 12.55
2000 "Tottori_ Japan" "SMNH02" 6.61 23.64
1979 "Imperial Valley-06" "Calexico Fire Station" 6.53 10.45
1987 "Superstition Hills-02" "El Centro Imp. Co. Cent" 6.54 18.2
1987 "Superstition Hills-02" "Westmorland Fire Sta" 6.54 13.03
1987 "Superstition Hills-02" "Imperial Valley Wildlife Liquefaction Array"
6.54 23.85
1995 "Kobe_ Japan" "Amagasaki" 6.9 11.34
1995 "Kobe_ Japan" "Fukushima" 6.9 17.85
1999 "Kocaeli_ Turkey" "Duzce" 7.51 13.6
1999 "Duzce_ Turkey" "Bolu" 7.14 12.02
2000 "Tottori_ Japan" "SMN002" 6.61 16.6
2010 "El Mayor-Cucapah_ Mexico" "Chihuahua" 7.2 18.21
2010 "El Mayor-Cucapah_ Mexico" "MICHOACAN DE OCAMPO" 7.2 13.21
2010 "El Mayor-Cucapah_ Mexico" "RIITO" 7.2 13.7
2010 "El Mayor-Cucapah_ Mexico" "EJIDO SALTILLO" 7.2 14.8
2010 "El Mayor-Cucapah_ Mexico" "El Centro -Imperial & Ross" 7.2 19.39
2010 "El Mayor-Cucapah_ Mexico" "El Centro Differential Array" 7.2 22.83
2010 "Darfield_ New Zealand" "Christchurch Cashmere High School"
7 17.64
2010 "Darfield_ New Zealand" "Pages Road Pumping Station"
7 24.55
2010 "Darfield_ New Zealand" "Christchurch Resthaven " 7 19.48
2010 "Darfield_ New Zealand" "Riccarton High School " 7 13.64
2010 "Darfield_ New Zealand" "Styx Mill Transfer Station " 7 20.86
2010 "El Mayor-Cucapah_ Mexico" "Westside Elementary School"
7.2 10.31

31
Table 3-6: Summary of Ground Motions of Group 3: Acceleration Information
Year Event Station PGA (g) Hor.1 Hor.2 Vert
V/H
1994 "Northridge-01" "Jensen Filter Plant
Administrative Building" 0.41 0.62 0.35 0.56
1994 "Northridge-01" "Pardee -SCE" 0.56 0.30 0.39 0.69
1994 "Northridge-01" "Sylmar -Converter Sta East" 0.85 0.45 0.48 0.56
1994 "Northridge-01" "Sylmar -Olive View Med FF" 0.60 0.84 0.54 0.64
2003 "San Simeon_ CA" "Cambria -Hwy 1 Caltrans
Bridge" 0.18 0.13 0.09 0.49
2003 "San Simeon_ CA" "Templeton -1-story Hospital" 0.44 0.48 0.26 0.55
2004 "Niigata_ Japan" "NIG019" 1.33 1.17 0.80 0.60
2004 "Niigata_ Japan" "NIG020" 0.41 0.53 0.31 0.59
2004 "Niigata_ Japan" "NIG028" 0.52 0.85 0.44 0.52
2004 "Niigata_ Japan" "NIGH01" 0.67 0.84 0.38 0.45
2004 "Niigata_ Japan" "NIGH11" 0.60 0.46 0.32 0.53
1979 "Montenegro_
Yugoslavia" "Bar-Skupstina Opstine" 0.37 0.37 0.24 0.65
1979 "Montenegro_
Yugoslavia" "Ulcinj -Hotel Albatros" 0.18 0.23 0.23 0.99
1979 "Montenegro_
Yugoslavia" "Ulcinj -Hotel Olimpic" 0.29 0.25 0.46 1.57
1978 "Tabas_ Iran" "Tabas" 0.85 0.86 0.64 0.74
1985 "Nahanni_ Canada" "Site 1" 1.11 1.20 2.28 1.90
1985 "Nahanni_ Canada" "Site 3" 0.18 0.17 0.14 0.79
1992 "Cape Mendocino" "Cape Mendocino" 1.49 1.04 0.74 0.49
1994 "Northridge-01" "Jensen Filter Plant Generator
Building" 0.57 0.99 0.76 0.77
1994 "Northridge-01" "LA Dam" 0.43 0.32 0.32 0.75
1994 "Northridge-01" "Pacoima Kagel Canyon" 0.30 0.43 0.17 0.39
1979 "Montenegro_
Yugoslavia" "Petrovac -Hotel Olivia" 0.46 0.30 0.21 0.45
2008 "Iwate_ Japan" "IWTH25" 1.43 1.15 3.84 2.68
1976 "Gazli_ USSR" "Karakyr" 0.70 0.86 1.70 1.97
1994 "Northridge-01" "Arleta -Nordhoff Fire Sta" 0.35 0.31 0.55 1.60
1994 "Northridge-01" "Newhall -Fire Sta" 0.58 0.59 0.55 0.93
1994 "Northridge-01" "Newhall -W Pico Canyon Rd." 0.42 0.36 0.30 0.71
1994 "Northridge-01" "Rinaldi Receiving Sta" 0.87 0.47 0.96 1.10
1994 "Northridge-01" "Sylmar -Converter Sta" 0.62 0.92 0.61 0.66
2008 "Iwate_ Japan" "IWT011" 0.22 0.15 0.21 0.96

32
Table 3-7: Summary of Ground Motions of Group 3: Moment Magnitude and Closest Distance
Year Event Station Mw Distance
1994 "Northridge-01" "Jensen Filter Plant
Administrative Building" 6.69 0
1994 "Northridge-01" "Pardee -SCE" 6.69 5.54
1994 "Northridge-01" "Sylmar -Converter Sta East" 6.69 0
1994 "Northridge-01" "Sylmar -Olive View Med FF" 6.69 1.74
2003 "San Simeon_ CA" "Cambria -Hwy 1 Caltrans
Bridge" 6.52 6.97
2003 "San Simeon_ CA" "Templeton -1-story Hospital" 6.52 5.07
2004 "Niigata_ Japan" "NIG019" 6.63 0.21
2004 "Niigata_ Japan" "NIG020" 6.63 7.45
2004 "Niigata_ Japan" "NIG028" 6.63 0.46
2004 "Niigata_ Japan" "NIGH01" 6.63 0.49
2004 "Niigata_ Japan" "NIGH11" 6.63 6.27
1979 "Montenegro_
Yugoslavia" "Bar-Skupstina Opstine" 7.1 0
1979 "Montenegro_
Yugoslavia" "Ulcinj -Hotel Albatros" 7.1 1.52
1979 "Montenegro_
Yugoslavia" "Ulcinj -Hotel Olimpic" 7.1 3.97
1978 "Tabas_ Iran" "Tabas" 7.35 1.79
1985 "Nahanni_ Canada" "Site 1" 6.76 2.48
1985 "Nahanni_ Canada" "Site 3" 6.76 4.93
1992 "Cape Mendocino" "Cape Mendocino" 7.01 0
1994 "Northridge-01" "Jensen Filter Plant Generator
Building" 6.69 0
1994 "Northridge-01" "LA Dam" 6.69 0
1994 "Northridge-01" "Pacoima Kagel Canyon" 6.69 5.26
1979 "Montenegro_
Yugoslavia" "Petrovac -Hotel Olivia" 7.1 0
2008 "Iwate_ Japan" "IWTH25" 6.9 0
1976 "Gazli_ USSR" "Karakyr" 6.8 3.92
1994 "Northridge-01" "Arleta -Nordhoff Fire Sta" 6.69 3.3
1994 "Northridge-01" "Newhall -Fire Sta" 6.69 3.16
1994 "Northridge-01" "Newhall -W Pico Canyon Rd." 6.69 2.11
1994 "Northridge-01" "Rinaldi Receiving Sta" 6.69 0
1994 "Northridge-01" "Sylmar -Converter Sta" 6.69 0
2008 "Iwate_ Japan" "IWT011" 6.9 8.41

33
Table 3-8: Summary of Ground Motions of Group 4: Acceleration Information
Year Event Station PGA (g) Hor.1 Hor.2 Vert
V/H
1971 "San Fernando" "Castaic -Old Ridge
Route" 0.32048 0.27516 0.1666 0.51984
1971 "San Fernando" "LA -Hollywood Stor
FF" 0.22476 0.19493 0.16427 0.73084
1994 "Northridge-01" "Canyon Country -W
Lost Cany" 0.40361 0.47163 0.30349 0.64349
1994 "Northridge-01" "LA -Brentwood VA
Hospital" 0.18536 0.16424 0.13807 0.74484
1994 "Northridge-01" "LA -UCLA Grounds" 0.27788 0.47381 0.26497 0.55923
1994 "Northridge-01" "Sunland -Mt Gleason
Ave" 0.13298 0.15724 0.20335 1.2933
2004 "Niigata_ Japan" "NIGH09" 0.39762 0.3763 0.24448 0.61485
2007 "Chuetsu-oki_
Japan" "Shiura Nagaoka" 0.22909 0.21551 0.11629 0.50761
2007 "Chuetsu-oki_
Japan" "NIG028" 0.13068 0.13945 0.076164 0.54619
2008 "Iwate_ Japan" "AKTH04" 2.4685 1.3433 1.1058 0.44796
2008 "Iwate_ Japan" "AKTH06" 0.18967 0.18449 0.14258 0.75172
2008 "Iwate_ Japan" "MYG005" 0.53551 0.53551 0.65675 1.2264
2008 "Iwate_ Japan" "Iwadeyama" 0.35409 0.26871 0.23008 0.64978
1971 "San Fernando" "Lake Hughes #12" 0.38215 0.28217 0.19418 0.50813
1971 "San Fernando" "Lake Hughes #9" 0.16988 0.14345 0.094275 0.55493
1976 "Friuli_ Italy-01" "Tolmezzo" 0.35713 0.31512 0.27704 0.77576
1994 "Northridge-01" "Beverly Hills -12520
Mulhol" 0.62092 0.44991 0.32582 0.52474
1994 "Northridge-01" "Lake Hughes #12A" 0.17445 0.25713 0.12055 0.46882
1994 "Northridge-01" "Topanga -Fire Sta" 0.32469 0.19247 0.19474 0.59977
2003 "San Simeon_ CA" "San Antonio Dam -Toe" 0.092985 0.12103 0.059472 0.49139
2007 "Chuetsu-oki_
Japan" "Kashiwazaki City Takayanagicho"
0.36207 0.72686 0.40537 0.5577
2007 "Chuetsu-oki_
Japan" "Oguni Nagaoka" 0.62535 0.51331 0.23961 0.38315
2008 "Iwate_ Japan" "AKT023" 0.3658 0.36784 0.25009 0.6799
2008 "Iwate_ Japan" "IWT015" 0.24339 0.2002 0.12186 0.50069
2008 "Iwate_ Japan" "Minase Yuzawa" 0.21533 0.244 0.13913 0.57018
2008 "Iwate_ Japan" "Kurihara City" 0.70268 0.42199 0.28619 0.40728
2008 "Iwate_ Japan" "Ichinoseki Maikawa" 0.33839 0.39224 0.16527 0.42134
1994 "Northridge-01" "LA -N Faring Rd" 0.27998 0.26365 0.18433 0.65837
2007 "Chuetsu-oki_
Japan" "NIG017" 0.24619 0.20681 0.1668 0.67751
2008 "Iwate_ Japan" "IWTH20" 0.24453 0.25434 0.13837 0.54403

34
Table 3-9: Summary of Ground Motions of Group 4: Moment Magnitude and Closest Distance
Year Event Station Mw Distance
1971 "San Fernando" "Castaic -Old Ridge
Route" 6.61 19.33
1971 "San Fernando" "LA -Hollywood Stor FF" 6.61 22.77
1994 "Northridge-01" "Canyon Country -W Lost
Cany" 6.69 11.39
1994 "Northridge-01" "LA -Brentwood VA
Hospital" 6.69 12.92
1994 "Northridge-01" "LA -UCLA Grounds" 6.69 13.8
1994 "Northridge-01" "Sunland -Mt Gleason
Ave" 6.69 12.38
2004 "Niigata_ Japan" "NIGH09" 6.63 22.37
2007 "Chuetsu-oki_ Japan" "Shiura Nagaoka" 6.8 10.61
2007 "Chuetsu-oki_ Japan" "NIG028" 6.8 15.32
2008 "Iwate_ Japan" "AKTH04" 6.9 13.07
2008 "Iwate_ Japan" "AKTH06" 6.9 19.15
2008 "Iwate_ Japan" "MYG005" 6.9 10.71
2008 "Iwate_ Japan" "Iwadeyama" 6.9 20.77
1971 "San Fernando" "Lake Hughes #12." 6.61 13.99
1971 "San Fernando" "Lake Hughes #9." 6.61 17.22
1976 "Friuli_ Italy-01" "Tolmezzo" 6.5 14.97
1994 "Northridge-01" "Beverly Hills -12520
Mulhol" 6.69 12.39
1994 "Northridge-01" "Lake Hughes #12A" 6.69 20.77
1994 "Northridge-01" "Topanga -Fire Sta" 6.69 10.31
2003 "San Simeon_ CA" "San Antonio Dam -Toe" 6.52 16.17
2007 "Chuetsu-oki_ Japan" "Kashiwazaki City Takayanagicho"
6.8 10.38
2007 "Chuetsu-oki_ Japan" "Oguni Nagaoka" 6.8 10.31
2008 "Iwate_ Japan" "AKT023" 6.9 11.68
2008 "Iwate_ Japan" "IWT015" 6.9 17.05
2008 "Iwate_ Japan" "Minase Yuzawa" 6.9 17.34
2008 "Iwate_ Japan" "Kurihara City" 6.9 12.83
2008 "Iwate_ Japan" "Ichinoseki Maikawa" 6.9 23.01
1994 "Northridge-01" "LA -N Faring Rd" 6.69 12.42
2007 "Chuetsu-oki_ Japan" "NIG017" 6.8 11.2
2008 "Iwate_ Japan" "IWTH20" 6.9 18.74

35
3.3 Defining Intensity Measure:
The purpose of this research is to show the difference between the building’s response under
two horizontal components and one vertical component, and the structure’s response under
only horizontal components. To present these changes in the response of structure, it is
crucial to determine the properties of a recorded earthquake that are most directly related
to the structures behavior. A value that quantifies the effect of a ground motion on the
structure is often called an Intensity Measure (IM). A record’s Peak Ground Acceleration has
frequently been used as an IM. However, ratio of PGAV to PGAH is not a good IM because it
can not show the strength of the ground motion.In other words, the structural response
cannot be presented correctly because PGAV/PGAH cannot presents the difference between
the strength of earthquakes which have similar V/H .
The efficiency of the estimation of the structural response can be enhanced if the correlation
between vertical and horizontal motions could be accounted for by an improved intensity
measure. In this research, the IM considered consists of the ratio of PGAV to PGAH along with
a third set of parameters: the magnitude (M), distance (R), and 30-m shear-wave velocity
(V30)associated with the ground motion. The resulting IM is called Ɛ (“epsilon”), which is
calculated as follows:
)ln(
)ln()ln(
/
/
HV
HV
H
V
PGA
PGA
The parameters PGAV and PGAH are obtained from empirical earthquake data. The
predicted median value of V/H, /V H , and the total aleatory standard deviation of the V/H
prediction, /V H , are calculated using CB16 ground motion model Bozorgnia and Campbell

36
(2016), using M, R, and V30 as input. The logarithms of all values in the ratio are taken, and
the result is Ɛ.
3.4 Response to Earthquake Ground Motions:
Each set of earthquakes cosidered in this study has 30 ground motions. Nonlinear response
history analysis has been performed for all of the individual ground motions in each group
with and without vertical component of ground motions.The Engineering demand
parameters (interstory drift ratio, peak floor acceleration, story shear and etc) were
obtained for all individual motions including vertical component (EDPV+H) as well as for all
individual motions without vertical excitation(EDPH).The ratios of EDPV+H and EDPH is called
𝛼 and is calculated as follows for each ground motion.
𝛼 =𝐸𝐷𝑃𝑉+𝐻
𝐸𝐷𝑃𝐻
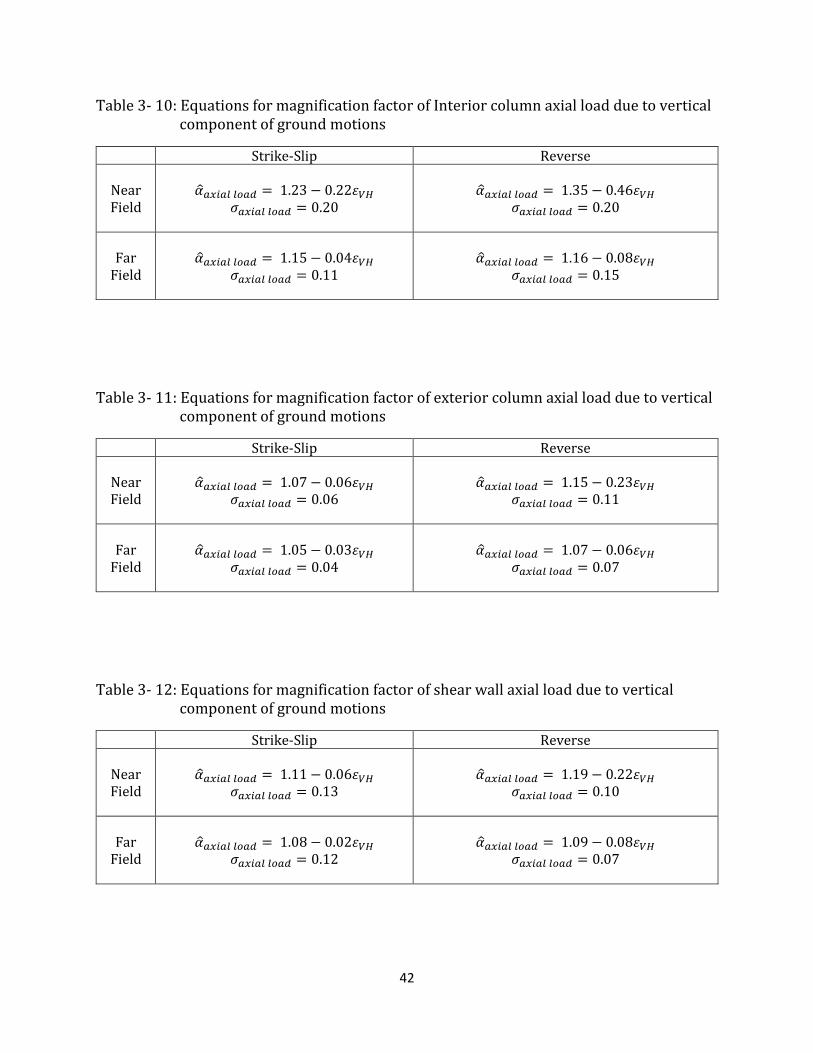
Based on the individual ratios 𝛼, a linear equation (per Table 3-10 to 3-14) has been
established to estimate a magnification factor(�̂�) as a function of Ɛ. In this study, axial force
on columns and shear walls, maximum inter-story drifts ratio, story shear, peak floor vertical
acceleration and peak floor vertical displacement were investigated.

37
3.4.1 Axial Force:
Figure 3-1 through 3-4 compare the axial force on exterior and interior columns, with and
without vertical excitation for each group respectively. Based on these figures, it can be
concluded that interior columns are significantly more influenced by vertical excitation than
exterior columns and shear walls. The motions with reverse fault type and a short distance
to a fault have a significant effect on the axial force of columns and shear walls. As seen in
Figure 3-3, the axial load in interior columns is amplified by 35% at the median level. As the
ratio PGAv/PGAH increases, the magnification factor increases significantly. There is less
change in axial force ratio (H+V/H) from median level for motions with short distance to
strike-slip fault than with motions at a short distance to reverse fault. The change in �̂� is
very small for both far-field groups as compared to the near-field groups resulting
comparatively small change in axial force in the interior columns. The same pattern, with
smaller magnification values, can be seen for exterior columns and shear walls. It can thus
be concluded that in general, earthquakes with a reverse fault have more effect on the axial
load of columns and shear walls than earthquakes with a strike-slip fault. The effect of the
vertical component is more on the interior columns than the exterior columns and shear
walls since interior columns carry more gravity load than exterior columns and shear walls.
Tables 3-9 through 3-12 present the summary of equations of magnification factor for axial
load in columns and shear walls due to the effect of vertical excitation.

38
Figure 3- 1: Axial Force on Exterior and Interior Columns for Group 1
Figure 3- 2: Axial Force on Exterior and Interior Columns for Group 2

39
Figure 3- 3: Axial Force on Exterior and Interior Columns for Group 3
Figure 3- 4: Axial Force on Exterior and Interior Columns for Group 4

40
Figure 3- 5: Axial Force on Shear Walls for Group 1
Figure 3- 6: Axial Force on Shear Walls for Group 2

41
Figure 3- 7: Axial Force on Shear Walls for Group 3
Figure 3- 8: Axial Force on Shear Walls for Group 4
42
Table 3- 10: Equations for magnification factor of Interior column axial load due to vertical component of ground motions
Strike-Slip Reverse
Near Field
�̂�𝑎𝑥𝑖𝑎𝑙 𝑙𝑜𝑎𝑑 = 1.23 − 0.22𝜀𝑉𝐻 𝜎𝑎𝑥𝑖𝑎𝑙 𝑙𝑜𝑎𝑑 = 0.20
�̂�𝑎𝑥𝑖𝑎𝑙 𝑙𝑜𝑎𝑑 = 1.35 − 0.46𝜀𝑉𝐻 𝜎𝑎𝑥𝑖𝑎𝑙 𝑙𝑜𝑎𝑑 = 0.20
Far Field
�̂�𝑎𝑥𝑖𝑎𝑙 𝑙𝑜𝑎𝑑 = 1.15 − 0.04𝜀𝑉𝐻 𝜎𝑎𝑥𝑖𝑎𝑙 𝑙𝑜𝑎𝑑 = 0.11
�̂�𝑎𝑥𝑖𝑎𝑙 𝑙𝑜𝑎𝑑 = 1.16 − 0.08𝜀𝑉𝐻 𝜎𝑎𝑥𝑖𝑎𝑙 𝑙𝑜𝑎𝑑 = 0.15
Table 3- 11: Equations for magnification factor of exterior column axial load due to vertical component of ground motions
Strike-Slip Reverse
Near Field
�̂�𝑎𝑥𝑖𝑎𝑙 𝑙𝑜𝑎𝑑 = 1.07 − 0.06𝜀𝑉𝐻 𝜎𝑎𝑥𝑖𝑎𝑙 𝑙𝑜𝑎𝑑 = 0.06
�̂�𝑎𝑥𝑖𝑎𝑙 𝑙𝑜𝑎𝑑 = 1.15 − 0.23𝜀𝑉𝐻 𝜎𝑎𝑥𝑖𝑎𝑙 𝑙𝑜𝑎𝑑 = 0.11
Far Field
�̂�𝑎𝑥𝑖𝑎𝑙 𝑙𝑜𝑎𝑑 = 1.05 − 0.03𝜀𝑉𝐻 𝜎𝑎𝑥𝑖𝑎𝑙 𝑙𝑜𝑎𝑑 = 0.04
�̂�𝑎𝑥𝑖𝑎𝑙 𝑙𝑜𝑎𝑑 = 1.07 − 0.06𝜀𝑉𝐻 𝜎𝑎𝑥𝑖𝑎𝑙 𝑙𝑜𝑎𝑑 = 0.07
Table 3- 12: Equations for magnification factor of shear wall axial load due to vertical component of ground motions
Strike-Slip Reverse
Near Field
�̂�𝑎𝑥𝑖𝑎𝑙 𝑙𝑜𝑎𝑑 = 1.11 − 0.06𝜀𝑉𝐻 𝜎𝑎𝑥𝑖𝑎𝑙 𝑙𝑜𝑎𝑑 = 0.13
�̂�𝑎𝑥𝑖𝑎𝑙 𝑙𝑜𝑎𝑑 = 1.19 − 0.22𝜀𝑉𝐻 𝜎𝑎𝑥𝑖𝑎𝑙 𝑙𝑜𝑎𝑑 = 0.10
Far Field
�̂�𝑎𝑥𝑖𝑎𝑙 𝑙𝑜𝑎𝑑 = 1.08 − 0.02𝜀𝑉𝐻 𝜎𝑎𝑥𝑖𝑎𝑙 𝑙𝑜𝑎𝑑 = 0.12
�̂�𝑎𝑥𝑖𝑎𝑙 𝑙𝑜𝑎𝑑 = 1.09 − 0.08𝜀𝑉𝐻 𝜎𝑎𝑥𝑖𝑎𝑙 𝑙𝑜𝑎𝑑 = 0.07

43
3.4.2 Inter-Story Drifts:
Figure 3-9 through 3-12 represent the maximum inter-story drift ratio (IDR) of the
structure’s response under the vertical and horizontal components of ground motions to the
response of the structure under only horizontal components. The figures show that there is
no significant contribution to story drift from inclusion of vertical component in the analysis.
As with axial load ratio, near-field ground motions with reverse faults have the most effect
on the maximum IDR. Table 3-13 shows that IDR magnification factor (𝛼 ) is very small for
all groups. To calculate the inter story drift, one need only consider the horizontal
components of ground motion.

44
Figure 3- 9: Max Inter-Story Drift Ratio for Group 1
Figure 3- 10: Max Inter-Story Drift Ratio for Group 2

45
Figure 3- 11: Max Inter-Story Drift Ratio for Group 3
Figure 3- 12: Max Inter-Story Drift Ratio for Group 4

46
Table 3- 13: Equations for magnification factor of max IDR ratio due to vertical component of ground motions
Strike-Slip Reverse
Near Field
�̂�𝑀𝑎𝑥 𝐼𝐷𝑅 = 1.04 − 0.05𝜀𝑉𝐻 𝜎𝑀𝑎𝑥 𝐼𝐷𝑅 = 0.035
�̂�𝑀𝑎𝑥 𝐼𝐷𝑅 = 1.06 − 0.08𝜀𝑉𝐻 𝜎𝑀𝑎𝑥 𝐼𝐷𝑅 = 0.052
Far Field
�̂�𝑀𝑎𝑥 𝐼𝐷𝑅 = 1.02 − 0.02𝜀𝑉𝐻 𝜎𝑀𝑎𝑥 𝐼𝐷𝑅 = 0.030
�̂�𝑀𝑎𝑥 𝐼𝐷𝑅 = 1.02 − 0.006𝜀𝑉𝐻 𝜎𝑀𝑎𝑥 𝐼𝐷𝑅 = 0.01
3.4.3 Story Shear:
Figure 3-9 through 3-12 represent the maximum story shear ratio of the structure’s response
under both the vertical and the horizontal components of ground motions to the response of
the building under only horizontal components. The figures show no significant change in
story shear when the vertical component is factored in. As with the axial load ratio, near-
field earthquakes with reverse faults have the most effect on the story shear. Table 3-14
shows that story shear magnification factor (𝛼) is very small for all groups.

47
Figure 3- 13: Max Story Shear Ratio for Group 1
Figure 3- 14: Max Story Shear Ratio for Group 2

48
Figure 3- 15: Max Story Shear Ratio for Group 3
Figure 3- 16: Max Story Shear Ratio for Group 4

49
Table 3- 14: Equations for magnification factor of story shear ratio due to vertical component of ground motions
Strike-Slip Reverse
Near Field
�̂�𝑠𝑡𝑜𝑟𝑦 𝑠ℎ𝑒𝑎𝑟 = 1.06 − 0.05𝜀𝑉𝐻
𝜎𝑠𝑡𝑜𝑟𝑦 𝑠ℎ𝑒𝑎𝑟 = 0.04
�̂�𝑠𝑡𝑜𝑟𝑦 𝑠ℎ𝑒𝑎𝑟 = 1.09 − 0.06𝜀𝑉𝐻
𝜎𝑠𝑡𝑜𝑟𝑦 𝑠ℎ𝑒𝑎𝑟 = 0.05
Far Field
�̂�𝑠𝑡𝑜𝑟𝑦 𝑠ℎ𝑒𝑎𝑟 = 1.05 − 0.03𝜀𝑉𝐻
𝜎𝑠𝑡𝑜𝑟𝑦 𝑠ℎ𝑒𝑎𝑟 = 0.04
�̂�𝑠𝑡𝑜𝑟𝑦 𝑠ℎ𝑒𝑎𝑟 = 1.05 − 0.03𝜀𝑉𝐻
𝜎𝑠𝑡𝑜𝑟𝑦 𝑠ℎ𝑒𝑎𝑟 = 0.02
3.4.4 Slab Response analysis:
From 30 records of each group, 6 records were selected with different V/H ratios to
calculated vertical displacement and acceleration of the slab at 2nd, 10th and 24th floors
along with the roof. The vertical acceleration and vertical displacement ratio (V+H/H) are
not a good EDPs for showing the effect of the vertical component of ground motions on slabs
because the vertical acceleration and the vertical displacement experienced by slab under
only horizontal components are negligible. Therefore only the results of the model under
ground motions including the vertical excitation are presented in the following sections.
3.4.4.1 Slab Vertical Acceleration:
Figures 3-17 through 3-20 present the peak floor acceleration of slab including vertical
excitation from the nonlinear response history analysis when the slab is accelerated
vertically. As seen in the figures, the near-field earthquakes have much more effect on the
slab vertical acceleration than far-field motions. The figures show that the vertical
acceleration of slab is around 2.2g for near-field with reverse fault earthquakes. It can be
concluded that the vertical component of ground motion is very important for slab design.

50
The peak floor vertical acceleration decreases gradually when floor level increases. In other
words, the peak floor vertical acceleration and floor level are inversely proportional to each
other. It must be emphasized that the slope of the linear regression line for near-field ground
motions are very sharp. This means that the slab vertical acceleration value is significantly
different for various potential earthquakes in each group.

51
`
Figure 3- 17: Vertical Acceleration at Mid-Span at Corner Slab for Group 1

52
Figure 3- 18: Vertical Acceleration at Mid-Span at Corner Slab for Group 2

53
Figure 3- 19: Vertical Acceleration at Mid-Span at Corner Slab for Group 3

54
Figure 3- 20: Vertical Acceleration at Mid-Span at Corner Slab for Group 4

55
3.4.4.2 Slab Vertical Displacement:
Figures 3-21 through 3-24 present the vertical displacement of the slab when vertical
excitation is included. As with other EDPs, the near-field earthquakes have much more effect
on the magnification factor than far-field earthquakes. The figure 3-23 show that the vertical
displacement of the slab is approximately 2.4 inch in the second floor for motions at near-
field to reverse fault. As with the absolute vertical acceleration, the relative vertical
displacement decreases gradually when floor level increases.

56
Figure 3- 21: Vertical Displacement at Mid-Span at Corner Slab for Group 1

57
Figure 3- 22: Vertical Displacement at Mid-Span at Corner Slab for Group 2

58
Figure 3- 23: Vertical Displacement at Mid-Span at Corner Slab for Group 3

59
Figure 3- 24: Vertical Displacement at Mid-Span at Corner Slab for Group 4

60
Chapter 4
SUMMARY AND CONCLUSIONS
4.1 Summary
With the increasing interest in understanding the effect of the vertical component of ground
motion on structures, modeling the buildings to simulate the effects of the vertical motions
remains a major challenge for the earthquake engineering community. This study presents
the influence of vertical component of ground motions on the response of a tall building;
earthquakes with reverse fault and strike-slip with short or far distance to the fault are
considered. In addition, equations for estimating the effect of vertical component of ground
motions on tall buildings were developed based on the results. This was done by modeling
Model 2B of PEER’s Case Studies of the Seismic Performance of Tall Buildings (Moehle, et al.
2011). which is a high-rise, reinforced concrete, dual-system building located at a highly
seismic site, and which was designed using the performance-based seismic design
procedures of the TBI Guidelines. Time history analysis was performed for near-field and
far-field records which had either reverse or strike-slip fault type. These records were
obtained from the NGA-West2 database.

61
4.2 Conclusion and observations
The results of the present study can be summarized as follows.
1. The vertical component of an earthquake increased the axial force on the columns
over that of the horizontal components by 20% to 120%. This increase was higher for
interior columns than exterior columns and shear walls. Earthquakes with reverse
faults have a stronger effect on a column’s axial load than strike-slip faults. Moreover,
earthquakes in the near field have a significantly higher effect on axial load than
earthquakes in the far-field.
2. Maximum inter-story drifts and story shear response do not change considerably due
to vertical excitation consideration. For in the median sense and for strong
earthquakes with a short distance to the fault, story drifts and story shears increase
only around 6%.; there is a small increase in magnification factor for rare records
with higher𝑃𝐺𝐴𝑉 𝑃𝐺𝐴𝐻⁄ . This means that vertical components are unnecessary for
calculating the inter-story drift and story-shear.
3. The vertical component of ground motion has a significant effect on slab vertical
acceleration. For near-field and far-field records, it is really important to include the
vertical component of ground motion in the analysis when designing a slab. The peak
floor vertical acceleration and floor level are inversely proportional to each other. For
near-field ground motions, the absolute vertical acceleration experienced by slab for
rare earthquakes is significantly different than the most likely events.

62
4. Slab vertical displacement is highly influenced by vertical excitation. The floor
relative vertical displacement decreases gradually when floor level increases. The
relative vertical displacement experienced by slab for rare earthquakes is
significantly different than the most likely events for all ground motions

63
Bibliography
ACI 318-08. 2008. Building Code Requirements for Structural Concrete and Commentary . American
Concrete Institute Committee 318.
Ahmadi G, Mostaghel N. 1980. "Stability and Upper Bound to the Response of Tall Structures to
Earthquake Support Motion." Journal of Earthquake Engineering of Structural Mechanics 8
(2): 151-159. doi:10.1080/03601218008907357.
Ambraseys, N., and J. Douglas. 2003. "Effect of Vertical Ground Motions on Horizontal Response of
Structures." International Journal of Structural Stability and Dynamics 3 (2): 227-265.
doi:DOI: 10.1142/S0219455403000902.
Antoniou, S. 1997. "Shear Assessment of R/C Structures Under Combined Earthquake Loading." MSc
Dissertation, ESEE, Imperial College.
ASCE 41-13. 2013. Seismic Rehabilitation of Existing Buildings Buildings. Reston, Virginia.: American
Society of Civil Engineers.
ASCE7-05. 2005. Minimum Design Load for Buildings and Other Structures. Reston,Vitginia:
American Society of Civil Engineers.
Bozorgnia, Y., and K. W. Campbell. 2016. "Ground Motion Model for the Vertical-to-Horizontal (V/H)
Ratios of PGA, PGV, and Response Spectra." Earthquake Spectra 32 (2): 979-1004.
doi:10.1193/072814EQS121M.
Bozorgnia, Y., and K. W. Campbell. 2004. "The Vertical-To-Horizontal Response Spectral Ratio and
Tentative Procedures for Developing Simplified V/H and Vertical Design Spectra." Journal of
Earthquake Engineering 8 (4): 175-207. doi:10.1080/13632460409350486.

64
CEN. 2005a. Design of structures for earthquake resistance - Part 1: General rules. EN 1998-1,
Bruxelles, Belgium: European Committee for Standardization.
Collier, C. J., and A. S. Elnashai. 2001. "A Procedure for Combining Vertical and Horizontal Seismic
Action Effects." Journal of Earthquake Engineering 5 (4): 521-539.
doi:10.1142/S136324690100056X.
Commission of the European Communities. 1993. Eurocode 8: Earthquake Resistant Design of
Structures, CEN/TC250/SC8 |Part 1.1: Seismic actions and general requirements for
structures.
CSI Perform 3D V4. 2006. "Nonlinear Analysis and Performance Assessment for 3D Structures."
Berkeley, CA: Computer and Structures, Inc.
Deger, Z. T., and T. Y. Yang. 2015. "Seismic Performance of Reinforced Concrete Core Wall Buildings
With and Without Moment-Resisting Frames." Structural Design of Tall and Special Buildings
24 (7): 477-490. doi:10.1002/tal.1175.
FEMA-356. 2000. Prestandard and Commentary for the Seismic Rehabilitation of Buildings.
Washington, DC: Federal Emergency Management Agency.
Friedland, I., M. Power, and R. Mayes. 1997. "Proceedings of the FHWA/NCEER Workshop on the
National Representatino of Seismic Ground Motion for New and Existing Highway
Facilities." Technical Report NCEER-97-0010.
Ghodsi, T., J. F. Ruiz, C. Massie, and Y. Chen. 2010. "PEER/SSC Tall Building Design Case History No.
2." Structural Design of Tall and Special Buildings 19 (1-2): 197–256. doi:10.1002/tal.542.
IBC-2000. 2000. International Building Code. Virginia: International Code Council, Falls Church.

65
Iyengar, R. N., and M. Shinozuka. 1972. "Effect of Self-Weight and Vertical Accelerations on the
Seismic Behaviour of Tall Structures During Earthquakes." Journal of Earthquake
Engineering and Structural Dynamics 1 (1): 69-78. doi:10.1002/eqe.4290010107.
Iyengar, R. N., and T. K. Sahia. 1977. "Effect of Vertical Ground Motion on the Response of Cantilever
Structures." Proc. Sixth World Conf. on Earthquake Engineering 1166-1177.
Mander, J. B., M. J. Priestley, and R. Park. 1988. "Theoretical Stress-Strain Model for Confined
Concrete." ASCE Journal of Structural Engineering 114 (8): 1804–1826.
doi:10.1061/(ASCE)0733-9445(1988)114:8(1804).
Moehle, J., Y. Bozorgnia, N. Jayaram, P. Jones, M. Rahnama, N. Shome, Z. Tuna, J. Wallace, T. Yang, and
F. Zareian. 2011. Case Studies of the Seismic Performance of Tall Buildings Designed by
Alternative Means. Report 2011/05, Pacific Earthquake Engineering: University of
California: Berkeley.
Mostaghei, N., and G. Ahmadi. 1978. "On the Stability of Columns Subjected to Non-Stationary
Random or Deterministic Support Motion." Journal of Earthquake Engineering and
Structural Dynamics 6 (3): 321-326. doi:10.1002/eqe.4290060307.
Mostaghel, N. 1974. "Stability of Columns Subjected to Earthquake Support Motion." Journal of
Earthquake Engineering and Structural Dynamics 3 (4): 347-353.
doi:10.1002/eqe.4290030405.
Munshi, J. A., and S. K. Ghosh. 1998. "Analyses of Seismic Performance of a Code-Designed
Reinforced Concrete Building." Journal of Engineering Structures 20 (7): 606-618.
doi:10.1016/S0141-0296(97)00055-2.

66
Mwafy, A. M., and A. S. Elnashai. 2006. "Vulnerability of Code-Compliant RC Buildings under Multi-
Axial Earthquake Loading." 4th International Conference on Earthquake Engineering,.
Taipei,Taiwan. Paper No. 115.
Naish, D. 2010. Testing and Modeling of Reinforced Concrete Coupling Beams. Ph.D. Dissertation.,
University of California, Los Angeles.
Pacific Earthquake Engineering Research Center. 2010. Guidelines for Performance-Based Seismic
Design of Tall Buildings. Report PEER-2010/05, Pacific Earthquake Engineering Research
Center: University of California: Berkeley, CA.
Papazoglou, A., and A. S. Elnashai. 1996. "Analytical and Field Evidence of The Damaging Effect of
Vertical Earthquake Ground Motion." Earthquake Engineering and Structural Dynamics 25
(10): 1109-1137. doi:10.1002/(SICI)1096-9845(199610)25:10<1109::AID-
EQE604>3.0.CO;2-0.
Paulay T and Priestley MJN. 1992. Seismic Design of Reinforced Concrete and Masonry Buildings,.
New York: John Wiley and Sons.
Scott, M. H,, and G. L. Fenves. 2006. "Plastic Hinge Integration Methods for Force-Based Beam-
Column Elements." Journal of Structural Engineering 132 (2): 244-252.
doi:10.1061/(ASCE)0733-9445(2006)132:2(244).
Shakib, H., and A. Fuladgar. 2003. "Effect of Vertical Component of Earthquake on the Response of
Pure-Friction Base-Isolated Asymmetric Buildings." Journal of Engineering Structures 25
(14): 1841-1850. doi:10.1016/j.engstruct.2003.08.008.
Tuna, Z. 2012. Seismic performance, modeling, and failure assessment of reinforced concrete shear
wall buildings. Ph.D. Dissertation, University of California,Los Angeles.

67
UBC-97. 1997. Uniform Building Code. Whittier, California: International Conference of Building
Offcials.


