Embed Size (px)
Citation preview

Nitrogen Management Training for Certified Crop Advisers
California’s Nutrient Management Regulations – Frequently Asked Questions
University of California
Jerome Pier, PhD Rob Mikkelsen, PhD
Gabriele Ludwig, PhD
MODULE 1

Introduction
• Certified Crop Advisers (CCAs) have been chosen, following training and certification, to sign off on nitrogen (N) management plans for California growers.
• This presentation addresses questions CCAs may have regarding their role in the future of N management plans.
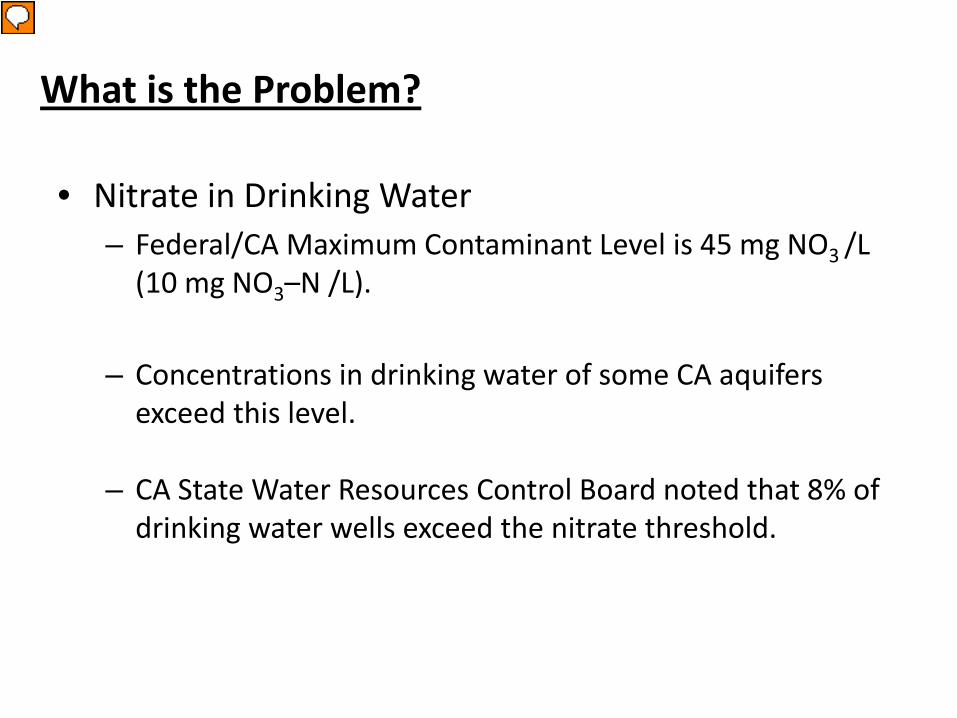
What is the Problem?
• Nitrate in Drinking Water – Federal/CA Maximum Contaminant Level is 45 mg NO3 /L
(10 mg NO3–N /L). – Concentrations in drinking water of some CA aquifers
exceed this level.
– CA State Water Resources Control Board noted that 8% of drinking water wells exceed the nitrate threshold.

Measuring Nitrate and Nitrate-N Concentrations
Measuring Nitrate: 45 mg NO3
-/L (measure N + O)
Measuring Nitrate-N: 10 mg NO3
--N/L (measure N only)

Nitrate (NO3-) and nitrite (NO2
-) effects are related: • Oral ingestion can lead to methemoglobinemia, “blue baby
syndrome” in infants. – First described in 1945 – Reference Dose established 1991 – Basis of nitrate and nitrite Maximum Concentration Levels
• Not a human carcinogen (2002)
(6/19/13 USEPA Region 9 Bruce Macler)
Impact of Nitrate Polluted Water on Health
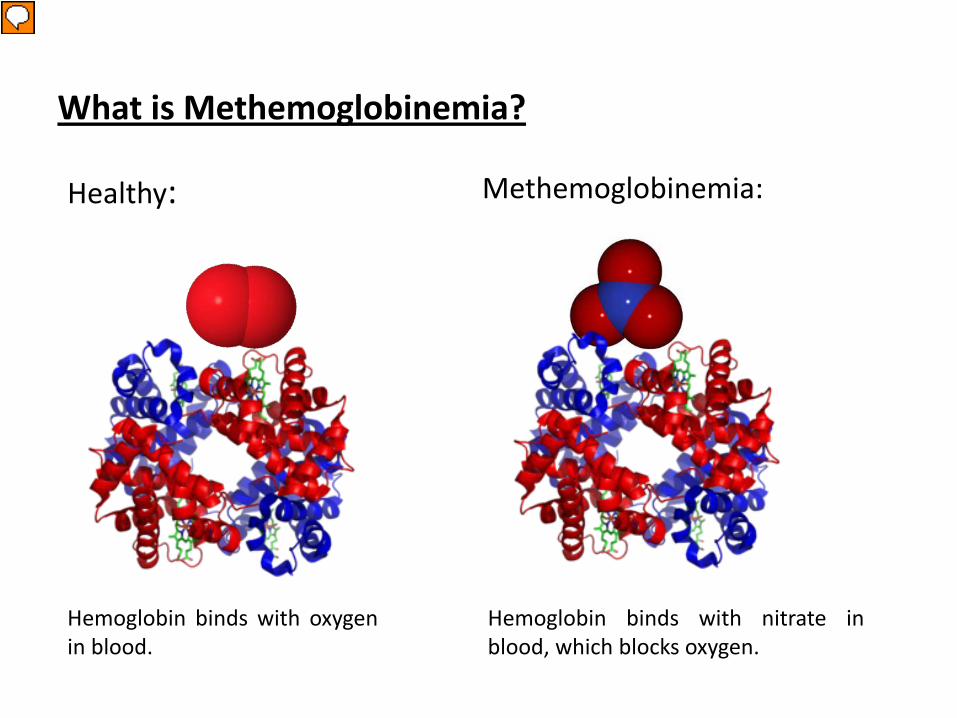
What is Methemoglobinemia?
Hemoglobin binds with oxygen in blood.
Healthy:
Hemoglobin binds with nitrate in blood, which blocks oxygen.
Methemoglobinemia:

• Known as Blue Baby Syndrome • Normal hemoglobin is converted to methemoglobin, which
cannot carry oxygen. – 0-20% methemoglobin yields bluish skin (cyanosis) – 25-40% yields hypotension, rapid pulse and breathing – > 50% can be fatal
• Can be caused by several agents including nitrate
What is Methemoglobinemia?
(6/19/13 USEPA Region 9 Bruce Macler)

Methemoglobinemia in California
• Agency for Toxic Substances and Disease Registry did an assessment at the request of CA DHS in 2000.
• 42 total methemoglobinemia cases over 13 years studied
– None specifically associated with nitrate – Four located in areas where wells are used
• National figures similar- rare to find a clear, unique association with drinking water nitrate
(6/19/13 USEPA Region 9 Bruce Macler)

Is Nitrate a Human Carcinogen?
• USEPA does not currently believe so, based on lack of supporting data and substantial negative data – Theory is that NO3
- --> NO2- --> Nitrosamines
• Animal toxicity studies show nitrosamines cause cancer, but
not nitrate or nitrite alone • Human epidemiology studies are not clear
6/19/13 USEPA Region 9 Bruce Macler

Where Does Nitrate Pollution Occur?
• Nitrate is the most common pollutant in drinking water worldwide.
• USEPA estimates 52% of US community water wells and 57%
of domestic wells have levels in excess of 2 mg NO3- /L
(considered background levels). • USGS estimates up to 15% of wells exceed MCL. • Problem Areas in California:
– San Joaquin Valley, Santa Ana Valley and Salinas – In CA, nitrate contamination results from intensive
agriculture combined with a shallow aquifer.

Where is Nitrate a Problem in California?
• Most nitrate contaminates groundwater, but the California coast has excess nitrate in surface water, causing hypoxia in Monterey Bay.
• Los Angeles, San Bernardino and Tulare counties have the
most drinking water violations. • Nitrate polluted wells occur mainly where there is shallow
groundwater. • Rivers have elevated nitrate concentrations, especially along
the coast.

Areas with shallow groundwater and intensive agriculture are vulnerable to nitrate contamination
Above MCL
Below MCL
Nitrate Problem Areas in California

Why is Shallow Groundwater Most Affected?
• Nitrate is an anion and is not retained by soil. It moves with the wetting front.
• Water moving below the root zone carries nitrate with it. • Nitrates from septic systems can be a local problem. • After years of downward flow with water, nitrate eventually
reaches the aquifer. • The farther from the source, the longer nitrate takes to reach
the groundwater.

Nitrate moves with water through the “Vadose Zone” until it reaches groundwater.
What Happens Once Nitrate Moves Below the Rootzone?
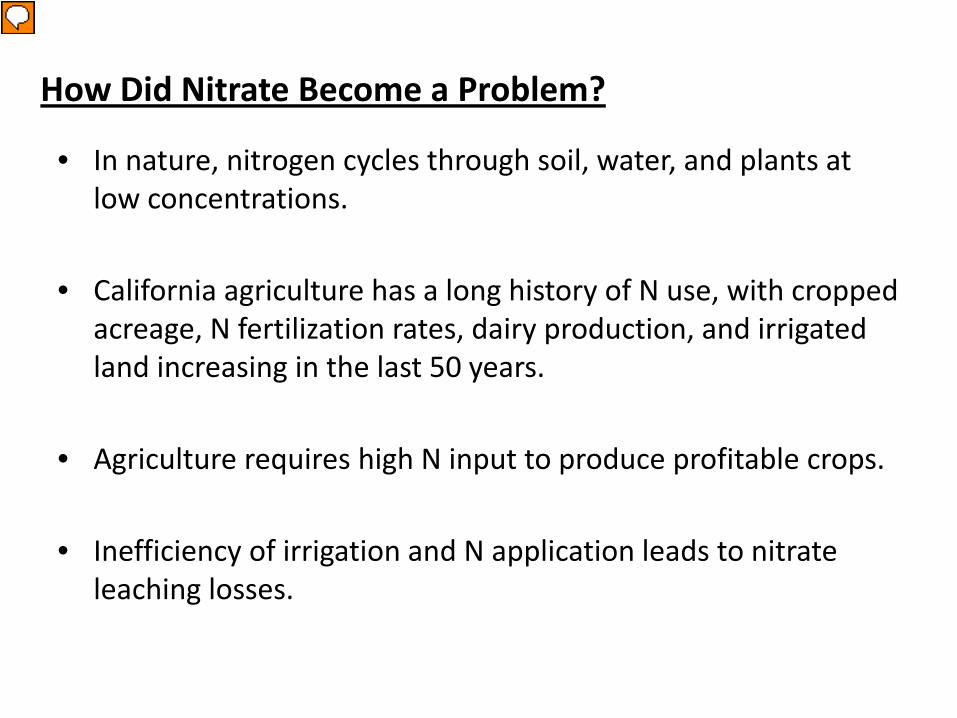
How Did Nitrate Become a Problem?
• In nature, nitrogen cycles through soil, water, and plants at low concentrations.
• California agriculture has a long history of N use, with cropped acreage, N fertilization rates, dairy production, and irrigated land increasing in the last 50 years.
• Agriculture requires high N input to produce profitable crops. • Inefficiency of irrigation and N application leads to nitrate
leaching losses.

Where is Nitrate Coming From in California?
The two major N inputs on cropland are: Synthetic fertilizer 53% Dairy Manure 33%
Data from Salinas Valley and Tulare Lake Basin
N Fertilizer
Dairy N

Where is Nitrate Going in California?
• 34% removed in harvest • 10% gaseous loss • 5% runoff • 51% available to leach to
groundwater
Data from Salinas Valley and Tulare Lake Basin
Harvested N
Leachable N

What are the Impacts of Nitrate Pollution?
• Nitrate in drinking water poses two problems: – Public health
• In Tulare Lake Basin and Salinas Valley, 254,000 people at risk for drinking nitrate-contaminated water.
• 220,000 people drink from public water systems • 34,000 drink from domestic wells.
– Financial • Expense of treating contaminated water or providing an
alternate source of clean water.

What are the Financial Consequences?
• Large municipalities can afford to find unpolluted water sources or treat drinking water.
• Small agricultural communities cannot afford to treat their contaminated water nor buy purified water.
• No inexpensive method exists to remove nitrate.
• Inefficient use of N fertilizer wastes grower resources.

What are the Regulatory Consequences?
• Irrigated Lands Regulatory Program (ILRP)
– Managed by Regional Water Quality Control Boards
– Applies to all growers who irrigate, except dairies
– Boards use Waste Discharge Requirements (WDR) to specify
what growers and coalitions must implement to protect groundwater and surface water.

Regulations: Waste Discharge Requirements
• Growers with irrigated lands must either join regional coalitions or meet WDR requirements individually.
• Coalition Tasks in the Central Valley:
– Groundwater quality assessments and plans – Monitoring long term groundwater quality trends – Assess which BMPs protect groundwater quality – Surface water quality monitoring – Compilation of data submitted by growers and reports to
Regional Water Board
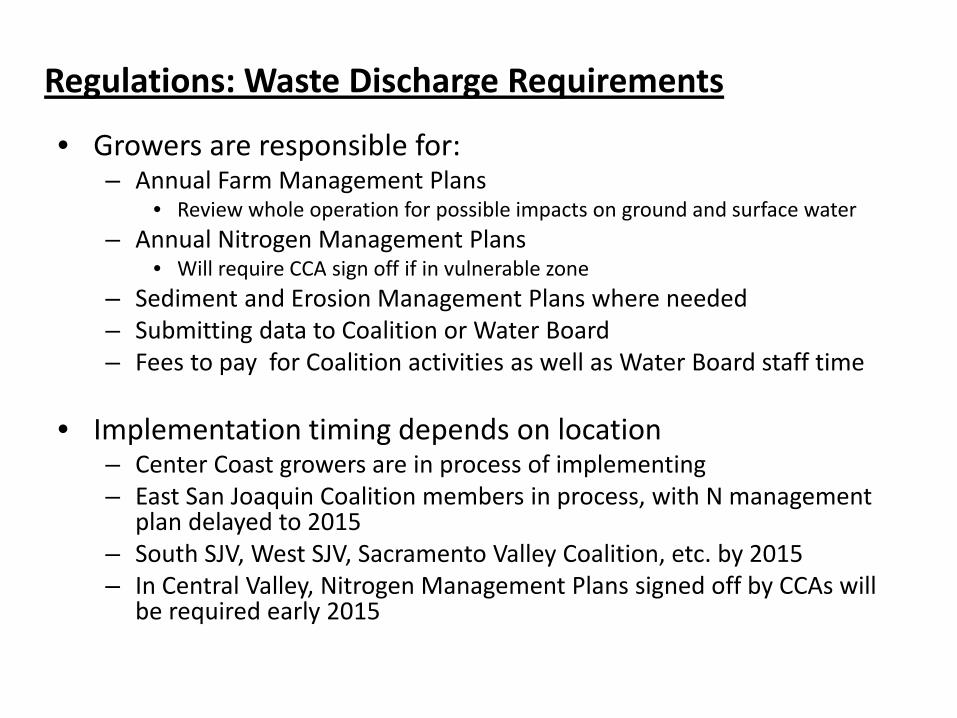
• Growers are responsible for: – Annual Farm Management Plans
• Review whole operation for possible impacts on ground and surface water – Annual Nitrogen Management Plans
• Will require CCA sign off if in vulnerable zone – Sediment and Erosion Management Plans where needed – Submitting data to Coalition or Water Board – Fees to pay for Coalition activities as well as Water Board staff time
• Implementation timing depends on location
– Center Coast growers are in process of implementing – East San Joaquin Coalition members in process, with N management
plan delayed to 2015 – South SJV, West SJV, Sacramento Valley Coalition, etc. by 2015 – In Central Valley, Nitrogen Management Plans signed off by CCAs will
be required early 2015
Regulations: Waste Discharge Requirements

What Do CCAs need to do?
• The rest of this program will give you the background necessary to understand nitrogen management plans (NMP) and how to complete them.
• Your signature on the NMP verifies the grower is
aware of the Management Practices to reduce the potential of nitrate loss.

The role of CCAs in these regulations is to deliver information to farmers. The following examples demonstrate how important CCAs are in getting
information to farmers.
The Power of CCAs

Linda Prokopy, Purdue
The Power of CCAs: Indiana Example

Survey asked farmers about the primary decision influencer for the decision maker. Overwhelmingly, this was the "fertilizer dealer” (Mike Schmitt, Univ Minn)
The Power of CCAs: Minnesota Example

(Encouraging California Specialty Crops Growers to Adopt Environmentally Beneficial Management Practices for Efficient Irrigation and Nutrient Management)
Crop Advisors are the most consulted source of technical assistance in helping farmers change management practices in California.
The Power of CCAs: California Example

Certified Crop Advisors Can Facilitate Change
CCAs have the relationship with farmers to help them improve their practices… everyone can improve! CCAs have been empowered by the Water Board to take the lead in changing nutrient management practices:
• Get Educated! • Get Busy!

Contributing partners:
University of California
University of California Agriculture and Natural Resources web: ucanr.edu Twitter: @ucanr
California Institute for Water Resources University of California Agriculture and Natural Resources web: ciwr.ucanr.edu Twitter: @ucanrwater
California Department of Food & Agriculture (CDFA) Fertilizer Research and Education Program web: www.cdfa.ca.gov Twitter: @CDFAnews
California Association of Pest Control Advisers (CAPCA) web: capca.com
Nitrogen Management Training for Certified Crop Advisers
Course materials available at: ciwr.ucanr.edu/NitrogenManagement