Embed Size (px)
Citation preview

University of Birmingham
The response of buried pipes to UK standard trafficloadingChapman, David; Alzabeebee, Saif; Jefferson, Ian; Faramarzi, Asaad
DOI:10.1680/jgeen.15.00190
License:None: All rights reserved
Document VersionPeer reviewed version
Citation for published version (Harvard):Chapman, D, Alzabeebee, S, Jefferson, I & Faramarzi, A 2017, 'The response of buried pipes to UK standardtraffic loading', Geotechnical Engineering, vol. 170, no. 1, pp. 38-50. https://doi.org/10.1680/jgeen.15.00190
Link to publication on Research at Birmingham portal
Publisher Rights Statement:Checked for eligibility: 12/08/2016. http://www.icevirtuallibrary.com/toc/jgeen/current
General rightsUnless a licence is specified above, all rights (including copyright and moral rights) in this document are retained by the authors and/or thecopyright holders. The express permission of the copyright holder must be obtained for any use of this material other than for purposespermitted by law.
•Users may freely distribute the URL that is used to identify this publication.•Users may download and/or print one copy of the publication from the University of Birmingham research portal for the purpose of privatestudy or non-commercial research.•User may use extracts from the document in line with the concept of ‘fair dealing’ under the Copyright, Designs and Patents Act 1988 (?)•Users may not further distribute the material nor use it for the purposes of commercial gain.
Where a licence is displayed above, please note the terms and conditions of the licence govern your use of this document.
When citing, please reference the published version.
Take down policyWhile the University of Birmingham exercises care and attention in making items available there are rare occasions when an item has beenuploaded in error or has been deemed to be commercially or otherwise sensitive.
If you believe that this is the case for this document, please contact [email protected] providing details and we will remove access tothe work immediately and investigate.
Download date: 02. Apr. 2022

● Article type: research article ● 1.5 illustrations per 500 words. ● 04/12/2015.
● 5000, 13.
-------------------------------------------------------------------------------------------------------------------------------
The response of buried pipes to UK Standard traffic loading
Author 1
● Saif Alzabeebee, BSc, MSc
● School of Engineering, University of Birmingham, Birmingham, UK
● College of Engineering, University of Al-Qadisiyah, Al-Diwaniyah, Iraq
Author 2
● David Chapman, BSc(Hons), DIS, PhD, CEng, MICE, FHEA
● School of Engineering, University of Birmingham, Birmingham, UK
Author 3
● Ian Jefferson, BEng(Hons), DIS, PhD, FGS
● School of Engineering, University of Birmingham, Birmingham, UK
Author 4
● Asaad Faramarzi, BSc, MSc, PhD, FHEA
● School of Engineering, University of Birmingham, Birmingham, UK
School of Engineering University of Birmingham Edgbaston Birmingham B15 2TT UK E-mail: [email protected] [email protected]
2
Abstract (200 words)
The current design practice in the UK for estimating the soil pressure on a buried pipe under
traffic loads is based on a simple equation derived using a Boussinesq solution. In order to test
and verify this equation, and study the effect of pipe diameter and backfill height for rigid
(concrete) and flexible (PVC) pipes, a study has been conducted using three-dimensional finite
element modelling. It was found that increasing the diameter of the concrete pipe nonlinearly
decreases the maximum vertical displacement, while the relationship between the concrete pipe
diameter and the maximum thrust force was found to be dependent on the backfill height.
Increasing the diameter of the PVC pipe linearly increases the displacement and the maximum
thrust force. The effect of traffic live load on the maximum thrust force becomes insignificant for
a cover depth larger than 2 m and 3 m for the concrete and PVC pipes, respectively. The results
indicate that there are significant issues with the maximum soil pressure equation used in the
British Standard. A new equation has been developed using numerical modelling results and
using a regression analysis to predict the maximum soil pressure on a buried pipe based on
backfill height.
Keywords: Pipes & pipelines; design methods & aids; research & development; codes of
practice and standards
List of notation F is the field test
3DFE is the three-dimensional finite element analysis
2DFE is the two-dimensional finite element analysis
L (1-g) is the laboratory test
L(C) is the length of the laboratory centrifuge test
PE is the polyethylene
PP is the polypropylene
UPVC is the unplasticized polyvinyl chloride
HDPE is the high density polyethylene
PVC is the polyvinyl chloride
AL is the aluminium
ST is the steel
CON is the concrete
RC is the reinforced concrete
C is the calculated maximum soil pressure under traffic live load
H is the backfill height
E is the modulus of elasticity
υ is the Poisson ratio

3
γ is the unit weight of the soil
c′ is the cohesion of the soil
φ′ is the angle of internal friction of the soil
K, n, and Rf is the hyperbolic soil model parameter
D is the diameter of the pipe
Wt is the trench width
USCS is the unified soil classification system
CR is the predicted maximum soil pressure due to the traffic live load using the regression equation
4
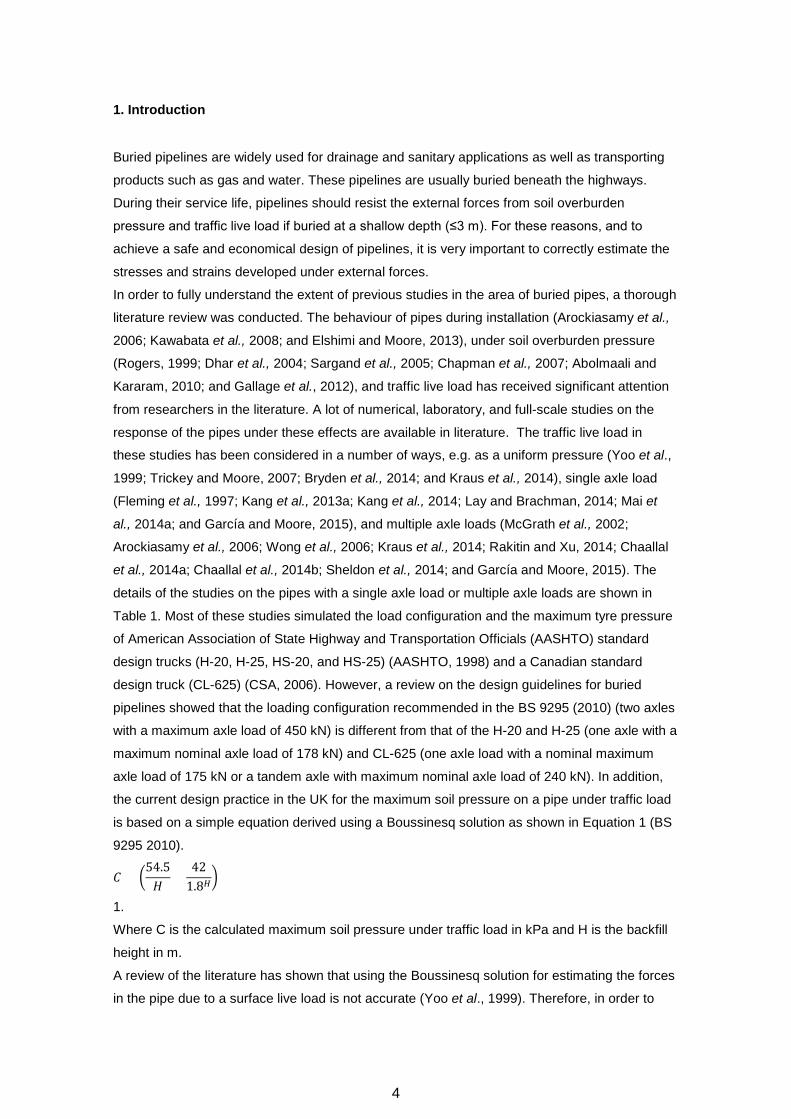
1. Introduction
Buried pipelines are widely used for drainage and sanitary applications as well as transporting
products such as gas and water. These pipelines are usually buried beneath the highways.
During their service life, pipelines should resist the external forces from soil overburden
pressure and traffic live load if buried at a shallow depth (≤3 m). For these reasons, and to
achieve a safe and economical design of pipelines, it is very important to correctly estimate the
stresses and strains developed under external forces.
In order to fully understand the extent of previous studies in the area of buried pipes, a thorough
literature review was conducted. The behaviour of pipes during installation (Arockiasamy et al.,
2006; Kawabata et al., 2008; and Elshimi and Moore, 2013), under soil overburden pressure
(Rogers, 1999; Dhar et al., 2004; Sargand et al., 2005; Chapman et al., 2007; Abolmaali and
Kararam, 2010; and Gallage et al., 2012), and traffic live load has received significant attention
from researchers in the literature. A lot of numerical, laboratory, and full-scale studies on the
response of the pipes under these effects are available in literature. The traffic live load in
these studies has been considered in a number of ways, e.g. as a uniform pressure (Yoo et al.,
1999; Trickey and Moore, 2007; Bryden et al., 2014; and Kraus et al., 2014), single axle load
(Fleming et al., 1997; Kang et al., 2013a; Kang et al., 2014; Lay and Brachman, 2014; Mai et
al., 2014a; and García and Moore, 2015), and multiple axle loads (McGrath et al., 2002;
Arockiasamy et al., 2006; Wong et al., 2006; Kraus et al., 2014; Rakitin and Xu, 2014; Chaallal
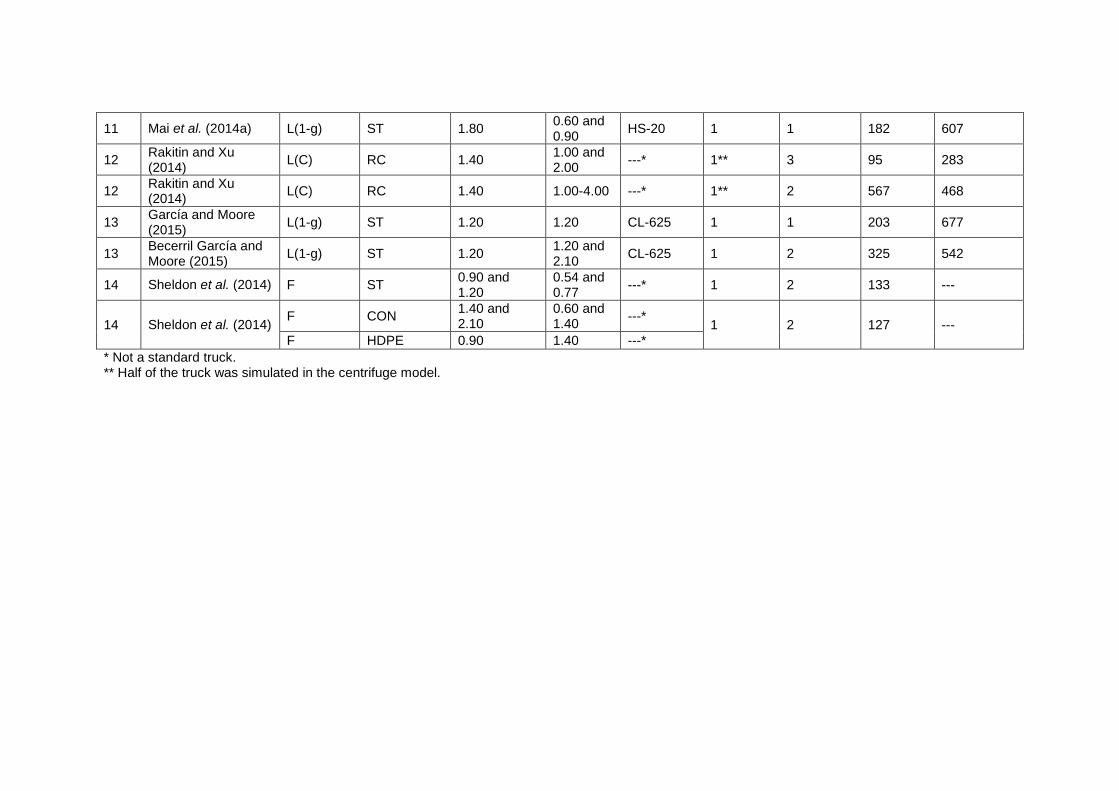
et al., 2014a; Chaallal et al., 2014b; Sheldon et al., 2014; and García and Moore, 2015). The
details of the studies on the pipes with a single axle load or multiple axle loads are shown in
Table 1. Most of these studies simulated the load configuration and the maximum tyre pressure
of American Association of State Highway and Transportation Officials (AASHTO) standard
design trucks (H-20, H-25, HS-20, and HS-25) (AASHTO, 1998) and a Canadian standard
design truck (CL-625) (CSA, 2006). However, a review on the design guidelines for buried
pipelines showed that the loading configuration recommended in the BS 9295 (2010) (two axles
with a maximum axle load of 450 kN) is different from that of the H-20 and H-25 (one axle with a
maximum nominal axle load of 178 kN) and CL-625 (one axle load with a nominal maximum
axle load of 175 kN or a tandem axle with maximum nominal axle load of 240 kN). In addition,
the current design practice in the UK for the maximum soil pressure on a pipe under traffic load
is based on a simple equation derived using a Boussinesq solution as shown in Equation 1 (BS
9295 2010).
𝐶𝐶 = �54.5𝐻𝐻
+42
1.8𝐻𝐻�
1.
Where C is the calculated maximum soil pressure under traffic load in kPa and H is the backfill
height in m.
A review of the literature has shown that using the Boussinesq solution for estimating the forces
in the pipe due to a surface live load is not accurate (Yoo et al., 1999). Therefore, in order to

5
test, and potentially improve, this equation, rigorous numerical analysis results and/or field test
results are required. However, due to the complex nature of the soil-pipe interaction under traffic
live load and the nonlinearity of the soil, it is not possible to use the results and the
recommendations from the previous studies to test and improve this equation. This is because
of the difference in the loading configuration and the maximum axle load used in these previous
studies. Furthermore, the literature lacks clear conclusions for the effect of pipe diameter and
backfill height on the behaviour of the pipe, where most of the studies have focused on certain
pipe types, certain pipe diameters, and certain backfill heights (refer to Table 1). Therefore, the
present study aims to assess the effect of pipe diameter and backfill height on rigid (concrete)
and flexible (PVC) pipes under the live loading configuration specified in BS 9295 (2010) using
a validated nonlinear three-dimensional finite element model. In addition, the results of the
maximum soil pressure on the pipe obtained from these analyses have been compared with the
current design equation (Equation 1) recommended by BS 9295 (2010).
2. Model validation
Model validation in numerical analyses is very important to gain confidence in the approaches
and models used. Therefore, two pipe related tests that are available in the literature have been
considered for validating the finite element modelling techniques used in the present study (one
field and one laboratory based). MIDAS GTS NX 2015 (v1.1), a commercial three-dimensional
finite element package, has been used to create the numerical models. The field test was
chosen to validate the numerical modelling because it is comparable in terms of scale to the
present study, while the laboratory test has been considered to test the validity of the modelling
to predict the response of pipes in more controlled laboratory conditions.
2.1 Validation Problem 1
A field test involving a corrugated HDPE pipe with a nominal diameter of 0.90 m has been
modelled to validate and evaluate the predictions of the proposed numerical model
(Arockiasamy et al., 2006). The pipe was buried in a trench with a minimum width of 1.655 m.
The backfill height was 0.45 m. Crushed limestone was used for the 0.152 m bedding layer and
poorly graded sand with silt with a degree of compaction of 95 % of the Standard Proctor
maximum dry density was used as the backfill material. The pipe was subjected to surface live
loads from two axles of two trucks with a maximum axle load of 181 kN. The axle load value
simulated an AASHTO HS-20 truck with an impact factor calculated using the equation from
AASHTO (1998). The space between the two trucks was 0.91 m.
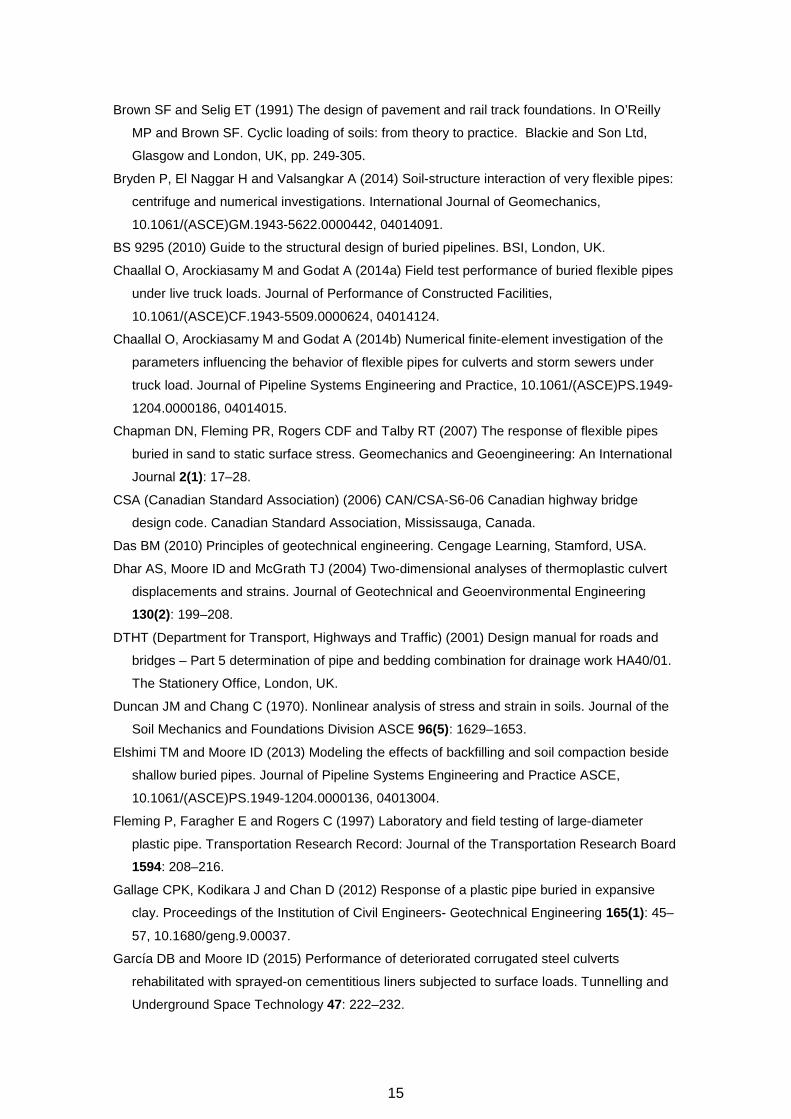
A numerical model was developed for this problem, with a length, width, and height of 15 m, 12
m, and 10 m, respectively. Four noded tetrahedron solid elements were used to model the
surrounding soil and the trench, while three noded triangular shell elements were used to model
the pipe. Sensitivity analyses were undertaken to evaluate the impact of the mesh size on the

6
results and the best agreement was achieved when the average element size was 0.15 m for
the pipe, 0.15 m for the trench, 0.25 m for the bedding layer, and 0.5 m for the surrounding soil.
The finite element mesh is shown in Figure 1. The truck live load for each tyre was modelled as
a surface pressure over a tyre foot print area of approximately 0.23 x 0.31 m (Arockiasamy et
al., 2006). A linear elastic model was used to model the pipe. The Duncan-Chang hyperbolic
soil model (Duncan and Chang, 1970) was used to represent the behaviour of the soil. The
Duncan-Chang hyperbolic soil model was chosen because it has the ability to model the effect
of the stress level on the soil stiffness, which gives a better prediction for the behaviour of the
pipe (Dhar et al., 2004; Kim and Yoo, 2005; Kang et al., 2007; Kang et al., 2013a; Kang et al.,
2013b; and Kang et al., 2014). The mechanical properties of the bedding soil, backfill soil, and
natural soil were adopted from the literature (Boscardin et al., 1990) and are shown in Table 2.
The modulus of elasticity (E) and the Poisson ratio (υ) of the pipe were taken equal to be
760000 kPa and 0.4, respectively (Arockiasamy et al., 2006).
As part of the modelling process, a full interface bond between the pipe and the soil has been
assumed in the analysis as previous studies have shown that using a full bond gives a good
prediction for the behaviour of the pipe (Taleb and Moore, 1999; Kim and Yoo, 2005; Kang et al.
2007; Meguid and Kamel, 2014; and Mai et al., 2014b). The base of the model was restrained
against movement in all directions, while the sides of the model were restrained against
movement in the horizontal direction. Four steps were performed in the finite element analyses:
Step 1: The initial earth pressures for the in situ soil were calculated. The coefficient of the
lateral earth pressure of the natural soil was taken equal to 1.
Step 2: The trench was excavated.
Step 3: The bedding soil, pipe and backfill soil were added to the model. The coefficient of the
lateral earth pressure of the compacted backfill was taken as equal to 1 (Brown and Selig,
1991)
Step 4: The traffic live load was applied using 25 equal loading increments.
This field test has also been modelled in the literature using 2D and 3D elastic finite element
(Arockiasamy et al., 2006) and 2D nonlinear finite element model (Kang et al., 2014).
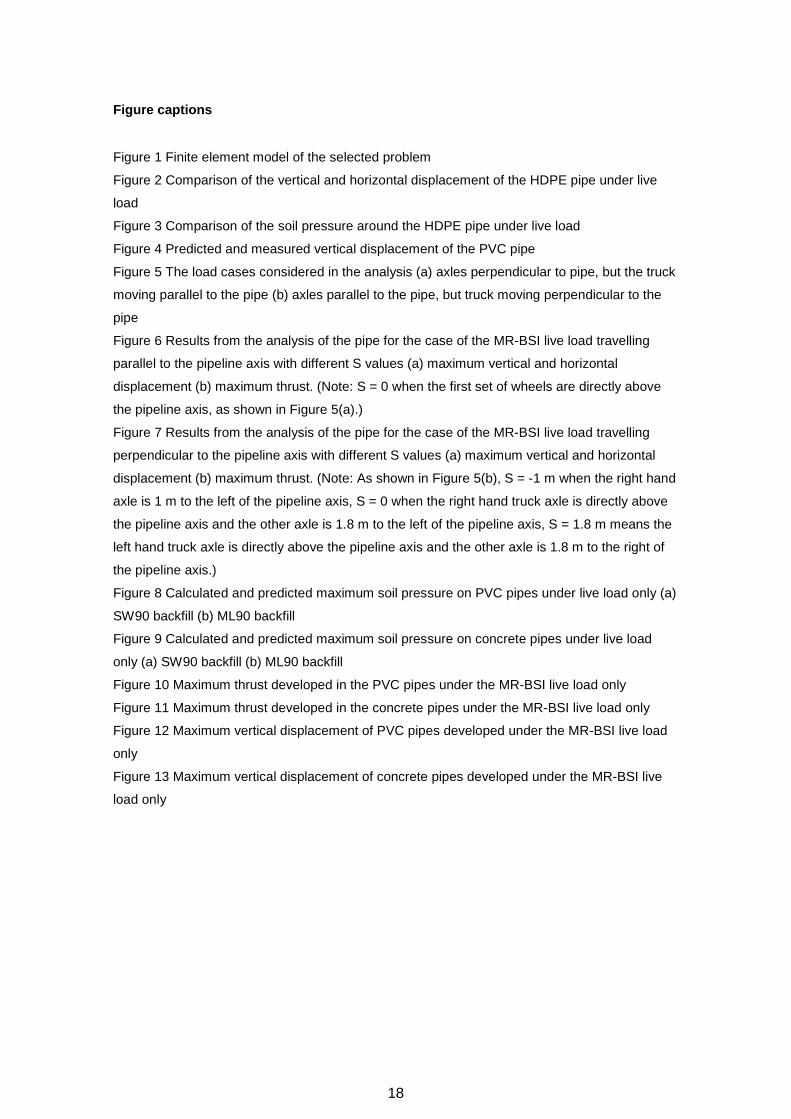
Figure 2 compares the maximum vertical and horizontal displacement of the pipe obtained from
the field results (Arockiasamy et al., 2006), the present model, two- and three-dimensional finite
element elastic models (Arockiasamy et al., 2006), and a two-dimensional analysis using the
Duncan-Selig hyperbolic soil model (Kang et al., 2014). Figure 3 compares the results of the soil
pressure around the pipe obtained from the field test and the same numerical studies. From
Figure 2, it can be seen that the present model predicted the displacement of the pipe better
than the previous models with a difference of 14.3 % for the vertical displacement (3.5 mm from
the field test and 4 mm from the developed model) and 12 % for the horizontal displacement
(1.5 mm from the field test and 1.32 mm from the developed model). Figure 3 shows that the
present model predicted the soil pressure around the pipe reasonably well. It can be seen also
that the two-dimensional model also predicted the soil pressure reasonably well. However, the
7
decision to use a nonlinear three-dimensional model in this study was made to avoid using the
spreading factor, which is an empirical factor used in the two-dimensional modelling to take into
account the three-dimensional effect of traffic loads on pipes. It is worth noting that Kang et al.
(2014) did not report the value of the spread factor which has been used in their analysis. The
difference between the actual and predicted results can be justified by the complexity and
variability of soil density pattern around the pipe and the difference between the real and the
assumed soils properties. However, it can be concluded that the model is able to represent the
soil-pipe interaction with an acceptable accuracy when compared with field results and previous
numerical studies.
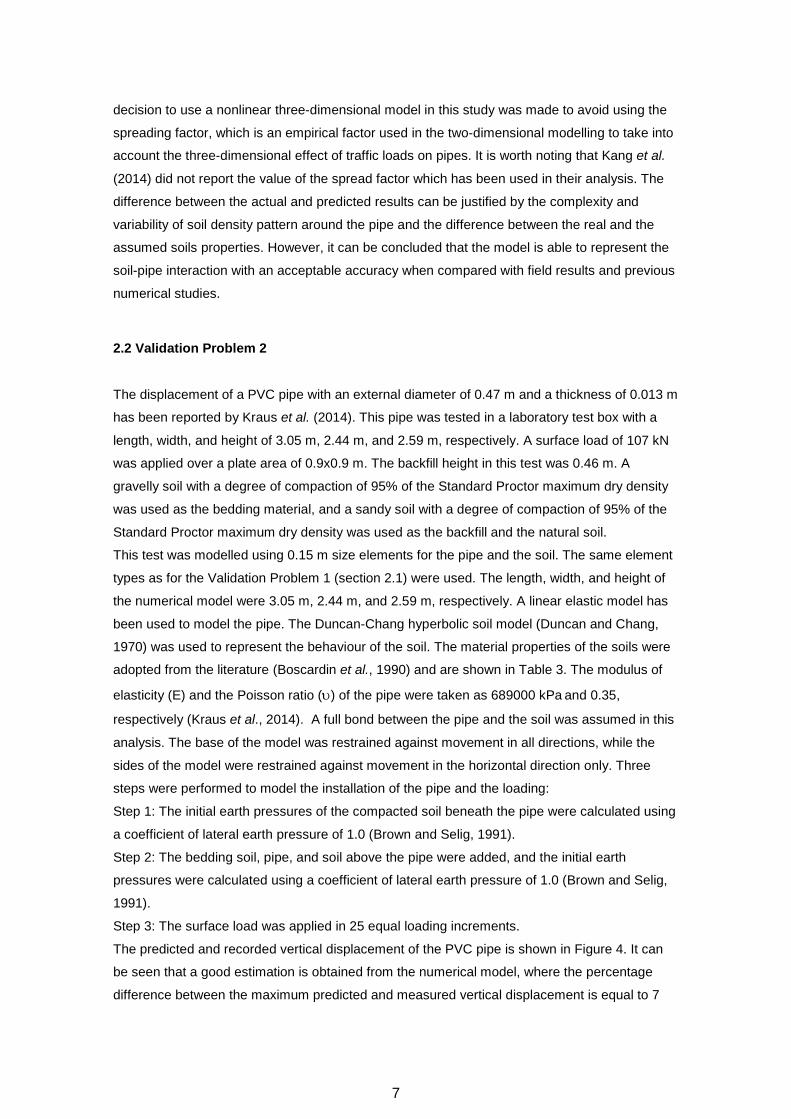
2.2 Validation Problem 2
The displacement of a PVC pipe with an external diameter of 0.47 m and a thickness of 0.013 m
has been reported by Kraus et al. (2014). This pipe was tested in a laboratory test box with a
length, width, and height of 3.05 m, 2.44 m, and 2.59 m, respectively. A surface load of 107 kN
was applied over a plate area of 0.9x0.9 m. The backfill height in this test was 0.46 m. A
gravelly soil with a degree of compaction of 95% of the Standard Proctor maximum dry density
was used as the bedding material, and a sandy soil with a degree of compaction of 95% of the
Standard Proctor maximum dry density was used as the backfill and the natural soil.
This test was modelled using 0.15 m size elements for the pipe and the soil. The same element
types as for the Validation Problem 1 (section 2.1) were used. The length, width, and height of
the numerical model were 3.05 m, 2.44 m, and 2.59 m, respectively. A linear elastic model has
been used to model the pipe. The Duncan-Chang hyperbolic soil model (Duncan and Chang,
1970) was used to represent the behaviour of the soil. The material properties of the soils were
adopted from the literature (Boscardin et al., 1990) and are shown in Table 3. The modulus of
elasticity (E) and the Poisson ratio (υ) of the pipe were taken as 689000 kPa and 0.35,
respectively (Kraus et al., 2014). A full bond between the pipe and the soil was assumed in this
analysis. The base of the model was restrained against movement in all directions, while the
sides of the model were restrained against movement in the horizontal direction only. Three
steps were performed to model the installation of the pipe and the loading:
Step 1: The initial earth pressures of the compacted soil beneath the pipe were calculated using
a coefficient of lateral earth pressure of 1.0 (Brown and Selig, 1991).
Step 2: The bedding soil, pipe, and soil above the pipe were added, and the initial earth
pressures were calculated using a coefficient of lateral earth pressure of 1.0 (Brown and Selig,
1991).
Step 3: The surface load was applied in 25 equal loading increments.
The predicted and recorded vertical displacement of the PVC pipe is shown in Figure 4. It can
be seen that a good estimation is obtained from the numerical model, where the percentage
difference between the maximum predicted and measured vertical displacement is equal to 7
8
%. It can be also be seen that the difference between the results is less than that for the field
problem (Validation Problem 1), which is expected as the laboratory tests for small pipe
diameters are usually more controlled, with less uncertainties regarding the compaction of the
soil, the recorded results, and the uniformity of the support around the pipe. This validation
problem, together with Validation Problem 1, gives confidence in the modelling technique being
used.
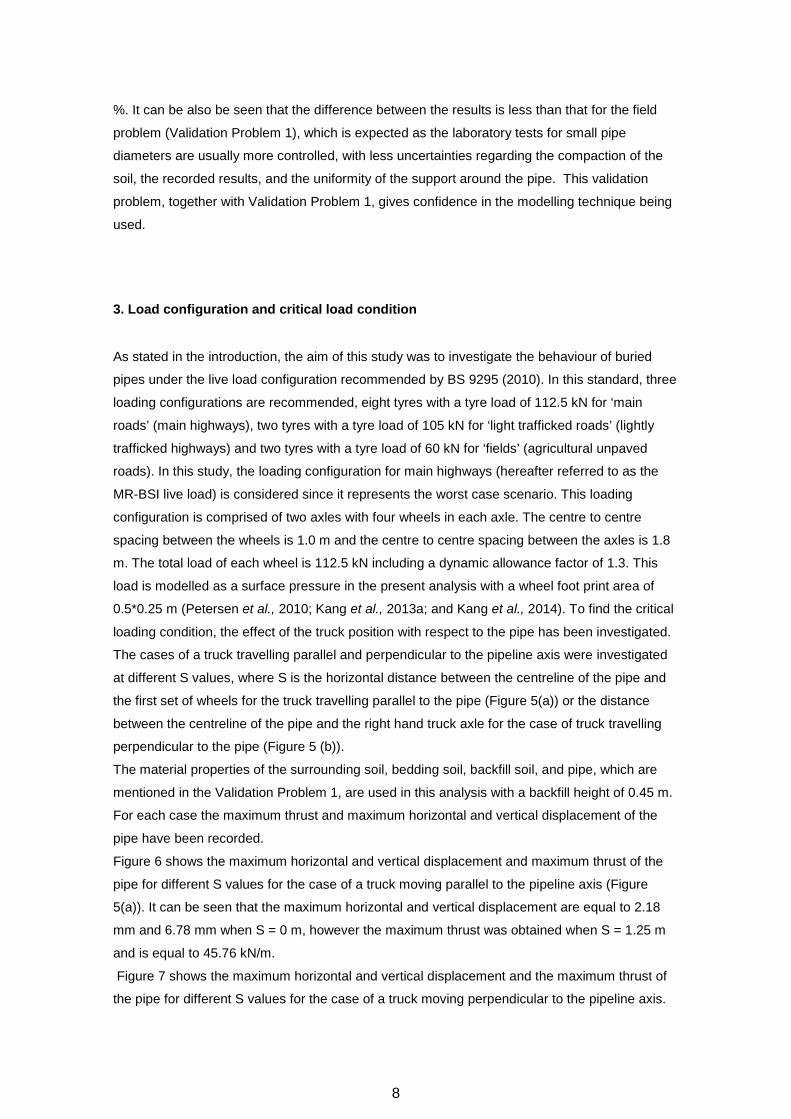
3. Load configuration and critical load condition
As stated in the introduction, the aim of this study was to investigate the behaviour of buried
pipes under the live load configuration recommended by BS 9295 (2010). In this standard, three
loading configurations are recommended, eight tyres with a tyre load of 112.5 kN for ‘main
roads’ (main highways), two tyres with a tyre load of 105 kN for ‘light trafficked roads’ (lightly
trafficked highways) and two tyres with a tyre load of 60 kN for ‘fields’ (agricultural unpaved
roads). In this study, the loading configuration for main highways (hereafter referred to as the
MR-BSI live load) is considered since it represents the worst case scenario. This loading
configuration is comprised of two axles with four wheels in each axle. The centre to centre
spacing between the wheels is 1.0 m and the centre to centre spacing between the axles is 1.8
m. The total load of each wheel is 112.5 kN including a dynamic allowance factor of 1.3. This
load is modelled as a surface pressure in the present analysis with a wheel foot print area of
0.5*0.25 m (Petersen et al., 2010; Kang et al., 2013a; and Kang et al., 2014). To find the critical
loading condition, the effect of the truck position with respect to the pipe has been investigated.
The cases of a truck travelling parallel and perpendicular to the pipeline axis were investigated
at different S values, where S is the horizontal distance between the centreline of the pipe and
the first set of wheels for the truck travelling parallel to the pipe (Figure 5(a)) or the distance
between the centreline of the pipe and the right hand truck axle for the case of truck travelling
perpendicular to the pipe (Figure 5 (b)).
The material properties of the surrounding soil, bedding soil, backfill soil, and pipe, which are
mentioned in the Validation Problem 1, are used in this analysis with a backfill height of 0.45 m.
For each case the maximum thrust and maximum horizontal and vertical displacement of the
pipe have been recorded.
Figure 6 shows the maximum horizontal and vertical displacement and maximum thrust of the
pipe for different S values for the case of a truck moving parallel to the pipeline axis (Figure
5(a)). It can be seen that the maximum horizontal and vertical displacement are equal to 2.18
mm and 6.78 mm when S = 0 m, however the maximum thrust was obtained when S = 1.25 m
and is equal to 45.76 kN/m.
Figure 7 shows the maximum horizontal and vertical displacement and the maximum thrust of
the pipe for different S values for the case of a truck moving perpendicular to the pipeline axis.
9
From these Figures it can be seen that the maximum vertical displacement and thrust in the
pipe were obtained when the centre of the right hand axle was above the crown (S = 0 m) and
are equal to 10.1 mm and 47.5 kN/m respectively. However, the maximum horizontal
displacement of 3.9 mm was recorded when the centre of the right hand axle was 0.25 m away
from the crown of the pipe (S = 0.25 m).
It can be concluded from these Figures that the highest vertical and horizontal displacements in
the pipe are obtained when the truck is moving perpendicular to the pipeline axis and the critical
case is obtained when the centre of the right hand axle is above the crown of the pipe. This is
because of the dependency of the pipe behaviour on the surrounding soil stiffness (Fleming et
al., 1997; Brachman and Krushelnitzky 2005; and Saadeldin et al., 2015) and the dependency
of the soil stiffness on the stress level. The confining pressure in the soil adjacent to the sides of
the pipe is larger for the cases where the pipe is between the two axle loads because of an
increase in the stress level, which increases the stiffness of the soil adjacent to the sides of the
pipe. Increasing the soil stiffness increases the side support on the pipe, and hence the
settlement and the thrust forces will be smaller. However, for the case where one axle is directly
above the pipe, the stress level will not distribute equally around the pipe and the soil stiffness
will be smaller. Furthermore, the stress level on the crown of the pipe will be larger when the
axle load is directly above the pipe.
These results are in agreement with the findings from Chaallal et al. (2014a), who observed
from a field test involving a flexible pipe under two axle loads that the worst case for the pipe
was when one of the axles was directly above the pipe.
Comparing the results of the critical case of the MR-BSI live load and the case of the two axles
of the two HS-20 design trucks (from the validation section) shows that the MR-BSI live load is
much more stringent with the calculated horizontal and vertical displacements under the MR-
BSI live load being 195% and 153% higher respectively.
4. Parametric study
A parametric study has been carried out to examine the performance of concrete and PVC
pipes under the critical condition of the MR-BSI live load. The diameters and thicknesses of
these pipes are adopted from the literature (Petersen et al., 2010) and are shown in Table 4.
The study investigated the effect of the pipe diameter and backfill height (0.5 m to 4.5 m) on the
maximum soil pressure, the maximum vertical displacement of the pipe, and the maximum
thrust force in the pipe. The boundary conditions, the elements types, the constitutive models
for the soil and the pipe, and the elements sizes were the same as for the validation problems.
A gravelly sand with a degree of compaction of 90% measured according to the maximum
Standard Proctor dry density (SW in the unified soil classification system (USCS) (Das, 2010)
(hereafter referred to as SW90)), and a sandy silt with a degree of compaction of 90% (ML in
the USCS (hereafter referred to as ML90)) have been used in the analyses. The study focused
on these soils because they are the most common soils to be used as a backfill material in
10
practice (Chaallal et al., 2014b). The thickness of the bedding layer is taken as equal to 0.10 m
and modelled using a SW90 soil. The natural surrounding soil is assumed to be stiffer than the
trench soil. The material properties of the soils used are shown in Table 5, and the material
properties of the pipes are shown in Table 6. The trench width (Wt) has been calculated using
Equation 2 (Arockiasamy et al., 2006). The results of the parametric study are discussed in the
next subsections.
𝑊𝑊𝑡𝑡 = 1.5 𝐷𝐷 + 0.3
2.
4.1 Maximum soil pressure on pipes
In this section, the effect of backfill height on the maximum soil pressure acting on the pipes is
discussed for concrete and PVC pipes. Figure 8 (a) and (b) shows the maximum soil pressure
at the crown of the pipe due to the MR-BSI live load only for the case of the PVC pipes
embedded in SW90 and ML90 soils, respectively. The predicted maximum soil pressure from
the BS equation (Equation 1) is also shown in this figure. It can be seen that the maximum soil
pressure due to the effect of traffic live load decreases nonlinearly as the backfill height
increases for both soils. For the SW90 soil, the percentage decrease in the tyre stress (i.e. 900
kPa) for a backfill height of 1m is equal to 91%, 89%, and 88% for pipe diameters of 0.37 m,
0.76 m, and 1.47 m, respectively. This reveals that approximately 90% of the tyre stress is
reduced at a backfill height of 1.0 m. For a backfill height of 3 m, the percentage decrease is
equal to 99%, 98%, and 97% for pipe diameters of 0.37 m, 0.76 m, and 1.47 m, respectively. It
can also be seen that increasing the diameter of the pipe increases the maximum soil pressure,
which indicates that negative arching increases as the diameter of the pipe increases. The
same trend in behaviour is also noticed for the ML soil.
Comparing the results of the SW and the ML soils shows that the maximum soil pressure for the
models with the SW backfill is larger than that with the ML backfill for all of the considered
diameters. This indicates that positive arching increases as the type of the backfill soil changes
from SW90 to ML90. This is probably due to the fact that the SW soil is stiffer than the ML soil,
which makes the ML backfill soil experience larger settlement under the same loading condition.
This increases the positive arching effect as larger shearing forces are develop on the sides of
the trench (Kang et al., 2007, Kang et al., 2013b).
Comparing the results of the SW90 and ML90 soils with Equation 1 shows, in general, that the
equation underestimates the soil pressure at backfill heights of 0.5 m and 1.0 m, and
overestimates the soil pressure at a backfill height equal to or greater than 2.0 m. The ratio
between the soil pressure predicted from the numerical modelling (P) and the soil pressure
calculated from Equation 1 (C) varies between 1.82 and 0.039 for the 0.37 m diameter pipe,
2.85 and 0.096 for the 0.76 m diameter pipe, and 2.9 and 0.19 for the 1.47 m diameter pipe.

11
Figure 9 (a) and (b) shows the predicted and calculated maximum soil pressure for the concrete
pipes. It can be seen that the same behaviour as for the PVC pipes is recorded, where
approximately 88% and 98% of the tyre stress is reduced at backfill heights of 1.0 m and 3.0 m,
respectively. Similar observations were also found by Bian et al. (2012) from a full scale study
on the effect of truck loads on an arch concrete culvert (width of 3.5 m and height of 2.5 m)
buried in a poorly graded gravel with a backfill height ranging from 0.5 m to 3.5 m. Bian et al.
(2012) noticed that the tyre stress decreased by 91 % at a depth of 1.0 m below the ground
surface.
Comparing the results of the SW90 and ML90 soils with Equation 1 shows that in general the
equation underestimates the maximum soil pressure at backfill heights ranging from 0.5 m to
2.5 m for the SW90 soil and from 0.5 m to 2.0 m for the ML90 soil. However, Equation 1
overestimates the soil pressure at a backfill height equal to or greater than 3.0 m for the SW90
soil and 2.5 m for the ML90 soil. The ratio between the predicted and calculated maximum soil
pressure (P/C) varies between 2.29 and 0.05 for the 0.41 m diameter pipe, 2.84 and 0.08 for the
0.76 m diameter pipe, 2.91 and 0.33 for the 1.47 m diameter pipe, and 3.64 and 0.47 for the
2.89 m diameter pipe.
4.2 Pipe thrust
Figures 10 and 11 present the effect of PVC and concrete pipe diameter and backfill height on
the maximum thrust force developed in the pipe under the MR-BSI live load only and buried in a
SW90 soil. In Figure 10, it can be seen that increasing the diameter of the PVC pipe from 0.37
m to 1.47 m increases the maximum thrust force. As expected, increasing the backfill height
decreases the maximum thrust force developed in the pipe under the live load effect.
Figure 11 shows that for backfill heights of 0.5 m and 1 m, there is a sharp increase in the thrust
force when the diameter of the pipe changed from 0.41 m to 0.76 m. However, beyond 0.76 m
diameter the thrust developed decreases as the diameter increases. For a backfill height of 1.5
m and 2 m, the thrust force continues to increase after the 0.76 m diameter, however the
increase is small. This behaviour was due to the dependency of the developed thrust on
the surrounding soil stiffness (which depends on the backfill height) and also on the
change in the zone of maximum thrust from the invert to a region bounded by the
crown and shoulder of the pipe as the diameter and the backfill height changes. It should be noted here that the effect of the traffic live load did not produce an increase in the
maximum thrust forces in the PVC pipes after a backfill height of 3 m, and for the concrete pipes
after a backfill height equal to or greater than 2.5 m. This is due to the significant reduction of
the soil pressure due the effect of the backfill height as discussed in section 4.1. In addition, the
small amount of stress which did reach the pipes after these backfill heights added additional
support to the sides of the pipe, which in turn reduced the maximum thrust in the springline
instead of increasing it. This happened in the concrete pipes at a depth smaller than for the

12
PVC pipes because of the tendency of the concrete pipes to attract more load than the PVC
pipes due to their higher stiffness.
The trend in the behaviour of the PVC and concrete pipes is noticeably different. This is
because of the changing maximum thrust zone for the concrete pipes, which depends on the
pipe diameter and the backfill height. The maximum thrust zone changed from the invert to a
region bounded by the crown and shoulder of the pipe. This is because of the stiffness of the
pipe, which changed for each case due to the difference in the wall thickness and the diameter
of the pipe, and the effect of the arching as the stiffness, diameter, and the backfill height
changed. Peterson et al. (2010) also noticed that the maximum thrust changes as the backfill
height and the diameter changes. However, for the PVC pipes, the maximum thrust force
occurred in the shoulder zone for all of the cases, giving the trend in the results shown in Figure
10.
4.3 Pipe displacement
Figure 12 presents the effect of varying diameter and backfill height on the maximum vertical
displacements of PVC pipes under the MR-BSI live load and buried in a SW90 soil. It can be
seen that the maximum vertical displacement of the PVC pipe increases approximately linearly
as the diameter of the pipe increases for all of the backfill heights. Furthermore, the
displacement significantly decreases as the backfill height increases. This finding is consistent
with the findings of past studies by Tricky and Moore (2007), Chaallal et al. (2014a), and
Chaallal et al. (2014b), which also concluded that increasing backfill height significantly
decreases the vertical displacement of pipes.
Figure 13 presents the effect of diameter and backfill height on the maximum vertical
displacement of concrete pipes under the MR-BSI live load with a SW90 backfill. It can be seen
that increasing the diameter of the concrete pipe causes the maximum vertical displacement to
decrease nonlinearly for all of the backfill heights.
It should be noted that a direct comparison between the PVC and concrete pipe response
cannot be made because of the differences in the modulus of elasticity and the wall thicknesses
of the pipes being modelled.
Additional controlled experimental studies are required to support the findings from the present
study as very limited field studies were found in the literature on the effect of pipe diameter on
the soil pressure, thrust, and displacement developed in the pipe under live load. Wong et al.
(2006) investigated the short and long term behaviour of concrete pipes under the effect of soil
weight and traffic loads with a diameter range of 0.60-0.90 m. However, the burial depth, the
trench geometry, the surrounding soil and the backfill soil were different for each pipe, which
does not help in drawing a direct conclusion to support the findings from the current study.
Sheldon et al. (2014) reported the vertical and horizontal displacement of corrugated metal and
concrete pipes with two different diameters, however the backfill height was different for each
13
diameter and hence no direct conclusion can be drawn to support the findings from the present
study.
5. Practical implication
As shown in section 4.1, there are significant issues with Equation 1 as adopted in the British
Standard for estimating the maximum soil pressure on the pipe under traffic live load. Therefore
in this section, a new equation has been developed using regression analysis. Several trials
have been made to find the best fit equation using linear and non-linear regression analyses.
The best equation was chosen based on the maximum coefficient of determination. The
maximum soil pressure from 112 data points obtained from the numerical modelling for the PVC
and concrete pipes with backfill heights ranging from 1 m to 4.5 m were used in the derivation of
the regression equation. The backfill height of 0.5 m was excluded from the regression analysis
as from a practical point of view, the minimum allowed cover in the United Kingdom for the
pipes under the main road loading requirement is approximately 1m (DTHT, 2001). The
equation obtained from the regression analysis has a coefficient of correlation of 0.93 and is
given by Equation 3. It should be noted here that this equation is valid for a backfill height of 1.0
m or higher.
CR = 900(1 − (−0.01 H2 + 0.0833 H + 0.8243))
3.
Where, CR is the predicted maximum soil pressure from the regression equation in kPa. H is
the backfill height in m.
6. Conclusions
A validated three-dimensional finite element model has been developed and used to find the
critical loading conditions for the British Standard traffic live load configuration for a buried pipe
and a study of the behaviour of PVC (0.37-1.47 m) and concrete pipes (0.41 -2.89 m) under this
critical loading condition has been conducted. A cover depth range of 0.5-4.5 m has been
modelled in this study for both the PVC and concrete pipes. The following conclusions can be
drawn from the present study:
1- The MR-BSI loading configuration imposes a higher stress and displacement on the
pipe compared with two AASHTO HS-20 trucks, where the predicted horizontal and
vertical displacements under the critical MR-BSI live load configuration are 195% and
153% higher than that predicted under two HS-20 design trucks with two axles.
2- The equation recommended by the British Standard (BS 9295, 2010) for estimating the
maximum soil pressure on a buried pipe has been shown not to be accurate. A new
regression equation has been proposed based on the results of an extensive numerical
study. The proposed equation has a coefficient of determination of 0.93. This new
14
equation can be used to predict the maximum soil pressure under traffic live loads for a
backfill height equal to or greater than 1.0 m. 3- The effect of traffic load on the maximum thrust force is negligible for a backfill height
greater than 3 m for the PVC pipes and a backfill height of 2.5 m or higher for the
concrete pipes analysed in this study. Greater backfill heights only cause redistribution
of the thrust forces around the pipe without increasing the maximum thrust developed.
4- Increasing the diameter of the PVC pipe approximately linearly increases the maximum
thrust forces in the pipe for all of the backfill heights considered. However, for the
concrete pipes with backfill heights of 0.5 m and 1 m, the maximum thrust force
increases when the diameter changes from 0.41 m to 0.76 m, following by a small
decrease as the diameter increases from 0.76 m to 2.89 m. However, for a backfill
height of 1.5 m and 2 m, increasing the diameter of the pipe continuously increases the
maximum thrust force, but the increase is small.
5- Increasing the diameter of the pipe approximately linearly increases the vertical
displacement in the PVC pipes and nonlinearly decreases the vertical displacement for
the concrete pipe type.
Acknowledgements
The first author would like to acknowledge the financial support for financial support for this
research provided by the Higher Committee for Education Development in Iraq (HCED).
References
AASHTO (American Association of State Highway and Transportation Officials) (1998)
AASHTO LRFD bridge design specifications. American Association of State Highway and
Transportation Office, Washington, USA.
Abolmaali A and Kararam A (2010) Nonlinear finite-element-based investigation of the effect of
bedding thickness on buried concrete pipe. Journal of Transportation Engineering 136(9):
793–799.
Arockiasamy M, Chaallal O and Limpeteeprakarn T (2006) Full-scale field tests on flexible pipes
under live load application. Journal of Performance of Constructed Facilities 20(1): 21–27.
Bian X, Tang X, Shen W et al. (2012) An experimental study on a culvert buried in granular soil
subjected to vehicle loads. Advances in Structural Engineering 15(6): 1031–1040.
Boscardin MD, Selig ET, Lin RS and Yang GR (1990) Hyperbolic parameter for compacted
soils. Journal of Geotechnical Engineering ASCE 116(1): 88–104.
Brachman RWI and Krushelnitzky RP (2005) Response of a landfill drainage pipe buried in a
trench. Canadian Geotechnical Journal 42(3): 752–762.
15
Brown SF and Selig ET (1991) The design of pavement and rail track foundations. In O’Reilly
MP and Brown SF. Cyclic loading of soils: from theory to practice. Blackie and Son Ltd,
Glasgow and London, UK, pp. 249-305.
Bryden P, El Naggar H and Valsangkar A (2014) Soil-structure interaction of very flexible pipes:
centrifuge and numerical investigations. International Journal of Geomechanics,
10.1061/(ASCE)GM.1943-5622.0000442, 04014091.
BS 9295 (2010) Guide to the structural design of buried pipelines. BSI, London, UK.
Chaallal O, Arockiasamy M and Godat A (2014a) Field test performance of buried flexible pipes
under live truck loads. Journal of Performance of Constructed Facilities,
10.1061/(ASCE)CF.1943-5509.0000624, 04014124.
Chaallal O, Arockiasamy M and Godat A (2014b) Numerical finite-element investigation of the
parameters influencing the behavior of flexible pipes for culverts and storm sewers under
truck load. Journal of Pipeline Systems Engineering and Practice, 10.1061/(ASCE)PS.1949-
1204.0000186, 04014015.
Chapman DN, Fleming PR, Rogers CDF and Talby RT (2007) The response of flexible pipes
buried in sand to static surface stress. Geomechanics and Geoengineering: An International
Journal 2(1): 17–28.
CSA (Canadian Standard Association) (2006) CAN/CSA-S6-06 Canadian highway bridge
design code. Canadian Standard Association, Mississauga, Canada.
Das BM (2010) Principles of geotechnical engineering. Cengage Learning, Stamford, USA.
Dhar AS, Moore ID and McGrath TJ (2004) Two-dimensional analyses of thermoplastic culvert
displacements and strains. Journal of Geotechnical and Geoenvironmental Engineering
130(2): 199–208.
DTHT (Department for Transport, Highways and Traffic) (2001) Design manual for roads and
bridges – Part 5 determination of pipe and bedding combination for drainage work HA40/01.
The Stationery Office, London, UK.
Duncan JM and Chang C (1970). Nonlinear analysis of stress and strain in soils. Journal of the
Soil Mechanics and Foundations Division ASCE 96(5): 1629–1653.
Elshimi TM and Moore ID (2013) Modeling the effects of backfilling and soil compaction beside
shallow buried pipes. Journal of Pipeline Systems Engineering and Practice ASCE,
10.1061/(ASCE)PS.1949-1204.0000136, 04013004.
Fleming P, Faragher E and Rogers C (1997) Laboratory and field testing of large-diameter
plastic pipe. Transportation Research Record: Journal of the Transportation Research Board
1594: 208–216.
Gallage CPK, Kodikara J and Chan D (2012) Response of a plastic pipe buried in expansive
clay. Proceedings of the Institution of Civil Engineers- Geotechnical Engineering 165(1): 45–
57, 10.1680/geng.9.00037.
García DB and Moore ID (2015) Performance of deteriorated corrugated steel culverts
rehabilitated with sprayed-on cementitious liners subjected to surface loads. Tunnelling and
Underground Space Technology 47: 222–232.

16
Kang J, Jung Y and Ahn Y (2013a) Cover requirements of thermoplastic pipes used under
highways. Composites Part B-Engineering 55: 184–192.
Kang J, Parker F and Yoo CH (2007) Soil-structure interaction and imperfect trench installation
for deeply buried concrete pipes. Journal of Geotechnical and Geoenvironmental
Engineering 133(3): 277–285.
Kang J, Stuart SJ and Davidson JS (2014) Analytical study of minimum cover required for
thermoplastic pipes used in highway construction. Structure and Infrastructure Engineering
10(3): 316–327.
Kang JS, Stuart SJ and Davidson JS (2013b) Analytical evaluation of maximum cover limits for
thermoplastic pipes used in highway construction. Structure and Infrastructure Engineering
9(7): 667–674.
Kawabata T, Mohri Y, Oda T et al. (2008) Field measurement and numerical analysis for buried
large diameter steel pipes. Proceedings of International Pipelines Conference 2008. ASCE,
Atlanta, Georgia, USA, pp. 1–10.
Kim K and Yoo CH (2005) Design loading on deeply buried box culverts. Journal of
Geotechnical and Geoenvironmental Engineering 131(1): 20–27.
Kraus E, Oh J and Fernando EG (2014) Impact of repeat overweight truck traffic on buried utility
facilities. Journal of Performance of Constructed Facilities, 10.1061/(ASCE)CF.1943-
5509.0000454, 04014004.
Lay GR and Brachman RWI (2014) Full-scale physical testing of a buried reinforced concrete
pipe under axle load. Canadian Geotechnical Journal 51(4): 394–408.
Mai VT, Hoult NA and Moore ID (2014a) Effect of deterioration on the performance of
corrugated steel culverts. Journal of Geotechnical and Geoenvironmental Engineering,
10.1061/(ASCE)GT.1943-5606.0001021, 04013007.
Mai VT, Moore ID and Hoult NA (2014b) Performance of two-dimensional analysis: deteriorated
metal culverts under surface live load. Tunnelling and Underground Space Technology 42:
152–160.
McGrath TJ, DelloRusso SJ and Boynton J (2002) Performance of thermoplastic culvert pipe
under highway vehicle loading. Pipelines2002: Beneath Our Feet: Challenges and Solutions.
ASCE, Cleveland, Ohio, USA, pp. 1–14.
Meguid MA and Kamel S (2014) A three-dimensional analysis of the effects of erosion voids on
rigid pipes. Tunnelling and Underground Space Technology 43: 276–289.
Petersen Dl, Nelson CR, McGrath TJ and Kitane Y (2010) Recommended design specifications
for live load distribution to buried structures. Transport Research Board, Washington, USA.
Rakitin B and Xu M (2014) Centrifuge modeling of large-diameter underground pipes subjected
to heavy traffic loads. Canadian Geotechnical Journal 51(4): 353–368.
Rogers CDF (1999) The structural performance of flexible pipe for landfill drainage.
Proceedings of the Institution of Civil Engineers- Geotechnical Engineering 137(4): 249–260,
10.1680/gt.1999.370410.

17
Saadeldin R, Hu Y and Henni A (2015) Numerical analysis of buried pipes under field geo-
environmental conditions. International Journal of Geo-Engineering, 10.1186/s40703-015-
0005-4.
Sargand SM, Masada T, Tarawneh B and Gruver D (2005) Field performance and analysis of
large-diameter high-density polyethylene pipe under deep soil fill. Journal of Geotechnical
and Geoenvironmental Engineering 131(1): 39–51.
Sheldon T, Sezen H and Moore ID (2014) Joint response of existing pipe culverts under surface
live loads. Journal of Performance of Constructed Facilities, 10.1061/(ASCE)CF.1943-
5509.0000494, 04014037.
Taleb B and Moore I (1999). Metal culvert response to earth loading: performance of two-
dimensional analysis. Transportation Research Record: Journal of the Transportation
Research Board 1656: 25–36.
Trickey SA and Moore ID (2007) Three-dimensional response of buried pipes under circular
surface loading. Journal of Geotechnical and Geoenvironmental Engineering 133(2): 219–
223.
Wong LS, Allouche EN, Dhar AS et al. (2006) Long-term monitoring of SIDD type IV
installations. Canadian Geotechnical Journal 43(4): 392–408.
Yoo CS, Lee KM, Chung SW and Kim JS (1999) Interaction between flexile buried pipe and
surface load. Journal of Korean Geotechnical Society 15(3): 83–97.
18
Figure captions
Figure 1 Finite element model of the selected problem
Figure 2 Comparison of the vertical and horizontal displacement of the HDPE pipe under live
load
Figure 3 Comparison of the soil pressure around the HDPE pipe under live load
Figure 4 Predicted and measured vertical displacement of the PVC pipe
Figure 5 The load cases considered in the analysis (a) axles perpendicular to pipe, but the truck
moving parallel to the pipe (b) axles parallel to the pipe, but truck moving perpendicular to the
pipe
Figure 6 Results from the analysis of the pipe for the case of the MR-BSI live load travelling
parallel to the pipeline axis with different S values (a) maximum vertical and horizontal
displacement (b) maximum thrust. (Note: S = 0 when the first set of wheels are directly above
the pipeline axis, as shown in Figure 5(a).)
Figure 7 Results from the analysis of the pipe for the case of the MR-BSI live load travelling
perpendicular to the pipeline axis with different S values (a) maximum vertical and horizontal
displacement (b) maximum thrust. (Note: As shown in Figure 5(b), S = -1 m when the right hand
axle is 1 m to the left of the pipeline axis, S = 0 when the right hand truck axle is directly above
the pipeline axis and the other axle is 1.8 m to the left of the pipeline axis, S = 1.8 m means the
left hand truck axle is directly above the pipeline axis and the other axle is 1.8 m to the right of
the pipeline axis.)
Figure 8 Calculated and predicted maximum soil pressure on PVC pipes under live load only (a)
SW90 backfill (b) ML90 backfill
Figure 9 Calculated and predicted maximum soil pressure on concrete pipes under live load
only (a) SW90 backfill (b) ML90 backfill
Figure 10 Maximum thrust developed in the PVC pipes under the MR-BSI live load only
Figure 11 Maximum thrust developed in the concrete pipes under the MR-BSI live load only
Figure 12 Maximum vertical displacement of PVC pipes developed under the MR-BSI live load
only
Figure 13 Maximum vertical displacement of concrete pipes developed under the MR-BSI live
load only
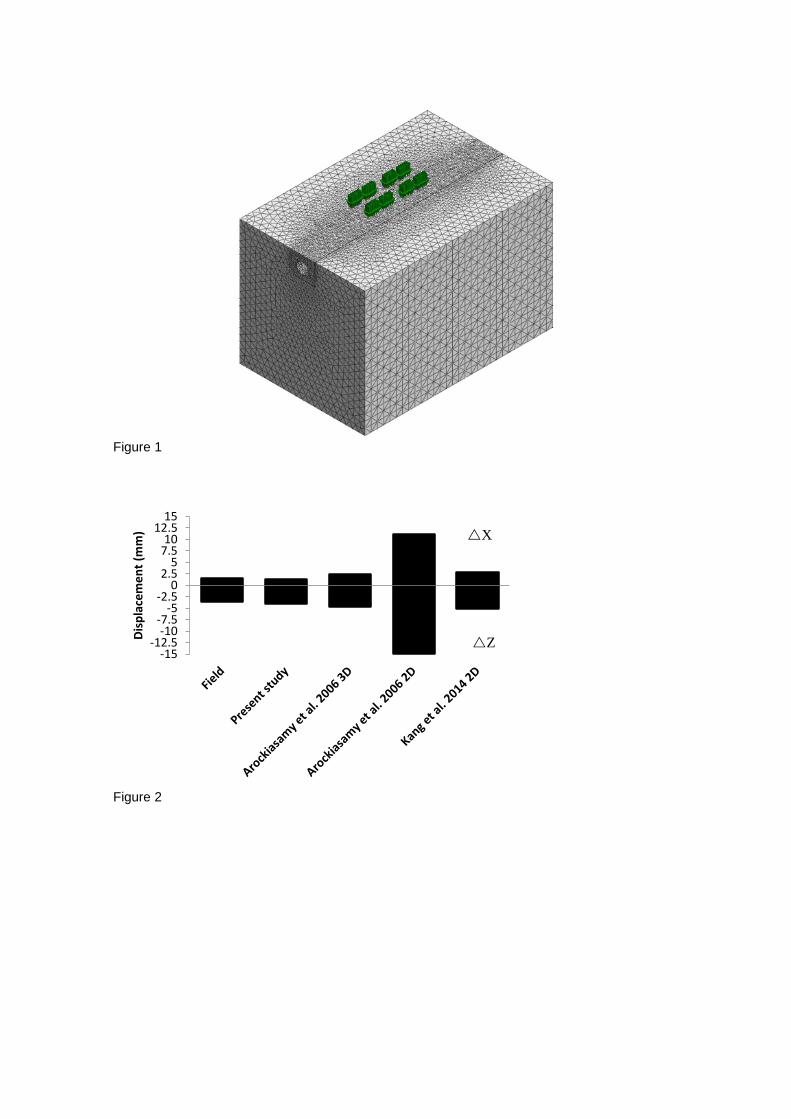
Figure 1
Figure 2
-15-12.5
-10-7.5
-5-2.5
02.5
57.510
12.515
Disp
lace
men
t (m
m)
Z
X
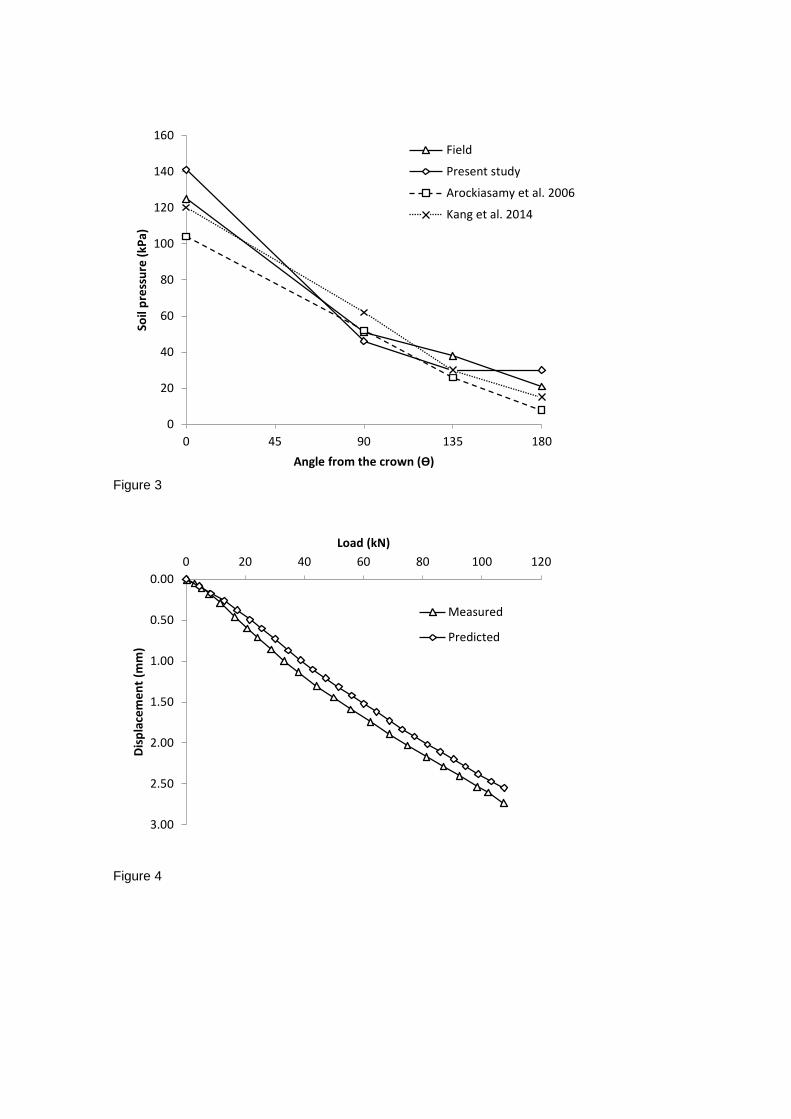
Figure 3
Figure 4
0
20
40
60
80
100
120
140
160
0 45 90 135 180
Soil
pres
sure
(kPa
)
Angle from the crown (ϴ)
Field
Present study
Arockiasamy et al. 2006
Kang et al. 2014
0.00
0.50
1.00
1.50
2.00
2.50
3.00
0 20 40 60 80 100 120
Disp
lace
men
t (m
m)
Load (kN)
Measured
Predicted

(a)
(b)
Figure 5
Figure 6a
0
1
2
3
4
5
6
7
8
0 0.5 1 1.5 2
Max
. dis
plac
emen
t (m
m)
S (m)
Vertical
Horizantal
S
Pipe
Tyre foot print (0.25*0.5) m
S
1.0 m
1.0 m
1.0 m
1.8 m
1.0 m
1.0 m
1.0 m
Axles
Direction of movement of the truck
1.8 m

Figure 6b
Figure 7a
20
25
30
35
40
45
50
0 0.5 1 1.5 2
Max
. Thr
ust (
kN/m
)
S (m)
0
2
4
6
8
10
12
-1 -0.5 0 0.5 1 1.5 2
Max
. dis
plac
emen
t (m
m)
S (m)
Vertical
Horizantal

Figure 7b
Figure 8a
20
25
30
35
40
45
50
-1 -0.5 0 0.5 1 1.5 2
Max
. thr
ust (
kN/m
)
S (m)
0
0.5
1
1.5
2
2.5
3
3.5
4
4.5
5
0 100 200 300 400 500
H (m
)
Max. soil pressure (kPa)
D = 0.37 m
D = 0.76 m
D = 1.47 m
BSI equation

Figure 8b
Figure 9a
0
0.5
1
1.5
2
2.5
3
3.5
4
4.5
5
0 100 200 300 400H
(m)
Max. soil pressure (kPa)
D = 0.37 m
D = 0.76 m
D = 1.47 m
BSI equation
0
0.5
1
1.5
2
2.5
3
3.5
4
4.5
5
0 100 200 300 400 500 600
H (m
)
Max. soil pressure (kPa)
D = 0.41 mD = 0.76 mD = 1.47 mD = 2.89 mBSI equation

Figure 9b
Figure 10
0
0.5
1
1.5
2
2.5
3
3.5
4
4.5
5
0 100 200 300 400 500H
(m)
Max. soil pressure (kPa)
D = 0.41 mD = 0.76 mD = 1.47 mD = 2.89 mBSI equation
0
10
20
30
40
50
60
70
0 0.5 1 1.5
Thru
st (k
N/m
)
Diameter (m)
H = 0.5 mH = 1.0 mH = 1.5 mH = 2.0 mH = 2.5 mH = 3.0 m
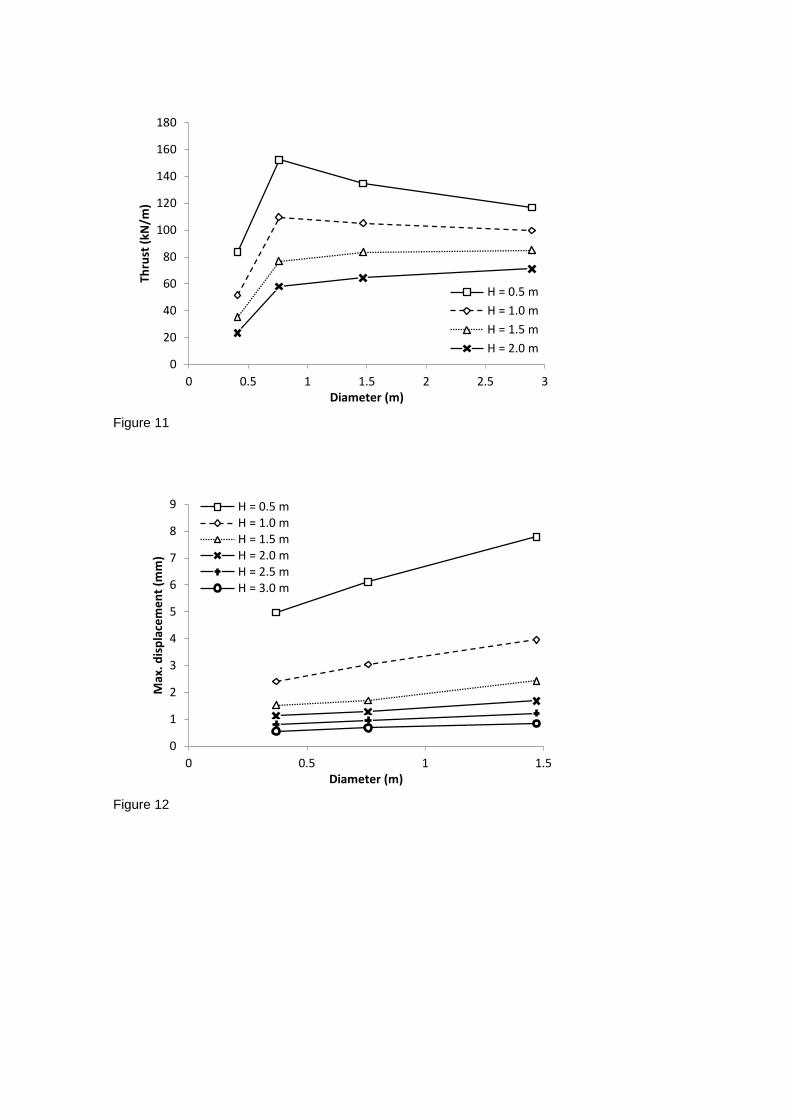
Figure 11
Figure 12
0
20
40
60
80
100
120
140
160
180
0 0.5 1 1.5 2 2.5 3
Thru
st (k
N/m
)
Diameter (m)
H = 0.5 mH = 1.0 mH = 1.5 mH = 2.0 m
0
1
2
3
4
5
6
7
8
9
0 0.5 1 1.5
Max
. dis
plac
emen
t (m
m)
Diameter (m)
H = 0.5 mH = 1.0 mH = 1.5 mH = 2.0 mH = 2.5 mH = 3.0 m

Figure 13
0
0.5
1
1.5
2
2.5
3
0 0.6 1.2 1.8 2.4 3
Max
. dis
plac
emen
t (m
m)
Diameter (m)
H = 0.5 m
H = 1.0 m
H = 1.5 m
H = 2.0 m
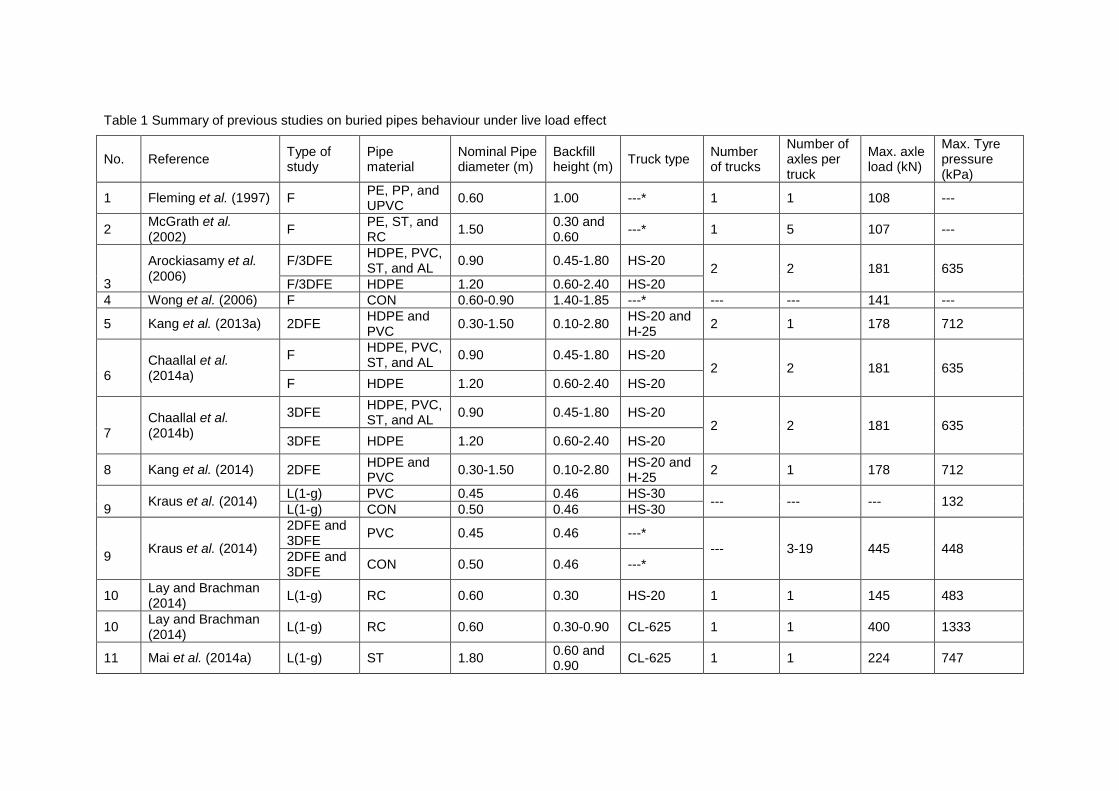
Table 1 Summary of previous studies on buried pipes behaviour under live load effect
No. Reference Type of study
Pipe material
Nominal Pipe diameter (m)
Backfill height (m) Truck type Number
of trucks
Number of axles per truck
Max. axle load (kN)
Max. Tyre pressure (kPa)
1 Fleming et al. (1997) F PE, PP, and UPVC 0.60 1.00 ---* 1 1 108 ---
2 McGrath et al. (2002) F PE, ST, and
RC 1.50 0.30 and 0.60 ---* 1 5 107 ---
3
Arockiasamy et al. (2006)
F/3DFE HDPE, PVC, ST, and AL 0.90 0.45-1.80 HS-20 2 2 181 635
F/3DFE HDPE 1.20 0.60-2.40 HS-20 4 Wong et al. (2006) F CON 0.60-0.90 1.40-1.85 ---* --- --- 141 ---
5 Kang et al. (2013a) 2DFE HDPE and PVC 0.30-1.50 0.10-2.80 HS-20 and
H-25 2 1 178 712
6
Chaallal et al. (2014a)
F HDPE, PVC, ST, and AL 0.90 0.45-1.80 HS-20
2 2 181 635 F HDPE 1.20 0.60-2.40 HS-20
7
Chaallal et al. (2014b)
3DFE HDPE, PVC, ST, and AL 0.90 0.45-1.80 HS-20
2 2 181 635 3DFE HDPE 1.20 0.60-2.40 HS-20
8 Kang et al. (2014) 2DFE HDPE and PVC 0.30-1.50 0.10-2.80 HS-20 and
H-25 2 1 178 712
9 Kraus et al. (2014) L(1-g) PVC 0.45 0.46 HS-30 --- --- --- 132 L(1-g) CON 0.50 0.46 HS-30
9 Kraus et al. (2014)
2DFE and 3DFE PVC 0.45 0.46 ---*
--- 3-19 445 448 2DFE and 3DFE CON 0.50 0.46 ---*
10 Lay and Brachman (2014) L(1-g) RC 0.60 0.30 HS-20 1 1 145 483
10 Lay and Brachman (2014) L(1-g) RC 0.60 0.30-0.90 CL-625 1 1 400 1333
11 Mai et al. (2014a) L(1-g) ST 1.80 0.60 and 0.90 CL-625 1 1 224 747
11 Mai et al. (2014a) L(1-g) ST 1.80 0.60 and 0.90 HS-20 1 1 182 607
12 Rakitin and Xu (2014) L(C) RC 1.40 1.00 and
2.00 ---* 1** 3 95 283
12 Rakitin and Xu (2014) L(C) RC 1.40 1.00-4.00 ---* 1** 2 567 468
13 García and Moore (2015) L(1-g) ST 1.20 1.20 CL-625 1 1 203 677
13 Becerril García and Moore (2015) L(1-g) ST 1.20 1.20 and
2.10 CL-625 1 2 325 542
14 Sheldon et al. (2014) F ST 0.90 and 1.20
0.54 and 0.77 ---* 1 2 133 ---
14 Sheldon et al. (2014) F CON 1.40 and 2.10
0.60 and 1.40 ---* 1 2 127 ---
F HDPE 0.90 1.40 ---* * Not a standard truck. ** Half of the truck was simulated in the centrifuge model.
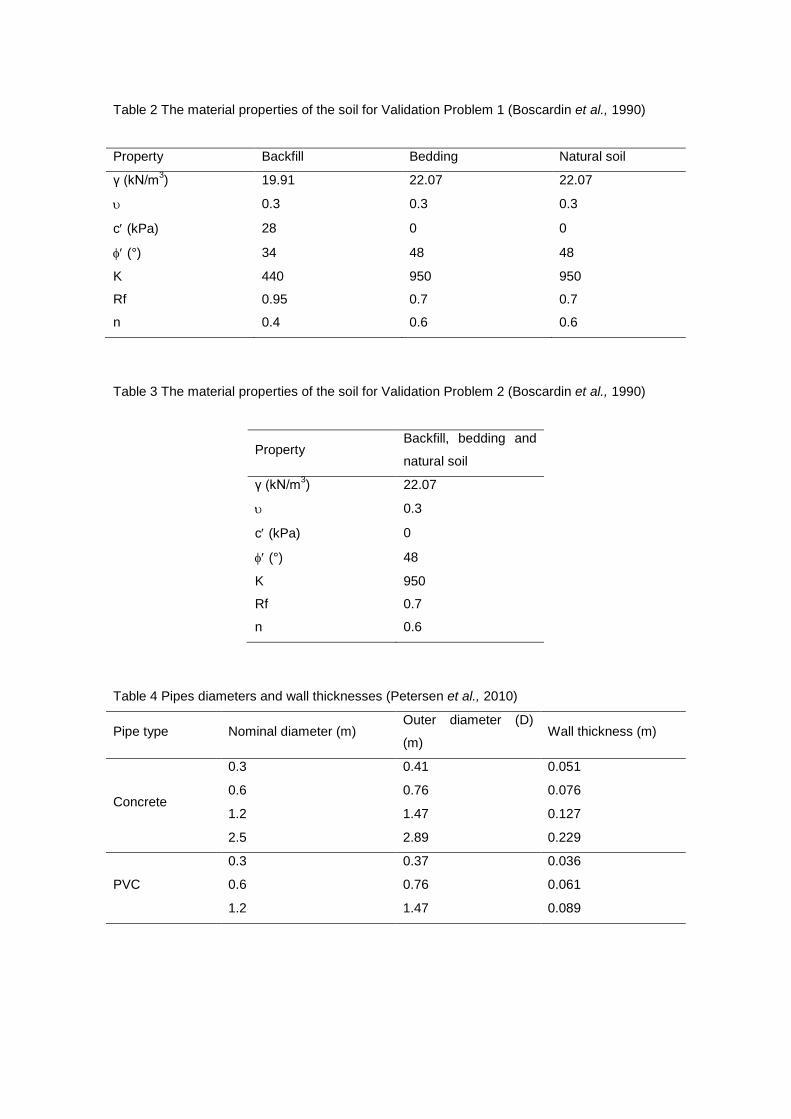
Table 2 The material properties of the soil for Validation Problem 1 (Boscardin et al., 1990)
Property Backfill Bedding Natural soil
γ (kN/m3) 19.91 22.07 22.07
υ 0.3 0.3 0.3
c′ (kPa) 28 0 0
φ′ (°) 34 48 48
K 440 950 950
Rf 0.95 0.7 0.7
n 0.4 0.6 0.6
Table 3 The material properties of the soil for Validation Problem 2 (Boscardin et al., 1990)
Property Backfill, bedding and
natural soil
γ (kN/m3) 22.07
υ 0.3
c′ (kPa) 0
φ′ (°) 48
K 950
Rf 0.7
n 0.6
Table 4 Pipes diameters and wall thicknesses (Petersen et al., 2010)
Pipe type Nominal diameter (m) Outer diameter (D)
(m) Wall thickness (m)
Concrete
0.3 0.41 0.051
0.6 0.76 0.076
1.2 1.47 0.127
2.5 2.89 0.229
PVC
0.3 0.37 0.036
0.6 0.76 0.061
1.2 1.47 0.089
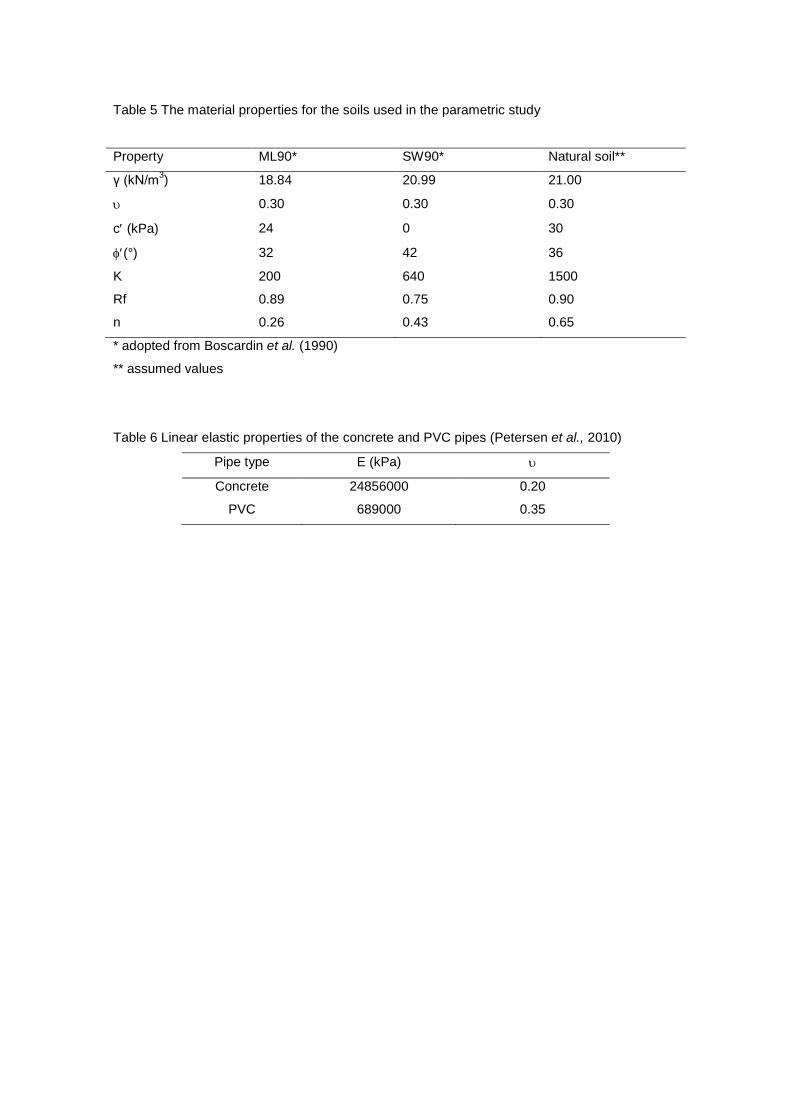
Table 5 The material properties for the soils used in the parametric study
Property ML90* SW90* Natural soil**
γ (kN/m3) 18.84 20.99 21.00
υ 0.30 0.30 0.30
c′ (kPa) 24 0 30
φ′(°) 32 42 36
K 200 640 1500
Rf 0.89 0.75 0.90
n 0.26 0.43 0.65
* adopted from Boscardin et al. (1990)
** assumed values
Table 6 Linear elastic properties of the concrete and PVC pipes (Petersen et al., 2010)
Pipe type E (kPa) υ
Concrete 24856000 0.20
PVC 689000 0.35