Embed Size (px)
Citation preview

Citation for published version:Johnes, J, Izzeldin, M & Pappas, V 2014, 'A comparison of performance of Islamic and conventional banks 2004to 2009', Journal of Economic Behavior and Organization, vol. 103, no. Supplement, pp. S93-S107.https://doi.org/10.1016/j.jebo.2013.07.016
DOI:10.1016/j.jebo.2013.07.016
Publication date:2014
Document VersionPeer reviewed version
Link to publication
Publisher RightsCC BY-NC-NDThe published version is available via: http://dx.doi.org/10.1016/j.jebo.2013.07.016
University of Bath
General rightsCopyright and moral rights for the publications made accessible in the public portal are retained by the authors and/or other copyright ownersand it is a condition of accessing publications that users recognise and abide by the legal requirements associated with these rights.
Take down policyIf you believe that this document breaches copyright please contact us providing details, and we will remove access to the work immediatelyand investigate your claim.
Download date: 03. Jul. 2020

1
A comparison of performance of Islamic and conventional banks 2004 to 2009
Jill Johnes1, Marwan Izzeldin and Vasileios Pappas2
Department of Economics Lancaster University Management School
Lancaster University LA1 4YX United Kingdom
Abstract
We compare the efficiency of Islamic and conventional banks during the period 2004-2009 using data
envelopment analysis (DEA) and meta-frontier analysis (MFA). The use of the non-parametric MFA allows for
the decomposition of gross efficiency (i.e. the efficiency of banks when measured relative to a common
frontier) into 2 components: net efficiency (the efficiency of banks measured relative to their own bank type
frontier) and type efficiency (the efficiency which relates to modus operandi). This approach is new to the
Islamic banking literature. The analysis is performed in two stages. The first stage employs DEA and MFA to
compare banks on the basis of gross efficiency and its components (net and type). We find that Islamic banks
are typically on a par with conventional ones in terms of gross efficiency, significantly higher on net efficiency
and significantly lower on type efficiency. Second stage analyses, which account for banking environment and
bank-level characteristics, confirm these results. The low type efficiency of Islamic banks could be attributed to
lack of product standardisation whereas high net efficiency reflects high managerial capability in Islamic banks.
These findings are relevant to both policy-makers and regulators. In particular, Islamic banks should explore
the benefits of moving to a more standardized system of banking, while the underperformance of
conventional bank managers could be examined in the context of the on-going remuneration culture.
Keywords: Banking sector; Islamic banking; Efficiency; Data Envelopment Analysis; Meta-frontier analysis
JEL Classification: C14; G21
1 Corresponding author: email: [email protected] 2 Acknowledgement: The authors are grateful to the Gulf One Lancaster Centre for Economic Research (GOLCER) for support; to the discussant and participants at the Islamic Finance Conference 2012 (El Shaarani Centre for Islamic Business and Finance, Aston Business School & Durham Business School, Birmingham, 29th September – 1st October 2012) for comments; and to two anonymous referees. The usual disclaimer applies.

2
1. Introduction
The recent financial crisis led to difficulties in many conventional3 banks across the globe. Islamic
banks, in contrast, were largely insulated from the crisis (Willison 2009; Yılmaz 2009). It appeared
that their highly regulated operational environment guided by Shariah principles prohibited
investment in the type of financial products which adversely affected conventional banks and which
prompted the crisis (Hasan and Dridi 2010).
As a consequence, the traditional values of Islamic finance have increasing appeal to Western
investors who are disillusioned with the banking practices of conventional banks in the wake of the
global financial crisis (Arthur D Little Report 2009). Islamic banks are therefore no longer limited to
traditional Muslim regions: there are more than 300 Islamic financial institutions spread across 70
countries. Indeed, there are now 5 Islamic banks in the UK, and 19 Islamic financial institutions in the
USA.
The success of Islamic banks relative to conventional banks in the macroeconomic environment,
however, is in contrast to expectations of their performance (by which we mean technical efficiency)
in a microeconomic context. Islamic banks might be expected to have lower technical efficiency than
conventional banks for a number of reasons. First, the strict application of Shariah rules means that
many of the Islamic banking products are bespoke thereby increasing operational costs. Second,
Islamic banks are typically small compared to conventional banks (Chapra 2007), and there is
evidence that technical efficiency increases with size in the banking industry (see, for example, Miller
and Noulas 1996; Abdul-Majid et al. 2005a; Chen et al. 2005; Drake et al. 2006). Third, Islamic banks
are typically domestically owned and there is evidence to support the contention that foreign-
owned banks are more technically efficient than their domestically-owned counterparts (see, for
example, Sturm and Williams 2004; Matthews and Ismail 2006).
The rapid increase in Islamic banking, and the importance of the sector for the economies of
some countries (for example Malaysia, Bahrain and the United Arab Emirates) make it important to
3 We use the term conventional to refer to commercial banks not involved in Islamic banking products.

3
have a greater understanding of efficiency and its drivers. Indeed, given the international spread of
Islamic banking practices, a study comparing the performance of Islamic and conventional banking is
of widespread interest. Previous studies which specifically focus on the performance of Islamic banks
relative to conventional banks are inconclusive in their findings. We therefore aim to fill a gap in the
literature by investigating two questions to which previous studies have failed to provide adequate
answers. First, which types of banks (Islamic or conventional) are more technically efficient? Second,
what are the underlying reasons for any differences in efficiency between Islamic and conventional
banks?
We focus our empirical study on countries with a substantial (at least 60%) Muslim population
and where there are both Islamic and conventional banks in operation. Our analysis comes in two
stages. In a first stage, we assume a degree of competition between Islamic and conventional
banking sectors4 and compute (using a non-parametric approach) and directly compare the
efficiency of 45 Islamic banks with 207 conventional banks across 18 countries over the period 2004
to 2009 (a period which covers the start of the global financial crisis). As part of this first stage, we
adopt a meta-frontier approach (MFA) which decomposes efficiency into two components: one due
to the modus operandi and one due to managerial competence at converting inputs into outputs.
The use of non-parametric MFA is new to the Islamic banking context. In a second stage we
investigate the determinants of the two components of efficiency (rather than just the overall
efficiency) and are thereby able to uncover and discuss more effective ways in which managers and
policy-makers can improve efficiency. The econometric investigation of the factors underlying all
three types of efficiency is also new to the Islamic banking literature.
Our approach reveals new insights into Islamic banking efficiency. First of all, we find in the first
stage that there is no significant difference in mean efficiency between conventional and Islamic
banks when efficiency is measured relative to a common frontier. The decomposition of overall
efficiency using a MFA, however, reveals some fundamental differences between the two bank
4 This is not an unreasonable assumption given the growing appeal of Islamic financial products, and given that large ratings agencies such as Moody’s have begun to get involved in Islamic finance (Alexakis and Tsikouras 2009).

4
types. In particular, the modus operandi in Islamic banking appears to be less efficient on average
than the conventional one. Managers of Islamic banks, however, make up for this as mean efficiency
in Islamic banks is higher than in conventional banks when efficiency is measured relative to their
own bank type frontier. The differences, shown in this is study, in relative performance of Islamic
and conventional banks on gross efficiency and its 2 components perhaps provide an explanation of
why the results of previous studies have provided apparently conflicting results.
A second-stage analysis verifies that differences between the two banking systems remain even
after banking environment and bank-level characteristics have been taken into account. These
findings are important and relevant to both policy-makers and regulators.
The paper is in six sections of which this is the first. Section 2 provides a brief literature review
while a discussion of the methodological approaches to efficiency measurement is presented in
section 3. Section 4 describes the sample data and the empirical model, and results are presented
and interpreted in section 5. Conclusions and policy implications are discussed in section 6.
2. Literature review
There is an abundant literature on the efficiency of banking institutions: detailed (albeit
somewhat outdated) reviews can be found elsewhere (Berger and Humphrey 1997; Berger and
Mester 1997; Brown and Skully 2002). A small subset of this literature focuses on Islamic banking
either in isolation or in comparison to conventional banking (see table 1 for details of studies which
use frontier estimation methods to derive measures of efficiency). The remainder of this section will
focus predominantly on the comparative literature.
[Table 1 here]
We have previously hypothesized that Islamic banks will typically have lower efficiency than
conventional banks. The evidence from previous empirical studies of Islamic and conventional
banking is mixed: some find no significant difference in efficiency between the two types of banking
(Abdul-Majid et al. 2005b; El-Gamal and Inanoglu 2005; Mokhtar et al. 2006; Bader 2008; Hassan et
al. 2009; Shahid et al. 2010); some studies do not test whether observed differences in efficiency are
significant and this is mainly due to small sample size (Hussein 2004; Al-Jarrah and Molyneux 2005;

5
Said 2012). One study (Al-Muharrami 2008) claims that Islamic banks are significantly more efficient
than conventional banks, but results of significance tests are not shown, and the result is based on a
sample which only contains 7 Islamic banks. Only a small number of studies find, as expected a
priori, that Islamic banks are significantly less efficient than conventional banks, but the possible
reasons for the difference are not explored further (Mokhtar et al. 2007; 2008; Srairi 2010).
One group of studies deserves particular mention because they make a distinction between
‘gross’ and ‘net’ efficiency (Abdul-Majid et al. 2008; Johnes et al. 2009; Abdul-Majid et al. 2010;
2011a; 2011b). Gross efficiency incorporates both managerial competence and efficiency arising
from modus operandi; net efficiency isolates the managerial component and therefore provides a
measure of managerial efficiency. In one study based on banks in Malaysia, gross efficiency scores
are derived from a stochastic frontier analysis (SFA) estimation of a cost function which makes no
allowance for various characteristics of each bank (including whether or not it is Islamic), while net
efficiency scores are estimated by taking into account the operating characteristics of banks in the
SFA cost function (Abdul-Majid et al. 2008; 2011a; 2011b). Gross efficiency is found to be highest for
conventional banks and lowest for Islamic banks, and the significance of the Islamic dummy in the
cost equation including the environmental variables suggests that this difference is significant.
There are, however, only slight differences in net efficiency between the different types of banks.
The findings from this study are questionable for two reasons. First they are derived from an
estimated cost function for a sample of Islamic and conventional banks, and this implicitly assumes
an objective of cost minimization on the part of all the banks in the data set. Second, the estimation
technique (SFA) applies the same parameters5 to all observations and hence does not allow for
differences in objectives between the different types of banks in the sample.
A later study by the same authors (Abdul-Majid et al. 2010) corrects the first problem by
estimating an output distance function; the shortcomings of the SFA estimation technique, however,
remain. This study, based on a sample of banks across 10 different countries, finds that the Islamic
dummy is not a significant determinant of net efficiency; hence any inferior performance of Islamic
5 This point is explained and discussed further in section 3.

6
banks is mainly due to the constraints under which they operate rather than the shortcomings of
their managers.
Johnes et al (2009) take a different approach by examining gross and net efficiency using an
output distance function estimated using data envelopment analysis (DEA). They find (like Abdul-
Majid et al. 2008; 2011a; 2011b) that the lower performance of Islamic banks in the Gulf
Cooperation Council (GCC) region is due to modus operandi rather than managerial incompetence.
These studies are interesting and offer a way forward in terms of isolating the underlying causes
of the differing performance of Islamic and conventional banks. There is a need, however, for a
comparison of efficiency between conventional and Islamic banks based on a large sample of banks
using an approach which makes no underlying assumptions regarding the banks’ objectives, and
which allows for inter-bank differences in outlook. It is also necessary to investigate the factors
underlying the gross and net efficiency scores. Thus, it is not enough to know whether it is modus
operandi or managerial inadequacies which underpin a bank’s performance; bank managers need to
know how and to what extent their behaviour can affect their efficiency. A detailed second stage
analysis of both gross and net efficiency scores will provide this information.
3. Methodology
Studying banking efficiency can be done in two possible ways: either by use of traditional
financial ratio analysis (FRA); or by the distance function approach which leads to frontier estimation
methods such as DEA and SFA. The pros and cons of FRA as a method of efficiency measurement are
well known (Ho and Zhu 2004; Hasan 2005). In the context of Islamic banking, the most severe
drawback is the assumption underlying financial ratios of cost minimisation or profit maximisation;
these are unlikely to be the most pressing objectives in the context of Islamic banking (Abdul-Majid
et al. 2010). The distance function approach, whereby a firm’s observed production point is
compared to a production frontier which denotes best practice, does not assume any specific
optimizing objective on the part of the firms, and is therefore our preferred method of approach.

7
It is worth reflecting upon our intention to compare directly the efficiency of Islamic and
conventional banks6. Critics argue that the objectives of the two banking systems differ so much that
such a comparison is invalid: for example, conventional banks can be seen to be motivated only by
profit; Islamic banks have additional objectives which encompass social value and ethical behaviour
(in line with Shariah principles). Objections to a direct comparison can be rejected using one or other
of two possible arguments:
a) Conventional and Islamic banks increasingly compete in similar markets comprising customers
who are seeking products which conform to their religious principles and customers who are not
so constrained (Warde 2010). Evidence cited includes: Islamic subsidiaries and/or windows
opened by conventional banks; the availability of Islamic financial products outside of Islamic
countries; the establishment of Islamic banks in non-Islamic countries; and the targeting of some
Islamic products at all types of customers (Warde 2010). Direct competition between the two
bank types in the same markets allows a direct comparison between Islamic and conventional
banks.
b) In the event that the objectives and markets of the two types of banks are indeed different, we
believe that it is still possible to make a direct comparison so long as the estimation method
appropriately allows for differences between (and within) the banking systems. We have a choice
of estimation methods, namely the parametric SFA or the non-parametric DEA (Majumdar 1995;
Coelli et al. 2005) both of which make the assumption that production units are comparable.
While the general advantages and disadvantages of each of these are well-known one aspect
must be emphasized. DEA, by estimating a frontier which envelops the observed production
points with piecewise linear segments, allows each bank to have its own objectives as it will only
be compared with banks of similar input and output mix. For example, a small Islamic bank,
financing its loans using a balanced mix of equity and deposits, would not in DEA be compared
with a large conventional bank with a different input-output mix financing its loans
predominantly using deposits. Similarly, an Islamic bank mainly involved in sale and mark-up 6 This is not an entirely original approach and there are examples in previous literature (see section 2 for details).
8
transactions will not be compared with one which undertakes joint venture finance as they will
have different mixes of outputs. SFA, on the other hand, applies the same parameters7 to all
observations in the sample. By choosing DEA rather than SFA as our estimation method in the
first stage, we therefore overcome any criticism of pooling banks with different objectives as DEA
only compares like with like.
The effectiveness of policies to improve bank efficiency depends on the source of inefficiency, for
example, whether it is managerial incompetence or whether it is the banking system in which the
bank operates. We adopt a meta-frontier methodology (similar to one introduced by Charnes et al.
1981) for decomposing the efficiency of banks into two components: one which is due to the modus
operandi, i.e. the context in (or rules under) which the bank operates (namely conventional or
Islamic); and one which is due to managerial competence at converting inputs into outputs within
the context in which the bank operates. Whilst relatively new to the Islamic banking literature, this
type of method has been applied in banking more generally (Bos and Schmiedel 2003) as well as in
other contexts including education, sport and the water industry (De Witte and Marques 2009;
Tiedemann et al. 2011; Wongchai et al. 2012).
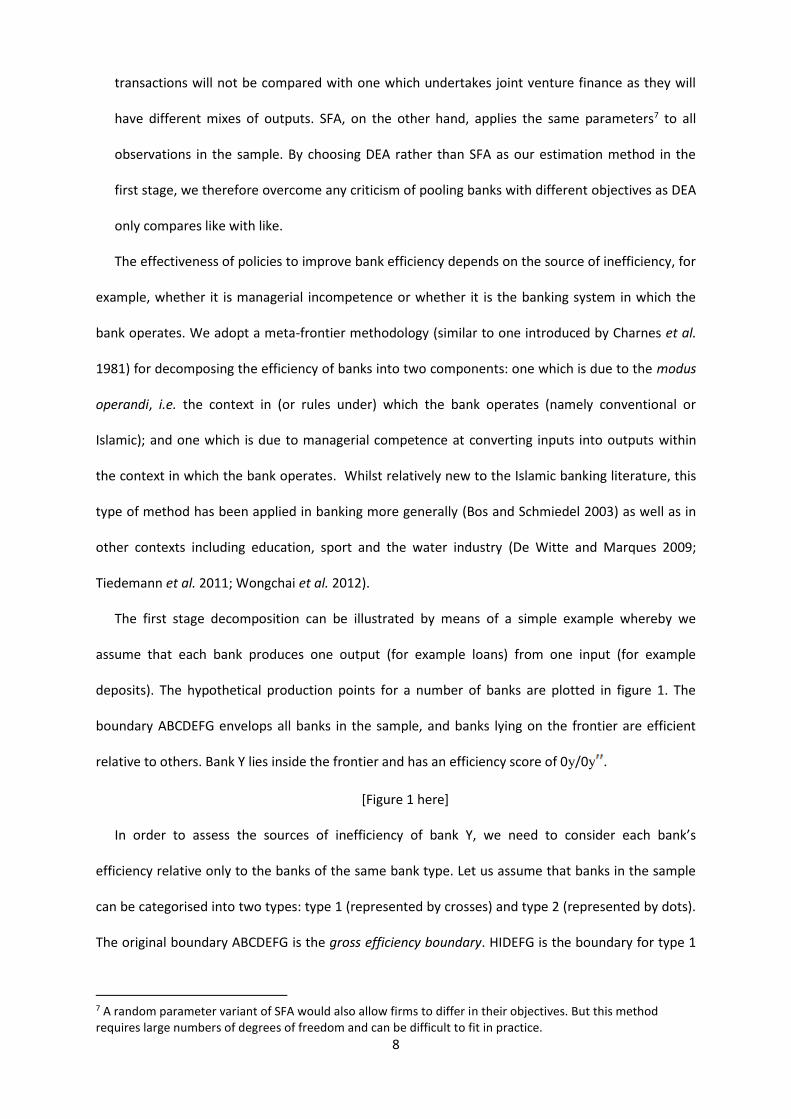
The first stage decomposition can be illustrated by means of a simple example whereby we
assume that each bank produces one output (for example loans) from one input (for example
deposits). The hypothetical production points for a number of banks are plotted in figure 1. The
boundary ABCDEFG envelops all banks in the sample, and banks lying on the frontier are efficient
relative to others. Bank Y lies inside the frontier and has an efficiency score of 0y/0y .
[Figure 1 here]
In order to assess the sources of inefficiency of bank Y, we need to consider each bank’s
efficiency relative only to the banks of the same bank type. Let us assume that banks in the sample
can be categorised into two types: type 1 (represented by crosses) and type 2 (represented by dots).
The original boundary ABCDEFG is the gross efficiency boundary. HIDEFG is the boundary for type 1
7 A random parameter variant of SFA would also allow firms to differ in their objectives. But this method requires large numbers of degrees of freedom and can be difficult to fit in practice.

9
banks, and ABCKL is the boundary for type 2 banks. We call these the net efficiency boundaries. Bank
Y, a type 2 bank, has a net efficiency score of which represents the proportion of output
obtained by bank Y relative to the best possible output achievable by type 2 banks only and given
bank Y’s input level. The distance between the net and gross boundaries measures the impact on
output of bank type. The type efficiency score of bank Y is therefore and indicates the
impact on bank Y of operating under a type 2 system.
There are some potential problems with this approach but we have taken steps to minimize the
effect of these. First of all, it should be clear from the previous exposition that the estimation of
gross and net efficiencies is based on different samples of banks. Efficiencies calculated using DEA,
which is a non-parametric method, are affected by sample size (Zhang and Bartels 1998), and hence
the results of the MFA can be biased when DEA is used to perform the calculations and comparisons
(De Witte and Marques 2009). In order to guard against this problem, we resort to bootstrapping
methods to deliver bias-corrected efficiency scores which correct for sampling variability 8.
Second, the approach requires an assumption regarding concavity of the meta-frontier. A
concave meta-frontier implies that points on the line segments of the gross efficiency frontier are
feasible for both types of observations. In figure 1, for example, this means that since point C is
obtainable by type 2 banks and point D is obtainable by type 1 banks, then points on the line joining
C and D are attainable by both types of banks, but are currently not being observed because of some
constraint or limitation of one or other of the two banking systems (not because of managerial
inefficiency). A non-concave meta-frontier (Tiedemann et al. 2011) implies that the meta-frontier
comprises entirely of line segments which are on either of the net efficiency frontiers. In figure 1, for
example, line segment CD would not be part of the non-concave meta-frontier, but would be
replaced by CJD. The effect of choice of concavity assumption on results is likely to be smaller the
larger the sample size. Both concave and non-concave meta-frontiers have been applied in the
literature. For ease of estimation we assume a concave meta-frontier, as in Charnes et al. (1981).
8 Bias-corrected efficiencies are calculated using the homogeneous bootstrapping algorithm of Simar and Wilson (2008).

10
Differences between Islamic and conventional banks in gross, net and type efficiency
(respectively) might be a consequence of some other underlying characteristic(s) of each group of
banks and not purely operation within the given system. Thus we intend to perform a second stage
analysis which will ascertain the determinants of each efficiency component and which will include
as one of the explanatory variables an indicator of bank type.
We use a (bank) random effects estimation approach with heteroscedasticity-corrected standard
errors in our second stage analysis9 as recommended in recent work which compares various second
stage approaches (Hoff 2007; McDonald 2009). This contrasts with previous studies which have
adopted a Tobit regression approach (examples in the banking context include: Jackson and Fethi
2000; Casu and Molyneux 2003; Drake et al. 2006; Ariff and Can 2008; Sufian 2009). The choice of a
Tobit model, however, is based on the premise that the dependent variable comprising DEA
efficiency scores is a censored variable, whereas efficiency scores are not censored but are fractional
data (McDonald 2009), thus making Tobit analysis inappropriate.
4. Sample data and models
The empirical analysis presented in this study focuses on countries where at least 60% of the
population is Muslim and where both bank types coexist. We include in the sample banks for which
a complete set of data for the DEA model can be compiled using the data source Bankscope, for the
period 2004 to 200910. This is an interesting time period over which to undertake this study as it also
allows us to gain insights into the effects of macroeconomic turmoil and instability on the efficiency
of the banking sector (two studies examine Islamic and conventional banks over the same period:
Rokhim and Rokhim 2011; Beck et al. 2013).
Banks are designated Islamic or conventional on the basis of the Bankscope definition11, and
conventional banks which operate Islamic windows are not included in our sample. Data for 252
9 An alternative approach using data mining can be found elsewhere (Emrouznejad and Anouze 2009; 2010). 10 Note that Bankscope moved to International Financial Reporting Standards (IFRS) from 2004 onwards, and so data should be comparable over time. 11 We cross-check the banks listed as ‘Islamic’ in Bankscope with other databases of Islamic banks including the
International Finance Information Service (IFIS), the Islamic Development Bank (IDB) and Zawya.

11
banks (207 conventional and 45 Islamic) across 18 countries12 are extracted from the consolidated
data in US dollars (USD) having been converted from own currencies by end of accounting year
exchange rates. In addition, all variables are deflated to 2005 prices using appropriate deflators13.
Both banking sectors (conventional and Islamic) in the sample countries are required to follow
national and international regulatory requirements under the supervision of the banking authorities
of their host country, and both bank types adhere to the same accounting standards (Alexakis and
Tsikouras 2009). Thus data should be consistent across the two bank types, but any discrepancy in
practice (for example, Islamic banks must also conform to the requirements of the Shariah
supervisory board) is allowed for in the first stage by the use of DEA.
4.1 First stage analysis: estimation of efficiencies
The choice of variables qualifying for the DEA model is guided by previous literature and data
availability. We assume that banks perform an intermediary role between borrowers and depositors
(Pasiouras 2008) and that they use i) deposits and short term funding, ii) fixed assets, iii) general and
administration expenses and iv) equity as inputs to produce i) total loans and ii) other earning assets.
Islamic banks do not offer loans in the same way as conventional banks, and so the term ‘total
loans’ is a generic term used to encompass the equity financing products they use. Conventional
banks earn money from the spread between lending interest and borrowing interest rates. Islamic
banks have a similar spread which is defined in terms of profit share ratios between the
entrepreneurs (borrowers) and the depositors (lenders).
Fixed assets are included to represent capital input, while general and administration expenses
are used as a proxy for labour input. While it may not be a perfect reflection of labour input, it is
more easily available than better measures (e.g. employee numbers or expenditure on wages) and
has been used in previous studies (e.g. Drake and Hall 2003) where it is argued that personnel
expenses make up a large proportion of general and administration expenses.
12 The countries are: Bahrain; Bangladesh; Brunei; Egypt; Indonesia; Jordan; Kuwait; Malaysia; Mauritania; Pakistan; Palestine; Qatar; Saudi Arabia; Sudan; Tunisia; Turkey; United Arab Emirates; Yemen. Details of the number and type of banks included in the sample and population can be found here: http://www.lancs.ac.uk/people/ecajj/1islamicbanking2013.htm. 13These were calculated using data from World Development Indicators (WDI) and Global Development Finance (GDF).

12
It has been suggested that an indicator of risk-taking should explicitly be incorporated into any
model of banking efficiency (Charnes et al. 1990), and this aspect is likely to be particularly
important in a context which compares Islamic and conventional banks where one would expect a
difference in risk-taking behaviour (Sufian 2006). There are several suggestions of measures of risk-
taking activity. Some studies use off-balance sheet items (Pasiouras 2008; Lozano-Vivas and
Pasiouras 2010) but this variable has the disadvantage that data are not widely available and the
sample is consequently severely reduced by its inclusion. Other studies use equity which is more
widely available; moreover bank attitudes to holding equity have responded quickly to changes in
the financial climate, and this makes it particularly attractive in a study which encompasses a period
of financial crisis. Indeed, equity has been used to reflect risk in previous studies which have covered
times of financial crisis: the East Asian crisis (Abdul-Majid et al. 2008), and the savings and loans
crisis in the USA (Alam 2001). We therefore feel that the variable equity captures the general
attitudes towards risk (enforced or preferred) of the two types of banks over the period, and use it
to reflect risk in our own study.
Descriptive statistics of the DEA variables are presented in table 2. Over the whole period of
study, the typical conventional bank has just over US $6000 million in total loans and US $2500
million in other earning assets. These are 1.5 and 3 times the values for Islamic banks (respectively).
There has been growth in these output variables in both banking sectors over the period but this has
slowed down (understandably given the world economic climate) towards the end of the period14.
Input variables are typically up to twice as big in the conventional compared to the Islamic banking
sector.
[Table 2 here]
4.2 Second stage analysis: determinants of efficiency
In a second stage, an investigation of the possible determinants of the different types of
efficiency scores (gross, net and type) of the banks is undertaken. We consider two broad
categories: the characteristics of the individual banks, and the banking context, over which
14 See http://www.lancs.ac.uk/people/ecajj/1islamicbanking2013.htm for further details.

13
managers have no control, and which is particularly relevant in cross-country studies (Dietsch and
Lozano-Vivas 2000; Lozano-Vivas et al. 2002). The proposed explanatory variables and their potential
impact are discussed below. The effects of these variables have not all been explored in an Islamic
banking context and so we draw on the conventional banking literature for inspiration in choosing
variables. We consider eight variables to reflect bank-level characteristics.
A binary variable to reflect whether or not the bank is classified by Bankscope as fully-fledged
Islamic (ISLAMIC). This variable is included in the second stage to assess whether any differences
in efficiency between the two types of banks remain after the economic environment and the
bank’s own characteristics have been taken into account.
A dummy variable to reflect whether the bank is listed on the stock market (LIST) and an
interaction term between ISLAMIC and LIST (ISLIST). Listing on the stock market has been found
to have a positive effect on efficiency in the context of conventional banks in Europe (Casu and
Molyneux 2003) but a negative effect in the context of Islamic banks (Yudistira 2004) – hence
the inclusion of both the listing dummy and interaction term.
The value of a bank’s total assets (ASSETS). Value of total assets15 is included to reflect bank size.
Islamic banks are typically smaller than conventional banks and so it might be size which causes
any observed differences in efficiency. Indeed, cost efficiency appears to be negatively related to
size in the context of Islamic banks (Beck et al. 2013). We check for a non-linear relationship
between efficiency and size by also including the square of ASSETS (ASSETSSQ).
The ratio of loan loss reserves to loans (LOANLOSS/LOANS). This variable acts as a proxy for
credit risk (the higher the loan loss reserves ratio the lower the credit risk). In managing
increasing credit risk, banks may incur additional expenses to monitor their loans (Barajas et al.
1999) which might lead to lower efficiency; on the other hand, a lower ratio has been associated
with increased profit margins (Miller and Noulas 1997) and this may lead in turn to higher
efficiency. Islamic and conventional banks may well manage credit risk differently, and this
variable is included to capture any potential effect of that possibility. Previous evidence, derived
15 Note that this variable (total assets) is distinctive from the variable fixed assets included in the first stage DEA.

14
from an analysis of conventional banks, finds no significant relationship between the ratio of
loan loss reserves to loans and efficiency (Staikouras et al. 2008).
The ratio of total loans to total assets (LOANS/ASSETS) and the ratio of net loans to total assets
(NETLOANS/ASSETS). Total loans is the sum of reserves for impaired loans (relative to non-
performing loans) and net loans. By including both variables we obtain the effect on efficiency of
the components of total loans. Thus the sum of the coefficients on these two variables will
reflect the effect on efficiency of net loans (relative to total assets), and the coefficient on
LOANS/ASSETS will indicate the effect on efficiency of the value of reserves for impaired loans
(relative to non-performing loans): the greater are these reserves, the higher is the bank’s
liquidity and hence the lower its exposure to defaults; on the other hand, the lower are the
reserves, the higher are potential returns. Thus the potential overall effects of
NETLOANS/ASSETS and LOANS/ASSETS on efficiency are unclear, a priori, although previous
research has suggested a positive relationship between liquidity and efficiency in both Islamic
and European banks (Hasan and Dridi 2010).
We consider five variables – sourced from World Development Indicators (WDI) and Global
Development Finance (GDF) databases – to reflect the overall banking environment.
The normalised Herfindahl index (HHI). This variable reflects the competitive environment of
each country’s banking sector. The index is calculated using all the banks (contained in
Bankscope16) for a given country and hence assumes that Islamic and conventional banks
compete against each other17. The ‘quiet life’ theory suggests that increased industry
concentration is related to lower technical efficiency as there is little incentive to be efficient
when competition is low (Berger and Mester 1997). The ‘efficiency hypothesis’, on the other
16The normalized Herfindahl index is where HI is the Herfindahl index, calculated using market
shares (based on total assets) at year end, and N is the number of firms (Bikker and Haaf 2002; Čihák and Hesse 2010). The normalised Herfindahl index ranges from 0 to 1 and gives lower rankings than the original Herfindahl index for industries with small number of firms (Busse et al. 2007). It is therefore more appropriate in the present context. Bankscope is not entirely comprehensive in its coverage, but omitted banks are likely to be small and hence the HHI calculated on this basis should adequately reflect the competitive environment. 17 This is justified on the grounds that Islamic banking products increasingly appeal to non-Muslim customers; and large ratings agencies are getting involved in Islamic finance (Alexakis and Tsikouras 2009; Arthur D Little Report 2009).

15
hand, argues that concentration and efficiency are positively related. There is evidence from
previous studies in the context of conventional banks to support both the ‘quiet life’ theory
(Yudistira 2004; Staikouras et al. 2008) and the ‘efficiency hypothesis’ (Dietsch and Lozano-Vivas
2000; Koutsomanoli-Filippaki et al. 2009).
The degree of market capitalization i.e. the percentage valuation of listed firms across all sectors
relative to the country’s GDP (MCAP). This is included to reflect the level of stock market activity
in the economy, and its possible effect on bank efficiency is unknown a priori.
Growth in real GDP (GDPGR) and Inflation (INF). These variables are included to capture the
buoyancy of the economy in which the bank is located. While their precise effects are unknown
a priori, previous evidence, derived from studies of conventional banks, has shown a positive
relationship between GDP growth and banking efficiency (Staikouras et al. 2008; Awdeh and El
Moussawi 2009).
Per capita GDP (GDPPC). This variable reflects the level of institutional development and the
supply and demand conditions in the market in which the bank is located. While previous
evidence based on conventional banks has shown a positive relationship between per capita
income and costs (Dietsch and Lozano-Vivas 2000), the precise effect of this variable on
efficiency is ambiguous a priori.
We include additional variables to reflect the time and regional dimensions of the data.
Year dummies are included to allow for changes in banking efficiency over time; these are used
in preference to a trend variable to allow for different effects on efficiency in different years.
These dummies may also pick up the effect on efficiency of any idiosyncratic (year by year)
changes in data recording or bank behaviour. In addition the interactions between the Islamic
dummy and year dummies are included to examine whether Islamic and conventional banks
have experienced different effects on their efficiency over the time period.

16
Region dummies are included to allow for differences in efficiency between three broad
regions18. Historically, there has been some diversity between countries in interpretation of
Shariah law which might impact on efficiency, although more recently countries have been
seeking common ground (Warde 2010).
We estimate, using random effects, with heteroscedasticity-corrected standard errors, the
following equation:
where: , represents banks; represents time; represents
country; represents region; and . The dependent variable denotes efficiency
and separate equations are estimated for gross, net and type efficiency respectively; is the
intercept term and denotes the mean of the unobserved heterogeneity; is the
random heterogeneity specific to the nth bank and is constant over time; and is
uncorrelated over time; is an Nx8 matrix of bank-level explanatory variables (see section 4.2);
is an Nx5 matrix of country-level explanatory variables (see section 4.2); is an Nx2 matrix of
regional-level dummies (see footnote 10); is an Nx10 matrix of year dummies, and year and
Islamic interaction dummy variables.
Descriptive statistics of the variables included in the second stage analysis are presented in table
3. There are clear differences between Islamic and conventional banks in terms of these variables.
Most notably Islamic banks are much smaller (less than half the size) and, through their country
location, they face a much higher (nearly double) per capita GDP than their conventional
counterparts.
[Table 3 here]
5. Results
5.1 First stage results
18 The regions are: Middle East and North Africa (MENA) = Egypt, Jordan, Mauritania, Palestine, Sudan, Tunisia, Turkey, Yemen; Gulf Cooperating Council (GCC) = Bahrain, Kuwait, Qatar, Saudi Arabia, United Arab Emirates; Asia = Bangladesh, Brunei, Indonesia, Malaysia, Pakistan. GCC and ASIA are the dummy variables included in the equation.

17
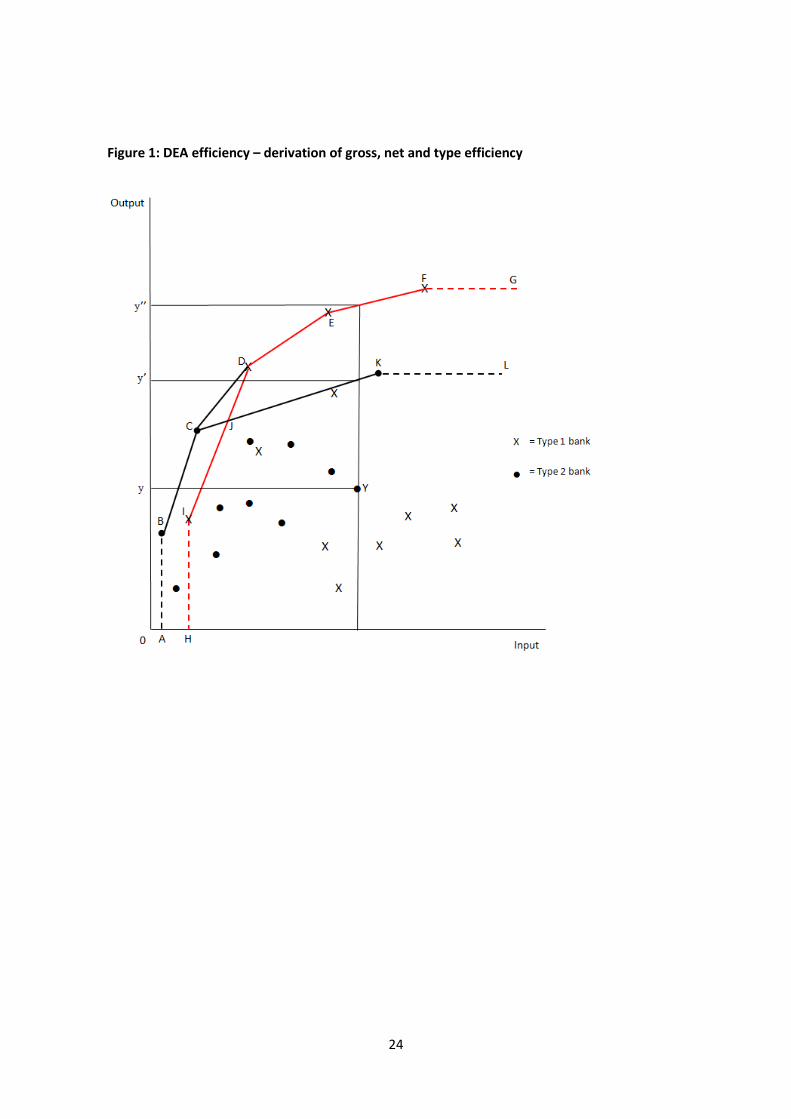
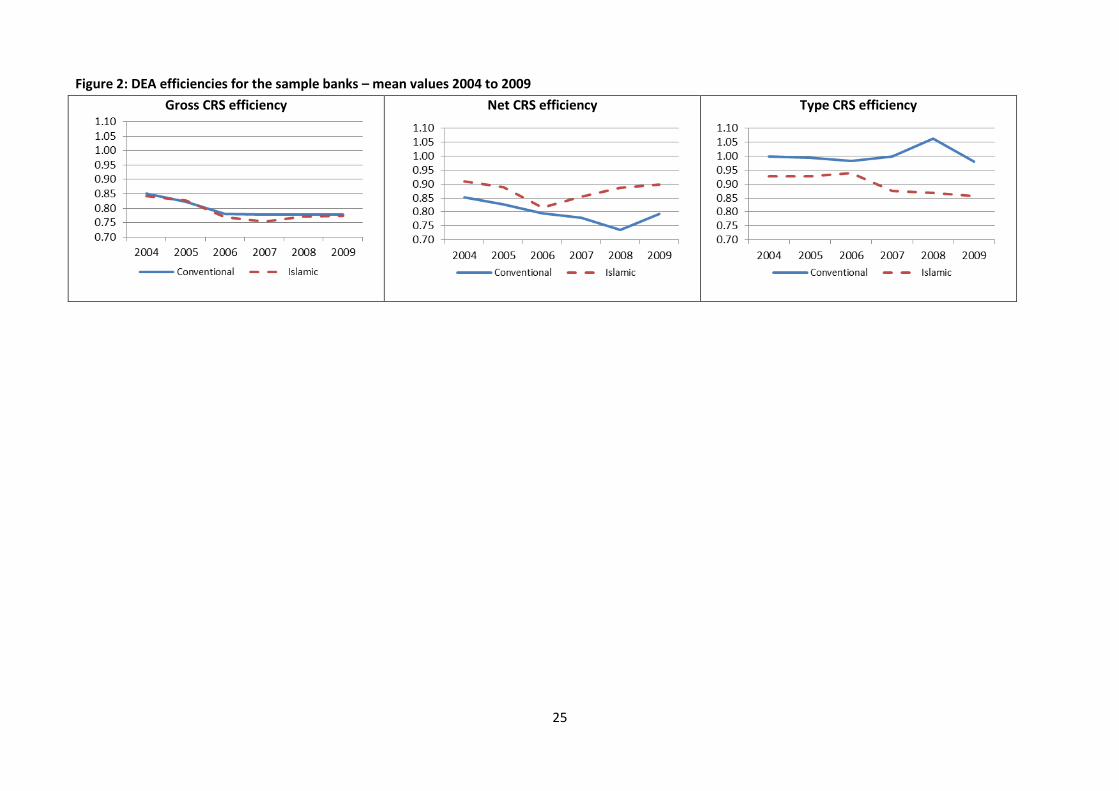
Bias-corrected19 DEA efficiencies, calculated using an output-oriented constant returns to scale
(CRS) approach, on the assumption that production conditions vary over time20, are reported in table
4 and displayed in figure 2. We discuss the findings in the context of, respectively, gross efficiency,
type efficiency and net efficiency as defined in section 3.
[Table 4 here]
[Figure 2 here]
In terms of gross efficiency there is no evidence to suggest significant differences in mean
efficiency levels between conventional and Islamic banks. Thus, when measured against a common
frontier, each type of bank typically has the same level of efficiency.
In the context of type efficiency, we see that conventional banks have higher efficiency, on
average, than the Islamic banks, and this difference is significant in all years of the study. These
results provide clear evidence that the Islamic banking system is less efficient than the conventional
one. This is in line with conclusions from earlier studies derived using SFA and DEA (Abdul-Majid et
al. 2008; Johnes et al. 2009; Abdul-Majid et al. 2011a). The fact that the Islamic banking modus
operandi is less efficient than its conventional counterpart comes as no surprise for a number of
reasons. First, an Islamic bank operates mainly with customised contracts which are either equity-
type (profit and loss sharing) or services-type (leasing agreements, mark-up pricing sale). These
contracts are tailor-made as many of the relevant parameters (such as maturity, repayments and
collateral) are client-specific. The bank, as the financer, needs to conduct a feasibility and
profitability analysis for equity-type contracts; this is costly and time-consuming, depending on
nature and size of project. Second, an Islamic bank needs to seek approval for its financial products
from the Shariah board of the bank. This is done for every Islamic bond issue (sukuk) and also for the
majority of equity-based contract; exceptions are fee-based contracts which tend to be more
19 Results calculated without bootstrapping can be found here http://papers.ssrn.com/sol3/papers.cfm?abstract_id=2071615. 20 This means that the DEA is performed for each year separately. Given the expanding populations and markets in many of the sample countries, this is likely to be a valid assumption. For comparison, the efficiencies were also generated on the assumption that production conditions do not vary over time. In practical terms, this means that the DEA is performed on the pooled data. Broad conclusions are identical to those reported here.

18
standardised and hence rarely require the approval of the Shariah board. Thus Islamic banks incur
greater administration costs and higher operational risk than conventional banks.
Turning now to net efficiency, Islamic banks consistently have higher average levels of efficiency
than conventional banks and the differences are largely significant over time. Thus, when banks are
measured against their own frontier, Islamic banks are more efficient, on average, than conventional
banks. The implication of this finding is that managers of Islamic banks appear to make up for the
inefficiencies arising from modus operandi (evident from the type efficiency results) by being more
efficient than their counterparts in conventional banks. We return to this in the following section.
The above results can be illustrated in a simple banking model by referring back to figure 1. The
conventional banks are most closely represented by the crosses in figure 1. The gross efficiency
frontier is mainly (but not exclusively) determined by crosses – i.e. conventional banks. But a large
number of conventional banks are highly inefficient and lie at some distance from the gross (and
net) efficiency frontiers. In contrast, relatively few Islamic banks determine the gross efficiency
frontier, but many of them lie close to the gross (and net) efficiency frontiers with only a few being
highly inefficient. The average gross efficiency score is therefore similar for the two types of banks,
but the net efficiency score is much higher, on average, amongst Islamic banks compared to
conventional banks.
The composition of banks forming the gross efficiency frontier (dominated by conventional
banks) combined with the location of the different types of inefficient banks is such that the peer
groups of both Islamic and conventional banks are likely to be dominated by conventional banks. An
examination of the peers from the DEA generally confirms this finding. There is a subtle difference
between the two groups however: for the study period as a whole, the composition of the peer
group of a typical inefficient Islamic bank is 38% Islamic banks, and 62% conventional banks; for a
typical inefficient conventional bank the percentages are 32% and 68% respectively.
5.2 Second stage results
Table 5 presents the results of the second stage analysis, the main finding of which is that, having
taken into account a range of macroeconomic and bank-level variables, the distinctions between

19
Islamic and conventional banks found in section 5.1 still remain. Thus there is no significant
difference between Islamic and conventional banks in terms of gross efficiency; the net efficiency of
Islamic banks is significantly higher (by 0.08) than in conventional banks, while type efficiency is
lower (by 0.07) for Islamic banks than conventional banks. The Islamic method of banking results in
lower efficiency than conventional banking (as indicated by type efficiency), but the managers of the
Islamic banks make up for this disadvantage (as indicated by net efficiency), and this is the case even
after taking into account other contextual and bank-level characteristics. The efforts of the
managers of Islamic banks in terms of recouping efficiency lost due to modus operandi is an
interesting finding and is in contrast to reports from the late 1990s which suggested that managers
of Islamic banks were lacking in training (Iqbal et al. 1998).
It seems therefore that the expansion of demand for Islamic financial products has coincided with
an improvement in managerial efficiency. We need to look at how Islamic banks have responded to
the increase in customer base in order to understand why this has happened. Operating with tailor-
made financial products (as in Islamic banks) requires considerable human input, and so, as demand
has increased, Islamic banks have spent more on human resources than conventional banks
(Pellegrina 2008). In addition, Islamic banks have generally opted to specialize in some key financial
products as demand has increased rather than to offer a full array of products and services (Garbois
et al. 2012). Thus managers can focus and become experts on a limited range of products. A final
reason for improved managerial performance is that the expansion in demand has led to Islamic
banking products becoming generally better understood in recent years (and specifically over the
period of the study) as a consequence of, for example, marketing campaigns21.
Other reasons for the apparent discrepancy in performance between Islamic and conventional
bank managers might include remuneration systems and project viability. Remuneration of
managers in conventional banks comprises a fixed element (salary) and variable components
(shares, bonuses and other benefits). Most recently, bonuses have been criticized for being attached
to short-term goals. It is to be expected that managers focus upon goals to which bonuses are 21 To this end, Bank Syariah Mandiri in Indonesia sponsors documentaries on Islamic finance while Emirates Bank in the UAE waives loan payments during Ramadan as part of marketing campaigns (Bloomberg).

20
attached, and these are usually quantity-oriented (i.e. the number of loans) rather than quality-
oriented (i.e. viability of the project). Here, the long investment horizon of conventional financial
products, which can be up to 20 or 30 years, could be an impediment to the manager’s focus and
judgment of the pecuniary worth. Bonuses are not part of the Islamic banking culture22. It is also
plausible that the shorter horizon of financial projects in Islamic banks alongside the personalized
services (i.e. custom-based contracts) force managers to perform more efficiently, although we have
no evidence to support this contention.
[Table 5 here]
Some other results in table 5 are worthy of further discussion. A number of variables are
significant in explaining gross and net but not type efficiency. Increasing size initially decreases gross
and net efficiency but beyond an asset value of around $40 billion gross and net efficiency tend to
increase with size. Given that mean size is around $7 billion, many banks (and nearly all Islamic
banks) experience the negative relationship between gross and net efficiency and size.
The ratio of total loans to total assets and the ratio of net loans to total assets are the two
remaining bank-level variables which significantly affect gross and net efficiency, the former
positively and the latter negatively. These results need to be considered together since total loans
are the sum of net loans and reserves for impaired loans (relative to non-performing loans). Thus the
coefficient on the ratio of total loans to total assets reflects the effect of holding reserves for
impaired loans on efficiency: in this case the higher the reserves (and hence the higher the
protection for the bank from bad loans) the higher are gross and net efficiency. This suggests that
banks which behave prudently in terms of insuring against bad loans reap rewards in terms of higher
gross and net efficiency. The sum of the two coefficients suggests that the size of net loans (relative
total assets) has little effect on gross and net efficiency.
Three macroeconomic (country-level) variables are significant in the net and gross efficiency
equations at the 10% significance level. First, the significantly negative coefficient on HHI provides
22 For example, the Gulf Finance House in Bahrain does not give any form of performance related bonuses (Gulf Finance House Annual Report, 2010). The Dubai Islamic Bank gave bonuses that amounted to less than 0.1% of the total staff expenses in 2011 (Dubai Islamic Bank Annual Report, 2011).

21
support for the ‘quiet life’ hypothesis. Second, a higher level of market capitalization (and hence
stock market activity) leads to lower gross and net efficiency. Third, increasing GDP growth is
associated with higher efficiency (gross and net) as expected.
The two dummy variables to reflect geographical region are also significant with banks in the
Asian region having higher gross and net efficiency (than banks in MENA) by 0.04, and banks in the
GCC having lower efficiency (than banks in MENA) by around 0.08. We speculate that the size of
population may account for such regional differences: Asia has the largest population, followed by
the MENA region, and then by the GCC. It is possible that higher demand for banking products in the
highly populated region leads to greater standardization of products, and the possibility of reaping
economies of scale. The opposite may be the case for the smallest region. Further research is
necessary to confirm these conjectures.
Finally, year fixed effects indicate that, compared with the first year of the study (2004) all years
have seen significantly lower gross efficiency, with 2006 and 2008 seeing the worst performance.
This pattern is the same for conventional and Islamic banks. The time pattern of net efficiency, on
the other hand, differs between the two types of banks. Conventional banks have seen increasing
falls in net efficiency (relative to 2004) with the nadir being in 2008; there is an improvement in
2009, but the position is still low relative to 2004. Islamic banks have experienced a similar pattern in
net efficiency between 2005 and 2008 – Islamic banks have seen a slightly bigger (smaller) fall in
2006 (2008) compared to conventional banks – but 2009 reveals a significant difference between
the two types in that Islamic banks have seen a rise in net efficiency relative to 2004. Managers of
Islamic banks seem therefore to have coped with the recent financial crisis better than managers of
conventional banks (as signalled by the net efficiency results). However, the crisis seems to have had
a more adverse effect on type efficiency in Islamic than conventional banks: thus the efficiency
disadvantage of operating under Islamic rules appears to have become greater over the period of
crisis..
6. Conclusion

22
Our purpose in this paper has been to compare efficiency, using DEA, amongst a sample of
Islamic and conventional banks located in 18 countries over the period 2004 to 2009. The DEA
results provide evidence that there are no significant differences in gross efficiency (on average)
between conventional and Islamic banks. This result is in line with a number of previous studies (El-
Gamal and Inanoglu 2005; Mokhtar et al. 2006; Bader 2008; Hassan et al. 2009).
By using a non-parametric MFA we have been able to decompose gross efficiency into two
components: net efficiency provides a measure of managerial competence, while type efficiency
indicates the effect on efficiency of modus operandi, and by doing this we have discovered that the
result of no significant difference in gross efficiency between banking types conceals some
important distinctions. First, the type efficiency results provide strong evidence that Islamic banking
is less efficient, on average, than conventional banking. Second, net efficiency is significantly higher,
on average, in Islamic compared to conventional banks suggesting that the managers of Islamic
banks are particularly efficient given the rules by which they are constrained. The apparent
inefficiency of the Islamic banking system is counterbalanced by the efficiency of the managers of
Islamic banks.
We investigate, in a second stage analysis, the determinants of gross, net and type efficiency in
order to provide more information to managers and policy-makers regarding ways of improving
performance. The main finding is that the distinctions between Islamic and conventional banks in
terms of net and type efficiency are observed even after taking into account other banking and
macroeconomic factors.
Each type of banking could therefore learn from the other. Islamic banks need to look at the
conventional banking system for ideas on how to make their own system more efficient. An obvious
possibility would be to standardize their portfolio of products as in conventional and the larger
Islamic banks. Conventional banks need to examine the managerial side of Islamic banking for ideas
on how to improve the efficiency of their own managers. If there is little difference in the inherent
ability or the training of managers in each type of bank, then other aspects, such as the
remuneration systems and project viability might hold the key.

23
The second stage analysis finds that the relationship between efficiency and bank size is
quadratic, and most banks in the sample are operating on the downward sloping part of the
function. Managers should also take note of the beneficial effects on efficiency of prudent behaviour
in terms of holding reserves relative to non-performing loans.
In a period of financial turmoil, the banks in this sample have typically suffered falls in their gross
efficiency relative to the start of the period. The year 2008 had a particularly bad impact on gross
efficiency, but there has been a limited recovery in 2009. An examination of the components of
gross efficiency indicates, however, that the managers of Islamic banks have coped with the crisis
better than those of conventional banks (based on the results for net efficiency), but that the gap
between the conventional and Islamic frontiers has widened during this same period (based on
results for type efficiency). This implies that the efficiency advantage of the conventional over the
Islamic operating system has increased during the period of financial turmoil, suggesting that a shift
to a more standardized process would help Islamic banks to maintain efficiency in the face of future
crises.
These are important results but rely on the validity of the sectoral-level approach taken here.
Future studies at the sectoral level would benefit from the use of extended data sets and alternative
estimation methods which allow for unbalanced panel data. In addition, case studies into selected
banks could offer insights into why managers of Islamic banks appear to perform more efficiently
than those of conventional banks, and would complement the econometric analyses of bank level
data.
24
Figure 1: DEA efficiency – derivation of gross, net and type efficiency
25
Figure 2: DEA efficiencies for the sample banks – mean values 2004 to 2009
Gross CRS efficiency
Net CRS efficiency
Type CRS efficiency

26
Table 1: Islamic banking efficiency studies (frontier estimation approach)
Context Method Studies
No significant difference in efficiency between Islamic and conventional banks
21 countries: Algeria; Bahrain; Bangladesh; Brunei; Egypt; Gambia; Indonesia; Jordan; Kuwait; Lebanon; Malaysia; Pakistan; Qatar; Saudi Arabia; Senegal; Tunisia; Turkey; Yemen; Sudan; Iran; United Arab Emirates
DEA (Bader 2008)
11 countries: Egypt; Bahrain; Tunisia; Jordan; Kuwait; Lebanon; Qatar; Saudi Arabia; Turkey; United Arab Emirates; Yemen
DEA (Hassan et al. 2009)
5 countries: Bahrain; Kuwait; Qatar; UAE; Singapore DEA (Grigorian and Manole 2005)
Malaysia SFA (Mokhtar et al. 2006)
Turkey SFA (El-Gamal and Inanoglu 2005)
Islamic banks are significantly more efficient than conventional banks
GCC: Bahrain; Kuwait; Oman; Qatar; Saudi Arabia; UAE DEA (Al-Muharrami 2008)
Islamic banks are significantly less efficient than conventional banks
GCC: Bahrain; Kuwait; Oman; Qatar; Saudi Arabia; UAE SFA (Srairi 2010)
Malaysia DEA (Mokhtar et al. 2007; 2008)
Islamic banks have (significantly) lower efficiency than conventional banks and it is predominantly a consequence of modus operandi rather than managerial inadequacies
10 countries: Bahrain; Bangladesh; Indonesia; Iran; Jordan; Lebanon; Malaysia; Sudan; Tunisia; Yemen;
SFA (Abdul-Majid et al. 2010)
GCC: Bahrain; Kuwait; Oman; Qatar; Saudi Arabia; UAE DEA (Johnes et al. 2009)
Malaysia SFA (Abdul-Majid et al. 2008; 2011a; 2011b)
The efficiency of Islamic and conventional banks is compared, but the significance of any difference is not tested
Cross-country: Conventional banks in the USA and randomly drawn Islamic banks
DEA (Said 2012)
4 countries: Jordan; Egypt; Saudi Arabia; Bahrain SFA (Al-Jarrah and Molyneux 2005)
Bahrain SFA (Hussein 2004)
Studies of Islamic banks only
21 countries: Algeria; Bahamas; Bahrain; Bangladesh; Brunei; Egypt; Gambia; Indonesia; Iran; Jordan; Kuwait; Lebanon; Malaysia; Mauritania; Qatar; Saudi Arabia; Sudan; Tunisia; UAE; UK; Yemen
SFA DEA
(Hassan 2005; 2006)
16 countries: Bahrain; Bangladesh; Egypt; Gambia; Indonesia; Iran; Kuwait; Malaysia; Pakistan; Saudi Arabia; Turkey; UAE; Qatar; South Africa; Sudan; Yemen
DEA (Sufian 2009)
12 countries: Algeria; Bahrain; Egypt; Gambia; Indonesia; Jordan; Kuwait; Malaysia; Qatar; Sudan; UAE; Yemen
DEA (Yudistira 2004)
13 countries: Algeria; Bahrain; Bangladesh; Brunei; Egypt; Indonesia; Jordan; Kuwait; Malaysia; Qatar; Sudan; UAE; Yemen
DEA (Viverita et al. 2007)
14 countries: Algeria; Bahamas; Bangladesh; Bahrain; Brunei; Egypt; Jordan; Kuwait; Malaysia; Qatar; Saudi Arabia; Sudan; UAE; Yemen
DEA (Brown 2003)
GCC: Bahrain; Kuwait; Oman; Qatar; Saudi Arabia; UAE DEA (Mostafa 2007; El Moussawi and Obeid 2010; 2011; Mostafa 2011)
Malaysia DEA (Sufian 2006*; 2006/2007*; 2007*; Kamaruddin et al. 2008)
Sudan SFA (Hassan and Hussein 2003; Saaid et al. 2003; Saaid 2005)
*The study includes both fully-fledged Islamic banks and conventional banks with Islamic windows.

27
Table 2: Descriptive statistics for the DEA input and output variables
Conventional Islamic All
All Years Mean Median SD Mean Median SD Mean Median SD Deposits and short-term funding 5638 1551 9113 2370 799 4584 5061 1362 8581 Fixed assets 95 28 291 66 15 186 90 25 276 General and administrative expenses 156 42 426 68 29 113 141 38 391 Equity 1163 615 1312 880 561 925 1113 601 1257 Total loans 6120 3453 5835 4306 2954 3850 5799 3338 5579 Other earning assets 2587 584 5012 875 313 1556 2285 518 4641 Note: All variables are reported in US $ millions at 2005 prices. The number of observations in each year is 45 Islamic banks and 210 conventional banks.
Table 3: Descriptive statistics for the second stage explanatory variables
Conventional Islamic All
All Years Mean Median SD n Mean Median SD n Mean Median SD n ASSETS 8.090 2.245 13.435 1260 3.619 1.275 7.004 270 7.301 1.941 12.656 1530
LOANLOSS/LOANS 6.126 3.510 7.067 1234 5.248 3.542 6.908 221 5.993 3.530 7.048 1455 LOANS/ASSETS 0.533 0.560 0.173 1260 0.473 0.510 0.223 269 0.522 0.550 0.184 1529
NETLOANS/ASSETS 0.536 0.559 0.162 1260 0.472 0.504 0.222 269 0.525 0.552 0.175 1529 HHI 0.136 0.101 0.080 1260 0.181 0.155 0.103 270 0.144 0.104 0.086 1530
MCAP 113.235 89.950 105.870 1194 91.416 69.815 93.375 216 109.893 89.950 104.319 1410 GDPGR 5.701 5.850 3.393 1260 6.381 6.180 4.051 270 5.821 5.930 3.526 1530
INF 8.874 8.550 6.712 1260 9.832 10.390 7.711 270 9.043 8.790 6.906 1530 GDPPC 7.815 1.543 12.496 1256 15.023 6.929 15.928 266 9.075 2.625 13.436 1522
Note: ASSETS is in US $ billions at 2005 prices; GDPPC is in US $ thousands at 2005 prices. The number of observations in each year varies because of data availability.
28
Table 4: First stage DEA results by year for all countries – mean and median values
GROSS NET TYPE
Conventional Islamic ALL Conventional Islamic ALL Conventional Islamic ALL
Pooled Mean 0.798 0.789 0.796 0.797 0.876 0.811 1.000 0.899 0.984 P value (t test) 0.295 0.000** 0.000**
Median 0.810 0.812 0.810 0.809 0.917 0.827 0.999 0.922 0.997 P value (MW) 0.716 0.000** 0.000**
P value (KS) 0.134 0.000** 0.000**
2004 Mean 0.850 0.842 0.849 0.852 0.909 0.862 0.998 0.927 0.986 P value (t test) 0.608 0.000** 0.000** Median 0.875 0.870 0.872 0.875 0.952 0.886 1.000 0.944 1.000 P value (MW) 0.456 0.000** 0.000** P value (KS) 0.490 0.000** 0.000**
2005 Mean 0.822 0.826 0.823 0.827 0.889 0.838 0.995 0.929 0.983 P value (t test) 0.802 0.000** 0.000** Median 0.845 0.867 0.848 0.854 0.933 0.863 0.997 0.941 0.996 P value (MW) 0.689 0.000** 0.000** P value (KS) 0.742 0.000** 0.000**
2006 Mean 0.781 0.768 0.779 0.795 0.816 0.799 0.982 0.939 0.974 P value (t test) 0.511 0.234 0.000** Median 0.797 0.801 0.798 0.809 0.853 0.817 0.987 0.935 0.984 P value (MW) 0.780 0.101 0.000** P value (KS) 0.363 0.015** 0.000**
2007 Mean 0.778 0.753 0.774 0.779 0.855 0.793 0.999 0.875 0.977 P value (t test) 0.300 0.000** 0.000** Median 0.797 0.805 0.797 0.799 0.892 0.812 0.999 0.896 0.998 P value (MW) 0.360 0.000** 0.000** P value (KS) 0.411 0.000** 0.000**
2008 Mean 0.777 0.772 0.777 0.735 0.887 0.762 1.063 0.868 1.028 P value (t test) 0.807 0.000** 0.000** Median 0.779 0.806 0.784 0.723 0.947 0.745 1.050 0.871 1.031 P value (MW) 0.967 0.000** 0.000** P value (KS) 0.816 0.000** 0.000**
2009 Mean 0.777 0.773 0.776 0.793 0.898 0.812 0.980 0.858 0.958 P value (t test) 0.825 0.000** 0.000** Median 0.779 0.805 0.781 0.804 0.950 0.826 0.994 0.860 0.986 P value (MW) 0.965 0.000** 0.000** P value (KS) 0.789 0.000** 0.000**

29
** = significant at 5% significance level; * = significant at 10% significance level; t test tests the null hypothesis that the means of the two samples are equal (equal variances are not assumed); MW (Mann Whitney U test) tests the null hypothesis that the two samples are drawn from the same distributions (against the alternative that their distributions differ in location); KS (Kolmogorov-Smirnov 2-sample test) tests the null hypothesis that the two samples are drawn from the same distributions (against the alternative that their distributions differ in location and shape)
Table 5: Second stage results
GROSS NET TYPE
coeff z P>|z| coeff z P>|z| coeff z P>|z| ISLAMIC 0.006 0.350 0.724 0.081 4.640 0.000 -0.069 -5.600 0.000
LIST -0.016 -1.570 0.116 -0.013 -1.280 0.201 -0.003 -0.960 0.335 ISLAMIC*LIST -0.028 -1.360 0.173 -0.018 -0.910 0.364 -0.033 -2.310 0.021
ASSETS -0.004 -4.730 0.000 -0.004 -4.760 0.000 0.000 -0.990 0.324 ASSETSSQ 0.000 5.340 0.000 0.000 5.270 0.000 0.000 2.320 0.021
LOANLOSS/LOANS 0.001 2.550 0.011 0.001 1.880 0.061 0.000 0.900 0.368 LOANS/ASSETS 0.425 5.830 0.000 0.373 9.030 0.000 0.080 5.020 0.000
NETLOANS/ASSETS -0.426 -5.320 0.000 -0.383 -7.510 0.000 -0.066 -3.520 0.000 HHI -0.117 -1.970 0.049 -0.108 -1.760 0.079 0.026 1.030 0.304
MCAP 0.000 -3.610 0.000 0.000 -4.060 0.000 0.000 -1.340 0.181 GDPGR 0.002 1.980 0.048 0.002 2.890 0.004 -0.001 -1.260 0.209
INF 0.000 -1.370 0.171 0.000 -1.010 0.315 0.000 -0.280 0.778 GDPPC 0.001 0.760 0.449 0.001 1.120 0.263 0.000 0.030 0.974
ASIA 0.036 2.950 0.003 0.032 2.730 0.006 0.008 1.800 0.071 GCC -0.075 -2.910 0.004 -0.077 -3.420 0.001 -0.001 -0.170 0.868
2005 -0.018 -4.660 0.000 -0.016 -4.100 0.000 -0.002 -1.240 0.216 2006 -0.059 -10.680 0.000 -0.046 -8.380 0.000 -0.016 -7.900 0.000 2007 -0.051 -6.570 0.000 -0.051 -6.860 0.000 0.002 1.340 0.180 2008 -0.058 -8.500 0.000 -0.103 -14.890 0.000 0.065 9.240 0.000 2009 -0.053 -6.970 0.000 -0.036 -4.900 0.000 -0.023 -6.020 0.000
ISLAMIC*2005 0.021 1.730 0.084 0.005 0.370 0.709 0.015 1.540 0.123 ISLAMIC*2006 -0.003 -0.240 0.809 -0.045 -2.670 0.008 0.039 2.750 0.006 ISLAMIC*2007 -0.009 -0.490 0.621 0.012 0.710 0.479 -0.035 -2.170 0.030 ISLAMIC*2008 0.011 0.700 0.483 0.095 5.630 0.000 -0.114 -6.650 0.000 ISLAMIC*2009 0.008 0.480 0.633 0.052 3.050 0.002 -0.050 -3.280 0.001
CONSTANT 0.877 40.220 0.000 0.878 41.800 0.000 0.992 108.870 0.000
No. of observations 1353 1353 1353 No. of groups 232 232 232
Overall R2 0.303 0.377 0.364
Wald 756.470 1302.320 594.160
Prob > 0.000 0.000 0.000
Notes: The model is estimated using bank random effects; standard errors are heteroscedasticity adjusted. Italics denote significant at 10% significance level.
30
REFERENCES
Abdul-Majid, M., N. G. Mohammed Nor and F. F. Said (2005a). Efficiencies of Islamic banks in Malaysia. International Conference on Islamic Banking and Finance, Bahrain,2005.
Abdul-Majid, M., N. G. Mohammed Nor and F. F. Said (2005b). 'Efficiency of Islamic banks in Malaysia'. Islamic Finance and Economic Development. M. Iqbal and A. Ahmad (ed). New York, Palgrave Macmillan.
Abdul-Majid, M., D. S. Saal and G. Battisti (2008). 'The efficiency and productivity of Malaysian banks: an output distance function approach.' Aston Business School Research Paper RP 0815.
Abdul-Majid, M., D. S. Saal and G. Battisti (2010). 'Efficiency in Islamic and conventional banking: an international comparison.' Journal of Productivity Analysis 34(1): 25-43.
Abdul-Majid, M., D. S. Saal and G. Battisti (2011a). 'Efficiency and total factor productivity change of Malaysian commercial banks.' The Service Industries Journal 31(13): 2117-2143.
Abdul-Majid, M., D. S. Saal and G. Battisti (2011b). 'The impact of Islamic banking on the cost efficiency and productivity change of Malaysian commercial banks.' Applied Economics 43(16): 2033-3054.
Al-Jarrah, I. and P. Molyneux (2005). 'Efficiency in Arabian banking'. Islamic Perspectives on Wealth Creation. M. Iqbal and R. Wilson (ed). Edinburgh, Edinburgh University Press: pp97-117.
Al-Muharrami, S. (2008). 'An examination of technical, pure technical and scale efficiencies in GCC banking.' American Journal of Finance and Accounting 1(2): 152-166.
Alam, I. M. S. (2001). 'A nonparametric approach for assessing productivity dynamics of large US banks.' Journal of Money, Credit, and Banking 33(1): 121-139.
Alexakis, C. and A. Tsikouras (2009). 'Islamic finance: Regulatory framework challenges lying ahead.' International Journal of Islamic and Middle Eastern Finance and Management 2(2): 90-104.
Ariff, M. and L. Can (2008). 'Cost and profit efficiency of Chinese banks: a non-parametric analysis.' China Economic Review 19(2): 260-273.
Arthur D Little Report (2009). 'Islamic finance comes of age; joint opportunities for Western and Arabic financial institutions.' Financial Services Viewpoint April.
Awdeh, A. and C. El Moussawi (2009). 'Bank efficiency and foreign ownership in the Lebanese banking sector.' Review of Middle East Economics and Finance 5(2): 1-22.
Bader, M. K. I. (2008). 'Cost, revenue, and profit efficiency of Islamic versus conventional banks: international evidence using data envelopment analysis.' Islamic Economic Studies 15(2): 23-76.
Barajas, A., R. Steiner and N. Salazar (1999). 'Interest spreads in banking in Colombia, 1974–96.' IMF Staff Papers 46: 196-.
Beck, T., A. Demirgüç-Kunt and O. Merrouche (2013). 'Islamic vs. conventional banking: Business model, efficiency and stability.' Journal of Banking and Finance 37(2): 433-447.
Berger, A. N. and D. B. Humphrey (1997). 'Efficiency of financial institutions: international survey and directions for future research.' European Journal of Operational Research 98(2): 175-212.
Berger, A. N. and L. J. Mester (1997). 'Inside the black box: What explains differences in the efficiencies of financial institutions.' Journal of Banking and Finance 21(7): 895-947.
Bikker, J. A. and K. Haaf (2002). 'Competition, concentration and their relationship: An empirical analysis of the banking industry.' Journal of Banking and Finance 26(11): 2191-2214.
Bos, J. W. B. and H. Schmiedel (2003). 'Comparing efficiency in European banking: A metafrontier approach.' Research Series Supervision 57 Netherlands Central Bank, The Netherlands.
Brown, K. (2003). 'Islamic banking comparative analysis.' The Arab Bank Review 5(2): 43-50. Brown, K. and M. T. Skully (2002). 'International Studies in Comparative Banking: A Survey of Recent
Developments.' SSRN eLibrary. Busse, J. A., T. C. Green and K. Baks (2007). 'Fund Managers Who Take Big Bets: Skilled or
Overconfident.' SSRN eLibrary. http://ssrn.com/paper=891727. Casu, B. and P. Molyneux (2003). 'A comparative study of efficiency in European banking.' Applied
Economics 35(17): 1865-1876.
31
Chapra, M. U. (2007). 'Challenges facing the Islamic financial industry'. Handbook of Islamic Banking. M. K. Hassan and M. K. Lewis (ed). Cheltenham, Edward Elgar: pp325-360.
Charnes, A., W. W. Cooper and E. Rhodes (1981). 'Evaluating program and managerial efficiency: an application of data envelopment analysis to program follow through.' Management Science 27(6): 668-697.
Charnes, A., Z. M. Huang and D. B. Sun (1990). 'Polyhedral cone-ratio DEA models with an illustrative application to larger commercial banks.' Journal of Econometrics 46(1-2): 73-91.
Chen, X., M. Skully and K. Brown (2005). 'Banking efficiency in China: application of DEA to pre- and post-deregulation eras: 1993-2000.' China Economic Review 16(3): 229-245.
Čihák, M. and H. Hesse (2010). 'Islamic banks and financial stability: An empirical analysis.' Journal of Financial Services Research 38: 95-113.
Coelli, T. J., D. S. P. Rao, C. J. O'Donnell and G. E. Battese (2005). An Introduction to Efficiency and Productivity Analysis. New York, Springer.
De Witte, K. and R. C. Marques (2009). 'Capturing the environment, a metafrontier approach to the drinking water sector.' International Transactions in Operational Research 16(2): 257-271.
Dietsch, M. and A. Lozano-Vivas (2000). 'How the environment determines banking efficiency: A comparison between French and Spanish industries.' Journal of Banking and Finance 24(6): 985-1004.
Drake, L. and M. J. B. Hall (2003). 'Efficiency in Japanese banking: an empirical analysis.' Journal of Banking and Finance 27(5): 891-917.
Drake, L., M. J. B. Hall and R. Simper (2006). 'The impact of macroeconomic and regulatory factors on bank efficiency: a non-parametric analysis of Hong Kong's banking system.' Journal of Banking and Finance 30: 1443-1466.
El-Gamal, M. A. and H. Inanoglu (2005). 'Inefficiency and heterogeneity in Turkish banking: 1990-2000.' Journal of Applied Econometrics 20: 641-664.
El Moussawi, C. and H. Obeid (2010). 'Evaluating the productive efficiency of Islamic banking in GCC: A non parametric approach.' International Research Journal of Finance and Economics 53: 178-190.
El Moussawi, C. and H. Obeid (2011). 'Evaluating the productive efficiency of Islamic banking in GCC: A non-parametric approach.' International Management Review 7(1): 10-.
Emrouznejad, A. and A. L. Anouze (2009). 'A note on the modelling the efficiency of top Arab banks.' Expert Systems with Applications 36(3 part i): 5741-5744.
Emrouznejad, A. and A. L. Anouze (2010). 'Data envelopment analysis with classification and regression tree - a case of banking efficiency.' Expert Systems 27(4): 231-246.
Garbois, C., C. Gourp, A. von Pock and M. Bhatnagar (2012). 'The Future of Banking.' http://www.atkearney.com/en_GB/financial-institutions/ideas-insights/article/-/asset_publisher/LCcgOeS4t85g/content/the-future-of-islamic-banking/10192 AT Kearney.
Grigorian, D. A. and V. Manole (2005). 'A Cross-Country Nonparametric Analysis of Bahrain’s Banking System.' IMF Working Paper WP/05/117 International Monetary Fund, Washington DC.
Hasan, M. and J. Dridi (2010). 'The effects of the global crisis on Islamic and conventional banks: A comparative study.' IMF Working Paper WP/10/201 Interntional Monetary Fund, Washington DC.
Hasan, Z. (2005). 'Evaluation of Islamic banking performance: on the current use of econometrics models.' Munich Personal RePEc Archive 7272.
Hassan, M. K. (2005). 'The cost, profit and X-efficiency of Islamic banks.' Paper presented at 12th ERF Annual Conference. www.erf.org.eg/CMS/getFile.php?id=469.
Hassan, M. K. (2006). 'The x-efficiency in Islamic banks.' Islamic Economic Studies 12(2): 49-78. Hassan, M. K. and K. A. Hussein (2003). 'Static and dynamic efficiency in the Sudanese banking
system.' Review of Islamic Economics 14: 5-48. Hassan, T., S. Mohamad and M. K. I. Bader (2009). 'Efficiency of conventional versus Islamic banks:
evidence from the Middle East.' International Journal of Islamic and Middle Eastern Finance and Management 2(1): 46-65.

32
Ho, C.-T. and D.-S. Zhu (2004). 'Performance measurement of Taiwan's commercial banks.' International Journal of Productivity and Performance Management 53(5/6): 425-434.
Hussein, K. A. (2004). 'Banking efficiency in Bahrain: Islamic versus conventional banks.' Islamic Development Bank, Islamic Research and Training Institute Research Paper 68 Islamic Development Bank, Islamic Research and Training Institute, Jeddah.
Iqbal, M., A. Ahmad and T. Khan (1998). 'Challenges facing Islamic banking.' Islamic Research and Training Institute, Islamic Development Bank, Occasional Paper No. 1 Islamic Research and Training Institute, Islamic Development Bank.
Jackson, P. M. and M. D. Fethi (2000). 'Evaluating the technical efficiency of Turkish commercial banks: an application of DEA and Tobit analysis.' Efficiency and Productivity Research Unit. https://lra.le.ac.uk/bitstream/2381/369/1/dpno5.pdf University of Leicester.
Johnes, J., M. Izzeldin and V. Pappas (2009). 'The efficiency of Islamic and conventional banks in the Gulf Cooperation Council (GCC) countries: An analysis using financial ratios and data envelopment analysis.' LUMS Working Papers Series 2009/023 Lancaster University Management School.
Kamaruddin, B. H., M. S. Safa and R. Mohd (2008). 'Assessing the production efficiency of Islamic banks and conventional bank Islamic windows in Malaysia.' International Journal of Business and Management Research 1(1): 31-48.
Koutsomanoli-Filippaki, A., D. Margaritis and C. Staikouras (2009). 'Efficiency and productivity growth in the banking industry of Central and Eastern Europe.' Journal of Banking and Finance 33(3): 557-567.
Lozano-Vivas, A. and F. Pasiouras (2010). 'The impact of non-traditional activities on the estimation of bank efficiency: International evidence.' Journal of Banking and Finance 34(7): 1436-1449.
Lozano-Vivas, A., J. T. Pastor and J. M. Pastor (2002). 'An efficiency comparison of European banking systems operating under different environmental conditions.' Journal of Productivity Analysis 18: 59-77.
Majumdar, S. K. (1995). 'X-efficiency in emerging competitive markets: The case of US telecommunications.' Journal of Economic Behavior and Organization 26: 129-144.
Matthews, K. and M. Ismail (2006). 'Efficiency and productivity growth of domestic and foreign commercial banks in Malaysia.' Cardiff Economics Working Papers E2006/2: 23pp. http://www.cf.ac.uk/carbs/econ/workingpapers/papers/E2006_2.pdf Cardiff University, Cardiff.
Miller, S. M. and A. G. Noulas (1996). 'The technical efficiency of large bank production.' Journal of Banking and Finance 20(3): 495-509.
Miller, S. M. and A. G. Noulas (1997). 'Portfolio mix and large-bank probability in the USA.' Applied Economics 29(4): 505-512.
Mokhtar, H. S. A., N. Abdullah and S. M. Al-Habshi (2006). 'Efficiency of Islamic banking in Malaysia: A stochastic frontier approach.' Journal of Economics Cooperation 27(2): 37-70.
Mokhtar, H. S. A., N. Abdullah and S. M. Alhabshi (2007). 'Technical and cost efficiency of Islamic banking in Malaysia.' Review of Islamic Economics 11(1): 5-40.
Mokhtar, H. S. A., N. Abdullah and S. M. Alhabshi (2008). 'Efficiency and competition of Islamic banking in Malaysia.' Humanomics 24(1): 28-48.
Mostafa, M. (2007). 'Modeling the efficiency of GCC banks: a data envelopment analysis approach.' International Journal of Productivity and Performance Management 56(7): 623-643.
Mostafa, M. (2011). 'Modeling Islamic banks' efficiency: A non-parametric frontier approach.' International Journal of Islamic and Middle Eastern Finance and Management 4(1): 7-29.
Pasiouras, F. (2008). 'Estimating the technical and scale efficiency of Greek commercial banks: the impact of credit risk, off-balance sheet activites, and international operations.' Research in International Business and Finance 22(3): 301-318.
Pellegrina, L. D. (2008). 'Capital adequacy ratios, efficiency and governance: a comparison between Islamic and Western banks.' Working Paper Centro Paolo Baffi, Bocconi University, Milan.

33
Rokhim, G. and R. Rokhim (2011). 'The stability comparison between Islamic banks and conventional banks: Evidence in Indonesia ' 8th International Conference on Islamic Economics and Finance Qatar National Convention Center, Doha, Qatar.
Saaid, A.-e. E. (2005). 'Allocative and technical inefficiency in Sudanese Islamic banks: An empirical investigation'. Islamic Perspectives on Wealth Creation. M. Iqbal and R. Wilson (ed). Edinburgh, Edinburgh University Press: pp142-154.
Saaid, A.-E. E., S. A. Rosly, M. H. Ibrahim and N. Abdullah (2003). 'The X-efficiency of the Sudanese Islamic banks.' IIUM Journal of Economics and Management 11(2): 123-141.
Said, A. (2012). 'Comparing the change in efficiency of the Western and Islamic banking systems.' Journal of Money, Investment and Banking 23: 149-180.
Shahid, H., R. Ur Rehman, G. S. K. Niazi and A. Raoof (2010). 'Efficiencies comparison of Islamic and conventional banks of Pakistan.' International Research Journal of Finance and Economics 49: 24-42.
Simar, L. and P. W. Wilson (2008). 'Statistical inference in nonparametric frontier models: Recent developments and perspectives'. The Measurement of Productive Efficiency. H. O. Fried, C. A. K. Lovell and S. S. Schmidt (ed). Oxford, Oxford University Press.
Srairi, S. A. (2010). 'Cost and profit efficiency of conventional and Islamic banks in GCC countries.' Journal of Productivity Analysis 34(1): 45-62.
Staikouras, C., E. Mamatzakis and A. Koutsomanoli-Filippaki (2008). 'Cost efficiency of the banking industry in the South Eastern European region.' Journal of International Financial Markets, Institutions and Money 18(5): 483-497.
Sturm, J.-E. and B. Williams (2004). 'Foreign bank entry, deregulation and banks efficiency: Lessons from the Australian experience.' Journal of Banking and Finance 28(7): 1775-1799.
Sufian, F. (2006). 'The efficiency of the Islamic banking industry in Malaysia: Foreign vs domestic banks.' Review of Islamic Economics 10(2): 27-53.
Sufian, F. (2006/2007). 'The efficiency of Islamic banking industry: a non-parametric analysis with non-discretionary input variable.' Islamic Economic Studies 14(1&2): 53-87.
Sufian, F. (2007). 'The efficiency of Islamic banking industry in Malaysia: foreign versus domestic banks.' Humanomics 23(3): 174-192.
Sufian, F. (2009). 'The determinants of Islamic banks' efficiency changes: Empirical evidence from the MENA and Asian banking sectors.' International Journal of Islamic and Middle Eastern Finance and Management 2(2): 120-138.
Tiedemann, T., T. Francksen and U. Latacz-Lohmann (2011). 'Assessing the performance of German Bundesliga football players: a non-parametric metafrontier approach.' Central European Journal of Operations Research 19(4): 571-587.
Viverita, V., K. Brown and M. Skully (2007). 'Efficiency analysis of Islamic banks in Africa, Asia and the Middle East.' Review of Islamic Economics 11(2): 5-16.
Warde, I. (2010). Islamic Finance in the Global Economy. Edinburgh, Edinburgh University Press. Willison, B. (2009). 'Technology trends in Islamic investment banking.' Islamic Finance News 6(19). Wongchai, A., W.-B. Liu and K.-C. Peng (2012). 'DEA metafrontier analysis on technical efficiency
differences of national universities in Thailand.' International Journal on New Trends in Education and Their Implications 3(4): 30-42.
Yılmaz , D. (2009). Islamic finance - during and after the global financial crisis Islamic finance - during and after the global financial crisis Istanbul.
Yudistira, D. (2004). 'Efficiency in Islamic banking: an empirical analysis of eighteen banks.' Islamic Economic Studies 12(1): 1-19.
Zhang, Y. and R. Bartels (1998). 'The effect of sample size on the mean efficiency in DEA with an application to electricity distribution in Australia, Sweden and New Zealand.' Journal of Productivity Analysis 9(3): 187-204.