Embed Size (px)
Citation preview

University of Arizona Institute of Atmospheric PhysicsPage 1
Wide-Area Soil Moisture Estimation Using the Propagation of Low-Frequency
Electromagnetic Signals
William Scheftic (Graduate Student, Atmospheric Sciences, University of Arizona)
Kenneth L. Cummins and E. Philip Krider (Atmospheric Sciences, University of Arizona)
David Goodrich, Susan Moran, and Russell Scott (USDA Southwest Watershed Research Center)

University of Arizona Institute of Atmospheric PhysicsPage 2
Discussion Outline
- Finite soil surface conductivity has a quantifiable effect on surface-wave radio propagation in the 100 kHz to 1 MHz range
- Brief theoretical explanation
- Lightning Based method
- Methodology
- Preliminary results
- Some Limitations
- Radio transmission method
- Overview of summer 2007 field campaign

University of Arizona Institute of Atmospheric PhysicsPage 3
1 104
1 105
1 106
1 107
1 103
0.01
0.1
1
3.5
3
2.5
2
1.5
1
0.5
0
Freq [Hz]
Sig
nal
Att
enu
atio
n
Pha
se [
rad]
Conductivity = 10 mS/m; Propagation distance = 100 kmEffect of finite conductivity on surface-wave signal propagation
(propagation model of Norton, 1937):
U2 i
i 0 c2
U U2
R R U2 i2c
R
z
RU
z
RU
F R 1 i4 R
1 R 2exp
4 R
1 R 2
erfc i 4 R
1 R 2

University of Arizona Institute of Atmospheric PhysicsPage 4
Variation with Conductivity
• Soil – Low pass filter on propagating fields
• Smaller conductivity or larger distance: lower cutoff-frequency

University of Arizona Institute of Atmospheric PhysicsPage 5
Electrical conductivity varies with soil moisture content
Percent soil saturation
Ele
ctric
al C
ondu
ctiv
ity
(mS
/m)
σ=2.
%W=0.34
0 0.063 0.13 0.19 0.25 0.31 0.38 0.44 0.50
0.4
0.8
1.2
1.6
2
2.4
2.8
3.2
3.6
4
Archie’s Equation:
WwRAmW
eR%%1
Where σ is the electrical conductivity, Re is the resistivity, %W is the percent water content, and β represents the relevant soil properties. The exponent α is typically in the range of 1.5 and 2.2.
Figure: β = 10, α = 1.5 (blue) and 2.0 (red)

University of Arizona Institute of Atmospheric PhysicsPage 6
Lightning Background
2 3 4 – 6 7 - 13 14
17 – 33 ms ... 50 – 83.5 ms … 216 – 233 ms
23:42:47.542 ... No NLDN
Report … 23:42:47.762
Cloud-to-ground lightning electromagnetic fields: (b) First, and (c) Subsequent strokes

University of Arizona Institute of Atmospheric PhysicsPage 7
Rise-time determined by the highest frequencies
2 3 4 – 6 7 - 13 14
17 – 33 ms ... 50 – 83.5 ms … 216 – 233 ms
23:42:47.542 ... No NLDN
Report … 23:42:47.762

University of Arizona Institute of Atmospheric PhysicsPage 8
Propagation Animation - 75->450 km distanceConductivity = 5 mS/m
55 56 57 58 59 60 61 62 63 64 651
0.83
0.67
0.5
0.33
0.17
0.0
0.858
xf75m
sensor_lpf m
6555m
106
fs
75 km

University of Arizona Institute of Atmospheric PhysicsPage 9
55 56 57 58 59 60 61 62 63 64 651
0.83
0.67
0.5
0.33
0.17
0.0
0.858
xf75m
sensor_lpf m
6555m
106
fs
75 km
Propagation Animation - 75->450 km distance

University of Arizona Institute of Atmospheric PhysicsPage 10
55 56 57 58 59 60 61 62 63 64 651
0.83
0.67
0.5
0.33
0.17
0.0
0.858
xf150m
sensor_lpf m
6555m
106
fs
150 km
Propagation Animation - 75->450 km distance

University of Arizona Institute of Atmospheric PhysicsPage 11
55 56 57 58 59 60 61 62 63 64 651
0.83
0.67
0.5
0.33
0.17
0.0
0.858
xf225m
sensor_lpf m
6555m
106
fs
225 km
Propagation Animation - 75->450 km distance

University of Arizona Institute of Atmospheric PhysicsPage 12
55 56 57 58 59 60 61 62 63 64 651
0.83
0.67
0.5
0.33
0.17
0.0
0.858
xf300m
sensor_lpf m
6555m
106
fs
300 km
Propagation Animation - 75->450 km distance

University of Arizona Institute of Atmospheric PhysicsPage 13
55 56 57 58 59 60 61 62 63 64 651
0.83
0.67
0.5
0.33
0.17
0.0
0.858
xf375m
sensor_lpf m
6555m
106
fs
375 km
Propagation Animation - 75->450 km distance

University of Arizona Institute of Atmospheric PhysicsPage 14
55 56 57 58 59 60 61 62 63 64 651
0.83
0.67
0.5
0.33
0.17
0.0
0.858
xf450m
sensor_lpf m
6555m
106
fs
450 km
Propagation Animation - 75->450 km distance

University of Arizona Institute of Atmospheric PhysicsPage 15
Rudimentary LTG Method
200 km LordsburgTucson
Williams
Window Rock
Yuma
• Select desired path for analysis
• Starting at a polygon that defines the lightning-observation region
• Ending at a sensor location (e.g., Lordsburg; Williams)
• Evaluate risetime of lightning waveform measured by the selected sensor.
• Convert risetime to apparent electrical conductivity
• Convert apparent conductivity to soil moisture
• Used North American Regional Reanalysis (NARR) as validation
Polygon
PathSensor

University of Arizona Institute of Atmospheric PhysicsPage 16
Average Risetime over U.S.

University of Arizona Institute of Atmospheric PhysicsPage 17
Normalized Cumulative Frequency Distribution of Risetime for Different Time Periods in 2005
0.00
0.10
0.20
0.30
0.40
0.50
0.60
0.70
0.80
0.90
1.00
2.5 3 3.5 4 4.5 5 5.5 6 6.5
Risetime [μs]
7-7 to 7-21
7-22 to 7-27
7-29 to 8-5
8-6 to 8-23
9-5 to 9-11
Risetime for All Negative First Strokes in Tucson Area (Recorded at Lordsburg Sensor)NARR Soil Moisture for 5 Periods During the 2005 Season
0
0.05
0.1
0.15
0.2
0.25
0.3
0.356/
22
6/27 7/2
7/7
7/12
7/17
7/22
7/27 8/1
8/6
8/11
8/16
8/21
8/26
8/31 9/5
9/10
Date (2005)
Vo
l So
il. M
ois
t [f
ract
ion
]
0
2
4
6
8
10
12
14
16
Ris
etim
e [μ
s]
Distribution of Risetime And Soil Moisture
University of Arizona Institute of Atmospheric PhysicsPage 18
14
16
18
20
22
24
26
06/27 07/07 07/17 07/27 08/06 08/16 08/26 09/05 09/15
Date (2005)
(100
/RT
) [1
00/μ
s]
0.13
0.15
0.17
0.19
0.21
0.23
0.25
0.27
Vo
l. S
oil
Mo
ist.
[f
ract
ion
]
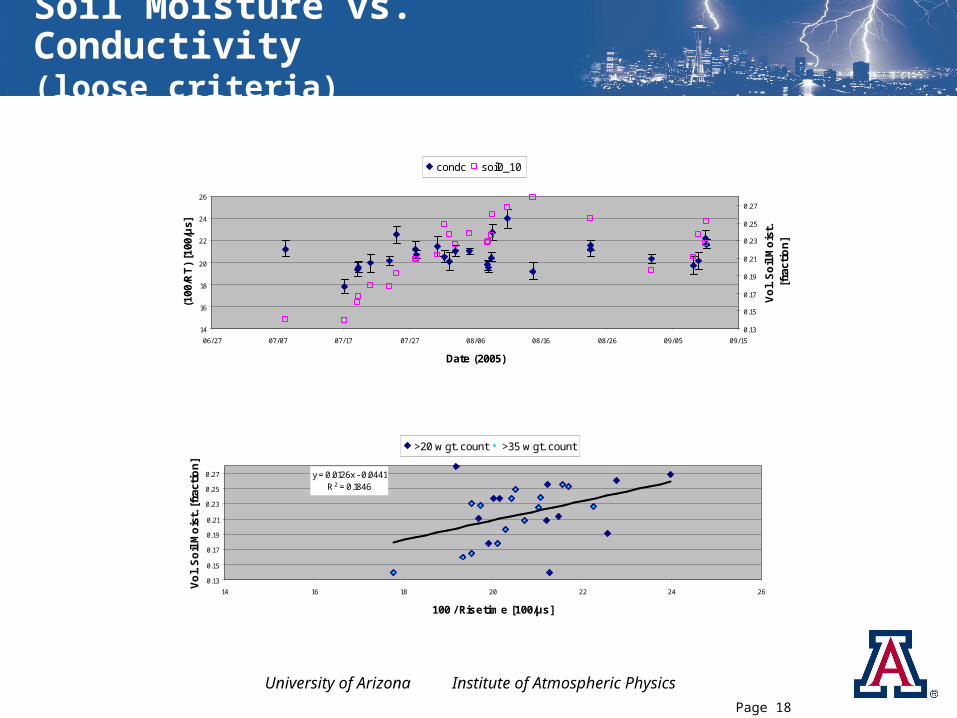
condc soil0_10
Soil Moisture vs. Conductivity(loose criteria)
y = 0.0126x - 0.0441R2 = 0.1846
0.13
0.15
0.17
0.19
0.21
0.23
0.25
0.27
14 16 18 20 22 24 26
100 / Risetime [100/μs]
Vo
l. S
oil
Mo
ist.
[fr
acti
on
]
>20 w gt. count >35 w gt. count

University of Arizona Institute of Atmospheric PhysicsPage 19
17
18
19
20
21
22
23
07/07 07/17 07/27 08/06 08/16 08/26 09/05 09/15
Date (2005)
(100
/RT
) [1
00/μ
s]
0.13
0.15
0.17
0.19
0.21
0.23
0.25
0.27
Vo
l. S
oil
Mo
ist.
[f
ract
ion
]
condc soil0_10
y = 0.0247x - 0.2907R2 = 0.5754
0.13
0.15
0.17
0.19
0.21
0.23
0.25
0.27
17 18 19 20 21 22 23
100 / Risetime [100/μs]
Vo
l. S
oil
Mo
ist.
[fr
acti
on
]
Soil Moisture vs. Conductivity(weighted count > 35)

University of Arizona Institute of Atmospheric PhysicsPage 20
Limitations
• Other factors affect conductivity changes
• Soil temperature, soil salinity, conductivity gradient over a several-meter depth
• No perfect set of wide-area data for validation
• NARR can miss precipitation events as occurred for at least one of the 2005 lightning events.
• The size of the lightning region being analyzed determines how similar lightning to sensor paths really are.
• Must have lightning!!

University of Arizona Institute of Atmospheric PhysicsPage 21
An alternate signal source is man-made narrow-band radio signals
(LORAN, NDB, AM radio stations)
Sa
Sc
Sb
Tx
dc
da
dab
Longitude
Latitude
University of Arizona Institute of Atmospheric PhysicsPage 22
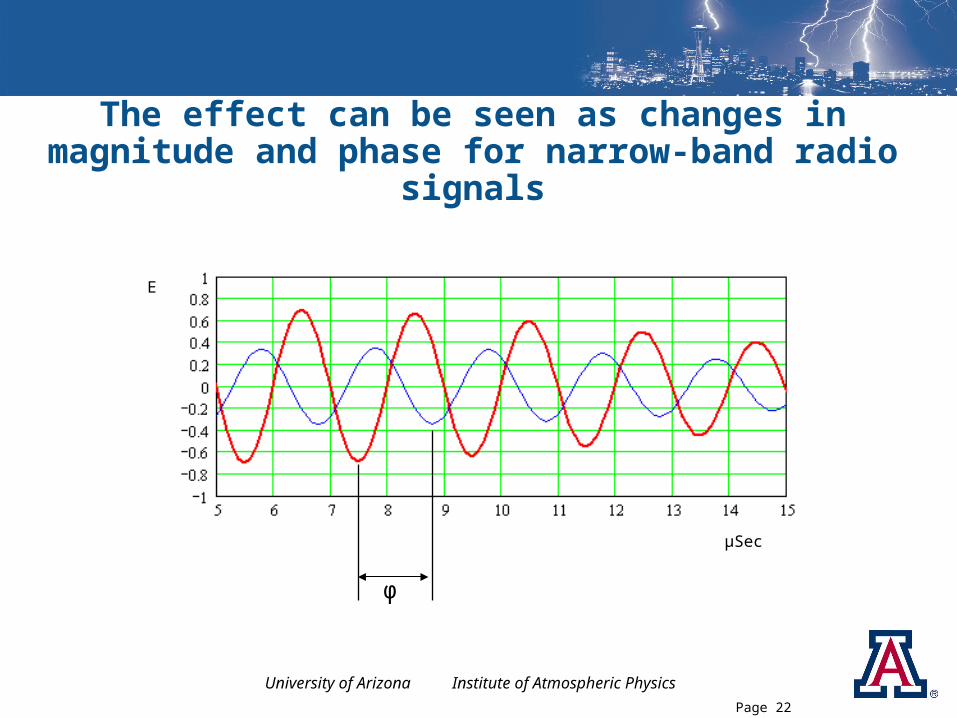
The effect can be seen as changes in magnitude and phase for narrow-band radio signals
φ
μSec
E

University of Arizona Institute of Atmospheric PhysicsPage 23
RadioTX Field Campaign ‘07
• June->October Field Campaign in San Pedro Basin
• Three broadband sensors
• Remote control from PAS
• Measure mag/phase vs. fq.
• Derive conductivity
• Correlate with WG and San Pedro in-situ measurements, and NARR
Note: 18 AM transmitter within 100km of Tombstone

University of Arizona Institute of Atmospheric PhysicsPage 24

University of Arizona Institute of Atmospheric PhysicsPage 25
420 kHz NDB

University of Arizona Institute of Atmospheric PhysicsPage 26
790 kHz AM station

University of Arizona Institute of Atmospheric PhysicsPage 27
Questions?

University of Arizona Institute of Atmospheric PhysicsPage 28
Supporting Material

University of Arizona Institute of Atmospheric PhysicsPage 29
Wide-area Validation:North American Regional Reanalysis
Specifications• 32 km resolution, every 3
hours
• Available from Jan 1979 through Feb 2007
• Adequate representation of hydrologic balance
• Uses NOAH LSM ver. 2.6
• 4 soil depth layers
• Uses hourly rain gauge data and PRISM technique to assimilate precipitation

University of Arizona Institute of Atmospheric PhysicsPage 30
Comparison of Daily Soil Moisture from NARR Dataset (0 to 10 cm) and ARS In-situ Measurements (5cm)
0.0
0.1
0.2
0.3
0.4
0.5
0.6
0.7
0.8
0.9
1.0
06/15 06/25 07/05 07/15 07/25 08/04 08/14 08/24 09/03 09/13 09/23
Date (2005)
Re
lativ
e S
atu
ratio
n [(
fra
ctio
n-m
in)/
(ma
x-m
in)]
ARS (Charleston, AZ) NARR (31.66N 110.18W)
Soil Moisture: NARR Vs. ARS In-Situ

University of Arizona Institute of Atmospheric PhysicsPage 31

University of Arizona Institute of Atmospheric PhysicsPage 32

University of Arizona Institute of Atmospheric PhysicsPage 33

University of Arizona Institute of Atmospheric PhysicsPage 34

University of Arizona Institute of Atmospheric PhysicsPage 35

University of Arizona Institute of Atmospheric PhysicsPage 36

University of Arizona Institute of Atmospheric PhysicsPage 37

University of Arizona Institute of Atmospheric PhysicsPage 38

University of Arizona Institute of Atmospheric PhysicsPage 39

University of Arizona Institute of Atmospheric PhysicsPage 40