Embed Size (px)
Citation preview

University of Alberta
Physiochemical and Rheological Properties of Alkaline Isolated Poultry Proteins
by
Vida Moayedi Mamaghani
A thesis submitted to the Faculty of Graduate Studies and Research in partial fulfillment of the requirements for the degree of
Master of Science in
Food Science and Technology
Department of Agricultural, Food and Nutritional Science
© Vida Moayedi Mamaghani Spring 2010
Edmonton, Alberta
Permission is hereby granted to the University of Alberta Libraries to reproduce single copies of this thesis and to lend
or sell such copies for private, scholarly or scientific research purposes only. Where the thesis is converted to, or otherwise made available in digital form, the University of Alberta will advise potential users of the thesis of these
terms.
The author reserves all other publication and other rights in association with the copyright in the thesis and, except as herein before provided, neither the thesis nor any substantial portion thereof may be printed or otherwise reproduced in
any material form whatsoever without the author's prior written permission.

Examining Committee
Dr. Mirko Betti, Agricultural, Food and Nutritional Science
Dr. Jianping Wu, Agricultural, Food and Nutritional Science
Dr. Wendy Wismer, Agricultural, Food and Nutritional Science
Dr. Ellen Goddard, Rural Economy

DEDICATION
To my father, Ali Moayedi Mamaghani, who always watches over me from the sky with his special smile.
To my mother, Sorour, who has always supported me in all ways…without
you I would never be at this stage.
To Pouya, Lida, and Alireza, my motivators and supporters, without your great help, this would not have been possible.
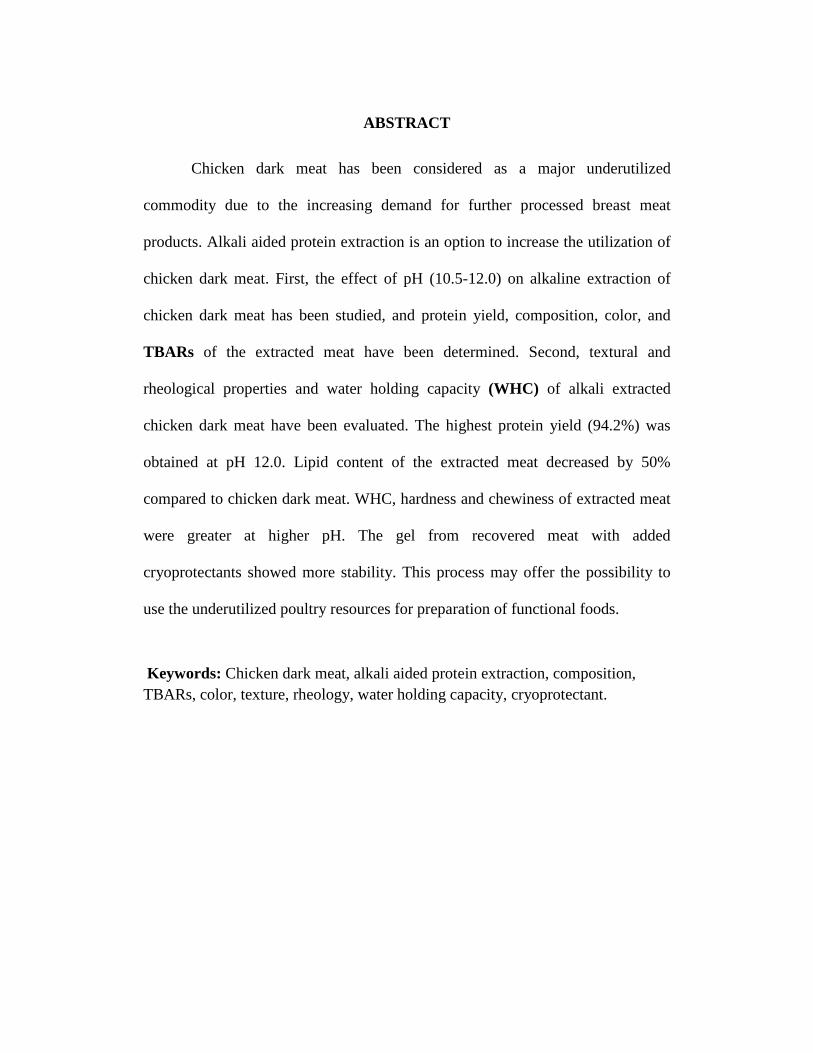
ABSTRACT
Chicken dark meat has been considered as a major underutilized
commodity due to the increasing demand for further processed breast meat
products. Alkali aided protein extraction is an option to increase the utilization of
chicken dark meat. First, the effect of pH (10.5-12.0) on alkaline extraction of
chicken dark meat has been studied, and protein yield, composition, color, and
TBARs of the extracted meat have been determined. Second, textural and
rheological properties and water holding capacity (WHC) of alkali extracted
chicken dark meat have been evaluated. The highest protein yield (94.2%) was
obtained at pH 12.0. Lipid content of the extracted meat decreased by 50%
compared to chicken dark meat. WHC, hardness and chewiness of extracted meat
were greater at higher pH. The gel from recovered meat with added
cryoprotectants showed more stability. This process may offer the possibility to
use the underutilized poultry resources for preparation of functional foods.
Keywords: Chicken dark meat, alkali aided protein extraction, composition, TBARs, color, texture, rheology, water holding capacity, cryoprotectant.
ACKNOWLEDGEMENTS
• Mirko Betti for giving me this opportunity, and for guiding me to higher paths of knowledge. Without him, I would not be here.
• Wendy Wismer, Jianping Wu, and Ellen Goddard for their wise input throughout the whole project.
• George Britton for being a unique teacher, motivator, and supporter. • Dileep Omana for his great help and advice for academic writing and for
his patience answering my questions. • Tulia Perez for being such a special friend and for helping me throughout
the project, especially with statistics. • Jacky Chan, Sandeep Singla, and Yuliya Hrynets for being such nice friends
and co-workers, and for their willingness to help others. • Yan Xu for his technical expertise. • Kelvin A. Lien for helping me with chromatography and for being patient to
explain all the procedure for me and answering my endless questions. • Maryam and Leila Zargarzadeh for being my second family. • Sahar Navidghasemizad for being such a wonderful friend, for listening to
me and for always being there when I needed her. • Sarah Goomeshi Nobary for being my great friend who always helped me to
break up my daily routine and to do something exciting. • Most importantly, my mother, Sorour, for her great help and support, for
listening to me and giving me advice. Also, for understanding my research. • Lida and Pouya Moayedi Mamaghani, and Alireza Danesh for their great
help and support. • Grant, Patti, and Carly Henley for all their endless kindness and caring,
which is rarely found nowadays. • All the students and staff at the Poultry Research Centre for their assistance
and expertise.

1 LITERATURE REVIEW ................................................................................. 11.1 ‘Low Value’ Poultry Dark Meat ................................................................... 1
1.2 Structure and Protein Composition of Muscle .............................................. 21.2.1 Skeletal Muscle ....................................................................................... 21.2.2 Muscle Proteins ...................................................................................... 31.2.3 Muscle Fiber Types ................................................................................ 4
1.3 Alternatives to Increase ‘Low Value’ Dark Meat Utilization ....................... 51.3.1 Conventional (Traditional) Surimi Processing Technology ................... 51.3.2 pH Shifting Processing: A New Technology for the Recovery of Functional Proteins .......................................................................................... 8
1.3.2.1 Factors Influencing Protein Recovery using pH shifting Processing and their Comparison with Traditional Surimi Production .......................... 91.3.3 Functional Properties of Muscle Proteins and their Link to pH Shifting Process and Traditional Surimi Production ................................. 15
1.3.3.1 Protein Solubility ........................................................................ 151.3.3.2 Protein Gelation .......................................................................... 171.3.3.3 Rheological Properties ............................................................... 17
1.3.3.3.1 Dynamic Mechanical Analysis (DMA) ............................... 171.3.3.4 Textural Properties ..................................................................... 18
1.3.3.4.1 Textural Profile Analysis (TPA) .......................................... 181.3.3.5 Water Holding Capacity ............................................................. 191.3.3.6 Cooking Loss .............................................................................. 191.3.3.7 Emulsification Capacity ............................................................. 201.3.3.8 Protein Denaturation .................................................................. 201.3.3.9 The Effect of Surimi and pH Shifting Process on Functional, Textural, and Rheological Properties of the Recovered Proteins ........... 21
1.3.4 Color and its Link to the Recovered Proteins from Surimi and pH Shifting Process ......................................................................................... 221.3.5 The Effect of Surimi and pH Shifting Process on the Recovered Proteins’ Stability during Storage .............................................................. 24
1.4 Potential Applications of the Recovered Proteins by pH Shifting Methods 25
1.5 Research Objectives .................................................................................... 261.5.1 Main Objective ..................................................................................... 261.5.2 Specific Objectives ............................................................................... 26
1.6 Approach ..................................................................................................... 27
1.7 TABLES ...................................................................................................... 28
1.8 FIGURES .................................................................................................... 30
1.9 REFERENCES ............................................................................................ 32

2 ALKALI AIDED PROTEIN EXTRACTION OF CHICKEN DARK MEAT: COMPOSITION AND STABILITY TO LIPID OXIDATION OF THE RECOVERED PROTEINS ...................................................................... 44
2.1 INTRODUCTION ....................................................................................... 44
2.2 MATERIALS AND METHODS ................................................................ 452.2.1 Materials ............................................................................................... 452.2.2 Protein Solubility Curve ....................................................................... 452.2.3 Protein Isolation .................................................................................... 462.2.4 Determination of Total Protein Content ............................................... 462.2.5 Extractability of Recovered Proteins .................................................... 472.2.6 Determination of Total Fat Content ...................................................... 472.2.7 Separation of the Main Lipid Classes ................................................... 482.2.8 Fatty Acid Analysis .............................................................................. 482.2.9 Susceptibility to Oxidation ................................................................... 492.2.10 Color Measurements ........................................................................... 50
2.2.10.1 Total Heme Pigments Content ..................................................... 502.2.11 Statistical Analysis ............................................................................. 51
2.3 RESULTS AND DISCUSSION ................................................................. 512.3.1 Protein Solubility .................................................................................. 512.3.2 Protein Recovery and Protein Content ................................................. 522.3.3 Extractability of Recovered Proteins .................................................... 522.3.4 Lipid Profile .......................................................................................... 53
2.3.4.1 Total Lipid Content ........................................................................ 532.3.4.2 Neutral and Polar Lipids Content ................................................... 54
2.3.5 Fatty Acid Profile ................................................................................. 552.3.5.1 Neutral Lipids Fraction .................................................................. 552.3.5.2 Polar Lipids Fraction ...................................................................... 56
2.3.6 Susceptibility to Oxidation ................................................................... 572.3.7 Color Measurements and Total Heme Pigments .................................. 57
2.4 CONCLUSIONS ......................................................................................... 59
2.5 TABLES ...................................................................................................... 61
2.6 FIGURES .................................................................................................... 65
2.7 REFERENCES ............................................................................................ 71
3 ALKALI AIDED PROTEIN EXTRACTION FROM CHICKEN DARK MEAT: TEXTURAL AND RHEOLOGICAL CHARACTERISTICS OF RECOVERED PROTEINS ................................................................................ 77
3.1 INTRODUCTION ....................................................................................... 77
3.2 MATERIALS AND METHODS ................................................................ 783.2.1 Materials ............................................................................................... 783.2.2 Methods ................................................................................................ 78
3.2.2.1 Extraction Method ......................................................................... 783.2.2.2 Cooking Loss ................................................................................. 79

3.2.2.3 Expressible Moisture ...................................................................... 793.2.2.4 Textural Profile Analysis ............................................................... 803.2.2.5 Dynamic Viscoelastic Behaviour of Recovered Proteins .............. 80
3.2.3 Statistical Analysis ................................................................................ 80
3.3 RESULTS AND DISCUSSION ................................................................. 813.3.1 Cooking Loss ........................................................................................ 813.3.2 Expressible Moisture ............................................................................ 813.3.3 Textural Profile Analysis/Dynamic Viscoelastic Behaviour ................ 82
3.4 CONCLUSIONS ......................................................................................... 85
3.5 TABLES ...................................................................................................... 86
3.6 FIGURES .................................................................................................... 87
3.7 REFERENCES ............................................................................................ 91
4 PROJECT SUMMARY AND IMPLICATIONS .......................................... 95

LIST OF TABLES Table 1.1. Protein (%), lipid (%), moisture (%), and iron (mg/100 g of meat) content of skinless chicken dark and white meat………………………………...28
Table 1.2. Color attributes (L*, a*, and b*) of chicken dark and white meat……29
Table 2.1. Protein (%) and lipid (%) composition of chicken dark and extracted meat (wet basis)………………………………………………………………….61
Table 2.2. Level (mg fatty acid / 100 g of meat) of fatty acids in the neutral lipids of chicken dark and extracted meat.......................................................................62
Table 2.3. Level (mg fatty acid / 100 g of meat) of fatty acids in the polar lipids of chicken dark and extracted meat ........................................................................63
Table 2.4. Color measurements and total heme pigments of chicken dark and extracted meat .......................................................................................................64
Table 3.1. Textural profile analysis of recovered proteins after protein extraction by pH-shift method................................................................................................86

LIST OF FIGURES
Figure 1.1. Schematic diagram of muscle structure, starting from a cross section of a whole muscle (a), including the layers of connective tissue, the muscle bundle (b), fibre (c), myofibril (d) and myofilaments (e)……………………..30
Figure 1.2. Flow chart of surimi manufacturing…………………………………31
Figure 2.1. Solubility profile of chicken dark meat proteins as a function of pH. Protein homogenates were adjusted to a pH range of 1.5 to 12.0 using HCl or NaOH. The values presented are means of 4 replicate determinations…………………………………………………………………65
Figure 2.2. Effect of extraction pH on protein yield of extracted chicken dark meat. Dissimilar letters in the graph represent significant (P < 0.05) difference. The values presented are means of 4 replicate determinations………………..66
Figure 2.3. Regression analysis showing the relation between protein yield (%) and fat (% on dry basis) of extracted chicken dark meat as a function of extraction pH…………………………………………………………………..67
Figure 2.4. Regression analysis showing the relation between protein yield (%) and neutral lipids (% on dry basis) of extracted chicken dark meat as a function of extraction pH………………………………………………………………..68
Figure 2.5. Extractability of recovered proteins after protein extraction by pH-shift method. Sarcoplasmic proteins were solubilized in phosphate buffer, while total proteins were solubilized in phosphate buffer (pH 7.4) containing potassium iodide. Dissimilar letters for respective parameters in the graph represent significant (P < 0.05) difference…………………………………….69
Figure 2.6. Effect of time and extraction pH on oxidative stability of chicken dark and extracted meat measured as induced TBA reactive substances (TBARS). The values presented are means of 4 replicate determinations………………..70
Figure 3.1. Cooking loss of different treatments during alkali extraction of chicken dark meat. Dissimilar letters (a, b, c) in the figure denotes significant difference (P < 0.05)…………………………………………………………..87
Figure 3.2. Expressible moisture of different treatments during alkali extraction of chicken dark meat. Dissimilar letters (a, b) in the figure denotes significant difference (P < 0.05)…………………………………………………………..88
Figure 3.3. Dynamic viscoelastic behaviour (DVB) of recovered proteins from chicken dark meat after alkali extraction (without cryoprotectants)…………..89

Figure 3.4. Dynamic viscoelastic behaviour (DVB) of recovered proteins from chicken dark meat after alkali extraction, stored at -30 oC for one month with added cryoprotectants…………………………………………………………90
LIST OF ABBREVIATIONS
AA: Arachidonic acid
DHA: Docosahexaenoic acid
DMA: Dynamic mechanical Analysis
DMCM: Dark minced chicken meat
EM: Extracted meat
EPA: Eicosapentaenoic acid
FA: Fatty acids
GC: Gas chromatography
LA: Linoleic acid
LC ω-3 PUFA: Long chain omega-3 polyunsaturated fatty acids
LNA: alpha-linolenic acid
MDA: Malonaldehydes
MT: Metric tons
MUFA: Monounsaturated fatty acids
PL: Phospholipids
PUFA: Polyunsaturated fatty acids
SFA: Saturated fatty acids
TBA: Thiobarbituric acid
TBARs: Thiobarbituric acid reactive substances
TG: Triacylglycerols
TPA: Texture profile analysis
WHC: Water holding capacity

1
1 LITERATURE REVIEW
1.1 ‘Low Value’ Poultry Dark Meat
Poultry meat production worldwide approached 94.7 million metric tons (MT) in
2009 (FAO, 2009). Currently the US, China, Brazil and European Union (EU) with 19.4,
12.1, 11.3, and 8.5 million MT respectively, are the primary broiler producers (USDA,
2009a,b,c,d). In 2008 the amount of poultry production in Canada reached 1.2 million
MT (Statistics Canada, 2009).
According to the US Livestock Marketing Information Centre, estimated per
capita total red meat and poultry consumption in the US in 2007 was 110.7 kg (World
Poultry, 2008). Chicken and turkey meat consumption in the US had a dramatic increase
from 12 kg in 1950, to 52 kg per capita in 2007 (USDA/ERS, 2007). Chicken meat
consumption in Canada was 21.5 kg per capita in 1989 while in 2008 it reached the level
of 31.8 kg (CFC, 2008). The major factors which contributed to the increase in Canadian
poultry consumption were population growth, demand for non red meat species,
awareness of perceived health benefits of poultry meat, and continuing consumer
preference for convenient and creative value-added chicken products with reduced meal
preparation time (AAFC, 2006; Goddard et al., 2007).
Poultry meat can be categorized into high-value (mostly white meat) and low-
value (mostly dark meat) (Peterson and Orden, 2005). Although, chicken meat mainly
consists of broilers (high value), spent breeder hens and males, and spent table egg layers
are also categorized in the group of low value poultry meat (Bilgili, 2000). Due to the low
quality and yield of the meat from broiler breeders and spent layers, they are regarded as
‘Low Value’ meat, and there is little demand for them in food processing (AFAC, 2003).
In the United States, white meat is preferred over dark meat (USDA, 2000). Therefore,
with the increasing demand for further processed breast meat products (i.e. white meat),
chicken dark meat has been regarded as a by-product (USDA, 2004). The major concerns
with chicken dark meat which affect consumers’ selection and satisfaction are color (due
to heme pigments containing iron), high fat content and poor shelf stability (Froning,

2
1995; Fletcher, 1997; Betti and Fletcher, 2005). The differences in protein, lipid,
moisture and iron content of chicken white and dark meat are presented in Table 1.1.
Low value dark poultry meat should not be considered only as muscle tissue
which is processed into traditional forms of food, but rather as a source of functional
ingredients for food product development. Agricultural commodities which are
fractionated into components have been widely used as ingredients in other food products
to improve functional properties. For example, isolated soybean proteins are used as
binders, extenders, and fillers. In addition, isolated soy proteins can improve water-
holding capacity, and lighten dark meat (Owens, 2001). Therefore, this idea can be also
applicable to poultry dark meat.
Since meat quality is affected by the muscle structure in the living animal, it is
important to overview chemical and physical composition of muscle proteins, which is
provided in the following sections.
1.2 Structure and Protein Composition of Muscle
1.2.1 Skeletal Muscle
A schematic diagram of the muscle structure is shown in Figure 1.1. As can be
seen in the diagram, a skeletal muscle is formed by many muscle bundles. Epimysium is
the cover for muscle bundles. Perimysium is a connective tissue which separates muscle
bundles from one another. Endomysium is a thin layer by which muscle fibers are
separated from each other. Muscle fibers are the units which form a muscle bundle. Each
muscle fiber consists of myofibrils and each myofibrill contains myofilaments. The
Sarcomere is a small muscle unit which is involved in muscle contraction. There is a dark
area in which a thick filament (myosin) and a thin filament (actin) overlap. This area is
known as the A-band. There is a light area in the A-band which contains no thin
filaments called the H-zone. The Z-line is the area which determines the borders of a
sarcomere, and it is composed of narrow dark bands of proteins (Strasburg et al., 2008).
Muscle contraction occurs when thick filaments slide toward the Z-line (Barbut, 2002).
There is a great variation in the size of the skeletal muscles from breast muscle to the
muscle which control the movement of the eyes.

3
1.2.2 Muscle Proteins
Based on their solubility function, proteins in skeletal muscle have been
categorized into sarcoplasmic, myofibrillar, and stromal proteins (Strasburg et al., 2008).
Sarcoplasmic proteins include proteins located in the sarcoplasm (cellular fluid) of the
myofiber including myoglobin, hemoglobin, cytochromes, glycolytic enzymes and
creatine kinase. These proteins are also called ‘water soluble’ proteins. This fraction
constitutes about 30% of the total muscle protein content (Scopes, 1970).
Myofibrillar proteins include 50-60% of muscle proteins. These proteins are salt
soluble and thus they are called ‘salt soluble’ proteins. Myosin and actin which are
categorized in this group, are thick and thin filaments, respectively (Strasburg et al.,
2008). They play the main role in muscle contraction and consist of about 65% of the
total myofibrillar proteins and around 40% of the total muscle protein content (Yates and
Greaser, 1983). Other proteins included in this group are tropomyosin, troponin, C-
Protein, α-Actinin, and β-Actinin (Barbut, 2002). According to the fact that actin and
myosin are the most abundant proteins among the myofibrillar proteins, the solubility of
all other proteins in this group will be affected by these two proteins, and greatly
influence the functional properties of the processed meat products. Myosin which
constitutes about 45% of the myofibrillar proteins is the main skeletal muscle protein
involved in muscle contraction. Myosin forms the thick filaments and is the abundant
protein present in the A-band area (Yates and Greaser, 1983). Myosin with molecular
weight of approximately 540,000 daltons, is a long rod-shaped protein composed of six
subunits including two heavy chains and four light chains. The heavy chains consist of
the myosin head. Movement occurs when the myosin heads connect with actin (Barbut,
2002). Thin filaments are composed of three main myofibrillar proteins including actin,
tropomyosin and troponin. Actin with a molecular weight of 42,000 daltons, makes up
the thin filaments. The actin molecule is composed of two chains which are twisted
together. Tropomyosin, another protein of the thin filaments, surrounds the actin
molecule. It consists of 5% of the myofibrillar proteins and is a rod shaped protein.
Troponin, another protein of the thin filaments, is composed of 5% of the myofibrillar
proteins and is in globular shape. There are three types of troponin which include
troponin-C, troponin-I, and troponin-T. They are all located along the actin filament.

4
When Troponin-C binds with calcium ions, the tropomyosin moves and as a result, the
myosin binding site in actin molecule becomes exposed which leads to the connection of
actin and myosin (Jackson et al., 1975).
Stromal proteins, which comprise 10-20% of total muscle protein content, provide
strength and protection for muscle tissue. The composition and abundance of these kinds
of proteins greatly affect the quality of meat products. The major protein of this group is
collagen (Strasburg et al., 2008). Other proteins of this group are elastin and
mitochondrial proteins (Barbut, 2002). Collagen contributes to meat toughness and
increases with the age of the animal. Thus, the meat from older animals is of lower
quality because it is more tough compared to the meat from the younger ones
(McCormick, 1999; Purslow, 2005). During meat processing, cooking leads to breaking
and partial solubilization of collagen which will increase meat tenderness (Resurreccion,
1994).
1.2.3 Muscle Fiber Types
According to muscle appearance, it is possible to classify the muscle fibers into
red and white. The poultry dark meat (e.g. thigh) is mainly composed of red fibers, and
due to this reason its color is dark compared to white meat (i.e. breast). The myoglobin
content of red fibers is higher than those in white fibers leading to the color difference
(Barbut, 2002). On the other hand, according to the type of metabolism, muscle fibers can
be divided into two groups of oxidative and anaerobic (glycolytic). Thus, based on this
classification, muscle fibers can be grouped into type I (slow oxidative), type IIa (fast
oxidative glycolytic), and type IIb (fast glycolytic) (Strasburg et al., 2008). Type I fibers,
which are red fibers, (e.g. in thigh muscle) have high myoglobin content which supplies
the oxygen for the oxidative metabolism, and fatigue occurs slowly. Mitochondria are the
organelles which are responsible for aerobic respiration of the cell. The reactions during
aerobic respiration require oxygen for ATP production, which is the energy source for all
the cell activities. Since the metabolism of type I fibers is oxidative, they have higher
number of mitochondria and the size of mitochondria is larger compared to the white
fibers. Furthermore, the lipid content of the fibers is higher. These characteristics enable
type I fibers to contract for longer time. The speed of contraction for these fibers is lower,

5
and their diameter is smaller than the white fibers. In contrast, type IIb fibers (e.g. in
breast muscle) have low myoglobin content and their metabolism is glycolytic. Thus,
fatigue occurs faster. Glycolytic metabolism can happen in the presence or absence of
oxygen. Due to this fact, type IIb fibers have the lowest number of mitochondria, and also
the size of their mitochondria is smaller compared to the red fibers. The lipid content of
these fibers is also lower than the red fibers. All these characteristics lead fatigue to
happen faster in these muscles compared to the red muscles. In addition, the contraction
speed of type IIb fibers is higher than the red fibers and their diameter is larger compared
to the red fibers (Barbut, 2002). Type IIa fibers are red, have medium amount of
myoglobin and fatigue occurs on a medium speed compared to type I and type IIb fibers
(Strasburg et al., 2008). According to the research by Smith et al. (1993) chicken
Pectoralis muscle (i. e. breast) contained 100% Type IIb muscle fibers. According to
Baeza and Brillard (1999), on average, chicken Sartorius muscle (i. e. thigh) was
composed of type I (16%), type IIa (54%), and type IIb (30%) fibers.
1.3 Alternatives to Increase ‘Low Value’ Dark Meat Utilization
The ‘low value’ meat includes both dark meat fishes and poultry dark meat. The
most important options to increase the utilization of ‘low value’ dark meat include
traditional surimi technology and pH shifting processing. These technologies aim to
concentrate and isolate muscle proteins from this type of raw materials.
1.3.1 Conventional (Traditional) Surimi Processing Technology
Surimi is a Japanese word which literally means “minced meat” and refers to a
frozen concentrate of fish myofibrillar proteins which has been stabilized by
antidenaturants (known as cryoprotectants). Surimi preparation was discovered 900 years
ago by Japanese fishermen. The ancient surimi process involved mincing the fish with
salt and spices, grounding it into a paste and cooking it to achieve a shelf stable gelled
product. With the addition of cryoprotectants, which are sugars, surimi will be protected
against freeze denaturation (Zamula, 1985; Vieira, 1996). As a result, surimi has a longer
stability when stored in frozen conditions. For the first time cryoprotectants were used by
Nishiya et al. (1960). In their study, after dewatering of fish myofibrillar proteins, they
added carbohydrates (sucrose and sorbitol) and froze the product afterwards. The results

6
indicated that freeze denaturation of proteins was inhibited. The discovery revolutionized
the surimi industry. Figure 1.2 shows an outline of the surimi manufacturing process. As
the figure shows, surimi production includes several steps which involve preparing the
fish for deboning, deboning process, mincing, washing and refining processes,
dewatering, addition of cryoprotectants, and finally freezing the final surimi product. The
details of each step are described in the following paragraph. Due to its reasonable price
and good sensory characteristics, surimi seafood is a well-known product in the market
(Shie and Park, 1999).
The aim of deboning process is to separate the flesh from the fish; usually carried
out using mechanical meat separators. Before proceeding to deboning, fish should be
prepared to get deboned. One method for fish preparation is removing head, gut and clean
the belly walls (Pigott, 1986). The main concern at this step is the complete removal of
viscera from the meat. Otherwise, the stability of the meat will be considerably decreased
due to microbial infection (Park and Lin, 2005). Deboning and mincing processes are
both using the same procedure, which is utilization of a roll-type meat separator. During
these operations, the prepared fish is pressed through a perforated drum. While meat
passes through the perforations and is conducted to the inner drum, bone, skin, etc. will
be left in the outer drum. The optimum size of the perforations is suggested to be 3- 4
mm in diameter (Takeda, 1971; Lee, 1984).
The minced meat thus obtained is then water washed. During the washing
process, the minced meat is washed with iced water with the ratio of 1:4 or 1:5, and this
process is repeated twice or three times. Salt can be added to the minced meat at the level
of 0.2 to 0.3% to help in removing the water from the meat (Southeast Asian Fisheries
Development Center, 1988).
Sarcoplasmic proteins and lipids are removed by the washing process.
Sarcoplasmic proteins include myoglobin, hemoglobin and other components, and lipids
include neutral lipids (triacylglycerols) and polar lipids (mainly phospholipids). The
presence of lipids (especially polar lipids) and sarcoplasmic proteins put the storage
stability of myofibrillar proteins at risk (Scopes, 1970; Park and Lin, 2005; Betti et al.,
2009). On the other hand, the amount of water used for washing is of great importance

7
due to economic issues. Therefore, choosing a suitable washing procedure which uses
reasonable amount of water and at the same time efficiently removes the dispersed fat
and water-soluble proteins is highly important. According to Adu et al. (1983) some
factors such as freshness of fish or the structure of washing unit affect the washing
process.
The aim of the refining process is to remove stromal proteins (mainly connective
tissues’ components such as collagen) from the meat using a refiner. The quality of the
refining process varies with the size of the refiner screen size and speed. For example, a
larger screen size and fast speed leads to higher yields as well as greater amount of
impurities in the isolated proteins. The composition of the fraction separated from the
myofibrillar proteins by the refiner was reported as protein (15.4%), moisture (81.4%),
lipid (1.9%) and ash (1.0%) (Kim and Park, 2003) in which the composition of the
protein part was mainly stromal proteins. After the washing process, the water content of
the meat is increased by approximately 10% (from 82% to 92%). The washed minced
meat is further passed through a screw press. The goal of this process is to dewater the
meat which means to remove the extra water gained from the washing process by
applying mechanical force. According to Park and Lin (2005) by the use of salts, such as
NaCl and CaCl2
As mentioned before, cryoprotectants play an important role in surimi production,
because they prevent muscle protein denaturation during frozen storage. Cryoprotectants
such as sucrose and sorbitol (9% w/w) are used for this purpose. A number of studies
performed to present new cryoprotectants to the industry. For example, trehalose (a
disaccharide) and a short-chain glucose polymer have been introduced by Cargill
Corporation and Roquette Corporation respectively (Hunt et al., 2001, 2002). Although
the mechanism of cryoprotectants are not fully understood yet, the addition of
cryoprotectants leads to improved water holding capacity of the myofibrillar proteins,
which further leads to a smoother paste in the final product. The last step in surimi
production is freezing; usually done at -30 °C. The temperature for transportation of the
frozen surimi is approximately -20 °C (Southeast Asian Fisheries Development Center,
at the level of 0.1 to 0.3%, separation of the moisture from the screw
press will be improved.

8
1988). A quality control test for the surimi product is the detection of metals. In order to
prevent lipid oxidation and increasing the surimi shelf life, it is of great importance to
detect metals in surimi final product, which is a part of surimi HACCP program. The
common metals detected are ferrous, copper, aluminum, and stainless steel, and
according to the FDA’s Health Hazard Evaluation Board metal fragments which have a
length of 7-25 mm are considered hazardous (FDA, 2001).
1.3.2 pH Shifting Processing: A New Technology for the Recovery of Functional
Proteins
Traditional surimi processing has been revolutionized by the introduction of a
new technique. The new technology which is named pH shifting processing is based on
shifting pH values, and is utilized in acid and alkaline solubilization processes (Hultin
and Kelleher, 1999, 2000). This process consists of different phases. The first phase is
homogenization of minced muscle with water. The ratio of meat to water varies between
1:5 to 1:9 (Nolsøe and Undeland, 2009). Homogenization is followed by the addition of
acid or alkali solution to bring the pH above 10.5 or below 3.5 where proteins have the
maximum solubility (see chapter 2). In order to remove lipids and stromal proteins from
the muscle, centrifugation is performed. During centrifugation, materials are separated
based on their density. Thus, fat (with least density) will be present as the top layer, while
other impurities which have more density (skin, bone and cellular membranes) will be
precipitated at the bottom of the centrifuge tube. Therefore, the middle fraction contains
solubilized proteins which will be collected and then adjusted to the isoelectric point of
the myofibrillar proteins, which is pH of 5.2 to 5.5. At this pH value, because
myofibrillar proteins have no net charge, they will precipitate. Another centrifugation
step is used to collect the sedimented proteins. After collection of the functional proteins
the pH value can be re-adjusted to the natural pH of the muscle. The final step is adding
cryoprotectants and freezing the final product. pH shifting processing is an ideal method
for the utilization of the low-value raw meat, especially because this kind of raw material
has high amount of fat which can be difficult to separate by conventional surimi process.
The advantages of pH shifting processing over traditional surimi production
include higher protein yields (85% vs. 70%) due to more recovery of sarcoplasmic

9
proteins, and more efficient removal of lipids, connective tissue and other impurities
thanks to the use of high-speed centrifugation (Kristinsson and Hultin, 2003; Hultin et al.,
2005; Sanmartin et al., 2009). Also by utilizing pH shifting processing, there is no need
for deboning the raw fish material (Nolsøe and Undeland, 2009). Using optimum amount
of water, both neutral and polar fractions of lipids can be separated from the meat and
thus, the shelf life of the final product will be increased due to reduction in lipid
oxidation. Also, the waste water obtained from the pH shifting processing contains less
solid parts due to the use of centrifugation (Park et al., 2003).
1.3.2.1 Factors Influencing Protein Recovery using pH shifting Processing and their
Comparison with Traditional Surimi Production
Due to the fact that traditional surimi production was not efficient enough, pH
shifting processing was introduced as a new technology to improve and overcome
problems in surimi processing. Most of the studies in this field are focused on fish as
raw material. Therefore, in this section, comparisons between traditional surimi
production and acid / alkaline solubilization process for fish have been reviewed, and
relevant studies on poultry sources have also been included.
A variety of processes were used for separation of myofibrillar proteins from fat
and pigments, and to increase oxidative stability of the final poultry products. One of
the methods was the use of centrifugation (Froning and Johnson, 1973; Dhillon and
Maurer, 1975). Young (1975) performed an aqueous extraction using a solution having
a pH of 7.0 followed by precipitation at a pH of 4.5, for the protein recovery from
mechanically deboned chicken meat (MDCM). Hernandez et al. (1986) used phosphate
buffer solution at a pH of 8.0 for protein extraction, and efficiently removed fat and
pigments from mechanically deboned turkey meat (MDTM). An aqueous washing with
added sodium bicarbonate (pH: 8.0) was used by Dawson et al. (1989) for myofibrillar
proteins’ isolation from mechanically deboned chicken meat. Some researchers such as
Jelen et al. (1982), McCurdy et al. (1986), Liang and Hultin (2003), and Betti and
Fletcher (2005) extracted myofibrillar proteins from poultry dark meat and poultry
residues by the use of high extraction pH and low precipitation pH.

10
Protein recovery, which is an important issue in both surimi and pH shifting
processes, is affected by some other factors. One of these factors is protein solubility at
alkali and acid pH ranges; which should be high to obtain good protein yields. Another
factor is the size of the sediments formed after the centrifugations which should be low to
increase the recovered proteins. The last factor is the solubility of the proteins at the
precipitation pH, which should be low in order to increase the proteins’ precipitation after
the centrifugation process. Kristinsson and Ingadottir (2006) who worked on tilapia fish
using alkaline and acid solubilization processes indicated protein yields of 61-68% for the
alkaline process, while the yields for the acid process was reported as 56-61%. Therefore,
in their study higher yields were obtained from the alkaline solubilization process. On the
other hand, a study performed in 2002 by Undeland et al. who worked on white muscle
of herring fish indicated protein yields of 68% and 74% for alkaline and acid protein
extraction, respectively. The reason for lower yield for alkaline solubilization was due to
the fact that during the first centrifugation larger sediment was formed, which reduced the
yield.
Batista (1999) tested alkali process on hake and monkfish and obtained the
average protein yield of 71.8%. To study the relationship of protein yield with
solubilization pH, Kim et al. (2003) used a 1:10 fish meat to water ratio, and acidic and
alkaline pH treatments. The results showed that at a pH of 12.0, the yield of proteins was
approximately 70% (maximum level), while the yield was around 60% (minimum level)
when a pH of 10.5 was used. However, due to economical issues, the amount of water
used in the process is of high importance. Thus, an efficient amount of water should be
chosen in a way to meet both yield and economical matters.
Froning and Johnson (1973) studied the effect of centrifugation on the quality of
mechanically deboned fowl meat. The centrifugation process led to the formation of three
phases including fat, aqueous, and meat fractions. The results indicated that the protein
content of the final product was significantly increased from 14.2% to 22.7 % using
centrifugation.
In a study conducted by Young (1975), protein extraction from mechanically
deboned poultry meat was carried out. Protein extraction was performed using solvents

11
with pH range of 5.5 to 7.5, and precipitation pH range of 4.0 to 7.5. Results suggested
the use of extraction pH values of above 6.5, with a precipitation pH of 4.5 for obtaining
maximum yield of 83.7%.
In a Study by Liang and Hultin (2003) alkaline solubilization (pH: 10.8) and acid
precipitation (pH: 5.2) was used for protein isolation from mechanically deboned turkey
meat. The ratio of meat to water was 1:6 (w:v), and dewatering was performed by
centrifugation at 10,000 × g for 25 min at 0 °C to 10 °C. The moisture content of the
isolated proteins was adjusted to approximately 80%, and cryoprotectants (sorbitol,
sucrose, sodium tripolyphosphate, and sodium bicarbonate) were added before freezing
the final product. The results showed that protein content of the final product was
increased from 12.0% to 17.0% compared to the raw meat.
Betti and Fletcher (2005) studied the effect of extraction and precipitation pH on
the yield of broiler dark meat. They studied extraction pH range of 8.0 to 12.0, followed
by precipitation pH range of 3.8 to 5.2. The better dry yields (above 70%) were obtained
at extraction pH values of above 10.5 and precipitation pH values of above 4.4.
Due to the problems associated with lipid oxidation, it is of great importance to
obtain a low level of lipid content in the final product. Several studies have been
performed on lipid reduction using acid or alkaline protein extractions. Lipid removal
depends on some factors such as the speed which is chosen for the first step of
centrifugation process, the lipid content of the raw meat and the water amount used in the
process. Since water is a polar solvent, using high amounts of water helps to separate the
polar fraction of lipids from the muscle proteins. More details are given on this topic in
chapter 2. During the first step of centrifugation process, the membrane lipids precipitate,
which reduce the risk of lipid oxidation in the final product. Richards and Hultin (2001)
studied the effect of lipid content on lipid oxidation in minced washed cod fish containing
0.1% fat. The results indicated high level of lipid oxidation for the final product. This
result could emphasize the role of hemoglobin as a strong prooxidant, which causes lipid
oxidation even when the amount of fat in the minced washed cod fish was as low as
0.1%. Thus, in order to prevent lipid oxidation in the presence of strong prooxidants like
hemoglobin, the lipid content of the final product should be very low. The following

12
studies were conducted on lipid reduction using acid, alkali and traditional surimi
processing.
The aim of a research conducted on several fish species including catfish, Spanish
mackerel, mullet, and croaker by Kristinsson and Demir in 2003, was to compare lipid
removal using surimi processing with acid and alkali aided process. The results indicated
that the highest amount of lipid loss was found using alkaline solubilization followed by
acid aided and traditional surimi process. A lipid removal of 68.4% (croaker), 81.4%
(mullet), 79.1% (mackerel), and 88.6% (catfish) was reported using alkaline process. The
lipid reduction values for acid process for the mentioned fish species were 38.1%, 58.0%,
76.9%, and 85.4%, respectively. Finally, the values for traditional surimi process were
16.7%, 10.4%, 72.1%, and 58.3%, respectively. The main difference between the
processing of surimi and the acid or alkaline process was the dewatering step. In acid and
alkali processes, centrifugation is used to remove the excess water from the recovered
proteins, while in surimi technology cheesecloth is used for this matter, which probably
affected removal of lipids. A study conducted by Cortes-Ruiz et al. (2001) on lipid
reduction of fish (Bristly sardine) led to a 67.4% lipid reduction in surimi process, and
88.3% for the protein recovered by acid solubilization process, while the total lipid
content of the fish was 3.3%.
Another study on lipid reduction was conducted by Kristinsson and Liang (2006).
In this study Atlantic croaker fillets containing 3.1% lipid, was used for acid, alkaline,
and surimi processing. The dewatering step was performed using centrifugation (10,000
× g) for 20 min for acid and alkali process, and by cheesecloth for the surimi process. The
results showed a fat reduction of 68% for the acid process, 38% for the alkali process,
and 17% for the surimi process.
A study conducted by Kristinsson et al. (2005) on channel catfish meat compared
lipid reduction using three processes of acid and alkali protein extraction with traditional
surimi processing. The results showed that the highest lipid reduction (88.6%) for
alkaline processing, while the value for acid and surimi processing were 85% and 58%,
respectively. The catfish meat was skinless fillets with a lipid content of 4.7% to 9.8%.
While the dewatering step for surimi process involved squeezing by cheesecloth, this step

13
for acid or alkali process was operated by centrifugation (10,000 × g) for 20 min in 2
steps. The reason for the noticeable difference in lipid reduction between the
conventional surimi process and the acid and alkaline processes was due to the first
centrifugation step in acid and alkali processes (Kristinsson and Demir, 2003). Lipid
removal was greater in acid and the alkaline processing than the traditional surimi
processing due to the use of centrifugation. In most of the comparative studies on the acid
and alkaline solubilization processes in fish, lipid reduction was higher by alkaline
solubilization.
A study by Froning and Johnson (1973) was performed to improve the quality of
mechanically deboned fowl meat by centrifugation. The results showed that
centrifugation process (20,000 rpm for 15 min at 5 °C) had a significant effect on fat
reduction from mechanically deboned poultry meat. Total fat content of the recovered
proteins using centrifugation was decreased by 62.8%. The final product of an alkaline
extraction followed by acid precipitation from mechanically separated poultry residues
showed a 51.3% decrease in total fat content (Jelen et al., 1982).
In a study by Dawson et al. (1989) an aqueous washing process was used to
remove fat and pigments from mechanically deboned chicken meat. MDCM was mixed
with a solution of water with added sodium bicarbonate (pH: 8.0) to solubilize
myofibrillar proteins which are salt soluble. The ratio of meat to water was 1:4 (w:w), a
pH of 6.8 was used to precipitate myofibrillar proteins, and separate them from pigments,
and dewatering was performed by centrifugation. The results of this study showed that fat
content of the extracted MDCM was decreased by 88.3% compared to the raw MDCM.
The initial fat content of the MDCM was 12.8%.
Total fat content of the final product was decreased by 93.3% in a study using
alkaline solubilization (pH: 10.8) and acid precipitation (pH: 5.2) which was performed
on mechanically deboned turkey meat. The ratio of meat to water was 1:6 (w:v), and
centrifugation (10,000 × g for 25 min, at 0 - 10 °C) was used for dewatering (Liang and
Hultin, 2003).
14
Another factor for the quality of meat products is lipid oxidative stability which is
related to the product storage stability. Minced meat products as well as products
containing greater amount of prooxidants are those which are at high risk of lipid
oxidation. This could be explained by the fact that after mincing process with the
increased lipid surface being exposed to oxygen and prooxidants, lipid oxidation
increases. Because of the activation of heme proteins in acidic conditions leading them to
act as a prooxidant, the acid solubilization process caused more lipid oxidation than the
alkaline process. In addition, the exposure of minced washed cod fish to acidic conditions
(pH: 2.5) for 20 minutes makes the muscle more susceptible to oxidation (caused by
hemoglobin) compared to native washed minced fish meat (Kristinsson, 2001). Acidic
conditions exist in both acid and alkali processes. However during the acid solubilization
process there is a greater exposure to acidic conditions. As has been mentioned before,
there is an exposure to low pH (isoelectric point i.e. pH: 5.2-5.5) for myofibrillar
proteins’ precipitation, which would lead to lipid oxidation. Kristinsson and Liang (2006)
reported more lipid oxidation for the recovered proteins from Atlantic croaker fish by
acid process compared to the alkaline process. In a study conducted by Kristinsson and
Demir (2003) on some fish species, lipid oxidation of the protein isolates using acid,
alkali, and surimi process was evaluated. The species of fish used in this study included
catfish, croaker, mullet, and Spanish mackerel, and the temperature of the water used in
the process was 4 °C. After the process, the protein isolates obtained from all three
processing methods were put in freezer bags, and kept in the fridge (4 °C). Afterwards,
every third day samples were chosen and were put in the freezer (-70 °C) to prevent lipid
oxidation. After this treatment, thiobarbituric acid reactive substances (TBARs) were
measured as a method for lipid oxidation evaluation. The results indicated that the lowest
amounts of lipid oxidation were found with surimi process compared to acid and alkali
processing. The highest level of lipid oxidation was found with the acid solubilization
process followed by the alkali aided process. The reason for the more lipid oxidative
stability of surimi process would be that during this process, the minced meat is not
subjected to low pH, which prevents hemoglobin and myoglobin activation leading to
reduction in lipid oxidation.

15
A potential solution to reduce lipid oxidation is the addition of compounds such
as metal chelators which can act like antioxidants and improve lipid oxidative stability of
the recovered proteins. A study by Undeland et al. (2005) indicated that chelating agents
such as ethylenediaminetetraacetic acid (EDTA) (0.04%) and sodium tripolyphosphate
(0.2%), and also reducing agents such as erythorbate (0.2%), could act as antioxidants
and improve lipid oxidative stability of acid-processed fish and also during the storage of
the protein isolate. The results of this work showed that while the addition of only
erythorbate or in combination with EDTA and sodium tripolyphosphate had a significant
effect in decreasing lipid oxidation in the final protein isolate, without using these
antioxidants, severe lipid oxidation occurred in the protein isolate.
Lipid oxidative stability of mechanically deboned poultry meat which was
centrifuged was higher than those without centrifugation (Froning and Johnson, 1973).
This finding indicated that fat reduction caused by centrifugation led to higher stability to
lipid oxidation for the final product.
In a study conducted by Dawson et al. (1990) myofibrillar proteins from
mechanically deboned chicken meat were extracted by a phosphate solution (pH: 8.0),
followed by a precipitation pH of 6.8, and dewatered by centrifugation. The results of the
study indicated that even though total fat content decreased by 88.3%, extracted meat was
more susceptible to lipid oxidation than the raw meat. The lower lipid oxidative stability
of extracted meat compared to the raw meat was due to unsuccessful removal of
phospholipids which are more susceptible to lipid oxidation.
1.3.3 Functional Properties of Muscle Proteins and their Link to pH Shifting Process
and Traditional Surimi Production
1.3.3.1 Protein Solubility
The definition of solubility or extractability of proteins is the percent of the total
proteins extracted by water or a suitable solvent in specific conditions (Sikorski, 2007).
One of the major factors affecting protein solubility in aqueous solutions is the pH of the

16
solution. In alkaline and acidic conditions, proteins carry a negative and positive charge,
respectively. This leads to repulsion between the proteins which finally cause proteins to
be solubilized. On the other hand, because of the fact that proteins carry no net charge at
the isoelectric point, they precipitate at this pH. For the isolation of different kinds of
proteins from food, solubility difference is considered as an important issue (Kristinsson,
2001). Another factor which affects solubility is denaturation of the proteins. Solubility
may decrease when proteins are denatured. According to Sikorski (2007) during heating,
denaturation which is followed by aggregation of the proteins leads to an increase in
hydrophobicity, and as a result, solubility reduces. The other critical factor which affects
protein solubility is the ionic strength of a solution. Ionic strength determines the
concentration of ions in a solution, and is calculated by the following formula:
2
21
ii ZC∑=µ
In this formula Ci is the concentration of an ion and Zi is the net charge of the ion
(Fox and Foster, 1957). When ionic strength of a salt solution is low (i. e. lower than 0.5)
protein solubility can increase or decrease depending on the amino acid composition on
the protein surface. For example, for soy proteins, because hydrophobic (non-polar)
amino acids are located on the surface of the protein molecule, they are unable to bind to
the ions of the salt solution, and therefore, solubility of the proteins is reduced. In
contrast, β-lactoglobulin and myosin have hydrophilic (polar) amino acids located on the
surface of the protein molecule, thus they can bind to the ions in the salt solution, and
increase protein solubility. With the increase in ionic strength of a salt solution (i. e. μ
>1), different ions affect solubility in different ways. For example, for salt solutions
containing ions of SO42- and F–, solubility decreases with the increase in the salt
concentration (Damodaran, 2008). It means that salt solutions containing these ions are
able to precipitate proteins from the solution. This concept is named as ‘salting out’. On
the other hand, when salt solutions containing ions of Br–, I–, SCN–, and ClO4– are added
to the protein solution, solubility increases with the increase in the salt concentration.
This phenomenon is named ‘salting in’ (Sikorski, 2007). When ionic strength of a
solution is kept at a constant amount, protein solubility can either increase or decrease

17
based on the anions and cations which are present in the solution. In this condition, while
anions which most increase protein solubility involve SCN–, ClO4–, I–, Br–, Cl–, F–, and
SO42- respectively, cations which most decrease protein solubility include Ca2+, Mg2+,
Li+, Na+, K+, and NH4+
1.3.3.2 Protein Gelation
, respectively. This ranking of anions and cations is named the
Hofmeister series (Damodaran, 2008).
Proteins from different sources of animal or plant have the gel forming ability. In
case of myofibrillar proteins, when they are extracted from muscle and exposed to heat,
they form an irreversible semisolid, three-dimensional structure, which is called a gel.
Since myofibrillar proteins form the major component of processed meat products,
gelation is an important factor in meat products industry (Acton et al., 1978; Barbut,
1995).
Myofibrillar protein gelation process involves several steps. During the first step,
muscle fibers are extracted by the use of salt. Afterwards, with the application of heat,
protein denaturation occurs. The next step is aggregation, and it happens when unfolded
proteins connect with the surrounding proteins. The last step occurs when aggregates
cross-link which leads to the formation of a three-dimensional gel network and water
entrapment within the network (Tarte and Amundson, 2006).
1.3.3.3 Rheological Properties
1.3.3.3.1 Dynamic Mechanical Analysis (DMA) Dynamic mechanical analysis (DMA) is a method which is used to study dynamic
viscoelastic behavior (DVB) of a material. For this purpose, dynamic or oscillatory tests
are performed. During DMA, dynamic stress at a given frequency is applied to a material.
Viscoelastic materials show both elastic (solid) and viscous (liquid) behaviors. The
rheological factors which show DVB of the material, includes the storage modulus (G'),
the loss modulus (G''), and loss angle (Tan delta). The storage modulus (G') is related to
the elastic (solid) character of the material which indicates the energy which is stored
during deformation (Peleg et al., 1989; Hamann et al., 1990). On the other hand, the loss
modulus (G'') is related to the viscous (liquid) behavior of the material which indicates

18
the energy which is dissipated as the material is deformed (Vodovotz et al., 2001). For
example if we assume a solid which is ideally elastic, all the energy is stored (i.e. G''= 0)
but for a viscous material in which all the energy is dissipated, G' is equal to zero. Tan
delta which is defined as the ratio of G''/G' (Dogan and Kokini, 2007), shows the degree
of viscoelasticity of a sample. If tan delta is a low value for a material, it means that the
material has a higher elasticity (higher G' value) and is a more solid-like material.
1.3.3.4 Textural Properties
Texture of foods is an attribute which is strongly related to consumer preference,
selection, and satisfaction of food products. Food industry efforts are to develop the
proper texture for food products (Rohm, 1990; Gunasekaran and Ak, 2003). According to
the International Organization for Standardization, texture of a food is defined as the
rheological and structural attributes of a food product which is perceived by human
senses (ISO, 1992). Texture of meat is an attribute that is determined by several factors
such as hardness, springiness, chewiness, and cohesiveness. Differences in meat texture
are related to the composition and structure of the meat including different kinds of
proteins as well as fat and connective tissue. Some other factors such as cooking also
affect meat texture (Bailey, 1972; Solomon et al., 2009).
1.3.3.4.1 Textural Profile Analysis (TPA) Textural properties of a material are measured by a technique called textural
profile analysis. According to Mallikarjunan (2006), cohesiveness, springiness,
chewiness, resilience and hardness are the textural attributes which are measured by the
utilization of TPA technique. Definition of these parameters is important because each
factor deals with different aspects of a material’s texture. While the amount of work
needed to chew a solid sample until the swallowing state is determined by chewiness
value, the ability of a material to recover its original shape after the removal of the force
is known as springiness. Resilience, on the other hand, determines an extent to which the
sample can fight to get back to its original position. Cohesiveness determines the amount
of deformation for a material before it breaks, and finally, hardness is the maximum force
needed to compress a material. By determining each of the above factors, some
information could be obtained about the texture of a material.

19
1.3.3.5 Water Holding Capacity
Water holding capacity (WHC) which is one of the important attributes of both
fresh meat or processed meat products indicates the extent to which meat can keep its
moisture inside when some conditions apply (Swatland, 2002). These conditions can be
the application of temperature (e.g. cooking), or compression. A number of factors affect
WHC of meat such as pH, animal species, and age. The most important factor is the pH
of the meat. In order to study the effect of pH on WHC of the meat, a study has been
performed on beef (Grau et al., 1953). The beef samples were immersed in buffer
solutions with different pH values and their weight gain were measured afterwards. The
results indicated the lowest weight gain for the samples which were immersed in the
buffer solution with the pH value of 5.2. The reason could be explained due to the fact
that pH of 5.2 is the isoelectric point for meat proteins. At this pH the net charge of the
proteins is equal to zero, hence they are attracted to each other, and as a result they
cannot hold water inside them. Thus, their WHC was at its minimum level (Honikel,
2009). The reason for WHC to be such an important factor for the meat is that it is
associated with the appearance of the meat when exposed to heat treatment (i.e. cooking),
and contributes to the juiciness of the meat. When it comes to comminuted meat products
(e.g. sausages), WHC is particularly an important quality attribute. During the production
of comminuted meat products, due to mincing process of the meat, structure of the meat
proteins which hold the water is destroyed, and therefore, the ability of the meat to hold
the water will be decreased (Lawrie and Ledward, 2006). Therefore, WHC greatly affects
the quality of the comminuted meat products.
1.3.3.6 Cooking Loss
One of the important factors which determine the quality of the meat product is
cooking loss. Cooking loss indicates the amount of water which is lost during cooking,
and therefore, it is associated with water holding capacity of the meat. When meat is
heated, if the meat has lower cooking loss, it will be understood that the meat had higher
ability to hold water, and therefore, it has greater WHC. If the water holding capacity of a
meat product is low, the meat will lose more amount of water during cooking leading to
production of a drier product, which can be unacceptable to consumers (Barbut, 2002).

20
Cooking loss occurs with the denaturation of meat proteins. During cooking, the structure
of meat proteins change by shrinkage of muscle fibers and connective tissues, and
aggregation of proteins occurs leading to water release from the cells (i.e. decrease of
WHC). The temperature at which the meat proteins denature is at the range of 37 °C to 75
°C, and the recommended internal temperature for cooking is 75 °C (Honikel, 2009).
1.3.3.7 Emulsification Capacity
Emulsification capacity, which is an important quality factor especially in
comminuted meat products, is defined as the ability of the proteins to emulsify oil. In
order to measure emulsification capacity, liquid oil is gradually added to meat protein
solution, while using a homogenizer to mix the oil. The aim is to determine the point at
which proteins cannot emulsify more oil. This point is known as the breakdown point,
and is the state when oil and protein phases separate (Barbut, 2002). The breakdown
point can be measured by a sudden decrease in viscosity or conductivity of the solution,
since the fat phase has lower conductivity. The method is used to measure the
emulsification capacity for proteins from chicken meat (Maurer et al., 1969).
1.3.3.8 Protein Denaturation
In food processing, denaturation is defined as an irreversible change which occurs
when proteins unfold and hydrophobic amino acids, which are originally located in the
interior of the protein molecule, are exposed. A number of factors cause protein
denaturation such as change in pH (by the addition of alkali or acid) and temperature (i.e.
cooking), or addition of ions (e.g. NaCl). Denaturation affects a number of factors such as
solubility and hydrophobicity of the proteins (Sikorski, 2007). There will be a decrease in
solubility as well as an increase in hydrophobicity of the denatured proteins compared to
the native state. Denaturation of meat proteins occurs at the temperature range of 30-55
°C. For example, the denaturation temperature for myosin is 50-55 °C (Lesiow and
Xiong, 2001; Tarte and Amundson, 2006). According to Wang and Smith (1994) and
Smyth et al. (1999) the denaturation temperature of myosin varies with pH and ionic
conditions. A pH of 5.5-6.1 and ionic strength of 0.6 M NaCl are the typical conditions
used in processed meat industry.
21
1.3.3.9 The Effect of Surimi and pH Shifting Process on Functional, Textural, and
Rheological Properties of the Recovered Proteins
The gelation properties of the recovered proteins play an important role in the
preparation of processed muscle food products. Two important factors which influence
the quality of the gel formed by the recovered proteins are temperature and the quality of
raw material used for processing. In an investigation conducted by Kristinsson and Demir
(2003), surimi and acid / alkali process were tested on four different fish species, and the
gel quality measurements were performed by oscillatory tests. The best gel was obtained
for the protein isolate prepared using alkali process, and the gel obtained from the acid
processed mince was of the lowest quality. The quality of the surimi gel was between the
alkali and acid processed ones. These results could be explained by the lower protease
activity during alkali process, which caused less protein breakdown. Thus, when the
protein isolate obtained from the alkali process was exposed to gelation, due to the higher
amount of protein-protein interaction and aggregation, the resultant gel had higher
quality. According to Nolsøe and Undeland (2009) the results of several comparative
studies on fish species about the quality of gel for the recovered proteins during acid and
alkali process, indicated better gel formation for protein isolates obtained by alkaline
aided process. Regarding the quality of raw material as well as comparison of acid and
surimi process, a study was conducted on fresh sardine fish to compare different gels
obtained from surimi and acid process based on textural profile analysis (hardness and
cohesiveness, and elasticity) (Cortes-Ruiz et al., 2001). The raw material for acid process
included fresh sardines and sardines which were stored on ice for 5 days. The highest
hardness value was reported for the proteins recovered by the acid process which used the
5-day stored sardines as the starting material. This could be explained by the more
protein content (+ 15%) in the final product prepared using acid process. Higher hardness
values were probably because of more protein-protein interaction and aggregation which
might have led to harder but less elastic gels. Regarding textural properties, maximum
values were reported for cohesiveness and elasticity of the gels obtained from the surimi
process, and minimum values were associated with the proteins recovered by the acid
process using the stored fish as the raw material.

22
In a study conducted by Li (2006) isolated myofibrillar proteins from spent hens
were added to chicken breast and pork ham to evaluate textural properties. A solution
containing 6% myofibrillar proteins was injected into chicken breast and pork ham at a
ratio of 20% of the meat weight. The results showed higher hardness for chicken breast as
well as higher hardness and chewiness for pork ham with added myofibrillar proteins
compared to those without the added proteins. Therefore, the use of isolated proteins
from low value poultry meat sources for functional properties’ improvement of meat
products was indicated in the study.
According to Froning and Johnson (1973) cooking loss of the recovered proteins
from mechanically deboned poultry meat after centrifugation treatment was lower
compared to those with no centrifugation treatment. The lower cooking loss for the
recovered meat might be explained by the higher protein content of it, which led to higher
water holding capacity for the recovered proteins.
An alkaline solubilization with an acid precipitation was performed on
mechanically deboned turkey meat (Liang and Hultin, 2003). The authors found that
cooking loss of the cooked protein isolate decreased significantly compared to that of
cooked raw meat. This finding indicated that higher water holding capacity for the
protein isolate was due to its higher protein content. In addition, a good gel forming
ability was reported for the protein isolate.
1.3.4 Color and its Link to the Recovered Proteins from Surimi and pH Shifting
Process
Color is an important meat quality which greatly affects consumers’ preference
(Froning, 1995). Total heme pigments including myoglobin and hemoglobin are
responsible for the color of meat. The meat pigment is mainly myoglobin because
hemoglobin, which is the blood pigment, will be mostly removed after the slaughter.
Therefore, myoglobin is the determining factor for the meat color, and variations in meat
color indicate the differences in myoglobin content. For example, poultry breast and thigh
which are known as white and dark meat respectively, easily can be differentiated from
each other (Schwartz et al., 2009). Since myoglobin and hemoglobin contain iron, the
23
difference in iron content of white and dark chicken meat is the result of variations in
total heme pigments (see Table 1.1).
The CIE Lab color scale which is based on the values of redness (a*), yellowness
(b*), and lightness (L*) is a well-known method for measuring the color of a sample. In
this regard, the moisture content of the sample is an important factor influencing the color
measurements. If the sample has more water content, because of the greater light
reflection, it will have more lightness value. The CIELAB color attributes for chicken
dark and white meat are presented in Table 1.2.
The factors influencing the color of the recovered proteins are those associated
with the raw starting material such as the amount of pigments, blood, and dark muscle.
Therefore, different processes should be applied to different fish species for obtaining the
lightest (in color) possible protein isolates, because consumers preferred the whitest color
for the protein isolates (Tabilo-Munizaga and Barbosa-Canovas, 2004). This shows that
color is an important factor which affects consumers’ selection for the products made
from isolated proteins. The results from comparative studies performed on surimi, acid
and alkali process indicated the maximum whiteness value for the protein isolates
obtained from the surimi process, followed by alkali and acid processes. According to
Nolsøe and Undeland (2009) the greater whiteness value in surimi production could be
explained by the washing process which might have helped to remove higher amounts of
heme pigments from the protein isolate. The higher whiteness value for the proteins
recovered by alkaline solubilization processes compared to the ones obtained from the
acid solubilization process indicated that alkali aided process was more efficient in the
heme pigments’ separation from the fish meat.
A study by Hernandez et al. (1986) on mechanically deboned turkey meat
indicated that protein extraction using phosphate buffer with a pH of 8.0 could efficiently
remove heme pigments, increased lightness of the final product by 51%, and reduced its
redness by 64%.
There was a significant increase in lightness value of the extracted meat compared
to the raw meat from mechanically deboned chicken meat using an aqueous washing with

24
added sodium bicarbonate (pH: 8.0). Redness value of the final product was also
significantly decreased (Dawson et al., 1989).
1.3.5 The Effect of Surimi and pH Shifting Process on the Recovered Proteins’
Stability during Storage
One of the important parameters which determines the quality of the protein
isolate is the stability of the isolated proteins during frozen storage which is considered as
an advantage for surimi production. As has been mentioned previously, in surimi
technology cryoprotectants are compounds such as sugars (sucrose and sorbitol) which
are able to reduce the protein denaturation during freezing and thawing process as well as
prevent aggregation (Matsumoto, 1980). The reason is that cryoprotectants avoid proteins
becoming unfolded (Carpenter and Crowe, 1988). Thus, in this way they increase the
stability of protein products (e.g. surimi) when stored frozen. Chemicals which have been
used as cryoprotectants in muscle proteins included sucrose, sorbitol, phosphates, and
sodium tripolyphosphate (Nishiya et al., 1961; Mahon, 1964; Matsumoto, 1978, 1979;
Park and Lanier, 1987; Park et al., 1988). One action which has been reported for
phosphates (e.g. sodium tripolyphosphate) as a cryoprotectant is that they decrease the
negative effect of frozen storage on myofibrillar protein solubility (Jittinandana et al.,
2003).
A study was conducted on the recovered proteins (Thawornchinsombut and Park,
2006) from Pacific whiting fish regarding the effect of frozen storage on textural
properties. In order to determine the effect of cryoprotectants on the stability of proteins
during storage, they divided each sample into two parts, and used cryoprotectants in one
part but not in the other. Afterwards, the samples were exposed to freezing and thawing
steps which were repeated three times. The temperatures for freezing and thawing were -
18 °C and 4 °C, respectively. The results indicated that the best quality gels were
obtained from the recovered proteins using an alkali process containing cryoprotectants.
In contrast, the lowest gel quality was associated with the gels obtained from the protein
samples without cryoprotectants. From this study, it can be concluded that using
cryoprotectants for the protein isolates obtained from alkali process is of high importance
to avoid freeze denaturation.

25
On the other hand, the addition of cryoprotectants is not the only way of
increasing the stability of a protein product during frozen storage. Jaczynski et al. (2006)
reported that by separation of membrane lipids from the protein isolate, even without
using cryoprotectants, the stability of freeze-dried fish protein could be improved.
1.4 Potential Applications of the Recovered Proteins by pH Shifting Methods
The goal of pH shifting technology is the utilization of low value meat and
development of new healthy value-added products. By the advantages which were
mentioned for pH shifting technology, and by the comparison of different chemical and
functional properties of the proteins recovered by this method, it can be concluded that
pH shifting technology could better utilize low value dark meat than the traditional surimi
processing. The US. Food and Drug Administration (2004) has confirmed the isolated
proteins from seafood and poultry sources using pH shifting processing as Generally
Regarded As Safe (GRAS).
The final product of the recovered proteins using pH shifting processing can be in
the form of liquid or powder. Proteus Industries introduced isolated proteins as coating
for battered and breaded products (www.proteusindustries.com). Other applications
include using recovered proteins as ingredients to improve functional properties of food
products. For example, isolated proteins can be used as emulsifiers (Petursson et al.,
2004) and to improve water holding capacity of whole-muscle meat products (Li, 2006).
The coating product “Nutrilean™” which is in the form of powder has been produced by
Proteus Industries using acid process on both chicken and fish sources. Nutrilean™ is a
pure protein isolate, and it can be used as a batter ingredient which can be sprayed on to
any kind of meat before frying. Nutrilean forms a thin barrier outside the coated product
which prevents moisture from escaping. Thus, during frying, less oil can be absorbed into
the product. This way, the fat content of the final fried product was reported to decrease
by 25% to 75%. Water holding capacity of the final cooked product was also improved.
As a consequence, moisture loss from drying out the product under the heat lamps in
restaurants or fast foods was reduced leading to more juicy products. Even the color of
the final product has been reported to improve to a richer bronze color, which is a more

26
natural color and is usually found in home-made products. According to the Proteus
Industries the technology can be applied to meat from all sources. The food industries
which are currently using Nutrilean technology involve Comfort Creek, Good Harbor,
and Sunrise Foods.
1.5 Research Objectives
1.5.1 Main Objective
The objective of this thesis project was to examine the use of high pH extractions and
low precipitation pH on poultry dark meat in order to produce functional proteins extracts
suitable for the preparation of further processed meat products.
1.5.2 Specific Objectives
• Determine the effect of pH, in the range of 10.5 to 12.0, on alkaline solubilization
process of chicken dark meat
• Evaluate the effect of pH on solubility and extractability of the proteins from chicken
dark meat
• Investigate the effect of alkali aided process on protein yield and composition of
chicken dark meat
• Establish the effect of alkali aided extraction on the distribution of fatty acids in
between neutral and polar lipid fractions of chicken dark meat
• Study the effect of alkali aided extraction on color characteristics of the chicken dark
meat.
• Evaluate the effect of alkali aided process on lipid oxidative stability of chicken dark
meat
• Determine the effect of alkaline solubilization process on the textural and rheological
characteristics of chicken dark meat
27
• Evaluate the influence of cooking on the water holding capacity of alkali extracted
chicken dark meat
1.6 Approach
The objectives of this thesis were assessed in two phases followed by laboratory
analysis.
Phase 1. Four extraction pH values (10.5, 11.0, 11.5, and 12.0) were chosen for alkali
protein extraction from chicken dark meat. Each experiment and each assay was done at
least in triplicate. Protein yield, protein and lipid composition, fatty acid profile, color
characteristics and TBARS were studied in chicken dark and extracted meat.
Phase 2. Four extraction pH values (10.5, 11.0, 11.5, and 12.0) were chosen for alkali
protein extraction from chicken dark meat. Each experiment and each assay was done at
least in triplicate. Textural and rheological characteristics, as well as cooking loss and
expressible moisture have been studied.

28
1.7 TABLES
Table 1.1. Protein (%), lipid (%), moisture (%), and iron (mg/100 g of meat) content of skinless chicken dark and white meat
Chicken
Meat
Protein
content
Lipid
content
Moisture
content
Iron content
(mg/100g meat)
Dark Meat 20.1 4.3 75.9 1.0
White Meat 23.2 1.6 74.9 0.7
Modified from: USDA, 1999.

29
Table 1.2. Color attributes (L*, a*, and b*) of chicken dark and white meat
Chicken Meat Lightness (L*) Redness (a*) Yellowness (b*)
Dark Meat 59.95 1.11 3.98
White Meat 62.11 0.99 3.55
Modified from: Perez-Alvarez, and Fernandez-Lopez, 2009.

30
1.8 FIGURES
Figure 1.1. Schematic diagram of muscle structure, starting from a cross section of a whole muscle (a), including the layers of connective tissue, the muscle bundle (b), fibre (c), myofibril (d) and myofilaments (e). Reprinted from POULTRY PRODUCTS PROCESSING: AN INDUSTRY GUIDE. EBOOK by Shai Barbut. Copyright 2001 by Taylor & Francis Group LLC - BOOKS. Reproduced with permission of Taylor & Francis Group LLC – BOOKS in the format Dissertation via Copyright Clearance Center.

31
Figure 1.2. Flow chart of surimi manufacturing. Reprinted from SURIMI AND SURIMI SEAFOOD, SECOND EDITION by J. W. Park and T.M. JOHN LIN. Copyright 2005 by Taylor & Francis Group LLC - BOOKS. Reproduced with permission of Taylor & Francis Group LLC - BOOKS in the format Dissertation via Copyright Clearance Center.
32
1.9 REFERENCES
AAFC (Agriculture and Agri-Food Canada). 2006. Profile of the Canadian chicken
industry. http://www.agr.gc.ca/poultry-volaille/prindc_eng.htm Accessed Nov. 2009
Acton, J. C., G. R. Ziegler, and D. L. Burge. 1978. Functionality of muscle constituents
in the processing of comminuted meat products. Crit Rev Food Sci Nutr. 18:99-121.
Adu, G.A., Babbitt, J.K., and Crawford, D.L. 1983. Effect of washing on the nutritional
and quality characteristics of dried minced rockfish flesh. J. Food Sci. 48:1053–1060.
AFAC (Alberta Farm Animal Care). 2003. Page 3. Spent hen disposal across Canada in
Farm Animal Welfare Insights. http://www.afac.ab.ca/insights/insights4.pdf Accessed
Sep. 2009.
Baeza, E., J. P. Brillard. 1999. Effect of sex reversal on muscle development of chicken.
Station de Recherches Avicoles, Nouzilly, France.
http://www.cabi.org/animalscience/Uploads/File/AnimalScience/additionalFiles/WPS
A_files/baeza_2.pdf Accessed Jan. 2010.
Bailey, A. J. 1972. The basis of meat texture. J. Sci. Food Agric. 23:995-1007.
Barbut S. 1995. Importance of fat emulsification and protein matrix characteristics in
meat batter stability. J. Muscle Foods. 6:161-177.
Barbut, S. 2002. Basic anatomy and muscle biology. Pages 37-47. Measuring sensory and
functional properties. Pages 494 and 510 in Poultry Products Processing. S. Barbut
ed. CRC Press, Boca Raton, FL.
Batista, I. 1999. Recovery of proteins from fish waste products by alkaline extraction.
Eur. Food Res. Technol. 210:84-89.
Betti, M., and D. L. Fletcher. 2005. The influence of extraction and precipitation pH on
the dry matter yield of broiler dark meat. Poult. Sci. 84:1303-1307.

33
Betti, M., T. I. Perez, M. J. Zuidhof, and R. A. Renema. 2009. Omega-3 enriched broiler
meat: 3.Fatty acid distribution between triacylglycerol and phospholipid classes.
Poult. Sci. 88:1-15.
Bilgili, S. F. 2000. Poultry products and processing in the international market place.
Auburn University, Auburn, AL. http://www.fass.org/fass01/pdfs/Bilgili.pdf
Accessed Sep. 2009.
Carpenter, J. F., and J. H. Crowe. 1988. The mechanism of cryoprotection of proteins by
solutes. Cryobiology. 25:244-255.
CFC (Chicken Farmers of Canada). 2008. Annual report 2008. Chicken Farmers of
Canada. http://www.chicken.ca/app/wa/mediaEntry?mediaEntryId=5230 Accessed
Nov. 2009.
Cortes-Ruiz, J. A., Pacheco-Aguilar R., Garcia-Sanchez G., and Lugo-Sanchez M. E.
2001. Functional characterization of a protein concentrate from bristly sardine made
under acidic conditions. J. Aquat. Food Prod. Technol. 10:5-23.
Damodaran, S. 2008. Amino acids, peptides, and proteins. Page 268 in Fennema’s Food
Chemistry. S. Damodaran, K. L. Parkin, and O. R. Fennema, eds. CRC Press, Boca
Raton, FL.
Dawson, P. L., B. W. Sheldon, and H. R. Ball. 1989. Pilot-Plant washing procedure to
remove fat and color components from mechanically deboned chicken meat. Poult.
Sci. 68:749-753.
Dawson, P. L., B. W. Sheldon, D. K. Larik, and H. R. Ball. 1990. Changes in the
phospholipid and neutral-lipid fractions of mechanically deboned chicken meat due to
washing, cooking, and storage. Poult. Sci. 69:166-175.
Dhillon A. S., and A. J. Maurer. 1975. Stability study of comminuted poultry meats in
frozen storage. Poult. Sci. 54:1407-1414.

34
Dogan, H., and J. L. Kokini. 2007. Rheological properties of foods. Page 13 in Handbook
of Food Engineering. 2nd ed. D. R. Heldman , and D. B. Lund, eds. CRC Press, Boca
Raton, FL.
FAO (Food and Agriculture Organization). 2009. Food Outlook- June 2009. FAO.
Economic and Social Development Department.
http://www.fao.org/docrep/011/ai482e/ai482e08.htm#36 Accessed Sep. 2009.
FDA (Food and Drug Administration). 2001. Fish and Fisheries Products Hazards and
Controls Guidance.
http://www.fda.gov/Food/GuidanceComplianceRegulatoryInformation/GuidanceDoc
uments/Seafood/FishandFisheriesProductsHazardsandControlsGuide/default.htm
Accessed Sep. 2009.
FDA (Food and Drug Administration). 2004. GRAS Notice No. GRN 000147.
http://www.cfsan.fda.gov/~rdb/opag147.html Accessed Sep. 2009.
Fletcher, D. L. 1997. Poultry meat color. Pages 159–175 in Proc. Poult. Sci. Symp. Poult.
Meat Sci. Univ. Bristol, Bristol, UK.
Fox, S. W., and J. F. Foster. 1957. The solubility behavior of proteins. Pages 241-242 in
Introduction to Protein Chemistry. S. W. Fox, and J. F. Foster, eds. John Wiley &
Sons, New York, NY.
Froning, G. W., and F. Johnson. 1973. Improving the quality of mechanically deboned
fowl meat by centrifugation. J. Food Sci. 38:279-281.
Froning, G. W. 1995. Color of poultry meat. Poult. Avian Biol. Rev. 6:83–93.
Goddard, E., B. Shank, C. Panter, T. Nilssson, and S. Cash. 2007. Canadian chicken
industry: consumer preferences, industry structure and producers benefits from
investment in research and advertising. Univ. Alberta, AB, Canada. 07-04:33.
http://www.uofaweb.ualberta.ca/re//pdfs/PR%2007-04.pdf Accessed Nov. 2009.
Grau, R., R. Hamm, and A. Baumann. 1953. Über das Wasserbindungsvermögen des
toten Säugetiermuskels. I. Mitteilung. Biochemische Zeitschrift. 325:1-11.

35
Gunasekaran, S., and M. M. Ak. 2003. Cheese texture in Cheese Rheology and Texture.
S. Gunasekaran, and Ak, M. M., eds. CRC Press, Boca Raton, FL.
http://www.crcnetbase.com.login.ezproxy.library.ualberta.ca/doi/pdfplus/10.1201/978142
0031942.ch7 Accessed Feb. 2010.
Hamann, D. D., S. Purkayastha, and T. C. Lanier. 1990. Applications of thermal scanning
rheology to the study of food gels. Page 306 in Thermal Analysis of Foods. V. R.
Harwalkar, and C. Y. Ma, eds. Elsevier, New York, NY.
Hernandez, A., R. C. Baker, and J. H. Hotchkiss. 1986. Extraction of pigments from
mechanically deboned turkey meat. J. Food Sci. 51:865-872.
Honikel, K. O. 2009. Moisture and water-holding capacity. Pages 323-332 in Handbook
of Muscle Foods Analysis. L. M. L. Nollet, and F. Toldra, eds. CPC Press, Boca
Raton, FL.
Hultin, H. O., and S. D. Kelleher. 1999. Process for isolating a protein composition from
a muscle source and protein composition. US Pat. No. 6,005,073.
Hultin, H. O., and S. D. Kelleher. 2000. High efficiency alkaline protein extraction. US
Pat. No. 6,136,959.
Hultin, H. O., H. G. Kristinsson, T. C. Lanier, and J. W. Park. 2005. Process for recovery
of functional proteins by pH shifts. Pages 131-133 in Surimi and Surimi Seafood. 2nd
ed. J. W. Park, ed. Taylor & Francis, Boca Raton, FL.
Hunt, A., J. W. Park, and C. Jaundoo. 2001. Cryoprotection of Pacific whiting surimi
using a non-sweet glucose polymer. Proc. IFT Annual Meet. 100-4. (Abstr.)
Hunt, A., J. W. Park, and H. Zoerb. 2002. Trehalose as functional cryoprotectant for fish
proteins. Proc. IFT Annual Meet. 99-6. (Abstr.)
ISO (International Organization for Standardization). 1992. Sensory Analysis-
Vocabulary. ISO5492.

36
Jackson, P., G. W. Amphlett, and S. V. Perry. 1975. Primary structure of troponin-t and
interaction with tropomyosin. J. Biochem. 151:85-97.
Jaczynski, J., W. Hunt, and J. W. Park. 2006. Safety and quality of frozen fish, shellfish,
and related products. Pages 360-364 in Handbook of Frozen Food Processing and
Packaging. D. W. Sun, ed. CRC Press, Boca Raton, FL.
Jelen, P., R. A. Lawrence, and M. Cerrone. 1982. Evaluation of alkali extracted chicken
protein for use in luncheon meats. Can. Inst. Food Sci. Technol. J. 5:289-293.
Jittinandana, S., P. B. Kenney, and S. D. Slider. 2003. Cryoprotection affects
physiochemical attributes of rainbow trout fillets. J. Food Sci. 68:1208-1214.
Kim, Y. S., J. W. Park, and Y. J. Choi. 2003. New approaches for the effective recovery
of fish proteins and their physicochemical characteristics. Fish. Sci. 69:1231-1239.
Kim, J. S., and J. W. Park. 2003. Gelatin from solid by-products of Pacific whiting surimi
processing. IFT Annual Meet. 76A-11. (Abstr.)
Kristinsson, H. G. 2001. Conformational and functional changes of hemoglobin and
myosin induced by pH: Functional role in fish quality. PhD Diss. Univ.
Massachusetts, Amherst.
Kristinsson, H., and N. Demir. 2003. Functional fish protein ingredients from fish species
of warm and temperate waters: comparison of acid- and alkali-aided processing vs.
conventional surimi processing. Pages 277-295 in Advances in Seafood Byproducts.
P. J. Bechtel, ed. Univ. Alaska, Anchorage.
Kristinsson, H. G., and H. O. Hultin. 2003. Effect of low and high pH treatment on the
functional properties of cod muscle proteins. J. Agric. Food Chem. 51:5103-5110.
Kristinsson, H. G., A. E. Theodore, N. Demir, and B. Ingadottir. 2005. A comparative
study between acid- and alkali-aided processing and surimi processing for the
recovery of proteins from channel catfish muscle. J. Food Sci. 70:C298-C306.

37
Kristinsson H. G., and B. Ingadottir. 2006. Recovery and properties of muscle proteins
extracted from tilapia (Oreochromis niloticus) light muscle by pH shift processing. J.
Food Sci. 71:E132-E141.
Kristinsson, H. G., and Y. Liang. 2006. Effect of pH-shift processing and surimi
processing on Atlantic croaker (Micropogonias undulates) muscle proteins. J. Food
Sci. 71:C304-C312.
Lawrie, R. A., and D. A. Ledward. 2006. The eating quality of meat. Page 290 in
Lawrie’s Meat Science. 7th ed. R. A. Lawrie, and Ledward, D. A., eds. CPC Press,
Boca Raton, FL.
Lee, C. M. 1984. Surimi process technology. Food Technol. 38:69–80.
Li, C. T. 2006. Myofibrillar protein extracts from spent hen meat to improve whole
muscle processed meats. Meat Sci. 72:581-583.
Liang, Y., and H. O. Hultin. 2003. Functional protein isolates from mechanically
deboned turkey by alkaline solubilization with isoelectric precipitation. J. Muscle
Foods. 14:195-205.
Mahon, J. H., and C. G. Schneider. 1964. Minimizing freezing damage and thawing drip
in fish fillets. Food Technol. 18:117-118.
Mallikarjunan, P. 2006. Physical measurements. Page 528 in Handbook of Frozen Food
Processing and Packaging. D. W. Sun, ed. CPC Press, Boca Raton, FL.
Matsumoto, J. J. 1978. Minched fish technology and its potential for developing
countries. Proc. Symp. Fish Utilization Technology and Marketing in the IPFC
Region, Manila, Philippines.
Matsumoto, J. J. 1979. Denaturation of fish muscle proteins during frozen storage. Pages
205-226 in Proc. Am. Chem. Soc. Symp. Washington, DC.
Matsumoto, J. J. 1980. Chemical deterioration of muscle proteins during frozen storage.
Pages 95-124 in Proc. Am. Chem. Soc. Symp. Washington, DC.

38
Maurer, A. J., R. C. Baker, and D. V. Vadehra. 1969. Kind and concentration of soluble
protein extract and their effect on the emulsifying capacity of poultry meat. Food
Technol. 23:575-577.
McCormick, R. J. 1999. Extracellular modifications to muscle collagen: implications for
meat quality. Poult. Sci. 78:785-791.
McCurdy, S., P. Jelen, P. Fedec, and D. F. Wood. 1986. Laboratory and pilot scale
recovery of protein from mechanically separated chicken residues. J. Food Sci.
51:742–746.
Nishiya, K., F. Takeda, K. Tamoto, O. Tanaka, and T. Kubo. 1960. Studies on freezing of
surimi (fish paste) and its application. III. Influence of salts on quality of fish meat.
Mon. Rep. Hokkaido Fish. Res. Lab. Fisheries Agency. Japan. 17:373-383.
Nishiya, K., F. Takeda, K. Tamoto, O. Tanaka, T. Fukumi, T. Kitabayashit, and S.
Aizawa. 1961. Studies on freezing of surimi (fish paste) and its application: studies
on manufacture of frozen surimi for the material of kamaboko and sausage. Hokkaido
Munic. Fish Exp. Stn. 18:122-135.
Nolsøe, H., and I. Undeland. 2009. The acid and alkaline solubilization process for the
isolation of muscle proteins: state of the art. Food Bioprocess Technol. 2:1-27.
Owens, C. M. 2001. Coated poultry products. Page 229 in Poultry Meat Processing, A. R.
Shams, ed. CRC Press, Boca Raton, FL.
Park, J. W., and T. C. Lanier. 1987. Combined effects of phosphates and sugar or polyol
on protein stabilization of fish myofibrils. J. Food Sci. 52:1509-1513.
Park, J. W., T. C. Lanier, and D. P. Green. 1988. Cryoprotective effects of sugars,
polyols, and phosphates on Alaska pollock surimi. J. Food Sci. 53:1-3.
Park, J. D., C. H. Jung, J. S. Kim, D. M. Cho, M. S. Cho, and Y. J. Choi. 2003. Surimi
processing using acid and alkali solubilization of fish muscle protein. J. Korean Food
Sci. Nutr. 32:400-405.

39
Park, J. W., and T. M. J. Lin. 2005. Surimi: manufacturing and evaluation. Pages 35-47,
and 376-383 in Surimi and Surimi Seafood. J. W. Park, ed. CRC Press, Boca Raton,
FL.
Peleg, M., I. Roy, O. H. Campanella, and M. D. Normand. 1989. Mathematical
characterization of the compressive stress-strain relationships of spongy baked goods.
J. Food Sci. 54:947-949.
Perez-Alvarez J. A., and J. Fernandez-Lopez. 2009. Color measurements on muscle-
based foods. Page 470 in Handbook of Muscle Foods Analysis. L. M. L. Nollet and F.
Toldrà, eds. CRC Press, Boca Raton, FL.
Peterson, E. B., and D. Orden. 2005. Effects of tariffs and sanitary barriers on high- and
low-value poultry trade. J. Agric. Resour. Econ. 30:109-127.
Petursson, S., E. A. Decker, and D. J. McClements. 2004. Stabilization of oil-in-water
emulsions by cod protein extracts. J. Agric. Food Chem. 52:3996-4001.
Pigott, G. M. 1986. Surimi: the “high tech” raw materials from minced fish flesh. Food
Rev. Int. 2:213–246.
Purslow, P. P. 2005. Intramuscular connective tissue and its role in meat quality. Meat
Sci. 70:435-447.
Resurreccion, A. V. A. 1994. Cookery of muscle foods. Page 406-429 in Muscle Foods.
D. M. Kinsman, A. W. Kotula, and B. C. Breidenstein, eds. Chapman and Hall, New
York, NY.
Richards, M. P., and H. O. Hultin. 2001. Rancidity development in a fish muscle model
system as affected by phospholipids. J. Food Lipids. 8:215-230.
Rohm, H. 1990. Consumer awareness of food texture in Austria. J. Texture Stud. 21:363-
373.
Sanmartin, E., J. C. Arboleya, M. Villamiel, and F. J. Moreno. 2009. Recent advances in
the recovery and improvement of functional proteins from fish processing by-

40
products: use of protein glycation as an alternative method. Comprehensive Rev.
Food Sci. Food Safety. 8:332-344.
Schwartz, S. J., J. H. von Elbe, and M. M. Giusti. 2009. Colorants. Page 537 in
Fennema’s Food Chemistry. S. Damodaran, K. L. Parkin, and O. R. Fennema, eds.
CRC Press, Boca Raton, FL.
Scopes, R. K. 1970. Characterization and study of sarcoplasmic proteins. Pages 471-492
in The Physiology and Biochemistry of Muscle as a Food. 2nd
Shie J. S., and J. W. Park, 1999. Physical characteristics of surimi seafood as affected by
thermal processing conditions. J. Food Sci. 64:287-290.
ed. E. J. Briskey, R.G.
Cassens, and B. B. Marsh, eds. Univ. of Wisconsin Press, Madison, WI.
Sikorski, Z. E. 2007. The role of proteins in food. Pages 136-140 in Chemical and
Functional Properties of Food Components. 3rd
Smith, D. P., D. L. Fletcher, R. J. Buhr, and R. S. Beyer. 1993. Pekin ducklings and
broiler chicken pectoralis muscle structure and composition. Poult. Sci. 72:202-208.
ed. Z. E. Sikorski, ed. CRC Press,
Boca Raton, FL.
Smyth, A. B., E. O. O’Neill, and D. M. Smith. 1999. Functional properties of muscle
proteins in processed poultry products. Pages 377-396 in Poultry Meat Science. R. I.
Richardson, and G. C. Mead, eds. CABI Publishing, New York, NY.
Solomon, M. B., J. S. Eastridge, E. W. Paroczay, and B. C. Bowker. 2009. Measuring
meat texture. Page 480 in Handbook of Muscle Foods Analysis. CPC Press, Boca
Raton, FL.
Southeast Asian Fisheries Development Center. 1988. A Handbook on the Processing of
Frozen Surimi and Fish Jelly Products in Southeast Asia. Marine Fish. Res. Dep.
Statistics Canada. 2009. Poultry and Egg Statistics. 23-015-X:12.
http://www.statcan.gc.ca/pub/23-015-x/23-015-x2009002-eng.pdf Accessed Sep.
2009.

41
Strasburg, G., Y. L. Xiong, and W. Chiang. 2008. Physiology and chemistry of edible
muscle tissues. Pages 930-935 and 949-950 in Fennema's Food Chemistry. 4th ed. S.
Damodaran, K. L. Parkin, and O. R. Fenema, eds. CRC Press, Boca Raton, FL.
Swatland, H. J. 2002. On-line monitoring of meat quality in Meat Processing: Improving
Quality J. Kerry, Kerry, J., and Ledward, D., eds. CRC Press, Boca Raton, FL.
http://www.foodnetbase.com//books/902/1539_ch10.pdf Accessed Sep. 2009.
Tabilo-Munizaga, G., and G. V. Barbosa-Canovas. 2004. Color and textural parameters
of pressurized and heat-treated surimi gels as affected by potato starch and egg white.
Food Res. Int. 37:767-775.
Takeda, F. 1971. Technological history of frozen surimi industry. New Food Ind. 13:27–
31.
Tarte, R., and C. M. Amundson. 2006. Protein interactions in muscle foods. Pages 247-
249 in Ingredient Interactions: Effects on Food Quality. 2nd ed. A. G. Gaonkar, and
A. McPherson, eds. CRC Press, Boca Raton, FL.
Thawornchinsombut, S., and J. W. Park. 2006. Frozen stability of fish protein isolate
under various storage conditions. J. Food Sci. 71:C227-C232.
Undeland, I., S. D. Kelleher, and H. O. Hultin. 2002. Recovery of functional proteins
from herring (Clupea harengus) light muscle by an acid or alkaline solubilization
process. J. Agric. Food Chem. 50:7371-7379.
Undeland, I., G. Hall, K. Wendin, I. Gangby, and A. Rutgersson. 2005. Preventing lipid
oxidation during recovery of functional proteins from herring (Clupea harengus)
fillets by an acid solubilization process. J. Agric. Food Chem. 53:5625-5634.
USDA (U.S. Food and Drug Administration). 1999. Nutrient database for standard
references - Release 13. United States Dept. of Agriculture, Washington, DC.
USDA (U.S. Food and Drug Administration). 2000. USDA Baseline Projections. United
States Department of Agriculture.
42
http://www.ers.usda.gov/Briefing/SouthKorea/waob001JapanKoreaMeatBox.pdf
Accessed Sep. 2009.
USDA (U.S. Food and Drug Administration). 2004. Sensory and physicochemical
property relationships in food that define and predict end-use quality.
http://www.reeis.usda.gov/web/crisprojectpages/402748.html Accessed June 2009.
USDA/ERS. 2007. Farm animal statistics: meat consumption. Factory farming.
http://www.hsus.org/farm/resources/pubs/stats_meat_consumption.html Accessed
Sep. 2009.
USDA (U.S. Food and Drug Administration). 2009a. Livestock, dairy, and poultry
outlook. Economic Research Service Report LDP-M-183:1.
USDA (U.S. Food and Drug Administration). 2009b. China poultry and products. USDA
Foreign Agricultural Service GIAN Report CH9014:3.
USDA (U.S. Food and Drug Administration). 2009c. Brazil poultry and products. USDA
Foreign Agricultural Service GIAN Report BR9602:3.
USDA (U.S. Food and Drug Administration). 2009d. EU-27 poultry and products. USDA
Foreign Agricultural Service GIAN Report E49020:3.
Vieira, E. R. 1996. Fish and shelfish. Pages 278-282 in Elementary Food Science, 4th ed.
Chapman & Hall, New York, NY.
Vodovotz, Y., M. Baik, E. Vittadini, and P. Chinachoti. 2001. Instrumental techniques
used in bread staling analysis in Bread Staling. P. Chinachoti, and Y. Vodovotz, eds.
CRC Press, Boca Raton, FL.
Wang, S. F., and D. M. Smith. 1994. Poultry muscle proteins and heat-induced gelation.
Poult. Sci. Rev. 5:145-167.
World Poultry. 2009. US: poultry consumption lowest in 7 years.
http://www.worldpoultry.net/news/poultry-consumption-lowest-in-7-years-3402.html
Accessed Sep. 2009.

43
Yates, L. D., and M. L. Greaser. 1983. Quantitative-determination of myosin and actin in
rabbit skeletal-muscle. J. Mol. Biol. 168:123-141.
Young, L. L. 1975. Aqueous extraction of protein isolate from mechanically deboned
poultry meat. J. Food Sci. 40: 1115-1118.
Zamula, E. 1985. Getting hooked on surimi. FDA Consumer.
http://www.questia.com/googleScholar.qst?docId=5002117300 Accessed January 2010.

44
2 ALKALI AIDED PROTEIN EXTRACTION OF CHICKEN DARK
MEAT: COMPOSITION AND STABILITY TO LIPID OXIDATION OF
THE RECOVERED PROTEINS1
2.1 INTRODUCTION
Currently, with the increasing demand for further processed breast meat products,
chicken dark meat has been considered a major underutilized commodity (USDA, 2004).
The major concerns with chicken dark meat which affect consumers’ selection and
satisfaction are color, high fat content and poor shelf life stability (Froning, 1995;
Fletcher, 1997). One of the alternatives to increase the utilization of chicken dark meat is
to extract myofibrillar proteins and separate them from fat and pigments to enhance their
application, which is required for the preparation of further processed meat products
(Betti and Fletcher, 2005). The use of alkaline extraction followed by acid precipitation
has been investigated for protein recovery from vegetable sources (Fletcher and Ahmed,
1977). Various researchers have examined potential extraction techniques for
mechanically separated poultry meat (MSPM), meat offal, beef bones, and fish meat
(Meinke et al., 1972; Young and Lawrie, 1974; Jelen et al., 1979; Lawrence et al., 1982).
Japanese researchers developed a process for the recovery of proteins from fish
resulted in ‘Surimi’, which is a functional protein ingredient. Surimi preparation involves
washing the minced raw fish material in 5-10 °C water or slightly alkaline solution, with
the aim of removing undesirable flavor components, pigments, blood and fat, leading to
concentrated functional myofibrillar proteins (Lanier, 1986; Kristinsson and Ingadottir,
2006). An evolution of the conventional surimi preparation which is more suitable to
extract proteins from pelagic fatty fishes is the alkaline solubilization technique
developed by Hultin et al. (2000). In this new process, solubilized fish myofibrillar
proteins at pH above 10.0 can be separated from fat and pigments by high speed
1 This Chapter was accepted for publication in the Journal of Poultry Science, 2010 (authors: Vida Moayedi, Dileep Omana, Jacky Chan, Yan Xu and Mirko Betti)

45
centrifugation and recovered by precipitation at the isoelectric point (Hultin and Kelleher,
1999; Hultin et al., 2003; Kristinsson and Ingadottir, 2006). The extraction mechanism
increases the charge on myofibrillar proteins by a pH-shifting processing technique.
The recent over-production of leg quarters and dark meat has resulted in a
dramatically low market for these two raw materials. Thus, the production of a light-
colored, low-fat protein isolate from the dark meat products, which can be used for the
preparation of many processed food products, has received increased attention. It could
be used, for example, as an alternative to phosphates for meat enhancement (Vann and
DeWitt, 2007) and especially as a functional food ingredient for further processed meat
products. The current study was performed to develop an efficient technology for
extraction of myofibrillar proteins from chicken dark meat.
Hence, the objective of the present investigation was to determine the effect of
pH, in the range of 10.5 to 12.0, on the alkaline solubilization of chicken dark meat.
Aspects studied were the effect of alkali aided process on protein and lipid composition,
lipid oxidation and color characteristics of the extracted meat.
2.2 MATERIALS AND METHODS
2.2.1 Materials
Skinless frozen chicken thigh meat was obtained from Lilydale (Edmonton, AB,
Canada). The chicken thigh meat was thawed (4 °C) overnight. The thawed chicken thigh
meat was then ground using a meat grinder (Waring Pro, MG100NC, Taiwan), vacuum
packed in 400 g plastic bags and was stored at -30 °C prior to analysis. The resulting dark
minced chicken meat (DMCM) was used for this study.
2.2.2 Protein Solubility Curve
The protein solubility curve was prepared using a method by Kim et al. (2003).
6.0 g dark minced raw meat and 300 ml refrigerated distilled water were mixed in a
homogenizer (Fisher Scientific, Power Gen 1000 S1, Schwerte, Germany) at setting 3 for
1 minute. Aliquots of homogenate (30 ml) were adjusted to a range of pH values (1.5 to

46
12.0) using 0.2 M and 1 M HCl or NaOH. The sample solutions were centrifuged at
25,900 g at 4 °C for 20 minutes. The middle liquid layer was used for protein analysis.
Protein solubility was measured by the Biuret method (Gornall et al., 1949) and
expressed as mg/g of protein. Bovine serum albumin (Sigma-Aldrich, St Louis, MO,
USA) was used as the standard.
2.2.3 Protein Isolation
Protein isolation was performed as a modification of the methods of Liang and
Hultin (2003), and Betti and Fletcher (2005). To prepare protein isolate, 400 g of frozen
minced chicken thigh meat was partially thawed (4 °C) overnight it was then mixed with
ice-distilled water (1:2.5, w:v) using a 900 Watt Food Processor (Wolfgang Puck,
WPMFP15, W.P. Appliances, Inc., Hollywood, FL, USA) for 15 min. The homogenate
was adjusted to pH 10.5 to 12.0 in 0.5 increments with a pH meter (UB10, Denver
Instrument, Denver, CO, USA) using 2N NaOH over a 5 min period. After pH
adjustment, the homogenate was allowed to stand still (4 °C for 30 min) and centrifuged
(Beckman Coulter, Avanti® J-E centrifuge, CA, USA) at 25,900 × g for 20 min (4 °C).
Three layers were formed after centrifugation: an upper fat layer, a middle aqueous layer
of soluble proteins and a bottom sediment layer. The middle protein supernatant layer
was carefully removed and the other two layers were discarded. The resultant protein
supernatant was adjusted to pH 5.2 using 2N HCl over a 5 min period. The precipitated
proteins were then centrifuged at 25,900 × g for 20 min (4 °C). The sedimented proteins
were mixed with 700 g of ice-distilled water using the food processor for 7 min and
adjusted to pH of 6.2, followed by centrifugation at 25,900 × g for 20 min (4 °C). The
protein isolate were then weighed and protein yield was determined using the formula
below. Moisture content of the resulting protein isolate was adjusted to 80% and stored at
-30 °C. The resulting protein isolate was called extracted meat (EM).
Protein yield (%) = Protein content of DMCM (g)
Protein content of EM (g) x 100
2.2.4 Determination of Total Protein Content
Total protein content was determined using the biuret procedure (Gornall et al.,
1949; Torten and Whitaker, 1964). The biuret reagent was prepared as described by

47
Layne (1957). The partially dispersed meat sample (1.0 g) in 20 mL of 0.5M NaOH was
heated in a boiling water bath for 10 min and cooled in an ice-water bath. The solution
was filtered to remove the elastin particles and some of the fat. Anhydrous ether (15 mL)
was added to 15 mL of the filtrate, which was then centrifuged (J-6B/P Beckman,
Beckman® Instruments, Inc, CA, USA) at 2,278 × g for 10 min after shaking. After
centrifugation, 1 mL of the lower aqueous layer was taken and mixed with 4 mL of biuret
reagent. Optical density was measured at 540 nm after 30 min using a UV/VIS
spectrophotometer (V-530, Jasco Corporation, Tokyo, Japan). Bovine serum albumin
(HyClone, UT, USA) was used for preparation of the standard curve. Total protein
content was measured on the DMCM as well as the EM.
2.2.5 Extractability of Recovered Proteins
The extractability of sarcoplasmic proteins in the protein isolate was measured by
vortexing 2 g of sample with 20 ml of 30 mM phosphate buffer (pH 7.4) to create a
homogenate solution. This solution was allowed to stand still overnight at 4 o
2.2.6 Determination of Total Fat Content
C, and was
then filtered using Whatman No. 1 filter paper. The protein content of the filtrate was
estimated using the Biuret method (Gornall et al., 1949). For measuring total protein
extractability, 50 mM phosphate buffer containing 0.55 M potassium iodide (pH 7.4) was
added to dissolve the proteins. Analysis was carried out in triplicate.
Total fat content was determined using a method described by Folch et al. (1957).
10.0 g of EM and 5.0 g of DMCM were separately mixed with 2:1 chloroform-methanol
(v/v) solution (120 mL) using a vortex mixer for 10 min and stood still for 30 min. The
slurry was filtered and the filtrate was transferred to a separation funnel, followed by
addition of 40 mL of 0.88% NaCl solution. The funnel was then left for 30 min for phase
separation. The bottom chloroform phase was filtered on an anhydrous sodium sulphate
bed (Fisher Scientific, NJ, USA). 60 mL of the clear chloroform phase was taken out into
a pre-weighed flask followed by rotary evaporation (Rotavapor, RE 121, Buchi,
Switzerland) for 15 min at 40 °C. The flask was then put in a 60 °C oven for 30 min,
followed by placing in a desiccator for 30 min before weighing it again to obtain the total

48
fat content. The residue was dissolved in 10 mL of chloroform and stored in the freezer (-
30 °C) until required for analysis.
2.2.7 Separation of the Main Lipid Classes
The main lipid classes were separated using a method described by Ramadan and
Mörsel (2003). A glass column (60 cm x 1.5 cm) was packed with activated silica gel
(70–230 mesh; Whatman, NJ, USA) by applying a slurry of the silica gel in chloroform
(1:5, w/v). Total lipids were dissolved in 9.5 mL of chloroform and applied to the
column, which was then eluted sequentially with 50 mL chloroform (for neutral lipids),
and with 50 mL methanol (for polar lipids) thereafter. The solvent from each fraction was
evaporated by rotary evaporation and the percentage of each fraction was determined
gravimetrically. The residues were dissolved separately in 2 mL of chloroform and stored
in the freezer (-30 °C) until required for analysis.
2.2.8 Fatty Acid Analysis
Total fatty acid profile and composition of the neutral and polar lipid classes for
raw thigh meat and extracted meat were analyzed by gas chromatography (GC) on 4
replicate samples. Derivatization was conducted using a solution of hydrochloric acid in
methanol (methanolic HCl, 3N; Supelco, PA, USA) and according to manufacture
instructions provided by Supelco. Extracted fat was diluted with chloroform. 2mL of
methanolic HCl were added to 50µl of the extracted fat – chloroform mixture. In order to
stimulate the reaction, samples were put into a 60 °C water bath for 120 min.
Fatty acid profile of the neutral and polar lipid classes was determined with a GC
Varian (Varian Walnut Creek, California, USA) 3400 gas chromatograph equipped with
a flame ionization detector and a SGE-BPX70 capillary column (60m x 0.25 mm x 0.25
µm film thickness; SGE Analytical Science Pty Ltd, Victoria, Australia). Operating
conditions for the GC for fatty acid composition of neutral and polar lipid classes were as
follows: initial temperature of 50 °C was held for 0.2 min; increased at 20 °C/min to 170
°C, which was maintained for 5 min. At a rate of 10 °C/min, a temperature of 230 °C was
reached, which was maintained for 13 min. A Cool-on-Column injection method was
used, with an initial and final injector temperature of 60 °C and 230 °C (30 min)

49
respectively, increasing at a rate of 150 °C/min. The temperature of the detector remained
at 240 °C and the column head pressure of the carrier gas (helium) was 25 PSI. The fatty
acid peak integration was performed using the Galaxie Chromatography Data System
(Varian). Fatty acids were quantified using methyl-heptadecanoic acid as an internal
standard (Sigma-Aldrich Co., MO, USA) and were identified by comparison of authentic
standards (GLC-463 NU-CHEK PREP, INC. Elysian, MN, USA). Saturated fatty acids
(SFA) levels were calculated as 14:0 + 15:0 + 16:0 (palmitic acid) + 18:0 (strearic acid) +
19:0 + 20:0 + 22:0. Monounsaturated fatty acids (MUFA) levels were calculated as 14:1
+ 16:1 ω-7 cis +17:1 + 18:1 ω-7 trans + 18:1 ω-7 +18:1 ω-9 (oleic acid) + 20:1.
Polyunsaturated fatty acids (PUFA) levels were calculated as 18:2 ω-6 (linoleic acid; LA)
+ 18:3 ω-3 (α-linolenic acid; LNA) + 18:3 ω-6 + 20:2 ω-6 + 20:3 ω-3 + 20:3 ω-6 + 20:4
ω-6 (arachidonic acid; AA) + 20:5 ω-3 (eicosapentaenoic acid; EPA) + 22:4 ω-6 + 22:5
ω-3 (docosapentaenoic acid; DPA) + 22:6 ω-3 (docosahexaenoic acid; DHA). Total ω-6
fatty acid levels were calculated as LA + 18:3 ω-6 + 20:2 ω-6 + 20:3 ω-6 + AA + 22:4 ω-
6. Total ω-3 fatty acid levels were calculated as LNA + 20:3 ω-3 + EPA + DPA + DHA.
Long chain ω-3 fatty acid (LC ω-3) levels were calculated as 20:3 ω-3 + EPA + DPA +
DHA. Long chain ω-6 fatty acid (LC ω-6) levels were calculated as 20:2 ω-6 + 20:3 ω-6
+ AA + 22:4 ω-6.
2.2.9 Susceptibility to Oxidation
Lipid susceptibility to oxidation was measured by using the induced thiobarbituric
acid reactive substances (TBARs) test as a modification of the method of Kornbrust and
Mavis (1980) on raw thigh meat as well as extracted leg meat. Four replicate
measurements were conducted. To prepare homogenates, 3 g of the meat sample was
homogenized with 25 mL of 1.15% KCl solution for 45 s. A 200 µl aliquot of the
homogenate was incubated at 37 °C in 80 mM Tris-maleate buffer (pH 7.4) with 2.5 mM
ascorbic acid and 50 µM ferrous sulphate in a total volume of 2 mL. At fixed intervals (0,
30, 60, 100 and 150 min), aliquots were removed for measurement of TBARS. TBARs
were expressed as nanomoles of malondialdehyde (MDA) per milligram of meat.

50
2.2.10 Color Measurements
The CIE (1978) system color profile of lightness (L*), redness (a*) and
yellowness (b*) was measured by a HunterLab colorimeter (LSXE/UNI, Virginia, USA)
on EM samples immediately after extraction prior to frozen storage at -30 °C. A white
standard plate was used to calibrate the colorimeter. Three readings of L*, a*, and b*
values were taken from each batch of the raw dark and extracted meat samples, and the
values were averaged. Whiteness, intensity of the red, saturation and HUE values were
calculated according to the following formula.
Intensity of the red = a* / b*
Hue angle measures the degree of departure from the true red axis of the CIE
color space (Brewer et al., 2006). As hue angle increases, visually perceived redness
decreases (Little, 1975; Brewer et al., 2006). Chroma refers to the brightness/colorfulness
of an object (Fairchild, 2004).
2.2.10.1 Total Heme Pigments Content
Total heme pigments were extracted from 10.0 g of a homogenized meat sample
within a solution of 40 mL acetone, 1 mL HCl and 2 mL water according to Hornsey
(1956). The solution was filtered after1-hour pause and the absorbance was measured
using a UV/VIS spectrophotometer (V-530, Jasco Corporation, Tokyo, Japan) at 640 nm
wavelength. The absorbance value obtained was multiplied by the factor value 17.18, and
the concentration of total hemic pigments was expressed in milligrams of myoglobin per
gram of meat.
abHUE /arctan=
22 baSaturation +=
( ) 222100100 baLWhiteness ++−−=

51
2.2.11 Statistical Analysis
Each experiment and each assay was done at least in triplicate. Reported results
represent an average of each experimental assay. All data were subjected to Analysis of
Variance using the general linear model procedure of SAS (SAS System, 2002).
Differences between least squares means were determined using HSD Tukey differences,
and were reported as significant at the P < 0.05 level. Linear regression analysis and Karl
Pearson’s coefficient of correlation has been determined to find the correlation between
various parameters as a function of pH treatments.
2.3 RESULTS AND DISCUSSION
2.3.1 Protein Solubility
The solubility of proteins from chicken thigh meat has been measured in pH range
of 1.5 - 12.0 (Figure 2.1). The highest value for protein solubility was determined at the
extremes of pH in both acidic and alkaline range. The increased solubility at extreme pH
values has been related to an increased positive and negative charge of the muscle
proteins at low and high pH, respectively, leading to electrostatic repulsion between the
proteins (Hamm, 1994). The protein solubility showed a U-shaped curve; however,
unlike the typical solubility curve for fish muscle protein homogenates, the solubility was
found to be a maximum at pH 10.5 and showed a marginal reduction up to pH 12.0. The
reason for this marginal decrease in protein solubility may be due to the exposure of more
hydrophobic groups at the higher pH values.
pH-shift solubilizing processing is a method which has been broadly used for fish
muscle; however in this study we have shown that this process can also be applicable to
underutilized chicken meat sources for protein extraction. Investigations by Kristinsson et
al. (2005) on catfish muscle indicated that there is less protein denaturation in alkali
aided process than in acid aided process. As a consequence, based on the solubility curve,
higher alkaline pH, ranging from 10.5 to 12.0 was considered for the present study.

52
2.3.2 Protein Recovery and Protein Content
Alkaline pH treatments ranging from 10.5 to 12.0 were chosen for protein
extraction according to the results obtained from the protein solubility curve. The yield of
the protein extraction was significantly increased as the pH of extraction increased. The
highest recovery of proteins which is equivalent to 94.2% was obtained at a pH of 12.0
(Figure 2.2). This high level of protein yield could be explained by the denaturation of
myofibrillar proteins and the exposure of hydrophobic groups (Omana et al., 2010).
Denaturation of proteins at high pH values results in unfolding of proteins (Sikorski,
2007). As a consequence, hydrophobic amino acids will be exposed to the surface of the
protein structure, which may lead to more aggregation and precipitation of myofibrillar
proteins at the isoelectric point (Ingadottir, 2004; Gehring et al., 2009). The reason for
the higher protein yields in this study compared to Kristinsson and Ingadottir (2006), who
recovered 68% of proteins from Tilapia fish muscle by alkali aided process, could be
explained by the differences between chicken and fish proteins as starting materials. As
expected, protein yield was negatively correlated with total and neutral lipid content of
EM (R = -0.88 and R = -0.81; P < 0.00001), respectively (Figures 2.3 and 2.4).
The protein content was significantly increased when a pH of 12.0 was reached
compared with the one of 10.5 (P < .0001) (Table 2.1). The highest level of protein
content on wet basis, 19.4%, was reached at a pH of 12.0, however; it was not
significantly different as compared to the values of chicken dark meat. It may indicate
that the maximum protein could be extracted from chicken dark meat using alkali-aided
processing at a pH of 12.0.
2.3.3 Extractability of Recovered Proteins
Extractability of recovered proteins is of great importance for the manufacture of
processed muscle foods, including restructured meats. This is because most of the
functional properties of muscle protein, such as emulsification and gelation, are related to
this parameter.
Sarcoplasmic protein extractability from recovered proteins as a function of
various pH was significantly decreased (P < 0.0001) compared to the extractability of

53
sarcoplasmic proteins in raw meat (Figure 2.5). The reduction was found to be most
significant at pH 11.5 and pH 12.0. This reduction may be explained by the instability of
proteins due to aggregation behavior (Mohan et al., 2006) during the process of
extraction. Total protein extractability showed a similar trend. Approximately a 50%
reduction was found at pH treatments of 10.5 and 11.0 compared to the initial raw
materials. The reduction was even more evident for the proteins recovered at alkali at pH
values of 11.5 and 12.0 (Figure 2.5). The strong reduction of total protein extractability
for samples extracted at higher pH may be explained by unfolding of myofibrillar
proteins, leading to exposure of more hydrophobic groups to the exterior (Sarma et al.,
1999). However, the decrease in protein extractability at higher pH values might be a
consequence of altered protein conformations induced by chemical denaturation, which
could not be fully restored after pH readjustment. Kristinsson and Hultin (2003) showed
that the conformation of myosin head could not revert to its native conformation during
alkali treatment (pH 11.0) followed by pH (7.5) readjustment.
2.3.4 Lipid Profile
2.3.4.1 Total Lipid Content
The presence of high lipid content has important implications in the storage,
processing, stability, and nutritional values of muscle food. It is also a reason for the
rapid sensory quality losses observed. In order to increase the utilization of extracted
proteins, total fat content from dark meat must be reduced.
Lipid content of the thigh meat was 6.3% (on wet basis). Fat content of the
extracted meat by alkali treatments showed an average of 50% reduction compared to
chicken dark meat with no significant difference among the pH treatments (Table 2.1).
This reduction is possible because during the alkali solubilization process, when high pH
values (10.5 - 12.0) are used, an increase in negative charge of muscle proteins occur,
leading to electrostatic repulsion between the proteins (Hamm, 1994). As a result,
proteins solubilize in alkaline solution. When this slurry is centrifuged, lipids, due to their
low density, are separated from the protein phase (Hultin and Kelleher, 2000).

54
However, the low amount (~50%) of fat reduction found in the current
investigation compared to other studies (65-70%) conducted in fish (Hultin and Kelleher,
2000; Nolsøe and Undeland, 2009) could be explained by the lower ratio of meat to water
used for alkali extraction. In this study, the ratio of meat to water was 1:2.5 (w: v) while
other investigations on mechanically deboned turkey used a ratio of 1:6 (w: v) (Liang and
Hultin, 2003). In addition, research on fish alkali extraction indicated that a ratio of 1:5 is
used in order to increase fat removal, especially polar lipids (Nolsøe and Undeland,
2009). The low amount of water used in this study was chosen because of the growing
concern of water usage during food processing.
2.3.4.2 Neutral and Polar Lipids Content
In general, triacylglycerol (neutral lipid) content of the dark muscles, mainly rich
in saturated fatty acids, is related to the sustainable energy source required by the
animals, while the highly unsaturated nature of the polar lipids is necessary for the
metabolic functional requirements of the membrane (Betti et al., 2009). However, fatty
acids composition is not the only difference between the neutral oils and the polar
membranes lipids. Because the polar lipids (mainly phospholipids) are in the cell
membranes, which exist primarily as a bi-layer, they have a very large surface area
exposed to the aqueous phase of the cell compared to triacylglycerol (Hultin, 1995). As a
consequence, even though the neutral fat predominates in dark meat, polar lipids would
have ten times more exposure to pro-oxidants than the triacylglycerols at the surface of
the oil droplets. In addition to their greater surface area, membrane lipids are found in
association with components that can accelerate their oxidation, such as reactive oxygen
species (ROS) (Hultin and Kelleher, 2000). For all these reasons, polar lipids must be
strongly reduced during the extraction process.
A significant decrease (P < 0.0001) in neutral lipids in extracted meat was
observed compared to chicken dark meat. The content of neutral lipids in chicken dark
meat (% on wet basis) was 5.4 % (Table 2.1). On average, neutral lipid removal from
chicken dark meat using the alkali aided process was 61.5%. In this study, in contrast to
the neutral lipids, polar lipids were not affected by the alkali extraction (pH values 10.5 -
12.0). The unsuccessful removal of polar lipids may result from the lower amount of
55
water used for alkali extraction (2.5 vs. 5 (w: v)) (Nolsøe and Undeland, 2009). As
previously discussed, polar lipids are difficult to remove because they are strongly bound
to membrane proteins and hence, their extraction was difficult (Nylander, 2004). These
results also concur with Dawson et al. (1990) who did not successfully remove polar
lipids from MSPM by using slightly alkaline washing treatments. By contrast, a recent
study conducted by Hrynets et al. (2009) using acid extraction in the presence of citric
acid showed considerable reduction in the level of polar lipids of MSPM; it has been
suggested that citric acid might play a role as a binding agent to the basic amino acid
residues of cytoskeletal proteins competing with the acidic phospholipids of membranes
(Liang and Hultin, 2005) In light of this, low pH of extraction and addition of citric acid
may be exploited to improved removal of polar lipids from chicken dark meat.
2.3.5 Fatty Acid Profile
The fatty acid profile of neutral and polar lipids for chicken dark meat and
extracted meat are presented in Tables 2.2 and 2.3.
2.3.5.1 Neutral Lipids Fraction
The predominant SFA was palmitic acid (C16:0) and among MUFA, oleic acid
(C18:1 ω-9) was the most abundant fatty acid (Table 2.2). According to Wood et al.
(2008), the content of oleic acid is higher in neutral lipids than in polar lipids fraction.
The levels of SFA, MUFA and PUFA significantly decreased by 68%, 66% and 60%,
respectively in the neutral lipids fraction of chicken dark meat due to alkali pH treatments
(P < 0.0001). The lowest amounts of fatty acids were found at a pH of 11.5 (448, 978 and
339 mg per 100 g of chicken dark meat for SFA, MUFA and PUFA, respectively) (Table
2.3). The reduction in SFA after pH treatment was mainly due to a 68% decrease in
palmitic acid. The reduction of MUFA was explained by the decrease of oleic acid. In
fact, there was a 72% reduction in this fatty acid compared to chicken dark meat at a pH
of 11.5. The decrease of LA was responsible for the significant reduction in PUFA levels
in alkali pH treatments compared to chicken dark meat (P < 0.0001). The highest removal
(72%) of LA was found at a pH of 11.5. In neutral lipids, LNA was the only ω-3 fatty
acid found in chicken dark meat. The highest reduction of LNA in alkali treatments was
also 72% at a pH of 11.5.

56
Total ω-6 fatty acids were significantly reduced by alkali extraction, with the
maximum reduction at a pH of 11.5 (297 mg/100 g of chicken dark meat). The ω-6: ω-3
ratio for chicken dark meat was 7.20 and due to the similar reduction in total ω-3 and ω-6
fatty acids in the alkali treatments, the ratio of ω -6: ω -3 did not change significantly
compared to chicken dark meat (Table 2.2). However, there was a significant
improvement of the ratio (8.26) when a pH of 12.0 was used compared to the one at 10.5
(Table 2.2).
2.3.5.2 Polar Lipids Fraction
In chicken dark meat, palmitic acid, stearic acid, oleic acid and LA were the
predominant fatty acids in polar lipids (87.8, 103, 155 and 122 mg per 100 g of meat for
the fatty acids respectively) (Table 2.3). SFA levels did not decrease due to the alkali
treatments. There was a significant increase in SFA of 47% at a pH of 11.5 compared to
chicken dark meat (198 vs. 292 mg SFA/100 g of meat; P = 0.0311). The MUFA and
PUFA levels in chicken dark meat did not significantly change due to the alkali
treatments (P = 0.2856 and P = 0.0730 for MUFA and PUFA respectively).
Total ω -3 and LC ω -3 fatty acids tended to increase by alkali treatments while
the increase was only significant at a pH of 10.5 (P = 0.0093 and P = 0.0131 for Total ω -
3 and LC ω -3 fatty acids respectively). Long chain polyunsaturated fatty acids (LC
PUFAs) including 22:4 ω -6, 20:3 ω -3, EPA, DPA and DHA were not detected in the
neutral lipids fraction, and they were present only in polar lipids. These results are in
agreement with Betti et al. (2009), who studied the distribution of fatty acids of chicken
thigh (dark) meat in triacylglycerols and phospholipids, and found that LC PUFAs were
absent (or present in a very low amount) in triacylglycerols compared to their level in
phospholipids.
LC ω-6 and total ω-6 fatty acids on the other hand, were not significantly affected
by the treatments (P = 0.1315 and P = 0.0815 for LC ω -6 and total ω-6 fatty acids
respectively). Similarly, no significant change in ω-6: ω-3 ratio was observed due to
alkali extraction in relation to chicken dark meat (Table 2.3). The ratio for chicken dark
57
meat was 7.47 and it varied from 5.54 to 8.23 in the different pH treatments, reaching its
maximum at a pH of 12.0 (8.23).
As discussed previously, the unsuccessful removal of polar lipids did not decrease
the concentration of LC PUFAs, which in some cases, (pH 10.5) they even increased. If
this is potentially desirable from a nutritional point of view it does produce serious
technological problems due to lipid oxidation during frozen storage (see below).
2.3.6 Susceptibility to Oxidation
Interactions between incubation time and alkali pH treatments used for extraction
were found in the induced TBARs measured to test the oxidative stability of chicken dark
meat and extracted meat (Figure 2.6). The MDA formation increased as the time of
incubation increased, as expected. The highest MDA value was found after an incubation
time of 150 min in chicken dark meat, as well as, in extracted meat. There was a
significant increase (P < 0.05) in MDA formation in extracted meat compared to chicken
dark meat, indicating that extracted meat was more susceptible to oxidation. This denotes
that although total fat of chicken dark meat decreased by approximately 50% due to alkali
extraction, polar lipids were not removed. These polar lipids contain more LC PUFAs,
and hence extracted meat is more susceptible to oxidation than chicken dark meat. It
confirms that LC PUFAs deposited in polar lipids are responsible for lipid oxidation
(Erickson, 2002). This is further evidenced by the fatty acid data. In fact, the unsuccessful
removal and concentration of LC PUFAs, including EPA, DPA, DHA, C20:3 ω-3 and
C22:4 ω-6 in the polar fraction, which were not present in the neutral lipids, may be the
reason for the increased lipid oxidation susceptibility in extracted meat compared to
chicken dark meat.
2.3.7 Color Measurements and Total Heme Pigments
Color is an important attribute which influences consumers’ selection of and
satisfaction with meat products (Froning, 1995; Fletcher, 1997). The color measurements
(L*, a*, b*, a*/b*, saturation, HUE and whiteness) and total heme pigments for chicken
dark and extracted meat are described in Table 2.4. The individual color measurements of
a* and b*, were significantly lower in extracted meat compared to chicken dark meat.

58
The application of alkali aided extraction to chicken dark meat lightened the color of the
dark meat. This could be explained by the fact that during the alkali aided process, the pH
is adjusted to the isoelectric point of myofibrillar proteins (pH: 5.2), which led to
precipitation. Thus, by further centrifugation, sarcoplasmic proteins (total heme pigments
included) which are water-soluble components (Scopes, 1970) will be easily separated
from the myofibrillar proteins. The color values of redness (a*) and yellowness (b*) in
extracted meat significantly decreased (P < 0.0001 and P = 0.0016) by 83% and 11%,
respectively compared to chicken dark meat. The decrease in redness value could be
explained by the fact that the raw meat presents red color because of the myoglobin
(Terra et al., 2009), and as a result, by removing myoglobin, the redness value decreased.
The reduction in yellowness for extracted meat could be because of lipid removal.
According to Irie (2001), carotene concentration is the main factor affecting yellowness
of the fat in meat but carotene levels were not measured here.
The value of lightness (L*) significantly increased with alkali extraction
compared to chicken dark meat (P < 0.0001). Moreover, studies on turkey muscle color
indicated that total pigments concentration is one of the factors influencing meat L*
values (Boulianne and King, 1995, 1998; Gasperlin et al., 2000). Thus, the reason for
increase in lightness values in extracted meat could be attributed to the removal of total
heme pigments from chicken dark meat by alkali aided process. Whiteness values of the
extracted meat significantly increased (P < 0.0001) compared to chicken dark meat,
mainly because of the considerable increase in L* value which is the main factor
affecting whiteness (Table 2.4). The intensity of the red (a*/b*) significantly decreased
compared to chicken dark meat, due to the reduction of redness. The saturation value of
extracted meat significantly decreased compared to chicken dark meat (P < 0.0001)
indicating that extracted meat has less color intensity compared to chicken dark meat.
This could be explained by the removal of total heme pigments by alkali extraction which
may affect color intensity (Irie, 2001). The HUE value considerably increased in
extracted meat (P < 0.0001) compared to chicken dark meat. This indicates that the
visually perceived redness was reduced by the extraction process.

59
The values of a*, b* and L* for chicken breast was reported as 0.99, 3.55 and
62.11, respectively (Perez-Alvarez and Fernandez-Lopez, 2009) while the values
obtained in our study for extracted meat were 1.54, 16.98 and 63.30 respectively. The
comparison between these values indicates that L* and a* values for extracted meat are
comparable with those in breast meat. Yellowness value (b*) in extracted meat is higher
compared to chicken breast. The reason for this higher yellowness could be explained by
the unsuccessful removal of polar lipids which contain higher amounts of LC PUFAs and
oxidation of the remaining pigments to some extent in the EM (Irie, 2001).
Alkaline solubilization considerably decreased (P < 0.0001) total heme pigment
content compared to chicken dark meat. The values reached the average of 0.60 mg/g
which showed a 53% reduction compared to chicken dark meat (Table 2.4). According to
Pikul et al. (1982) and Niewiarowicz et al. (1986) the values obtained in this study are
similar to those found in chicken breast meat.
Despite all the color characteristics that were improved by alkali treatments,
Omana et al. (2010) found different results when color was measured on EM samples
stored for 30 d at -30 °C; L* and whiteness were lower in EM samples than minced
chicken dark meat. The inefficient removal of polar lipids, which increased the
unsaturation level in EM, and the pronounced oxidation of the remaining pigments
probably resulted in a slightly darker meat as compared to the starting material although
the index of red decreased. These results suggest that immediately after extraction, EM
samples are distinguished by an overall bright white-yellow color and after 30 d of frozen
storage, the formation of oxidized pigments, mainly met-myoglobin isolated proteins
resulted in a more dark-yellow color.
2.4 CONCLUSIONS
This first experiment demonstrated that it is possible to recover protein yields of
more than 80% in the pH range of 10.5 – 12.0. However, the isolated proteins were
susceptible to lipid oxidation as revealed by TBARs values, even though the total fat
content decreased to approximately 50%. The recovery process failed to remove polar
60
lipid and in some cases (pH 10.5), they even increased. However, neutral lipids were
removed by 61.51%. Alkali aided extraction helped to lighten the color of the dark meat
and reduction of heme pigments by 53%. In spite of the susceptibility to lipid oxidation
of the recovered proteins, our earlier studies (Omana et al., 2010) revealed that the
proteins in the extracted meat obtained after treatment at pH 10.5 and 11.0 could regain
the original conformation after pH readjustment to 6.2. Hence, it can be concluded that
the meat extraction at these pH values can be utilized for product preparations with
desired functional properties. The oxidation issue may be overcome by modifying the
process to remove more polar lipids (i.e. addition of citric acid) or by adding a stabilizing
agent such as vitamin E.

61
2.5 TABLES
Table 2.1. Protein (%) and lipid (%) composition of chicken dark and extracted meat (wet basis)
Extraction pH a
Parameters Chicken Dark Meat 10.5 11.0 11.5 12.0 SEM Pr > F
Protein content 20.6 16.7a 17.1c 18.2c 19.4bc 0.3 ab <.0001
Total fat content 6.26 3.41a 3.15b 2.94b 2.97b 0.19 b <.0001
Neutral lipids 5.43 2.55a 2.06b 1.86b 1.90b 0.19 b <.0001
Polar lipids 0.828 0.846 1.09 1.08 1.07 0.068 0.0261
a-cLeast squares means in a row corresponding to a certain factor with different letters are significantly different (P < 0.05). The values presented are means of 4 replicate determinations.

62
Table 2.2. Level (mg fatty acid / 100 g of meat) of fatty acids in the neutral lipids of chicken dark and extracted meat
Extraction pH a
Fatty acids Chicken
Dark Meat 10.5 11.0 11.5 12.0 SEM Pr > F
14:0 45.9 17.0a 13.3b 11.7b 14.0b 1.5 b <.0001
14:1 12.6 5.03a 3.50b 2.52b 3.92b 0.64 b <.0001
15:0 3.55 2.61a ND a 0.547 ND a 1.05 0.0913
16:0 1430 582a 456b 345bc 417c 41 bc <.0001
16:1 ω-7 372 149a 114b 93.8b 115b 13.9 b <.0001
18:0 354 154a 123b 90.5bc 108c 9.8 c <.0001
18:1 ω-7 187 80.0a 64.8b 50.7bc 63.0c 6.2 bc <.0001
18:1 ω-9 3038 1338a 1064b 823bc 990c 94 bc <.0001
18:2 ω-6 1017 533a 426b 284bc 325c 40 c <.0001
18:3 ω-3 154 103a 82.2ab 42.1bc 43.0c 12.5 c <.0001
18:3 ω-6 11.5 5.56a 4.21b 2.40bc 3.67c 0.48 bc <.0001
20:1 27.5 15.7a 11.9b 7.78bc 8.95c 1.11 c <.0001
20:2 ω-6 4.96 4.29a 3.47a 1.31a 2.41a 0.91 a 0.0798
20:3 ω-6 8.91 5.53a 4.72b 2.57b 3.98c 0.48 bc <.0001
20:4 ω-6 15.5 14.9a 13.3a 7.25ab 9.65b 1.42 ab 0.0037
SFA* 1833 756a 592b 448bc 539c 52 bc <.0001
MUFA* 3636 1588a 1258b 978bc 1181c 112 bc <.0001
PUFA* 1212 666a 534b 339bc 388c 53 c <.0001
Total ω-3* 154 103a 82.2ab 42.1bc 43.0c 12.5 c <.0001
Total ω-6* 1058 563a 452b 297bc 345c 42 c <.0001
ω -6:ω-3 7.20 5.40ab 5.43b 7.25b 8.26ab 0.54 a 0.0073 ND = not detected. SEM= standard error of the mean. a-c Values within a raw with no common superscript are significantly different (P < 0.05). The values presented are means of 4 replicate determinations. * SFA levels were calculated as 14:0 + 15:0 + 16:0 + 18:0. MUFA levels were calculated as 14:1 + 16:1 ω-7 + 18:1ω-7 +18:1 ω-9 + 20:1. PUFA levels were calculated as 18:2 ω-6 + 18:3 ω-3 + 18:3 ω-6 + 20:2 ω-6 + 20:3 ω-6 + 20:4 ω-6. Total ω-6 was calculated as 18:2 ω-6 + 18:3 ω-6 + 20:2 ω-6 + 20:4 ω-6. Total ω-3 was calculated as 18:3 ω-3.

63
Table 2.3. Level (mg fatty acid / 100 g of meat) of fatty acids in the polar lipids of chicken dark and extracted meat
Extraction pH a
Fatty acids Chicken Dark Meat 10.5 11.0 11.5 12.0 SEM Pr > F
14:0 5.88 9.05b 7.52a 7.54ab 7.44ab 0.62 ab 0.0421
16:0 87.8 105b 143ab 149a 137a 11.3 ab 0.0061
16:1 ω-7 12.6 11.8 11.0 11.3 10.1 1.1 0.7861
18:0 103 122 121 133 124 8 0.1681
18:1 ω-7 21.9 24.4b 28.5ab 31.7ab 29.5a 2.0 ab 0.0216
18:1 ω-9 155 166 180 189 178 12 0.3055
18:2 ω-6 122 153b 163ab 171ab 156a 11 ab 0.0459
18:3 ω-3 6.25 10.1ab 7.65a 5.83ab 4.45ab 1.03 b 0.0165
20:0 1.19 1.08ab 1.03ab 1.53ab 0.325a 0.276 b 0.0818
20:1 3.17 3.35 3.22 3.40 3.14 0.26 0.9356
20:2 ω-6 2.66 3.55 3.63 3.60 3.22 0.25 0.0724
20:3 ω-3 0.217 0.873 0.861 0.268 ND 0.245 0.0734
20:3 ω-6 6.77 9.24b 9.21ab 9.88ab 9.32a 0.65 ab 0.0324
20:4 ω-6 54.3 70.0 59.8 68.0 66.0 4.7 0.1639
20:5 ω-3 3.77 6.14b 5.46a 5.12ab 4.56ab 0.46 ab 0.0250
22:0 0.318 1.23 1.03 0.855 ND 0.365 0.1521
22:4 ω-6 9.30 12.4 11.1 12.5 12.0 0.82 0.0743
22:5 ω-3 10.6 17.3b 16.0a 15.2a 13.5ab 1.19 ab 0.0116
22:6 ω-3 6.19 10.3b 8.99a 9.02ab 7.75ab 0.88 ab 0.0472
SFA* 198 239b 274ab 292ab 268a 20 ab 0.0311
MUFA* 192 206 222 236 221 14 0.2856
PUFA* 222 293 286 300 277 19 0.0730
LC ω-3* 20.8 34.6b 31.3a 29.6ab 25.8ab 2.5 ab 0.0131
LC ω-6* 73.0 95.2 83.7 94.0 90.6 6.3 0.1315
Total ω-3* 27.0 44.7b 39.0a 35.4ab 30.3ab 3.1 b 0.0093
Total ω-6* 195 248 247 265 246 17 0.0815
ω -6:ω-3 7.47 5.54ab 6.31b 7.60ab 8.23a 0.45 a 0.0050
ND = not detected. SEM= standard error of the mean. a-b Values within a raw with no common superscript are significantly different (P < 0.05). The values presented are means of 4 replicate determinations. * SFA levels were calculated as 14:0 + 16:0 + 18:0 + 20:0 + 22:0. MUFA levels were calculated as 16:1 ω-7 + 18:1ω-7 +18:1 ω-9 + 20:1. PUFA levels were calculated as 18:2 ω-6 + 18:3 ω-3 + 20:2 ω-6 +20:3 ω-3 + 20:3 ω-6 + 20:4 ω-6 + 20:5 ω-3 + 22:4 ω-6 + 22:5 ω-3 + 22:6 ω-3. LC ω-3 levels were calculated as 20:3 ω-3 + 20:5 ω-3 + 22:5 ω-3 + 22:6 ω-3. LC ω-6 levels were calculated as 20:2 ω-6 + 20:3 ω-6 + 20:4 ω-6 + 22:4 ω-6. Total ω-3 was calculated as 18:3 ω-3 + 20:3 ω-3 + 20:5 ω-3 + 22:5 ω-3 + 22:6 ω-3. Total ω-6 was calculated as 18:2 ω-6 + 20:2 ω-6 + 20:3 ω-6 + 20:4 ω-6 + 22:4 ω-6.

64
Table 2.4. Color measurements and total heme pigments of chicken dark and extracted meat
Extraction pH a
Parameters Chicken Dark Meat 10.5 11.0 11.5 12.0 SEM Pr > F
a* 9.30 1.74a 1.84b 1.44b 1.12b 0.22 b < .0001
b* 19.1 17.3a 17.5b 17.0b 16.1b 0.3 b 0.0016
L* 51.4 63.2b 63.7a 63.6a 62.7a 0.8 a < .0001
a*/ b* 0.486 0.101a 0.105b 0.084b 0.065b 0.011 b < .0001
Saturation 21.3 17.3a 17.6b 17.1b 17.0b 0.3 b < .0001
HUE 64.1 84.2b 84.0a 85.2a 86.3a 0.6 a < .0001
Whiteness 43.7 58.6b 58.9a 59.2a 58.5a 0.8 a < .0001
Total heme pigments (mg/g) 1.13 0.580a 0.564b 0.695b 0.589b 0.030 b <.0001
a-bLeast squares means in a row corresponding to a certain factor with different letters are significantly different (P < 0.05). The values presented are means of 4 replicate determinations.

65
2.6 FIGURES
0
50
100
150
200
250
300
0 2 4 6 8 10 12
Figure 2.1. Solubility profile of chicken dark meat proteins as a function of pH. Protein homogenates were adjusted to a pH range of 1.5 to 12.0 using HCl or NaOH. The values presented are means of 4 replicate determinations.
Solu
bilit
y (m
g/g)
Treatment pH

66
Figure 2.2. Effect of extraction pH on protein yield of extracted chicken dark meat. Dissimilar letters in the graph represent significant (P < 0.05) difference. The values presented are means of 4 replicate determinations.

67
Figure 2.3. Regression analysis showing the relation between protein yield (%) and fat (% on dry basis) of extracted chicken dark meat as a function of extraction pH.
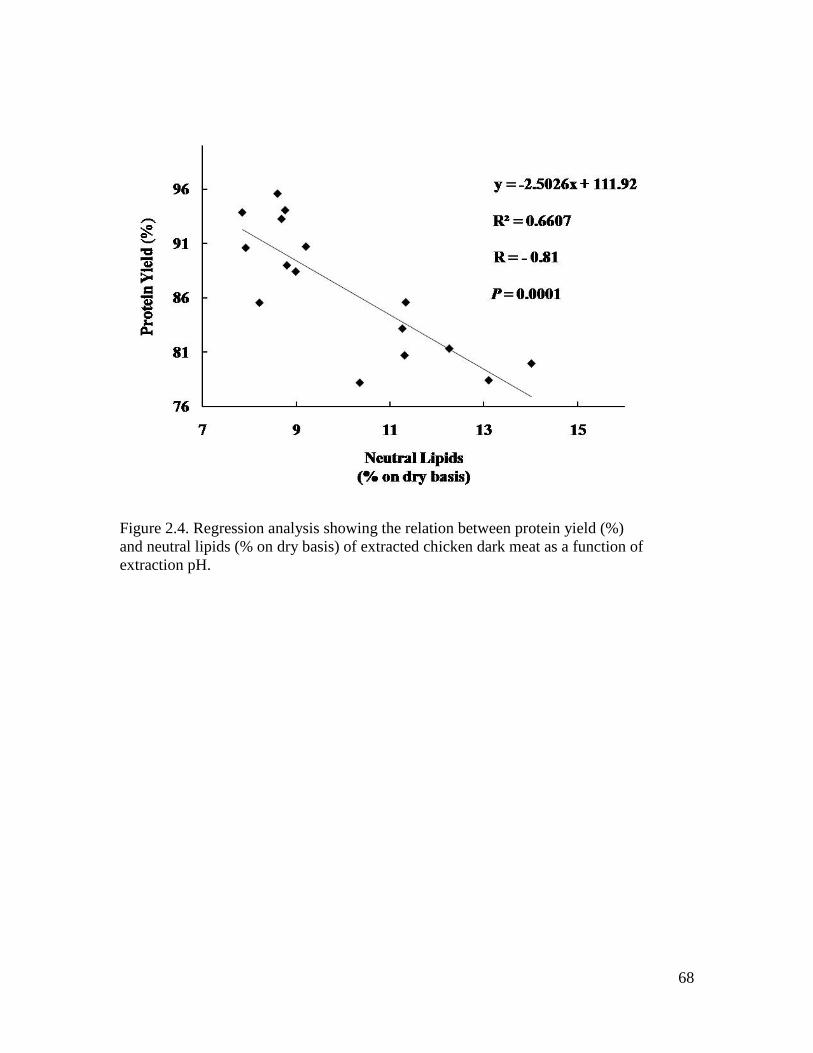
68
Figure 2.4. Regression analysis showing the relation between protein yield (%) and neutral lipids (% on dry basis) of extracted chicken dark meat as a function of extraction pH.

69
0
20
40
60
80
100
120
140
Raw H10.5 L11 H11.5 L12
sarcoplasmic proteins total proteins
a
a
b
b b
bc c
c
c
c
Treatments
Ext
ract
abili
ty (m
g/g)
Figure 2.5. Extractability of recovered proteins after protein extraction by pH-shift method. Sarcoplasmic proteins were solubilized in phosphate buffer, while total proteins were solubilized in phosphate buffer (pH 7.4) containing potassium iodide. Dissimilar letters for respective parameters in the graph represent significant (P < 0.05) difference. The values presented are means of 4 replicate determinations.

70
Figure 2.6. Effect of time and extraction pH on oxidative stability of chicken dark and extracted meat measured as induced TBA reactive substances (TBARS). The values presented are means of 4 replicate determinations.

71
2.7 REFERENCES
Betti, M., and D. L. Fletcher. 2005. The influence of extraction and precipitation pH on
the dry matter yield of broiler dark meat. Poult. Sci. 84:1303-1307.
Betti, M., T. I. Perez, M. J. Zuidhof, and R. A. Renema. 2009. Omega-3 enriched broiler
meat: 3.Fatty acid distribution between triacylglycerol and phospholipid classes.
Poult. Sci. 88:1-15.
Boulianne, M., and A. J. King. 1995. Biochemical and color characteristics of skinless
boneless pale chicken breast. Poult. Sci. 74:1693-1698.
Boulianne, M., and A. J. King. 1998. Meat color and biochemical characteristics of
unacceptable dark-coloured broiler chicken carcasses. J. Food Sci. 63:759-762.
Brewer, M. S., J. Novakofski, and K. Freise. 2006. Instrumental evaluation of pH effects
on ability of pork chops to bloom. Meat Sci. 72:596-602.
CIE (International Commission on Illumination). 1978. Recommendations on uniform
colour spaces, colour difference equations, psychometric colour terms. CIE Publ. 15
(E-1.3.1) 1971/(TO-1.3). Suppl. 15. Bureau Central de la CIE, Paris, France.
Dawson, P. L., B. W. Sheldon, D. K. Larick, and H. R. Ball. 1990. Changes in the
phospholipid and neutral-lipid fractions of mechanically deboned chicken meat due to
washing, cooking, and storage. Poult. Sci. 69:166-175.
Erickson, M. C. 2002. Lipid oxidation of muscle foods. Pages 365-411 in Food Lipids:
Chemistry, Nutrition, and Biotechnology. C. C. Akoh, and D. B. Min, eds. Marcel
Dekker, New York, NY.
Fairchild, M. D. 2004. Color appearance models: CIECAM02 and beyond. Proc.
IS&T/SID 12th Color Imaging Conf. Scotsdale, AZ.

72
Fletcher, D. L., and E. M. Ahmed. 1977. Spinning of peanut protein fibers. Peanut Sci.
4:17–21.
Fletcher, D. L. 1997. Poultry meat color. Pages 159–175 in Proc. Poult. Sci. Symp. Poult.
Meat Sci. Univ. Bristol, Bristol, UK.
Folch, J., M. Lees, and G. H. S. Stanley. 1957. A simple method for the isolation and
purification of total lipids from animal tissues. J. Biol. Chem. 226:497–509.
Froning, G. W. 1995. Color of poultry meat. Poult. Avian Biol. Rev. 6:83–93.
Gasperlin, L., X. Zlender, and V. Abram. 2000. Color of normal and high pH beef heated
to different temperatures as related to oxygenation. Meat Sci. 54:391-398.
Gornall, A. G., C. J. Bardawill, and M. M. David. 1949. Determination of serum proteins
by means of the biuret reaction. J. Biol. Chem. 177:751-766.
Hamm, R. 1994. The influence of pH on the protein net charge in the myofibrillar
system. Proc. Recipr. Meat Conf. 47:5-9.
Hornsey, H. C. 1956. The color of cooked cured pork. J. Sci. Food Agric. 7:534-540.
Hrynets, Y. V., J. Chan, Y. Xu, and M. Betti. 2009. Acid solubilization process of
mechanically separated turkey meat (MSTM) with the aid of citric acid and calcium
ions: effect on the polar and neutral lipid classes. Poult. Sci. 88 (Suppl. 1):33. (Abstr.)
Hultin, H. O. 1995. Role of membranes in fish quality. Pages 13-36 in TemaNord 1995:
624. Nordic Council Ministers, Copenhagen, Denmark.
Hultin, H. O., and S. D. Kelleher. 1999. Process for isolating a protein composition from
a muscle source and protein composition. US Pat. No. 6,005,073.
Hultin, H. O., and S. D. Kelleher. 2000. Surimi processing from dark muscle fish. Pages
59-77 in Surimi and Surimi Seafood. J. W. Park, ed. Marcel Dekker, New York, NY.
Hultin, H. O., S. D. Kelleher, Y. Feng, H. G. Kristinsson, M. P. Richards, I. A. Undeland,
and S. Ke. 2000. High efficiency alkaline protein extraction. US Pat. No. 60/230,397.

73
Hultin, H. O., S. D. Kelleher, Y. M. Feng, H. G. Kristinsson, M. P. Richards, and I. A.
Undeland. 2003. High efficiency alkaline protein extraction. Univ. Massachusettes,
Amherst. US Pat. No. 10/363,612.
Irie, M. 2001. Optical evaluation of factors affecting appearance of bovine fat. Meat Sci.
57:19-22.
Jelen, P., M. Earle, and W. Edwardson. 1979. Recovery of meat protein from alkaline
extracts of beef bones. J. Food Sci. 44:327-331.
Kim, Y. S., J. W. Park, and Y. J. Choi. 2003. New approaches for the effective recovery
of fish proteins and their physicochemical characteristics. Fish Sci. 69:1231-1239.
Kornbrust, D. J., and R. D. Mavis. 1980. Relative susceptibility of microsomes from
lung, heart, liver, kidney, brain and testes to lipid peroxidation: correlation with
vitamin E content. Lipids. 15:315-322.
Kristinsson, H. G., and H. O. Hultin. 2003. Changes in conformation and subunit
assembly of cod myosin at low and high pH and after subsequent refolding. J. Agric.
Food Chem. 51:7187-7196.
Kristinsson, H. G., A. E. Theodore, N. Demir, and B. Ingadottir. 2005. A comparative
study between acid- and alkali-aided processing and surimi processing for the
recovery of proteins from channel catfish muscle. J. Food Sci. 70:298–306.
Kristinsson, H. G., and B. Ingadottir. 2006. Recovery and properties of muscle proteins
extracted from Tilapia (Oreochromis niloticus) light muscle by pH shift processing. J.
Food Sci. 71:132-141.
Lanier, T. C. 1986. Functional properties of surimi. Food Technol. 40:107-114.
Lawrence, R. A., P. Jelen, and P. Fedec. 1982. Pilot plant extraction of protein from
mechanically separated poultry residues. J. Can. Inst. Food Sci. Technol. 15:325-328.
74
Layne, E. 1957. Spectrophotometric and turbidimetric methods for measuring proteins.
Page 450 in Methods in Enzymology. S. P. Colowick, and N. O. Kaplan, eds. Acad.
Press, New York, NY.
Liang, Y., and H. O. Hultin. 2003. Functional protein isolates from mechanically
deboned turkey by alkaline solubilization with isoelectric precipitation. J. Muscle
Foods. 14:195-205.
Liang, Y., and H. O. Hultin. 2005. Separations of membranes from acid-solubilized fish
muscle proteins with the aid of calcium ions and organic acid. J. Agric. Food Chem.
55:3008-3016.
Little, A. C. 1975. Off on a tangent. J. Food Sci. 40:410-411.
Meinke, W. W., M. A. Rahman, and K. F. Mattil. 1972. Some factors influencing the
production of protein isolates from whole fish. J. Food Sci. 37:195-198.
Mohan, M., D. Ramachandran, and T. V. Sankar. 2006. Functional properties of rohu
(Labeo rohita) proteins during iced storage. Food Resr. Inter. 39:847-854.
Niewiarowicz, A., J. Pikul, and P. Czajka. 1986. Gehalt an Myoglobin und Haemoglobin
in Fleischtverschiedener Geflü gelarten. Fleischwirtsch. 66:1281-1282.
Nolsøe, H., and I. Undeland. 2009. The acid and alkaline solubilization process for the
isolation of muscle proteins: state of the art. Food Bioproc. Technol. 2:1-27.
Nylander, T. 2004. Interactions between proteins and polar lipids in Food Emulsions. S.
E. Friberg, K. Larsson, and J. Sjöblom, eds. Marcel Dekker, New York, NY.
http://www.foodnetbase.com//books/2122/DKE199_FM.pdf Accessed Nov. 2009.
Omana, D. A., Y. Xu, V. Moayedi, and M. Betti. 2010. Alkali aided protein extraction
from chicken dark meat: chemical and functional properties of recovered proteins.
Process Biochem. 45: 375-381.
75
Perez-Alvarez, J. A., and J. Fernandez-Lopez. 2009. Color measurements on muscle-
based foods. Page 470 in Handbook of Muscle Foods Analysis. L. M. L. Nollet, and
F. Toldrà, eds. CRC Press, Boca Raton, FL.
Pikul, J., A. Niewiarowicz, and H. Pospieszna. 1982. Gehalt an Hämfarbstoffen im
Fleisch verschiedener Geflü gelarten. Fleischwirtsch. 62:900-905.
Ramadan, M. F., and J. T. Mörsel. 2003. Determination of the lipid classes and fatty acid
profile of Niger (Guizotia abyssinica Cass.) seed oil. Phytochem. Anal. 14:366-370.
Sarma, J., L. N. Srikar, and G. V. Reddy. 1999. Effect of ice storage on the functional
properties of pink perch and oil sardine meat. J. Sci. Food Agric. 79:169-172.
SAS System, 2002. SAS 9.1. Copyright (C) 2002-2003 By SAS Institute Inc., Cary, NC,
USA.
Scopes, R. K. 1970. Characterization and study of sarcoplasmic proteins. Page 471 in The
Physiology and Biochemistry of Muscle as a Food, 2nd ed. E. J. Briskey, R. G.
Cassens, and B. B. Marsh, eds. The Univ. Wisconsin Press, Madison, WI.
Terra, N. N., R. M. L. de Campos, and P. C. B. Campagnol. 2009. Sensory aspects of
cooked meats. Page 550 in Handbook of Muscle Foods Analysis. L. M. L. Nollet, and
F. Toldrà, eds. CRC Press, Boca Raton, FL.
Torten, J., and J. R. Whitaker. 1964. Evaluation of the biuret and dye-binding methods
for protein determination in meats. J. Food Sci. 29:168-174.
USDA (U.S. Food and Drug Administration). 2004. Sensory and physicochemical
property relationships in food that define and predict end-use quality.
http://www.reeis.usda.gov/web/crisprojectpages/402748.html Accessed June 2009.
Vann, D. G., and C. A. M. DeWitt. 2007. Evaluation of solubilized proteins as an
alternative to phosphates for meat enhancement. J. Food Sci. 72:72-77.
76
Wood, J. V., M. Enser, A. V. Fisher, G. R. Nute, P. R. Sheard, R. I. Richardson, S. I.
Hughes, and F. M. Whittington. 2008. Fat deposition, fatty acid composition and meat
quality: A review. Meat Sci. 78:343-358.
Young, R. H., and R. A. Lawrie. 1974. Utilization of edible protein from meat industry
by-products and waste. I. Factors influencing the extractability of protein from bovine
and ovine stomach and lungs. Food Technol. 9:69-78.

77
3 ALKALI AIDED PROTEIN EXTRACTION FROM CHICKEN DARK MEAT:
TEXTURAL AND RHEOLOGICAL CHARACTERISTICS OF RECOVERED
PROTEINS2
3.1 INTRODUCTION
Due to the fact that poultry dark meat has been considered as a major underutilized
commodity (USDA, 2004), finding new technologies to transform it into valuable foods has
become a major challenge for the poultry industry in North America.
One of the alternatives to utilize the “low value” poultry dark meat is to recover the
proteins without compromising the protein functionality. pH shifting processing has been widely
used for the recovery of proteins from fish dark meat (Kristinsson and Hultin, 2003). This
technology has several advantages over the conventional surimi processing. These advantages
include economical feasibility, high recovery yield and improved functionalities of the recovered
proteins (Undeland et al., 2002; Kristinsson et al., 2005). Furthermore, the protein recovery from
fatty fishes (more than 5% fat content) using pH shifting technology showed improvement in gel
properties (Undeland et al., 2002; Kristinsson and Hultin, 2003). Since the fat content of poultry
dark meat is similar to that of fatty fishes, the pH shifting method is expected to be appropriate
for poultry dark meat.
Problems with research on surimi and other materials rich in dark meat are color, poor gel
properties, and lipid oxidation (Okada, 1980; Hultin and Kelleher, 2000). Due to the relationship
of texture with gel forming ability of myofibrilar proteins, the study of gelation has been of
interest. Research by Ashgar et al. (1985) indicated that myosin and actomyosin are the proteins
which play the main role in gelation. According to Oakenfull et al. (1997), dynamic
measurements which involve small deformations under oscillating stress may give more reliable
information on the viscoelastic nature of the gel compared to large strain test. Meat texture is
responsible for quality and affects consumer acceptance (Ordonez et al., 2001; Stanley, 1976).
The complex interaction between sensory properties and physical processes which occurs during
chewing and determines human perception of meat quality. Instruments which measure food
texture stimulate such interactions. Hence, texture evaluation can be performed by subjecting the 2 A modified version of this Chapter was accepted for publication in the Journal of Poultry Science, 2010 (authors: Dileep Omana, Vida Moayedi, Yan Xu, and Mirko Betti).
78
food to shearing, chewing, compressing or stretching, and measuring the response of food to
those conditions. Texture Profile Analysis (TPA) is broadly used to evaluate food texture (Tabilo
et al., 1999).
Alkaline solubilization followed by acid precipitation has been used on poultry meat in
order to extract the proteins (Jelen et al., 1982; McCurdy et al., 1986). Since there is not much
research performed on textural and rheological properties of alkali extracted proteins from
chicken meat, this study was conducted to assess textural properties and rheological
characteristics of alkali extracted chicken dark meat.
3.2 MATERIALS AND METHODS
3.2.1 Materials
Frozen chicken thigh meat was obtained from Lilydale Inc. (Edmonton, AB, Canada) and
used for this study. The chicken thigh meat was thawed at 4 oC overnight. It was then minced
using a meat grinder (Waring Pro, Woodbridge, ON, Canada); vacuum packed in 400 g plastic
bags and stored at -30 o
3.2.2 Methods
C until analysis.
3.2.2.1 Extraction Method
The extraction was carried out as per the methods described earlier (Liang and Hultin,
2003; Betti and Fletcher, 2005) with modifications. For the extraction of protein isolate, 400 g of
frozen chicken thigh meat was thawed at 4 oC overnight. The meat was further mixed with ice-
distilled water mixture (1:2.5; w:v) using an homogenizer (Wolfgang Puck Appliances) for 15
minutes. Further, the pH of the resulting meat slurry was adjusted using 2 M NaOH with
constant mixing. Individual lots were adjusted to pH 10.5, 11.0, 11.5, and 12.0 for alkaline
hydrolysis/protein solubilization and allowed to stand still at 4 oC for 30 minutes. The slurry was
centrifuged using an Avanti J-E refrigerated centrifuge (Beckman Coulter, Inc., Palo Alto, CA,
USA) at 25,900 g for 20 minutes at 4 oC. Three layers were formed after centrifugation: an upper
fat layer, a middle aqueous layer of soluble proteins and a bottom sediment layer. The middle
protein layer was carefully removed and the pH was adjusted to 5.2 using 2 M HCl. The

79
precipitated proteins were separated by centrifugation at 25,900 g for 20 minutes at 4 oC. These
separated proteins were further mixed with iced water and the pH was adjusted to pH 6.2. Hence,
this method of recovery of proteins is also called pH-shift method. The proteins were finally
separated by centrifugation at 25,900 g for 20 minutes at 4 oC. After determining the moisture
content of the protein extract, the final moisture content was adjusted to 80%, then mixed with
cryoprotectants (5% sorbitol, 4% sucrose, 0.3% sodium tripolyphosphate, 0.4% sodium
bicarbonate and 0.03% sodium nitrite) using a Kitchen-Aid meat processor. The processor was
pre-chilled and operated in a cold room (6-10 °C) to prevent the temperature of the protein
isolate from exceeding 15 °C throughout the mixing process. The recovered proteins were then
stored at -30 o
3.2.2.2 Cooking Loss
C for one month, after which samples were drawn for analysis.
Samples weighing 25-30 g (W1) were packed in plastic tubes. The tubes were then
heated at 95 oC, until the internal temperature of the samples reaches 75 oC. The temperature was
checked using thermocouples inserted in the center of the sample. The samples were considered
cooked when the internal temperature reached 75 o
Cooking loss (%) = (W1- W2/ W1) x 100
C. After cooking, the meat was weighed again
(W2) to determine the loss in weight during cooking.
3.2.2.3 Expressible Moisture
The expressible water content was determined using a texture profile analyzer (TA XT
Express, Stable micro systems, Ltd., Surrey, England). A known quantity of cooked sample
(approximately 300 mg) was placed on a pre-weighed filter paper (Whatman No.1), and
sandwiched between two glass plates. Using the texture profile analyzer under adhesive test
mode, the sample was tested with a target force of 1000 g. The hold time for this test was 2
minutes, which was sufficient to express the water content of the sample. After the test, the filter
paper along with the absorbed water was immediately weighed. Expressible water is measured as
the quantity of water released per gram meat and was expressed as a percentage.
Expressible water (%) = (wet paper - dry paper / meat weight) x 100

80
3.2.2.4 Textural Profile Analysis
The texture profile analysis was carried out using a texture profile analyzer (TA-XT
Express, Stable micro systems, Ltd., Surrey, England) with the method developed by Zhang and
Barbut (2005). Meat samples in cylindrical shape (1.0 cm-height and 4.0 cm-diameter) were
prepared from the samples. The analysis was carried out in TPA mode, using the TA-XT Express
software included with the equipment. A double compression cycle test was performed up to
50% compression of the original portion height with an aluminium cylinder probe of 5 cm
diameter. A time of 1 s was allowed to elapse between the two compression cycles. The trigger
force used for the test was 5 g, with a test speed of 5 mm/s. When the test was finished, the
software calculated the values for hardness (maximum force in grams required to compress the
sample), springiness (ability of the sample to recover its original form after deforming force was
removed), chewiness (the work needed to chew a solid sample to a steady state of swallowing),
cohesiveness (extent to which the sample could be deformed prior to rupture) and resilience (the
ability of the sample for recovery of shape). The analysis was carried out for 6 replicates.
3.2.2.5 Dynamic Viscoelastic Behaviour of Recovered Proteins
The dynamic viscoelastic behavior (DVB) of raw chicken meat and treated samples in the
temperature range of 7 °C to 100 °C was measured using a Physica MCR Rheometer (Anton
Paar GmbH, Virginia, USA) under oscillatory mode, using a 2.5 cm parallel plate measuring
geometry. Approximately 4 g of macerated meat was ground thoroughly to obtain a fine paste.
The paste was used for DVB measurement. The gap between measuring geometry and the peltier
plate was adjusted to 1000 µm. The measurements were made by applying a small amplitude
oscillation (0.5%) with a frequency of 1.0 Hz. A heating rate of 2 °C/min was achieved through
the peltier plate of the rheometer. The applied stress was compared with the resultant strain. The
results of the measurements were expressed as the storage modulus (G′) and loss modulus (G′′).
An average of 3 replicates was used for plotting the results.
3.2.3 Statistical Analysis
Each experiment and each assay was done at least in triplicate. Reported results represent
an average of each experimental assay. All data were subjected to Analysis of Variance using the
general linear model procedure of SAS (SAS, 2006). Differences between least squares means

81
were determined using HSD Tukey differences, and were reported as significant at the P < 0.05
level.
3.3 RESULTS AND DISCUSSION
3.3.1 Cooking Loss
One of the factors which determine meat quality is water holding capacity. Expressible
moisture and cooking loss are the factors which are responsible for tenderness of meat (El
Rammouz et al., 2004) and hence related to the water holding capacity of the proteins. Cooking
loss measurement helps to assess the effect of extraction pH on the water holding capacity
(WHC) of the recovered proteins. There was a decrease in cooking loss for proteins extracted at
pH values above 11.0. The maximum reduction in cooking loss was for proteins recovered at pH
values of 11.5 and 12.0 (Figure 3.1). The lower cooking loss indicates higher WHC of the
proteins. The greater WHC for proteins extracted with pH values above 11.0 could be explained
by their higher protein content (see Chapter 2). In fact during heating, proteins form a gel by
entrapping water. Higher protein content leads to better gel formation due to greater WHC of the
proteins.
For the raw meat on the other hand, cooking loss was found to be maximum compared to
extracted meat, which means that WHC was at its minimum level. This could be explained by
the absence of cryoprotectants in the raw dark meat which were only added to extracted meat. In
fact cryoprotectants improve WHC by absorbing more water (Henry et al., 1995). It has been
reported by Ensoy et al. (2004) that the WHC of the surimi prepared from spent layers has been
improved by adding cryoprotectants.
3.3.2 Expressible Moisture
Expressible moisture (water loss) is a factor which indicates meat texture, tenderness and
juiciness. Cooking loss and water loss are the parameters which both indicate WHC of meat
(Mallikarjunan and Hung, 1997). In the present study water loss decreased as the pH of
extraction increased (Figure 3.2). Water loss was less than 10% which was significantly lower (P
< 0.05) for extracted meat at pH values of 11.0, 11.5, and 12.0 compared to pH 10.5 and raw
82
dark meat. Kristinsson and Liang (2006) reported similar results for alkali-extracted fish
proteins. In present investigation the lower expressible moisture obtained for protein isolates at
the pH 11.0 and above, indicates higher WHC for the protein gel network at this pH values
(Rawdkuen et al., 2009).
An inverse relationship was found between water loss and hardness of the recovered meat
(Table 3.2). Similar results were found by Rawdkuen et al. (2009) who conducted a study on
tilapia fish. Higher pH values leads to unfolding the proteins and results in exposure of
hydrophobic groups, which leads to an increase in hydrophobicity. As a result, during heating of
such protein there will be better gel network formation due to higher hydrophobic interaction.
Water loss of the proteins recovered at pH 10.5 was similar to the values for raw dark meat due
to the low alkaline conditions which might lead to less exposure of hydrophobic groups
compared to pH 11.0 and above.
3.3.3 Textural Profile Analysis/Dynamic Viscoelastic Behaviour
Alkali-aided protein isolates underwent less denaturation compared to acid-aided protein
isolates as reported by Kristinsson et al. (2005). Texture profile analysis of alkali extracted
proteins is showed in Table 3.1. Hardness was greater for protein isolates at higher extraction pH
values. The maximum hardness (4956 gram force) was found to be for proteins extracted at pH
11.5. This could be explained by the fact that higher pH leads to more protein denaturation and
exposure of more hydrophobic groups (Omana et al., 2010), leading to more protein-protein and
protein-cryoprotectant interactions. These interactions will lead to form a gel network with
higher hardness values. It is hypothesized that such a gel network would differ from a typical gel
network of myofibrillar proteins (Tadpitchayangkoon and Yongsawatdigul, 2009). Elastic gels
are derived from numerous cross-links between the myofibrillar proteins. When this gel network
is unevenly distributed due to local aggregation of myofibrillar proteins, it will lead to poor gel
formation as indicated by the lower storage modulus (G′). According to Feng and Hultin (2001)
due to the presence of local aggregates of myofibrillar proteins even though the gel appears
harder, it can easily breaks under stress.
Another reason for an increase in hardness for extracted meat could be concentration of
myofibrillar proteins. According to Chen et al. (1997) hardness increased for myofibrillar
83
proteins concentrated by washing procedures. Previous studies conducted on alkali extraction of
chicken dark meat showed that samples at pH 11.5 and 12.0 had higher protein content (see
Chapter 2). Thus, this higher protein content might be the reason for the greater hardness of these
samples.
There was no significant difference in springiness values between extracted meats treated
at different pH values. This could be explained by the fact that all the samples were adjusted to
equal moisture content. There was a significant (P < 0.05) increase in chewiness values for
extracted meat at pH values of 11.5 and 12.0. Chewiness denotes the resistance to compression
force (Caine et al., 2003). Greater chewiness values obtained for protein samples treated at
higher pH, might be explained by the increase in WHC (Figure 3.2), which results in more
chewiness. Cohesiveness and resilience values significantly (P < 0.05) increased for extracted
meat compared to raw dark meat with no significant difference between the pH treatments.
According to Caine et al. (2003) change in resilience value was mainly due to the fat content.
The alkali-aided extraction led to a significant lipid loss. On average fat removal was
approximately 50% between pH values of (10.5-12.0) (see Chapter 2). The difference of TPA
factors between extracted meat and raw dark meat might be due to the variations in moisture,
lipid, and collagen content.
The dynamic rheological measurement has been used to study the heat-induced gelation
of myofibrillar proteins (Hamann, 1987). Increase in storage modulus (G′) indicates elastic gel
network formation. Thus the change in G′ values is used to monitor gelation of proteins
(Venugopal et al., 2002). Loss modulus (G′′) indicates the viscous behavior of the sample. The
ratio of G′′/ G′ during the oscilla tory test indicates gel transition temperature and is expressed as
tan delta.
Dynamic viscoelastic behaviour (DVB) of extracted proteins (without cryoprotectants) at
various pH values is presented in Figure 3.3. The DVB for chicken dark meat indicated
considerable gelation properties as it showed by G′ values. Maximum storage modulus value
(439 kPa) was found at 66.7 oC. The increase in value indicated that proteins had ordered
aggregation and formed a 3-dimensional gel network which entraps water (Dileep et al., 2005).
The increase in storage (G′) and loss modulus (G′′) during heating indicate formation of a
viscoelastic gel network. G′ values were at their maximum in temperature range of 40 -60 oC.
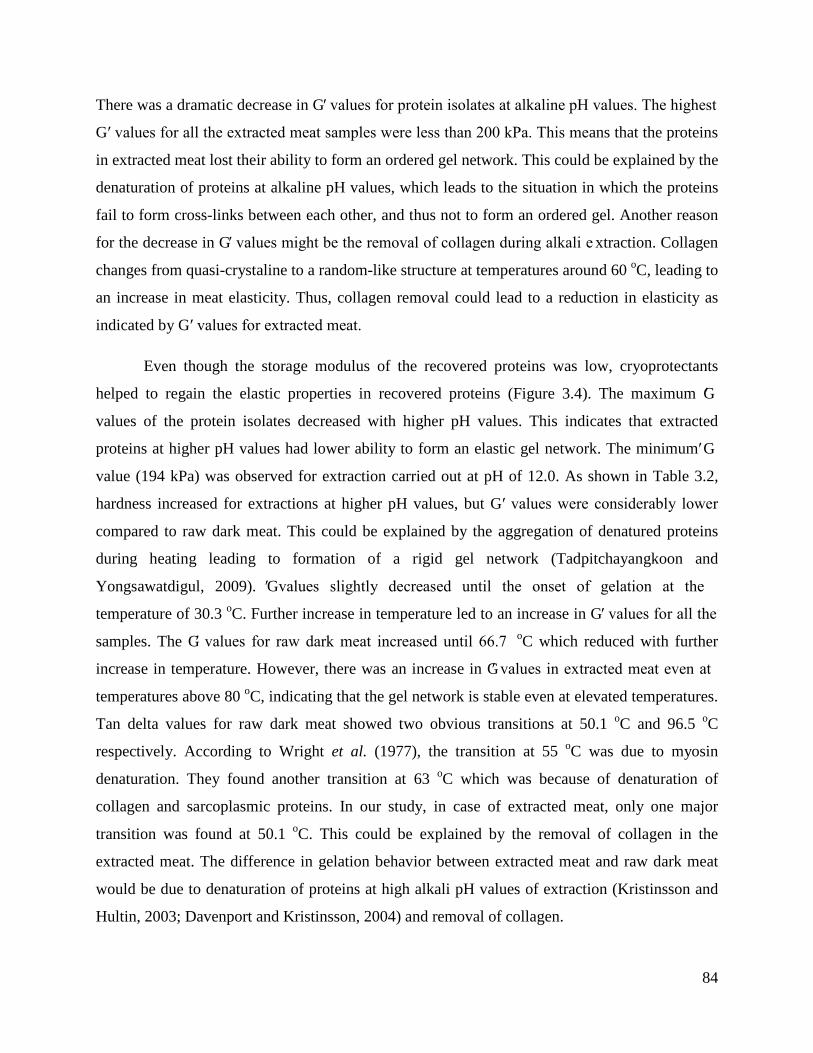
84
There was a dramatic decrease in G′ values for protein isolates at alkaline pH values. The highest
G′ values for all the extracted meat samples were less than 200 kPa. This means that the proteins
in extracted meat lost their ability to form an ordered gel network. This could be explained by the
denaturation of proteins at alkaline pH values, which leads to the situation in which the proteins
fail to form cross-links between each other, and thus not to form an ordered gel. Another reason
for the decrease in G′ values might be the removal of collagen during alkali e xtraction. Collagen
changes from quasi-crystaline to a random-like structure at temperatures around 60 o
Even though the storage modulus of the recovered proteins was low, cryoprotectants
helped to regain the elastic properties in recovered proteins (Figure 3.4). The maximum G′
values of the protein isolates decreased with higher pH values. This indicates that extracted
proteins at higher pH values had lower ability to form an elastic gel network. The minimum G′
value (194 kPa) was observed for extraction carried out at pH of 12.0. As shown in Table 3.2,
hardness increased for extractions at higher pH values, but G′ values were considerably lower
compared to raw dark meat. This could be explained by the aggregation of denatured proteins
during heating leading to formation of a rigid gel network (Tadpitchayangkoon and
Yongsawatdigul, 2009). G′ values slightly decreased until the onset of gelation at the
temperature of 30.3
C, leading to
an increase in meat elasticity. Thus, collagen removal could lead to a reduction in elasticity as
indicated by G′ values for extracted meat.
oC. Further increase in temperature led to an increase in G′ values for all the
samples. The G′ values for raw dark meat increased until 66.7 oC which reduced with further
increase in temperature. However, there was an increase in G′ values in extracted meat even at
temperatures above 80 oC, indicating that the gel network is stable even at elevated temperatures.
Tan delta values for raw dark meat showed two obvious transitions at 50.1 oC and 96.5 oC
respectively. According to Wright et al. (1977), the transition at 55 oC was due to myosin
denaturation. They found another transition at 63 oC which was because of denaturation of
collagen and sarcoplasmic proteins. In our study, in case of extracted meat, only one major
transition was found at 50.1 oC. This could be explained by the removal of collagen in the
extracted meat. The difference in gelation behavior between extracted meat and raw dark meat
would be due to denaturation of proteins at high alkali pH values of extraction (Kristinsson and
Hultin, 2003; Davenport and Kristinsson, 2004) and removal of collagen.
85
3.4 CONCLUSIONS
Cooking loss and water loss significantly reduced for recovered proteins at higher pH
values. In comparison with raw dark meat, there was an increase in hardness and chewiness of
extracted meat at higher pH values. Even though the hardness of protein extracts was higher,
their lower G′ values showed less elasticity. The lower G′ values of the extracted meat as
compared to the raw dark meat may be due to extensive denaturation of proteins as well as
collagen removal during the process. Storage modulus of extracted meat was found to be
increased with the addition of cryoprotectants. The gels obtained from extracted proteins with
added cryoprotectants were more stable and were not disrupted even at temperatures above 80 o
C. Unlike the raw dark meat, extracted meat showed a single transition due to the denaturation
of myosin as indicated by tan delta values. In conclusion, this study revealed that proteins
extracted at pH values of 10.5 and 11.0 posses good water holding capacity and appreciable
gelling properties which make them a suitable functional ingredient for the preparation of further
processed meat products.

86
3.5 TABLES Table 3.1. Textural profile analysis of recovered proteins after protein extraction by pH-shift method1
Parameters Raw pH 10.5 pH 11.0 pH 11.5 pH 12.0
Hardness (g)
2836.83 (767.17)
b 3151.88a,b
(1318.43) 3782.27
(1292.69) a,b 4956.30
(1366.58) a 4334.15a,b
(424.38)
Springiness
0.98a
(0.21) 1.17a
(0.41) 0.97a
(0.05) 1.24a
(0.46) 1.36a
(0.42)
Chewiness
1521.69b
(641.08) 2840.10
(1941.44) a,b 2753.09a,b
(777.67) 4492.63a
(1289.96) 4584.52a
(1573.40)
Cohesiveness
0.54b
(0.06) 0.73a
(0.03) 0.77a
(0.05) 0.77a
(0.03) 0.77a
(0.02)
Resilience 0.30b
(0.04) 0.43a
(0.03) 0.52a
(0.07) 0.51a
(0.06) 0.52a
(0.03)
1
Results are presented as means values (n = 6). Values in parenthesis denote standard deviations. Dissimilar superscripts in the same row denote significant difference (P < 0.05).

87
3.6 FIGURES
0
4
8
12
16
Raw 10.5 11 11.5 12
Figure 3.1. Cooking loss of different treatments during alkali extraction of Chicken dark meat. Dissimilar letters (a, b, c) in the figure denotes significant difference (P < 0.05). The values presented are means of 6 replicate determinations.
Raw 10.5 11.0 11.5 12.0 Treatments
Coo
king
loss
(%)
a
a,b
b,c
c c

88
0
10
20
30
Raw 10.5 11 11.5 12
Figure 3.2. Expressible moisture of different treatments during alkali extraction of chicken dark meat. Dissimilar letters (a, b) in the figure denotes significant difference (P < 0.05). The values presented are means of 6 replicate determinations.
Raw 10.5 11.0 11.5 12.0 Treatments
Wat
er lo
ss (%
)
a a
b
b b

89
0
100
200
300
400
500
0 20 40 60 80 1000
0.1
0.2
0.3
0.4
0
100
200
300
400
500
0 20 40 60 80 1000
0.1
0.2
0.3
0.4
0
100
200
300
400
500
0 20 40 60 80 1000
0.3
0.6
0.9
1.2
1.5
1.8
0
100
200
300
400
500
0 20 40 60 80 1000
2
4
6
8
10
12
0.4 0.3 0.2 0.1 0
Raw
10.5 11.0
11.5 12.0
Temperature (oC)
Sto
rag
e,
G'
/ L
os
s m
od
ulu
s,
G"
(kP
a)
Ta
n
de
lt
a
0.4 0.3 0.2 0.1 0
0
100
200
300
400
500
0 20 40 60 80 1000
0.1
0.2
0.3
0.4
Figure 3.3. Dynamic viscoelastic behaviour (DVB) of recovered proteins from chicken dark meat after alkali extraction (without cryoprotectants). DVB of fresh chicken dark meat is given for comparison (G'(-●-) , G''(-○-) and Tan delta(-∆-)). Storage/Loss moduli are drawn on the same scale for all the graphs.

90
0
100
200
300
400
500
0 20 40 60 80 1000
0.1
0.2
0.3
0.4
0
100
200
300
400
500
0 20 40 60 80 1000
0.1
0.2
0.3
0.4
0
100
200
300
400
500
0 20 40 60 80 1000
0.1
0.2
0.3
0.4
0
100
200
300
400
500
0 20 40 60 80 1000
0.1
0.2
0.3
0.4
Raw
10.5 11.0
11.5 12.0
Figure 3.4. Dynamic viscoelastic behaviour (DVB) of recovered proteins from chicken dark meat after alkali extraction, stored at -30oC for one month with added cryoprotectants. DVB of fresh chicken dark meat is given for comparison. (G'(-●-), G'' (-○-) and Tan delta (-∆-)). Storage/Loss moduli are drawn on the same scale for all the graphs.
Temperature (oC)
Sto
rag
e,
G'
/ L
os
s m
od
ulu
s,
G"
(kP
a)
Ta
n
de
lt
a
0
100
200
300
400
500
0 20 40 60 80 1000
0.1
0.2
0.3
0.4
0.4 0.3 0.2 0.1 0
0.4 0.3 0.2 0.1 0

91
3.7 REFERENCES
Ashgar, A., K. Samejima, and T. Yasui. 1985. Functionality of muscle protein in gelation
mechanism of structured meat products. CRC Crit. Rev. Food Sci. Nutr. 22:27-105.
Betti, M., and D. L. Fletcher. 2005. The influence of extraction and precipitation pH on the dry
matter yield of broiler dark meat. Poult. Sci. 84:1303-1307.
Caine, W. R., J. L. Aalhus, D. R. Best, M. E. R. Dugan, and L. E. Jeremiah. 2003. Relationship
of texture profile analysis and Warner-Bratzler shear force with sensory characteristics of
beef rib steaks. Meat Sci. 64:333-339.
Chen, H. H., E. M. Chiu, and J. R. Huang. 1997. Colour and gel-forming properties of horse
mackerel (Trachurus japonicus) as related to washing conditions. J. Food Sci. 62:985–991.
Davenport, M., and H. G. Kristinsson. 2004. Effect of different acid and alkali-treatments on the
molecular and functional properties of catfish muscle proteins. IFT Annual Meet. 49G-14.
(Abstr.)
Dileep, A. O., B. A. Shamasundar, P. K. Binsi, F. Badii, and N. K. Howell. 2005. Effect of ice
storage on the physicochemical and dynamic viscoelastic properties of ribbonfish (Trichiurus
spp) meat. J. Food Sci. 70:E537-545.
El-Rammouz, R., R. Babile, and X. Fernandez. 2004. Effect of ultimate pH on the
physicochemical and biochemical characteristics of turkey breast muscle showing normal rate
of postmortem pH fall. Poult. Sci. 83:1750–1757.
Ensoy, U., N. Kolsarici, and K. Candogan. 2004. Quality characteristics of spent layer surimi
during frozen storage. Eur. Food Resear. Technol. 219:14-19.
Feng, Y., and H. O. Hultin. 2001. Effect of pH on the rheological and structural properties of
gels of water-washed chicken-breast muscle at physiological ionic strength. J. Agric. Food
Chem. 49:3921–3935.
Hamann, D. D. 1987. Methods for measuring rheological changes during thermally induced
gelation of proteins. Food Technol. 41:100–108.
92
Henry, L. K., L. C. Boyd, and D. P. Green. 1995. Cryoprotectants improve physical and
chemical properties of frozen blue crab meat (Callinectes sapidus). J. Sci. Food Agric. 69:
15-20.
Hultin, H. O., and S. D. Kelleher. 2000. Surimi processing from dark muscle fish. Pages 59-77 in
Surimi and Surimi Seafood. J. W. Park, ed. Marcel Dekker, New York, NY.
Jelen, P., R. A. Lawrence, and M. Cerrone. 1982. Evaluation of alkali extracted chicken protein
for use in luncheon meats. Can. Inst. Food Sci. Technol. J. 15:289-293.
Kristinsson, H. G., and H. O. Hultin. 2003. Changes in conformation and subunit assembly of
cod myosin at low and high pH and after subsequent refolding. J. Agric. Food Chem. 51:
7187-7196.
Kristinsson, H. G., A. E. Theodore, N. Demir, and B. Ingadottir. 2005. A comparative study
between acid- and alkali-aided processing and surimi processing for the recovery of proteins
from channel catfish muscle. J. Food Sci. 70:C298–C306.
Kristinsson, H. G., and Y. Liang. 2006. Effect of pH-shift processing and surimi processing on
atlantic croaker (Micropoganias undulates) muscle proteins. J. Food Sci. 71:C304-C312.
Liang, Y., and H. O. Hultin. 2003. Functional protein isolates from mechanically deboned turkey
by alkaline solubilization with isoelectric precipitation. J. Muscle Food. 14:195-206.
Mallikarjunan, P., and Y. C. Hung. 1997. Physical and ultrasound measurements. Pages 313-319
in Quality in Frozen Foods. M. C. Erikson, and Y. C. Hung, eds. Chapman & Hall, New
York, NY.
McCurdy, S., P. Jelen, P. Fedec, and D. F. Wood. 1986. Laboratory and pilot scale recovery of
protein from mechanically separated chicken residues. J. Food Sci. 51:742–746.
Oakenfull, D., J. Pearce, and R. W. Burley. 1997. Protein gelation. Pages 111-142 in Food
Proteins and Their Applications. S. Damodaran, and A. Paraf, eds. Marcel Dekker, New
York, NY.

93
Okada, M. 1980. Utilization of small pelagic species for food. Pages 265-282 in Proc. 3rd Natl.
Technical Seminar on Mechanical Recovery and Utilization of Fish Flesh. R. E. Martin, ed.
Natl. Fisheries Inst. Washington, DC.
Omana, D. A., Y. Xu, V. Moayedi, and M. Betti. 2010. Alkali aided protein extraction from
chicken dark meat: chemical and functional properties of recovered proteins. Process
Biochem. 45: 375-381.
Ordonez, M., J. Rovira, and I. Jaime. 2001. The relation between the composition and texture of
conventional and low-fat frankfurters. Int. J. Food Sci. Technol. 36:749–758.
Rawdkuen, S., S. Sai-Ut, S. Khamsorn, M. Chaijan, and S. Benjakul. 2009. Biochemical and
gelling properties of tilapia surimi and protein recovered using an acid-alkaline process. Food
Chem. 112:112-119.
SAS, 2006. SAS user’s guide. Statistics, Version 9.0, SAS Institute. Inc., Cary, NC. USA.
Stanley, D. W. 1976. Texture of meat and its measurement. Page 405 in Rheology and Texture in
Food Quality. J. M. de Man, P. W. Voisey, V. Rasper, and D. W. Stanley, eds. The AVI
Publishing Company, Westport, CT.
Tabilo, G., Flores, M., Fiszman, S. M., and F. Toldra. 1999. Postmortem meat quality and sex
affect textural properties and protein breakdown of dry-cured ham. Meat Sci. 51:255–260.
Tadpitchayangkoon, P., and J. Yongsawatdigul. 2009. Comparative study of washing treatments
and alkali extraction on gelation characteristics of striped catfish (Pangasius hypophthalmus)
muscle protein. J. Food Sci. 74:C284-291.
Undeland, I., S. D. Kelleher, and H. O. Hultin. 2002. Recovery of functional proteins from
herring (Clupea harengus) light muscle by an acid or alkaline solubilization process. J. Agric.
Food Chem. 50:7371–7379.
USDA (U.S. Food and Drug Administration). 2004. Sensory and physicochemical property
relationships in food that define and predict end-use quality.
http://www.reeis.usda.gov/web/crisprojectpages/402748.html Accessed June 2009.

94
Venugopal, V., A. Kakatkar, D. R. Bongirwar, M. Karthikeyan, S. Mathew, and B. A.
Shamasundar. 2002. Gelation of shark meat under mild acidic conditions: physicochemical
and rheological characterization of the gel. J. Food Sci. 67:2681–2686.
Wright, D. J., I. B. Leach, and P. Wilding. 1977. Difference scanning calorimeter studies of
muscle and its constituent proteins. J. Sci. Food Agric. 28:557–564.
Zhang, L., and S. Barbut. 2005. Rheological characteristics of fresh and frozen PSE, normal and
DFD chicken breast meat. British Poult. Sci. 46:687–693.

95
4 PROJECT SUMMARY AND IMPLICATIONS
Muscle protein extraction from “low value” poultry meat has been receiving increased
attention. Color, high fat content and poor shelf life are the main concerns with “low value”
poultry meat, and all affect consumers’ selection and satisfaction. One of the attempts to increase
the utilization of poultry dark meat is using alkaline solubilization processing to recover
myofibrillar proteins and separate them from pigments and fat to increase their utilization for the
preparation of further processed meat products.
This thesis has described alkaline extraction of chicken dark meat. The process resulted
in a yield of more than 80% in the pH range (10.5 – 12.0) studied. Even though the total fat
content decreased by approximately 50%, the current study demonstrated that the isolated
proteins are susceptible to lipid oxidation as revealed by TBARs values. The alkaline
solubilisation process failed to remove polar lipids and in some cases they even increased.
However, neutral lipids were removed by 61.51%. Alkali aided extraction helped to lighten the
color of the dark meat and reduction of heme pigments by 53%.
There was a significant decrease in cooking loss and water loss for the recovered proteins
at higher pH values. Hardness and chewiness of extracted meat was found to be greater for
extractions at higher pH values. Even though the hardness of protein isolates was higher the gels
obtained from them were less elastic as indicated by G′ values. Cryoprotectants improved the gel
forming ability of the extracted meat as indicated by rheological analysis. The gels thus obtained
with added cryoprotectants were more stable and were not disrupted even at temperatures above
80 o
Possible applications of the recovered protein include use as meat fillers or in the
manufacture of casings and biodegradable packaging. Another advantage of using these proteins
is that people seem to have fewer allergies to poultry proteins than those from milk, eggs, fish
C. Raw dark meat showed two transitions corresponding to the denaturation of myosin as
well as collagen and other sarcoplasmic proteins. However, the second transition was absent in
the case of extracted meat, probably due to the removal of collagen. In conclusion, this study
revealed that alkali-extracted proteins from chicken dark meat at pH values of 10.5 and 11.0 may
have the possibility to be used as a functional ingredient for the development of new meat
products.

96
and soybean sources. However, before any possible commercialization of this protein isolate in
Canada, determination of potential unsafe compounds (i.e. lysino-alanine) needs to be evaluated.
Remarkably, the U.S Food Drug Administration (2004) gave the status as safe (GRAS) to alkali-
and acid-produced protein isolate from fish.
Further considerations include modifying the process to remove more polar lipids by
adding more water and citric acid to the starting material, or adding stabilizing agents such as
vitamin E to overcome the oxidation issue. A complete sensory profile analysis will be also
important for the successful application of such extracts for food product development.