Embed Size (px)
Citation preview

Spatio-Temporal Variability and Predictability of Relative Humidity Over West African Monsoon Region Daniel Broman1, Balaji Rajagopalan1,3, Thomas Hopson2 and Rajul Pandya3
(1) Civil, Environmental, and Architectural Engineering, University of Colorado, Boulder, CO; (2) National Center for Atmospheric Research; (3) University Corporation for Atmospheric Research
Abstract
Spatial and temporal variability of relative humidity over the West African Monsoon (WAM) region is investigated. In particular, the variability during the onset, peak and retreat periods of the monsoon is considered. A K-means cluster analysis was performed to identify spatially coherent regions of relative humidity variability during the three periods. The cluster average of the relative humidity provides a robust representative index of the strength and timing of the WAM. Correlating the cluster anomalies with large-scale dynamial and thermodynamical features indicate that the land-ocean temperature gradient and the corresponding circulation, tropical Atlantic sea surface temperatures (SSTs), and to a somewhat lesser extent SSTs over the tropical Pacific, all play a role in modulating the timing of the monsoon season relative humidity onset and retreat. These connections to large-scale climate features were also found to be persistent over intraseasonal time scales, and thus best linear predictive models were developed to enable skillful forecasts of relative humidity during the two periods at 15-75 day lead times. The public health risk due to meningitis epidemics are of grave concern to the population in this region, and these risks are strongly tied to regional humidity levels. Because of this linkage, the understanding and predictability of relative humidity variability is of use in meningitis epidemic risk mitigation, which motivated this research.
Introduction
This project focuses on the interaction between climate and disease incidence in eight countries in West Africa: Ghana, Togo, Benin, Nigeria, Chad, Niger, Mali, and Burkina Faso. All or parts of these countries lie within the African ‘Meningitis Belt’, and whose seasonal weather patterns are controlled by the West African Monsoon (WAM). Limited healthcare networks exist in this region, with international organizations providing logistic and material support. Understanding of the interseasonal variability of the WAM system could provide more informed decision-support in allocating healthcare supplies given identified links between meningococcal meningitis epidemics and climate. One of the strongest links identified is with relative humidity, motiving this study.
The traditional measure of monsoon variability has been seasonal rainfall. The region experiences periods of low and high rainfall, including the Sahelian drought of the 1970s and 80s. Past investigation has looked at identifying causes of both the annual rainfall cycle and the larger decadal scale patterns. Connections have been made with global sea-surface temperatures, circulation patterns, along with other ocean and land-surface processes including soil moisture.
The WAM is a dominant low-level southwesterly flow affecting sub-Saharan Africa temperature and precipitation patterns. This seasonal flow advects moisture from the Gulf of Guinea and equatorial Atlantic onshore during the boreal summer in sharp contrast to the dry northeasterly Harmattan winds that exist throughout the rest of the year. Monsoon behavior is linked to the seasonal latitudinal migration of the intertropical convergence zone (ITCZ) and the intertropical front (ITF), the latter representing the interface between monsoon winds and Harmatton winds. Eltahir and Gong (1996) investigated the sources of moisture in West Africa and found the Tropical Atlantic contributes 23%, Central Africa 17%, and that 27% comes from precipitation recycling within West Africa. This study only quantified moisture in the form of precipitation but provides a basis for understanding moisture fluxes in the region. The Gulf of Guinea source is controlled by the southwest monsoon flow, the Central African source by westerly flows generated by monsoon circulation, and the precipitation recycling by land surface properties. Using a Lagrangian approach, Nieto et al. (2006) tracked the sources of moisture for the Sahel and found that in summer, precipitation recycling over the Sahel was the most important. Other identified sources included the Tropical Atlantic, Central Africa, and the Eastern Mediterranean. For this last source, increased SSTs increased local evaporation and the moisture was advected to the Sahel through low-level transport. Lavaysse et al. (2009) identify several dynamical elements of the West African Monsoon that represent and influence its behavior including the West African Heat Low (WAHL), the African Easterly Jet (AEJ), the

Tropical Easterly Jet (TEJ), and African Easterly Waves (AEW). The pressure gradient between the WAHL and the South Atlantic anticyclone drives the southwesterly monsoon winds. The strength and position of the West African Heat Low (WAHL) is dependent on preferential heating controlled by surface albedo and solar heating conditions (Ramel et al. 2006). These controls also influence the shape of the WAHL that can be more zonally elongated than round in some years (Lavaysse et al. 2009). Work by Drobinski et al. (2005) suggest that the orography of North Africa, the Hoggar Massive and Atlas Mountains in particular, aid in the deepening of the WAHL in late spring and describe its location centered over the Sahara Desert. Subsidence to the north of the mountains from the northern branches of the Hadley cell and the WAHL increase the pressure gradient rotating southeasterly winds to northeasterly winds. This behavior strengthens WAHL circulation, deepening the low pressure region. Monsoon onset as defined by Sultan and Janicot (2003) is split into two phases a “preonset” identified as the date the ITF reaches 15ºN (with the ITF being the zero mean zonal wind component at 925mb). This phase represents the start of the rainy season in the region and the mean date of occurrence is the 14 May with 9.8 day standard deviation. Monsoon onset is defined by an abrupt transition or “jump” of the ITCZ from 5º to 10ºN corresponding with increases in rainfall and a deepening of the heat low. The mean date of occurrence is 25 June with 9 day standard deviation. The deepening of the WAHL occurs on a mean date of 20 June, five days before the mean date of monsoon jump (Lavaysse et al. 2009).
Nicholson (2009) presented a “new look” on WAM dynamics and suggested the importance of the African Easterly Jet (AEJ) and Tropical Easterly Jet (TEJ) to rainfall and moisture advection. She identified the region between the waves as the “tropical rainbelt”. Instability resulting from conservation of vorticity promotes convection in this region. The cross-equator pressure gradient driving monsoon flows produces in some years a low-level westerly jet whose strength is strongly correlated with rainfall. A weak pressure gradient and a weak or nonexistent westerly jet occur during dry years and a strong pressure gradient and strong well-defined westerly jet occur during wet years. The AEJ transports mesoscale convective systems (MCS) westward, which are responsible for large-scale precipitation in the region (Mohr and Thorncroft 2006). The speed of the AEJ centered at 650mb is controlled by WAHL meridional circulation (Thorncroft and Blackburn 1999). Uplift in the WAHL generates an anticyclone aloft whose easterly circulation strengthens the AEJ. The strengths of the AEJ and TEJ control the location and propagation of African Easterly Waves (AEW) which help organize MSC (Jackson et al. 2009). The number and timing of AEWs are responsible for the interseasonal variability of WAM rainfall.
The strength of the cross-equator pressure gradient has been linked to sea-surface temperatures (SST) in the Gulf of Guinea. Lough (1986) identified a precipitation dipole between the Guinea Coast and the Sahel. Future work by Vizy and Cook (2002), Fontaine and Louvet (2006), and Caniaux et al. (2011) have investigated this dipole and linked it to SST anomalies in the Gulf of Guinea. In April, cross-equator southeast trade winds strengthen as the ITCZ shifts northward. These trades produce Ekman pumping north of the equator lowering SSTs and lead to the formation of the “Atlantic cold tongue”. This feature is well developed during the peak of the monsoon. Positive SST anomalies in the Gulf of Guinea increase evaporation enhancing precipitation over the Guinea Coast. Concomitant low-level winds from the Sahara extends further south leading to subsidence and suppressed precipitation in the Sahel.
Modeling studies by Koster et al. (2004) suggest a strong land-atmosphere coupling between soil moisture and precipitation in boreal summer. This supports the precipitation recycling findings mentioned above.
Hagos and Cook (2008) explain the decreasing Sahelian rainfall in the 1980s through increased sea-surface temperatures in the Indian Ocean. Warming produced a region of subsidence over the Sahel blocking monsoon-advected moisture from the Atlantic. Continued increases in Indian Ocean SSTs have shifted this zone westward over the Atlantic leading to an increase, though still depressed rainfall over the Sahel.
IPCC AR4 Assessment suggests due to the increased SST in the tropics an amplification of the precipitation dipole between the Sahel and Guinea Coast with decreased rainfall over the Sahel and increased rainfall over the Guinea Coast. Haarsma (2005) investigate rainfall variability over the Sahel using climate reanalysis data and found a strong link between rainfall and mean sea-level pressure over the Sahara, the summer location of the WAHL. Increases in surface air temperatures suggest a deepened heat low and increased rainfall over the Sahel. Cook and Vizy (2006) address this uncertainty. There is low

model agreement for much of West Africa, and the CGCMs used in the ensemble did not capture well the precipitation distribution or monsoon dynamics.
Coinciding with the West African Monsoon region is the African meningitis belt (Lapeyssonnie 1963) extending through the semi-arid region south of the Sahara. Several studies have indicated a strong link between atmospheric moisture, in the form of relative humidity or specific humidity, and meningococcal meningitis susceptibility. (Molesworth et al. 2003) classified districts by their seasonal specific humidity profiles found that this classification along with land cover were the best predictors in a meningitis epidemic risk model. This relationship appears robust as studies by Besancenot et al. (1997) in Benin, Yaka et al. (2008) in Niger and Burkina Faso reached similar conclusions. This link between relative humidity and its predictive capability of meningitis risk is corroborated from preliminary analysis [xx ref xx;], shown in Figure 1. This figure indicates an inverse relationship between relative humidity and meningitis risk.
Figure 1: Meningitis relative humidity relationship [REF]
The probability of exceedance is based on the mean relative humidity for the proceeding four weeks at a two-week lag. The red dashed line indicates the inherent background risk of a meningitis epidemic independent of relative humidity. Humidity in the region and more importantly the timing of humidity increase and decrease are controlled by the WAM system. Thus, understanding monsoon dynamics to better predict monsoon onset and retreat in the context of increasing and decreasing relative humidity would allow better prediction of meningitis epidemic risk. [REF]
Prior to the development of a conjugate vaccine for serogroup A meningococcal meningitis the primary method of treating all epidemics of meningococcal meningitis relied on the distribution of a polysaccharide vaccine to regions at risk for epidemics. The motivation was to contain the disease before it spread to surrounding districts. Districts at alert level, 5 cases in 100,000 received the vaccine if surrounding districts had already reached the epidemic level of 10 cases in 100,000. If a district reached the alert level without neighboring a district at the epidemic level, the decision to allocate vaccine was based on vaccine supply and time to the end of meningitis season. This allocation, managed by the International Coordinating Group on Vaccine Provision (ICG), is still used to manage epidemics of other meningococcal meningitis

serogroups, particularly W-135. [REF for this section]
While prior research efforts largely focused on monsoon seasonal rainfall and its variability, this study is motivated by the need to provide better tools to help mitigate and manage the meningitis risk. To this end, here we propose to investigate the interannual variability and predictability of relative humidity during the onset and retreat phase of the monsoon season which coincides with the retreat and onset season of meningitis risk. This research offers a unique and complementary perspective to the existing body of literature. The paper is organized as follows. The study region and data sets used are first described followed by the methods. Next, results from climate diagnostics and predictability are presented followed by results from predictive models and concluding with summary and discussion of the results.
An understanding of the interseasonal variability of relative humidity could provide better prediction of the end of the meningitis season allowing for more informed decisions while allocating vaccine and healthcare resources. This study aims to investigate this interseasonal variability. Weather station data for the time period 1973 – 2012 were used along with climate reanalysis data to identify potential predictors of relative humidity behavior. Identified predictors were used to develop predictive models of relative humidity.
Data and Study Region
Figure 2: Study region showing weather station locations. The shading indicates countries lying within the ‘meningitis belt’ as defined by the U.S. CDC1
The study region encompasses countries falling within both the meningitis belt and WAM region and includes Mali, Burkina Faso, Togo, Benin, Chad, and Cameroon as shown in Figure 2. Daily calculated relative humidity data from the GHCN network were obtained through NOAAs’ Climate Data Online (CDO) portal2. The World Meteorological Organization (WMO) maintains the GHCN network, constructed from data collected by national meteorological services. These data were obtained for 32 stations (Figure 2) within the study region with at least 90% coverage over 1973 – 2012. Investigations of large-scale climate variability used the gridded NCEP/NCAR reanalysis data (Kalnay et al. 1996) and gridded Kaplan sea-surface temperature reconstructions (Kaplan et al. 1998).
Methods
Monsoon dynamics were examined through variations in relative humidity in three periods defined as: monsoon onset, 15 May – 30 June; monsoon peak, 30 June – 15 September; and monsoon retreat, 15 1U.S. CDC Meningitis Belt Map: http://wwwnc.cdc.gov/travel/yellowbook/2012/chapter-3-infectious-diseases-related-to-travel/meningococcal-disease.htm 2 NOAA CDO: http://www.ncdc.noaa.gov/cdo-web/
20ºN
10ºN
10ºW 20ºE10ºE0º

September – 15 October. These periods are similar to those selected by the African Monsoon Multidisciplinary Analysis for their Special Observing Period (Redelsperger et al. 2006). For each period mean relative humidity was computed for each station and year providing a forty-year time series.
A K-means cluster analysis (Scott and Knott 1974) was performed separately for each period to identify the spatial variability and coherence of relative humidity. In this, locations are grouped in homogeneous clusters such that within cluster variability is minimum and between-cluster variability is maximum. A cluster index was then computed by averaging the relative humidity across stations in each cluster, to produce representative time series for each spatial region (cluster).
The cluster indices of relative humidity for each period were then correlated with a suite of contemporaneous global circulation fields including sea level pressure, zonal and meridional winds at 925mb, 600mb and 200mb, sensible and latent heat fluxes using the reanalysis data set; and with global Kaplan SST. The resulting spatial correlation maps were used to identify the large-scale ocean and atmospheric mechanism that drive the variability of relative humidity in the study region. Composite maps of selected fields corresponding to ‘high’ and ‘low’ relative humidity years were also produced to understand the physical links to extremes in relative humidity.
To explore the predictability of relative humidity in the region lagged correlation maps were produced with circulation fields and SST – in that the relative humidity in a period is correlated with large-scale fields from preceding time periods. For example, the onset period relative humidity index is correlated with large-scale fields from preceding April, March, February and January. Regions of high correlation values are used to develop potential predictors by spatially averaging over this region. The predictors are then used in a generalized linear modeling framework to develop predictive models at different lead times. This method has been widely used in application to western US streamflow forecasting (Grantz et al. 2005; Regonda et al. 2006; Bracken et al. 2010).
Results and Discussion
Spatial Variability
A K-means cluster analysis was performed on the average relative humidity at all the locations for the onset, peak and retreat periods. The data is grouped into several clusters and for each the within cluster variance is computed. The number of clusters where this variance drops off and stabilizes is the optimal number selected. Figure xx shows the within cluster variance versus number of clusters for the three periods. It can be seen that the variance drops off around three clusters in all the periods, indicating that higher number of clusters is unlikely to result in distinct homogeneous clusters.
(a) (b) (c)Figure 3: K-means cluster diagnostics for (a) Onset, (b) Peak, and (c) Retreat periods

The spatial locations of the clusters in the three periods are shown in Figure 3. In all the periods the three clusters exhibit a clear north-south spatial pattern with stations grouped along east-west. The north-south stratification is consistent with movement of the ITCZ through the monsoon season and the background strong climatological humidity gradient in the region. The stations in the three clusters for the onset and retreat periods are almost identical with slight differences only at the cluster boundaries. This similarity can be attributed to the onset northward and retreat southward movement of the ITCZ being fairly uniform. The onset ITCZ transition includes a ‘jump’ from ~10º to 15º N in June, contrasted with a relatively smooth retreat, but averaging the relative humidity over each period obscures these differences. During the peak season the ITCZ is within 10º to 15º N latitudes, hence the diffusion of cluster boundaries. Several of the stations found in the northern cluster during onset and retreat are found in the middle cluster during peak monsoon period. Only the three most northern stations, Tombouctou, Gao, and Agadez, all located close or within the Sahara remain in the northern cluster in all three periods.
(a) (b)
(c)Figure 4: K-means station clusters for each period, onset (a), peak (b), and retreat (c).
The relative humidity is then averaged over the stations in each cluster to obtain cluster indices for the three periods and a time series of their standardized values are shown in Figure 4. Although the actual relative humidity varies between each cluster, the figure shows that the they all have similar temporal variability (not shown). All three periods exhibit an upward trend from ~1988 through 2012, which corresponds to the upward trend found in the Sahel rainfall index (Janowiak 1988).

(a) (b)
(c)Figure 5: Standardized relative humidity timeseries for onset (a), peak (b), and retreat (c)

(a)
(b)
(c)

Figure 6: Onset south (a), middle (b), and north (c) cluster correlation maps with surface temperature (left), mean sea-level pressure (middle), 500 – 800mb averaged winds (right), and global sea-surface temperature
(bottom).
(a)
(b)

(c)
Figure 7: Retreat south (a), middle (b), and north (c) cluster correlation maps with surface temperature (left), mean sea-level pressure (middle), 500 – 800mb averaged winds (right), and global sea-surface
temperature (bottom).
Links to Large-Scale Climate
In order to understand the drivers of year-to-year variability of the relative humidity, the cluster indices were correlated with large-scale climate fields of the concurrent period. In particular, we selected four variables to correlate – surface temperature, mean sea level pressure, 500-800mb average winds and global SST. The sea level pressure and average winds were selected to capture the links to atmospheric circulation such as the jet; while the surface temperatures and SSTs are for large-scale oceanic features such as ENSO, Atlantic equatorial patterns etc.
Figure 6 shows the correlations with each of the variables’ fields for the three clusters during the onset period. In the onset period, all three clusters have positive correlation with the Sahara desert surface temperature, and negative correlation with the Guinea Coast surface temperature. This negative correlation extends to Gulf of Guinea and South Atlantic sea-surface temperatures. This dipole pattern of positive correlation over land coupled with negative correlation to the south and over the ocean is indicative of a strong land-ocean thermal gradient, a key component of the monsoon. The correlation pattern with sea level pressure is opposite and consistent – over the warmer land of the Sahara the approximate location of West African Heat Low, the pressure is low leading to a negative correlation, with the opposite holding true to the south and along the Guinea Coast. With SSTs a dipole pattern is apparent in the tropical Atlantic Ocean, with positive correlation in the northern tropical Atlantic and negative to the south. This dipole is well known as influencing the rainfall over North Eastern Brazil and Western Africa (xxx refs xx). In the Pacific there is a weak positive correlation in the central and eastern tropical Pacific and a weak negative correlation in the west, reminiscent of the ENSO pattern. The correlation patterns are remarkably similar for the middle and southern cluster (Figures 6).
Retreat period correlations are shown in Figure 7. For all clusters, the land temperature correlations show positive correlation over western Africa similar to that in the onset period (Figure 6), but a negative correlation to the south that is much weaker. The correlations with SLP also mirror this (Figure 6). The correlation pattern with 500-800mb winds shows a stronger negative correlation over the region of the African Easterly Jet, also the location of the ITCZ (Figure 7). This is stronger and coherent than its counterpart in the onset period (Figure 6). This is due to the fact the most of the activity is on the land as the monsoon period starts to wind down. The correlation with SST is much weaker than that observed during onset – this is consistent with the fact that during the end of the monsoon season the tropical Atlantic SST gradient is much diminished as the ITCZ is in the northern hemisphere and on its way south – and the gradient gets established in fall.
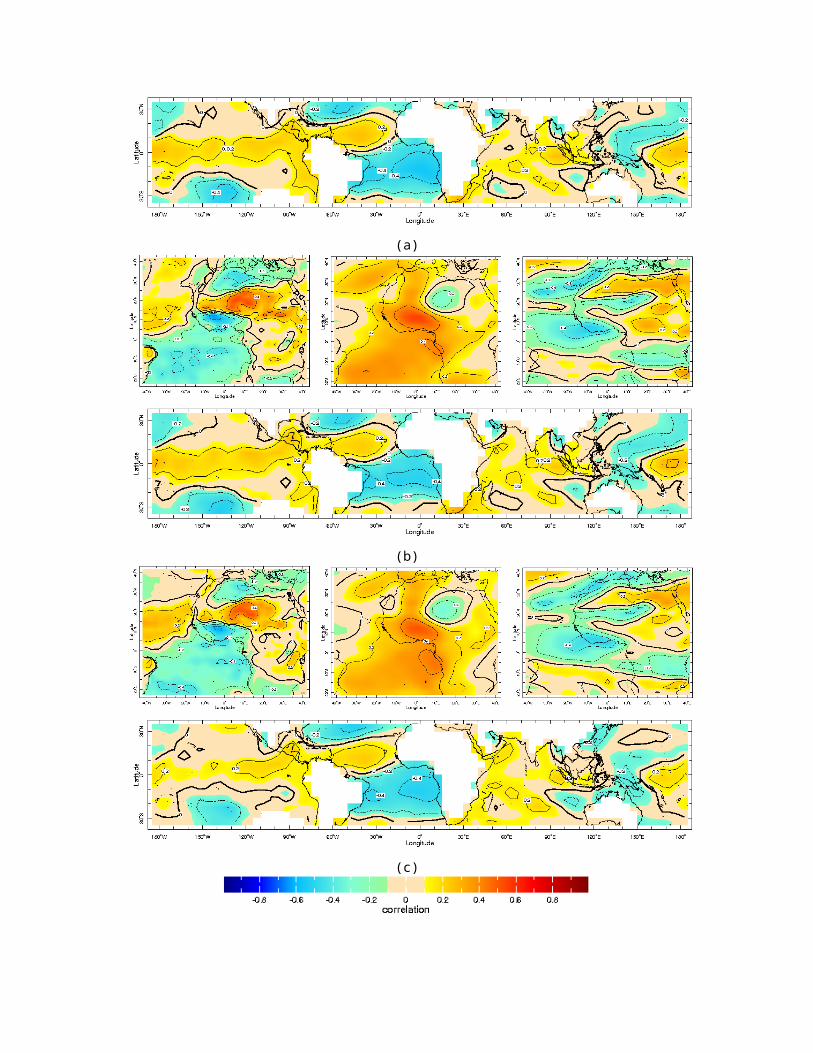
Figure 8: Onset south cluster composite plots showing surface temperature (top) and 925mb winds (bottom) for low years (left), high years (middle) and the low – high years (right)
Figure 9: Retreat south cluster composite plots showing surface temperature (top) and 925mb winds (bottom) for low years (left), high years (middle) and the low – high years (right)
Composite analysis was performed to investigate the large-scale climate features responsible for relative humidity extremes. For this, we selected years with ‘high’ and ‘low’ relative humidity outside of one standard deviation away from the mean, for a given period and maps of climate variables averaged over these years are produced. We show representative composite maps for the south cluster for onset (Figure 8) and retreat periods (Figure 9). Composite maps of surface temperature for low years for onset period

(Figure 8) shows a cooler land and warmer ocean, indicative of a weaker land-ocean temperature gradient - the winds show an anomalously southerly flow consistent with the temperature pattern. During high years the patterns are reversed, although the warming over land is a bit stronger than during low years, also the wind pattern is weaker than that of the low years and. The asymmetry in the relationship during low and high years indicates nonlinearity in the relationship and the difference maps in the same figure show this. These patterns are similar during retreat (Figure 9) and also for other clusters (figures not shown).
Predictability
As mentioned in the motivation, relative humidity during onset and withdrawal periods are important for the retreat and onset of meningitis season, respectively - thus, the ability to predict the relative humidity during these periods is of specific interest. To this end, predictors and forecasting models are developed understand the predictability and the potential long-lead skill. To identify predictors, the cluster time indices are correlated with large-scale climate variables from preceding periods. We selected three lead times to issue forecasts for the onset – i.e., the first of Mar, Apr and May, giving a lead time of 75, 45 and 15 day lead times, respectively. Figure 10 shows the correlation between the onset index of the southern cluster with Jan climate variables. It can be noticed that the correlation patterns with surface temperature, sea level pressure and winds are similar to the correlation patterns seen during the concurrent period (Figure 6) – indicating that the large scale patterns are persistent and thus, lending potential predictability. The boxes indicate regions of high absolute correlation. Correlations with climate variables on May 1 (Figure 11) also show similar patterns. Regions with high absolute correlation, approximately 0.4 or above in these maps are identified and the corresponding climate variables averaged over these regions provide potential predictors. Figures 12 and 13 show the correlation plots for June and August used to select retreat predictors. The red boxes in Figures 10 – 13 show the regions used to generate these predictors. The list of predictors identified for the different lead times and for onset and withdrawal are shown in Tables 1 and 2.
(a) (b) (c) (d)Figure 10: Onset South Cluster correlation plots with January (a) Surface Temperature, (b) MSLP, (c) 200mb Zonal
Winds, (d) 600mb Meridional Winds
(a) (b) (c)Figure 11: Onset South Cluster correlation plots with April (a) SST, (b) MSLP, (c) 200mb Zonal Winds

(a) (b) (c)Figure 12: Retreat South Cluster correlation plots with June (a) SST, (b) 600mb Zonal Winds, (c) 200mb Zonal
Winds
(a) (b)Figure 13: Retreat South Cluster correlation plots with August (a) MSLP, (b) 200mb Zonal Winds
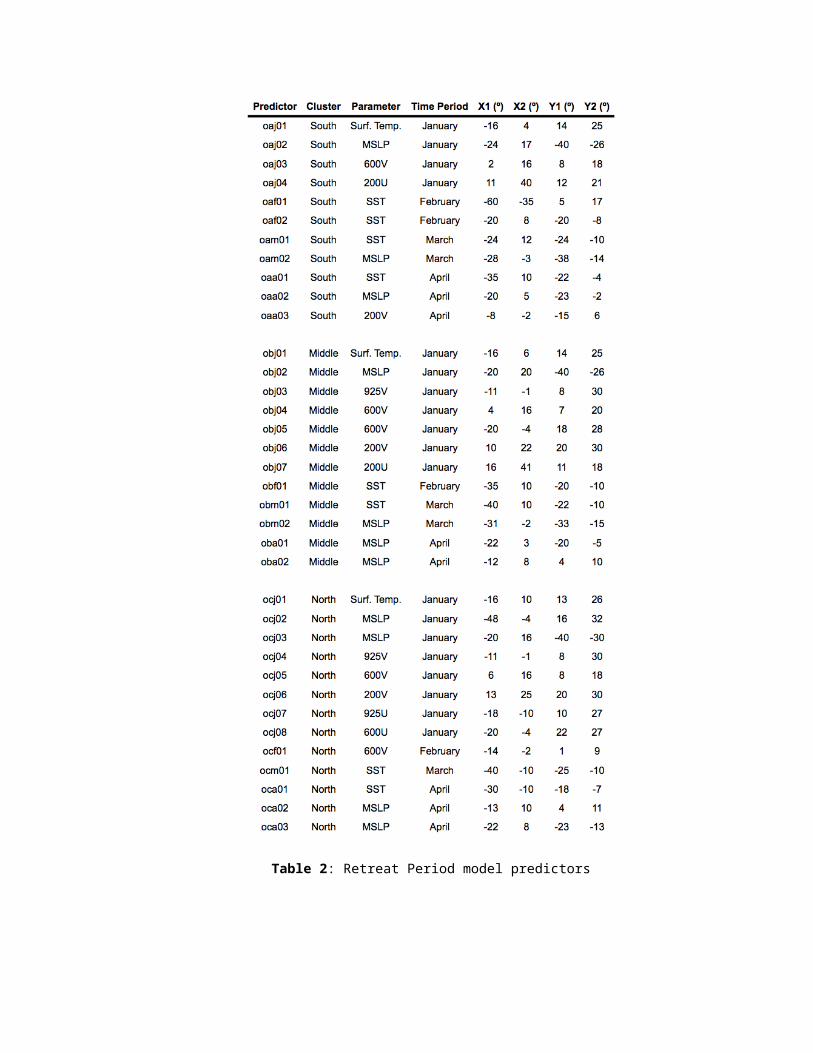
Table 1: Onset Period model predictors

Table 2: Retreat Period model predictors

A ‘best’ linear model was fitted for each lead time and for each period of interest. A generalized linear modeling (GLM) approach was selected as it is flexible and general. In GLM (McCullagh and Nelder 1989), the response or the dependent variable Y, can be assumed to be a realization from any distribution in the exponential family with a set of parameters. A smooth and invertible link function transforms the conditional expectation of Y to the set of predictors.
G(E(Y)) = η = f (X) + ε = XβT+ ε (1)G(.) is the link function, X is the set of predictors or independent variables, E(Y) is the expected value of the response variable and ε is the error. In a linear model the function G(.) is identity. Depending on the assumed distribution of Y there exist appropriate link functions (see McCullagh and Nelder 1989). The model parameters, β, are estimated using an iterated weighted least squares method that maximizes the likelihood function as opposed to an ordinary least squares method in linear modeling. Here we fit a linear regression model – i.e., normality of variable Y and identity link function.
Models were fitted with different combination of predictors and for each the AIC was calculated. The best model was selected as the one that minimizes the Akaike Information Criteria (AIC).
The AIC is calculated as follows:AIC=2k−2 L (2)
where L is the logarithm of the likelihood function of the model with the predictor subset under consideration and k, is the number of parameters to be estimated in this model and it serves as a penalty. The AIC penalizes models with more number of predictors thus favoring parsimony. For the selected best model two performance metrics were computed – fitting R2 which explains the variance captured by the model and cross validated R2 in this, an observation is dropped, the model fitted using the rest of the observations and the dropped pointed is predicted.

This latter indicates the variance explained by the model in a ‘predictive’ mode. To further assess the predictive capability of the models we performed leave 10% out cross-validation – in this 10% of observations are dropped at random and they are predicted using model fitted on the rest of the data. A final measure of model fit, root mean squared error (RMSE) is computed using the same drop 10% method as above. This is repeated 1,000 times and the median RMSE is selected, providing a robust assessment of the predictive skill.
Table 3: Onset Period GLM model statistics and predictor sets. Predictors from Table 1 above.
Table 4: Retreat Period GLM model statistics and predictor sets. Predictors from Table 2 above

The best model (or set of best predictors) based on AIC selects 2-3 predictors for almost all the lead times except for a few cases during withdrawal where it selects 4 predictors. The predictor sets and model skill scores can be found in Tables 3 (onset period) and 4 (retreat period). Furthermore, predictor sets were remarkably consistent between the south and middle clusters, notable exceptions being the 1 April south cluster model containing February North Atlantic SST, and the 1 May south cluster model containing April Guinea Coast 200mb meridional winds. Guinea Coast 600mb meridional winds were found in the north cluster replacing South Atlantic MSLP in the 1 March and 1 April models. Plots of observed, estimated and cross-validated estimates of south onset cluster relative humidity are shown in Figure 14. It can be seen that the model estimates and predicts the values very well at all the lead times. The corresponding scatter plots of the observations and estimates (Figure 14) shows that almost all of the predictions fall within the 5% of the observed values (dotted lines indicate ±5% lines). It is interesting to note that the models exhibit good skill at all lead times, especially at 74-day lead time – as can be seen by the R2 cross validated R2 in Tables 3 and 4.
(a) (b) (c)
(d) (e) (f)
Figure 14: Onset South Cluster GLM models showing direct fit values and cross-validated values. (a), (b), and (c) show the model fits for 1 March, 1 April, and 1 May. (d), (e), and (f) show the predicted vs. observed values for the
1 March, 1 April, and 1 May models (solid line indicates 1:1, dashed lines show ±5%)
(a) (b) (c)
(d) (e) (f)
Figure 15: Retreat South Cluster GLM models showing direct fit values and cross-validated values. (a), (b), and (c) show the model fits for 1 March, 1 April, and 1 May. (d), (e), and (f) show the predicted vs. observed values for the
1 March, 1 April, and 1 May models (solid line indicates 1:1, dashed lines show ±5%)
Forecasts of retreat period relative humidity also show good skill at all lead times including long lead. The retreat period model predictor sets are more varied; South Atlantic MSLP is a predictor for the middle and north clusters, but is not seen in the south cluster (Table 4). Both the south and north models contain predictors from the North Atlantic, MSLP, and SST respectively. Land surface-atmosphere interactions are responsible for the majority of the predictors, with Guinea Coast 925mb meridional winds, central Africa 600mb and 200mb winds, and central Africa surface temperature showing up in the predictor sets. There are no other common predictors found between the models. Model and cross-validated estimates capture the observed variability very well and but one estimate fall within 5% of the observed values (Figure 15).
Discussion
The model results indicate skill in predicting relative humidity from climate variables. The predictions provide the mean relative humidity for the period of interest, which can inform an earlier or later end (or

start) to the meningitis season. The best parameter sets for the models indicate that the strengths of the WAHL and South Atlantic anticyclone are the largest controls on relative humidity during monsoon onset. Secondary controls include the Gulf of Guinea SSTs, which influence the local MSLP and winds, and modify the cross-equator pressure gradient responsible for monsoon flow. Another secondary influence is the strength of the North Atlantic anticyclone, which along with the WAHL direct the strength of the hot, dry Harmatton winds from the northeast. These secondary influences appear to be responsible for much of the intercluster variability. Combined they have a large influence on the location of the Intertropical Front (ITF), the boundary between monsoon and Harmattan flows. During monsoon retreat, the strength of the South Atlantic anticyclone remains important, but surface – atmospheric interactions become the secondary controls. There is a lot of variability surrounding the predictors identified for each model; given the complexity of these interactions, become more difficult. This knowledge offers the International Coordinating Group a better understanding of the start and end of the meningitis season which can provide a more informed decision making process while allocating vaccine in the region.
Besancenot, J. P., M. Boko, and P. C. Oke, 1997: Weather conditions and cerebrospinal meningitis in Benin (Gulf of Guinea, West Africa). European Journal of Epidemiology, 13, 807–815.
Bracken, C., B. Rajagopalan, and J. Prairie, 2010: A multisite seasonal ensemble streamflow forecasting technique. Water Resources Research, 46, W03532.
Caniaux, G., H. Giordani, J.-L. Redelsperger, F. Guichard, E. Key, and M. Wade, 2011: Coupling between the Atlantic cold tongue and the West African monsoon in boreal spring and summer. J. Geophy. Res., 116, C04003.
Cook, K., and E. Vizy, 2006: Coupled model simulations of the West African monsoon system: Twentieth-and twenty-first-century simulations. J. Climate, 19, 3681–3703.
Drobinski, P., B. Sultan, and S. Janicot, 2005: Role of the Hoggar massif in the West African monsoon onset. Geophysical Research Letters, 32, 481–484.
Eltahir, E., and C. Gong, 1996: Dynamics of wet and dry years in West Africa. J. Climate, 9, 1030-1042.
Fontaine, B., and S. Louvet, 2006: Sudan-Sahel rainfall onset: Definition of an objective index, types of years, and experimental hindcasts. Journal of Geophysical Research, 111, D20103.
Grantz, K., B. Rajagopalan, M. Clark, and E. Zagona, 2005: A technique for incorporating large-scale climate information in basin-scale ensemble streamflow forecasts. Water Resources Research, 41, W10410.
Haarsma, R. J., 2005: Sahel rainfall variability and response to greenhouse warming. Geophysical Research Letters, 32, L17702.
Hagos, S. M., and K. H. Cook, 2008: Ocean Warming and Late-Twentieth-Century Sahel Drought and Recovery. J. Climate, 21, 3797–3814.
Jackson, B., S. E. Nicholson, and D. Klotter, 2009: Mesoscale Convective Systems over Western Equatorial Africa and Their Relationship to Large-Scale Circulation. Monthly Weather Review, 137, 1272–1294.
Janowiak, J., 1988: An Investigation of the Interannual Rainfall Variability in Africa. J. Climate, 1, 240–255.
Kalnay, E. and Coauthors, 1996: The NCEP/NCAR 40-year reanalysis project. Bulletin of the American Meteorological Society, 77, 437–471.
Kaplan, A., M. A. Cane, A. C. Clement, M. B. Blumenthal, B. Rajagopalan, and C. Bottoraley, 1998: Analyses of global sea surface temperature 1856-1991. Journal of Geophysical Research: Oceans, 103, 18,567–18,589.
Koster, R. D. and Coauthors, 2004: Regions of strong coupling between soil moisture and precipitation. Science (New York, N.Y.), 305, 1138–1140.
Lapeyssonnie, L., 1963: La méningite cérébrospinale en Afrique. Bulletin of the World Health

Organization, 28.
Lavaysse, C., C. Flamant, S. Janicot, D. J. Parker, J.-P. Lafore, B. Sultan, and J. Pelon, 2009: Seasonal evolution of the West African heat low: a climatological perspective. Climate Dynamics, 33, 313–330.
Lough, J. M., 1986: Tropical Atlantic sea surface temperatures and rainfall variations in subsaharan Africa. Monthly weather review, 114, 561–570.
McCullagh, P., and J. A. Nelder, 1989: Generalized Linear Models, Second Edition. Chapman & Hall/CRC, 511pp.
Mohr, K. I., and C. D. Thorncroft, 2006: Intense convective systems in West Africa and their relationship to the African easterly jet. Quarterly Journal of the Royal Meteorological Society, 132, 163–176.
Molesworth, A. M., L. E. Cuevas, S. J. Connor, A. P. Morse, and M. C. Thomson, 2003: Environmental risk and meningitis epidemics in Africa. Emerging Infectious Diseases, 9, 10, 1287–93.
Nicholson, S. E., 2009: A revised picture of the structure of the “monsoon” and land ITCZ over West Africa. Climate Dynamics, 32, 1155–1171.
Nieto, R., L. Gimeno, and R. M. Trigo, 2006: A Lagrangian identification of major sources of Sahel moisture. Geophysical Research Letters, 33, L18707.
Ramel, R., H. Gallée, and C. Messager, 2006: On the northward shift of the West African monsoon. Climate Dynamics, 26, 429–440.
Redelsperger, J.-L., C. D. Thorncroft, A. Diedhiou, T. Lebel, D. J. Parker, and J. Polcher, 2006: African Monsoon Multidisciplinary Analysis: An International Research Project and Field Campaign. Bulletin of the American Meteorological Society, 87, 1739–1746.
Regonda, S. K., B. Rajagopalan, M. Clark, and E. Zagona, 2006: A multimodel ensemble forecast framework: Application to spring seasonal flows in the Gunnison River Basin. Water Resources Research, 42, W09404.
Scott, A. A. J., and M. Knott, 1974: A Cluster Analysis Method for Grouping Means in the Analysis of Variance. Biometrics, 30, 507–512.
Sultan, B., and S. Janicot, 2003: The West African monsoon dynamics. Part II: The “preonset” and “onset” of the summer monsoon. J. Climate, 16, 3407–3427.
Thorncroft, C. D., and M. Blackburn, 1999: Maintenance of the African easterly jet. Quarterly Journal of the Royal Meteorological Society, 125, 763–786.
Vizy, E. K., and K. H. Cook, 2002: Development and application of a mesoscale climate model for the tropics : Influence of sea surface temperature anomalies on the West African monsoon. Journal of Geophysical Research: Atmospheres (1984–2012), 107, D3, ACL-2.
Yaka, P., B. Sultan, H. Broutin, S. Janicot, S. Philippon, and N. Fourquet, 2008: Relationships between climate and year-to-year variability in meningitis outbreaks: a case study in Burkina Faso and Niger. International Journal of Health Geographics, 7, 34.


![Presented By - Aryan CollegeBALAJI BALAJ1i BALAJI NAMKEE,v BALAJI NAM KEEN Kna BAL BALAJI sNAFERS BALAJii BALAJI AN AFERS BALAJI 0ÈERs BALAJI BALAJI only BALAJI Ctlinese ej/ffJ1]JžfJ](https://img.dokumen.tips/doc/110x75/5eaecb507cb6087a2d0ae9dc/presented-by-aryan-college-balaji-balaj1i-balaji-namkeev-balaji-nam-keen-kna.jpg)