Embed Size (px)
Citation preview

our teachers
our school
our message
University Charter MS
University Charter Middle School at CSU
Channel Islands2014-15
School Accountability Report Card
Published in 2015-16
Gayle Hughes Director
700 Temple Avenue Camarillo, CA 93010
Grades: 6-8 Phone: (805) 482-4608
http://universitycharterschools.csuci.edu
CDS Code: 56-72553-0111690
Para español, visita: http://universitycharterschools.csuci.edu
2University Charter Middle School at CSU Channel IslandsSARC
School Accountability Report Card
In accordance with state and federal requirements, the School
Accountability Report Card (SARC) is put forth annually by all public schools as a tool
for parents and interested parties to stay informed of the school’s
progress, test scores and achievements.
Director’s MessageUCS (University Charter Schools—University Charter Middle School and University Preparation School com-bined) is a collaborative community of innovative learners who seek out challenges and persevere toward individual and shared goals. We provide multiple opportunities for students to thrive in a diverse and com-passionate learning environment. The middle school program focuses on developing critical thinkers who demonstrate mastery of the California Common Core State Standards in an environment that supports the unique developmental stages of the adolescent child.
University Charter Middle School (UCMS) maximizes learning opportunities for its students who reflect the ethnic, linguistic, socioeconomic, and special needs diversity of Ventura County and California classrooms by using the best and most promising pedagogical and California standards-based practices employed by highly qualified teachers and administrators. These practices are modeled for student teachers, other credential candidates and a variety of practitioners through regularly scheduled on-site training and action research in conjunction with CSU Channel Islands.
In the years since the school’s inception, UCMS has evolved, expanded and celebrated great achievements. The school community—including students, teachers, parents, families, CSUCI faculty and community part-ners—has experienced great pride in the accomplishments of the past years and wishes to see the school continue to make strides in the future. Among the numerous successes experienced are the following events, awards, programs and achievements that have contributed to the growth and development of UCMS between 2006 and 2015:
• $40,000 granted to UPS and UCMS to help support salary of Science Lab coach
• Cutting-edge technology: 1:1 ratio of students in grades 6-8 to Chromebooks or laptops; Smartboards in all classrooms
• Schoolwide implementation of Lucy Calkins writer’s workshop
• Opportunity to learn two languages for all students via our two programs: Two-way Immersion and Language Enrichment
• Peaceful Playground school: assigned playground coach at each campus
• Developed PE program for grades K-8
• Active participation in Parent-Teacher-Student Association (PTSA)
• POET (Peer Observation to Enhance Teaching) teachers are relieved by the administrator to go and observe their colleagues for the purpose of professional growth
• School counselor to support social-emotional growth and challenges of students
• More than 1,000 pre-service teachers have worked and trained in our classrooms
• Recipient of the Rooted Futures grant
• Many lunch and after-school clubs include Math Club, Animal Shelter Awareness Club, Animal Habitat Club, Book Club, Bead Club, Nutrition Club, Leadership and Yearbook
• Middle School Leadership program
• Middle School Teacher-Student Mentoring program
• Triton Autism Ambassadors for Middle School students
• Renaissance for Middle School students
• Science Fair
• After-school athletics program (basketball, volleyball, track, flag football, soccer)
• National award-winning cheerleading team
• Robotics Team actively involved in FIRST LEGO League (FLL) and local competitions
• After-school clubs include Math Club, Art Club and Ballet Folklorico
• Participation in Camarillo Academic Olympics (CAO)
• Annual participation in Ventura County Spelling Bee
• Planned and executed countywide STEMposium event for more than 100 Ventura County educators in the summer of 2015
• Peer Buddies program
• Specialist classes providing students enrichment opportunities: music (theory, ukulele, xylophone), technology (coding, Minecraft), LEGO engineering program, keyboarding, art classes, etc.
• Schoolwide CHAMPS and Positive Behavioral Interventions and Supports programs
• Grant recipient of $60,000 for Family Resource Center by anonymous donor
• Dual Language and Language Enrichment Programs
• Fall Harvest Festival and Spring Luau
• Annual eighth-grade Washington, D.C., trip
• Collaboration with CSUCI Science Department to coordinate community Science Night event to serve students and residents throughout Ventura County
These achievements supplement the progress made within our instructional programs that support students to be successful within a rigorous, project-based educational program. UCMS strives to provide an education that engages students in meaningful educational experiences that empower them to become productive, creative, socially responsible lifelong learners who will make valuable contributions in our culturally diverse and ever-evolving technological society.
Board of DirectorsDr. Jeanne Adams
Marie Francois
MIchelle Dean
Richard Urias
Cathrine Cartwright
School Mission StatementUCS (University Charter Schools—
University Charter Middle School and University Preparation School combined) is a collaborative community of innovative
learners who seek out challenges and persevere toward individual and shared goals. We provide multiple opportunities
for students to thrive in a diverse and compassionate learning environment. The mission of the University Charter
Middle School at California State University Channel Islands is to build a comprehensive learning community for
grade 6-8 students.

3University Charter Middle School at CSU Channel IslandsSARC
Three-Year DataNumber of Classrooms by Size
2012-13 2013-14 2014-15
SubjectNumber of Students
1-22 23-32 33+ 1-22 23-32 33+ 1-22 23-32 33+
English language arts 2 5 3 6 5 1 6 6
Mathematics 2 4 2 5 4 3
Science 2 4 1 6 4 3
History/social science 3 3 2 4 1 3 4
California Physical Fitness TestEach spring, all students in grades 5, 7 and 9 are required to participate in the California Physical Fitness Test (PFT). The Fitnessgram® is the designated PFT for students in California public schools put forth by the State Board of Education. The PFT measures six key fitness areas:
1. Aerobic Capacity
2. Body Composition
3. Flexibility
4. Abdominal Strength and Endurance
5. Upper Body Strength and Endurance
6. Trunk Extensor Strength and Flexibility
Encouraging and assisting students in establishing lifelong habits of regular physical activity is the primary goal of the Fitnessgram. The table shows the percentage of students meeting the fitness standards of being in the “healthy fitness zone” for the most recent testing period. For more detailed information on the California PFT, please visit www.cde.ca.gov/ta/tg/pf.
Percentage of Students Meeting Fitness Standards
2014-15 School Year
Grade 7
Four of six standards 18.8%
Five of six standards 29.0%
Six of six standards 30.4%
Class Size DistributionThe bar graph displays the three-year data for average class size and the table displays the three-year data for the number of classrooms by size.
Three-Year DataAverage Class Size
13-1412-13 14-15
6 Englishlanguage arts
Mathematics Science History/socialscience
21
26
31 31 31
24 2325 26 2626
2123 23 23
Enrollment by GradeThe bar graph displays the total number of students enrolled in each grade for the 2014-15 school year.
2014-15 Enrollment by Grade
6
7
8
85
69
93
2014-15 School Year
Enrollment by Student GroupThe total enrollment at the school was 247 students for the 2014-15 school year. The pie chart displays the percentage of students enrolled in each group.
Socioeconomically disadvantaged
56.3%English
learners15.0%
Students with disabilities
8.9%Foster Youth
0.0%
Hispanic or Latino71.7%American Indian
or Alaska Native2.4%
Asian1.2%
Filipino0.8%
Black or African-American
3.2%
White19.4%
Two or More Races1.2%

4University Charter Middle School at CSU Channel IslandsSARC
Parental InvolvementWe invite all parents to volunteer and become involved in our school programs. We offer a variety of oppor-tunities for parents to become involved and contribute to our school community: School Advisory Council; English Learner Acquisition Committee; PTSA; athletics coaching; and volunteering for field trips, classroom activities, and school events such as Camarillo Academic Olympics, our annual luau, Dolphin Fun Run, and Harvest Festival. We urge parents to contact the school at any time to find out about these opportunities and more!
For more information on how to become involved at the school, please contact Assistant Director Veronica Solorzano at (805) 482-4608 or [email protected].
Professional DevelopmentEach year, three days of professional development are held in August, preced-ing the school year and student ar-rival. Through professional development, administrators and teachers take time to improve their teaching skills and to extend their knowledge of the subjects they teach. These days of professional development cover training and topics such as (but not limited to) testing, as-sessment and accountability, differentia-tion strategies, instructional improvement, state standards, project-based learning, English-Language Development (ELD), dual immersion, classroom management strategies and Response to Intervention (RTI). One day of professional develop-ment is held midyear, and an additional day occurs upon the conclusion of the school year. In addition, teachers meet weekly for an afternoon of staff develop-ment, which includes a variety of profes-sional development topics and trainings that expand upon the professional devel-opment provided in August.
In addition to the professional develop-ment days provided throughout the school year, the school aims to ensure opportuni-ties for staff to attend off-site workshops and conferences whenever possible. UCMS teachers often participate in the valuable opportunities offered by the Ventura County Office of Education, which include but are not limited to workshops reinforcing RTI models and strategies.
Teachers collaborate to implement professional-development strategies and structures during their Active Collabora-tion Team Time (ACTT), which takes place during the school day while students are actively learning with Specialist Team Teachers. During ACTT, teachers work in teams to review student work, track stu-dent performance, and guide and improve their instruction in the classroom.
Professional Development Days
2013-14 5 days
2014-15 6 days
2015-16 5 days
“As responsible members of the community, we take pride in our school environment by maintaining
a clean and well-groomed campus.”
School SafetyUniversity Charter Middle School at CSU Channel Islands is committed to the safety and security of students, staff members and the community. To that end, a comprehensive plan has been developed to address vari-ous emergency situations. It is our belief that students can only thrive when they feel safe from earthquakes, bullies and emergencies. Parents and staff members work together to identify potential hazards and take preventive measures. Regular practice drills of emergency procedures make safety a routine and allow us to get on with the business of education. Earthquake, lockdown and fire drills prepare staff and students and equip them with the proper procedures to remain safe in the case of an emergency.
While teaching and practicing the importance of intrinsic rewards and motivation is very important at UCMS, we also have a program of positive reinforcement used to encourage, reward and recognize good citizenship. It must be remembered that the vast majority of students obey all school rules all the time. It is important to understand the connection between demonstrating self-discipline and the positive results of following the rules. Examples of positive-reinforcement activities in place at UCMS include:
• After-school activities
• Student leadership
• Recognition assemblies
• Field trips
• Leadership privileges
• Academic awards
• Renaissance Attendance Awards
• Extracurricular activities
• Athletic programs
• School clubs
• Dolphin Club privileges (special dances, assemblies, awards)
• Club 100 membership
• Caught Being Good tickets with weekly drawings for student recognition
• Walk to Learn token program
Rules are for the safety and well-being of everyone. Infractions of the rules will lead to certain consequences and disciplinary procedures. Listed below are the procedures that students are given and need to know:
1. Loss of privileges, a session with our counselor, and/or community service will result from excessive tardies, class disruptions, incomplete work, lunch problems, etc. This may be assigned before school, at lunch or after school.
2. Incident reports may be written by school employees about behavior. A report usually states that the student has an attendance, behavior and/or academic problem. Minor-incident reports are handled by the classroom teacher, while reports of serious incidents, as outlined on the report form, are usually handled by the school director (principal) or designee. Referrals written for severe infractions or multiple infractions may result in higher levels of progressive discipline.
3. On-Campus Suspension (OCS) may be used in lieu of suspension for certain offenses. OCS is held during the school day. Assignment to OCS is made by an administrator for a period of one to five days. Students assigned OCS remain in OCS during the length of the school day, including lunch period. Restroom breaks are scheduled. When in OCS, students are expected to complete all assignments and service projects provided by teachers. School Service Projects: for truancy, unserved detention, exces-sive tardies, lack of respect, or are assigned at the administration’s discretion.
4. Suspensions may occur for infractions involving Education Code, Section 48900.
5. Expulsions: There are certain serious acts of misconduct for which students may be expelled from this school. This is an administrative and School Board decision and is for the most severe violations of school rules.
6. The school safety plan was last reviewed and discussed with the school faculty in August 2015.

5University Charter Middle School at CSU Channel IslandsSARC
California Standards Tests for All Students: Science (grades 5, 8 and 10)The tables show the percentage of students in grades 5, 8 and 10 who scored at Proficient or Advanced levels (meeting or exceeding state standards) in science.
Three-Year DataStudents Scoring at Proficient or Advanced Levels
University Charter MS California
Subject 12-13 13-14 14-15 12-13 13-14 14-15
Science 64% 65% 71% 59% 60% 56%
California Standards Tests Results by Student Group: Science (grades 5, 8 and 10)
2014-15 School YearStudents Scoring at Proficient or Advanced Levels
Group Science
All students in the district 77%
All students at the school 71%
Male 77%
Female 65%
Black or African-American v
American Indian or Alaska Native v
Asian v
Filipino v
Hispanic or Latino 65%
Native Hawaiian or Pacific Islander v
White 95%
Two or more races v
Socioeconomically disadvantaged 60%
English learners v
Students with disabilities v
Students receiving Migrant Education services v
Foster youth ±
California Assessment of Student Performance and Progress/Standardized Testing and Reporting Results Beginning in the 2013-14 school year, the Standardized Testing and Reporting (STAR) Program was eliminated and replaced by a new set of assessments called the California Assessment of Student Performance and Progress (CAASPP).
For the 2015 school year, the CAASSP included a mix of online and paper-pencil assessments. The online component contained the Smarter Balanced English language arts/literacy and mathematics tests. The paper-pencil science assessments of CAASPP included the California Standards Test (CST), California Modified Assessment (CMA) and California Alternate Performance Assessment (CAPA). There was also the optional Standards-based Tests in Spanish for reading/language arts.
The CST is a multiple-choice test in science for varying grade levels. The CMA is a modified assessment for students with disabilities who have an Individualized Education Plan (IEP). The CAPA is an alternate assessment for students with significant cognitive disabilities who are unable to take the CST with accommodations or modifications or the CMA with accommodations.
For more information on the CAASPP assessments, please visit www.cde.ca.gov/ta/tg/ca.
CAASPP by Student Group: English Language Arts and MathematicsThe tables on the following pages display the information on student achievement at each performance level in English language arts and mathematics for the school by student groups for grades 6-8.
Levels of achievement include:
• Level 1 = Standard not met
• Level 2 = Standard nearly met
• Level 3 = Standard met
• Level 4 = Standard exceeded
Note: The number of students tested includes students who did not receive a score. However, the number of students tested is not the number that was used to calculate the performance level percentages. The performance level percentages are calculated using students with scores.v Scores are not shown when the number of students tested is 10 or fewer, either because the number of students tested
in this category is too small for statistical accuracy or to protect student privacy.
± Information is not available at this time.
California Assessment of Student Performance and Progress Results for All Students (grades 3-8 and 11)The table below shows the percentage of students meeting or exceeding the state standards in English language arts/literacy and mathematics.
2014-15 School YearPercentage of Students Meeting or Exceeding State Standards
Subject University Charter MS California
English language arts/literacy 51% 44%
Mathematics 40% 33%

6University Charter Middle School at CSU Channel IslandsSARC
CAASPP Results by Student Group: English Language Arts and Mathematics - Grade 6
Level 1 = Standard not met Level 2 = Standard nearly met Level 3 = Standard met Level 4 = Standard exceeded
v Scores are not shown when the number of students tested is 10 or fewer, either because the number of students tested in this category is too small for statistical accuracy or to protect student privacy.
2014-15 School YearStudents Achieving at Each Performance LevelEnglish Language Arts: Grade 6 Total
EnrollmentNumber Tested
Percentage Tested of Total
Enrollment
Percent Achievement
Group Level 1 Level 2 Level 3 Level 4
All students 87 86 98.9% 22% 38% 26% 13%
Male 40 46.0% 30% 33% 23% 13%
Female 46 52.9% 15% 43% 28% 13%
Black or African-American 3 3.4% v v v v
American Indian or Alaska Native 1 1.1% v v v v
Asian 1 1.1% v v v v
Filipino 0 0.0% v v v v
Hispanic or Latino 62 71.3% 24% 45% 21% 10%
Native Hawaiian or Pacific Islander 0 0.0% v v v v
White 18 20.7% 17% 11% 50% 22%
Two or more races 1 1.1% v v v v
Socioeconomically disadvantaged 47 54.0% 21% 49% 23% 4%
English learners 12 13.8% 25% 50% 17% 0%
Students with disabilities 1 1.1% v v v v
Students receiving Migrant Education services 0 0.0% v v v v
Foster youth ± ± ± ± ± ±
Mathematics: Grade 6 Total Enrollment
Number Tested
Percentage Tested of Total
Enrollment
Percent Achievement
Group Level 1 Level 2 Level 3 Level 4
All students 87 86 98.9% 33% 34% 23% 10%
Male 40 46.0% 35% 30% 23% 13%
Female 46 52.9% 30% 37% 24% 9%
Black or African-American 3 3.4% v v v v
American Indian or Alaska Native 1 1.1% v v v v
Asian 1 1.1% v v v v
Filipino 0 0.0% v v v v
Hispanic or Latino 62 71.3% 37% 37% 23% 3%
Native Hawaiian or Pacific Islander 0 0.0% v v v v
White 18 20.7% 11% 28% 28% 33%
Two or more races 1 1.1% v v v v
Socioeconomically disadvantaged 47 54.0% 38% 36% 21% 4%
English learners 12 13.8% 25% 67% 8% 0%
Students with disabilities 1 1.1% v v v v
Students receiving Migrant Education services 0 0.0% v v v v
Foster youth ± ± ± ± ± ±
± Information is not available at this time.

7University Charter Middle School at CSU Channel IslandsSARC
CAASPP Results by Student Group: English Language Arts and Mathematics - Grade 7
Level 1 = Standard not met Level 2 = Standard nearly met Level 3 = Standard met Level 4 = Standard exceeded
v Scores are not shown when the number of students tested is 10 or fewer, either because the number of students tested in this category is too small for statistical accuracy or to protect student privacy.
2014-15 School YearStudents Achieving at Each Performance LevelEnglish Language Arts: Grade 7 Total
EnrollmentNumber Tested
Percentage Tested of Total
Enrollment
Percent Achievement
Group Level 1 Level 2 Level 3 Level 4
All students 72 72 100.0% 24% 22% 39% 14%
Male 35 48.6% 40% 23% 26% 9%
Female 37 51.4% 8% 22% 51% 19%
Black or African-American 2 2.8% v v v v
American Indian or Alaska Native 3 4.2% v v v v
Asian 1 1.4% v v v v
Filipino 0 0.0% v v v v
Hispanic or Latino 51 70.8% 31% 22% 27% 18%
Native Hawaiian or Pacific Islander 0 0.0% v v v v
White 14 19.4% 7% 14% 71% 7%
Two or more races 1 1.4% v v v v
Socioeconomically disadvantaged 42 58.3% 36% 29% 29% 5%
English learners 15 20.8% 73% 13% 7% 0%
Students with disabilities 3 4.2% v v v v
Students receiving Migrant Education services 0 0.0% v v v v
Foster youth ± ± ± ± ± ±
Mathematics: Grade 7 Total Enrollment
Number Tested
Percentage Tested of Total
Enrollment
Percent Achievement
Group Level 1 Level 2 Level 3 Level 4
All students 72 72 100.0% 29% 35% 22% 14%
Male 35 48.6% 34% 34% 20% 11%
Female 37 51.4% 24% 35% 24% 16%
Black or African-American 2 2.8% v v v v
American Indian or Alaska Native 3 4.2% v v v v
Asian 1 1.4% v v v v
Filipino 0 0.0% v v v v
Hispanic or Latino 51 70.8% 37% 29% 18% 16%
Native Hawaiian or Pacific Islander 0 0.0% v v v v
White 14 19.4% 7% 43% 43% 7%
Two or more races 1 1.4% v v v v
Socioeconomically disadvantaged 42 58.3% 40% 40% 14% 5%
English learners 15 20.8% 67% 33% 0% 0%
Students with disabilities 3 4.2% v v v v
Students receiving Migrant Education services 0 0.0% v v v v
Foster youth ± ± ± ± ± ±
± Information is not available at this time.
8University Charter Middle School at CSU Channel IslandsSARC
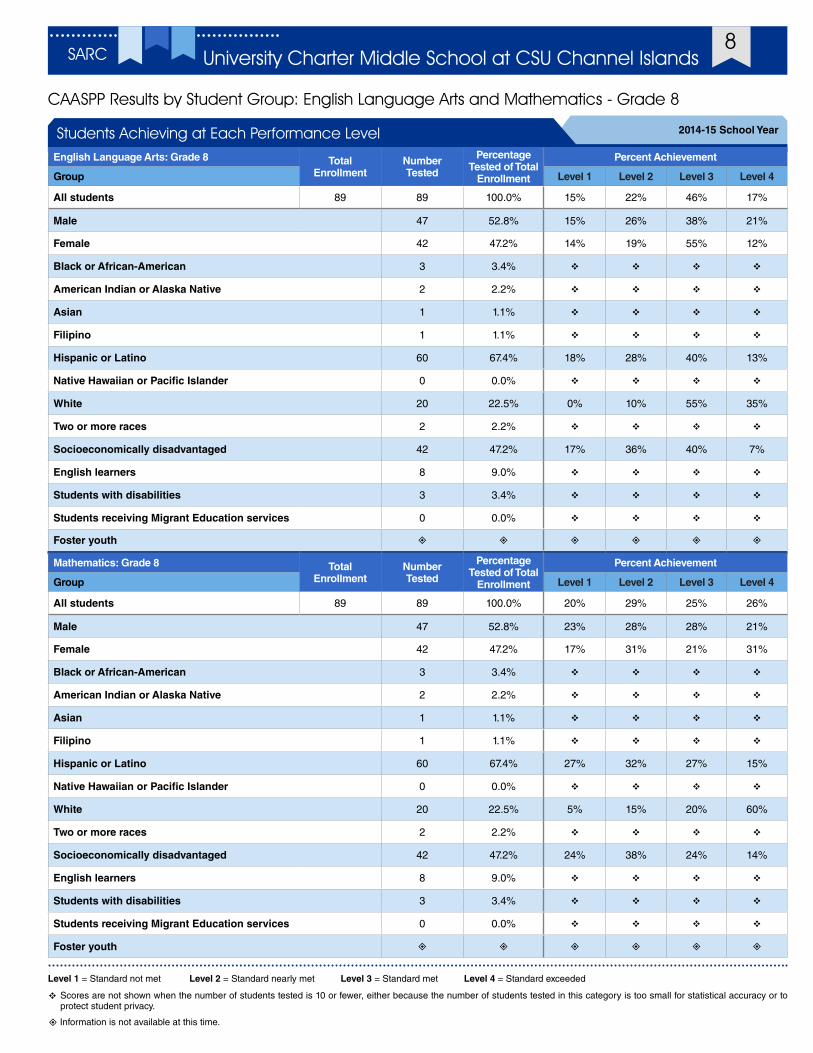
CAASPP Results by Student Group: English Language Arts and Mathematics - Grade 8
Level 1 = Standard not met Level 2 = Standard nearly met Level 3 = Standard met Level 4 = Standard exceeded
v Scores are not shown when the number of students tested is 10 or fewer, either because the number of students tested in this category is too small for statistical accuracy or to protect student privacy.
2014-15 School YearStudents Achieving at Each Performance LevelEnglish Language Arts: Grade 8 Total
EnrollmentNumber Tested
Percentage Tested of Total
Enrollment
Percent Achievement
Group Level 1 Level 2 Level 3 Level 4
All students 89 89 100.0% 15% 22% 46% 17%
Male 47 52.8% 15% 26% 38% 21%
Female 42 47.2% 14% 19% 55% 12%
Black or African-American 3 3.4% v v v v
American Indian or Alaska Native 2 2.2% v v v v
Asian 1 1.1% v v v v
Filipino 1 1.1% v v v v
Hispanic or Latino 60 67.4% 18% 28% 40% 13%
Native Hawaiian or Pacific Islander 0 0.0% v v v v
White 20 22.5% 0% 10% 55% 35%
Two or more races 2 2.2% v v v v
Socioeconomically disadvantaged 42 47.2% 17% 36% 40% 7%
English learners 8 9.0% v v v v
Students with disabilities 3 3.4% v v v v
Students receiving Migrant Education services 0 0.0% v v v v
Foster youth ± ± ± ± ± ±
Mathematics: Grade 8 Total Enrollment
Number Tested
Percentage Tested of Total
Enrollment
Percent Achievement
Group Level 1 Level 2 Level 3 Level 4
All students 89 89 100.0% 20% 29% 25% 26%
Male 47 52.8% 23% 28% 28% 21%
Female 42 47.2% 17% 31% 21% 31%
Black or African-American 3 3.4% v v v v
American Indian or Alaska Native 2 2.2% v v v v
Asian 1 1.1% v v v v
Filipino 1 1.1% v v v v
Hispanic or Latino 60 67.4% 27% 32% 27% 15%
Native Hawaiian or Pacific Islander 0 0.0% v v v v
White 20 22.5% 5% 15% 20% 60%
Two or more races 2 2.2% v v v v
Socioeconomically disadvantaged 42 47.2% 24% 38% 24% 14%
English learners 8 9.0% v v v v
Students with disabilities 3 3.4% v v v v
Students receiving Migrant Education services 0 0.0% v v v v
Foster youth ± ± ± ± ± ±
± Information is not available at this time.

9University Charter Middle School at CSU Channel IslandsSARC
Textbooks and Instructional MaterialsUCMS selects textbooks from a list of state-approved options. Teachers also develop lessons based on the California state standards by utilizing the most effective and appropriate supplemental materials to maximize learning opportunities for all students. To find a list of the state standards, please visit the California Depart-ment of Education website. All students are assigned textbooks for all relevant subjects and may request a book for use at home.
Textbooks are adopted from the most recent state-approved list and are consistent with the content and cycles of the curriculum frameworks adopted by the State Board of Education.
2015-16 School YearTextbooks and Instructional Materials List
Subject Textbook Adopted
English language arts Pearson/Prentice Hall 2007
Mathematics Houghton Mifflin Harcourt 2014
Science Pearson/Prentice Hall 2007
History/social science Pearson/Prentice Hall 2007
Quality of TextbooksThe following table outlines the criteria required for choosing textbooks and instructional materials.
2015-16 School YearQuality of Textbooks
Criteria Yes/No
Are the textbooks adopted from the most recent state-approved or local governing-board-approved list? Yes
Are the textbooks consistent with the content and cycles of the curriculum frameworks adopted by the State Board of Education? Yes
Do all students, including English learners, have access to their own textbooks and instructional materials to use in class and to take home? Yes
Availability of Textbooks and Instructional MaterialsThe following lists the percentage of pupils who lack their own assigned textbooks and instructional materials.
Percentage of Students Lacking Materials by Subject
2015-16 School Year
Reading/language arts 0%
Mathematics 0%
Science 0%
History/social science 0%
Visual and performing arts 0%
Foreign language 0%
Health 0%
Adequate Yearly ProgressThe federal Elementary and Secondary Education Act (ESEA) requires all schools and districts meet Adequate Yearly Prog-ress (AYP) requirements. California public schools and districts are required to meet or exceed criteria in the following four target areas:
• Participation rate on statewide as-sessments in English language arts and mathematics
• Percentage of students scoring proficient on statewide assess-ments in English language arts and mathematics
• Attendance rates for schools with enrollment in Transitional Kindergar-ten through grade eight (TK-8)
• Graduation rate for high schools
The table displays whether or not the school, district, and state met each of the AYP criteria and made overall AYP for 2014-15. For more information, visit www.cde.ca.gov/ta/ac/ay.
2014-15 School YearAdequate Yearly Progress Criteria
University Charter MS California
Met overall AYP Yes Yes
Met participation rate:
English language arts Yes Yes
Mathematics Yes Yes
Met percent proficient:
English language arts n n
Mathematics n n
Met attendance rates Yes Yes
Met graduation rate � Yes
Adequate Yearly Progress
� Not applicable. This AYP indicator is only applicable for high schools.
Not applicable. Due to the transition to the Smarter Balanced Summative Assessments, the U.S. Department of Education approved the California Department of Education’s waiver request to exclude the percent proficient results from AYP determinations. For more information on the AYP reports, please visit http://data1.cde.ca.gov/dataquest/.
n
10University Charter Middle School at CSU Channel IslandsSARC
• Systems: Gas systems and pipes, sewer, mechanical systems (heating, ventilation and air-conditioning)
• Interior: Interior surfaces (floors, ceilings, walls and window casings)
• Cleanliness: Pest/vermin control, overall cleanliness (school grounds, buildings, rooms and common areas)
• Electrical: Electrical systems (interior and exterior)
• Restrooms/fountains: Restrooms, sinks and drinking fountains (interior and exterior)
• Safety: Fire-safety equipment, emergency systems, hazardous materials (interior and exterior)
• Structural: Structural condition, roofs
• External: Windows/doors/gates/fences, playgrounds/school grounds
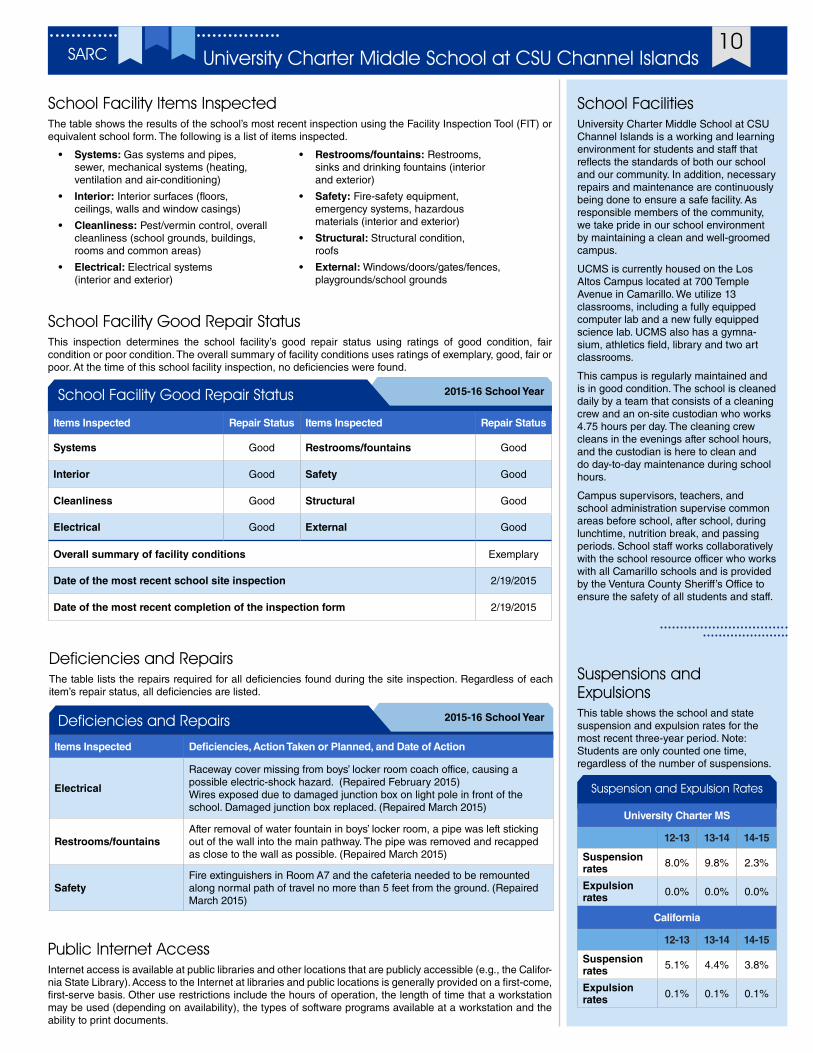
School Facility Items Inspected The table shows the results of the school’s most recent inspection using the Facility Inspection Tool (FIT) or equivalent school form. The following is a list of items inspected.
School FacilitiesUniversity Charter Middle School at CSU Channel Islands is a working and learning environment for students and staff that reflects the standards of both our school and our community. In addition, necessary repairs and maintenance are continuously being done to ensure a safe facility. As responsible members of the community, we take pride in our school environment by maintaining a clean and well-groomed campus.
UCMS is currently housed on the Los Altos Campus located at 700 Temple Avenue in Camarillo. We utilize 13 classrooms, including a fully equipped computer lab and a new fully equipped science lab. UCMS also has a gymna-sium, athletics field, library and two art classrooms.
This campus is regularly maintained and is in good condition. The school is cleaned daily by a team that consists of a cleaning crew and an on-site custodian who works 4.75 hours per day. The cleaning crew cleans in the evenings after school hours, and the custodian is here to clean and do day-to-day maintenance during school hours.
Campus supervisors, teachers, and school administration supervise common areas before school, after school, during lunchtime, nutrition break, and passing periods. School staff works collaboratively with the school resource officer who works with all Camarillo schools and is provided by the Ventura County Sheriff’s Office to ensure the safety of all students and staff.
Deficiencies and RepairsThe table lists the repairs required for all deficiencies found during the site inspection. Regardless of each item’s repair status, all deficiencies are listed.
2015-16 School YearDeficiencies and Repairs
Items Inspected Deficiencies, Action Taken or Planned, and Date of Action
Electrical
Raceway cover missing from boys’ locker room coach office, causing a possible electric-shock hazard. (Repaired February 2015) Wires exposed due to damaged junction box on light pole in front of the school. Damaged junction box replaced. (Repaired March 2015)
Restrooms/fountainsAfter removal of water fountain in boys’ locker room, a pipe was left sticking out of the wall into the main pathway. The pipe was removed and recapped as close to the wall as possible. (Repaired March 2015)
SafetyFire extinguishers in Room A7 and the cafeteria needed to be remounted along normal path of travel no more than 5 feet from the ground. (Repaired March 2015)
School Facility Good Repair Status This inspection determines the school facility’s good repair status using ratings of good condition, fair condition or poor condition. The overall summary of facility conditions uses ratings of exemplary, good, fair or poor. At the time of this school facility inspection, no deficiencies were found.
2015-16 School YearSchool Facility Good Repair Status
Items Inspected Repair Status Items Inspected Repair Status
Systems Good Restrooms/fountains Good
Interior Good Safety Good
Cleanliness Good Structural Good
Electrical Good External Good
Overall summary of facility conditions Exemplary
Date of the most recent school site inspection 2/19/2015
Date of the most recent completion of the inspection form 2/19/2015
Public Internet AccessInternet access is available at public libraries and other locations that are publicly accessible (e.g., the Califor-nia State Library). Access to the Internet at libraries and public locations is generally provided on a first-come, first-serve basis. Other use restrictions include the hours of operation, the length of time that a workstation may be used (depending on availability), the types of software programs available at a workstation and the ability to print documents.
Suspensions and ExpulsionsThis table shows the school and state suspension and expulsion rates for the most recent three-year period. Note: Students are only counted one time, regardless of the number of suspensions.
Suspension and Expulsion Rates
University Charter MS
12-13 13-14 14-15
Suspension rates 8.0% 9.8% 2.3%
Expulsion rates 0.0% 0.0% 0.0%
California
12-13 13-14 14-15
Suspension rates 5.1% 4.4% 3.8%
Expulsion rates 0.1% 0.1% 0.1%

11University Charter Middle School at CSU Channel IslandsSARC
Teacher QualificationsThis table shows information about teacher credentials and teacher qualifications. Teachers without a full cre-dential include teachers with district and university internships, pre-internships, emergency or other permits, and waivers. For more information on teacher credentials, visit www.ctc.ca.gov.
Three-Year DataTeacher Credential Information
University Charter MS
Teachers 13-14 14-15 15-16
With full credential 12 12 12
Without full credential 0 0 0
Teaching outside subject area of competence (with full credential) 0 0 0
Teacher Misassignments and Vacant Teacher PositionsThis table displays the number of teacher misassignments (positions filled by teachers who lack legal authori-zation to teach that grade level, subject area, student group, etc.) and the number of vacant teacher positions (not filled by a single designated teacher assigned to teach the entire course at the beginning of the school year or semester). Please note total teacher misassignments includes the number of teacher misassign-ments of English learners.
Three-Year DataTeacher Misassignments and Vacant Teacher Positions
University Charter MS
Teachers 13-14 14-15 15-16
Teacher misassignments of English learners 0 0 0
Total teacher misassignments 0 0 0
Vacant teacher positions 0 0 0
Core Academic Classes Taught by Highly Qualified TeachersThe No Child Left Behind Act (NCLB) extended the Elementary and Secondary Education Act (ESEA) to require that core academic subjects be taught by “highly qualified” teachers, defined as having at least a bachelor’s degree, an appropriate California teaching credential, and demonstrated competence for each core academic subject area he or she teaches. The table displays data regarding highly qualified teachers from the 2014-15 school year.
High-poverty schools are defined as those schools with student participation of approximately 40 percent or more in the free and reduced-priced meals program. Low-poverty schools are those with student participation of approximately 39 percent or less in the free and reduced-priced meals program. For more information on teacher qualifications related to NCLB, visit www.cde.ca.gov/nclb/sr/tq.
2014-15 School YearNo Child Left Behind Compliant Teachers
Percentage of Classes in Core Academic Subjects
Taught by Highly Qualified Teachers
Not Taught by Highly Qualified Teachers
University Charter MS 100.00% 0.00%
All schools in district 94.68% 5.32%
High-poverty schools in district 97.86% 2.14%
Low-poverty schools in district 93.79% 6.21%
Academic Counselors and School Support StaffThis table displays information about aca-demic counselors and support staff at the school and their full-time equivalent (FTE).
Academic Counselors and School Support Staff Data
2014-15 School Year
Academic Counselors
FTE of academic counselors 0.0
Average number of students per academic counselor ²
Support Staff FTE
Social/behavioral or career development counselors 0.30
Library media teacher (librarian) 0.00
Library media services staff (paraprofessional) 0.00
Psychologist 0.25
Social worker 0.00
Nurse 0.06
Speech/language/hearing specialist 0.25
Resource specialist (nonteaching) 1.00
² Not applicable.
Types of Services FundedLike other public schools, University Charter Middle School at CSUCI receives per-student allocation from the state. In addition, the school receives certain cat-egorical funding based on the number of low-income students and English learner students. UCMS spends the majority of allocated funds on teacher salaries and benefits, classroom support, and textbooks, all of which directly relate to classroom instruction. Our hardworking and dedicated PTSA raises funds to help support field trips, assemblies and various student activities. Through categorical funding (Title I) and Local Control Funding Formula (LCFF), UCMS is able to provide additional instruction and interventions and support for English learners and low-income students. The school provided three sessions of intervention during the instructional day and also employs hourly teachers to provide intervention services after school.

2013-14 School Accountability Report Card
12University Charter Middle School at CSU Channel Islands
Data for this year’s SARC was provided by the California Department of Education (CDE), school and district offices. For additional information on California schools and districts and comparisons of the school to the district, the county and the state, please visit DataQuest at http://data1.cde.ca.gov/dataquest. DataQuest is an online resource that provides reports for accountability, test data, enrollment, graduates, dropouts, course enrollments, staffing and data regarding English learners. Per Education Code Section 35256, each school district shall make hard copies of its annually updated report card available, upon request, on or before February 1 of each year.
All data accurate as of December 2015.
School Accountability Report Card
Published by:
www.sia-us.com | 800.487.9234
SARC
Expenditures Per PupilSupplemental/restricted expenditures come from money whose use is controlled by law or by a donor. Money that is designated for specific purposes by the district or governing board is not considered restricted. Basic/unrestricted expenditures are from money whose use, except for general guidelines, is not controlled by law or by a donor.
Financial Data ComparisonThis table displays the school’s per-pupil expenditures from unrestricted sources and the school’s average teacher salary and compares it to the state data.
2013-14 Fiscal YearFinancial Data ComparisonExpenditures
Per Pupil From Unrestricted Sources
Annual Average Teacher Salary
University Charter MS $6,683 $63,858
California $5,348 $72,993
School and California: percentage difference +25.0% -12.5%
School Financial DataThe following table displays the school’s average teacher salary and a breakdown of the school’s expenditures per pupil from unrestricted and restricted sources.
2013-14 School YearSchool Financial Data
University Charter MS
Total expenditures per pupil $6,841
Expenditures per pupil from restricted sources $158
Expenditures per pupil from unrestricted sources $6,683
Annual average teacher salary $63,858
2015-16 School YearFederal Intervention Program
University Charter MS
Program Improvement status In PI
First year of Program Improvement 2009-2010
Year in Program Improvement Year 5
Federal Intervention ProgramSchools and districts receiving Title I funding that fail to meet AYP over two con-secutive years in the same content area (English language arts or mathematics) or on the same indicator enter into Program Improvement (PI). Each additional year that the district or school(s) do not meet AYP results in advancement to the next level of intervention. The percentage of schools identified for Program Improve-ment is calculated by taking the number of schools currently in PI within the district and dividing it by the total number of Title I schools within the district.
This table displays the 2015-16 Program Improvement status for the school and district. For detailed information about PI identification, please visit www.cde.ca.gov/ta/ac/ay/tidetermine.asp.
Federal Intervention Program
Financial Data The financial data displayed in this SARC is from the 2013-14 fiscal year. The most current fiscal information available provided by the state is always two years behind the current school year and one year behind most other data included in this report. For detailed information on school expenditures for all districts in California, see the California Department of Education (CDE) Current Expense of Education & Per-pupil Spending Web page at www.cde.ca.gov/ds/fd/ec. For information on teacher salaries for all districts in California, see the CDE Certificated Salaries & Benefits Web page at www.cde.ca.gov/ds/fd/cs. To look up expenditures and salaries for a specific school district, see the Ed-Data website at www.ed-data.org.
1
2
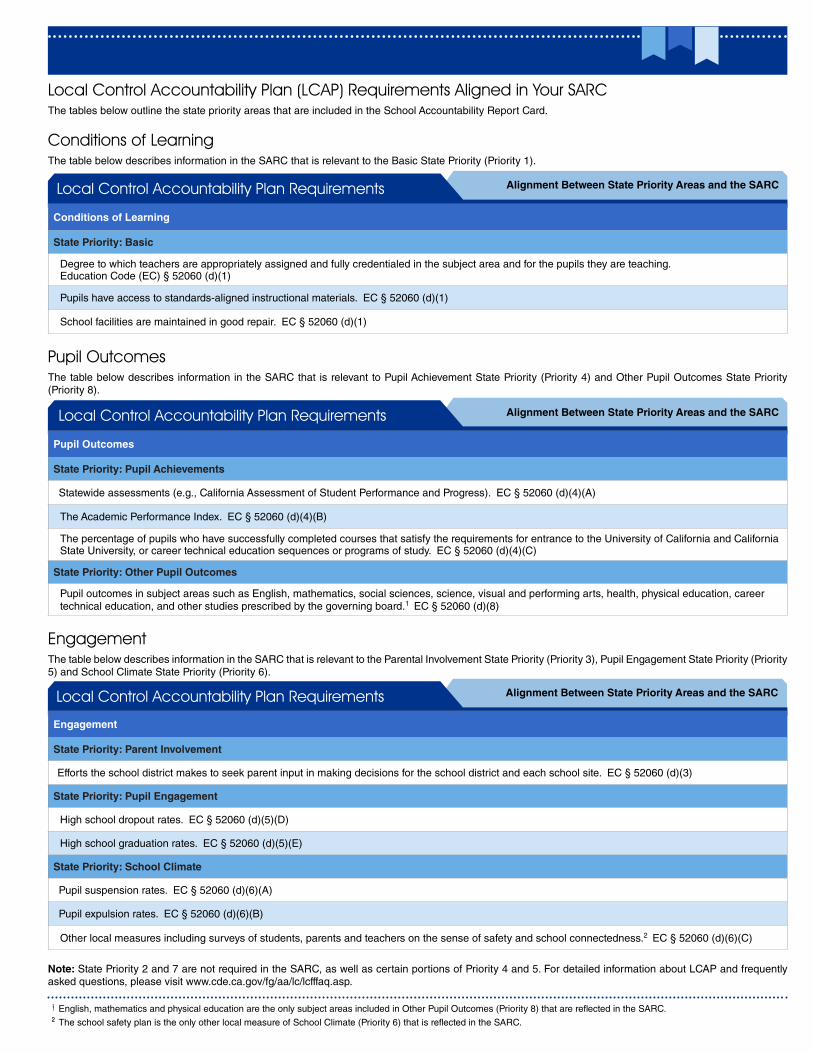
Local Control Accountability Plan (LCAP) Requirements Aligned in Your SARCThe tables below outline the state priority areas that are included in the School Accountability Report Card.
Note: State Priority 2 and 7 are not required in the SARC, as well as certain portions of Priority 4 and 5. For detailed information about LCAP and frequently asked questions, please visit www.cde.ca.gov/fg/aa/lc/lcfffaq.asp.
Conditions of LearningThe table below describes information in the SARC that is relevant to the Basic State Priority (Priority 1).
Alignment Between State Priority Areas and the SARCLocal Control Accountability Plan Requirements
Conditions of Learning
State Priority: Basic
Degree to which teachers are appropriately assigned and fully credentialed in the subject area and for the pupils they are teaching. Education Code (EC) § 52060 (d)(1)
Pupils have access to standards-aligned instructional materials. EC § 52060 (d)(1)
School facilities are maintained in good repair. EC § 52060 (d)(1)
Pupil OutcomesThe table below describes information in the SARC that is relevant to Pupil Achievement State Priority (Priority 4) and Other Pupil Outcomes State Priority (Priority 8).
Local Control Accountability Plan Requirements
Pupil Outcomes
State Priority: Pupil Achievements
Statewide assessments (e.g., California Assessment of Student Performance and Progress). EC § 52060 (d)(4)(A)
The Academic Performance Index. EC § 52060 (d)(4)(B)
The percentage of pupils who have successfully completed courses that satisfy the requirements for entrance to the University of California and California State University, or career technical education sequences or programs of study. EC § 52060 (d)(4)(C)
State Priority: Other Pupil Outcomes
Pupil outcomes in subject areas such as English, mathematics, social sciences, science, visual and performing arts, health, physical education, career technical education, and other studies prescribed by the governing board.1 EC § 52060 (d)(8)
English, mathematics and physical education are the only subject areas included in Other Pupil Outcomes (Priority 8) that are reflected in the SARC. 1
The school safety plan is the only other local measure of School Climate (Priority 6) that is reflected in the SARC.2
EngagementThe table below describes information in the SARC that is relevant to the Parental Involvement State Priority (Priority 3), Pupil Engagement State Priority (Priority 5) and School Climate State Priority (Priority 6).
Alignment Between State Priority Areas and the SARCLocal Control Accountability Plan Requirements
Engagement
State Priority: Parent Involvement
Efforts the school district makes to seek parent input in making decisions for the school district and each school site. EC § 52060 (d)(3)
State Priority: Pupil Engagement
High school dropout rates. EC § 52060 (d)(5)(D)
High school graduation rates. EC § 52060 (d)(5)(E)
State Priority: School Climate
Pupil suspension rates. EC § 52060 (d)(6)(A)
Pupil expulsion rates. EC § 52060 (d)(6)(B)
Other local measures including surveys of students, parents and teachers on the sense of safety and school connectedness.2 EC § 52060 (d)(6)(C)
Alignment Between State Priority Areas and the SARC

![University Student Charter - dental.pdn.ac.lkdental.pdn.ac.lk/Downloads/STUDENT CHARTER_English.pdf · University Student Charter 5 The University Grants Commission [UGC], which was](https://img.dokumen.tips/doc/110x75/6005664657d7786ec30cd3e0/university-student-charter-charterenglishpdf-university-student-charter-5.jpg)


![University Student Charter · University Student Charter 5 The University Grants Commission [UGC], which was established with the enactment of the Universities Act No.16 of 1978,](https://img.dokumen.tips/doc/110x75/5f2de7c7f271a204e678b33b/university-student-charter-university-student-charter-5-the-university-grants-commission.jpg)