Embed Size (px)
Citation preview
University at Buffalo The State University of New York
Bioinformatics : Gene Expression Data Analysis
Aidong Zhang Professor
Computer Science and EngineeringUniversity at Buffalo
University at Buffalo The State University of New York
05.12.03
University at Buffalo The State University of New York
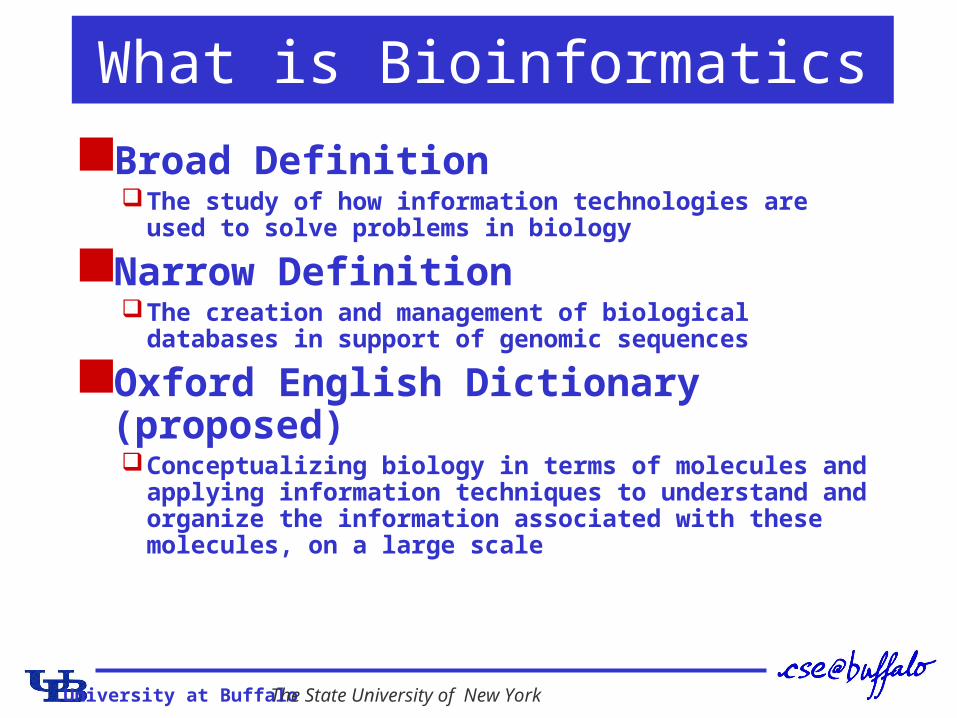
What is Bioinformatics
Broad DefinitionThe study of how information technologies are used to
solve problems in biology
Narrow DefinitionThe creation and management of biological databases in
support of genomic sequences
Oxford English Dictionary (proposed)Conceptualizing biology in terms of molecules and
applying information techniques to understand and organize the information associated with these molecules, on a large scale
University at Buffalo The State University of New York
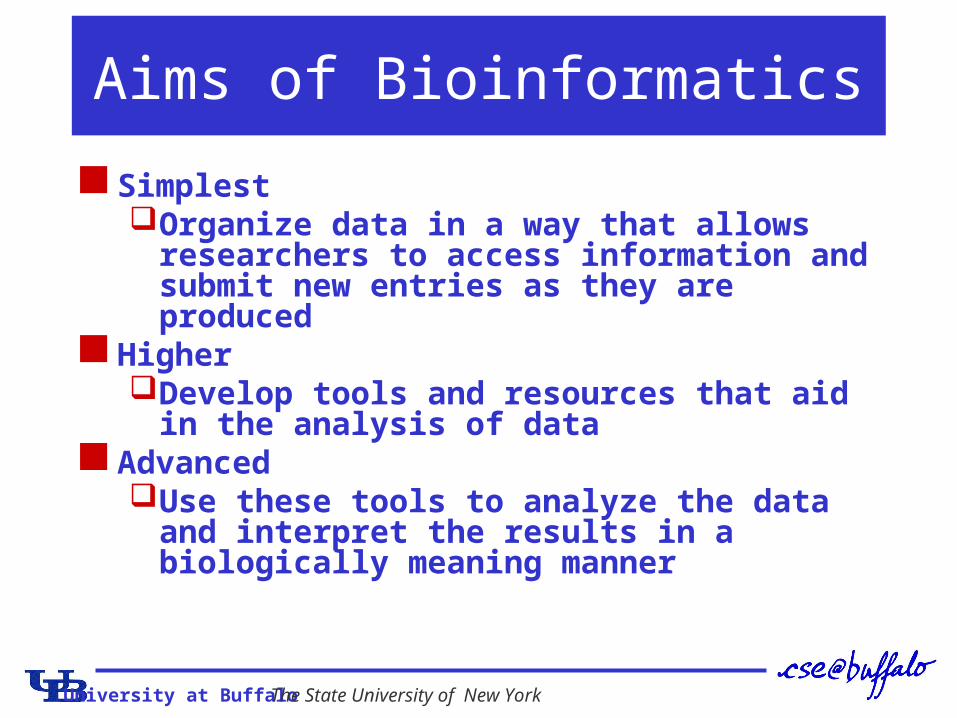
Aims of Bioinformatics
SimplestOrganize data in a way that allows researchers
to access information and submit new entries as they are produced
HigherDevelop tools and resources that aid in the
analysis of dataAdvanced
Use these tools to analyze the data and interpret the results in a biologically meaning manner
University at Buffalo The State University of New York
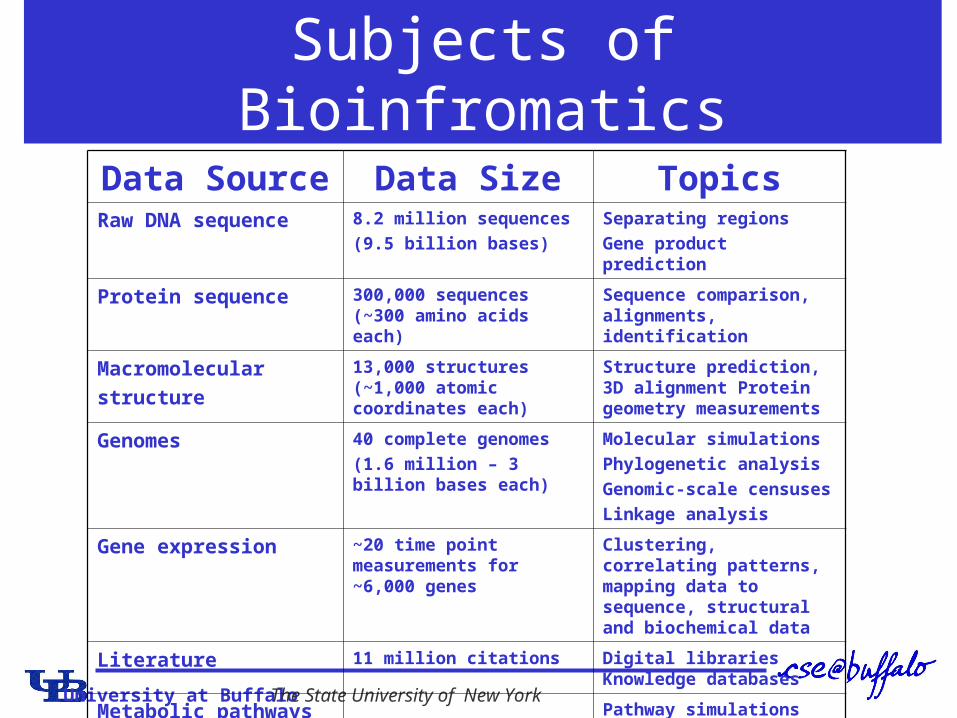
Subjects of Bioinfromatics
Data Source Data Size TopicsRaw DNA sequence 8.2 million sequences
(9.5 billion bases)
Separating regions
Gene product prediction
Protein sequence 300,000 sequences (~300 amino acids each)
Sequence comparison, alignments, identification
Macromolecular
structure
13,000 structures (~1,000 atomic coordinates each)
Structure prediction, 3D alignment Protein geometry measurements
Genomes 40 complete genomes
(1.6 million – 3 billion bases each)
Molecular simulations
Phylogenetic analysis
Genomic-scale censuses
Linkage analysis
Gene expression ~20 time point measurements for ~6,000 genes
Clustering, correlating patterns, mapping data to sequence, structural and biochemical data
Literature 11 million citations Digital libraries Knowledge databases
Metabolic pathways Pathway simulations

University at Buffalo The State University of New York
Figure taken from http://www.oml.gov/hgmis

University at Buffalo The State University of New York
http://www.ipam.ucla.edu/programs/fg2000/fgt_speed7.ppt
DNA Microarray Experiments

University at Buffalo The State University of New York
Gene Expression Data Matrix• Each row represents a gene Gi ;• Each column represents an experiment condition Sj ;• Each cell Xij is a real value representing the gene expression level of gene Gi under condition Sj;
• Xij > 0: over expressed
• Xij < 0: under expressed• A time-series gene expression data matrix typically contains O(103) genes and O(10) time points.
Gene Expression Data

University at Buffalo The State University of New York
X11 X12 X13
X21 X22 X23
X31 X32 X33
sample 1 sample 2 sample 3ge
nes
samples
• asymmetric dimensionality
• 10 ~ 100 sample / condition
• 1000 ~ 10000 gene
• two-way analysis
• sample space
• gene space
Gene Expression Data

University at Buffalo The State University of New York
• Analysis from two angles
• sample as object, gene as attribute
• gene as object, sample/condition as attribute
Microarray Data Analysis
University at Buffalo The State University of New York
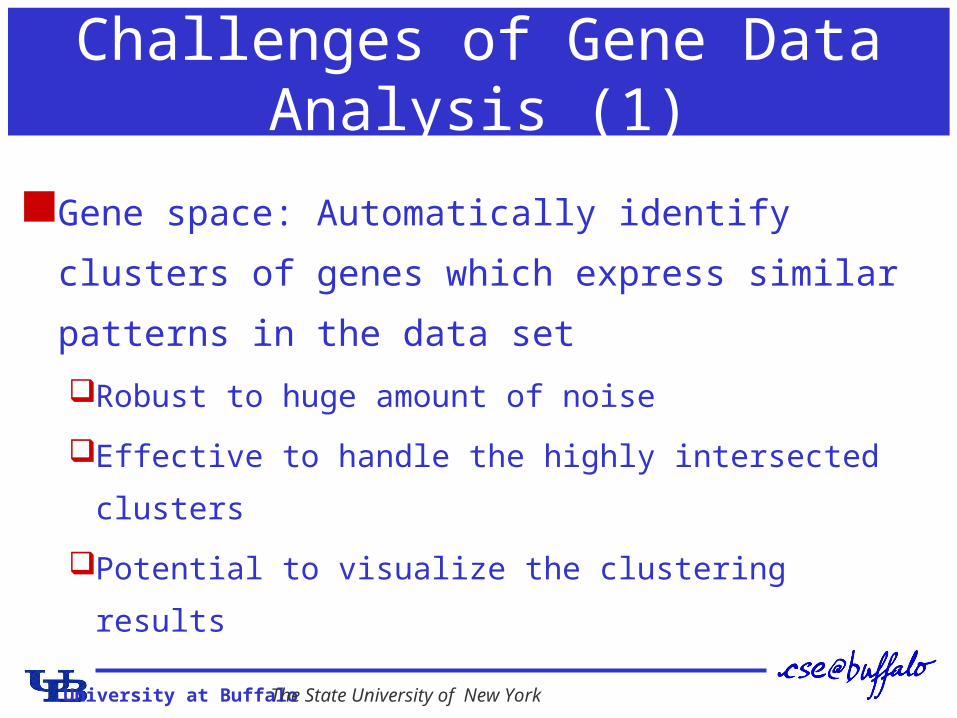
Challenges of Gene Data Analysis (1)
Gene space: Automatically identify clusters of genes
which express similar patterns in the data set
Robust to huge amount of noise
Effective to handle the highly intersected clusters
Potential to visualize the clustering results

University at Buffalo The State University of New York
Gene Expression Data Matrix Gene Expression Patterns
Co-expressed Genes
Why looking for co-expressed genes? Co-expression indicates co-function; Co-expression also indicates co-regulation.
Co-expressed Genes

University at Buffalo The State University of New York
Challenges of Gene Data Analysis (2)
Sample space: unsupervised sample clustering presents interesting but also very challenging problems
–The sample space and gene space are of very different
dimensionality (101 ~ 102 samples versus 103 ~104
genes).
–High percentage of irrelevant or redundant genes.
–People usually have little knowledge about how to
construct an informative gene space.

University at Buffalo The State University of New York
Sample Clustering
Gene expression data clustering

University at Buffalo The State University of New York
Microarray Data Analysis
Sample Clusters
Microaray Data
Gene Expression
Matrices
Gene Expression Data Analysis
ImportantpatternsImportant
patterns
Importantpatterns
MicroarrayImages
Gene Expression Patterns
Visualization
University at Buffalo The State University of New York
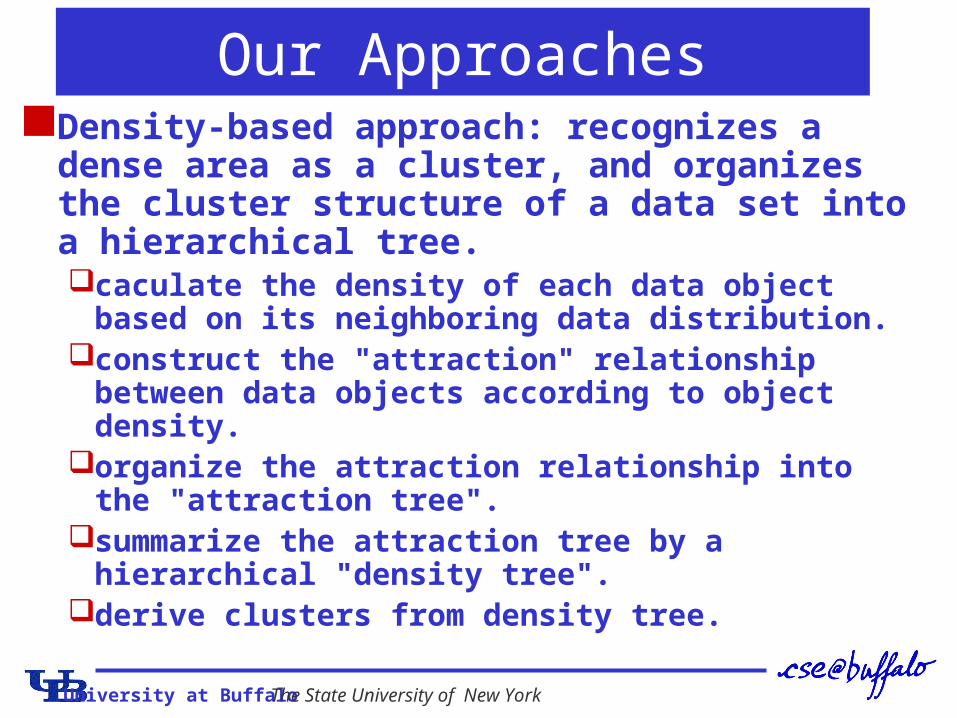
Our ApproachesDensity-based approach: recognizes a dense area
as a cluster, and organizes the cluster structure of a data set into a hierarchical tree.caculate the density of each data object based on its
neighboring data distribution.construct the "attraction" relationship between data
objects according to object density.organize the attraction relationship into the
"attraction tree".summarize the attraction tree by a hierarchical
"density tree".derive clusters from density tree.

University at Buffalo The State University of New York
Our Approaches (2)
Interrelated dimensional clustering --
automatically perform two tasks:
detection of meaningful sample patterns
selection of those significant genes of
empirical pattern

University at Buffalo The State University of New York
Our Approaches (3)
Visualization tool: offers insightful informationDetects the structure of datasetThree Aspects
Explorative Confirmative Representative
Microarray Analysis Status Numerical methods dominant Visualization serve graphical presentations of major clustering
methods Visualization applied
Global visualization (TreeView)Sammon’s mapping
TreeView
University at Buffalo The State University of New York
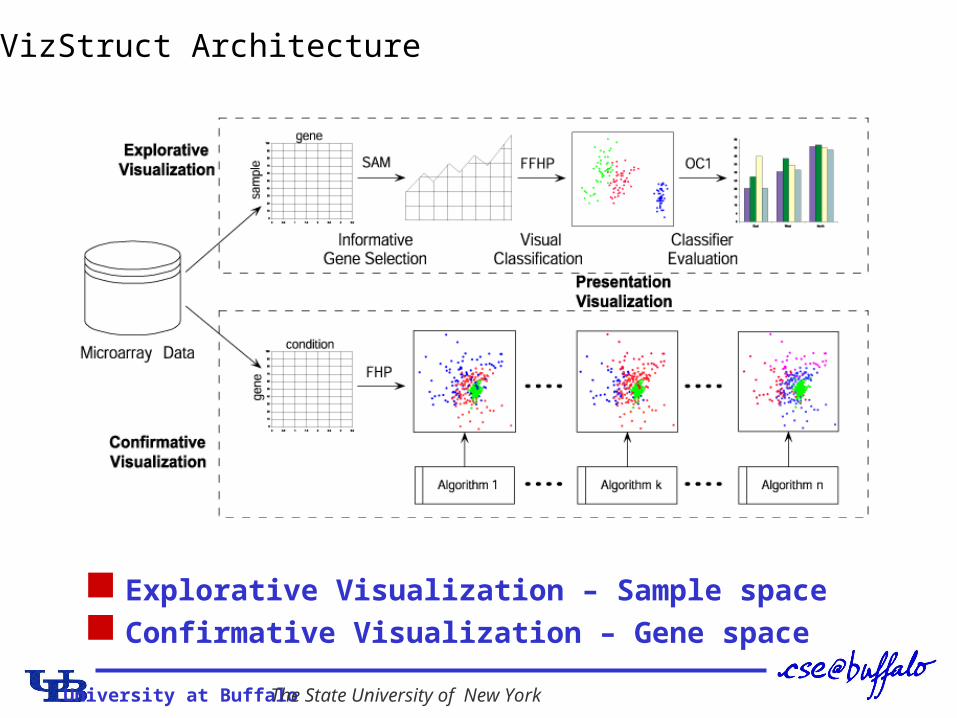
Explorative Visualization – Sample space Confirmative Visualization – Gene space
VizStruct Architecture

University at Buffalo The State University of New York
VizStruct - Dimension Tour
Interactively adjust dimension parameters
Manually or automatically
May cause false clusters to break
Create dynamic visualization

University at Buffalo The State University of New York
Visualized Results for a Time Series Data Set
University at Buffalo The State University of New York
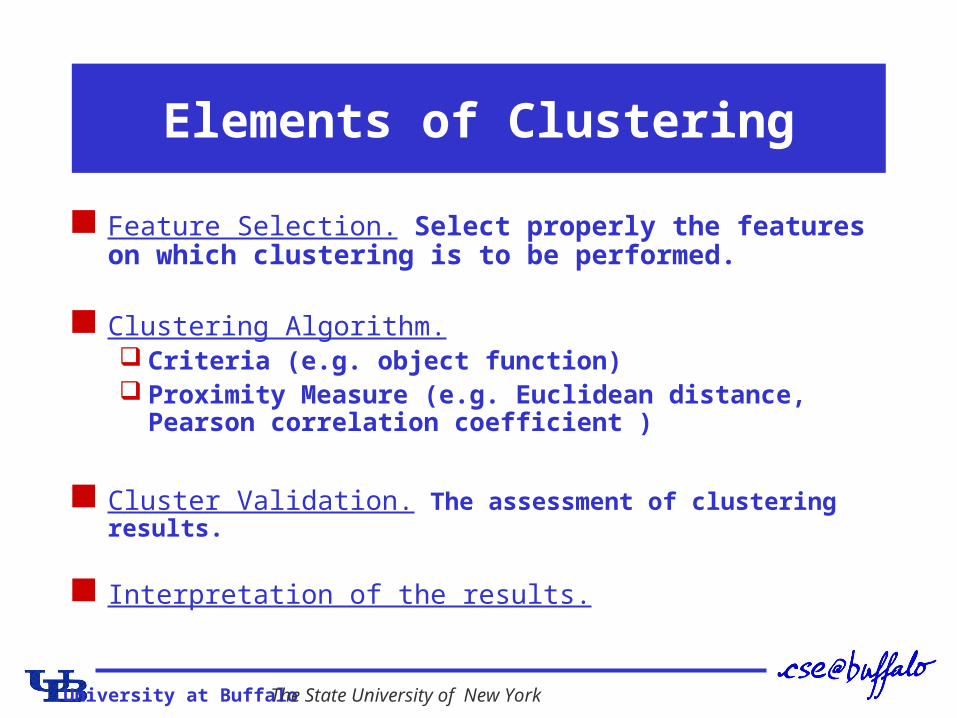
Elements of Clustering
Feature Selection. Select properly the features on which clustering is to be performed.
Clustering Algorithm. Criteria (e.g. object function) Proximity Measure (e.g. Euclidean distance, Pearson
correlation coefficient )
Cluster Validation. The assessment of clustering results.
Interpretation of the results.
University at Buffalo The State University of New York
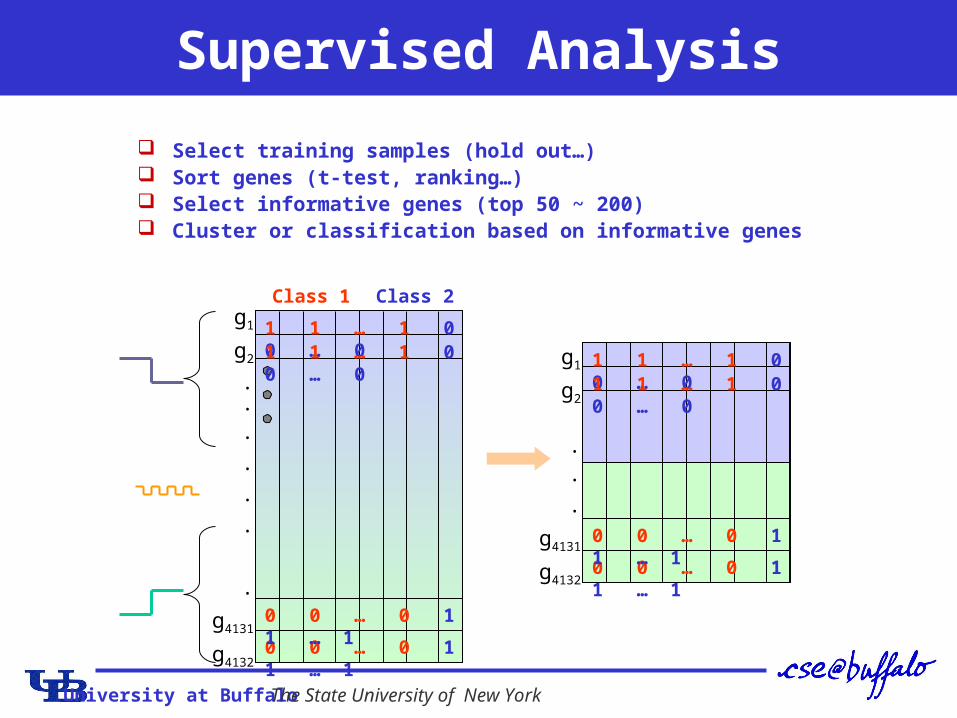
Supervised Analysis
Select training samples (hold out…) Sort genes (t-test, ranking…) Select informative genes (top 50 ~ 200) Cluster or classification based on informative genes
Class 1
1 1 … 1 0 0 … 01 1 … 1 0 0 … 0
0 0 … 0 1 1 … 1
0 0 … 0 1 1 … 1
Class 2g1
g2
.
.
.
.
.
.
.
g4131
g4132
1 1 … 1 0 0 … 01 1 … 1 0 0 … 0
0 0 … 0 1 1 … 1
0 0 … 0 1 1 … 1
g1
g2
.
.
.
g4131
g4132
University at Buffalo The State University of New York
Unsupervised Analysis
Microarray data analysis methods can be divided into two categories: supervised/unsupervised analysis.
We will focus on unsupervised sample classification which assume no membership information being assigned to any sample. Since the initial biological identification of sample classes
has been slow, typically evolving through years of hypothesis-driven research, automatically discovering sample pattern presents a significant contribution in microarray data analysis.
Unsupervised sample classification is much more complex than supervised manner. Many mature statistic methods such as t-test, Z-score, and Markov filter can not be applied without the phenotypes of samples known in advance.
University at Buffalo The State University of New York
Problem Statement
Given a data matrix M in which the number of
samples and the volume of genes are in
different order of magnitude (|G|>>| S|) and the
number of sample categories K.
The goal is to find K mutually exclusive groups
of the samples matching their empirical types,
thus to discover their meaningful pattern and
to find the set of genes which manifests the
meaningful pattern.

University at Buffalo The State University of New York
Problem Statement
Informative Genes
Non- informative
Genes
gene1
gene6
gene7
gene8
gene2
gene4
gene5
gene3
1 2 3 4 5 6 7samples

University at Buffalo The State University of New York
Problem Statement (2)
gene1
gene6
gene7
gene2
gene4
gene5
gene3
Non- informative
Genes
Informative Genes
1 2 3 4 5 6 7samples 8 9 10

University at Buffalo The State University of New York
Problem Statement (3)
Class 1 Class 2 Class3
genea geneb
genec gened
genee genef
Class 1 Class 2 Class3

University at Buffalo The State University of New York
Related Work
New tools using traditional methods :
TreeView
CLUTO
CIT
CNIO
GeneSpring
J-Express
CLUSFAVOR
• SOM
• K-means
• Hierarchical clustering
• Graph based clustering
• PCA
Their similarity measures based on full gene space are interfered by high percentage of noise.

University at Buffalo The State University of New York
Related Work (2)
Clustering with feature selection:
(CLIFF, leaf ordering, two-way ordering)
1. Filtering the invarient genes• Bayes model• Rank variance• PCA
2. Partition the samples• Ncut• Min-Max Cut
3. Pruning genes based on the partition• Markov blanket filter• T-test• Leaf ordering
University at Buffalo The State University of New York
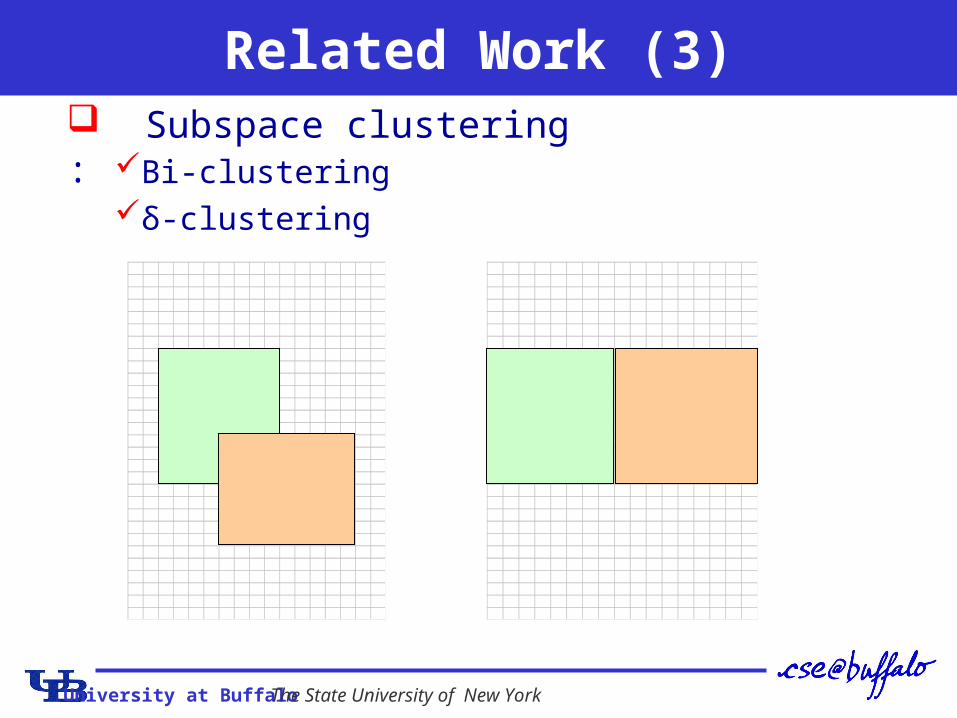
Related Work (3) Subspace clustering :
Bi-clusteringδ-clustering
University at Buffalo The State University of New York
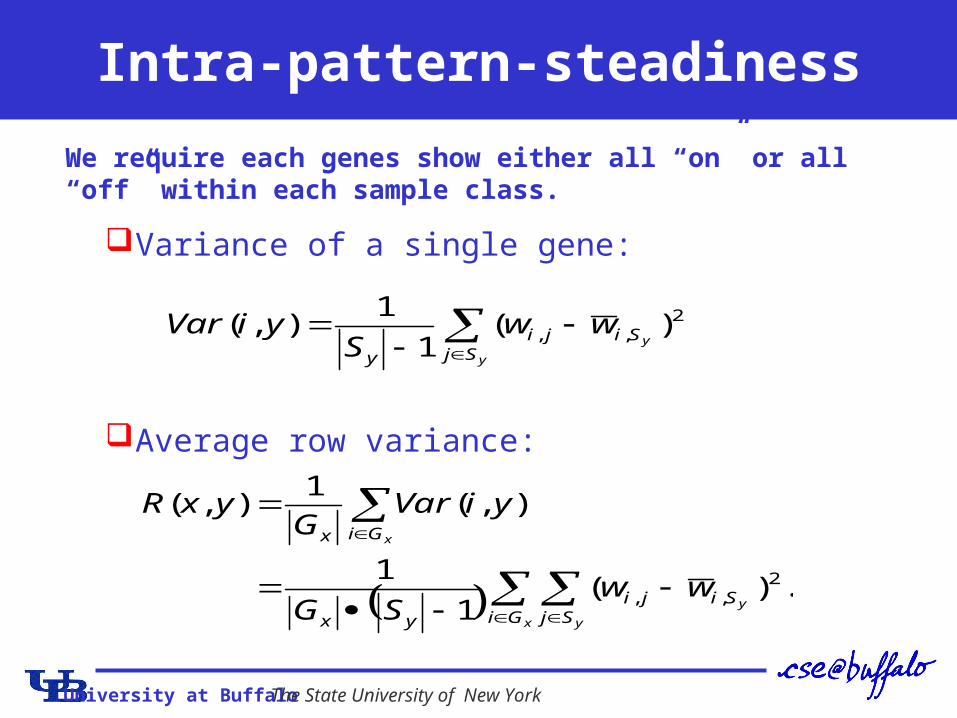
Intra-pattern-steadiness
Variance of a single gene:
Average row variance:
y
ySj
Siji
y
wwS
yiVar 2,, )(
1
1),(
.)(1
1
),(1
),(
2,,
x y
y
x
Gi SjSiji
yx
Gix
wwSG
yiVarG
yxR
We require each genes show either all “on” or all “off” within each sample class.

University at Buffalo The State University of New York
Intra-pattern-consistency(2)
Measure-ment
Data(A) Data(B)
residue 0.1975 0.4506
MSR 0.0494 0.4012
ARV* 339.0667 5.3000

University at Buffalo The State University of New York
Inter-pattern-divergence
In our model, both ``inter-pattern-steadiness'' and ``intra-pattern-dissimilarity'‘ on the same gene are reflected.
Average block distance:
x
GiSiSi
G
ww
yyxD xyy
',,
))',(,(

University at Buffalo The State University of New York
Pattern Quality
The purpose of pattern discovery is to identify the empirical pattern where the patterns inside each class are steady and the divergence between each pair of classes is large.
21,
21
21
)),(,(
),(),(
1
yy SS yyxD
yxRyxR

University at Buffalo The State University of New York
Pattern Quality (2)
Data(A) Data(B) Data(C)
Con 4.25 3.44 4.52
Div 41.60 25.20 46.16
14.2687 9.6074 15.3526
University at Buffalo The State University of New York
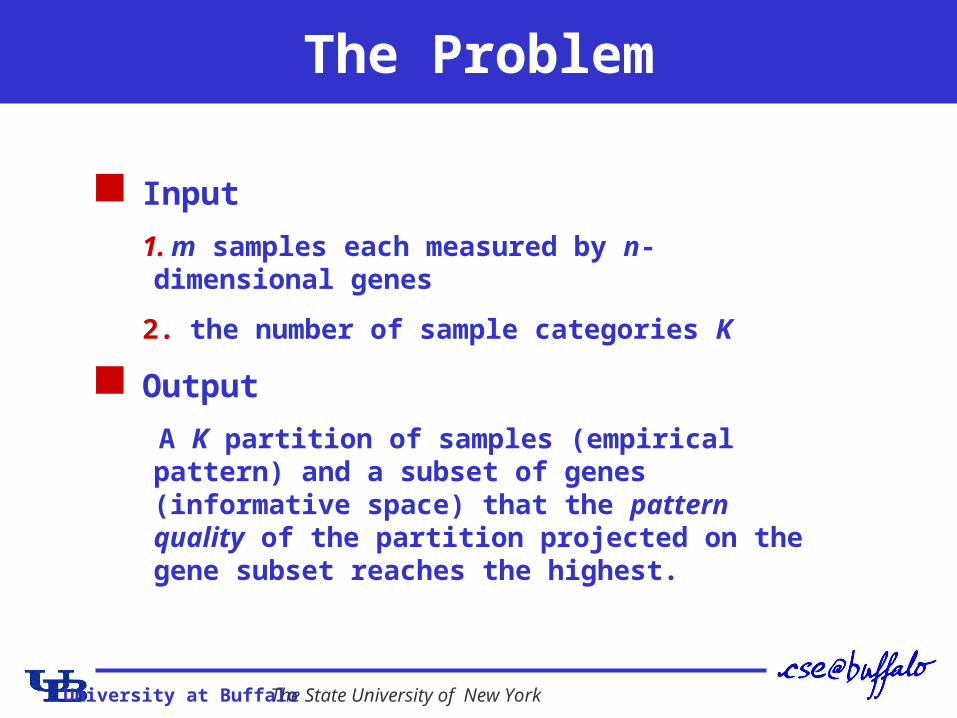
The Problem
Input
1. m samples each measured by n-dimensional genes
2. the number of sample categories K
Output
A K partition of samples (empirical pattern) and a subset of genes (informative space) that the pattern quality of the partition projected on the gene subset reaches the highest.

University at Buffalo The State University of New York
Strategy Starts with a random K-partition of samples and a subset of genes as the candidate of the
informative space.
Iteratively adjust the partition and the gene set toward the optimal solution.
Basic elements:
A state: A partition of samples {S1,S2,…Sk}
A set of genes G’G
The corresponding pattern quality An adjustment
For a gene G’, insert into G’
For a gene G’, remove from G’
For a sample in group S’, move to other group
ig
ig
is

University at Buffalo The State University of New York
Strategy (2)
Iteratively adjust the partition and the gene set toward the optimal pattern.
for each gene, try possible insert/remove
for each sample, try best movement.
University at Buffalo The State University of New York
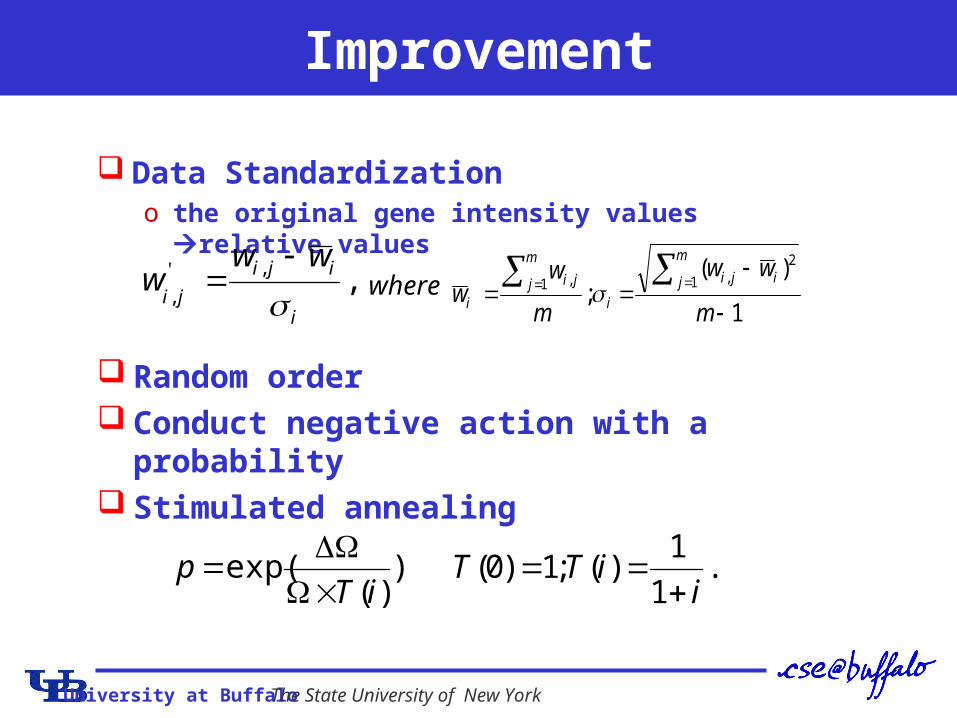
Improvement
Data Standardization o the original gene intensity values relative values
,,'
,i
iji
ji
www
1
)(;
1
2,1 ,
m
ww
m
ww
m
j iji
i
m
j ji
i where
Random order Conduct negative action with a probability Stimulated annealing
))(
exp(iT
p
.1
1)(;1)0(
iiTT

University at Buffalo The State University of New York
Experimental Results
Data Sets:Multiple-sclerosis data
MS-IFN : 4132 * 28 (14 MS vs. 14 IFN)MS-CON : 4132 * 30 (15 MS vs. 15 Control)
Leukemia data7129 * 38 (27 ALL vs. 11 AML)7129 * 34 (20 ALL vs. 14 AML)
Colon Cancer data2000 * 62 (22 normal vs. 40 tumor colon tissue)
Hereditary breast cancer data3226 * 22 ( 7 BRCA1, 8 BRCA2, 7 Sporadics)

University at Buffalo The State University of New York
0.0000
0.2000
0.4000
0.6000
0.8000
1.0000
Multiple-sclerosis data
MS_IFN 0.4815 0.4841 0.5238 0.4815 0.4815 0.4894 0.8052
MS_CON 0.4920 0.4851 0.5402 0.4828 0.4851 0.4851 0.6230
CNIO CITCLUSFAVO
RCluto J-Express Delta EPD*
Experimental Results (2)

University at Buffalo The State University of New York
Interrelated Dimensional Clustering
The approach is applied on classifying multiple-sclerosis patients and IFN-drug treated patients. (A) Shows the original 28 samples' distribution. Each point represents a sample,
which is a mapping from the sample's 4132 genes intensity vectors. (B) Shows 28 samples' distribution on 2015 genes. (C) Shows 28 samples' distribution on 312 genes. (D) Shows the same 28 samples distribution after using our approach. We
reduce 4132 genes to 96 genes.

University at Buffalo The State University of New York
Experimental Results (3)
0.0000
0.2000
0.4000
0.6000
0.8000
1.0000
Leukemia data
G1 0.6017 0.6586 0.5092 0.5775 0.5092 0.5007 0.9761
G2 0.4920 0.4920 0.4920 0.4866 0.4965 0.4538 0.7086
CNIO CITCLUSFAV
ORCluto J-Express Delta EPD*
Experimental Results (3)

University at Buffalo The State University of New York
Experimental Results (4)
0.0000
0.2000
0.4000
0.6000
0.8000
1.0000
Colon & Breast data
Colon 0.4939 0.5844 0.5844 0.5974 0.4415 0.4796 0.6293
Bres t 0.4112 0.5844 0.5844 0.6364 0.4112 0.4719 0.8638
CNIO CITCLUSFAVO
RCluto J-Express Delta EPD*
Experimental Results (4)
University at Buffalo The State University of New York
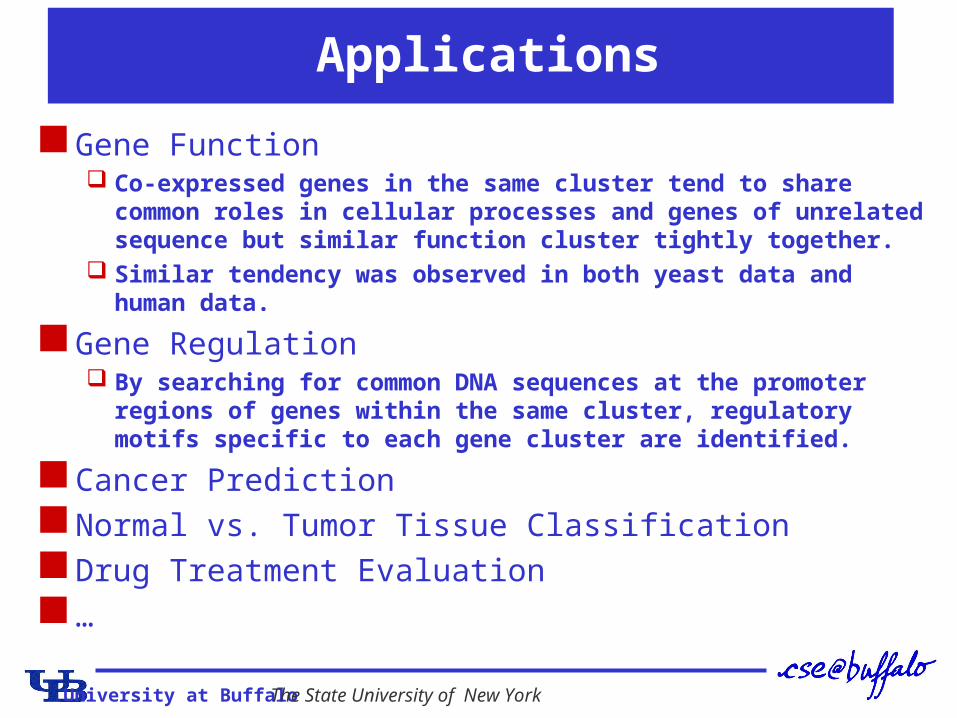
Applications
Gene Function Co-expressed genes in the same cluster tend to share common roles in
cellular processes and genes of unrelated sequence but similar function cluster tightly together.
Similar tendency was observed in both yeast data and human data.
Gene Regulation By searching for common DNA sequences at the promoter regions of genes
within the same cluster, regulatory motifs specific to each gene cluster are identified.
Cancer PredictionNormal vs. Tumor Tissue Classification Drug Treatment Evaluation …
University at Buffalo The State University of New York
Summary
We have developed advanced approaches for gene expression data analysis which work more effectively than traditional analysis approaches
This research area is exciting and challenging. There are a lot of interesting research issues.