Embed Size (px)
Citation preview
UNIVERSITI PUTRA MALAYSIA
KINETIC STUDY OF AN AEROBIC DIGESTION WITH BIOMASS RETENTION B Y
ULTRAFILTRATION MEMBRANES
KHOR OOI HONG
FK 1997 10
KINETIC S TUDY OF ANAEROBIC DIGES TION WITH BIOMA S S RETENTION BY
UL TRAFIL TRA TION ME,MBR ANES
By
KHOR 001 HONG
Thesis Submitted in Partial Fulfilment of the Requirements for the D egree of Master of S cience
in the Faculty of Engineering, Universiti Putra Malaysia
April 1997

TO ALL "\II' TEACHERS
ACKNO'VLEDGEMENTS
First and foremost, I would like to thank my chairman, Dr.
Fakhru'l-Razi Ahmadun for constantly guiding and encouraging me
during the many crisis in this study. Also, I wish to thank members of
my supervisory committee, En. Ahmad Jusoh and En. !>.1egat Johari
!>.1egat Mohd. Noor, for their time and energy spent in making this a
better work.
My appreciations to En. Ismail Ghani of the Env. Eng. Lab for his
assistance and technical support throughout this study. I am grateful to
the staff of the Engineering Faculty , who have helped me a lot in one
way or another, and to the staff of GSa for their cheerfulness and
professionalism in handling their work.
Special thanks to Boon Yan, Abdullah and Aloysius for their kind
assistance . To my lab mates , I hope they don't break the last beaker.
Last but not least , I like to thank Mom, Dad, Ping, and Thai for
their love, understanding and steadfast support. May all be ings b e well
and happy. May they realise the wisdom and happiness that they seek.
111
TABLE O F CONTENTS Page
ACKNOWLEDGE!\1ENT S . . . . . . . . ...................... ................ ...... III LIS T OF TABLES . . . . . . . . . . . . . . . . . . . . . . . . . . . . . . . . . . . . . . . . . . . . . . . . . . . . . . . . . . . . . . . vu LIST OF FIGURES . . . . . . . . . . . . . . . . . . . . . . . . . . . . . . . . . . . . . . . . . . .. . . . . . . . . . . . . . . . . . . ix LIS T OF PLATES . . . . . . . . . . . . . . . . . . . . . . . . . . . . . . . . . . . . . . . . . . . . . . . . . . . . . . . . . . . . . . . xi LIS T OF ABBREVIATIONS . . . . . . . . . . . . . . . . . . . . . . . . . . . . . . . . . . . . . . . . . . . . . . . . . xu AB S TRACT . . . . . . . . . . . . . . . . . . . . . . . . . . . . . . . . . . . . . . . . . . . . . . . . . . . . . . . . . . . . . .. . . . . . . . . XUl AB S TRAK . . . . . . . . . . . . . . . . . . . . . . . . . . . . . . . . . . . . . . . . . . . . . . . . . . . . . . . . . . . . . . . . . . . . . . . . . xv
CHAPTER
I
II
INTRODUCTION . . . . . . . . . . . . . . . . . . . . . . . . . . . . . . . . . . . . . . . . . . . . . . . . 1 Objectives . . . . . . . . . . . . . . . . . . . . . . . . . . . . . . . . . . . . . . . . . . . . . . . . . . . . . . . . . . . 4
LITERA TURE REVIEW . . . . . . . . . . . . . . . . . . . . . . . . . . . . . . . . . . . . . . .
!\,1icrobiology of Anaerobic Digestion . . . . . . . . . . . . . . . . . . . . . .
Hydrolysis . . . . . . . . . . . . . . . . . . . . . . . . . . . . . . . . . . . . . . . . . . . . . . . . . . .
Acidogenesis ..... . . . . . . . . . . . ... . . . . . . . . . . . . . ... . . . . . . . . . . .
Acetogenesis . . . . . . . . . . . . . . . . . . . . . . . . . . . . . . . . . . . . . . . . . . . . . .
M ethanogenesis . . . . . . . . . . . . . . . . . . . . . . . . . . . . . . . . . . . . . . . . . . .
Process Application . . . . . . . . . . . . . . . . . . . . . . . . . . . . . . . . . . . . . . . . . . . . . . Conventional Process . . . . . . . . . . . . . . . . . . . . . . . . . . . . . . . . . . .
5 5 6 6 7 9 1 2 1 4
Anaerobic Contact Process . . . . . . . . . . . . . . . . . . . . . . . . . . . . 1 5 Anaerobic Filter Process . . . . . . . . . . . . . . . . . . . . . . . . . . . . . . . 1 6
Kinetics and Modelling . . . . . . . . . . . . . . . . . . . . . . . . . . . . . . . . . . . . . . . . . 1 7 Microbial Growth Rate . . . . . . . . . . . . . . . . . . . . . . . . . . . . . . . . 1 8 Microbial Growth Rate and S ubstrate Utilisation Rate . . . . . . . . . . . . . . . . . . . . . . . . . . . . . . . . . . . . . . . . . . . 1 9 Effect of Substrate Concentration on Microbial Growth Rate . . . .. . . . . . . . . . . . . ... . . . . . . . . . . . . 20 Effect of Substrate Concentration on S ub strate Utilisation Rate . . . . . . . . . . . . . . . . . . . . . . . . . . . . . . . . . . . . . . . . . . . .
Steady S tates . . . . . . . . . . . . . . . . . . . . . . . . . . . . . . . . . . . . . . . . . . . . . .
Substrate Concentration and Solids Retention Time Minimum Substrate Concentration !\1icroorganism Concentration in Continuous Culture . . . . . . . . . . . . . . . . . . . . . . . . . . . . . . . . . . . . . . . . . . . . . . . . . . . . . .
IV
23 23
24 2 5
2 6
[II
IV
Digestion Operations . . . . . . . . . . . . . . . . . . . . . . . . . . . . . . . . . . . . . . . . . . . .
pH . . . . . . . . . . . . . . . . . . . . . . . . . . . . . . . . . . . . . . . . . . . . . . . . . . . . . . . . . . . .
Retention Time . . . . . . . . . . . . . . . . . . . . . . . . . . . . . . . . . . . . . . . . . . . .
Temperature . . . . . . . . . . . . . . . . . . . . . . . . . . . . . . . . . . . . . . . . . . . . . . .
MIxing . . . . . . . . . . . . . . . . . . . . . . . . . . . . . . . . . . . . . . . . . . . . . . . . . . . . . .
Membrane Filtration . . . . . . . . . . . . . . . . . . . . . . . . . . . . . . . . . . . . . . . . . . . .
Pressure Driven Membrane Processes . . . . . . . . . . . . .
Concentration Polarisation and Fouling . . . . . . . . . .
Cleaning and 11embrane Lifetimes . . . . . . . . . . . . . . . . .
Membrane Anaerobic System . . . . . . . . . . . . . . . . . . . . . . . . . . . . . . . .
Treatment Technology and Cost for P011E . . . . . . . . . . . .
MATERIALS AND METHODS Experimental Design . . . . . . . . . . . . . . . . . . . . . . . . . . . . . . . . . . . . . . . . . . . .
Crossflow Ultrafiltration Membrane (CUF) Unit Anaerobic Reactor . . . . . . . . . . . . . . . . . . . . . . . . . . . . . . . . . . . . . .
Centrifugal Pump . . . . . . . . . . . . . . . . . . . . . . . . . . . . . . . . . . . . . . . .
r..1embrane Cleaning . . . . . . . . . . . . . . . . . . . . . . . . . . . . . . . . . . . . . . . . . . . . Feed Preparation . . . . . . . . . . . . . . . . . . . . . . . . . . . . . .. . . . . . . . . . . . . . . . . . .
Laboratory Analysis . . . . . . . . . . . . . . . . . . . . . . . . . . . . . . . . . . . . . . . . . . . . Feed, Reactor C ontent and P ermeate . . . . . . . . . . . . . Frequency of Analysis . . . . . . . . . . . . . . . . . . . . . . . . . . . . . . . . . Gas Measurement . . . . . . . . . . . . .. . . . . . . . . . . . . . . . . . . . . . . . . .
Start-up . . . . . . . . . . . . . . . . . . . . . . . . . . . . . . . . . . . . . . . . . . . . . . . . . . . . . . . . . . . .
Steady S tates . . . . . . . . . . . . . . . . . . . . . . . . . . . . . . . . . . . . . . . . . . . . . . . . . . . . .
First Attempt . . . . . . . . . . . . . . . . . . . . . . . . . . . . . . . . . . . . . . . . . . . . . Second Attempt . . . . . . . . . . . . . . . . . . . . . . . . . . . . . . . . . . . . . . . . . .
Problems Encountered During Steady States . . . . . . . . . . . .
Presence of S olids in Reactor . . . . . . . . . . . . . . . . . . . . . . .
RESULTS AND DISCUS SION . . . . . . . . . . . . . . . . . . . . . . . . . . . . . Overall Performance of MAS Microbial Performanc e and Kinetics . . . . . . . . . . . . . . . . . . . . . .
Effect of Loading Rates and Retention Times on Utilisation Rates . . . . . . . . . . . . . . . . . . . . . . . . . . . . . . . . . . . . . .
Microbial Kinetics . . . . . . . . . . . . . . . . . . . . . . . . . . . . . . . . . . . . . . .
Kinetic 110delling . . . . . . . . . . . . . . . . . . . . . . . . . . . . . . . . . . . . . . .
Comparison with Existing Kinetic Constants . . . .
Estimation of S teady S tate Microorganism Concentration in Reactor . . . . . . . . . . . . . . . . . . . . . . . . . . . . .
Minimum S olids Retention T ime and Substrate Utilisation Efficiency
v
Page 27 27 2 8 29 30 3 1 3 2 3 4 3 5 36 40
42 42 43 -1-4 44 -1- 5 4 5 -1-7 -1-7 -1-7 48 5 1 5 2 5 2 5 3 5 4 5 5
5 9 5 9 6 1
62 66 68 73
77
8 2
Page Biogas C omposition and Production . . . . . . . . . . . . . . . . . . . . . . . 86
v
Effect of Cleaning and Biomass C oncentration on Permeate Flux . . . . . . . . . . . . . . . . . . . . . . . . . . . . . . . . . . . . . . . . . . . . . . . . . . . . .
Comparison of Performance of M embrane Biological Reactors . . . . . . . . . . . . . . . . . . . . . . . . . . . . . . . . . . . . . . . . . . . . . .
Comparison of Performance of POME-fed Anaerobic Systems . . . . . . . . . . . . . . . . . . . . . . . . . . . . . . . . . . . . . . . . . . . . . . .
CONCLUSIONS Recommendation
REFERENCES
APPENDICE S A
B - 1 B - 2
Experimental R a w Data . . . . . . . . . . . . . . . . . . . . . . . . . . . . . . .
Reactor Dimensions . . . . . . . . . . . . . . . . . . . . . . . . . . . . . . . . . . . .
Example of Simulation Results . . . . . . . . . . . . . . . . . . . . .
88
93
9 5
9 7 1 00
1 02
1 08 III 1 1 2
BIOGR APHIC AL S KETCH . . . . . . . . . . . . . . . . . . . . . . . . . . . . . . . . . . . . . . . . . . . . . . . . . . . . 1 1 3
vi

Table
1
2
3
4
5
LIST O F TABLES
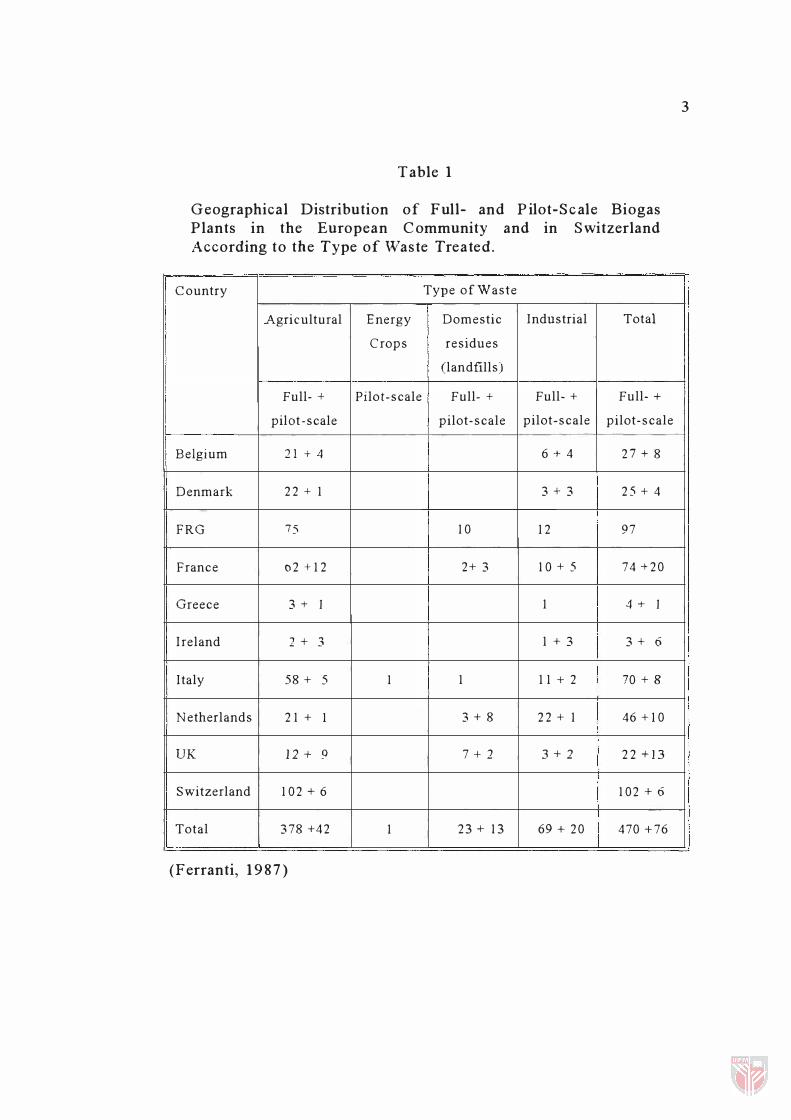
Geographic al Distribution of Full- and Pilot-scale Biogas Plants in the European Community and in Switzerland According to the Type of Waste Treated
Some Typical Operating Parameters of the Contact and Anaerobic Filter . . . . . : . . . . . . . . . .. . . . . . . . . . . . . . . . . . .
Kinetic 1\10dels Used in Anaerobic Treatment
1\1athematical Expressions of Specific S ubstrate Utilisation Rates for S everal Known Kinetic Models
Biomass Reactor Classification
6 Pressure-Driven 1\1embrane Processes and
Page
3
1 7
22
23
28
Membrane Characterictics . . . . . . . . . . . . . . . . . . . . . . . . . . . . . . . . . . . . . . . 32
7
8
9
1 0
Apparent Dimensions of Various P articles . . . . . . . . . . . . . . . . .
Application of Membrane Biological Reactors in Treating Several Type of Wastewater . . . . . . . . . . . . . . . . . . . .
Cost for Three 1\10st Common Treatment System for P 01\JE in J'vlalaysia . . . . . . . . . . . . . . . . . . . . . . . . . . . . . . . . . . . . . . . . . . .
S chedule and lvlethod of Ivfembrane Cleaning
1 1 Laboratory Analysis on Feed, Permeate and
3 3
3 8
4 1
4 5
Reactor Content . . . . . . . . . . . . . . . . . . . . . . . . . . . . . . . . . . . . . . . . . . . . . . ... .. . 47
1 2 Designated Organic Loading Rates (OLR) and "lastage at Various Steady S tates . . . . . . . . . . . . . . . . . . . . . . . . . . . . 5 3
1 3 Summary of Problems and Rectification . . . . . . . . . . . . . . . . . . . . 5 4
1 4 S ummary of Results . . . . . . . . . . . . . . . . . . . . . . . . . . . . . . . . . . . . . . . . . . . . . . . 60
Vll

Table
1 5 Results of the Application of Three Known
Page
Substrate Utilisation r-.10de1s . . . . . . . . . . . . . . . . . . . . . . . . . . . . . . . . . . . 68
16 Representative Values of Kinetic Constants for Anaerobic Digestion at 3 5 °C . . . . . . . . . . . . . . . . . . . . . . . . . . . . . . . . . . . 73
1 7 Summary of Kinetic Constants for \' arious Substrates Utilised in 1\1esophilic Anaerobic Treatment Processes as Compared to MAS Kinetic Constants for this Study . . . . . . . . . . . . . . . . . . . . . . . . . . . . . . 7 5
1 8 Kinetic Constants for S everal Mesophilic Anaerobic System Treating POr-.1E . . . . . . . . . . . . . . . . . . . . . . . . . . . . . . . . . . . . . . . . . . 76
1 9 Characteristics of Three Known Models in Predicting SR T nun' Substrate Utilisation Efficiency, E and Effluent Substrate Concentration, S . . . . . . . . . . . . . . . . . . . . 8 3
20
2 1
2 2
23
Comparison of o'&CH4 in Biogas Produced from Several Anaerobic Digesters Treating POME
Comparison of Performance of S everal Membrane Biological Rea ctors . . . . . . . . . . . . . . . . . . .. . . . . . . . . . . . . . . . . . . . . . . . . . . . .
Analytical Data for r-.lAS during S S l - S S6
Gas Composition and Production during S S l - S S6
Permeate Fio\vrate and Flux Data during S S 1 - S S6
V1l1
8 7
94
1 0 8
1 09
1 1 0
LIST OF FIGURES
Figure Page
1 Methanogenic Reactions 1 0
2 The Main �ficrobial Reactions in Anaerobic Digesters 1 1
3 S chematic Diagram of Three Main Types of Anaerobic Treatment Processes . . . . . . . . . . . . . . . . . . . . . . . . . . . . . . . . . 1 3
4 Schematic Diagram of Three Existing V ariations of Membrane Bioreactor System . . . . . . . . . . . . . . . . . . . . . . . . . . . . . . . . . . . 3 9
5 Experimental S et-up 43
6 J-tube Gas Analyser 49
7 Observed S and E vs S R T . . . . . . . . . . . . . . . . . . . . . . . . . . . . . . . . . . . . . . . . 63
8 S UR vs OLR 64
9 BLR, S S UR vs OLR 6 5
1 0 1 'S R T vs [r . . . . . . . . . . . . . . . . . . . . . . . . . . . . . . . . . . . . . . . . . . . . . . . . . . . . . . . . . . . . 67
1 1 Monod �fodel : 1 L' vs 1 / S 69
1 2 C ontois �fodel : 1 / U vs XIS 70
13 Chen and Hashimoto Model : 1/U vs SiS . . . . . . . . . . . . . . . . . . . . 7 1
1 4
1 5
1 6
1 7
Observed X vs Predicted X
Monod Model: SRT, S and E
Contois :Model : S RT, S and E
Chen and Hashimoto Model : SRT, S and E
IX
7 8
7 9
8 0
8 1

Figure
1 8
1 9
%CH4, Gas and 11ethane Yield vs OLR
%CH4, Gas and Methane Yield vs SRT
Page
8 4
8 5
20 Permeate Flux and 11LVS S over Cumulative Day . . . . . . . . . 8 9
2 1
2 2
Specification of Reactor
Contois 110del : 11 U YS XI S ( Include S S4)
x
1 1 1
1 1 2
LI ST OF PLATES
Plates
1 Feeder, Gas Collector and Anaerobic Reactor of
Page
l\,1embrane Anaerobic System . . . . . . . . . . . . . . . . . . . . . . . . . . . . . . . . . . . . 5 6
2 CUF Unit of l\1embrane Anaerobic System 5 7
3 Reactor's Dome with Gas Hose . . . . . . . . . . . . . . . . . . . . . . . . . . . . . . . . . . 5 8
-l Blockage is Suspected B etween the Conical S ection and the T -junction . . . . . . . . . . . . . . . . . . . . . . . . . . . . . . . . . . . . . . . . . . . . . . . . . . 5 8
5 Unused PCI Membrane Showing Pores with Size Ranging from 0 . 5 .urn to 0 . 0 5.um . . . . . . . . . . . . . . . . . . . . . . . . . . . . . . 92
6 Surface of Unwashed l\1:embrane ( not soaked in NaOH and HCI) is Overgrown with Fibrous, Net-like Gro\vths . . . . . . . . . . . . . . . . . . . . . . . . . . . . . . . . . . . .. . . . . . . . . . . . . . . . . . . . . . . . . . . . 92
7 Surface of Washed r-.1embrane ( soaked in NaOH for 3 0 minutes and Hel in 2-1- hours) Reveal Larger Pores. The Smaller Pores are Still l\Iostly Covered by Organisms . . . . . . . . . . . . . . . . . . . . . . . . . . . . . . . . . . . . . . . . . . . . . . . . . . . . . . . . . 93
Xl

BLR
COD
C STR
CUF
CUI\IAR
FFB
HRT
I\L-\S
I\IF
I\ IWC O
OLR
POME
PVC
RO
SEM
SRT
S S
SSUR
SUR
T S S
UF
VFA
\IS S
LI ST OF ABBREVIATIONS
Biological Loading Rate
Chemical Oxygen Demand
Completely I\1ixed, S tirred Tank Reactor
Crossflow Ultrafiltration Membrane
Crossflow Ultrafiltration I\,lembrane Anaerobic Reactor
Fresh Fruit B unch
Hydraulic Retention Time
I\1embrane Anaerobic System
lvIicrof iltration
Molecular \Veight Cut-off
Organic Loading Rate
Palm Oil Mill Effluent
Polyvynilchloride
Reverse Osmosis
S canning Electron Microscope
Solids Retention Time
Steady State
Specific Substrate Utilisation Rate
S ubstrate Utilisation Rate
Total S uspended S olids
Ultrafiltration
Volatile Fatty Acid
Volatile Suspended Solids
xu
Abs tract of thesis sub mitte d to the S enate of Universiti Putra Malaysia in partial fulfilment of the requirements for the degree of Master of S cience.
KINETIC STUDY OF ANAEROBIC DIGE STION WITH BIOMASS RETENTION BY ULTRFILTRATION MEMBRANES
By
KHOR 001 HONG
MARCH 1 997
Chairman : Dr. Fakhru'l-Razi Ahmadun
Faculty : Engineering
In this study, a 50 litre laboratory-scaled membrane anaerobic system
(1\1AS ) combining ultrafiltration (UF) membrane with anaerobic reactor
was used to treat palm oil mill effluent (POME) at ambient temperature .
S ix steady states were attained as part of a kinetic study. The results of
steady state 4 ( S S 4) was adversely affected by a long shutdown due to
pump leakage . The results of the five remaining steady states were
successfully fitted, above 96%, by Monod, Contois, and Chen and
Hashimoto models . Contois 1\t Iodel appeared to be the best at 99. 7�iO.
The microbial kinetic constants are Y = 0 . 8 3 gVS S/gCOD and b = 0 . 1 5
day·I. Minimum solids retention time, e cmin obtained from the three
simulation models range from 6-1 4 . 3 days . Maximum total gas yield was
measured at 0 . 6 2 1 litre/g COD at an organic loading rate ( OLR) of 5 . 0
kgCOD/m3/d. %CH4 composition decreases from 75 . 7% at OLR of 1 . 8
XUl
kgCOD/m3/d, to 62 . 3 % at OLR of 6 . 0 kgCOD/m3/d. The percentages of
COD removal were achieved between 99.0%-88.9% over a range of
mixed liquor suspended solids of 1 0, 033-22, 1 75 mg/I. The final
hydraulic and solids retention time, e and e have been reduced to 8.3 _ c
days and 1 2 . 5 days, respectively during S S6 . Under scanning electron
microscope ( S EM), the effective pores of the membrane was found to be
pores larger than 0 . 1 f-Lm. Layers of fibrous growth on the membrane
surface increase separation efficiency. 1\10re efficient and frequent
cleaning is required to inhibit membrane fouling and increas e p ermeate
flux. Overall, this study indicated that 1\1A S is capable of treating higher
OLR when e. is maintained above 20 days .
XIV

Abstrak tesis yang dikemukakan kepada S enat Universiti Putra Malaysia sebagai memenuhi sebahagian daripada syarat untuk Ijazah 1>.1a ster S ains .
KAJIAN KINETIK KE ATAS PENC ERNAAN ANAEROB I K D ENGAN P ENAHANAN BIOMAS OLEH MEMBRAN
ULTRATURASAN
Oleh
KHOR 001 HONG
MAC 1997
Pengerusi : Dr. Fakhru'l-Razi Ahmadun
Fakulti : Kejuruteraan
Dalam kajian Int, suatu sistem anaerobik membran (MA S )
berskala-makmal salZ 5 0 liter, yang menggabungkan membran
ultraturasan (UF) dengan reaktor anaerobik, telah digunakan untuk
merawat efluen kilang kelapa sawit (P01>.'fE) pada suhu persekitaran.
Enam tahap tetap (steady s tate) telah dicapai sebagai sebahagian
daripada kajian kinetik . Keputusan tahap tetap 4 ( S S 4 ) telah mengalami
gangguan, kesan daripada p emberhentian lama setelah pam mengalami
kebocoran. Keputusan tahap tetap yang selebihnya berjaya digunakan
untuk mendapat fit pada 96% ke atas, bagi model-model Monod,
Contois, s erta Chen dan Hashimoto. l\.1odel Contois didapati p aling baik
dengan 99.7%. Koefisien kinetik mikrobial yang didapati a dalah Y = 0 . 8 3
gVS S/gCOD dan b = 0.15 hari"l. Masa tahanan pepejal minimum, ecmin
yang didapati daripada simulasi ketiga-tiga model mempunyai julat an tara
xv
6- 1 4.3 hari . lumlah biogas maksimum ialah 0 . 6 2 1 liter/hari b agi kadar
beban organik ( OLR) 5 . 0 kgCOD/m3/hari . %CH4 berkurang daripada
7 5 . 7% pada OLR 1. 8 kgCOD/m3/hari, kepada 62 .3% p ada OLR 6 . 0
kgCOD/m3/hari. P eratusan penyingkiran COD telah dicapai di antara
99. 0%- 8 8 . 9% untuk pepej al terampai larutan campuran (ML S S ) antara
1 0, 033-22, 1 7 5 mg/I. Masa tahanan hidraulik dan p epejal, e and ec telah
dikurangkan kepada 8 . 3 hari dan 1 2 . 5 hari, masing-masing pada S S6 . Di
b awah mikroskop elektron scanning ( SEM), liang membran yang
berkesan adalah liang b es ar b erukuran lebih daripada 0 . 1 )..lm . Lapisan
tumbesaran berfiber di atas permukaan membran meningkatkan
kecekapan pemisahan. Pembersihan membran y ang lebih cekap and kerap
diperlukan untuk menghalang membran daripada tersumbat (fouling)
serta meningkatkan kadar alir permeate. S ecara keseluruhan, kajian ini
menunjukkan b ahawa MAS mampu untuk merawat OLR yang lebih
tinggi dengan pengekalan e c lebih daripada 20 hari.
XVI
CHAPTER I
INTRODUCTION
Anaerobic digestion IS a naturally occurnng microbiological
process in the environment; best observed in swamps, and deep reaches
of s ediments in water and soil . The confin ement and optimisation of the
naturally occurring anaerobic digestion process leads to the pioneering
use of anaerobic digestion in treating human excreta in septic tanks .
Since then, anaerobic digestion has moved into other areas of waste
reduction, such as agriculture, farming and industry.
The 19 70s energy cnSlS revealed another role of anaerobic
digestion - that of providing methane gas as an alternative fuel . The
crisis stimulated world-wide research and development in anaerobic
digestion. In highly industrialised and populated countries in Europe,
considerable research efforts were spent in this field. The European
Commission, for example, predicted that 1 0% of Europe's energy needs
could be met by renewable energy and thus, invested £ 1 00M in research
and development at one tim e ( Hobson, 1 993) . However, with the drop in
oil price, there remained no immediate economic reason for alternative
1
2
energies . Furthermore, the energy contribution from digesters were
below expectation. The total value of the fraction of biogas that was
effective as an energy source was much less than the amount spent on
research and development programmes (Coombs, 1 990) .
From then on, the continuing research on anaerobic digestion was
fuelled by growing awareness of pollution control. An early 1 9 80s
survey of biogas plants in Europe ( Table 1 ) found that mos t of the plants
were used to treat agricultural waste. Apart from that, over 8 0% of the
plants were in fact full-scale operating plants . The widespread attraction
of anaerobic digestion technology may be attributed to its ability to treat
concentrated waste with lower energy requirement .
In Malaysia, the heightened conSCIOusness that waste treatment is
necessary to avoid environmental pollution, was reinforced in the recent
7th Malaysia Plan (RM7) . Anaerobic digestion will have a bigger role to
play in treating large volumes of high to medium-range conc entrated
wastes. This is especially so if the agricultural development, which
focuses on l arge-scale production of food and high-value produce, goes
according to the RM7.
I
Table 1
Geographical Distribution of Full- and P ilot-S c ale Biogas Plants in the European C ommunity and in Switzerland According to the Type of \:Vaste Treated.
Country Type of Waste
Agricultural Energy Domestic Industrial Total
Crops residues
(landfills)
Full- + Pilot-scale Full- + Full- + Full- +
pilot -scale pilot-scale pilot-scale pilot-scale
Belgium 21 + 4 6 + 4 27 + 8
Denmark 22 + 1 3+3 25 + 4
FRG 75 10 12 97
France 02 + 12 2+ 3 10 + 5 74 +20
Greece 3 + I 1 4+ I
Ireland 2 + 3 1 + 3 3 + 6
Italy 58 + 5 1 1 11 + 2 70 + 8
Netherlands 21 + 1 3 + 8 22 + 1 46 +10
UK 12 + 9 7 + 2 3 + 2 22 + 13
Switzerland 102 + 6 102 + 6
Total 378 +42 1 23 + 13 69 + 20 470 +76
(Ferranti, 1 9 8 7 )
3

4
Likewise , there is continuous expansion m other sectors such as
the local manufacturing and industrial sectors, and solid and hazardous
waste disposal. At the same time, the industrial s ector will find more
stringent standards and imposition of fees for treated waste discharges
with the implementation of the RM7. This will in turn create the demand
for more efficient and better waste treatment systems .
Therefore, there are plenty of reasons for commg up with more
innovative and improved waste treatment facilities . In the design of
anaerobic digestion alone, there are many such variations . Among them,
there is a Membrane Anaerobic System (MAS ) that combines membrane
technology with anaerobic digestion ( Tan, 1 99 5; Fakhru'l-Razi, 1 994) .
The membrane serves to retain the slow-gro\ving active biomass in the
digester while allowing the production of high quality effluent.
Objectives
Therefore, it is the purpose of this study on the treatment of palm
oil mill effluent ( POJ\1E) u sing Membrane Anaerobic System (MAS) to : -
(i) evaluate the overall microbial kinetics, and
(ii) evaluate the applicability of three known kinetic models .

C HAPTER II
LITERATURE REVIEW
Detailed knowledge of microbiology is not necessary m order to
run an anaerobic digester. However, general knowledge of the
microbiology of digestion is important. It is necessary to find out which
part of the interdependent complex processes are limiting and therefore
require control, and improvement in operation or digester design.
Therefore, the following sections hope to bring forth that useful and
vital background knowledge needed in this study.
�1icrobiology of Anaerobi c Digestion
The microbial ecology of a digester consists of anaerobic bacteria
that stabilise organic matter in the absence of free oxygen. Although
there is a gradation in oxygen tolerance , most of the diges ter's bacteria
are among the least tolerant of oxygen. Therefore , any exposure to air or
oxygen will kill or inhibit these obligate anaerobes .
5
6
Classifying by their functions, anaerobic digestion of organic
matter to methane involves the interaction of s everal groups of bacteria.
Hydrolysis
The hydrolytic bacteria excrete extracellular enzymes to convert
complex particulate matter into soluble compounds. In the digestion of
particulate or polymeric waste, hydrolysis i s often found to be the
rate-limiting process (Archer and Kirsop, 1 990; S leat and Mah, 1 98 7 ) .
Acidogenesis
Archer and Kirsop ( 1 990) chose to classify the acidogens under
the s ame group as hydrolytic bacteria . However, the acidogenic group
was separately mentioned in another study by Haandel and Lettinga
( 1 994) . In B oone and Mah ( 1 98 7) , acidogens were also known as
fermentative bacteria, and were classified together with acetogens as
transitional bacteria .
The manner of classification by different researchers only seek to
emphasise the complex interspecies activitie s among the digester's
anaerobes . However, they all agreed that the hydrolytic products were
7
taken up in the cells of these fermentative bacteria and further converted
to simpler organic compounds, such as volatile fatty acids , and gaseous
compounds, such as CO2, and H2•
Acetogenesis
B ased on the classification by Archer and Kirsop ( 1 990), the
acetogenic bacteria \vere divided into obligate proton-reducing (hydrogen
producing) species and non-obligate proton-reducing species . B oth the
obligate and non-obligate proton-reducing acetogens produce the
methanogenic substrates, acetate, H2 and CO2, from the intermediate
compounds . The important distinction between these two types of
bacteria is the ability of the non-obligate proton-reducing bacteria to
grow unhampered in an environment of high Hz concentration.
In an environment with high H2 concentration, non-obligate
proton-reducing bacteria produce 2 main reduced fermentative products,
i . e butyrate and propionate . When the H" level is low enough, the main
product is acetate. This is accompanied by the release of H2 (which acts
as proton-reducer) . Under this non-obligate proton-reducing group,
homoacetogens were identified to be c apable of producing acetate from
H2 and CO2 under certain conditions ( Archer and Kirshop, 1 990) .

8
On the contrary, the obligate proton-reducing acetogens oxidise
reduced fermentative products , such as butyrate and propionate, to form
acetate and grow only by producing H2" Therefore, they can only survive
in an environment where the Hz-utilising bacteria co-exist (interspecies
Hz transfer), to keep the Hz concentration at a low _level .
According to B oone and Mah ( 1 9 8 7) , obligate proton-reducing
acetogens were only one of the three groups of bacteria classified under
transitional bacteria_ The other two were fermentative bacteria
(acidogens) and homoacetogens_
The obligate proton-reducing acetogen-mediated oxidising
reactions of propionate and butyrate. to acetate and H, or CO._ as
proposed III literatures are presented below. According to Haande1 and
Lettinga ( 1 994) , most of the reactions m sewage treatment follow the
general equation 2. If we consider butyric acid or propionic acid as
substrates, where the H:O ratio is l arger than 2 (y > 2z), this would hold
true. S imilarly, B oone and �fah ( 1 9 8 7 ) proposed the oxidation of
propionate (Eq. 3 ) and butyrate (Eq. 4) release H2 in the production of
acetate .