Embed Size (px)
Citation preview

UNIVERSITI PUTRA MALAYSIA
DEVELOPMENT OF COMPUTER PROGRAM TO ANALYSE COMBUSTION PRODUCTS RESULTING FROM
INCINERATION OF SOLID FUELS
HARIMI MOHAMED
FK 2000 29

DEVELOPMENT OF COMPUTER PROGRAM TO ANALYSE COMBUSTION PRODUCTS RESULTING FROM
INCINERATION OF SOLID FUELS
By
HARIMI MOHAMED
Thesis Submitted Fulfilment of the Requirements for the Degree of Master of Science in the Faculty of Engineering
Universiti Putra Malaysia April 2000

This Work is Dedicated To
My Parents and Sisters
ii
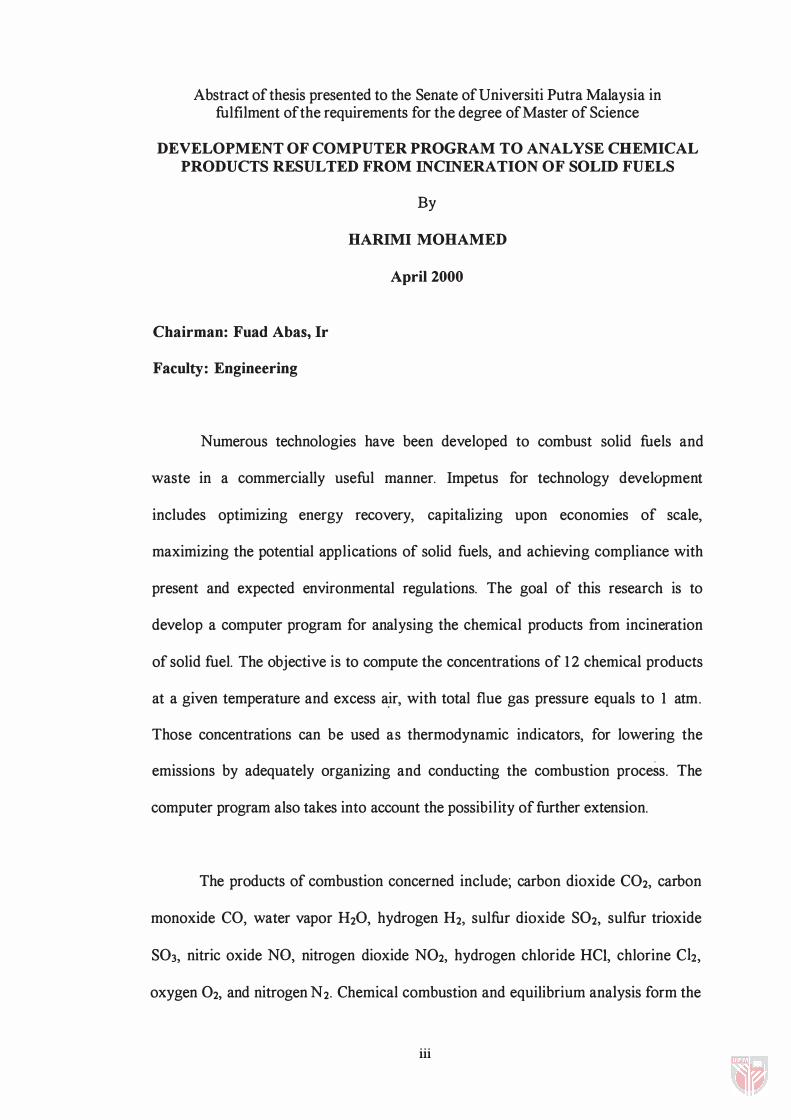
Abstract of thesis presented to the Senate ofUni versiti Putra Malaysia in fulfilment of the requirements for the degree of Master of Science
DEVELOPMENT OF COMPUTER PROGRAM TO ANALYSE CHEMICAL PRODUCTS RESULTED FROM INCINERATION OF SOLID FUELS
By
HARIMI MOHAMED
April 2000
Chairman: Fuad Abas, Ir
Faculty: Engineering
Numerous technologies ha ve been de veloped to combust solid fuels and
waste in a commercially useful manner. Impetus for technology de vel opment
includes optimizing energy reco very, capitalizing upon economies of scale,
maximizing the potential applications of solid fuels, and achie ving compliance with
present and expected en vironmental regulations. The goal of this research is to
de velop a computer program for analysing the chemical products from incineration
of solid fuel. The objecti ve is to compute the concentrations of 1 2 chemical products
at a gi ven temperature and excess a ir, with total flue gas pressure equals to 1 atm.
Those concentrations can be used as thermodynamic indicators, for lowering the
emissions by adequately organizing and conducting the combustion proce ss. The
computer program also takes into account the possibility of further extension.
The products of combustion concerned include; carbon dioxide C02, carbon
monoxide CO, water vapor H20, hydrogen H2, sulfur dioxide S02, sulfur trioxide
S03, nitric oxide N O, nitrogen dioxide N02, hydrogen chloride HC I, chlorine Ch,
oxygen O2, and nitrogen N2. Chemical combustion and equilibrium analysis form the
iii

main part of this research. For the first analysis 6 equations are deduced from mole
balance, and 6 other equations are deduced from the second analysis by using the
chemical equilibrium constants. The 12 equations are non-linear, and therefore
numerical method is used i.e. the Newton iteration method for its rapid con vergence.
The output from this computer program are compared with the re sult of
research carried out by the Institute of Nuclear Sciences (INS), which is based on the
application of the de veloped model for computing the chemical thermodynamic
equilibrium of a system formed by compounds and elements contained in the
Kolubare [Y ogosla via] basin lignite. Combustion simulation was done fo r eight
lignite compositions with temperatures from 800 to 1700 K, pressure 1 atm, and 25%
excess air. The results obtained from the combustion of such a solid fuel show that
there is no significant difference between the two sources [INS & Program] as
pro ved by using statistical T -test whate ver difference in the results that are noticed,
vary from one compound to another. This is due to different models used in
computing the chemical equilibrium constants and the number of products used. the
results gi ven by INS are related to more than 12 unknowns in comparison to the
de veloped computer program.
It is recommended to add to the de veloped computer program the equation of
energy, from which the adiabatic temperature can be computed. For the accuracy of
the computer program, other compounds may be added such as H, OH, H02, N20,
HN02, H202, SO, N, 0, and C �. Beside this the humidity in the air should be taken
into account. Additional subroutine may be inserted in the computer program, for
computing some thermodynamic pa rameters and also amount of additional fuel in
iv

PERPUSTAKAAN TNIVUtSlTI PUTRA MALAYSIA
case where the solid waste ha ve unsufficient heating value. Options for designing
furnace and the auxiliary equipments of an incinerator can also be included.
v

Abstrak tesis yang dikemukaken kepada Senat, Uni versiti Putra Malaysia sebagai memenuhi sebahagian keperluan untuk ijazah Master Sains
PEMBANGUNAN ATURCARA KOMPUTER BAGI MENGANALISIS PRODUK KIMIA YANG DIHASILKAN DARI PENUNUAN
BAHAN API PEPEJAL
Oleh
HARIMI MOHAMED
April 2000
Pengerusi: Fuad Abas, Ir
Fakulti: Kejuruteraan
Pelbagai teknologi telah dibangunkan untuk membakar bahan api pepejal dan
sisa dengan cara yang berguna dari segi komersial. Pemangkin bagi pembangunanan
teknologi termasuk pengoptimuman pemulihan tenaga, pembiayaan skala ekonomi,
memaksimumkan aplikasi berpotensi bagi bahan api pepejal, dan mencapai
pematuhan peraturan-peraturan alam sekitar sekarang dan pada masa hadapan.
Objektifnya ialah untuk mengira kepekatan bagi 12 produk kimia pada suhu dan
udara lebih yang telah ditetapkan, dengan tekanan gas serombong menyeluruh
bersamaan deng an 1 atmosfera. Kepekatan tersebut boleh digunakan sebagai
pen un juk term odinam ik, bag i m en gurangkan k eluaran d engan meng organ isas i dan
menjalankan proses pembakaran secara sempu ma. Aturcara komputer tersebut juga
mengambil kira kemungkinan penambahan tugas penyelidikan.
Produk pembakaran termasuk karbon dioksida CO2, karbon monoksida CO,
wap air H20, hidrogen H2, sulfur dioksida S02, sulfur trioksida S03, nitrik oksida
NO, nitrogen dioksida N02, hidrogen klorida HCI, klorin Ch, oksigen O2 dan
nitrogen N2. Pembakaran kimia dan analisis keseimbangan adalah kandungan utama
vi

bagi penyelidikan ini. Bagi analisis pertama 6 persamaan telah dibuat kesimpulan
dari persamaan mol dan 6 persamaan yang lain telah dibuat kesimpulan dari analisis
yang kedua menggunakan permalar keseimbangan kimia. Kesemua 12 persamaan
tersebut berbentuk tidak lelurus. Oleh yang demikian, kaedah berangka telah
digunakan , iaitu kaedah lelaran Newton dipilih kerana sifat penumpuan yang cepat.
Keluaran (output) dari aturcara komputer ini dibandingkan dengan hasil
penyelidikan yang dilaksanakan oleh Institute of Nuclear Science (INS), yang
berasaskan penggunaan model yang telah dibangunkan bagi mengira keseimbangan
termodinamik kimia bagi satu sistem yang dibentuk dari sebatian dan unsur
terkandung dalam lignit lembangan Kolubare [Yugosla via] dan pembakaran udara,
kajian telah dibuat keatas lapan jenis lignit dalam keadaan pembakaran suhu 800 ke
1700 K, tekanan 1 atm , dan udara lebih 25 %. Keputusan-keputusan yang dihasilkan
dari pembakaran bahan api pepejal tersebut menunjukkan bahawa tidak ada
perbezaan yang ketara dari kedua-dua sumber [INS dan aturcara], dan dibuktikan
dengan mengguna kaedah statistik ujian-T. Mana-mana perbezaan keputusan yang
ketara didapati berubah -ubah dari satu sebatian kepada yang lain. Ini disebabkan
model-model yang berlainan yang digunakan dalam mengira keseimbangan kimia
dan bilangan produk yang digunakan. Keputusan yang diberikan oleh INS adalah
berhubung kait dengan lebih dari 12 anu j ika dibandingkan dengan peri sian
komputer yang telah dibangunkan.
Adalah dicadangkan untuk memasukkan persamaan tenaga ke dalam aturcara
komputer yang telah dibangunkan dari mana suhu adiabatik boleh dikira. Bagi
ketepatan aturcara komputer, sebatian lain boleh ditambah contohnya H, OH, H02,
vii
N20, HN02, H202, SO, N, ° dan C�. Di samping itu kelembapan dalam udara
perlu diambil kira. Subr utin tambahan boleh dimasukkan dalam aturcara komputer
bagi mengira parameter termodinamik dan kandungan bahan api tambahan dalam kes
di mana sisa pepejal mengandungi nilai haba yang tidak mencukupi. Reka bentuk
relau dan peralatan tambah bagi penunuan tersebut boleh dimasukkan juga.
viii
ACKNOWLEDGEMENTS
The author wishes to express his profound appreciation and gratitude to the
chairman of the super visory committee, Ir Fuad Abas for his excellent super vision,
in valuable guidance, continuous encouragement, constructi ve suggestions and
comments throughout the duration of this research study.
The author is indebted to the members of the supervisory committee, Dr. Mohd
Sapuan Salit and Dr Abul Hossain Mollah for their comments and suggestions.
A deep thank to the personnel in the Graduate School Office UPM, and to Dr.
Mohamed AI Awad of UNIT EN, without their support and encouragement it would
not ha ve been easy to finish my study and finally, all who ha ve helped directly or
indirectly.
ix

I certify that an Examination Committee met on 14th April 2000 to conduct the final examination of Harimi Mohamed on his Master of Science thesis entitled "Development of Computer Program to Analyse Combustion Products Resulting from Incineration of Solid Fuels" in accordance with Universiti Pertanian Malaysia (Higher Degree) Act 1980 and Universiti Pertanian Malaysia (Higher Degree) Regulations 1981. The Committee recommends that the candidate be awarded the relevant degree. Members of the Examination committee are as follows:
Nor Mariah Adam, Ph.D. Department of Mechanical and Manufacturing, Faculty of Engineering, Universiti Putra Malaysia. (Chairman)
Fuad Abas, PEngo Department of Mechanical and Manufacturing, Faculty of Engineering, Universiti Putra Malaysia. (Member)
Md. Abul Hossain Mollah, Ph.D. Department of Mechanical and Manufacturing, Faculty of Engineering, Universiti Putra Malaysia. (Member)
Mohd. Sapuan Salit, Ph.D. Department of Mechanical and Manufacturing, Faculty of Engineering, Universiti Putra Malaysia. (Member)
-
. G HAZALI MOHA YIDIN, Ph.D, ProfessorlDeputy Dean of Graduate School, Universiti Putra Malaysia
Date: 30 MAY 2000
x

This thesis submitted to the Senate of Uni versiti Putra Malaysia and was accepted as fulfilment of the requirements for the degree of Master of Science.
xi
Date : 1 3 JUL 2000
DECL ARATION
I hereby declare that the thesis is based on my original work except for quotations and citations which have been duly acknowledged. I also declare that it has not been previously or concurrently submitted for any degree at UPM or other institutions.
xii
:::A'-Harimi�ed Date: 25/05/2000

TABLE OF CONTENTS
Page
DEDICATION 11 ABSTRACT III ABSTRAK VI ACKNO WLEDGMENTS IX APPROV AL SHEETS X DECLARATION FORM XlI LIST OF TABLES xv LIST OF FIGURES XVI LIST OF ABBREVIATIONS XV111
CHAPTER
1 INTRODUCTION 1 1 1 Background of the Study 2 1 2 Statement of Problem 3 1 3 Objectives 6
2 LIT ERATU RE RE VIEW 7 2 1 I ntroductIOn 7 2 2 Flue Gas Analysis Experiment 7
2 2 1 Orsat Gas Analysis 7 2 2 2 Chromatographic Analysis 8 2 2 3 Laser Techniques for Analysis 8
2 3 Flue Gas EstImation Methods 9 2 3 1 Carbon MonoxIde and Dioxide Analysis 9 2 3 2 Sulfur Oxides Analysis 14 2 3 3 Nitroge n Oxides Analysis 1 8
2 4 Software Developed 27 2 4 1 Computer Programs of Thermochemical Parameters 27 2 4 2 Computer Programs of Kinetic Parameters 28 2 4 3 Computer Programs of Reaction mecha nisms 29 2 4 4 Computer Programs of ThermodynamIc Equilibnum 30 2 4 5 Computer Programs for MS W Incmeratlon 32
2 5 Co nclusIO n 34
3 CHE MICAL AND MATHEMATICAL ANA LYSIS 36 3 1 Chemical Combustion Analysis 36
3 1 1 Stoichiometric Combustion Analysis 37 3 1 2 Actual Combustion Analysis 40
3 2 Chemical Equilibrium A nalysis 43 3 2 1 ChemIcal Equilibnum Constants 43 3 2 2 Chemical Equilibrium ReactIo ns 47
3 3 Mathematical A nalysis 49
Xlll

4.
5 .
3 . 3 . 1 Equations from Conservation of mass . . , . . . . . . . . . . . . . . . . . . . . . . . 49 3 .3 .2 Equations from Equilibrium Constants . . . . . . . . . . . . . . . . . . . . . . . . . . 50 3 .3 .3 System of Equations to be Solved . . . . . . . . . . . . . . . . . . . . . . . . . . . . . . . 52 3 .3 .4 Numerical Method used . . . . . . . . . . . . . . . . . . . . . . . . . . . . . . . . . . . . . . . . . . 55
3 .4 General Algorithm and Flowchart Diagram . . . . . . . . . . . . . . . . . . . . . . . . . . . 59 3 .4. 1 General Algorithm Developed . . . . . . . . . . . . . . . . . . . . . . . . . . . . . . . . . . . 59 3 .4.2 Flowchart Diagram . . . . . . . . . . . . . . . . . . . . . . . . . . . . . . . . . . . . . . . . . . . . . . . . 6 1
3 . 5 Programming Language Used. . . . . . . . . . . . . . . . . . . . . . . . . . . . . . . . . . . . . . . . . . . . 63 3 .6 Method used to Test the Results . . . . . . . . . . . . . . . . . . . . . . . . . . . . . . . . . . . . . . . . 65
RESULTS AND DISCUSSION . . . . . . . . . . . . . . . . . . . . . . . . . . . . . . . . . . . . . . . . . . . . . 4. 1 Introduction . . . . . . . . . . . . . . . . . . . . . . . . . . . . . . . . . . . . . . . . . . . . . . . . . . . . . . . . . . . . . . . . 4.2 Results and Discussion for Major Constituent Species . . . . . . . . . . . . . . .
4.2. 1 Results Obtained . . . . . . . . . . . . . . . . . . . . . . . . . . . . . . . . . . . . . . . . . . . . . . . . . . .
67 67 68 68
4.2.2 Discussion of Results . . . . . . . . . . . . . . . . . . . . . . . . . . . . . . . . . . . . . . . . . . . . . 70 4.3 Results and Discussion for Minor Constituent Species . . . . . . . . . . . . . . . 72
4.3 . 1 Results Obtained . . . . . . . . . . . . . . . . . . . . . . . . . . . . . . . . . . . . . . . . . . . . . . . . . . . 72 4.3.2 Discussion of Results . . . . . . . . . . . . . . . . . . . . . . . . . . . . . . . . . . . . . . . . . . . . . 78
4.4 Analysis of NO x and Other Dissociation Products . . . . . . . . . . . . . . . . . . . 84 4.4. 1 Nitrogen Oxides Analysis . . . . . . . . . . . . . . . . . . . . . . . . . . . . . . . . . . . . . . . . 85 4.4.2 Sulfur Trioxide Analysis . . . . . . . . . . . . . . . . . , . . . . . . . . . . . . . . . . . . . . . . . . 87 4.4.3 Carbon Dioxide Dissociation Analysis . . . . . . . . . . . . . . . . . . . . . . . . 88 4.4.4 Water Vapor Dissociation Analysis . . . . . . . . . . . . . . . . . . . . . . . . . . . . . 9 1
4. 5 Practical Considerations . . . . . . . . . . . . . . . . . . . . . . . . . . . . . . . . . . . . . . . . . . . . . . . . . . 92 4.6 Closure . . . . . . . . . . . . . . . . . . . . . . . . . . . . . . . . . . . . . . . . . . . . . . . . . . . . . . . . . . . . . . . . . . . . . 93
CONCLUSION AND RECO MMENDATIONS . . . . . . . . . . . . . . . . . . . . . . . . . . . 5 . 1 Conclusion . . . . . . . . . . . . . . . . . . . . . . . . . . . . . . . . . . . . . . . . . . . . . . . . . . . . . . . . . . . . . . . . . . 5 .2 Recommendations . . . . . . . . . . . . . . . . . . . . . . . . . . . . . . . . , . . . . . . . . . . . . . . . . . . . . . . . .
95 95 97
REFERENCES . . . . . . . . . . . . . . . . . . . . . . . . . . . . . . . . . . . . . . . . . . . . . . . . . . . . . . . . . . . . . . . . . . . . . . . . . 99
APPENDIX
A Flowchart Diagram of the Developed Program . . . . . . . . . . . . . . . . . . 104 B Computer Program for Testing the Developed Program . . . . . . . 107 C Results Obtained from running the Developed Program . . . . . . . 1 1 2
VITA . . . . . . . . . . . . . . . . . . . . . . . . . . . . . . . . . . . . . . . . . . . . . . . . . . . . . . . . . . . . . . . . . . . . . . . . . . . . . . . . . . 1 52
xiv

LIST OF TABLES
Table Page
1 . 1 Varied Percentage Excess A ir used . . . . . . . . . . . . . . . . . . . . . . . . . . . . . . . . . . . 4
1 .2 Choices and Options used in the Program . . . . . . . . . . . . . . . . . . . . . . . . . . . 6
3 . 1 Notation used in the Analysis of Combustion . , . . . . . . . . . . . . . . . . . . . . 37
3 .2 Air Composition . . . . . . . . . . . . . . . . . . . . . . . . . . . . . . . . . . . . . . . . . . . . . . . . . . . . . . . . 38
3 .3 Parameters used for Chemical Equilibrium Constants . . . . . . . . . . . . 48
4. 1 Composition of the Raw Kolubara Coal (% by mass) . . . . . . . . . . . . . . 67
4.2 Percentage by Volume ofN2 from INS and Program . . . . . . . . . . . . . 68
4.3 Percentage by Volume of H20 from INS and Program . . . . . . . . . . . 69
4.4 Percentage by Volume of CO2 from INS and Program . . . . . . . . . . . . 69
4.5 Percentage by Volume of 02 from INS and Program . . . . . . . . . . . . . . 69
4.6 Percentage by Volume of S02 from INS and Program . . . . . . . . . . . . 69
4.7 Percentage by Volume of S02 from INS . . . . . . . , . . . . . . . . . . . . . . . . . . . . 74
4.8 ppm by Volume of S03 from INS . . . . . . . . . . . . . . . . . . . . . . . . . . . . . . . . . . . . 74
4.9 ppm by Volume of NO from INS . . . . . . . . . . . . . . . . . . . . . . . . . . . . . . . . . . . . 75
4. 10 Percentage by Volume of S02 from Program . . . . . . . . . . . . . . . . . . . . . . . 75
4. 1 1 ppm by Volume Of S03 from Program . . . . . . . . . . . . . . . . . . . . . . . . . . . . . . 75
4. 12 ppm by Volume of NO from Program . . . . . . . . . . . . . . . . . . . . . . . . . . . . . . . 76
4. 1 3 T -test Computation for S02 . . . . . . . . . . . . . . . . . . . . . . . . . . . . . . . . . . . . . . . . . . . 76
4. 1 4 T -test Computation for S03 . . . . . . . . . . . . . . . . . . . . . . . . . . . . . . . . . . . . . . . . . . . 77
4. 1 5 T-test Computation for NO . . . . . . . . . . . . . . . . . . . . . . . . . . . . . . . . . . . . . . . . . . . . 77
xv
LIST OF FIGURES
Figure Page
2. 1 Appropr iate Range ofMSW Inc inerators . . . . . . . . . . . . . . . . . . . . . . . . . . . . . . 1 1
4. 1 Percentage by Volume for N2 and O2 obta ined from INS and Program . . . . . . . . . . . . . . . . . . . . . . . . . . . . . . . . . . . . . . . . . . . . . . . . . . . . . . . . . . . . . . . . 70
4.2 Percentage by Volume for H20 and C02 obta ined from INS and Program . . . . . . . . . . . . . . . . . . . . . . . . . . .. . . . . . . . . . . . . . . . . . . . . . . . . . . . . . . . . . . . . . 71
4.3 Percentage by Volume for S02 obta ined from INS and Program . . . . . . 72
4.4 Percentage by Volume of S02 from INS and Program at Feed 1 & 2 . . . . . . . . . . . . . . . . . . . . . . . . . . . . . . . . . . . . . . . . . . . . . . . . . . . . ' " . . . . . . . . . . . . 78
4 .5 Percentage by Volume of S02 from INS and Program at Feed 3 & 4 . . . . . . . . . . . . . . . . . . . '" . . . . . . . . . . . . . . . . . . . . . . . . . . . . . . . . . . . . . . . . . . . . . 79
4.6 Percentage by Volume of S02 from INS and Program at Feed 5 & 6 . . . . . . . . . . . . . . . . . . . . . . . . . . . . , . . . . . . . . . . . , . ' " . . . . . . . . . . . . . . . . . . . . . . 79
4.7 Percentage by Volume of S02 from INS and Program at Feed 7 & 8 . . . . . . . . . . . . . . . . . . . . . . . . . . . . . . . . . . . . . . . . . . . . . . . . . . . . . . . . . . . . . . . . . . . 80
4.8 ppmv of S03 from INS and Program at Feed 1 & 2 . . . . . . . . . . . . . . . . . . . 8 1
4.9 ppmv of S03 from INS and Program at Feed 3 & 4 . . . . . . . . . . . , . . . . . . . 8 1
4. 10 ppmv of S03 from INS and Program at Feed 5 & 6 . . . . . . . . . . . . . . . . . . . 82
4. 1 1 ppmv of S03 from INS and Program at Feed 7 & 8 . . . . . . . . . . . . . . . . . . . 82
4. 12 ppmv of NO from INS and Program for Feed 1 to 4 . . . . . . . . . . , . . . . ' " 83
4. 1 3 ppmv of NO from INS and Program for Feed 5 to 8 . . . . , . . . . . , . '" . . . 84
4. 14 Generat ion of NO x . . . . . . . . . . . . . . , . . . . . . . . . . . . . . . . . . . . . . . , ' " . . . . . . . . , . . . . . . 85
4. 1 5 Percentage Convers ion ofN2 into NOx . . . . . . . . . . . . . . . . . . . . . . . . . . . . . . . . . 86
4. 1 6 Percentage of S02 Ox id ized to S03 . . . . . . . . . . . . . . . . . . . . . . . . . . . . . . '" . . . . . 88
4. 17 Combust ion Effic iency . . . . . . . . . . . . . . . . . . . . . . . . . . . . . . . . . . . . . . . . . . . . . . . . . . . . 89
xvi

4. 18 Percentage Dissociation of CO2 . . . . . . . . . . . . . . . . . . . . . . . . . . . . . . . . . . . . . . . . . . 90
4. 19 Percentage Dissociation of H20 . . . . . . . . . . . . . . . . . . . . . . . . . . . . . . . . . . . . . . . . . . 91
4.20 Enlargement of Scale of 02 Concentration for INS and Program. . . . 93
4.21 Enlargement of Scale ofN2 Concentration for INS and Program . . . 94
xvii

LIST OF ABBREVIATIONS
oc Probability at which, the Null Hypothesis Ho is rejected.
c Error tolerated when using the Newton's Method.
AIF Air Fuel Ratio.
Act Actual Condition.
A(i,j) Matrix which contains Partial derivatives ( Jacobi Matrix).
CARS Coherent Anti-stokes Raman Scattering.
CE Combustion Efficiency.
df Degree of Freedom used in Statistics.
Ej Elemental Composition of Element j .
Eqs Equation (s).
%EX Percentage Excess Air.
fi Mole Fraction of element i.
Fj Function which contains equation j .
8Fj l8Xi Partial Derivative of Function Fj with respect to Xi .
8F18X Jacobi Matrix incorporated in A(i,j).
�Go Free Energy Change.
Ho Null Hypothesis used in Statistics.
HA Alternative Hypothesis used in Statistics.
mo Standard Heat of Reaction.
mT Standard Enthalpy Change.
INS Institute of Nuclear Science.
K Chemical E quilibrium Constant / Degree in Kelvin.
K p Equilibrium Constant based on Partial Pressure.
xviii
KPi
LIF
MFi
MSW
MWi
m Wi
ni
NCi
Ncli
Nhi
Nji
NOi
P
ppmv
P tot, R
Equilib rium Constant for element i.
Laser-Induced Fluorescence.
Mass Fraction of Element i in the Reactants.
Mass Fract ion of Element i in the Products of Combust ion.
Mass Fraction of Molecule i.
Municipal Solid Waste.
Molecular We ight of Element i in Reactants.
Molecular We ight of Element i in Products of Combust ion.
Average Molecular We ight of Molecule i.
Total mole in Products / Nitrogen Atom.
Moles of Element i in Reactants.
Moles of Element i in Products of Combust ion.
Number of Carbon Atom in the Molecule i.
Number of Chlorine Atom in the Molecule i.
Number of Hydrogen Atom in the Molecule i.
Number of element j in the Molecule i.
Number of Oxygen Atom in the Molecule i.
Absolute Pressure.
Partial Pressure of element i in Products.
Part Per M ill ion by Volume.
Total Pressure ( 1 atm) and Gas Constant respectively.
RP and RC Results ob tained from Program and INS respect ively.
S l, S2 Standard Deviations from INS and Program respectively.
S e Standard Error.
Sp 2 Pooled Var iance Est imate.
xix
st
T
T-t est
Teal
,1X
Stoichiom etric Condition (% EX=O).
T emp eratur e of th e Produ cts of Combustion.
T est us ed to compar e two M eans in Statistics (Stud ent's t distribution).
T -t est Calculat ed.
T -t est tak en from Statistical Tabl e.
Mol e fraction as Yj us ed aft er r educing th e numb er of unknowns.
Solution obtain ed at it eration it.
Diff er enc e b etw een solution at it and it+ 1 .
Mol e fraction of compon ent i in th e products.
xx
CHAPTER I
INTRODUCTION
F or thousands of years the value of burning wastes has been recognized, both
to reduce the quantity of surplus materials generated by households, trades, and
agricultural practices, and to provide fuel for heating or cooking. Reco gnition of the
potential environmental problems generated by burning solid wastes also has a long
history.
According to Brunner ( 1984), the specific benefits of incineration include:
• The volume and weight of the waste is reduced to a fraction of its original size.
• Waste reduction is imme diate ; it does not require long-term residence in a
landfill or holding pond.
• Waste can be incinerated on-site, without having to be carted to a distant area.
• Air discharges can be effectively controlled for minimal impact on the
atmospheric environment.
• The ash residue is usually non-putrescible, or sterile.
• Technology exists to completely destroy even the most hazardous of materials in
a complete and effective manner.
• Incineration requires a relatively small disposal area, not the acres and acres
required for lagoons or land burial.
• Using heat recovery techniques the co st of operation can o ften be reduced or
offset by the use of or sale of energy.
2
Incineration will not solve all waste problems (Brunner, 1984), it has some
disadvantages which include:
• High capital cost.
• Skilled operators are required.
• Not all materials are incinerable.
• Some materials require supplemental fuel to attain mandated efficiency of
destruction.
1.1 Background of the Study
In the combustion of municipal solid waste [MSW] , it is necessary first to
understand the fundamentals of solid fuels and combustion issues. Those issues
recognize that solid waste is not a single fuel. Rather, it is a heterogeneous mixture of
widely dissimilar organic and inorganic materials which are thrown into a single
combustion chamber. The process of combustion (Tillman et aI. , 1989) is
manipulated through mechanical method, fuel blending and separation, physical
operation, and accomplished by careful attention to the chemistry of solid waste
oxidation. This last point is the main concern of this research.
It is necessary to develop a computer program which can compute the
product of combustion at several excesses of air and temperatures, so that it can be
seen clearly how each product reacts when some parameters are manipulated. The
produ cts of combustion under study include CO2, CO, H20, H2, S02, S03, HCl, Ch,
N2, O2, NO, and N02. Since we have 12 unknowns it is necessary that 12 equations
3
be solved analytically or numerically, depending on the complexity of the equations
used.
This study is divided into two parts; part one is concerned with chemical
analysis such as chemical reaction (combustion) analysis and the other is concerned
with chemical equilibrium analysis. In chemical reaction analysis we are concerned
with computing the stoichiometric air used for the combustion of solid fuels and
relating this amount of air by adding additional air. Therefore the stochiometric of
each element in the reactant is known, so that a mass balance or atom balance around
each element can be made. For the chemical equilibrium analysis, it includes six
chemical equilibrium reactions due to dissociation of C02, H20, S03, NO, N02 and
H20 +Ch and their reverse reactions due to oxidation of CO, H2, S02, N2, NO, HC I
respectively.
1.2 Statement of Problem
In this research, many variables are used and many unknowns exist. It is
preferable to speci fy those variables and unknowns for the clarity of the problem.
The variables used include :
Waste composition (mass fractions).
Excess air introduced.
Temperature of the products.
4
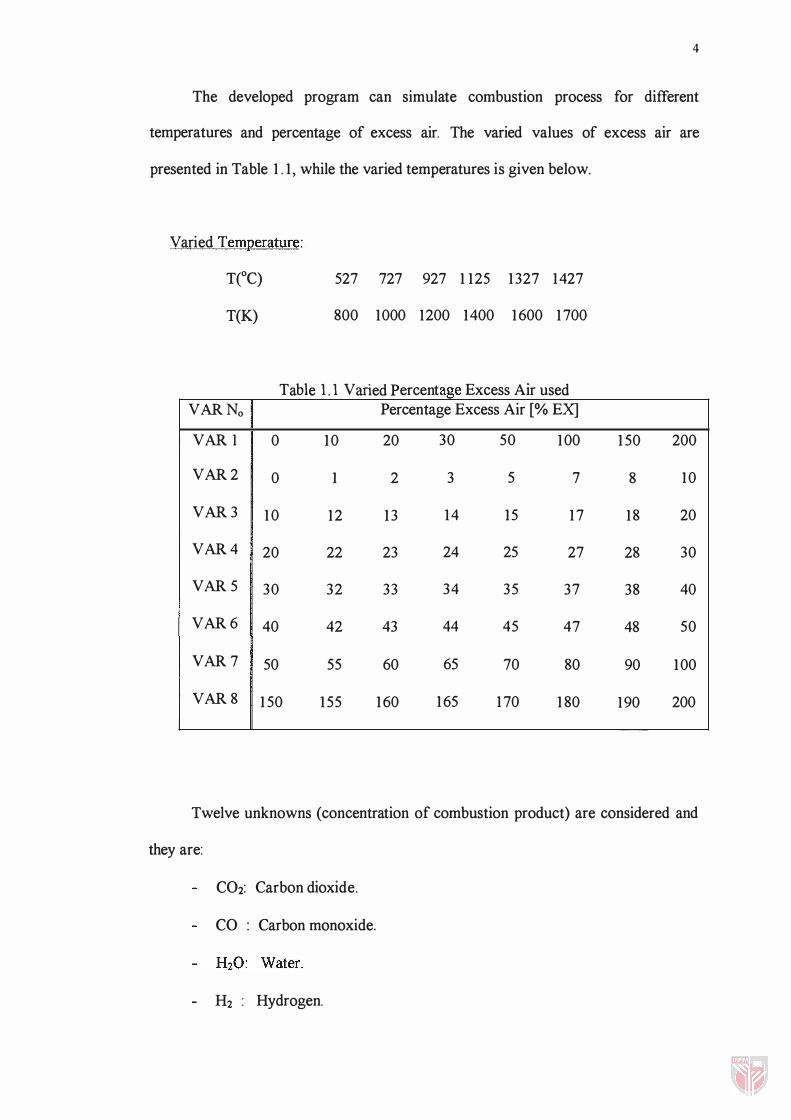
The developed program can simulate combustion process for different
temperatures and percentage of excess air. The varied values of excess air are
presented in Table 1 . 1 , while the varied temperatures is given below.
Varied Temperature:
T eC) 527 727 927 1 125 1 327 1427
T(K)
VAR No
VAR I
VAR 2
VAR 3
VAR 4
VAR 5
VAR 6
VAR 7
VAR 8
0
0
1 0
20
30
40
50
800 1000 1200 1400 1600 1700
T b Ill V .
d P a e . ane t E ercen age xcess Ai r use d Percentage Excess Air [% E X]
10 20 30 50 100
1 2 3 5 7
12 1 3 14 15 1 7
22 23 24 25 27
32 33 34 35 37
42 43 44 45 47
55 60 65 70 80
1 50 1 55 1 60 165 1 70 1 80
1 50 200
8 10
18 20
28 30
38 40
48 50
90 100
190 200
Twelve unknowns (concentration of combustion product) are considered and
they are:
CO2: Carbon dioxide.
CO : Carbon monoxide.
H2 : Hydrogen.


![core.ac.uk · pada suhu 250C dan tekanan 1 attn? (5 markah) [EKC 365] Kepekatan ozon didapati berada pada paras 118 gg/m3 di suatu stesen pengawasan. Berapakah kepekatan ozon tersebut](https://img.dokumen.tips/doc/110x75/60120a1c1f26933f01658e50/coreacuk-pada-suhu-250c-dan-tekanan-1-attn-5-markah-ekc-365-kepekatan-ozon.jpg)