Embed Size (px)
Citation preview
Alma Mater Studiorum - Università di Bologna
DOTTORATO DI RICERCA IN
SCIENZE CHIRURGICHE
Progetto n.1
“Metodologie di Ricerca nelle Malattie Vascolari”
Ciclo XXV
Settore Concorsuale di afferenza: 06/E1
Settore Scientifico-Disciplinare: MED22
DEVELOPMENT OF STRATEGIES
FOR VASCULAR DAMAGE REPAIR IN
PULMONARY ARTERIAL HYPERTENSION
Presentata da: Dott.ssa Silvia Cantoni
Coordinatore Dottorato : Relatore:
Chiar.mo Prof. Andrea Stella Chiar.mo Prof. Carlo Ventura
Correlatore:
Chiar.mo Prof. Nazzareno Galiè
Esame finale anno 2013

2

3
Abbreviations
5-HT, serotonin;
6MWD, 6 min-walk distance;
AgNOR, silver-stained Nucleolar Organizer Regions;
ALK1, activin-like kinase-type 1;
bFGF, fibroblast growth factor beta;
BMPR2, bone morphogenetic protein receptor type 2;
COPD, chronic obstructive pulmonary disease;
CTEPH, chronic thromboembolic pulmonary hypertension;
EGF, epidermal growth factor;
ERA, endothelin receptor antagonists;
ET-1, endothelin-1;
ETA, endothelin receptor A
ETB, endothelin receptor B
H&E, hematoxillin-eosin;
HPAH, Heritable pulmonary arterial hypertension;
IGF-1, insulin-like growth factor 1;
LV, Left Ventricle;
MCT, Monocrotaline;
mPAP, mean pulmonary arterial pressure ();
PAH, pulmonary arterial hypertension;
PAP, pulmonary arterial pressure;
PAR, pulmonary artery resistances;
PBMCs, Peripheral blood mononuclear cells;
PDE-5, phosphodyesterase type-5;
PDGF, platelet derived growth factor;

4
PH, Pulmonary hypertension;
PP, protein phosphatase;
RHC, right heart catheterization;
RV, right ventricle;
S, septum;
SAGE, Serial Analysis Gene Expression;
SSc-PAH, Scleroderma-associated pulmonary arterial hypertension;
TGF-beta or TGF-, transforming growth factor beta;
TNF-α, tumor necrosis factor-α;
VEGF, vascular endothelial growth factor.

5
Summary
Abbreviations ................................................................................................................ 3
1. Introduction ........................................................................................................................ 9
1.1. Definition and hemodynamic classification of Pulmonary Hypertension ....................... 9
1.1. Clinical classification of PH .......................................................................................... 9
1.2. Group I: PAH ............................................................................................................. 10
1.2.1. Epidemiology of PAH ............................................................................................. 12
1.2.2. Histopathology of PAH .......................................................................................... 12
1.2.3. Pathobiology of PAH ............................................................................................. 14
Endothelial dysfunction .................................................................................................. 15
Vascular remodeling ....................................................................................................... 17
Inflammatory process ..................................................................................................... 17
Thrombosis and platelet dysfunction .............................................................................. 19
1.2.4. Genetic .................................................................................................................. 20
1.2.5. Diagnosis and Clinical presentation of PAH ........................................................... 21
1.2.6. Pathophysiology of PAH ........................................................................................ 22
1.2.7. Current available therapies .................................................................................... 22
Prostanoids .................................................................................................................... 23
Endothelin Receptor Antagonists ................................................................................... 25
Phosphodiesterase Type-5 Inhibitors ............................................................................. 25
Combination Therapy ..................................................................................................... 26
1.2.8. Lung transplantation .............................................................................................. 26
1.2.9. Animal models in PAH ........................................................................................... 27
Chronic hypoxia ............................................................................................................. 27
Monocrotaline injury ....................................................................................................... 29
1.3. Smooth muscle cells ................................................................................................. 29

6
1.4. Platelet-derived growth factor pathway ...................................................................... 31
1.5. Histone deacetylase enzymes ................................................................................... 33
1.6. Histone deacetylase inhibitors ................................................................................... 34
1.7. Peripheral blood mononuclear cells ........................................................................... 35
2. Aim of the study ............................................................................................................... 37
2.1. In vitro animal studies ................................................................................................ 37
2.2. In vivo animal studies ................................................................................................ 37
2.3. Patients’ blood related studies ................................................................................... 37
3. Material and Methods ....................................................................................................... 39
3.1. In vitro animal studies ................................................................................................ 39
3.1.1. Reagents and antibodies ....................................................................................... 39
3.1.2. Cell isolation and culture conditions ....................................................................... 39
3.1.3. In vitro model of hyper-proliferation: experimental plan .......................................... 40
3.1.4. Cell proliferation and viability ................................................................................. 40
3.1.5. Immunofluorescence ............................................................................................. 40
3.1.6. Cell cycle analysis ................................................................................................. 41
3.1.7. Gene expression ................................................................................................... 41
3.1.8. SDS-PAGE and Western Blotting .......................................................................... 41
3.1.9. Electron microscopy .............................................................................................. 42
3.1.10. Mitosis analysis ................................................................................................... 42
3.1.11. Nucleolar Organizer Regions Silver morphometric analysis ................................. 42
3.1.12. Wound healing assay .......................................................................................... 43
3.1.13. Pulmonary artery ring assay ................................................................................ 43
3.1.14. Immunoprecipitation assay .................................................................................. 43
3.1.15. Statistical analysis ............................................................................................... 44
3.2. In vivo animal studies ................................................................................................ 44
3.2.1. Ethics Statement ................................................................................................... 44
3.2.2. Monocrotaline model of PAH in rats ...................................................................... 44

7
3.2.3. Study design.......................................................................................................... 44
3.2.4. BU administration .................................................................................................. 45
3.2.5. Assessment of right ventricular hypertrophy .......................................................... 45
3.2.6. Histological analyses ............................................................................................. 45
3.2.7. Statistical analysis ................................................................................................. 47
3.3. Patients’ blood related studies ................................................................................... 47
3.3.1. Study design.......................................................................................................... 47
3.3.2. Patient and healthy volunteers enrolment .............................................................. 48
3.3.3. Peripheral Blood Mononuclear Cells isolation ........................................................ 48
3.3.4. Serial Analysis Gene Expression (SAGE) library construction ............................... 49
Description of the procedure: ......................................................................................... 49
3.3.5. Quality and control of SAGE library ....................................................................... 51
3.3.6. Statistical analysis ................................................................................................. 52
4. Results ............................................................................................................................. 53
4.1. In vitro animal studies ................................................................................................ 53
4.1.1. Proliferation and viability assays ............................................................................ 53
4.1.2. Cell cycle analysis ................................................................................................. 54
4.1.3. Ultrastructural and morphometric analyses ............................................................ 55
4.1.4. Gene and protein expression analyses .................................................................. 56
4.1.5. Migration assays ................................................................................................... 58
4.1.6. Mechanism of action .............................................................................................. 59
4.2. In vivo animal studies: preliminary results ................................................................. 61
4.3. Patients’ blood related studies: preliminary results .................................................... 63
5. Discussion ........................................................................................................................ 70
5.1. In vitro animal studies ................................................................................................ 70
5.2. In vivo animal studies ................................................................................................ 71
5.3. Patients’ blood related studies ................................................................................... 72
6. Conclusions ...................................................................................................................... 74

8
7. References ....................................................................................................................... 75

9
1. Introduction
1.1. Definition and hemodynamic classification of Pulmonary
Hypertension
Pulmonary hypertension (PH) is a pathophysiological condition characterized by an increase of
pulmonary artery resistances (PAR) and consequent elevation of the right ventricular afterload lead to
right ventricular failure.
The definition of PH correspond to an elevation in pulmonary arterial pressure (PAP) mean ≥25
mmHg at rest. This is an arbitrary definition based on the PAP mean value, which is the least varying
parameter and it require a direct measurement trough right heart catheterization (RHC).
Actually, an increase of PAP mean ≥25 mmHg it occur in numerous clinical conditions
characterized by physiopathological and hemodynamic aspects, then it has been purposed an
hemodynamic classification to discriminate PH (Table 1)
Table 1. Haemodynamic Definitions of Pulmonary Hypertensiona
Definition Characteristics Clinical Groups
Pulmonary hypertension (PH)
Mean PAP ≥25 mmHg All
Pre-capillary PH Mean PAP ≥25 mmHg; PWP ≤15 mmHg; CO normal or reduced
b
Pulmonary arterial hypertension; PH due to lung diseases; Chronic thromboembolic PH; PH with unclear and/or multifactorial mechanisms
Post-capillary PH Mean PAP ≥25 mmHg, PWP >15 mmHg, CO normal or reduced
b
PH due to left heart disease: Passive TPG ≤12 mmHg Reactive (out of proportion) TPG >12 mmHg
CO indicates cardiac output; PAP, pulmonary arterial pressure; PH, pulmonary hypertension; PWP, pulmonary wedge pressure;
TPG, transpulmonary pressure gradient (mean PAP—mean PWP)
a All values measured at rest.
b According to Table 2.
1.1. Clinical classification of PH
The PH can be attributed to several clinical conditions, as well as in left heart diseases, in
parenchymal pneumopathies, pulmonary vascular mechanical obstructions, but it can be caused by a
pathological process of pulmonary circulation independently by any other reasons.
Each of these conditions is characterized by peculiar physiopathological and clinical aspects
then a classification based on hemodynamics parameters results limited for both diagnostic and
therapeutic point of views. For this reason physicians expert in PH formulate a clinical classification
forwarded to group conditions characterized by common histopathological and physiopathological

10
aspects in addition to similarities in clinical presentation, therapeutic strategy and prognostic evolution.
The clinical classification of PH has gone through a series of changes since the first version was
proposed in 1973 at the first international conference on primary PH endorsed by the World Health
Organization. The current clinical classification, derived from the 4th World Symposium on PH held in
2008 in Dana Point, California is shown in table 2. Very recently the 5th World Symposium is held in
Nice 2013, then this classification will probably modified.
The Dana Point classification aims to distinguish pulmonary arterial hypertension (PAH)
conditions including all type of PH where the increase of PAP are related to micropulmonary circle
disease (group I) from the other conditions where the increase of PAP is consequence of diseases as
left ventricular systolic or diastolic failure and valves diseases (Group 2), pulmonary parenchyma
disease and/ or hypoxemia (Group 3), chronic thromboembolic PH (CTEPH) (Group 4) and PH due to
unclear and/or multifactorial mechanisms (Group 5).
This clinical classification is essential also to guarantee a correct communication between
clinicians, in order to standardize diagnosis and treatment, to perform controlled clinical trial, and
finally to analyze novel pathobiological alterations in specific patient cohorts.
This research is focused on aspects related to the first group of clinical classification.
1.2. Group I: PAH
PAH includes an heterogenic group of diseases characterized by a progressive increase of
pulmonary vascular resistance leading to right ventricular failure and premature death [1]. The
prognosis of PAH is severe, prior to the advent of modern therapies, life expectancy for adults with
idiopathic PAH was 3 years from diagnosis; for children, it was 10 months [2].
PAH in adults includes at least nine clinical subgroups with virtually identical obstructive
pathologic changes (table 2) in the distal pulmonary arteries: idiopathic, heritable, drug- and toxin-
induced, associated with connective tissue diseases, HIV infection, portal hypertension, congenital
heart disease, schistosomiasis, and chronic hemolytic anemia [3].
All type of PAH are characterized by abnormalities in pulmonary vascular biology in each
compartment of the blood vessel, defined pulmonary hypertensive arteriopathy. The lumen has a
prothrombotic diathesis, the endothelium displays an excessive production of vasoconstrictors relative
to vasodilators, as well as an increase of mitogenic mediators. Vascular cells increase their
proliferation and migration leading to a progressive reduction of vascular lumen [4]. Despite PAH has
origin at pulmonary vascular level, the clinical symptoms and severe prognosis are principally related
to right ventricle failure.

11
Table 2. Updated Clinical Classification of Pulmonary Hypertension (Dana Point, 2008)
1 - Pulmonary arterial hypertension (PAH)
1.1 Idiopathic PAH
1.2 Heritable
1.2.1 BMPR2
1.2.2 ALK1, endoglin (with or without hereditary haemorrhagic telangiectasia)
1.2.3 Unknown
1.3 Drugs and toxins induced
1.4 Associated with (APAH):
1.4.1 Connective tissue diseases
1.4.2 HIV infection
1.4.3 Portal hypertension
1.4.4 Congenital heart disease
1.4.5 Schistosomiasis
1.4.6 Chronic haemolytic anaemia
1.5 Persistent pulmonary hypertension of the newborn
1’ Pulmonary veno-occlusive disease and/or pulmonary capillary haemangiomatosis
2 - Pulmonary hypertension due to left heart disease
2.1 Systolic dysfunction
2.2 Diastolic dysfunction
2.3 Valvular disease
3 - Pulmonary hypertension due to lung diseases and/or hypoxia
3.1 Chronic obstructive pulmonary disease
3.2 Interstitial lung disease
3.3 Other pulmonary diseases with mixed restrictive and obstructive pattern
3.4 Sleep-disordered breathing
3.5 Alveolar hypoventilation disorders
3.6 Chronic exposure to high altitude
3.7 Developmental abnormalities
4 - Chronic thromboembolic pulmonary hypertension
5 - PH with unclear and/or multifactorial mechanisms
5.1 Haematological disorders: myeloproliferative disorders, splenectomy
5.2 Systemic disorders, sarcoidosis, pulmonary Langerhans cell histiocytosis, lymphangioleiomyomatosis,
neurofibromatosis, vasculitis
5.3 Metabolic disorders: glycogen storage disease, Gaucher disease, thyroid disorders
5.4 Others: tumoral obstruction, fibrosing mediastinitis, chronic renal failure on dialysis
ALK-1 indicates activin receptor-like kinase 1 gene; APAH, associated pulmonary arterial hypertension; BMPR2, bone
morphogenetic protein receptor, type 2; HIV, human immunodeficiency virus; PAH, pulmonary arterial hypertension.

12
1.2.1. Epidemiology of PAH
The PAH disease is a rare clinical condition and represent only the 3.5% of all form of PH. The
most frequently clinical conditions responsible for the elevation of PAP are left heart diseases (Group
2) and diseases of pulmonary parenchyma (Group 3), corresponding to 78% and 10% of cases with
PH respectively.
The epidemiologic characteristics of Idiopathic-PAH (IPAH) are recently analyzed in some
national registries. Data relatives to French Registry [5] documented that females are predominant
within IPAH patients, with a ratio females/males of 1.9/1. PAH affects a relatively young patient
population (average age of 50 years) when compared with the more common thoracic organ diseases
such as coronary artery disease and chronic obstructive lung disease. Within PAH, idiopathic form is
the most frequent (39.2%), instead of it is documented that the heritable form (HPAH) is only 3.9% of
cases. Considering the PAH associated to secondary diseases the most frequent are connective
tissue diseases (15.3%) expecially Sclerodermia (SSc-PAH), besides congenital heart diseases
(11.3%), portal hypertension (10.4%), drug- and toxin-induced (9.5%) and HIV infection (6.2%). In this
registry the minimum prevalence of PAH and IPAH are 15 and 5.9 cases/ per million of adult
population/ year, respectively.
The epidemiological data emerging from the Scottish Registry [6], the second European registry,
and data from other studies confirmed that the prevalence of PAH, totally, ranges from ranges from 15
to 50 patients per million population [7, 8].
1.2.2. Histopathology of PAH
Albeit the clinical, hemodynamic, and prognostic aspects of different type of PAH belonging the
Group I of PH are heterogeneous, the histopathological substrate is virtually indistinguishable and
characterized by proliferative and obstructive lesions of pulmonary vascular structures defined as
pulmonary hypertensive arteriopathy [9]. This is a pathological process that involves primarily the
distal pulmonary arteries, in particular muscularized pre- and intra-acinar arteries (resistance vessels),
but it can involve also venous and capillary vessels.
The arteriopathy induces structural alterations including tunica media hypertrophy, tunica intima
thickening, tunica adventitia thickening, complex obstructive endoluminal lesions with
reparative/proliferative characteristic [10].
The tunica media hypertrophy is responsible for the increase in the transversal section wall area
of pre-acinar muscularized pulmonary arteries. All type of PAH are characterized by this process, its
extension and severity can change for each condition. Hypertrophy and hyperplasia of both smooth

13
muscle and fibroblast cells contribute to ‘neointima’ formation. Interestingly, even the partially- and
non-muscularized arterioles can origin neo-muscularized layer. Rarely, this is the only vascular lesion
present, and the histological condition is defined ‘isolated hypertrophy of tunica media’, however most
frequently it is associated to thickening and fibrosis of tunica intima.
In addition, all type of PAH are characterized by the thickening of tunica intima, due to an
increase of proliferative capacities of cells that lead to a reduction of lumen until occlusion of vessel.
The ultrastructural and immunohistochemical analyses in several reports have revealed that the
intimal cells have typical characteristic of fibroblasts, myofibroblasts and smooth muscle cells. The
increase in intima can be concentric laminar, eccentric of non-laminar concentric. All this type of
thickening can be generate occlusion of the arteriole.
The thickening of tunica adventitia is frequent in all types of PAH and contribute to a reduction in
elasticity of vessel wall. This phenomenon is caused by the expansion of perivascular connective
tissue and it stimulated by growth factors which are activated by serum elastases produced in smooth
muscle cells (SMCs) of fibrocellular tissue.
The complex endoluminal lesions are the structural alteration of vessels. They are distinguished
in reparative and proliferative lesion and included the plexiform lesions, angiomatoid lesions, and
necrotizing arteritis.
The plexiform lesions are morphologically comparable to renal glomeruli, they are constituted by
a plexus of capillaries and frequently they are associated to thrombi. They are characterized by highly
proliferative endothelial cells (including monoclonal proliferation) [11] surrounded by myofibroblasts,
SMCs and connective tissue. Although the plexiform lesion can occur at various sites within the lung
one distinctive presentation is within an aneurysmal dilatation of a small arterial branch close to its
origin from the parent vessel. The branch containing the plexiform lesion has been called a
supernumerary artery and characteristically originates at right angles to the parent vessel. When
plexiform lesions occur in a supernumerary artery, concentric laminar intimal fibrosis is consistently
found close to its origin. Moreover, distal to the plexiform lesion is a constellation of thin vessels
dilated and tortoises (varicose lesions) which make-up the so-called ‘dilatation’ or ‘angiomatoid’
lesions [12].
The necrotizing arteritis is generally associated to severe PAH. It is characterized by segmental
fibrinoid necrosis of muscular pulmonary arterioles and inflammatory cells infiltration.
The incidence of plexiform lesions varies from 20 to 90% of PAH patients. Although the lesion
may be detected in low numbers (0.1 to 1 1 lesions/cm2 or 5% of the pulmonary arteries), the
plexogenic form bears a poor prognosis. their presence denote a severe obstructive vasculopathy.
The pathogenesis of this type of lesions in controversial, in fact it not clear if they represent a sort of

14
unspecific cellular proliferation or an attempt of compensatory neovascularization in response to an
hypoxic condition or local ischemia.
Thrombotic lesions in situ and parietal thrombosis are additional histological hallmarks of
pulmonary hypertensive arteriopathy. The thrombotic lesions involve prevalently small arteries and
pulmonary venules. The parietal thrombosis involve elastic type of pulmonary arteries, usually it is a
secondary condition to several factors including vascular dilatation, presence of intimal atherosclerotic
lesions, and plasmatic prothrombotic factors, as well as perivascular inflammatory infiltrate composed
principally by macrophages and lymphocytes.
1.2.3. Pathobiology of PAH
The pathobiology of the distal pulmonary arteries in PAH patients is multifactorial and involves
various biochemical pathways and cell types (Figure 1).
Excessive vasoconstriction has been related to abnormal function or expression of potassium
channels in the SMCs [13] and to endothelial dysfunction [14].
Figure 1. Pathobiology of PAH. Cellular and molecular mechanism of disease induction. Image from Schermuly RT et al., Nat Rev Cardiol. 2011

15
Endothelial dysfunction leads to chronically impaired production of vasodilator and
antiproliferative agents such as nitric oxide and prostacyclin, along with over-expression of
vasoconstrictor and proliferative substances such as thromboxane A2 and endothelin [14]. Many of
these abnormalities both elevate vascular tone and promote vascular remodeling by proliferative
changes that involve several cell types, including endothelial and as well as fibroblasts. In addition, in
the adventitia, there is increased production of extracellular matrix including collagen, elastin, and
fibronectin and of matrix-bound smooth muscle cell mitogens, such as basic fibroblast growth factor.
Other matrix metalloproteases can stimulate the production of tenascin, a smooth muscle cell
mitogenic cofactor. Several additional growth factors including vascular endothelial growth factor,
platelet-derived growth factor, insulin-like growth factor-1, and epidermal growth factor have been
implicated in the development of remodeling and all have been reported to be increased (the molecule
and/or the specific receptors) in the lung and/or in the blood of PAH patients. Reduced plasma levels
of other vasodilator and antiproliferative substances such as vasoactive intestinal peptide have also
been demonstrated. Angiopoietin-1, an angiogenic factor essential for vascular lung development,
seems to be up-regulated in cases of PAH correlating directly with the severity of the disease.
Receptors of the bone morphogenetic protein pathway, involved in cellular proliferation and apoptosis,
are down-regulated and/or malfunctioning in the lung vasculature of both heritable and acquired PAH.
Inflammatory cells, cyto- and chemokines, and platelets (through the serotonin pathway) may also
play a significant role in PAH. Prothrombotic abnormalities have been demonstrated in PAH patients
and thrombi are present in both the small distal pulmonary arteries and in proximal elastic pulmonary
arteries.
K+ channels are important in modulating both vessel tone and smooth muscle cell proliferation.
The reduced expression and the malfunction of voltage-dependent k+ channels in IPAH patients [13]
lead to an inhibition of transmembrane currents of K+ and therefore the depolarization of cellular
membrane; this induces the activation of contractile apparatus and pulmonary artery vasoconstriction
through enabling the increase in cytoplasmic calcium (Ca2+). Moreover, the intracellular accumulation
of Ca2+ in cytosol induces smooth muscle cell proliferation. Remain to discover if the changes in the
expression of K+ channels are caused by a genetic modification at origin of the disease or if they
occurred as a consequence of PAH. In this sense it has been demonstrated that some anorexiant
drugs (dexfenfluramine and aminorex) are direct blockers of specific subtypes of K+ channels [15].
Endothelial dysfunction
Several studies have characterized the histological changes occurring in the endothelial cells of
both large and small vessels in response to chronic PH [16]. In chronic hypoxic PH, increases in
16
intimal thickness secondary to hypertrophy and hyperplasia is observed in both the endothelial and
subendothelial layers.
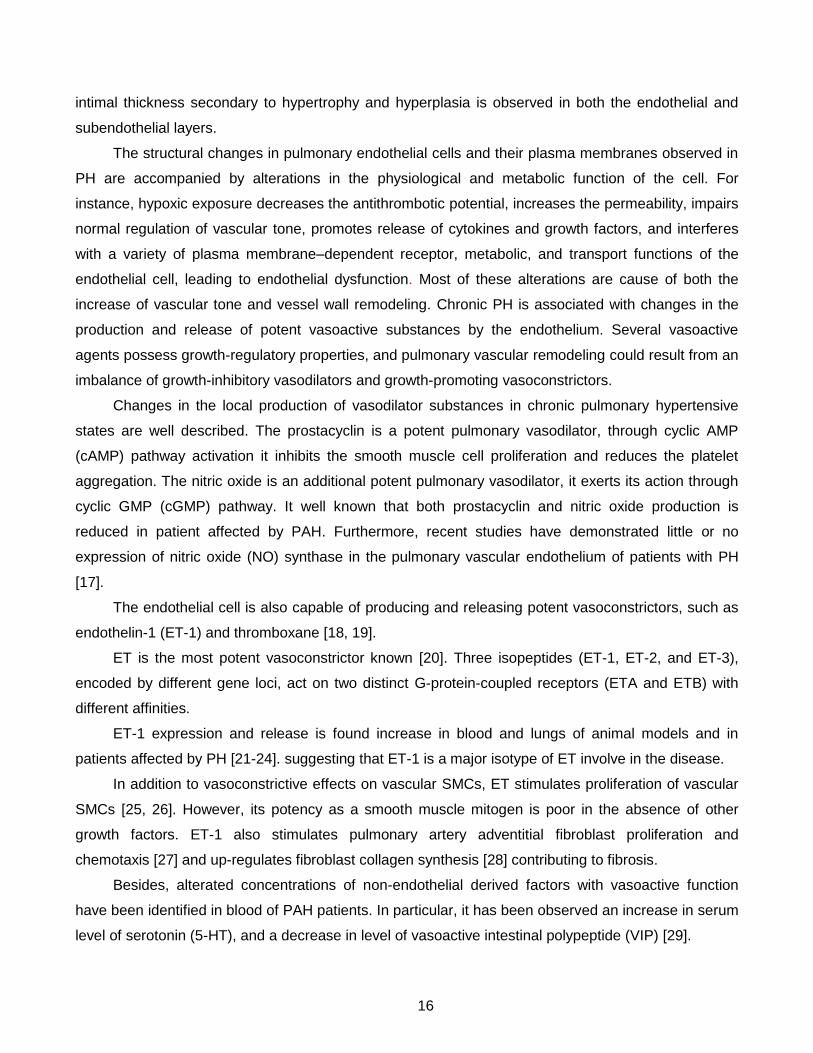
The structural changes in pulmonary endothelial cells and their plasma membranes observed in
PH are accompanied by alterations in the physiological and metabolic function of the cell. For
instance, hypoxic exposure decreases the antithrombotic potential, increases the permeability, impairs
normal regulation of vascular tone, promotes release of cytokines and growth factors, and interferes
with a variety of plasma membrane–dependent receptor, metabolic, and transport functions of the
endothelial cell, leading to endothelial dysfunction. Most of these alterations are cause of both the
increase of vascular tone and vessel wall remodeling. Chronic PH is associated with changes in the
production and release of potent vasoactive substances by the endothelium. Several vasoactive
agents possess growth-regulatory properties, and pulmonary vascular remodeling could result from an
imbalance of growth-inhibitory vasodilators and growth-promoting vasoconstrictors.
Changes in the local production of vasodilator substances in chronic pulmonary hypertensive
states are well described. The prostacyclin is a potent pulmonary vasodilator, through cyclic AMP
(cAMP) pathway activation it inhibits the smooth muscle cell proliferation and reduces the platelet
aggregation. The nitric oxide is an additional potent pulmonary vasodilator, it exerts its action through
cyclic GMP (cGMP) pathway. It well known that both prostacyclin and nitric oxide production is
reduced in patient affected by PAH. Furthermore, recent studies have demonstrated little or no
expression of nitric oxide (NO) synthase in the pulmonary vascular endothelium of patients with PH
[17].
The endothelial cell is also capable of producing and releasing potent vasoconstrictors, such as
endothelin-1 (ET-1) and thromboxane [18, 19].
ET is the most potent vasoconstrictor known [20]. Three isopeptides (ET-1, ET-2, and ET-3),
encoded by different gene loci, act on two distinct G-protein-coupled receptors (ETA and ETB) with
different affinities.
ET-1 expression and release is found increase in blood and lungs of animal models and in
patients affected by PH [21-24]. suggesting that ET-1 is a major isotype of ET involve in the disease.
In addition to vasoconstrictive effects on vascular SMCs, ET stimulates proliferation of vascular
SMCs [25, 26]. However, its potency as a smooth muscle mitogen is poor in the absence of other
growth factors. ET-1 also stimulates pulmonary artery adventitial fibroblast proliferation and
chemotaxis [27] and up-regulates fibroblast collagen synthesis [28] contributing to fibrosis.
Besides, alterated concentrations of non-endothelial derived factors with vasoactive function
have been identified in blood of PAH patients. In particular, it has been observed an increase in serum
level of serotonin (5-HT), and a decrease in level of vasoactive intestinal polypeptide (VIP) [29].

17
The 5-HT is produced by intestinal enterochromaffin cells and stored in platelets, it induces
vasoconstriction and it stimulates pulmonary vascular smooth muscle cell proliferation, instead of the
VIP is a neurotransmitter which induces systemic and pulmonary vasodilation through the activation of
cGMP and cAMP systems; in addition, VIP inhibits SMC proliferation and platelet aggregation.
Vascular remodeling
Albeit the pulmonary vasoconstriction is a primary condition in pulmonary hypertensive
vasculopathy development, the vascular remodeling is currently considered a key element in the
pathogenesis of PAH. In fact, many factor related to vascular tone modulation are strictly involved in
other processes, as well as proliferation, inflammation and thrombosis [30].
The vascular remodeling involves changes in all three levels of the vessel wall: the adventitia,
media, and intima (luminal side). Thus, at the cellular level, the process involves all type of vessel cell:
the fibroblasts, smooth muscle cells, and endothelial cells [4, 15]. The intermediate cell and the
pericytes (present in the small, partially muscularized and unmuscularized vessels, respectively) are
also prominent in the remodeling process; actually, they can be stimulated to differentiate and
proliferate under various normal and abnormal conditions. The principal histopathological hallmarks of
vascular remodeling are medial smooth muscle hypertrophy, distal smooth muscle proliferation with
neomuscularization of small pulmonary vessels, and mild intimal changes.
Longitudinal bundles of SMCs have been described in all three layers of the vessel [31].
Several studies in patient with severe PAH have also disclosed significant adventitial changes
with deposition of collagen and extracellular matrix, marked intimal proliferation, unique endothelial
cell changes, and plexogenic lesions [9, 11, 32].
At biomolecular level it is note that many growth factors are involved in vascular remodeling.
An increased expression of vascular endothelial growth factor (VEGF), platelet derived growth
factor (PDGF), fibroblast growth factor beta (bFGF), insulin-like growth factor 1 (IGF-1) and epidermal
growth factor (EGF), angiopoietin-1, an angiogenic factor essential for the development of pulmonary
vascular system, have been found in tissues of PAH patients [15, 33].
Inflammatory process
The concept that immunological reactions in PH play a significant role in the development and
worsening of the disease is now well accepted. Autoimmune infiltration of immune cells and
inflammatory reactions have been shown to contribute to the pathogenesis of IPAH [34].
Inflammatory processes are prominent in IPAH, but also in PAH related to more classical forms
of inflammatory syndromes, such as connective tissue diseases, HIV infection, or other viral etiologies
[35]. Indeed, a clinical improvement after immunosuppressive therapy is obtained in patients with PAH

18
associated to systemic inflammatory diseases, as well as tissue connective diseases, in particular
SSc-PAH and lupus erythematous [34]. Similarly, inflammation seems to play a significant role in
experimental animal models of PH.
Inflammation is an adaptive response that is triggered by deleterious stimuli and conditions, such
as infection and tissue injury [36]. It is characterized by the sequential release of cytokines,
chemokines and growth factors that regulate increased vascular permeability and recruitment of
leukocytes.
Increased vascular permeability also results in extravasation of plasma proteins, which further
amplify the inflammatory reaction.
Figure 2. Schematic illustration of infection-mediated and inflammation-mediated vascular remodelling: In response to infection and inflammatory events, lung vascular cells produce inflammatory mediators (chemokines and cytokines), thereby recruiting the inflammatory cells (macrophages, dendritic cells, mast cells, B-cells, T-cells and regulatory T-cells). With the coordination of inflammatory mediators, inflammatory cells may perpetuate the release of cytokines, chemokines and growth factors. Finally, these processes lead to vascular remodeling though matrix remodelling, collagen deposition, vascular cell proliferation, migration, and in situ thrombosis. CCL2, chemokine (C-C motif) ligand 2; CCL5, chemokine (C-C motif) ligand 5 or RANTES (regulated upon activation, normal T-cell expressed and secreted); CX3CL1, chemokine (C-X3-C motif) ligand 1 (fractalkine); CX3CR1, chemokine (C-X3-C motif) receptor 1; EC, endothelial cells; FB, fibroblasts; FGF, fibroblast growth factor; IL-1, interleukin-1; IL-6, interleukin 6; MCP-1, monocyte chemotactic protein-1; PDGF, plateletderived growth factor; PAH, pulmonary arterial hypertension; SDF-1a, stromal cell-derived factor 1a; SMC, smooth muscle cells; TNF-a, tumour necrosis factor-a; Treg cell, regulatory T-cell; VEGF, vascular endothelial growth factor. Image from Pullamsetti SS et al. Clinical Microbiology and Infection, 2011.

19
Inflammation is an adaptive response for restoring homeostasis, however, when it persists
(chronic inflammation), it can cause tissue damage and loss of function. Chronic inflammation may
occur because of the persistence of infection or antigen, recurring tissue injury, or a failure of
endogenous anti-inflammatory mechanisms [36].
In the PAH context (Figure 2), the inflammatory and immune components of structurally altered
vessels includes circulating monocytes, neutrophils, dendritic cells, macrophages and lymphocytes, as
well as fibroblasts, resident endothelial cells and smooth muscle cells. Presumably, circulating cells
are directed to the sites of injury, adhere to or come close to endothelial cells, invade the internal
elastic lamina, and release a variety of inflammatory mediators.
These substances that act on the local environment and promote chemotaxis, can be derived
also from plasma proteins or secreted by resident cells of the vasculature. They can be vasoactive
amines, vasoactive peptides, fragments of complement components, lipid mediators, cytokines,
chemokines or proteolytic enzymes [37, 38]. Chemotactic cytokines play a role in leukocyte
recruitment and trafficking in PH, such as rolling, activation, adhesion and extravasation into the
inflamed tissue along a chemoattractant gradient involving chemokines (soluble, secreted basic
proteins).
Released cytokines and growth factors produce the effects of inflammation by mediating
communication between and among circulating and resident vascular cells. Finally, all of these
interactions result in vascular remodelling through matrix remodelling, collagen deposition,
proliferation and migration of all vascular cell types [38].
Patients with idiopathic or associated PAH exhibit higher circulating levels and pulmonary
expression of IL-1b, IL-6 and tumor necrosis factor-α (TNF- α) than healthy controls [39].
Thrombosis and platelet dysfunction
Two additional processes involved in the pathogenesis of pulmonary hypertensive vasculopahty
are thrombosis and platelet dysfunction. Thrombolysis and thrombotic lesions in pulmonary
microcirculation and in elastic pulmonary arteries have been found in PAH patients [4]. It is evident
that the presence of alterated coagulation process, platelet and endothelial dysfunctions can favor the
development and the progression of thrombosis in situ.
High serum level of D-dimer (degradation product of fibrin), fibrinopeptide A (thrombin activity
indicator) [40], and an increase in urinary excretion of thromboxane A2 metabolites (platelet activation
index) [41] are altogether elements indicating thrombotic diathesis.
The platelet dysfunction role in PAH is not limited to altered coagulation process. Actually, in
response to specific stimuli platelet are able to produce prothrombotic, vasoactive and mitogen factors
as thromboxane A2, PDGF, 5-HT, TGF- and VEGF, which contribute to vascular remodeling.

20
Furthermore, the presence of endothelial damage serum markers, as Von Willebrand factor and
Plasminogen activator inhibitor-1 [42], leads to hypothesized that pulmonary endothelial damage
induces thrombogenic surface and favors thrombotic lesion formation in situ.
The mural thrombi in central elastic pulmonary arteries can be a consequence of several factors
including thrombophilic state, intimal atherosclerotic lesions, vascular dilation and reduced cardiac
output. In addition, the peripheral embolization of proximal thrombi can lead to a progression of
obstructive lesions in small caliber vessels.
1.2.4. Genetic
Familial cases have long been recognized, and in 2000, bone morphogenetic protein receptor
type 2 (BMPR2) was identified following linkage analysis [43-45] as the gene responsible for more
than 70% of Heritable PAH (HPAH) and approximately 20% of IPAH cases [46-49]. Crude indirect
estimates of the population carrier frequency for BMPR2 mutations lie in the frequency range of
0.001% to 0.01% [50].
Two further receptor members of the TGF-beta cell signaling superfamily are also recognized as
uncommon causes of HPAH. Heterozygous mutations in activin-like kinase-type 1 (ALK1) [51] and
endoglin (ENG) [52] cause hereditary hemorrhagic telangiectasia (HHT) and may rarely lead directly
to the development of PAH.
HPAH is inherited as an autosomal dominant trait with incomplete penetrance and an estimated
lifetime risk of 10% to 20% [53]. The disease is more frequent in women, with a ratio of at least 1.7:1
women to men [5, 54, 55]. Both incomplete penetrance and the significantly skewed gender ratio
suggest interactions between BMPR2 disease mutations and environmental exposures that may
include hormones, together with a role for modifying genes.
HPAH and IPAH have a similar clinical course. HPAH is associated with a slightly younger age
of onset and a slightly more severe hemodynamic impairment at diagnosis, but with similar life
expectancy [56]. Patients with PAH and disease-causing BMPR2 mutations are, however, less likely
to respond to acute vasodilator testing during RHC and are unlikely to benefit from treatment with
calcium channel blockade [56-58].
Families with BMPR2 mutations have been reported to have genetic anticipation, or earlier age
of diagnosis in subsequent generations [55]. However, no systematic population-based study has
been performed to avoid the ascertainment bias that could result in the recruitment and study of
families associated with earlier-onset disease in more recent generations. Furthermore, the usual
genetic mechanisms for anticipation, including trinucleotide repeat expansions, are not present in
BMPR2. The question of genetic anticipation can be better addressed in future registries in which all
21
patients with HPAH and IPAH can be genetically characterized and unbiased family studies can be
performed.
1.2.5. Diagnosis and Clinical presentation of PAH
The evaluation process of a patient with suspected PH requires a series of investigations
intended to confirm the diagnosis, clarify the clinical group of PH and the specific etiology within the
PAH group, and evaluate the functional and hemodynamic impairment. Since PAH, and particularly
IPAH, is a diagnosis of exclusion, the experts created a diagnostic algorithm, in order to have an
helpful starting point in any case of suspected PH [3]. Many techniques are available for physicians to
assess PAH: Electrocardiogram, Chest radiograph, Pulmonary function tests and arterial blood gases,
Echocardiography, Ventilation/perfusion lung scan, High-resolution computed tomography, contrast-
enhanced computed tomography, and pulmonary angiography, Cardiac magnetic resonance imaging,
Blood tests and immunology, Abdominal ultrasound scan, RHC and vasoreactivity test.
Above all, RHC is required to confirm the diagnosis of PAH, to assess the severity of the
hemodynamic impairment, and to test the vasoreactivity of the pulmonary circulation. It is really
important that it is performed in an experienced center, actually only in this case RHC procedures
have low morbidity (1.1%) and mortality (0.055%) rates [59].
The clinical presentation is similar in idiopathic and associated type of PAH. Symptoms of PH do
not usually occur until the condition has progressed.
They are mild, nonspecific often associated to other comorbidities, or only present during
demanding exercise. For these reasons, individuals with PAH may go years without a diagnosis.
Actually, in the most of registers the delay of patient diagnosis is about 2 years [5, 54]. The first
symptom of PH is usually shortness of breath (or dyspnea) with everyday activities, such as climbing
stairs. Symptoms at rest are reported only in very advanced cases. The most likely cause for dyspnea
in PH is the inadequacy of cardiac output compared to the metabolic requirements. Along with
dyspnea, patients may have fatigue, weakness, syncope, and abdominal distention. In addition, due to
pulmonary artery stretching or right ventricular ischemia patients could have angina despite normal
coronary arteries. Besides, the rupture of distended pulmonary vessels can cause hemoptysis which is
a rare but potentially devastating event.
Abnormalities detected on physical examination tend to be localized in the cardiovascular
system. A careful examination often allow to detect signs of PH and right ventricular hypertrophy.
The findings on lung examination are nonspecific but may point to the underlying cause of PH.
For instance, wheezing may lead to a diagnosis of chronic obstructive pulmonary disease (COPD),
and basilar crackles may indicate the presence of interstitial lung disease.

22
1.2.6. Pathophysiology of PAH
The increase of pulmonary vascular resistance in PAH patients is therefore related to different
mechanisms, including vasoconstriction (functional alterations), proliferative and obstructive
remodeling of the pulmonary vessel wall, inflammation, and thrombosis (overall fixed alterations).
Vasoconstriction is likely prevalent in the small group of patients responding to the acute
vasoreactivity test [3]. Only about 10% of patients with IPAH will meet these criteria. These patients,
defined ‘responder’, are most likely to show a sustained response to long-term treatment with high
doses of calcium channel blockers [60] and they are the only patients that can safely be treated with
this type of therapy.
The increase in pulmonary vascular resistance leads to right ventricular overload, hypertrophy,
and dilatation and eventually to right ventricle failure and death. The importance of the progression of
right ventricle failure on the symptoms, exercise limitation, and outcome of PAH patients is confirmed
by the prognostic impact of right atrial pressure, cardiac index and PAP, the three main hemodynamic
factors linked to right ventricle pump function. Echocardiography and cardiac magnetic resonance
parameters and brain natriuretic peptide plasma levels can also identify non-invasively the presence
and extent of right ventricular dysfunction. Afterload mismatch remains the leading determinant of right
heart failure in patients with PAH because its removal, as follows lung transplantation, leads almost
invariably to sustained recovery of right ventricle function. It is, therefore, conceivable that the drug
therapies tested in PAH patients have included compounds which could potentially interfere with the
pathobiological mechanisms of the disease trying to achieve a reverse remodeling of the obstructive
lesions and a reduction of the right ventricular afterload.
1.2.7. Current available therapies
Two decades ago, patients with idiopathic PAH were defined as the ‘kingdom of the near-dead’
[61] to outline their dismal median survival rate that, at that time, was 2.8 years from the diagnosis
[62], despite any available supportive treatment.
Current specific drug therapies include those targeting the pathobiological abnormalities of PAH
such as prostanoids, endothelin receptor antagonists (ERA) and phosphodyesterase type-5 (PDE-5)
inhibitors (Figure 3).

23
Prostanoids
Dysregulation of the prostacyclin metabolic pathways has been shown in patients with PAH as
assessed by reduction of prostacyclin synthase expression in the pulmonary arteries and of
prostacyclin urinary metabolites [63].
Epoprostenol (synthetic prostacyclin) is available as a stable freeze-dried preparation that needs
to be dissolved to allow intravenous infusion. It has a short half-life (3–5 min) and it is stable at room
temperature for only 8 hours; then it must be administered continuously with infusion pumps and
permanent tunnellized catheters. The efficacy of continuous intravenous administration of
epoprostenol has been tested in three unblinded clinical trials in IPAH [64, 65] and in SSc-PAH
patients [66]. Epoprostenol improves symptoms, exercise capacity and hemodynamics in both clinical
conditions, and is the only treatment shown to improve survival in IPAH in a randomized study.
Figure 3. Targeted medical therapy for pulmonary arterial hypertension based on the prostacyclin pathway, the nitric oxide pathway and the endothelin pathway. Image from Humbert M. et al., N Engl J Med 2004.

24
Optimal dose varies between individual patients, ranging from 20 to 40 ng/kg/min [67, 68]. Serious
adverse events related to the delivery system include pump malfunction, local site infection, catheter
obstruction and sepsis. Abrupt interruption of the epoprostenol infusion should be avoided because,
as observed in some patients, it may induce a rebound worsening of their PH with symptomatic
deterioration and even death.
Treprostinil is a tricyclic benzidine analogue of epoprostenol, with sufficient chemical stability at
room temperature, it can be administered intravenously or subcutaneously. The effects of treprostinil
in PAH were studied in the largest worldwide randomized controlled trial in which it has been
performed subcutaneous administration by micro-infusion pumps and small subcutaneous catheters.
This trial showed improvements in exercise capacity, hemodynamics and symptoms [69]. The greatest
exercise improvement was observed in patients who were more compromised at baseline and in
subjects who could tolerate upper quartile doses (>13.8 ng/kg/min). Infusion site pain was the most
common adverse effect of treprostinil, leading to discontinuation of the treatment in 8% of cases on
active drug and limiting dose increase in an additional proportion of patients. Among the 15% of
patients who continued to receive subcutaneous treprostinil alone, survival appears to be improved
[69].
In another long-term, open-label study, sustained improvement in exercise capacity and
symptoms with subcutaneous treprostinil was reported in patients with IPAH or CTEPH, with a mean
follow-up of 26 months [70]. Treprostinil has been recently approved in the USA for intravenous use in
patients with PAH: the effects appear to be comparable with those of epoprostenol but at a dose 2 to 3
times higher. It is more convenient for the patient because the reservoir can be changed every 48
hours as compared to 12 hours with epoprostenol.
Iloprost is a chemically stable prostacyclin analogue available for intravenous, oral and aerosol
administration. Inhaled therapy for PAH is an attractive concept that has the theoretical advantage of
being selective for the pulmonary circulation. Iloprost has been evaluated in one research clinical trial
in which daily repetitive drug inhalations (6 to 9 times, 2.5–5 μg/inhalation, median 30 μg daily) were
compared with placebo inhalation in patients with PAH and CTEPH [71]. The study showed an
increase in exercise capacity and improvement in symptoms, PVR and clinical events in enrolled
patients. A second research clinical trial on 60 patients already treated with bosentan increased in
exercise capacity in the subjects randomized to the addition of inhaled iloprost, compared with
placebo. Overall, inhaled iloprost was well tolerated. Continuous intravenous administration of iloprost
appears to be as effective as epoprostenol in a small series of patients with PAH and CTEPH [72].

25
Endothelin Receptor Antagonists
Activation of the ET-1 system has been demonstrated in both plasma and lung tissues of PAH
patients [22] Although it is not clear if the increased ET-1 plasma levels are a cause or a consequence
of PH [23], studies on tissue ET-1 expression confirm its prominent role in the pathogenesis of PAH
[21].
Bosentan is a first-in-class of oral active dual ETA and ETB receptor antagonists. It has been
evaluated in PAH in five research clinical trials that have shown improvement in exercise capacity,
functional class, hemodynamics, echocardiographic and Doppler variables, and time to clinical
worsening [73-76].
Long-term observational studies have demonstrated the durability of the effect of bosentan over
time. Increases in hepatic aminotransferases occurred in 10% of the subjects but were found to be
dose dependent and reversible after dose reduction or discontinuation. For these reasons liver
function tests should be performed at least monthly in patients receiving bosentan. Sitaxsentan, a
selective orally active ETA receptor antagonist, has been assessed in two research clinical trials in
patients with IPAH, SSc-PAH and congenital heart diseases [77]. The studies demonstrated
improvements in exercise capacity and hemodynamics. A one-year, open-label observational study
demonstrated the durability of the effects of sitaxsentan over time [78]. Incidence of abnormal liver
function tests, which reversed in all cases, was 3%-5% for the approved dose of 100 mg (monthly
monitoring is required). Interaction with warfarin requires the reduction of the anticoagulant dose by
about 80% to stabilize the international normalized ratio.
Ambrisentan, a non-sulfonamide, propanoic acid-class ERA selective for the ETA receptor, has
been in evaluated in a pilot study [79] and in two large research clinical trials that demonstrated
efficacy on symptoms, exercise capacity, hemodynamics and time to clinical worsening The openlabel
continuation study has demonstrated the durability of the effects of ambrisentan for at least one year
[80]. Ambrisentan has been approved for the treatment of WHO/NYHA functional class II patients. The
current approved is 5 mg once daily (OD), which can be increased to 10 mg OD if the drug is tolerated
with the initial dose. Incidence of abnormal liver function tests ranges from 0.8% to 3%. However even
in patients treated with ambrisentan, liver function tests are required at least monthly. Caution is
suggested for the co-administration of ambrisentan with ketoconazole and cyclosporine.
Phosphodiesterase Type-5 Inhibitors
Sildenafil is an orally active, potent and selective inhibitor of PDE-5 that exerts its
pharmacological effect by increasing the intracellular concentration of cGMP. A number of
uncontrolled studies have reported favorable effects of sildenafil in IPAH, PAH associated to
connective tissue diseases and to congenital heart diseases, and in CTEPH [81, 82]. A pivotal

26
research clinical trial in 278 PAH patients treated with sildenafil 20, 40, or 80 mg 3 times daily (TID)
has confirmed favorable results on exercise capacity, symptoms and hemodynamics [83]. Although
the approved dose is 20 mg TID, the durability of effect up to one year has been demonstrated only
with the dose of 80 mg TID. In clinical practice, up-titration beyond 20 mg TID. (mainly 40 to 80 mg
TID) is frequently needed. Most side effects of sildenafil were mild to moderate and mainly related to
vasodilation. Tadalafil is an OD dosing, selective PDE-5 inhibitor, currently approved for the treatment
of erectile dysfunction.
A pivotal research clinical trial on 406 PAH patients treated with tadalafil 5, 10, 20, or 40 mg OD
has shown favorable results on exercise capacity, symptoms, hemodynamics and time to clinical
worsening for the largest dose [84]. Side effects profile was similar to sildenafil.
Combination Therapy
Combination therapy is the simultaneous use of more than one PAH-targeted class of drugs, eg,
ERA, PDE-5 inhibitors, prostanoids, and novel substances. Although long-term safety and efficacy
have not yet been amply explored, numerous case series have suggested that various drug
combinations appear to be safe and effective. Different randomized controlled studies have shown the
efficacy of the combination of bosentan and epoprostenol [75], of the addition of inhaled iloprost to
patients on background therapy with bosentan [85], of bosentan in patients on background therapy
with sildenafil [74], of sildenafil in patients on background treatment with epoprostenol [86], of inhaled
treprostinil in patients with background treatment with either bosentan or sildenafil and of tadalafil in
patients on background treatment with bosentan [84]. Additional trials with novel compounds are on-
going. There are many open questions regarding combination therapy, including the optimal
combination and timing. Candidates to combination therapy are patients whose status is defined as
stable but unsatisfactory or unstable and deteriorating [3]. Given the complexities related to
combination therapy, it is recommended that candidates be referred to expert centers.
1.2.8. Lung transplantation
Transplantation has been performed in patients with IPAH and is considered by some to be the
final effective treatment for selected patients with IPAH
Lung and heart–lung transplantation in PAH has been assessed only in prospective uncontrolled
series, since formal research clinical trials are considered unethical in the absence of alternative
treatment options [87]. The 3-year and 5-year survival after lung and heart–lung transplantation is
approximately 55% and 45%, respectively [88]. Both single and bilateral lung transplantation have

27
been performed for IPAH and these operations have been combined with repair of cardiac defects in
Eisenmenger’s syndrome.
Recipient survival rates have been similar after single and bilateral lung transplantation and after
heart–lung transplantation for PAH. However, many transplant centers currently prefer to perform
bilateral lung transplantation. Lung and heart–lung transplantation are indicated in PAH patients with
advanced WHO/NYHA class III and class IV symptoms that are refractory to available medical
treatments. The appropriate timing of listing for transplantation is complicated by the unpredictable
waiting period and the donor organ shortage.
1.2.9. Animal models in PAH
Several animal models are currently available to study PH. The most commonly used animal
models of PH are the chronic hypoxic and the monocrotaline injury models. Although they don’t reflect
completely the human disease, these animal models have been used for quite some time and have
undoubtedly contributed to a better understanding of the pulmonary hypertensive process. The most
commonly used animal models are rats and mice.
Chronic hypoxia
Normo- and hypobaric hypoxia are frequently utilized to induce PH in a wide variety of animal
species. This model is very predictable and reproducible within a selected animal strain, however.
responses are significantly affected by age, as younger individuals with rapidly maturing lungs are
more susceptible to this trigger [89]. Structural changes in hypoxia-induced PH are very similar (albeit
of differing magnitude) in almost all mammals investigated. An increase in cells expressing alpha-
smooth muscle actin (alpha-SMA) into previously nonmuscularized arterioles rapidly occurs.
Many possibilities could account for these changes: the differentiation of pericytes, migration of
smooth muscle cells (SMC), recruitment and differentiation of local fibroblasts, mononuclear
cell/progenitor cell recruitment, and transdifferentiation of endothelial cells into mesenchymal-like cells
through endothelial-mesenchymal transition process [89, 90]. Subsequently, due to medial SMC
proliferation and hypertrophy there is increased thickening of the previously muscularized precapillary
pulmonary arteries.
Furthermore, inflammation appears to play a significant role in the hypoxia-induced remodeling
process in at least some strains of rats. Recently, it was reported that hypoxia induced an early and
persistent pulmonary artery-specific vascular inflammatory response [91]. The increased expression of
chemokine/ chemokine receptors preceded the appearance of inflammatory cells, which, in the case
of hypoxia, are primarily mononuclear. In addition, there is significant thickening and fibrosis of the
28
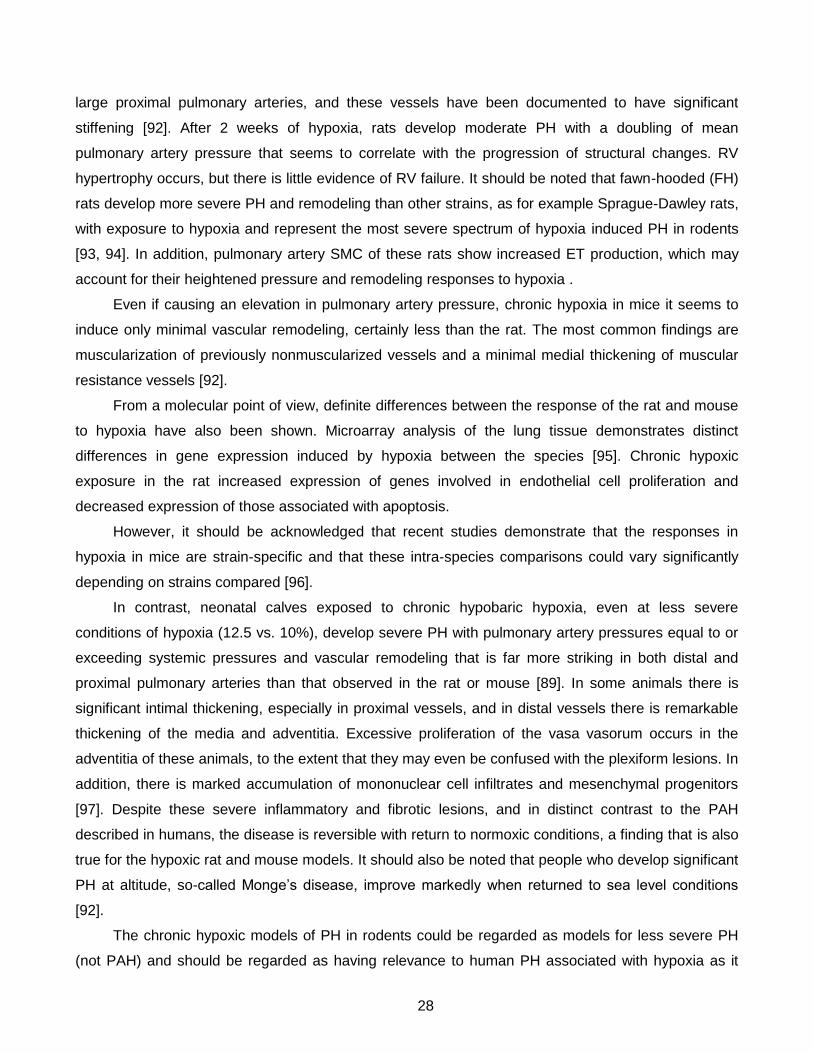
large proximal pulmonary arteries, and these vessels have been documented to have significant
stiffening [92]. After 2 weeks of hypoxia, rats develop moderate PH with a doubling of mean
pulmonary artery pressure that seems to correlate with the progression of structural changes. RV
hypertrophy occurs, but there is little evidence of RV failure. It should be noted that fawn-hooded (FH)
rats develop more severe PH and remodeling than other strains, as for example Sprague-Dawley rats,
with exposure to hypoxia and represent the most severe spectrum of hypoxia induced PH in rodents
[93, 94]. In addition, pulmonary artery SMC of these rats show increased ET production, which may
account for their heightened pressure and remodeling responses to hypoxia .
Even if causing an elevation in pulmonary artery pressure, chronic hypoxia in mice it seems to
induce only minimal vascular remodeling, certainly less than the rat. The most common findings are
muscularization of previously nonmuscularized vessels and a minimal medial thickening of muscular
resistance vessels [92].
From a molecular point of view, definite differences between the response of the rat and mouse
to hypoxia have also been shown. Microarray analysis of the lung tissue demonstrates distinct
differences in gene expression induced by hypoxia between the species [95]. Chronic hypoxic
exposure in the rat increased expression of genes involved in endothelial cell proliferation and
decreased expression of those associated with apoptosis.
However, it should be acknowledged that recent studies demonstrate that the responses in
hypoxia in mice are strain-specific and that these intra-species comparisons could vary significantly
depending on strains compared [96].
In contrast, neonatal calves exposed to chronic hypobaric hypoxia, even at less severe
conditions of hypoxia (12.5 vs. 10%), develop severe PH with pulmonary artery pressures equal to or
exceeding systemic pressures and vascular remodeling that is far more striking in both distal and
proximal pulmonary arteries than that observed in the rat or mouse [89]. In some animals there is
significant intimal thickening, especially in proximal vessels, and in distal vessels there is remarkable
thickening of the media and adventitia. Excessive proliferation of the vasa vasorum occurs in the
adventitia of these animals, to the extent that they may even be confused with the plexiform lesions. In
addition, there is marked accumulation of mononuclear cell infiltrates and mesenchymal progenitors
[97]. Despite these severe inflammatory and fibrotic lesions, and in distinct contrast to the PAH
described in humans, the disease is reversible with return to normoxic conditions, a finding that is also
true for the hypoxic rat and mouse models. It should also be noted that people who develop significant
PH at altitude, so-called Monge’s disease, improve markedly when returned to sea level conditions
[92].
The chronic hypoxic models of PH in rodents could be regarded as models for less severe PH
(not PAH) and should be regarded as having relevance to human PH associated with hypoxia as it

29
occurs in pulmonary parenchymal disease, sleep disordered breathing, severe (COPD), and residence
at high altitude.
Monocrotaline injury
Monocrotaline (MCT) is a toxic pyrrolizidine alkaloid present in the plant Crotalaria spectabilis.
More than 40 years ago PH was first described after repeated oral ingestion in laboratory rats [92]. It is
known that MCT is metabolized in the liver to the MCT pyrrole (MCTP), which leads to vascular injury.
MCT models, particularly in rats, can now be achieved by injection with a single subcutaneous or
intraperitoneal injection of MCT, making this a very simple and thus technically appealing animal
model available to a wide spectrum of investigators. Unfortunately, the response to MCT is variable
among species, strains, and even animals because of differences in the hepatic metabolism by
cytochrome P-450. The preferred species for the study of monocrotaline-induced PH is currently the
rat.
Although the exact mechanism through which MCT causes PH is not known, it is speculated by
many that it causes direct endothelial damage that then triggers the inexorable development and
progression of severe and eventually lethal PH [98]. This is based on observations showing that the
onset of increased pulmonary arterial pressures and vascular remodeling is delayed until 1–2 weeks
after the initiating dose [99]. Other investigators have suggested that the increases in pulmonary artery
pressure and vascular remodeling are caused by early and often dramatic accumulation of
mononuclear inflammatory cells in the adventitial sheath of the small intra-acinar vessels [100]. This
change occurs in both the pulmonary arteries and veins and precedes the evidence of smooth muscle
hypertrophy in the media. Thus adventitial inflammation, particularly macrophage accumulation, is
suggested by some to have more important effects on the pathogenesis of PH than the endothelial cell
[100, 101]. There is significant RV hypertrophy and RV dysfunction, which is important for study in PH
models. Following high doses of MCT injection, RV systolic pressures reaching 80 mmHg after 5
weeks have been reported, which was associated with a low survival rate of 35% [98, 99].
1.3. Smooth muscle cells
Smooth muscle cells (SMCs) are essential for good performance of the vasculature. By
contraction and relaxation, they modify the luminal diameter, which allows blood vessels to maintain
an appropriate blood pressure.
However, vascular SMCs also achieve other functions, which become progressively more
important such as in pregnancy, during exercise, or after vascular injury [102]. In these cases, SMCs

30
synthesize large amounts of extracellular matrix (ECM) components and increase proliferation and
migration.
The functions that SMCs can exert reflect their different phenotypes, ranging from contractile to
synthetic. These have clearly different morphologies. Contractile SMCs are elongated, spindle-shaped
cells, whereas synthetic SMCs are less elongated and have a cobblestone morphology (Figure 4),
which is referred to as epithelioid or rhomboid [103].
Synthetic SMCs contain a high number of organelles involved in protein synthesis, whereas
these are largely replaced by contractile filaments in contractile SMCs. Moreover, synthetic and
contractile SMCs have different proliferative and migratory characteristics. Generally, synthetic SMCs
exhibit higher growth rates and higher migratory activity than contractile SMCs [103].
The variations between SMCs within a particular vessel, both in term of marker gene expression
and functional and morphological characteristics, suggest that there may be a genetic basis for SMC
diversity. After all, such SMCs share similar embryological origins and experience comparable local
conditions. This concept is substantiated by several studies reporting the persistence of in vivo
phenotypes in culture, despite changed conditions. For example, within the bovine pulmonary artery,
four SMC phenotypes with distinct marker protein expression profiles and different morphologies have
been described [104]. The existence of distinct SMC populations within the same artery has also been
demonstrated in rat [105], pigs [106], and humans [107]. In all these studies, in vivo differences were
maintained in vitro. Interestingly, the studies summarized that although SMC phenotype appears to be
genetically programmed, local environmental cues can still modulate the characteristics of the SMCs.
This raises the question of the relative importance of the local environment versus genetic
programming, especially in pathobiological processes. SMCs isolated from the human internal thoracic
artery form a particularly illustrative example [107].
Figure 4. Whereas the SMCs in a vessel can collectively cover the whole spectrum of phenotypes, a given population of SMCs (indicated by ‘a’ to ‘f’, respectively) can only cover a limited area of this spectrum. The boundaries of the spectrum for any given SMC population are defined by (epi)genetic programs. SMCs can modulate their phenotype within the boundaries, a process which is controlled by the integration of environmental factors. Image from Rensen SSM et al Netherlands Heart Journal, 2007.

31
These SMCs were cloned after enzymatic digestion, producing epithelioid as well as spindle-
shaped cell types. Both had a contractile gene expression profile, but only spindle-shaped cells
expressed meta-vinculin. They also had higher SM-MHC and SM-calponin levels and a higher h-
caldesmon/l-caldesmon ratio. Apart from these differences, the two types of clones differed with
respect to proliferation rate, ECM build-up and responses to various growth factors and hormones.
One typical spindle-shaped clone, designated HITB5, was able to adopt either a synthetic or a
contractile phenotype, depending on serum concentrations [108]. This shows that even though SMC
phenotypes can be stable in culture, they can also be manipulated to adopt a certain phenotype,
allowing the study of agents that modulate phenotypes. SMC clones that are capable of reversible
modulation to both ends of the phenotype spectrum have also been derived from porcine coronary
artery SMCs [109]. These cells displayed phenotypic modulation after fibroblast growth factor (FGF)-2
or platelet-derived growth factor (PDGF)-BB treatment or withdrawal. PDGF-BB drove spindle-shaped
SMC clones towards the rhomboid phenotype. Concomitantly, proliferation and migration increased
and SM-MHC and smoothelin expression greatly diminished.
Many biocompounds have been reported to affect expression of SMC phenotype markers, some
of which even have phenotype-dependent effects. These factors include PDGF (see the next
paragraph), TGF-β, activin A, retinoids, angiotensin II, and TNF-α. Besides these, compounds such as
FGF, insulin-growth factor (IGF)-I and -II, endothelin-1, nitric oxide (NO), reactive oxygen species,
peroxisome proliferator-activated receptor-gamma ligands and complement 3 protein have been
shown to affect SMC phenotype.
1.4. Platelet-derived growth factor pathway
PDGF plays a critical role in cellular proliferation and development.
The biologically active form of PDGF is a dimer formed from the A and B chains. Interestingly, it
is active to a differing degree depending on which dimer is formed (AA, AB, or BB).
The PDGF Receptor (PDGFR) is also a dimer and can form from the combination of the alpha
and beta chains in any order (alpha-alpha, alpha-beta, beta-beta). The PDGFR dimer is only formed
after ligand binding so the alpha/beta composition of the receptor can be influenced by the form of
PDGF that is present. Upon binding of ligand the PDGFR is tyrosine phosphorylated
(autophosphorylation) and leads to the phosphorylation of several other cellular proteins [110]
including ras-dependent activation of p42/p44 mitogen–activated protein kinases (MAPKs) and
activation of phosphoinositol 3 kinase (PI3 kinase). Both events are critical for the mitogenic effects of
PDGF. It is well understood that sustained activation of signal transduction pathways, particularly
p42/p44 MAPK and PI3 kinase is required for progression through G1 to S [90].

32
PDGF, in particular PDGF-BB, is synthesized by many different cell types including SMCs, ECs,
and macrophages. Worthy to note, its receptor, PDGFR-β, is mainly expressed in SMCs. It has been
proposed as a key mediator in the progression of several fibroproliferative disorders such as
atherosclerosis, lung fibrosis, and PH [111].
In the context of PH it may contribute to pulmonary vascular remodeling via several
mechanisms. At first, PDGF is a potent mitogen which induces the proliferation of PASMCs and
fibroblasts. In addition, PDGF increases cell migration and extracellular matrix deposition by inducing
the expression of metallomatrix proteases, particularly matrix metalloproteinase 1, 3, and 9. PDGF
also potently inhibits apoptosis in vascular SMCs through the phosphatidylinositol 3 kinase (or
PI3K)/Akt pathway [112].
Besides, hypoxia is known [113] to induce PDGF gene expression in cultured vascular
endothelial cells derived from bovine pulmonary arteries and human umbilical vein. In accordance,
rats that developed PH following long-term exposure to hypoxia demonstrate increased expression of
PDGF-A and PDGF-B isoforms [114]. Moreover, increased expression of PDGF-A, PDGF-B, and
PDGF receptors (PDGF-R α, and PDGF-R β) have been assessed by reverse transcription-
polymerase chain reaction (PCR), performed on laser-captured microdissected pulmonary arteries
from native lungs of patients with severe IPAH who underwent lung transplantation [115] as compared
with control subjects.
Recently, novel therapeutic agents, such as tyrosine kinase inhibitors, have been tested in
experimental models of PH [116] and in clinical trials.
Within this class of drugs imatinib, a tyrosine kinase inhibitor licensed for the treatment of
chronic myeloid leukemia, has been investigated [116-118] as a possible therapy for PAH. In fact, it
showed a significant inhibition of PDGF-BB–induced proliferation and migration of PASMCs [51].
Imatinib acts by blocking the functioning of PDGF receptors as well as other kinases by targeting the
adenosine triphosphate binding site of tyrosine kinases. Schermuly R.T. et al [116] used the MCT rat
and a mouse hypoxic models to demonstrate that animals treated with imatinib had significantly
reduced pulmonary artery pressures, higher cardiac index, increased arterial oxygenation, and
improved survival when compared to sham-treated animals. The inhibition of PASMC proliferation was
observed in the imatinib-treated groups. A single clinical case study [118] in a patient with familial PAH
showed dramatic improvements after imatinib therapy in 6 min-walk distance (6MWD) as well as in a
reduction in pulmonary vascular resistance. Two further successful cases [117] of longer term
treatment have since been reported.
A phase II proof-of-concept study found that once daily imatinib in patients on established
therapies did not significantly improve 6MWD but did result in a significant reduction in PVR and an
increase in CO; post-hoc analysis suggested a greater treatment effect in those patients with more

33
severe hemodynamic compromise [119]. Imatinib is not without potentially serious side effects, but
these initial reports suggest that the drug may be beneficial for patients with advanced PAH who are
not responding to established therapies.
1.5. Histone deacetylase enzymes
All reactions within the chromatin substrate including transcription, replication, recombination,
and repair, must be initiated and regulated by DNA-binding factors. The interaction of these factors
with their target DNA requires chromatin to be partially relaxed. Actually, the packaging of eukaryotic
DNA into chromatin poses a fundamental accessibility problem. In this context, many studies have
established that such chromatin flexibility is achieved by two principal molecular mechanisms. First,
ATP-dependent chromatin remodeling factors alter histone–DNA interactions such that nucleosomal
DNA becomes more accessible to interacting proteins [120, 121]. Second, the amino-terminal tails of
the core histone proteins are subjected to a variety of covalent post-translational modifications
including acetylation, phosphorylation, methylation, ubiquitination, and ADP-ribosylation [122-124].
These modifications play essential roles in generating the dynamic state of chromatin.
Thus far, the most extensively studied post-translational histone modification is the Acetylation, a
process linked mainly to transcriptional activation. It is catalyzed by a group of enzymes known as
histone acetyltransferases, which transfer an acetyl group from the acetyl coenzyme A, metabolic
intermediary, to the amino group of lysine residues in histone tails [125].
It is generally accepted that the primary effect of acetylation is to partially neutralize the positive
charge of histones, resulting in a decrease in their affinity for negative charges of DNA and thereby
generating a permissive structure for the binding of proteins to the nucleic acid. Additionally,
acetylated histone tails can recruit other chromatin-associated proteins.
The functional importance of acetylation lies in its highly reversible nature that depends on the
accuracy and efficiency of the reverse reaction, histone deacetylation, which is catalyzed by a group of
enzymes known as histone deacetylases (HDACs).
HDAC family consists of at least 18 members which can be divided phylogenetically into four
classes.
Class I shows homology to the yeast protein reduced potassium deficiency 3, includes: HDAC1,
2, 3 and 8.
HDACs of Class II are homologous to the yeast enzyme HDA1, they are further grouped into two
subclasses Class IIa and Class IIb according to their sequence homology and domain organization.
Class IIa includes HDAC4, 5, 7, 9; and Class IIb includes HDAC6 and 10.
Class III show distinct homology with the yeast enzyme Sir2, includes: sirtuin (SIRT) 1 to 7.

34
It was reported that SIRT1, 2, 3, 5 and 6 induce deacetylation of histones or non-histone
proteins, whereas SIRT4 and 7 do not possess in vitro deacetylase activity [126].
Class IV: HDAC11 is the most recently identified member.
Furthermore, they can be divided into two structural categories: zinc-dependent enzymes (Class
I, Class II and Class IV) and nicotinamide adenine dinucleotide (NAD+)-dependent enzymes (Class
III).
These isoforms have generally distinct gene expression patterns and likely vary also in cellular
localization and function, though these have been poorly characterized. In term of cellular localization,
HDAC1, 2 and 3 are primarily nuclear, HDAC6 is primarily cytoplasmic and HDAC4, 5, 7 and 9 are
believed to shuttle between the nucleus and cytoplasm [127, 128]. The cellular localization of HDAC8
has not been resolved since it has been reported as being both nuclear and cytoplasmic [129, 130].
Most HDACs do not contain intrinsic DNA-binding activities; other cellular factors are required for
their proper recruitment to specific locations in the genome. In addition to histones, many HDACs can
deacetylate non-histone proteins in vitro and in vivo, this suggest a role of these enzymes not only in
nucleus but also in the cytoplasm.
Concerning the tissue distribution of HDACs, it is well known that Class I HDACs 1, 2 and 3 are
ubiquitously expressed and are almost exclusively found in the nuclei of normal cells. Weak to
moderate nuclear protein expressions has been reported in fibroblasts and myofibroblasts. SMCs of
either organ or vessels walls express the proteins as well [131, 132]. In addition, endothelial cells were
positive to a variable degree. Inflammatory cells, especially lymphocytes and macrophages,
occasionally expressed HDAC1, 2 and 3 [131, 132]. In contrast, expression of class II HDAC8 was
found to be restricted to cells with smooth muscle/myoepithelial differentiation [133] and consequently
has been suggested as a diagnostic marker for uterine tumors with smooth muscle differentiation
[129]. Expression of class II HDAC6 was not observed in lymphocytes, stromal cells and vascular
endothelial cells [134, 135].
1.6. Histone deacetylase inhibitors
As describe in the previous paragraph, the lysine acetylation is deeply implicated in the control
of highly regulated biological functions (including cell cycle control, differentiation, and apoptosis), and
its balance on histones and non-histone proteins is regulated by specific enzymes, histone acetyl
transferases and HDACs. It is well-known that alteration of the acetylation status is involved in the
development of various cancerous [136, 137] and non-cancerous diseases, including PAH [138].
Over the last 30 years, numerous synthetic and natural products, including a broad range of
dietary compounds, have been identified as HDAC modulators.
35
These molecules, HDAC inhibitors (HDACi), have shown antineoplastic activity in vitro and in
animal models in vivo [139]. Indeed, they have been tested as therapeutic agents for the treatment of
certain forms of cancer [140-142] and a broad variety of these substances are currently tested in
clinical trials of all phases [143]. Identification of cellular complexes containing protein phosphatases
(PP) and HDACs suggested a potential new mechanism by which both enzymatic activities may be
coordinated in the covalent modification of proteins that regulate cell growth and function .
Brush et al. [144] demonstrated that the anti-neoplastic activity of HDACi may in part be
associated with the disassembly of HDAC/phosphatase complexes and the resulting changes in
protein acetylation and phosphorylation may inhibit cell growth and transformation.
Most of these molecules have a binding site for catalytic zinc, a tail (linker) mimicking the side
chain of lysine and a ‘‘cap’’ for obstructing the entrance to the active site. These inhibitors can be
classified according to their structure into five categories: short-chain fatty acids, hydroxamates, cyclic
peptides, benzamides and depsipeptide [145, 146]. Nevertheless, many molecules with a potential
inhibitory activity against HDAC but with a chemical structure different than the first five have been
identified. A significant number of these molecules were isolated from natural sources [147].
Within the chemical class of short-chain fatty acids, sodium butyrate is present in the
gastrointestinal tract as a consequence of microbial fermentation of dietary fiber. It has been shown
that butyrate inhibits HDAC classes I, IIa and IV [148]. This compound leads to growth arrest,
differentiation of leukemic cells and induces apoptosis following the deterioration of the anti-apoptotic
protein Bcl-2 [149, 150]. The apparent lack of clinical efficacy may be explained by the low plasma
levels of sodium butyrate due to its short half-life in vivo [151].
1.7. Peripheral blood mononuclear cells
Peripheral blood mononuclear cells (PBMCs) consist of circulating mononuclear cells, including
monocytes, lymphocytes and macrophages. The lymphocyte population consists of T cells (CD4 and
CD8 positive ~75%), B cells and natural killer cells (~25% combined). These blood cells are a critical
component in the immune system to fight infection and adapt to intruders.
Besides, PMBCs play a critical role in inflammatory pathways leading to different pathological
conditions and they have emerged in recent years as valuable tool to find markers of several
diseases, including inflammatory (e.g. preeclampsia, rheumatoid arthritis, and chronic pancreatitis),
malignant (chronic lymphocytic leukemia, renal cell carcinoma, pancreatic cancer) [152-156], and
cardiovascular diseases [157].
The clinical accessibility of PBMCs is a very important aspect for PAH studies. Indeed, due to
high risks lung biopsies are not routinely performed in PAH patients. Moreover, even if explanted

36
lungs are available, they don’t allow to study early development of the disease. In this context, this cell
population could be an interesting surrogate tissue to find new molecular targets or markers involved
in PAH.

37
2. Aim of the study
2.1. In vitro animal studies
Due to their antiproliferative and antimigratory effects, HDACi have also been largely studied in
cancer and in atherosclerotic diseases, while their specific action in PAH has long remained
unexplored. Among HDACi, sodium butyrate (BU) is widely reported to elicit many cytoprotective,
chemopreventive and chemotherapeutic activities mainly through the arrest of cell proliferation,
induction of apoptosis or stimulation of cell differentiation by selectively altering gene expression. In
the meantime this research was ongoing, the application of HDACi in PH has been published for the
first time by Cavasin et al. [166]. Very recently, Zhao et al reported that protein levels of HDAC1 and 5
were elevated in patients with idiopathic PAH, and that HDACi were able to mitigate the development
of hypoxia induced PH in rats and exerted anti-proliferative effects on human and animal vascular
cells in culture [158]. Nevertheless, the intimate molecular mechanisms underlying the HDACi action
on PAH-PASMCs proliferation and signaling remain to be largely unraveled. Based on this lack of
knowledge, this study was designed to explore whether BU may modulate the proliferative action of
PDGF-BB in PASMCs isolated from rats with monocrotaline (MCT)-induced PAH.
2.2. In vivo animal studies
In addition to studies in vitro prompting to highlight whether BU counteracted the stimulatory role
of PDGF-BB on proliferation and migration of PASMCs, the aim of this research is to evaluate the
effect of HDACi in vivo. To this end, a rat model of PAH induced by MCT has been optimized.
The observation time for rat model of PAH is usually 4 or 5 weeks after induction of with MCT. In
this study 2 weeks-treatment with BU was tested starting 3 weeks after MCT injection and the sacrifice
have been performed at 5th week.
2.3. Patients’ blood related studies
Pulmonary hypertension (PH) is a common and severe pathophysiological condition
characterized by inadequate pathobiological human data and limited treatment resources.
Three type of patients affected by PH belonging group 1 have been included in the study, in
particular subject with IPAH, further divided in responder to vasoreactivity test (resp IPAH) and non-

38
responder (n-resp IPAH); subject with heritable PAH (HPAH) due to a mutation on BMPR2. All
patients have been compared to healthy subjects (control group) age and sex-matched.
The overall objective of this project is related to the identification of novel pathobiological
pathways in PBMCs of patients, as compared with those of healthy subjects individuals, by using high-
throughput Super-SAGE (Serial Analysis Gene Expression).
Specific study objectives:
- Significant genes expression differences between normal individuals and three groups of PAH
patients.
- Significant genes expression differences among the three groups of PAH patients.
- Multiple sorted genes entry analysis (Ingenuity Pathway Analysis) will be also performed to
identify possible clustering of differentially expressed genes in specific pathways and biological
processes.

39
3. Material and Methods
3.1. In vitro animal studies
3.1.1. Reagents and antibodies
Monocrotaline (MCT), Sodium Butyrate, Calyculin A, LY294002, Cell Growth Determination Kit,
MTT based, propidium iodide, protease and phosphatase inhibitors cocktail, BSA, trichloroacetic acid
and PMSF (SIGMA-Aldrich); DMEM, fetal bovine serum (FBS), penicillin and streptomycin, and L-
Glutamine (Lonza); PDGF-BB (PeProtech); Liquid scintillation ULTIMA Gold uLLT (PerkinElmer),
Cultrex BME (Tema Ricerca), annexin-V-Fluos staining kit (BD), protein A/G PLUS agarose
immunoprecipitation reagent (Santa Cruz). Primary antibodies: ki67 (Novocast); c-myc, anti-Acetyl
Lys, Akt and P-AktS473 (Cell Signaling); Actin and Cyclin D1 (BD); p27, p21, and PCNA (Santa Cruz).
Secondary antibodies: goat anti-mouse AlexaFluor555 (Invitrogen), HRP goat anti-rabbit IgG (Cell
Signaling), goat anti-mouse (BD), NovoLinkTM Polymer Detection System (Novocastra Laboratories
Ltd). Qiagen quantitect primers: cdkn2b (p15), kdr, tgfbr1, actb, gapdh, pcna, ednra, pdgfrb, ednrb,
myc, cdkn1a (p21), cdkn1b (p27).
3.1.2. Cell isolation and culture conditions
Rat PASMCs were isolated from pulmonary artery of animal receiving subcutaneously 60 mg/kg
of MCT (see paragraph in vivo studies). After 28 days from the injection, all rats were anesthetized in
a CO2/O2 mixture and subsequently killed by cervical dislocation to isolate pulmonary artery smooth
muscle cells (PASMCs) using a modification of previously described method [116]. Intrapulmonary
arteries were isolated and cleaned of connective tissue under a stereoscopic microscope. The tissue
was digested at 37°C for 20 min in DMEM containing collagenase type I, 250 U/ml (SIGMA-Aldrich).
FBS 10% was added to stop the reaction and the digested pieces were placed into petri dish
containing fresh complete medium and allowed to rest for one week. Cells were cultured in complete
medium consisting of high glucose DMEM supplemented with 10% FBS, 100 U/ml penicillin and 100
μg/ml streptomycin, 4mM L-Glutamine at 37°C in a humidified atmosphere of 5% CO2.

40
3.1.3. In vitro model of hyper-proliferation: experimental plan
For all experiments, PASMCs were starved the day after seeding with medium containing lower
percentage of serum (0.5% FBS). After 24 hours, cells were induced to proliferate and migrate by
replacing starvation medium with fresh medium containing 20 ng/ml PDGF-BB. BU was added
concurrently with the growth factor, while the inhibitors used to study the mechanism, such as 1 M
Calyculin A, and 25 M LY294002 (LY), were administered one hour before the treatment. PASMCs
from the third to the fourth passages were used for all studies. All experiments were repeated at least
three times, unless otherwise mentioned.
3.1.4. Cell proliferation and viability
Cell proliferation was evaluated using the MTT method, following the manufacturer’s instructions
(SIGMA). Briefly, MTT solution (0.5 mg/ml, final concentration) was added to each well at the end of
treatment and incubated for 2 hours at 37°C. The converted dye, insoluble purple formazan, was
solubilized by adding 10% SDS in a 10 mM HCl solution directly into the well. Data were collected at
570 nm with a multi-well plate reader (Dynex Technology).
For cell death detection, double labeling with propidium iodide (PI) and annexin-V (AV) was
carried out using an annexin-V-Fluos staining kit, according to the manufacturer’s instructions (BD). At
least 10000 events were recorded by the aid of FACS Aria instrument (BD). After the appropriate
markings for the negative and positive populations were set, the percentage of AV- /PI- (living cells),
AV+/PI- (early apoptosis), AV+/PI+ (late apoptosis, necrosis) staining were determined.
3.1.5. Immunofluorescence
PASMCs were seeded (5000 cells/cm2), starved and treated with molecules in low serum media.
After 24 hours, cells were washed with PBS and fixed in methanol for 10 min at room temperature
(r.t.). Permeabilization and saturation were performed using 0.1% Triton for 15 min and 5% BSA in
PBS for 1 hour at r.t., respectively. PBS added with 0.05% TWEEN 20 was used for washes. Primary
antibody for ki67 and secondary antibody alexafluor555-conjugated were suspended in BSA 1% in
PBS solution and incubated for 1 hour at 37°C. Nuclei were labeled using DAPI (10 ng/ml) for 15 min
at r.t. Antifade Prolong (Invitrogen) has been used to mounting glasses. The images was captured
using a microscope equipped with a digital sight camera (Nikon).

41
3.1.6. Cell cycle analysis
Cell cycle distribution was determined after propidium iodide (PI) staining, as previously
described Nusse’s method [159]. Trypsinized cells were centrifuged for 5 min at 800xg, and 2x10⁶
cells were resuspended in 1 ml solution I (584 mg/L NaCl, 1139 mg/L Nacitrate, 10 mg/L RNase and
0.3 ml/L Nonidet P-40). After 1 hour on ice, 1 ml of solution II (15 g/L citric acid, 85 g/L sucrose and 50
mg/L PI) was added and the samples were briefly vortexed. PI fluorescence forward scatter (FSC) and
side scatter (SSC) of cell suspension were used to assess cell cycle distribution of cells (10000
events) by flow cytometry.
3.1.7. Gene expression
Total RNA was isolated using RNeasy Micro Kit (Qiagen) following the manufacturer's
instructions. For RT-PCR, cDNA was synthesized in a 20-μl reaction volume with 1 μg of total RNA
and SuperScript III RT (Invitrogen). To assess indicated genes 0.2 μg of cDNA were used for real-time
RT-PCR performed with a Lightcycler system (Roche Diagnostics) and with the SYBR Green fast start
kit (Lightcycler® FastStart DNA MasterPLUS SYBR Green I). Qiagen quantitect primers were used in
real-time RT-PCR: cdkn2b (p15), kdr, tgfbr1, actb, gapdh, pcna, ednra, pdgfrb, ednrb, myc, cdkn1a
(p21), cdkn1b (p27). For each primer a melting curve analysis was performed and real-time PCR
efficiency was calculated. Data were normalized using gapdh and actin b (actb) as an index of cDNA
content after reverse transcription. Results were analyzed and related plots were created using
Relative expression Software Tool (REST 2009 V2.0.13, Qiagen) [160].
3.1.8. SDS-PAGE and Western Blotting
Proteins were obtained using M-PER (Pierce) mammalian protein extraction reagent, following
manufacturer’s instructions. Cells were washed with PBS, trypsinized and lysed with M-PER extraction
buffer additioned with 1 mM PMSF, protease and phosphatase inhibitor cocktail (SIGMA). Lysates
were subjected to SDS-PAGE and transferred to PVDF membranes. After blocking, the membranes
were probed overnight at +4°C with following primary antibodies: anti- cMyc, anti-Akt, anti-phospho
(S473) Akt (P-Akt), and anti-Acetyl Lys antibody (all from Cell Signaling); anti- Actin and anti-Cyclin D1
antibodies (all from BD); anti- p27, anti-p21, anti-PCNA, and anti-PP1 antibody (all from Santa Cruz).
Afterwards, the membranes were incubated for 1 hour at room temperature with secondary antibodies
conjugated to horseradish peroxidase (HRP): HRP goat anti-rabbit IgG (Cell Signaling) or goat anti-
mouse (BD). Bound antibodies were detected with the use of Immobilon Western HRP

42
Chemiluminescent Substrates (Millipore) and quantified by densitometry. The intensity of
phosphoprotein or protein bands was normalized respectively to that of the corresponding total
protein, or housekeeping protein, as indicated in the figures and legends.
3.1.9. Electron microscopy
The ultrastructural features of PASMCs were investigated by transmission electron microscope
(TEM). To preserve the natural morphology, cells were immediately washed and fixed in Karnowsky
fixative (2% glutaraldeyde, 4 % formaldeyde in 0.1 M phosphate buffer) directly in the culture plate for
20 minutes at room temperature. After mechanical removal, the cells were pelleted, fixed further for 24
hours with the same fixative at 4°C, and processed for TEM analysis. Samples were rinsed in PBS,
post-fixed in 1% buffered osmium tetroxide for 1 hour at room temperature, dehydrated through
graded ethanol and embedded in Araldite resin. Serial semi-thin sections were stained with Toluidine
blue. Ultrathin sections were counterstained with uranyl acetate and lead citrate and observed in a
Philips 400T (FEI Company, Milan, Italy) transmission electron microscope.
3.1.10. Mitosis analysis
For conventional histological analysis, pelleted cells were fixed in 10% buffered formalin and
embedded in paraffin; 4 µm-thick sections were stained with hematoxylin & eosin (H&E) and viewed in
a light microscope using the Image-Pro Plus® 6 software (Media Cybernetics, Silver Spring, MD).
Images were digitalized through a video camera (JVC 3CCD video camera, KY-F55B, Yokohama,
Japan) connected with a Leitz Diaplan light microscope (Wetzlar, Germany). Each sample was entirely
digitized using a 40x objective (final magnification 400x = high power field, HPF). The mitotic index
was calculated by counting the number of mitosis/ HPF.
3.1.11. Nucleolar Organizer Regions Silver morphometric analysis
The nucleolar organizer regions (NOR) are chromosomal landmarks consisting in tandemly
repeated sequences of ribosomal genes (rRNA). These portions of chromosomes are associated with
a nucleolus after the nucleus divides. NOR staining and quantification was carried out to evaluate
proliferation state by assessing proteins associated to the nucleolar organizer. Cells seeded on glass
slides were fixed in 2% paraformaldehyde in PBS supplemented with 1% Triton X-100. After washing
in distilled water, samples were stained with silver (Ag) for 13 minutes at 37°C in the dark using a
solution of one volume 2% gelatin in 1% aqueous formic acid, and two volumes of 50% silver nitrate.

43
After washing, cell seeded glasses were finally dehydrated and mounted in a synthetic medium with
no counterstaining. Morphometric analysis of Ag-stained NORs (AgNOR) was carried out by using the
Image-Pro Plus software, as previously reported [161]. For each experimental condition, AgNOR
intensely stained nucleolar (na) and nuclear areas (Na) of at least 60 nuclei were measured, and
results expressed as na/Na ratio x 100.
3.1.12. Wound healing assay
For scratch wound assays, confluent cells were starved and stimulated with PDGF in the
absence or presence of BU. Untreated cells were used as a control. After 16 hours, cell layers were
wounded using a 200 μl micropipette tip, the floating cells were washed away with starvation medium,
and wound closure was monitored by phase microscopy until 24 hours. To exclude the proliferation
effect the time point utilized for measurement of migration was 6 hours. At this time cells were fixed
using methanol for 10 min and stained with 0.1% of crystal violet solution in 25% methanol for 30
minutes. The migration area was determined for quantitative assessment using software NIS-
Elements D3.2 (NIKON), and compared to the wound area at time zero.
3.1.13. Pulmonary artery ring assay
Pulmonary arteries were removed from rats receiving MCT (60 mg/ Kg), and immediately
transferred to a 50-ml tube containing 40 ml of ice-cold, serum-free DMEM. The fibro-adipose tissue
was carefully removed and artery rings were sectioned (1 mm), and rinsed extensively in three
consecutive washes of DMEM. The rings were embedded in 0.3 ml of Cultrex BME and the 48-well
plates were incubated at 37°C for 30 min to harden the semi-solid medium. Then, 0.3 ml of treatment
medium were added to each well, the cultures were kept at 37°C in a humidified environment, and fed
every three days. Time zero, three-, six-, and ten-day cultures were photographed using a Nikon
microscope equipped with a digital camera.
3.1.14. Immunoprecipitation assay
For the immunoprecipitation analysis, cells were dissolved in M-PER extraction buffer additioned
with 1mM PMSF, protease and phosphatase inhibitors (SIGMA). Cell extracts were centrifuged at
10,000g for 10 min at 4 °C, the obtained supernatants were incubated 1 hour with anti-Akt or anti-
Acetyl-Lysine antibody (Cell Signaling) and immunoprecipitated with Protein A/G–Agarose overnight at
4°C. Subsequently the beads were isolated by centrifugation and washed five times with M-PER to

44
extraction of protein fraction. Samples were eluted in 2x loading buffer and boiled for 5 minutes to
dissociate the immunocomplexes from the beads. Immunoprecipitates were separated by SDS PAGE,
followed by immunoblotting. The blot was probed with antibodies against against total Akt, Phospho-
Akt and Acetyl-Lysine.
3.1.15. Statistical analysis
Significant differences were determined among various groups by ANOVA followed by
appropriate post-test, or using a two-tailed, unpaired Student's t test. Values were expressed as
mean±SEM from 3 to 9 independent experiments. Differences at P<0.05 and P<0.01 were considered
statistically significant and extremely significant, respectively.
3.2. In vivo animal studies
3.2.1. Ethics Statement
Animal use was approved by the Bioethics Committee of the University of Bologna, in
compliance with Directive 2010/63/EU of the European Parliament.
3.2.2. Monocrotaline model of PAH in rats
Adult male Sprague-Dawley rats (200–250 g in body weight; Harlan Laboratories) were
subjected to a single subcutaneous injection of 60 mg/kg of MCT (SIGMA-Aldrich), saline was used for
untreated rats (sham) as described previously [116]. MCT (50mg/ml, final concentration) was
dissolved in HCl 1 N and NaOH 1 N was added to neutralize the solution. One hundred twenty
microliters of this solution have been injected for every 100 g of body weight. Animals received food
and water ad libitum and were housed under controlled conditions of light and temperature (23–25°C).
3.2.3. Study design
On Day 0 all animals were randomly divided into four groups as following:
1. Healthy group or sham: animals receiving saline solution (vehicle for MCT).
2. MCT group or CTR group or untreated group: animals receiving MCT, but any treatment with
BU.
45
3. BU 20 group: animal receiving MCT and treated with Sodium Butyrate at concentration 20
mg/kg/day.
On day 0 MCT rats received MCT (group 2 and 3) or saline (group 1) and three week after they
have been treated with BU (group 3) or saline (group 1 and 2).
The animals have been sacrificed by overdose of anesthesia at 5th week. Heart and lungs were
collected for further analyses.
3.2.4. BU administration
Since BU has a short half-life, Alzet® osmotic pumps (Model# 2002) were used to allow a
continuous administration (0.5 l/ hour). For sham and untreated animals the osmotic pumps have
been filled with saline solution.
The ALZET® osmotic pumps have been implanted subcutaneously on the back of rats, slightly
posterior to the scapulae following manufacturer’s guidelines:
Animal under anesthesia has been shaved and the skin over the implantation site has
been washed.
A mid-scapular incision has been performed.
An hemostat has been inserted into the incision, and, by opening and closing the jaws of
the hemostat, a pocket for the pump has been created.
The filled pump has been inserted a into the pocket.
The wound has been closed with wound clips or sutures.
3.2.5. Assessment of right ventricular hypertrophy
To assess right ventricular hypertrophy, hearts were removed and kept in physiological salt
solution. Subsequently, they were weighed and the atria were removed. Right ventricle (RV) was
separated from left ventricle (LV) and septum (S). Each part was weighed and the ratios of right
ventricle to left ventricle plus septum [RV/(LV+S)].
3.2.6. Histological analyses
Heart and lung samples were fixed in buffered formalin 4% overnight, and after paraffin
embedding the sections will be stained with hematoxilin-eosin (H&E).
46
To perform the histological analysis of right ventricle hypertrophy, the rat heart will be serially
sectioned into 2mm–thick sections from the apex of the heart perpendicular to the base-to-apex axis.
The third whole section from the apex will be processed for comparisons between the different groups.
Samples were fixed in buffered formalin and embedded in paraffin, and 4-m-thick sections
were used for histological and immunohistochemical analysis.
For conventional histopathological analysis, sections were stained with H&E.
The muscularization of arteries in lungs was investigated with an antibody directed against
alpha-smooth muscle actin (-SMA). Specimens were deparaffinated with xylene, rehydrated through
decreasing concentrations of ethanol, rinsed in distilled water, and subjected to an antigen retrieval
treatment. Antigens were unmasked with citrate buffer, pH 6.0, at 120 °C, 1 atm. for 20 min. After
cooling and washing, endogenous peroxidase activity was neutralized using a 3% H2O2 solution in
methanol absolute for 10 min at room temperature in the dark; sections were then processed for
immunohistochemistry with a non-biotin-amplified method (NovoLinkTM Polymer Detection System,
Novocastra Laboratories Ltd.). After washing with TBS, the slides were incubated with NovocastraTM
protein block for 5 min in a wet chamber to reduce the nonspecific binding of primary antibody and
polymer reagent and rinsed twice with TBS. After washing, slides were incubated for 30 min at room
temperature with NovocastraTM post-primary block to enhance penetration of the next polymer
reagent, rinsed in TBS, and incubated with NovoLinkTM Polymer for 30 min at RT, and subsequently
with 3,3’-diaminobenzidine, prepared from NovocastraTM 3,3'-diaminobenzidine chromogen and
NovoLinkTM 3,3’-diaminobenzidine substrate buffer. Sections were rinsed in distilled water,
counterstained with Gill’s hematoxylin. Negative control was obtained by omitting the primary
antibody.
Successively, samples were dehydrated, coverslipped, and viewed by light microscopy using the
Image-Pro Plusprogram. Images were digitized through a video camera (JVC 3CCD video camera,
KY-F55B) connected with a Leitz diaplan light microscope; original images were analyzed using
Image- Pro Plus6 software (Media Cybernetics, Inc.).
Myocytolysis has been assessed after H&E staining of RV sections. Lighter stained cytoplasm
(with clear patches), due to the presence of glycogen in place of contractile elements in the cytoplasm
is an hallmark of this damage. To evaluate the differences between different groups a score value
from 0 to 5 has been attributed, meaning the absence and high presence of myocytolysis,
respectively. The injury score is a ratio between the mean of each section score and the number of
examined sections.

47
3.2.7. Statistical analysis
Significant differences were determined among various groups by unpaired Student's t test.
Values were expressed as mean±SEM. Differences at P<0.05 and P<0.01 were considered
statistically significant and extremely significant, respectively.
3.3. Patients’ blood related studies
3.3.1. Study design
Three type of patients affected by PH belonging group 1 have been included in the study, in
particular subject with Idiopathic PAH (IPAH), further divided in responder to vasoreactivity test (resp
IPAH) and non-responder (n-resp IPAH); subject with heritable PAH (HPAH) with BMPR2 mutation. All
patients have been compared to healthy subjects (control group) age and sex-matched.
PBMCs have been isolated from 20 ml of venous blood samples, and RNA extracted has been
stored at 80°C until performing the analysis. Five microgram of total RNA was used for SAGE and 4
g was retrotrascribed to cDNA for subsequent validation with real time PCR analysis.
SAGE library construction has been carried out in 8 healthy subjects and 13 patients affected by
PAH, including 4 n-resp IPAH, 3 resp IPAH and 6 HPAH.
Libraries have been sequenced using SOliD technique by Genomnia srl (Milano).
The identification of genes with significant differential expression between different groups have
been performed by Genomnia srl (Milano) using Bioconductor software, in particular “edgeR” and
DESeq.
Then, each sorted gene will be individually analyzed for his potential interest in the pathobiology
of PH, as a target for treatment and as a marker of severity. This assessment has been performed
through “raw” molecular function, literature association, gene expression experiment’s data (GEO),
mendelian inheritance peculiarity (OMIM) and oddities. A multiple genes entry analysis will be also
performed to identify possible clustering of differentially expressed genes in specific pathways and
biological processes.
Further analyses are required to validate down- and up-regulated gene ensued by SAGE. To
this end, real time RT-PCR on PBMC samples from the same subjects and additional samples will be
performed in the future.

48
3.3.2. Patient and healthy volunteers enrolment
This study has been carried out according to the principles of Declaration of Helsinski, and
written informed consent was obtained from all patients and healthy volunteers.
The enrolment has been performed by S.D.D. Center of PH at S. Orsola-Malpighi Hospital in
Bologna, coordinated by Prof. Nazzareno Galiè.
At baseline all patients referred to the Center were assessed by physical examination, 6MWD,
RHC, and vasoreactivity test.
Male and female subjects over 18 years of age with idiopathic PAH diagnosed according to
current PAH guidelines [3] in WHO functional class II and III were included in this study. The presence
of PAH has been defined by a mean pulmonary arterial pressure (mPAP) > 25 mmHg at rest, by
pulmonary capillary wedge pressure (PCWP) ≤ 15 mmHg and pulmonary vascular resistance (PVR) >
3 mmHg/ l/ min (Wood units). Patients were ‘naïve’, any specific therapy for PAH was a requisite to
exclusion.
Patients were excluded from the study if they had PH, belonging to the groups 2 to 5 of the Dana
Point classification, PH owing to left heart disease (PCWP > 15mmHg, PH owing to lung diseases or
hypoxia chronic thromboembolic PH, and PH with unclear multi-factorial mechanisms).
3.3.3. Peripheral Blood Mononuclear Cells isolation
Venous blood samples were collected in the morning and processed within 30 minutes. The
blood was drawn from a peripheral venipuncture into vacutainer tubes (BD) containing
ethylenediaminetetraacetic acid. PBMCs were isolated from 20 ml of whole blood with Lympholyte®-H
(CEDARLANE) following the manufacturer’s instructions. Briefly, blood were diluted 1:2 with PBS and
stratified onto the equal volume (20 ml) of Lympholyte. After centrifugation performed at room
temperature 1500g for 30 minutes avoiding acceleration and deceleration steps, the ring related to
PBMCs was collected and transferred in a new tube. Hemolysis and washes were performed to obtain
a pure population of cells.
RNA was isolated from PBMCs with RNeasy Micro kit (Qiagen) following the manufacturer’s
instructions. The integrity of RNA was assessed using a microfluidics-based platform, Agilent 2100
Bioanalyzer and NanoDrop.

49
3.3.4. Serial Analysis Gene Expression (SAGE) library construction
High-throughput Super-SAGE™ combines Super-SAGE with SOLiD platform, a Next Generation
Sequencing (NGS) technique.
SOLiD™ SAGE™ is based on two major principles:
• A sequence tag cleaved from the 3’-most Nla III restriction site in each transcript contains
sufficient information to uniquely identify the transcript.
• The expression level of the transcript can be quantified by the number of times a particular tag
is observed (one tag = one transcript).
The 3’ end SOLiD SAGE library construction was used to generate library of 27 bp ‘tags’ for all
the transcripts in a cell, followed by Sequencing by Oligonucleotide Ligation and Detection (SOLID)
sequencing of the tags and downstream mapping to RefSeq mRNA and genome databases. To this
purpose SOLiD-SAGE kit (life technology) was used and all passages have been performed following
manufacturer’s instructions.
The SOLiD™ SAGE™ system employs a modified version of the original protocol (Velculescu)
that generates a longer tag (27-bp) per transcript, using EcoP15I digestion. Briefly, polyA RNA is
directly captured from cell lysates using oligo-dT coated beads and converted to cDNA. A frequently
cutting anchoring enzyme, usually NlaIII, is used to cleave cDNA molecules, leaving the 3’ end of the
cDNA attached to the beads. Linkers are ligated to the immobilized cDNA fragments. These contain a
site for a type III restriction enzyme EcoP15I used as the tagging enzyme. EcoP15I binds to a
recognition sequence in the adapter adjacent to the CATG site and cleaves the cDNA 27 bp
downstream from the adapter.
Description of the procedure:
1. RNA Binding: Bind purified total RNA to Dynabeads® Oligo(dT) EcoP magnetic beads. The
beads capture poly(A) RNA directly from total RNA.
--------------AAAAAAAA(A)
TTTTTTTT-EcoP(dT)
2. cDNA Synthesis: Synthesize double-stranded cDNA from the RNA on the beads using
SuperScript® III Reverse Transcriptase and E. coli DNA polymerase. Performing all the
enzymatic steps in one tube enhances the efficiency of cDNA synthesis.

50
--------------AAAAAAAA(A)
--------------TTTTTTTT-EcoP(dT)
3. Nla III Digestion: Digest the double-stranded cDNA with Nla III, a sequence-specific restriction
endonuclease that cleaves ~99% of all human transcripts in RefSeq. Nla III is used as an
anchoring enzyme, because Nla III sites are known to occur approximately every 250 bp.
--------------AAAAAAAA(A)
GTAC--------------TTTTTTTT-EcoP(dT)
4. Adapter A Ligation: Adapter A contains a cohesive 4-bp overhang complementary to the Nla
III-digested cDNA, an EcoP15I restriction enzyme recognition site at the 3′ end, and a priming
site for PCR amplification (P2).
CATG--------------AAAAAAAA(A)
GTAC--------------TTTTTTTT-EcoP(dT)
5. EcoP15I Digestion: EcoP15I is a Type III restriction endonuclease used as the tagging
enzyme. EcoP15I binds to a recognition sequence in the adapter adjacent to the CATG site
and cleaves the cDNA ∼27 bp downstream from the adapter, releasing a tag with a 2-bp
overhang. The tag consists of 33 bp of adapter sequence and 27 bp of unique sequence from
a single transcript.
CATG--------------AAAAAAAA(A)
GTAC--------------TTTTTTTT-EcoP(dT)
6. Adapter B Ligation: Adapter B contains the other PCR priming site (P2) and SOLiD™
sequencing initiation sites.
CATG--------------AAAAAAAA(A)
GTAC--------------TTTTTTTT-EcoP(dT)
7. PCR Check: Purify and PCR amplify if necessary. Proceed to emulsion PCR and SOLiD™
sequencing, followed by analysis using SOLiD™ SAGE™ software.
Adapter A-EcoP
(P2 Seqs)
Adapter A-EcoP
(P2 Seqs)
Adapter A-EcoP
(P2 Seqs)

51
Adapter B
(P1 Seqs)
CATG--------------NNN
GTAC--------------------
3.3.5. Quality and control of SAGE library
The quality of the SAGE tags can be determined by PCR, followed by visualization of the 100-bp
tags by gel electrophoresis. Table 3 showed the procedure of sample preparation.
Experimental sample corresponds to ‘tag template from Adapter B Ligation’ (at the end of step
7), the negative controls are represented by the no-ligase negative control from EcoP15I Digestion
(steps 5 and 6, respectively).
Table 3. Sample preparation
Reagents Experimental No-template No-ligase
Template Control Control
5´ Amp Primer 0.5 μl 0.5 μl 0.5 μl
3´ Amp Primer 0.5 μl 0.5 μl 0.5 μl
Platinum® PCR SuperMix High Fid. 48 μl 49 μl 48 μl
SAGE tag template (20 μL total) 1 μl — —
No-ligase negative control — — 1 μl
Total volume 50 μl 50 μl 50 μl
Amplification step of PCR has been performed using the cycling parameters showed in table 4.
During the PCR reaction tagged template at 5, 10, 15, and 20 cycles have been collected to gel
electrophoresis analysis.
Table 4. Cycling parameters
Temperature Time Cycles
95°C 2 minutes 1
95°C 55°C 72°C
30 seconds 1 minute 1 minute
20 total (collect template
at 10, 15, and 20)
72°C 5 minutes 1
Adapter A-EcoP
(P2 Seqs)

52
PCR products have been run on a 4% agarose gel in TAE buffer with a DNA mass ladder 100bp.
The SAGE tagged template should appear as a clear 100-bp band. The manufacturer informed that
the cycle number that provides the optimal amplification can vary from sample to sample. Bands of
lower molecular weight may indicate adapter self-ligation products or primer dimers.
The negative controls (No-template and No-ligase Controls) should not contain any contaminating
amplified product of the size of the tags.
After analyzing the quality of the SAGE tags, a bioanalyzer have been used for quantification.
Purification of the tags has been performed using PureLink PCR Micro kit (Invitrogen) that can
distinguish the 100-bp tags from spurious 70–80 bp artifacts, such as primer dimers or adapter self-
ligations.
Samples have been sent on dry ice to Genomnia srl (Milano) for next steps: Emulsion PCR
preparation and SOLiD™ Sequencing.
3.3.6. Statistical analysis
SAGE data analysis was performed by Genomnia srl (Milano) with “edgeR” (R 2.13.0 version
for Windows 64 bit), an open-source-interpreted computer language for statistical computation and
graphics, and tools from the Bioconductor project.
Each library lead to about six million of sequenced tags, the computation analysis revealed
about 14,000 corresponding transcritpts. Statistical analysis lead to define significant differential
expressed genes within different comparisons. For each comparison a tagwise dispersion plot has
been created. This is a dotplot, in which the y and x axis correspond to the Fold Change and the
abundance of transcripts (expressed as concentration), respectively. Each dot correspond to a
particular transcript. In red have been reported all transcripts with significant differential expression P
value<0.005. The tagwise dispersion plot is useful to evaluate the existing variations (including
biological and technical variations).
Results, reported as Ref_seq, fold change significance and annotation, have been exported in
an Excel file.

53
4. Results
4.1. In vitro animal studies
4.1.1. Proliferation and viability assays
MTT viability assay revealed that a single pulse of PDGF-BB markedly increased PASMC
proliferation up to 120 hours, as compared to the control group (Figure 5); BU dose-dependently
reduced the growth factor effect after 24 hours of treatment, with cell proliferation remaining lower than
that detected in cells cultured in presence of PDGF-BB alone throughout the overall observation
period.
However, since 25 and 50 mM BU depressed cell viability, all the experiments were performed in
the presence of a lower physiological concentration of 5 mM [162]. At this concentration, Annexin V-
FITC and PI staining revealed that the percentage of cells in early apoptosis (AV+/PI-) was not
affected compared to the control group or cells exposed to PDGF-BB alone (Figure 6). Furthermore,
the percentage of cells in late apoptotic/ necrotic death (AV+/PI+) was not altered by BU compared to
PDGF-BB stimulated cells (Figure 6).
Figure 5. Proliferation in PASMCs isolated from PAH-rats. MTT assay at 24, 48, and 120 hours using a scale concentration of BU (n= 5). Significance versus stimulated cells (PDGF) was shown. Statistical analysis: ANOVA with Bonferroni post Test. Significance * p<0.05, ** p<0.01, *** p<0.001.

54
4.1.2. Cell cycle analysis
Immunofluorescence analysis showed that following 24 hours of PDGF-BB treatment 52±7.96 %
of PASMCs expressed the proliferating marker ki67, while the presence of 5 mM BU remarkably
counteracted the growth factor effect, decreasing the percentage of ki67 positive cells (24±3.84 %) to
a value superimposable to that observed in the control group (17±5.72 %) (Figure 7, A and B).
Figure 6 . Annexin V assayPI and annexin-V (AV) double labeling. Data were expressed as percentage of living cells (AV-/PI-), early apoptosis (AV+/PI-), and late apoptosis/ necrosis (AV+/PI+) (n=5). Significance versus stimulated cells (PDGF) was shown. Statistical analysis: ANOVA with Bonferroni post Test. Significance * p<0.05, ** p<0.01, ***
p<0.001.
Figure 7. (A) Immunofluorescence for ki67 and relative quantification (B). BU reduced PDGF-BB induced proliferation of PAH-PASMCs. (A) Immunofluorescence of Ki67 proliferation marker (red), nuclei were counterstained with DAPI (blue), merged images are reported in the lower panels. (B) Quantification of ki67 staining, results were expressed in % of positive cells normalized to the number of nuclei. Statistical analysis: ANOVA with Bonferroni post Test; significance versus stimulated cells (PDGF) * p<0.05, ** p<0.01,

55
Akin to this observation, cell cycle analysis (Figure 8) revealed that PDGF stimulation
significantly decreased the percentage of quiescent cells (G1/G0 phases) and increased the number
of cells in the proliferative state (S+G2/M), as compared to the control group. BU arrested PASMC cell
cycle mainly by blocking the transition throughout G0/G1 and S phase, thus increasing the number of
quiescent cells.
Figure 8. Cell cycle analysis. The percentage of cells in G0/G1, S and G2/M phases of the cell cycle were determined by cytofluorimetric analysis after PI staining (n=3). Statistical analysis: ANOVA with Bonferroni post Test; significance versus stimulated cells (PDGF) * p<0.05, ** p<0.01, *** p<0.001.
4.1.3. Ultrastructural and morphometric analyses
TEM analysis showed that control PASMCs had the appearance of very thin, bipolar spindle-like
elements, with extremely long cytoplasmic projections. Such ultrastructure remained unaltered when
cells were treated with a combination of BU and PDGF-BB, whereas a plump spindle-like morphology
Figure 9. Ultrastructural, histological analysis of PASMCs. (A) TEM analysis at 24 hours of treatment. Scale bars: 5μm. (B) Representative images of pelleted cells used to count mitosis after H&E staining. Original magnification 25x. Scale bars: 50 μm. (C) Quantitative analysis of the total number of mitosis for each condition. * p<0.05.

56
was observed in the presence of growth factor alone (Figure 1, A). Consistent with these
morphological observations, the number of mitotic nuclei was similar between the control group and
PASMCs concomitantly exposed to PDGF-BB and BU, despite a remarkable increase in the mitotic
figures observed in cells exposed to the growth factor alone (Figure 9, B and C).
The morphometric analysis of silver-stained Nucleolar Organizer Regions (AgNOR) has been
used to evaluate the nucleolar/ nuclear areas (na/Na) ratio. Nucleoli within the PASMCs nuclei were
intensely dark-stained without any counterstaining (Figure 10, A). Quantitative morphometric analysis
reveals that the mean na/Na ratio normalized to control was increased after PDGF-BB treatment. On
the contrary, in presence of BU, the mean na/Na ratio decreased compared to control quiescent cells
(Figure 9, B). Similar results were yielded using electron microscopy where nucleoli were revealed
trough their characteristic substructure (Figure 10, C).
4.1.4. Gene and protein expression analyses
Gene expression analysis showed that BU acted at the transcriptional level in PASMC
proliferation, respectively decreasing or increasing the gene expression of important positive or
negative cell cycle regulators. None of these genes was affected within the first 3 hours of treatment
(data not shown). However, after 6 hours of BU exposure, pcna, c-myc, and cyclin D1 were
significantly decreased, compared to PDGF alone (Figure 11). At the same time, the negative
regulators p21 and p15 were significantly increased when compared to PDGF (Figure 11). After 24
hours of treatment with BU, only the pcna gene expression was still decreased (data not shown).
Figure 10. Ultrastructural, and morphometric analysis of PASMCs. (A) Morphometric analysis of silver-stained NORs proteins results were expressed as mean nucleolar/ nuclear areas (m na/ m Na) ratio normalized to control. * p< 0.05 (B) PASMCs selectively stained for the AgNOR proteins. Original magnification 25x. Scale bars: 50 μm. (C) Ultrastructural features of PASMCs nucleoli (indicated by arrows). Scale bars: Ctr=2 μm; PDGF and BU=5 μm

57
At protein expression level, the treatment with HDACi decreased c-myc, cyclin D1, and PCNA
after 8 hours (Figure 12). At the same time, p27 expression was not affected, whereas p21 was
increased (Figure 12).
As early as 3 hours of treatment, BU significantly reduced the gene expression of PDGFRbeta,
compared to PDGF-BB treatment (data not shown), reaching a maximal transcriptional decrease after
6 hours (Figure 13).
Figure 12. Protein expression analysis of cell cycle regulators. Immunoblotting analysis of positive (c-myc, cyclin D1, PCNA) and negative regulators of cell cycle (p21 and p27) after 8 hours of treatment. The images reported is representative of five independent
experiments.
Figure 13. Gene expression analysis of crucial signaling receptors PDGFRbeta1, TGFRbeta1, KDR, Ednra and Ednrb, after 6 hours of treatment. Realtime PCR data were normalized to gapdh and actin beta housekeeping genes and expressed as relative fold change of PDGF+BU compared to PDGF treatment (n=5). Statistical analysis, REST 2009 Qiagen: significance versus stimulated cells (PDGF) * p<0.05, ** p<0.01,
*** p<0.001.
Figure 11. Gene expression analysis of cell cycle regulators. Gene expression analysis of positive (c-myc, pcna, and cyclin D1) and negative regulators (p21 and p15) after 6 hours of treatment. Realtime PCR data were normalized to gapdh and actin beta housekeeping genes and expressed as relative fold change of PDGF+BU compared to PDGF treatment (n=5). Statistical analysis, REST 2009 Qiagen: significance versus stimulated cells (PDGF) * p<0.05, ** p<0.01, ***
p<0.001.

58
At 24 hours of treatment, BU downregulated the transcription of genes encoding for Ednra (ETA
gene) and Ednrb (ETB gene) (Figure 14), two G protein-coupled receptors of the ET-1 family that are
deeply involved in PAH progression [163]. Conversely, BU did not affect TGFRbeta1 gene expression,
while increasing the transcription of KDR, a major VEGF receptor (Figure 14).
4.1.5. Migration assays
Two different migration assays have been considered to evaluate the effect of BU on PDGF-BB
induced migration of PASMCs. First, we examined the effect of 5 mM BU on cell migration using a
Figure 14. Gene expression analysis of crucial signaling receptors PDGFRbeta1, TGFRbeta1, KDR, Ednra and Ednrb, after 24 hours of treatment. Realtime PCR data were normalized to gapdh and actin beta housekeeping genes and expressed as relative fold change of PDGF+BU compared to PDGF treatment (n=5). Statistical analysis, REST 2009 Qiagen: significance versus stimulated cells (PDGF) * p<0.05, ** p<0.01, *** p<0.001.
Figure 15. Wound healing assay. (A) PASMCs have been stained with crystal violet at 6 hour of migration time. Interrupted line indicates time zero. (B) Quantitative results of wound healing assay (n=6); the measure was obtained by the difference between migration area after 6 hour and the initial area of the wound. Statistical analysis: ANOVA with Bonferroni post Test; ** p<0.01, *** p<0.001.

59
wound healing migration assay (Figure 15, A and B). Starved PASMCs were exposed for 16 hours to
PDGF in absence or presence of BU. At the end of the incubation time, wound was performed and
migration was monitored. At each investigated time, the presence of BU remarkably counteracted the
migratory action of PDGF-BB, even at late times (16-24 hours), when cells solely exposed to the
growth factor were induced to completely cover the wound area. The area of migration was calculated
after 6 hours (Figure 15, B) in order to reduce any effect due to the proliferation process.
To confirm the inhibitory effect of BU on PDGF-induced migration we performed pulmonary
artery ring assays. In this model, starting from 6 days, PDGF-BB induced a progressive sprouting of
the pulmonary artery that was completely arrested by BU throughout 12 days (Figure 16).
4.1.6. Mechanism of action
It is well known that PDGF-BB promotes cell proliferation activating the Akt pathway.
Interestingly, Akt phosphorylation was induced by the growth factor after 1 hour of treatment even in
the presence of BU (Figure 17, A). However, after 7 hours of treatment in the presence of the HDAC
inhibitors the phosphorylation of Akt at Ser473 was strongly reduced, and this effect was maintained
up to 24 hours (Figure 17, A). The PI3K inhibitor, LY294002, completely suppressed Akt activation
and consequently counteracted the stimulatory effect of PDGF-BB on proliferation (Figure 17, B) and
migration (Figure 17, C). Conversely, no additive effect of BU and LY294002 was observed.
Figure 16. Pulmonary artery rings assay. Pulmonary artery isolated from MCT-treated rats have been cut and included in semisolid medium.t The day after they have been treated as indicated. The sprounting has been followed throughout 12 days.

60
We investigated whether BU may have inhibited PDGFBB-induced Akt activation through a
deacetylase inhibitory action.
While basal acetylation was not affected by PDGF-BB, protein expression analysis revealed that
after 7 hours, a time point at which BU elicited a significant downregulation in phosphorylated Akt, BU-
treated cells also exhibited a remarkable increase in the level of acetylated Akt (Figure 18, A). Time
Figure 17. (A) Akt immunoprecipitation after 7 hours of treatment with PDGF and BU; immunoblotting analysis of Ac-Lys (up) and Akt (down). (B) Comparison between the Phospho-AktS473 level before (Total lysate) and after immunoprecipitation with anti-Acetyl lysine antibody (IP anti Ac-Lys) in cells at 1 hour-treatment with PDGF and BU. These are representative blots of five independent experiments.
Figure 18. (A) Time-course of phospho-AktS473, and total Akt, in PASMCs treated with PDGF in presence or absence of BU or TSA; untreated cells were used as control. These are representative blots of 9 independent experiments. (B) Quantification of Ki67. staining after 24 hours in presence or absence of PI3K inhibitor, LY294002. Results were expressed in % of positive cells normalized to the number of nuclei. (C) Quantification of migrated cell surface area after 6 hour of migration time in presence or absence of PI3K inhibitor, LY294002. Statistical analysis for (B) and (C): ANOVA with Bonferroni post Test; * p<0.05, ** p<0.01, *** p<0.001.

61
course analysis also revealed that BU-mediated acetylation was already evident at 1 hour, a time point
at which Akt was still phosphorylated (Figure 18, B).
We next investigated whether the ability of BU to downregulate Akt phosphorylation may result
from facilitation of Akt dephosphorylation by a mechanism involving protein phosphatases. To this
end, we used two well-known inhibitors whit a distinct specificity towards phosphatases, okadaic acid
which is selective for PP2A at low concentrations (≤ 100 nM) [164, 165], and calyculin A which doesn’t
discriminate between PP1 and PP2A [166].
Calyculin A restored at 7 hours the Akt phosphorylation in BU treated cells (Figure 19), while
okadaic acid was ineffective, suggesting a preferential involvement of PP1.
4.2. In vivo animal studies: preliminary results
At baseline Sprague-Dawley male rats were weighed and subjected to subcutaneous injection of
MCT or saline solutions. Therefore, they have been divided randomly into three groups, as follow:
- Sham
- MCT group
- MCT+BU group
The treatment with BU (20mg/Kg/day) was applied from day 21 to 35 to MCT+BU group.
Since this HDACi has a short half-life we used Alzet® osmotic pump to allow its continuous
administration. To this end, ALZET® were filled with a solution of BU 500 mM; on the other hand, for
untreated animals (sham and MCT groups) the osmotic pumps were filled with saline solution.
Figure 19. Immunoblotting for phospho-AktS473 and total Akt after 7 hour of treatment. Calyculin A and Okadaic acid were added 1 hour before the treatment to inhibit the phosphatase activity. The blots are representative of six independent experiments.

62
Five weeks after, rats have been sacrificed by overdose of anesthesia, then hearts and lungs
have been collected and processed for histological analyses.
The animals receiving MCT developed increase in pulmonary arteriolar muscularization (Figure
20) and right heart hypertrophy (Figures 21) compared to saline treated group.
Interestingly, the treatment with BU significantly reduced the thickness of distal pulmonary
arteries compared to MCT-group, as shown in figures 20.
Figure 20. Thickness of distal pulmonary arteries.
Five m sections were stained with alpha-
smooth muscle actin (-SMA) antibody (brown staining). (A) Sham, (B) MCT, (C) MCT+BU.
Statistical analysis: t-Test; * p<0.05, ** p<0.01.
Figure 21. H&E staining of RV sections. (A) sham, (B) MCT, (C) MCT+BU. (D) RV/LV+S ratio were calculated as index of Right heart hypertrophy. Statistical analysis: t-Test; *** p<0.001.

63
The ratio of RV weight to LV plus septum weight (RV/LV+S) increased from 0.19±0.03 (sham) to
0.41±0.08 (P<0.01 versus sham). BU caused a reduction of this ratio to 0.31±0.05 (P<0.05 versus
MCT; P<0.01 versus sham) (Figure 20, D). Consistent with RV/LV+S ratio, the thickness of RV was
significantly reduced in BU group (Figure 21, A-C).
Examination of right ventricular free wall, interventricular septum, and left ventricular posterior
wall in the Control group revealed normal myocytes without evidence of inflammatory cells or collagen
deposition. In contrast, in MCT-treated rats, a diffuse interstitial inflammatory infiltration was evident
throughout the myocardium. Interestingly, the treatment with BU strongly reduced MCT-induced
myocytolysis in cardiac cells (Figura 22).
4.3. Patients’ blood related studies: preliminary results
Patients have been assessed at baseline with 6 six minute walk test, vasoreactivity test, RHC
and screened for BMPR2 mutation.
SAGE evaluation has been performed in 8 healthy subjects (Table 6) and in 13 PAH patients
(Table 5), including 3 responder PAH (res PAH), 4 non responder PAH (n-res PAH), and 6 heritable
PAH (HPAH). All patients and healthy subject have been screened for BMPR2 mutation by TAO
laboratory at Cardiovascular Department of S.Orsola Malpighi Bologna.
Before sequencing step Quality & Control check of libraries have been performed using gel
electrophoresis analysis and Bioanalyzer.
Figure 22. Myocytolysis. H&E staining of RV. (A) sham, (B) MCT, (C) MCT+BU. Statistical analysis: t-Test; *** p<0.001. Myocytolysis has been measured on RV sections from each group. A score value from 0 to 5 has been attributed, meaning the absence and high presence of myocytolysis, respectively. The injury score is a ratio between the mean of each section score and the number of examined
sections.

64
Table 5. Enrolled patients (PAH)
Sample Type of PAH age sex BMPR2
mutation
1-PAH n-resp IPAH 30 F WT
2-PAH n-resp IPAH 41 M WT
3-PAH n-resp IPAH 57 M WT
4-PAH n-resp IPAH 59 M WT
5-PAH resp IPAH 27 F WT
6-PAH resp IPAH 29 F WT
7-PAH resp IPAH 48 F WT
8-PAH HPAH 28 F snp S775N Ex 12
(C): 2324 G/A
9-PAH HPAH 35 F intr10 1014-2A/G
10-PAH HPAH 37 F V341L - K342X
11-PAH HPAH 38 F S987F
12-PAH HPAH 29 M R899X
13-PAH HPAH 59 M R491W
Table 6. Enrolled healthy subjects (H)
Sample age sex BMPR2
mutation
1-H 27 F WT
2-H 30 F WT
3-H 40 F WT
4-H 55 F WT
5-H 28 M WT
6-H 46 M WT
7-H 55 M WT
8-H 61 M WT

65
Amplification step of PCR has been performed and during the reaction tagged template at 5, 10,
15, and 20 cycles have been collected. PCR products have been run on a 4% agarose gel in TAE
buffer with a DNA mass ladder 100bp (Figure 23).
For the quality control of libraries we used also bioanalyzer technology. In the electropherogram
the peak at 135 bp is related to SAGE library (Figure 24). The absence of other significant peaks
indicates a satisfactory grade of purity for sequencing analysis. Since, samples showed two bands at
15 cycles of PCR, 10 cycles amplification reaction has been performed on libraries before sequencing,
in order to reduce amplification of any unspecific products. In all samples negative controls did not
showed any bands, indeed any contaminating amplified product of the size of the tags was present in
libraries.
Data analysis revealed 15000 entries (transcripts) from 6 million of tags. Generalized linear
Figure 23. Quality&control of SAGE library. Gel Electrophoresis analysis. Negative controls (no-ligase and no-template). Samples have been collected at 5, 10, 15, and 20 cycles of
PCR.
Figure 24. Quality&control of SAGE library Bioanalyzer Electropherogram: the
peak at about 135 bp correspond to SAGE library.

66
model methods (GLMs) was used to detect differential expression in three comparisons:
1. n-resp IPAH vs Healthy subjects
2. res IPAH vs Healthy subjects
3. HPAH vs Healthy subjects
The comparison between n-resp IPAH patients and healthy subjects revealed 361 genes with
significant differential expression (p<0.005). In particular 270 genes were up- and 91 were down-
regulated (Figure 25). Clusterization of biological functions is reported in table 7.
Table 7. Comparison between n-resp IPAH patients’ and healthy subjects’ profiles: biological function clusterization within genes with significant differential expression
n-resp IPAH
within up regulated genes number of
genes
Cancer 20
Cell-To-Cell Signaling and Interaction 16
Cellular Growth and Proliferation 16
Drug Metabolism, Molecular Transport, Cell Death 13
Hematological Disease 7
Cardiovascular System Development and Function 7
Hereditary Disorder 5
Skeletal and Muscular System Development and Function
2
Figure 25. Tag wise dispersion plot related to the comparison between n-resp IPAH patients and Healthy volunteers. Logaritm of Fold Change (Log FC), abundance of transcripts expressed as Logaritm of concentration (Log Conc). In red have been reported all transcripts with significant differential
expression, P value<0.005.

67
The comparison between resp IPAH patients and healthy subjects revealed 395 genes with
significant differential expression (p<0.005). In particular, 362 genes were up- and 33 were down-
regulated (Figure 26).
Biological function clusterization is reported in table 8.
Interestingly, the overlapping analysis of this two comparisons revealed 21 shared genes,
biological function clusterization of which is reported in table 9. Within these 21 genes 7 are involved
in cell-to-cell signaling and interaction, 3 in cellular movement, probably all of these are related to the
inflammation process; besides, 5 are involved in cancer, increasing the hypothesis of parallelisms
between tumor condition and PAH.
Table 8. Comparison between resp IPAH patients’ and healthy subjects’ profiles: biological function clusterization within genes with significant differential expression
resp IPAH
within Up-regulated genes number of
genes
Cellular Development (smooth muscle cells) 5
Cellular Growth and Proliferation (smooth muscle cells) 5
Cell-To-Cell Signaling and Interaction 2
Inflammatory Response 2
Cell Death (repopulation of fibroblasts) 2
Cancer 22
Cancer /hematological disease (large-cell lymphoma) 2
Cancer mammary tumor 11
Figure 26. Tag wise dispersion plot related to the comparison between resp IPAH patients and Healthy volunteers. Logaritm of Fold Change (Log FC), abundance of transcripts expressed as Logaritm of concentration (Log Conc). In red have been reported all transcripts with significant differential
expression, P value<0.005.

68
Table 9. Overlapping analysis between n-resp IPAH vs H and resp IPAH vs H
Shared genes between resp IPAH and n-resp IPAH
within shared genes (Total 21) number of
genes
Cell-To-Cell Signaling And Interaction 7
Cancer 5
Cellular Movement 3
Drug Metabolism 3
Hematopoiesis Abnormal Morphology Of pro-Erythroblasts 1
The comparison between HPAH patients and healthy subjects revealed 2039 genes with
significant differential expression (p<0.005). In particular, 1246 genes were up-regulated and 792 were
down-regulated (Figure 27).
Interestingly, the elevated number of genes with significant differential expression suggest an
increased homogeneity within the group of HPAH with BMPR2 mutation compared to IPAH patients.
In addition, differing from the two previous comparisons in HPAH vs Healthy subject comparison
the number of down-regulated genes was higher rather than up-regulated genes, probably due to
BMPR2 mutation.
Biological function clusterization is reported in table 10.
Worthy to note, according to BMPR2 mutation within down-regulated genes most are related to
TGF-beta pathway. Besides, a high number of genes involved in immune system highlights the
relevant role of inflammation in this disease.
Figure 27. Tag wise dispersion plot related to the comparison between HPAH patients and Healthy volunteers. Logaritm of Fold Change (Log FC), abundance of transcripts expressed as Logaritm of concentration (Log Conc). In red have been reported all transcripts with significant differential expression; P value
<0.005.
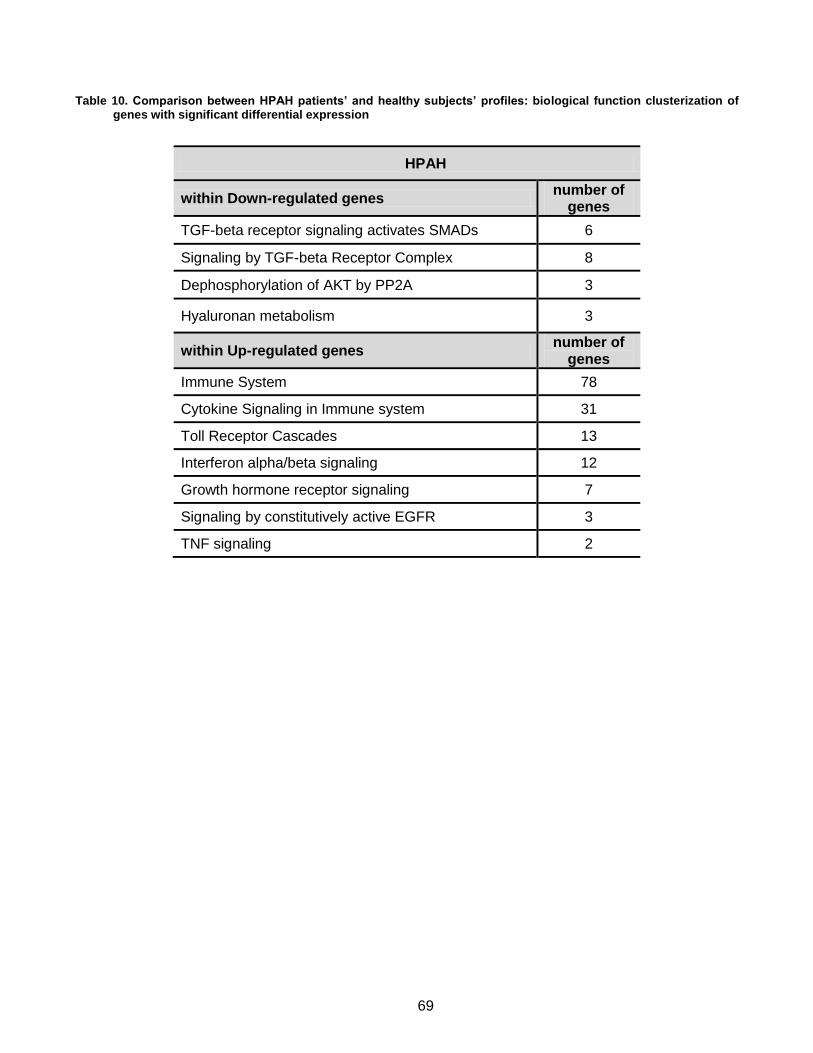
69
Table 10. Comparison between HPAH patients’ and healthy subjects’ profiles: biological function clusterization of genes with significant differential expression
HPAH
within Down-regulated genes number of
genes
TGF-beta receptor signaling activates SMADs 6
Signaling by TGF-beta Receptor Complex 8
Dephosphorylation of AKT by PP2A 3
Hyaluronan metabolism 3
within Up-regulated genes number of
genes
Immune System 78
Cytokine Signaling in Immune system 31
Toll Receptor Cascades 13
Interferon alpha/beta signaling 12
Growth hormone receptor signaling 7
Signaling by constitutively active EGFR 3
TNF signaling 2

70
5. Discussion
5.1. In vitro animal studies
HDACi are recognized as one of the promising target for handling cell growth and differentiation.
Nevertheless, apart from their use in cancer patients with both solid and liquid tumors, the potential
exploitation of HDACi in complex vascular diseases like PAH has long remained elusive, and
prompted only very recently [158, 167].
Here, we provided evidence that BU was able to control, at both gene and protein expression
level, multiple positive and negative regulators of proliferation in PASMCs isolated from PAH rats.
Inhibition of PASMC proliferation in response of PDGF-BB could be achieved at physiological
BU concentrations that did not impair cell viability. Noteworthy, BU was able to downregulate the gene
expression of PDGFRbeta, and the transcription of Ednra (ETA) and Ednrb (ETB), as well as PASMC
migration and PDGF-BB induced vessel sprouting from the pulmonary artery of PAH animals. These
findings further support the hypothesis that the action of this HDACi is fashioned at multiple
interconnected levels of the molecular plight that is impacting PASMC biology and PAH progression.
BU mediated inhibition of PDGF induced proliferation and migration was associated with a
remarkable reduction in Akt phosphorylation after 7 hours, an effect that was also achieved in the
presence of TSA. These inhibitory effects were mimicked by the PI3K inhibitor LY294002, with no
additive effect of BU, indicating that the anti-proliferative/-migratory action of BU was mediated by Akt
dephosphorylation. The ability of the phosphatase inhibitor calyculin A to rescue Akt phosphorylation
in the presence of BU and PDGF strongly suggests that phosphatase-mediated dephosphorylation of
Akt may be a major underlying mechanism of the HDACi action.
Failure to restore Akt phosphorylation by okadaic acid, which is selective for PP2A at low
concentrations [164, 165], suggests a major involvement of PP1, compared to PP2A.
Further insights within the mechanism(s) regulating BU-mediated phospho-Akt/phosphatase
interplay can be inferred from the BU effect on Akt acetylation. Our data show that BU enhanced the
level of acetylated Akt, concomitantly with a phosphatase inhibitor-relievable dephosphorylation of the
kinase. These observations from one hand raise the issue of investigating which histone
acetyltransferase(s), or HDAC/acetyltransferase interplay, may be responsible for the fine tuning of
Akt acetylation. On the other hand, the BU effect suggests that HDAC inhibition may have blocked
HDAC/phosphatase interaction(s), thus promoting the release of phosphatase and its subsequent
association with Akt, its acetylated form being more prone to phosphatase binding. Such a hypothesis
is consistent with previous observations showing that HDACi can disrupt HDAC 1 and 6 interaction

71
with PPI in human glioblastoma cells, resulting in the formation of a PP1/Akt complex and inhibition of
kinase activity [168], and that Akt deacetylation promotes its phosphorylation and activation [169].
Although HDACi are well known to induce chromatin plasticity and remodeling [170], acetylation
of nonhistone proteins has been demonstrated to modulate protein functions by altering their stability,
cellular localization and protein–nucleotide/protein–protein interactions. Well-characterized targets of
nonhistone acetylation include important cellular factors such as p53, nuclear factor-κB (NF-κB), p65,
CBP, p300, STAT3, tubulin, PC4, GATA factors, nuclear receptors, c-Myc, hypoxia-inducible factor
(HIF)-1α, FoxO1, heat-shock protein (Hsp)-90, HMG, E2F, MyoD, Bcr–Abl, the FLT3 kinase, c-Raf
kinase and so on [171-173].
Our results indicate an intriguing interplay between HDACs, protein phosphatase(s), and Akt
acetylation/deacetylation. To this end, acetylation and deacetylation of histones and nonhistone
proteins increasingly appear to be regulated through multifaceted interrelated networks and epigenetic
modification, the overall plan remaining mostly enigmatic [174], and still awaiting for further
clarification.
5.2. In vivo animal studies
Our preliminary results suggested the in vivo efficacy of HDAC inhibition in a preclinical model of
PH. Indeed, a continuous administration of BU reduced MCT-induced PAH in rats in a manner that
correlated with suppression of medial thickening of distal pulmonary arteries and inhibition of smooth
muscle cell proliferation in these vessels.
Cho YK et al. [175], shown that valproic acid blocks RV cardiac hypertrophy in response to PA
banding, as well as in the setting of PH caused by MCT-induced lung injury. Furthermore, Cavasin et
al. [166] demonstrated that HDACi suppress hypoxia-induced cardiopulmonary remodeling through an
antiproliferative mechanism.
In agreement with previous published findings, we also demonstrated that RV hypertrophy
induced by MCT was blunted by BU. In fact, RV/LV+S ratio and the thickness of RV were significantly
reduced in MCT+BU group compared to MCT-group.
Akhavein F. et al. demonstrated that MCT has effect on the myocardium or coronary vessels per
se. Myocytes of MCT-treated animals showed degenerative changes, fragmentation, coagulative
myocytolysis, and necrosis [176]. However, the presence of such myocardial changes in the right
ventricle could be explained as a consequence of myocardial injury resulting from PH. Our preliminary
results suggested that BU strongly reduced myocytolysis in RV. Further experiments are required to
clarify whether these results of HDACi are due to a direct action on heart tissue or they are
consequence of pulmonary pressure reduction.

72
Very recently, Zhao et al [157] reported that protein levels of HDAC1 and 5 were elevated in
patients with idiopathic PAH, and that HDACi were able to mitigate the development of hypoxia
induced PH in rats and exerted anti-proliferative effects on human and animal. However, the intimate
molecular mechanisms underlying the HDACi action remain to be largely unraveled.
It has been shown that BU inhibits HDAC classes I, IIa and IV [148]. This compound leads to
growth arrest, differentiation of leukemic cells and induces apoptosis following the deterioration of the
anti-apoptotic protein Bcl-2 [149, 150]. The apparent lack of clinical efficacy may be explained by the
low plasma levels of sodium butyrate due to its short half-life in vivo [151].
Albeit Cavasin et al. supported the hypothesis that isoform-selective HDAC inhibition could be
safer than general HDAC inhibition in the setting of RV pressure overload. BU is well tolerated by
humans, thus highlighting the translational potential of the present findings.
5.3. Patients’ blood related studies
To date, PBMCs have been used to identify PH specific genes [95] as well as distinguishing
between IPAH and SSc-PAH [177]. In general, however, these studies have shown considerable
heterogeneity when examining directly the contrast in gene expression profiles in PBMC between
SSc-PAH and SSc patients [178, 179].
Current ‘next-generation’ sequencing (NGS) technologies measure gene expression by
generating short reads or sequence tags, that is, sequences of 35–300 base pairs that correspond to
fragments of the original RNA.
There are a number of technologies and many different protocols, in this study we used Super-
SAGE with SOLiDTM platform. This technique was found to be more quantitatively reproducible
compare to microarray technique [180]. The sequencing requirement of SAGE gives it a unique
advantage. Its digital database facilitates direct comparisons between SAGE libraries. In contrast,
comparing microarray experiments may be more difficult due to a number of random and systematic
errors between different investigators or laboratories [181]. In addition, it allow to valid results also
starting from a small number of libraries.
In this study, we demonstrate significant differences in gene expression of peripheral blood cells
between PAH patients and Healthy subjects.
In particular, we define a panel of genes with significant differential expression for each
comparison, including n-resp IPAH vs Healthy, resp IPAH vs Healthy, and HPAH vs Healthy.
The overlapping analysis allow to define shared and unique genes for different conditions.
During the course of this study we developed an algorithms for a wide ranging analysis in
patients. Statistical methods are developed by Genomnia srl. for estimating biological variation on a

73
genewise basis and separating it from technical variation. A limitation of this study include the small
sample size of our patients groups, due to a restricted inclusion criteria as well as the absence of
specific PAH therapy. Indeed, most frequently patients referred to SSD PH Center of S. Orsola-
Malpighi Hospital (Bologna, Italy) are not naïve for PAH therapy. On the other hand, this criteria is a
strong point of the study, actually to date there are no studies considering this condition.
An empirical approach has been developed for sharing information between genes, allowing for
gene-specific variation even when only a few biological replicates are available. Furthermore, we will
addressed this issue by confirming a number of identified genes in a separate, larger, and more
diverse validation group of patients and healthy subjects.
Future analysis are required to validate selected genes with significant differential expression, as
well as real time PCR. If the changes found in PBMCs phenotype can be related back to the
pathobiology of the disease, they may allow to find the future therapeutic targets. Furthermore, thanks
to naïve condition differentially expressed genes could represent markers of prognosis during the
therapy administration.

74
6. Conclusions
Despite significant advances in the elucidation of genetic basis for some patients and despite
progresses in PAH therapy, the prognosis remains poor. The current treatment strategy, optimized in
recent guidelines [3], remains inadequate. In fact, the mortality rate continues to be high, and the
functional and hemodynamic impairments are still extensive in many patients. Prior to the advent of
modern therapies, life expectancy for adults with idiopathic PAH was 3 years from diagnosis; for
children, it was 10 months [2]. The specific drugs approved for PAH are able to slow the progression
of the disease, but cannot be considered a cure for the majority of patients [1].
Within this context, the development of treatments that may afford a reverse remodeling of
vascular architecture and biology in PAH would have relevant biomedical implications.
While additional studies are required to dissect the intimate mechanism(s) of the effects of
HDAC inhibitors on Akt dynamics and the patterning of other nonhistone proteins, the present findings
on the BU action highlight a new role for an old molecule. BU ability to behave as a fine tuner of a
crucial protein kinase conveys features characteristic of cell survival, proliferation and memory.
In vivo preliminary studies in rats suggested that BU has in vivo efficacy in reversing PAH
induced by MCT treatment. From such a view angle, BU can also be conceived as a molecule with a
“one component-multiple target logics”, paving the way to novel perspective(s) in the clinical use of
HDACi in PAH.
Besides, SAGE combined with a NGS technique revealed differences in PBMCs profiling of
naïve patients and healthy subjects. This suggests that PBMCs could be an interesting surrogate of
tissue useful to find new molecular targets and/or biomarkers involved in PAH. Unlike lung tissue
obtained from explants, the high accessibility of this cell population allow to study disease even at
early stages.

75
7. References
1. Galiè, N., M. Palazzini, and A. Manes, Pulmonary arterial hypertension: from the kingdom of the near-dead to multiple clinical trial meta-analyses. Eur Heart J, 2010. 31(17): p. 2080-6.
2. Runo, J.R. and J.E. Loyd, Primary pulmonary hypertension. Lancet, 2003. 361(9368): p. 1533-44.
3. Galiè, N., et al., Guidelines for the diagnosis and treatment of pulmonary hypertension: the Task Force for the Diagnosis and Treatment of Pulmonary Hypertension of the European Society of Cardiology (ESC) and the European Respiratory Society (ERS), endorsed by the International Society of Heart and Lung Transplantation (ISHLT). Eur Heart J, 2009. 30(20): p. 2493-537.
4. Pietra, G.G., et al., Pathologic assessment of vasculopathies in pulmonary hypertension. J Am Coll Cardiol, 2004. 43(12 Suppl S): p. 25S-32S.
5. Humbert, M., et al., Pulmonary arterial hypertension in France: results from a national registry. Am J Respir Crit Care Med, 2006. 173(9): p. 1023-30.
6. Peacock, A.J., et al., An epidemiological study of pulmonary arterial hypertension. Eur Respir J, 2007. 30(1): p. 104-9.
7. Naeije, R., et al., Mechanisms of improved arterial oxygenation after peripheral chemoreceptor stimulation during hypoxic exercise. J Appl Physiol, 1993. 74(4): p. 1666-71.
8. Simonneau, G., et al., Clinical classification of pulmonary hypertension. J Am Coll Cardiol, 2004. 43(12 Suppl S): p. 5S-12S.
9. Pietra, G.G., et al., Histopathology of primary pulmonary hypertension. A qualitative and quantitative study of pulmonary blood vessels from 58 patients in the National Heart, Lung, and Blood Institute, Primary Pulmonary Hypertension Registry. Circulation, 1989. 80(5): p. 1198-206.
10. Pietra, G.G. and J.R. Rüttner, Specificity of pulmonary vascular lesions in primary pulmonary hypertension. A reappraisal. Respiration, 1987. 52(2): p. 81-5.
11. Lee, S.D., et al., Monoclonal endothelial cell proliferation is present in primary but not secondary pulmonary hypertension. J Clin Invest, 1998. 101(5): p. 927-34.
12. Fishman, A.P., Changing concepts of the pulmonary plexiform lesion. Physiol Res, 2000. 49(5): p. 485-92.
13. Yuan, J.X., et al., Dysfunctional voltage-gated K+ channels in pulmonary artery smooth muscle cells of patients with primary pulmonary hypertension. Circulation, 1998. 98(14): p. 1400-6.
14. Budhiraja, R., R.M. Tuder, and P.M. Hassoun, Endothelial dysfunction in pulmonary hypertension. Circulation, 2004. 109(2): p. 159-65.
15. Humbert, M., et al., Cellular and molecular pathobiology of pulmonary arterial hypertension. J Am Coll Cardiol, 2004. 43(12 Suppl S): p. 13S-24S.
16. Stenmark, K.R. and R.P. Mecham, Cellular and molecular mechanisms of pulmonary vascular remodeling. Annu Rev Physiol, 1997. 59: p. 89-144.
17. Hagan, G. and J. Pepke-Zaba, Pulmonary hypertension, nitric oxide and nitric oxide-releasing compounds. Expert Rev Respir Med, 2011. 5(2): p. 163-71.
18. Patrignani, P., et al., Release of contracting autacoids by aortae of normal and atherosclerotic rabbits. J Cardiovasc Pharmacol, 1992. 20 Suppl 12: p. S208-10.
19. Dzau, V.J. and G.H. Gibbons, Vascular remodeling: mechanisms and implications. J Cardiovasc Pharmacol, 1993. 21 Suppl 1: p. S1-5.
20. Brain, S.D., et al., Endothelin-1: demonstration of potent effects on the microcirculation of humans and other species. J Cardiovasc Pharmacol, 1989. 13 Suppl 5: p. S147-9; discussion S150.
21. Galié, N., A. Manes, and A. Branzi, The endothelin system in pulmonary arterial hypertension. Cardiovasc Res, 2004. 61(2): p. 227-37.

76
22. Giaid, A., et al., Expression of endothelin-1 in the lungs of patients with pulmonary hypertension. N Engl J Med, 1993. 328(24): p. 1732-9.
23. Stewart, D.J., et al., Increased plasma endothelin-1 in pulmonary hypertension: marker or mediator of disease? Ann Intern Med, 1991. 114(6): p. 464-9.
24. Zamora, M.R., et al., Overexpression of endothelin-1 and enhanced growth of pulmonary artery smooth muscle cells from fawn-hooded rats. Am J Physiol, 1996. 270(1 Pt 1): p. L101-9.
25. Kornblihtt, A.R., et al., Primary structure of human fibronectin: differential splicing may generate at least 10 polypeptides from a single gene. EMBO J, 1985. 4(7): p. 1755-9.
26. Tanaka, Y., et al., Site-specific responses to monocrotaline-induced vascular injury: evidence for two distinct mechanisms of remodeling. Am J Respir Cell Mol Biol, 1996. 15(3): p. 390-7.
27. Peacock, A.J., et al., Endothelin-1 and endothelin-3 induce chemotaxis and replication of pulmonary artery fibroblasts. Am J Respir Cell Mol Biol, 1992. 7(5): p. 492-9.
28. Kahaleh, M.B., Endothelin, an endothelial-dependent vasoconstrictor in scleroderma. Enhanced production and profibrotic action. Arthritis Rheum, 1991. 34(8): p. 978-83.
29. Petkov, V., et al., Vasoactive intestinal peptide as a new drug for treatment of primary pulmonary hypertension. J Clin Invest, 2003. 111(9): p. 1339-46.
30. Jeffery, T.K. and N.W. Morrell, Molecular and cellular basis of pulmonary vascular remodeling in pulmonary hypertension. Prog Cardiovasc Dis, 2002. 45(3): p. 173-202.
31. Edwards, W.D., Plexogenic pulmonary arteriopathy. Histopathology, 1990. 17(2): p. 188-9. 32. Tuder, R.M., et al., Exuberant endothelial cell growth and elements of inflammation are present
in plexiform lesions of pulmonary hypertension. Am J Pathol, 1994. 144(2): p. 275-85. 33. Du, L., et al., Signaling molecules in nonfamilial pulmonary hypertension. N Engl J Med, 2003.
348(6): p. 500-9. 34. Dorfmüller, P., et al., Inflammation in pulmonary arterial hypertension. Eur Respir J, 2003.
22(2): p. 358-63. 35. Pullamsetti, S.S., et al., Inflammation, immunological reaction and role of infection in
pulmonary hypertension. Clin Microbiol Infect, 2011. 17(1): p. 7-14. 36. Libby, P., Inflammatory mechanisms: the molecular basis of inflammation and disease. Nutr
Rev, 2007. 65(12 Pt 2): p. S140-6. 37. Medzhitov, R., Origin and physiological roles of inflammation. Nature, 2008. 454(7203): p. 428-
35. 38. Davis, C., et al., The role of inflammation in vascular injury and repair. J Thromb Haemost,
2003. 1(8): p. 1699-709. 39. Humbert, M., et al., Increased interleukin-1 and interleukin-6 serum concentrations in severe
primary pulmonary hypertension. Am J Respir Crit Care Med, 1995. 151(5): p. 1628-31. 40. Eisenberg, P.R., et al., Fibrinopeptide A levels indicative of pulmonary vascular thrombosis in
patients with primary pulmonary hypertension. Circulation, 1990. 82(3): p. 841-7. 41. Christman, B.W., et al., An imbalance between the excretion of thromboxane and prostacyclin
metabolites in pulmonary hypertension. N Engl J Med, 1992. 327(2): p. 70-5. 42. Herve, P., et al., Pathobiology of pulmonary hypertension. The role of platelets and thrombosis.
Clin Chest Med, 2001. 22(3): p. 451-8. 43. Deng, Z., et al., Familial primary pulmonary hypertension (gene PPH1) is caused by mutations
in the bone morphogenetic protein receptor-II gene. Am J Hum Genet, 2000. 67(3): p. 737-44. 44. Lane, K.B., et al., Heterozygous germline mutations in BMPR2, encoding a TGF-beta receptor,
cause familial primary pulmonary hypertension. Nat Genet, 2000. 26(1): p. 81-4. 45. Newman, J.H., et al., Mutation in the gene for bone morphogenetic protein receptor II as a
cause of primary pulmonary hypertension in a large kindred. N Engl J Med, 2001. 345(5): p. 319-24.
46. Thomson, J.R., et al., Sporadic primary pulmonary hypertension is associated with germline mutations of the gene encoding BMPR-II, a receptor member of the TGF-beta family. J Med Genet, 2000. 37(10): p. 741-5.
77
47. Cogan, J.D., et al., Gross BMPR2 gene rearrangements constitute a new cause for primary pulmonary hypertension. Genet Med, 2005. 7(3): p. 169-74.
48. Aldred, M.A., et al., BMPR2 gene rearrangements account for a significant proportion of mutations in familial and idiopathic pulmonary arterial hypertension. Hum Mutat, 2006. 27(2): p. 212-3.
49. Cogan, J.D., et al., High frequency of BMPR2 exonic deletions/duplications in familial pulmonary arterial hypertension. Am J Respir Crit Care Med, 2006. 174(5): p. 590-8.
50. Humbert, M., et al., BMPR2 germline mutations in pulmonary hypertension associated with fenfluramine derivatives. Eur Respir J, 2002. 20(3): p. 518-23.
51. Trembath, R.C., et al., Clinical and molecular genetic features of pulmonary hypertension in patients with hereditary hemorrhagic telangiectasia. N Engl J Med, 2001. 345(5): p. 325-34.
52. Chaouat, A., et al., Endoglin germline mutation in a patient with hereditary haemorrhagic telangiectasia and dexfenfluramine associated pulmonary arterial hypertension. Thorax, 2004. 59(5): p. 446-8.
53. Sztrymf, B., et al., Genes and pulmonary arterial hypertension. Respiration, 2007. 74(2): p. 123-32.
54. Rich, S., et al., Primary pulmonary hypertension. A national prospective study. Ann Intern Med, 1987. 107(2): p. 216-23.
55. Loyd, J.E., et al., Genetic anticipation and abnormal gender ratio at birth in familial primary pulmonary hypertension. Am J Respir Crit Care Med, 1995. 152(1): p. 93-7.
56. Sztrymf, B., et al., Clinical outcomes of pulmonary arterial hypertension in carriers of BMPR2 mutation. Am J Respir Crit Care Med, 2008. 177(12): p. 1377-83.
57. Rosenzweig, E.B., et al., Clinical implications of determining BMPR2 mutation status in a large cohort of children and adults with pulmonary arterial hypertension. J Heart Lung Transplant, 2008. 27(6): p. 668-74.
58. Elliott, C.G., et al., Relationship of BMPR2 mutations to vasoreactivity in pulmonary arterial hypertension. Circulation, 2006. 113(21): p. 2509-15.
59. Hoeper, M.M., et al., Complications of right heart catheterization procedures in patients with pulmonary hypertension in experienced centers. J Am Coll Cardiol, 2006. 48(12): p. 2546-52.
60. Sitbon, O., et al., Long-term response to calcium channel blockers in idiopathic pulmonary arterial hypertension. Circulation, 2005. 111(23): p. 3105-11.
61. Robin, E.D., The kingdom of the near-dead. The shortened unnatural life history of primary pulmonary hypertension. Chest, 1987. 92(2): p. 330-4.
62. D'Alonzo, G.E., et al., Survival in patients with primary pulmonary hypertension. Results from a national prospective registry. Ann Intern Med, 1991. 115(5): p. 343-9.
63. Galiè, N., A. Manes, and A. Branzi, Prostanoids for pulmonary arterial hypertension. Am J Respir Med, 2003. 2(2): p. 123-37.
64. Rubin, L.J., et al., Treatment of primary pulmonary hypertension with continuous intravenous prostacyclin (epoprostenol). Results of a randomized trial. Ann Intern Med, 1990. 112(7): p. 485-91.
65. Barst, R.J., et al., A comparison of continuous intravenous epoprostenol (prostacyclin) with conventional therapy for primary pulmonary hypertension. N Engl J Med, 1996. 334(5): p. 296-301.
66. Badesch, D.B., et al., Continuous intravenous epoprostenol for pulmonary hypertension due to the scleroderma spectrum of disease. A randomized, controlled trial. Ann Intern Med, 2000. 132(6): p. 425-34.
67. McLaughlin, V.V., A. Shillington, and S. Rich, Survival in primary pulmonary hypertension: the impact of epoprostenol therapy. Circulation, 2002. 106(12): p. 1477-82.
68. Sitbon, O., et al., Long-term intravenous epoprostenol infusion in primary pulmonary hypertension: prognostic factors and survival. J Am Coll Cardiol, 2002. 40(4): p. 780-8.

78
69. Simonneau, G., et al., Continuous subcutaneous infusion of treprostinil, a prostacyclin analogue, in patients with pulmonary arterial hypertension: a double-blind, randomized, placebo-controlled trial. Am J Respir Crit Care Med, 2002. 165(6): p. 800-4.
70. Lang, I., et al., Efficacy of long-term subcutaneous treprostinil sodium therapy in pulmonary hypertension. Chest, 2006. 129(6): p. 1636-43.
71. Olschewski, H., et al., Inhaled iloprost for severe pulmonary hypertension. N Engl J Med, 2002. 347(5): p. 322-9.
72. Higenbottam, T., et al., Long-term intravenous prostaglandin (epoprostenol or iloprost) for treatment of severe pulmonary hypertension. Heart, 1998. 80(2): p. 151-5.
73. Galiè, N., et al., Bosentan therapy in patients with Eisenmenger syndrome: a multicenter, double-blind, randomized, placebo-controlled study. Circulation, 2006. 114(1): p. 48-54.
74. Galiè, N., et al., Treatment of patients with mildly symptomatic pulmonary arterial hypertension with bosentan (EARLY study): a double-blind, randomised controlled trial. Lancet, 2008. 371(9630): p. 2093-100.
75. Humbert, M., et al., Combination of bosentan with epoprostenol in pulmonary arterial hypertension: BREATHE-2. Eur Respir J, 2004. 24(3): p. 353-9.
76. Rubin, L.J., et al., Bosentan therapy for pulmonary arterial hypertension. N Engl J Med, 2002. 346(12): p. 896-903.
77. Barst, R.J., et al., Treatment of pulmonary arterial hypertension with the selective endothelin-A receptor antagonist sitaxsentan. J Am Coll Cardiol, 2006. 47(10): p. 2049-56.
78. Benza, R.L., et al., Sitaxsentan for the treatment of pulmonary arterial hypertension: a 1-year, prospective, open-label observation of outcome and survival. Chest, 2008. 134(4): p. 775-82.
79. Galié, N., et al., Ambrisentan therapy for pulmonary arterial hypertension. J Am Coll Cardiol, 2005. 46(3): p. 529-35.
80. Galiè, N., et al., Ambrisentan for the treatment of pulmonary arterial hypertension: results of the ambrisentan in pulmonary arterial hypertension, randomized, double-blind, placebo-controlled, multicenter, efficacy (ARIES) study 1 and 2. Circulation, 2008. 117(23): p. 3010-9.
81. Ghofrani, H.A., et al., Sildenafil for long-term treatment of nonoperable chronic thromboembolic pulmonary hypertension. Am J Respir Crit Care Med, 2003. 167(8): p. 1139-41.
82. Michelakis, E.D., et al., Long-term treatment with oral sildenafil is safe and improves functional capacity and hemodynamics in patients with pulmonary arterial hypertension. Circulation, 2003. 108(17): p. 2066-9.
83. Galiè, N., et al., Sildenafil citrate therapy for pulmonary arterial hypertension. N Engl J Med, 2005. 353(20): p. 2148-57.
84. Galiè, N., et al., Tadalafil therapy for pulmonary arterial hypertension. Circulation, 2009. 119(22): p. 2894-903.
85. McLaughlin, V.V., et al., Randomized study of adding inhaled iloprost to existing bosentan in pulmonary arterial hypertension. Am J Respir Crit Care Med, 2006. 174(11): p. 1257-63.
86. Simonneau, G., et al., Addition of sildenafil to long-term intravenous epoprostenol therapy in patients with pulmonary arterial hypertension: a randomized trial. Ann Intern Med, 2008. 149(8): p. 521-30.
87. Klepetko, W., et al., Interventional and surgical modalities of treatment for pulmonary arterial hypertension. J Am Coll Cardiol, 2004. 43(12 Suppl S): p. 73S-80S.
88. Hertz, M.I., et al., The registry of the international society for heart and lung transplantation: nineteenth official report-2002. J Heart Lung Transplant, 2002. 21(9): p. 950-70.
89. Stenmark, K.R., et al., Severe pulmonary hypertension and arterial adventitial changes in newborn calves at 4,300 m. J Appl Physiol, 1987. 62(2): p. 821-30.
90. Jones, R.C., et al., A protocol for phenotypic detection and characterization of vascular cells of different origins in a lung neovascularization model in rodents. Nat Protoc, 2008. 3(3): p. 388-97.

79
91. Burke, D.L., et al., Sustained hypoxia promotes the development of a pulmonary artery-specific chronic inflammatory microenvironment. Am J Physiol Lung Cell Mol Physiol, 2009. 297(2): p. L238-50.
92. Stenmark, K.R., et al., Animal models of pulmonary arterial hypertension: the hope for etiological discovery and pharmacological cure. Am J Physiol Lung Cell Mol Physiol, 2009. 297(6): p. L1013-32.
93. Bonnet, S., et al., An abnormal mitochondrial-hypoxia inducible factor-1alpha-Kv channel pathway disrupts oxygen sensing and triggers pulmonary arterial hypertension in fawn hooded rats: similarities to human pulmonary arterial hypertension. Circulation, 2006. 113(22): p. 2630-41.
94. Nagaoka, T., et al., Involvement of RhoA/Rho kinase signaling in pulmonary hypertension of the fawn-hooded rat. J Appl Physiol, 2006. 100(3): p. 996-1002.
95. Bull, T.M., et al., Gene expression profiling in pulmonary hypertension. Proc Am Thorac Soc, 2007. 4(1): p. 117-20.
96. Tada, Y., et al., Murine pulmonary response to chronic hypoxia is strain specific. Exp Lung Res, 2008. 34(6): p. 313-23.
97. Frid, M.G., et al., Hypoxia-induced pulmonary vascular remodeling requires recruitment of circulating mesenchymal precursors of a monocyte/macrophage lineage. Am J Pathol, 2006. 168(2): p. 659-69.
98. Jasmin, J.F., et al., Effectiveness of a nonselective ET(A/B) and a selective ET(A) antagonist in rats with monocrotaline-induced pulmonary hypertension. Circulation, 2001. 103(2): p. 314-8.
99. Meyrick, B., W. Gamble, and L. Reid, Development of Crotalaria pulmonary hypertension: hemodynamic and structural study. Am J Physiol, 1980. 239(5): p. H692-702.
100. Wilson, D.W., et al., Progressive inflammatory and structural changes in the pulmonary vasculature of monocrotaline-treated rats. Microvasc Res, 1989. 38(1): p. 57-80.
101. Stenmark, K.R., et al., Role of the adventitia in pulmonary vascular remodeling. Physiology (Bethesda), 2006. 21: p. 134-45.
102. Owens, G.K., M.S. Kumar, and B.R. Wamhoff, Molecular regulation of vascular smooth muscle cell differentiation in development and disease. Physiol Rev, 2004. 84(3): p. 767-801.
103. Hao, H., G. Gabbiani, and M.L. Bochaton-Piallat, Arterial smooth muscle cell heterogeneity: implications for atherosclerosis and restenosis development. Arterioscler Thromb Vasc Biol, 2003. 23(9): p. 1510-20.
104. Frid, M.G., et al., Smooth muscle cells isolated from discrete compartments of the mature vascular media exhibit unique phenotypes and distinct growth capabilities. Circ Res, 1997. 81(6): p. 940-52.
105. Bochaton-Piallat, M.L., et al., Phenotypic heterogeneity of rat arterial smooth muscle cell clones. Implications for the development of experimental intimal thickening. Arterioscler Thromb Vasc Biol, 1996. 16(6): p. 815-20.
106. Christen, T., et al., Cultured porcine coronary artery smooth muscle cells. A new model with advanced differentiation. Circ Res, 1999. 85(1): p. 99-107.
107. Li, S., et al., Innate diversity of adult human arterial smooth muscle cells: cloning of distinct subtypes from the internal thoracic artery. Circ Res, 2001. 89(6): p. 517-25.
108. Li, S., et al., Evidence from a novel human cell clone that adult vascular smooth muscle cells can convert reversibly between noncontractile and contractile phenotypes. Circ Res, 1999. 85(4): p. 338-48.
109. Hao, H., et al., Heterogeneity of smooth muscle cell populations cultured from pig coronary artery. Arterioscler Thromb Vasc Biol, 2002. 22(7): p. 1093-9.
110. Tallquist, M. and A. Kazlauskas, PDGF signaling in cells and mice. Cytokine Growth Factor Rev, 2004. 15(4): p. 205-13.
111. Humbert, M., et al., Platelet-derived growth factor expression in primary pulmonary hypertension: comparison of HIV seropositive and HIV seronegative patients. Eur Respir J, 1998. 11(3): p. 554-9.

80
112. Vantler, M., et al., Systematic evaluation of anti-apoptotic growth factor signaling in vascular smooth muscle cells. Only phosphatidylinositol 3'-kinase is important. J Biol Chem, 2005. 280(14): p. 14168-76.
113. McKinsey, T.A. and E.N. Olson, Toward transcriptional therapies for the failing heart: chemical screens to modulate genes. J Clin Invest, 2005. 115(3): p. 538-46.
114. Hamamdzic, D., L.M. Kasman, and E.C. LeRoy, The role of infectious agents in the pathogenesis of systemic sclerosis. Curr Opin Rheumatol, 2002. 14(6): p. 694-8.
115. Perros, F., et al., Platelet-derived growth factor expression and function in idiopathic pulmonary arterial hypertension. Am J Respir Crit Care Med, 2008. 178(1): p. 81-8.
116. Schermuly, R.T., et al., Reversal of experimental pulmonary hypertension by PDGF inhibition. J Clin Invest, 2005. 115(10): p. 2811-21.
117. Souza, R., et al., Long term imatinib treatment in pulmonary arterial hypertension. Thorax, 2006. 61(8): p. 736.
118. Ghofrani, H.A., W. Seeger, and F. Grimminger, Imatinib for the treatment of pulmonary arterial hypertension. N Engl J Med, 2005. 353(13): p. 1412-3.
119. Ghofrani, H.A., et al., Imatinib in pulmonary arterial hypertension patients with inadequate response to established therapy. Am J Respir Crit Care Med, 2010. 182(9): p. 1171-7.
120. Becker, P.B. and W. Hörz, ATP-dependent nucleosome remodeling. Annu Rev Biochem, 2002. 71: p. 247-73.
121. Lusser, A. and J.T. Kadonaga, Chromatin remodeling by ATP-dependent molecular machines. Bioessays, 2003. 25(12): p. 1192-200.
122. Zhang, Y. and D. Reinberg, Transcription regulation by histone methylation: interplay between different covalent modifications of the core histone tails. Genes Dev, 2001. 15(18): p. 2343-60.
123. Strahl, B.D. and C.D. Allis, The language of covalent histone modifications. Nature, 2000. 403(6765): p. 41-5.
124. Berger, S.L., Histone modifications in transcriptional regulation. Curr Opin Genet Dev, 2002. 12(2): p. 142-8.
125. Roth, S.Y., J.M. Denu, and C.D. Allis, Histone acetyltransferases. Annu Rev Biochem, 2001. 70: p. 81-120.
126. North, B.J., et al., The human Sir2 ortholog, SIRT2, is an NAD+-dependent tubulin deacetylase. Mol Cell, 2003. 11(2): p. 437-44.
127. Verdin, E., F. Dequiedt, and H.G. Kasler, Class II histone deacetylases: versatile regulators. Trends Genet, 2003. 19(5): p. 286-93.
128. Gallinari, P., et al., HDACs, histone deacetylation and gene transcription: from molecular biology to cancer therapeutics. Cell Res, 2007. 17(3): p. 195-211.
129. Waltregny, D., et al., Expression of histone deacetylase 8, a class I histone deacetylase, is restricted to cells showing smooth muscle differentiation in normal human tissues. Am J Pathol, 2004. 165(2): p. 553-64.
130. Lee, H., et al., Histone deacetylase 8 safeguards the human ever-shorter telomeres 1B (hEST1B) protein from ubiquitin-mediated degradation. Mol Cell Biol, 2006. 26(14): p. 5259-69.
131. Weichert, W., et al., Class I histone deacetylase expression has independent prognostic impact in human colorectal cancer: specific role of class I histone deacetylases in vitro and in vivo. Clin Cancer Res, 2008. 14(6): p. 1669-77.
132. Weichert, W., et al., Association of patterns of class I histone deacetylase expression with patient prognosis in gastric cancer: a retrospective analysis. Lancet Oncol, 2008. 9(2): p. 139-48.
133. de Leval, L., et al., Use of histone deacetylase 8 (HDAC8), a new marker of smooth muscle differentiation, in the classification of mesenchymal tumors of the uterus. Am J Surg Pathol, 2006. 30(3): p. 319-27.
134. Zhang, Z., et al., HDAC6 expression is correlated with better survival in breast cancer. Clin Cancer Res, 2004. 10(20): p. 6962-8.
81
135. Yoshida, N., et al., Prediction of prognosis of estrogen receptor-positive breast cancer with combination of selected estrogen-regulated genes. Cancer Sci, 2004. 95(6): p. 496-502.
136. Marks, P.A., et al., Histone deacetylase inhibitors as new cancer drugs. Curr Opin Oncol, 2001. 13(6): p. 477-83.
137. Melnick, A. and J.D. Licht, Histone deacetylases as therapeutic targets in hematologic malignancies. Curr Opin Hematol, 2002. 9(4): p. 322-32.
138. Li, M., et al., Emergence of fibroblasts with a proinflammatory epigenetically altered phenotype in severe hypoxic pulmonary hypertension. J Immunol, 2011. 187(5): p. 2711-22.
139. Bolden, J.E., M.J. Peart, and R.W. Johnstone, Anticancer activities of histone deacetylase inhibitors. Nat Rev Drug Discov, 2006. 5(9): p. 769-84.
140. Yoshida, M., T. Shimazu, and A. Matsuyama, Protein deacetylases: enzymes with functional diversity as novel therapeutic targets. Prog Cell Cycle Res, 2003. 5: p. 269-78.
141. Secrist, J.P., X. Zhou, and V.M. Richon, HDAC inhibitors for the treatment of cancer. Curr Opin Investig Drugs, 2003. 4(12): p. 1422-7.
142. McLaughlin, F., P. Finn, and N.B. La Thangue, The cell cycle, chromatin and cancer: mechanism-based therapeutics come of age. Drug Discov Today, 2003. 8(17): p. 793-802.
143. Camphausen, K. and P.J. Tofilon, Inhibition of histone deacetylation: a strategy for tumor radiosensitization. J Clin Oncol, 2007. 25(26): p. 4051-6.
144. Brush, M.H., et al., Deactylase inhibitors disrupt cellular complexes containing protein phosphatases and deacetylases. J Biol Chem, 2004. 279(9): p. 7685-91.
145. Bieliauskas, A.V. and M.K. Pflum, Isoform-selective histone deacetylase inhibitors. Chem Soc Rev, 2008. 37(7): p. 1402-13.
146. Khan, N., et al., Determination of the class and isoform selectivity of small-molecule histone deacetylase inhibitors. Biochem J, 2008. 409(2): p. 581-9.
147. Seidel, C., et al., Histone deacetylase modulators provided by Mother Nature. Genes Nutr, 2012. 7(3): p. 357-67.
148. Davie, J.R., Inhibition of histone deacetylase activity by butyrate. J Nutr, 2003. 133(7 Suppl): p. 2485S-2493S.
149. Schnekenburger, M., et al., Transcriptional and post-transcriptional regulation of glutathione S-transferase P1 expression during butyric acid-induced differentiation of K562 cells. Leuk Res, 2006. 30(5): p. 561-8.
150. Rosato, R.R., J.A. Almenara, and S. Grant, The histone deacetylase inhibitor MS-275 promotes differentiation or apoptosis in human leukemia cells through a process regulated by generation of reactive oxygen species and induction of p21CIP1/WAF1 1. Cancer Res, 2003. 63(13): p. 3637-45.
151. Miller, A.A., et al., Clinical pharmacology of sodium butyrate in patients with acute leukemia. Eur J Cancer Clin Oncol, 1987. 23(9): p. 1283-7.
152. Baine, M.J., et al., Transcriptional profiling of peripheral blood mononuclear cells in pancreatic cancer patients identifies novel genes with potential diagnostic utility. PLoS One, 2011. 6(2): p. e17014.
153. Whitney, A.R., et al., Individuality and variation in gene expression patterns in human blood. Proc Natl Acad Sci U S A, 2003. 100(4): p. 1896-901.
154. Twine, N.C., et al., Disease-associated expression profiles in peripheral blood mononuclear cells from patients with advanced renal cell carcinoma. Cancer Res, 2003. 63(18): p. 6069-75.
155. Sun, C.J., L. Zhang, and W.Y. Zhang, Gene expression profiling of maternal blood in early onset severe preeclampsia: identification of novel biomarkers. J Perinat Med, 2009. 37(6): p. 609-16.
156. Edwards, C.J., et al., Molecular profile of peripheral blood mononuclear cells from patients with rheumatoid arthritis. Mol Med, 2007. 13(1-2): p. 40-58.
157. Cappuzzello, C., et al., Gene expression profiles in peripheral blood mononuclear cells of chronic heart failure patients. Physiol Genomics, 2009. 38(3): p. 233-40.

82
158. Zhao, L., et al., Histone deacetylation inhibition in pulmonary hypertension: therapeutic potential of valproic acid and suberoylanilide hydroxamic acid. Circulation, 2012. 126(4): p. 455-67.
159. Fimognari, C., M. Nüsse, and P. Hrelia, Flow cytometric analysis of genetic damage, effect on cell cycle progression, and apoptosis by thiophanate-methyl in human lymphocytes. Environ Mol Mutagen, 1999. 33(2): p. 173-6.
160. Pfaffl, M.W., G.W. Horgan, and L. Dempfle, Relative expression software tool (REST) for group-wise comparison and statistical analysis of relative expression results in real-time PCR. Nucleic Acids Res, 2002. 30(9): p. e36.
161. Montanaro, L., et al., Location of rRNA transcription to the nucleolar components: disappearance of the fibrillar centers in nucleoli of regenerating rat hepatocytes. Cell Struct Funct, 2011. 36(1): p. 49-56.
162. Burger-van Paassen, N., et al., The regulation of intestinal mucin MUC2 expression by short-chain fatty acids: implications for epithelial protection. Biochem J, 2009. 420(2): p. 211-9.
163. Davie, N., et al., ET(A) and ET(B) receptors modulate the proliferation of human pulmonary artery smooth muscle cells. Am J Respir Crit Care Med, 2002. 165(3): p. 398-405.
164. Connor, J.H., et al., Importance of the beta12-beta13 loop in protein phosphatase-1 catalytic subunit for inhibition by toxins and mammalian protein inhibitors. J Biol Chem, 1999. 274(32): p. 22366-72.
165. Gupta, V., et al., A model for binding of structurally diverse natural product inhibitors of protein phosphatases PP1 and PP2A. J Med Chem, 1997. 40(20): p. 3199-206.
166. Resjö, S., et al., Phosphorylation and activation of phosphodiesterase type 3B (PDE3B) in adipocytes in response to serine/threonine phosphatase inhibitors: deactivation of PDE3B in vitro by protein phosphatase type 2A. Biochem J, 1999. 341 ( Pt 3): p. 839-45.
167. Cavasin, M.A., et al., Selective class I histone deacetylase inhibition suppresses hypoxia-induced cardiopulmonary remodeling through an antiproliferative mechanism. Circ Res, 2012. 110(5): p. 739-48.
168. Chen, C.S., et al., Histone acetylation-independent effect of histone deacetylase inhibitors on Akt through the reshuffling of protein phosphatase 1 complexes. J Biol Chem, 2005. 280(46): p. 38879-87.
169. Sundaresan, N.R., et al., The deacetylase SIRT1 promotes membrane localization and activation of Akt and PDK1 during tumorigenesis and cardiac hypertrophy. Sci Signal, 2011. 4(182): p. ra46.
170. Thiagalingam, S., et al., Histone deacetylases: unique players in shaping the epigenetic histone code. Ann N Y Acad Sci, 2003. 983: p. 84-100.
171. Yoo, C.B. and P.A. Jones, Epigenetic therapy of cancer: past, present and future. Nat Rev Drug Discov, 2006. 5(1): p. 37-50.
172. Yang, X.J. and E. Seto, Lysine acetylation: codified crosstalk with other posttranslational modifications. Mol Cell, 2008. 31(4): p. 449-61.
173. Glozak, M.A., et al., Acetylation and deacetylation of non-histone proteins. Gene, 2005. 363: p. 15-23.
174. Singh, B.N., et al., Nonhistone protein acetylation as cancer therapy targets. Expert Rev Anticancer Ther, 2010. 10(6): p. 935-54.
175. Cho, Y.K., et al., Sodium valproate, a histone deacetylase inhibitor, but not captopril, prevents right ventricular hypertrophy in rats. Circ J, 2010. 74(4): p. 760-70.
176. Akhavein, F., et al., Decreased left ventricular function, myocarditis, and coronary arteriolar medial thickening following monocrotaline administration in adult rats. J Appl Physiol, 2007. 103(1): p. 287-95.
177. Grigoryev, D.N., et al., Identification of candidate genes in scleroderma-related pulmonary arterial hypertension. Transl Res, 2008. 151(4): p. 197-207.

83
178. Pendergrass, S.A., et al., Limited systemic sclerosis patients with pulmonary arterial hypertension show biomarkers of inflammation and vascular injury. PLoS One, 2010. 5(8): p. e12106.
179. Risbano, M.G., et al., Altered immune phenotype in peripheral blood cells of patients with scleroderma-associated pulmonary hypertension. Clin Transl Sci, 2010. 3(5): p. 210-8.
180. McCarthy, D.J., Y. Chen, and G.K. Smyth, Differential expression analysis of multifactor RNA-Seq experiments with respect to biological variation. Nucleic Acids Res, 2012. 40(10): p. 4288-97.
181. Patino, W.D., O.Y. Mian, and P.M. Hwang, Serial analysis of gene expression: technical considerations and applications to cardiovascular biology. Circ Res, 2002. 91(7): p. 565-9.


![arXiv:1511.02938v1 [astro-ph.HE] 10 Nov 2015 · 28 INAF Istituto di Radioastronomia, I-40129 Bologna, Italy 29 Dipartimento di Astronomia, Universit`a di Bologna, I-40127 Bologna,](https://img.dokumen.tips/doc/110x75/5c66099209d3f2c14e8b7bc3/arxiv151102938v1-astro-phhe-10-nov-2015-28-inaf-istituto-di-radioastronomia.jpg)