Embed Size (px)
Citation preview

UNIVERSIDADE FEDERAL DO CEARÁ
CENTRO DE CIÊNCIAS
DEPARTAMENTO DE BIOQUÍMICA E BIOLOGIA MOLECULAR
PROGRAMA DE PÓS-GRADUAÇÃO EM BIOQUÍMICA
FRANCISCO DALTON BARRETO DE OLIVEIRA
ANÁLISE FISIOLÓGICA E PROTEÔMICA DE PLANTAS DE SORGO SOB
ESTRESSE SALINO E NUTRIDAS COM DIFERENTES FONTES DE
NITROGÊNIO
FORTALEZA
2017
FRANCISCO DALTON BARRETO DE OLIVEIRA
ANÁLISE FISIOLÓGICA E PROTEÔMICA DE PLANTAS DE SORGO SOB ESTRESSE
SALINO E NUTRIDAS COM DIFERENTES FONTES DE NITROGÊNIO
Dissertação apresentada ao Programa de Pós-
Graduação em Bioquímica do Departamento de
Bioquímica e Biologia Molecular, da
Universidade Federal do Ceará, como requisito
parcial para obtenção do título de Mestre em
Bioquímica. Área de concentração: Bioquímica
Vegetal
Orientador: Enéas Gomes Filho
Coorientador: Rafael de Souza Miranda
FORTALEZA
2017


FRANCISCO DALTON BARRETO DE OLIVEIRA
ANÁLISE FISIOLÓGICA E PROTEÔMICA DE PLANTAS DE SORGO SOB ESTRESSE
SALINO E NUTRIDAS COM DIFERENTES FONTES DE NITROGÊNIO
Dissertação apresentada ao Programa de Pós-
Graduação em Bioquímica do Departamento
de Bioquímica e Biologia Molecular, da
Universidade Federal do Ceará, como requisito
parcial para obtenção do título de Mestre em
Bioquímica. Área de concentração:
Bioquímica Vegetal
Aprovada em:____/____/________.
BANCA EXAMINADORA
_______________________________________________________
Prof. Dr. Enéas Gomes Filho (Orientador)
Universidade Federal do Ceará (UFC)
_______________________________________________________
Prof. Dra. Dirce Fernandes de Melo
Universidade Federal do Ceará (UFC)
_______________________________________________________
Prof. Dr. Humberto Henrique de Carvalho
Universidade Federal do Ceará (UFC)

A minhas queridas irmãs Maitê (in memorian)
e Dayse; a meu pai Maurílio, a minha mãe
Terezinha e a meu primo Eliezer Bruno (in
memorian).
...com amor.

AGRADECIMENTOS
A Deus, por me fornecer força e perseverança para continuar nestes dois anos e
meio de caminhada;
Ao Prof. Dr. Enéas Gomes Filho, do Laboratório de Fisiologia Vegetal, do
Departamento de Bioquímica e Biologia Molecular da Universidade Federal do Ceará, por ter
me acolhido, me orientado e me apoiado durante este período e na realização deste trabalho;
Ao Dr. Rafael de Souza Miranda (coorientador), elemento fundamental na
realização deste trabalho, por sua solicitude, conhecimentos transmitidos, auxílio e
coorientação na realização deste trabalho;
À Profa. Dra. Dirce Fernandes de Melo, do Laboratório de Bioenergética, do
Departamento de Bioquímica e Biologia Molecular da Universidade Federal do Ceará (UFC),
por ter aceitado constituir a banca examinadora, além de toda a tutoria, conselhos e
ensinamentos durante a graduação;
À Profa. Dra. Ana Cristina de Oliveira Monteiro Moreira e à Dra. Marina Duarte
Pinto Lobo, da Universidade de Fortaleza (UNIFOR), pela colaboração e solicitude prestadas
na etapa final deste trabalho, com as análises de espectrometria de massas dos spots protéicos;
Ao Prof. Dr. Humberto Henrique de Carvalho do Laboratório de Fisiologia
Vegetal, do Departamento de Bioquímica e Biologia Molecular (UFC), por ter aceito compor
a banca examinadora, pelo convívio e pelos conselhos prestados;
À Profa. Dra. Maria Raquel Alcântara de Miranda, do Laboratório de Bioquímica
e Fisiologia de Frutos, do Departamento de Bioquímica e Biologia Molecular da UFC, e seus
orientandos, por ter nos auxiliado em parte dos experimentos;
À Profa. Dra. Ilka Maria Vasconcelos, do Laboratório de Toxinas Vegetais
(DBBM – UFC), por todo o conhecimento, carinho e apoio adquiridos na disciplina de
Bioquímica e durante todo o mestrado;
Ao Prof. Dr. Bruno Anderson Matias da Rocha, coordenador do programa de pós-
graduação em Bioquímica da UFC, assim como os secretários Pedro Alencar e Vanda Livino
pela compreensão e colaboração, que permitiram a elaboração deste trabalho;
Aos amigos Gyedre dos Santos Araújo e Daniel Gomes Coelho, outros
componentes cruciais na elaboração desse trabalho, pelo companheirismo, pelo auxílio
imensurável na execução desse trabalho, pelo agradável convívio, pelas sugestões,
ensinamentos e pelos bons momentos vividos no Laboratório de Fisiologia Vegetal;

Ao Dr. Carlos Eduardo Braga de Abreu, do Departamento de Bioquímica e
Biologia Molecular (UFC), pelo companheirismo, convívio, risadas e principalmente pelos
auxílios prestados no início deste trabalho;
A meus pais, José Maurílio de Oliveira e Terezinha Araújo Barreto, pelo carinho,
por sempre acreditarem na minha capacidade, pelo direcionamento e pelo apoio em cada
decisão tomada por mim durante toda a minha vida;
À minha companheira e amiga Raissa Barros Rodrigues Neves, pelo amor,
carinho, compreensão, conselhos, apoio, bons momentos e auxílios prestados nesses quase
dois anos de convívio;
À minha irmã de criação Tereza Garcia de Morais e meu sobrinho, João Henrique
Sávio Deodoro Filho, pelo carinho e convívio diário;
Aos demais membros e agregados do Laboratório de Fisiologia Vegetal
(LABFIVE - UFC): Igor Moura, Luckas Huriel Duarte, Daniel de Oliveira, Paulo André
Freitas, Stelamaris Paiva, Joanna Rocha, Cibelle Gadelha, Isa Mary Pereira, Camila
Domingues, Lineker Lopes, Karollyny Roger, Cinthia Queiroz, Valeria Chaves, Viviane
Ruppenthal e Valdineia Soares de Freitas, pelo convívio, risadas, aprendizado e experiências
compartilhadas nestes dois anos;
Aos membros e agregados do Laboratório de Genômica Funcional (UFC): Prof.
Dr. José Hélio Costa, Thais Andrade, Clesivan Pereira, André Luiz Maia, Sarah Gomes,
Lyndefania Melo, Thays Aquino, Beatriz Lima, Katia Saraiva, Camila Freitas e à querida
mascote Severina, pelas conversas, momentos e apoio prestados na elaboração deste trabalho;
Aos grandes amigos que este Mestrado me proporcionou, Ms. Felipe Barros e Ms.
Roberto Nascimento (UFC), pelas experiências, conhecimentos trocados, convívio,
consideração e apoio nos momentos mais delicados deste período;
Aos amigos de longa data Marcos Paulo Oliveira (primo), Tony Jeimison Matos,
Diego Pereira, Caio Araújo, José Araujo, Bruno Damasceno, Rafael Vieira, Anderson
Cavalcanti, Fellipe Cavalcante, Rainer Leal e Marcelo Farias, por estes quase 13 anos de
risadas, saídas e companheirismo;
A meu terapeuta, Mateus Costa, pela disponibilidade, compreensão, diálogos e
reflexões que temos tido e que me ajudaram a concluir este trabalho;
Aos demais amigos e familiares que de alguma forma me ampararam nas horas
difíceis ou propiciaram bons momentos vividos: Carlos Eduardo Barreto, Jessika Barreto,
Eduardo Barreto Neto, Diana Barreto, Eduardo Vasconcelos e Lucas Sampaio (primos e

agregados); a meus tios; a Raissa Bret e Handerson Ribeiro (DBBM – UFC); Samara e
Rebeca Brito; Luiz Gonzaga Figueiredo (amigo do peito de longa data); Fernando Serafim
Sales, Kamile Girão e Amanda Sombra; Deborah Doublas (Biotecnologia – UFC); aos
membros do curso BRASAS Fernando Henrique Sales (teacher Henry), Karine Moura
(teacher Bunny) e Germana Frota (teacher Ge) e a meus alunos; aos membros do time Instinct
Pici e a todos que passaram pela minha vida e contribuíram de alguma forma para meu
crescimento pessoal;
À Secretária do Departamento de Bioquímica e Biologia Molecular, Sra. Maria
Gildemar de Oliveira e ao funcionário Daniel Farias, pela consideração e auxílios prestados;
Ao Conselho Nacional de Desenvolvimento Científico e Tecnológico (CNPq),
pela bolsa concedida, e ao Instituto Nacional de Ciência e Tecnológia em Salinidade
(INCTSal), pelo indispensável apoio financeiro para execução desse trabalho

“É o que as pessoas dizem [que o tempo
muda tudo]. Não é verdade. Fazer coisas é o
que muda algo. Não fazer nada deixa as
coisas do jeito que eram”.
Dr. Gregory House

RESUMO
A salinidade é um fator abiótico que acarreta danos significativos à produtividade de inúmeras
culturas em todo o mundo, principalmente nas regiões áridas e semiáridas, como é o caso do
Nordeste brasileiro. Nesse quadro, a busca por estratégias de cultivo e a elucidação de
mecanismos de tolerância a esse estresse têm se tornado cada vez mais importantes para a
produção agrícola em solos salinos. Nos últimos anos, tem sido demonstrado que o
fornecimento de amônio (NH4+), como fonte de nitrogênio, ativa mecanismos cruciais para a
aclimatação de plantas de sorgo ao estresse salino. No presente estudo, foi conduzida uma
investigação detalhada do proteoma de plantas de sorgo forrageiro (Sorghum bicolor L.
Moench), genótipo CSF20, submetidas ao estresse salino e nutridas com nitrato (NO3-) ou
NH4+, buscando identificar proteínas responsivas à salinidade e correlacioná-las com os
mecanismos de tolerância ao estresse. A apresentação desse trabalho foi dividida em dois
capítulos: no primeiro, Capítulo I, é apresentada uma revisão de literatura com o estado da
arte dos principais temas abordados ao longo do estudo; e no segundo, Capítulo II, o qual se
encontra na forma de um artigo completo para submissão, são apresentados os dados de
crescimento, as respostas fisiológicas e o estudo proteômico das folhas das plantas de sorgo.
Os resultados demonstraram claramente que as plantas de sorgo nutridas com NH4+
apresentaram melhor desempenho sob estresse salino que as nutridas com NO3-, dados os
maiores valores de biomassa, tais como área foliar, massa seca da parte aérea e das raízes. A
maior sensibilidade das plantas tratadas com NO3- foi associada a decréscimos nas massas
secas de raízes e partes aéreas, acúmulo excessivo de Na+ e baixa relação K
+/Na
+ nos tecidos.
O estudo proteômico revelou que um grande de número de proteínas foi modulado
diferencialmente pelo estresse salino e que essa regulação foi bastante influenciada pela fonte
de nitrogênio. De maneira geral, 115 proteínas apresentaram algum tipo de alteração pelo
estresse, tanto pelo aumento ou redução na abundância, como pela repressão ou síntese de
novo. Sob estresse salino, plantas nutridas com NO3- apresentaram regulação em 67 proteínas,
sendo 28 reguladas positivamente, 23 moduladas negativamente, 6 reprimidas e 10
sintetizadas de novo. A identificação, por LC-ESI-MS-MS, das proteínas alteradas pela
salinidade revelou que essas moléculas estão envolvidas principalmente com o processo
fotossintético/metabolismo do carbono (52%), o metabolismo energético (21%), a resposta ao
estresse (9%), ao sistema de defesa antioxidativo (5%) e a outros processos celulares (13%).
Em contraste, plantas nutridas com NH4+ mostraram alteração na expressão de 53 proteínas,

sendo 25 reguladas positivamente pela salinidade, 10 moduladas negativamente, 4 reprimidas
e 14 sintetizadas de novo. Desse total de proteínas, 42% estão relacionadas com o processo
fotossintético/metabolismo do carbono, 28% com o metabolismo energético, 13% com a
resposta ao estresse, 2% com o sistema antioxidativo e 15% a outros processos celulares. A
comparação do perfil proteico das plantas sob estresse salino (NO3- sal × NH4
+ sal) mostrou
que 35 proteínas foram expressas diferencialmente nas folhas; sendo 13 com maior
abundância nos tecidos das plantas nutridas com NH4+, 11 mais abundantes naquelas tratadas
com NO3-, 8 exclusivas do tratamento com NH4
+ e 3 específicas do tratamento com NO3
-. Os
dados sugerem que, sob salinidade, o melhor desempenho das plantas tratadas com NH4+ está
associado não somente à expressão de proteínas de resposta ao estresse, mas também ao
acionamento de um metabolismo energético mais eficiente, o qual fornece energia para os
mecanismos de defesa das plantas. Tais respostas possibilitam a manutenção da eficiência da
maquinaria fotossintética e são fundamentais para a maior tolerância ao estresse salino. Os
achados do presente estudo fornecem indícios de como a modulação do proteoma pode
resultar em uma melhor aclimatação ao estresse salino. Esses resultados proporcionam novas
perspectivas para o desenvolvimento de estratégias biotecnológicas a fim de se adquirir
genótipos mais tolerantes à salinidade.
Palavras-chave: Crescimento. Estresse salino. Fotossíntese. Íons inorgânicos. Nutrição
nitrogenada. Perfil proteico. Sorghum bicolor. Tolerância.

16
ABSTRACT
Salinity is an abiotic stress that causes significant damages to several crops yield around the
world, especially in arid and semiarid regions, like the Brazilian Northeast. In this context, a
search for cultivation strategies and the elucidation of the mechanisms of tolerance to that
stress have become more and more important for agricultural production in saline soils.
Lately, it has been shown that ammonium (NH4+) provided as nitrogen source activates
pivotal mechanisms to the acclimation of sorghum plants to salt stress. In this work a detailed
investigation in the proteome of forage sorghum (Sorghum bicolor L. Moench) genotype
CSF20 under salt stress and fed with either nitrate (NO3-) or NH4
+ was performed, aiming to
identify salt-responsive proteins and correlate them with tolerance mechanisms to the stress.
The presentation of this work was divided in two chapters. The first one, chapter I, exhibits a
review with the state-of-the-art of the main subjects addressed throughout the study. In
chapter II, in the form of article, growth data, physiological responses and the proteomic study
of leaves of sorghum plants are presented. The results clearly demonstrated that NH4+-fed
sorghum plants displayed better performance under salt stress than those ones supplied with
NO3-, given higher biomass values, such as leaf area and root and shoot dry mass. The greater
sensitivity of nitrate-grown plants was associated with massive decreases in roots and shoots
dry masses, excessive Na+ accumulation and low K
+/Na
+ ratio in tissues. The proteomic study
revealed that a large number of proteins are differentially modulated by salt stress, and this
regulation is highly influenced by the nitrogen source. In general, 115 proteins underwent
some sort of alteration in reponse to the stress, like increase or decrease in the abundance,
repression or de novo synthesis. Under salt stress, NO3--fed plants showed regulation in 67
proteins being 28 positively regulated, 23 negatively regulated, 6 repressed and 10 de novo
synthesized. The identification of these proteins by LC-ESI-MS-MS revealed that they are
involved mainly in carbon/photosynthetic metabolism (52%), energetic metabolism (21%),
response to stress (9%) antioxidant defense system (5%) and other cellular processes (13%).
In contrast, NH4+-grown plants displayed alteration in the expression of 53 proteins, being 25
positively salt-regulated, 10 negatively regulated, 4 suppressed and 14 de novo synthesized.
Out of this total of proteins, 42% are associated with carbon/photosynthetic metabolism, 28%
with energetic metabolism, 13% with response to stress, 2% with the antioxidant defense
system and 15% other cellular processes. The comparison of the protein profile of plants
under salt stress (NO3- salt × NH4
+ salt) showed that 35 proteins are differentially expressed in
17
leaves, being 13 with greater abundance in tissues of NH4+-fed plants, 11 in those grown with
NO3-, 8 NH4
+-growth exclusive and 3 NO3
- -treated specific. Data suggest that, under salinity,
the better performance of NH4+ is related not only to the expression of stress-responsive
proteins, but also to the activation of a more efficient energetic metabolism, which provides
energy to defense mechanisms of those plants. Such results allow the maintenance of the
photosynthetic apparatus efficiency and are crucial for the greater tolerance to salt stress.
These findings give signs of how proteome modulation can result in a better acclimation to
salt stress. The results offer new perspectives to the development of biotechnological
strategies in order to acquire more salt-tolerant genotypes.
Keywords: Growth. Inorganic ions. Nitrogen nutrition. Protein profile. Salt stress. Sorghum
bicolor. Tolerance.

LISTA DE ABREVIATURAS
APX peroxidase do ascorbato
CAT catalase
DHAR redutase do desidroascorbato
GOGAT glutamato-sintase (glutamina-oxoglutarato-aminotransferase)
GPX peroxidase da glutationa
GR redutase da glutationa
GS glutamina-sintetase
HKT proteína transportadora K+de alta afinidade
H+-PPase pirofosfatase inorgânica
MDHAR redutase do monodesidroascorbato
NHX proteína antiporte vacuolar trocadora de Na+/H
+
NiR redutase do nitrito
NR redutase do nitrato
NRT transportadores simporte de nitrato (Nitrate Transporters)
P-ATPase ATPase de membrana plasmática
POD peroxidase
ROS espécies reativas de oxigênio (Reactive Oxygen Species)
SOD dismutase do superóxido
SOS1 proteína antiporte de sódio de membrana plasmática (Salt Overly Sensitive 1)
V-ATPase ATPase de tonoplastos (membrana vacuolar)
2D eletroforese bidimensional
SUMÁRIO
1 INTRODUÇÃO ...................................................................................................... 15
2 OBJETIVOS ........................................................................................................... 17
2.1 Objetivo geral ......................................................................................................... 17
2.2 Objetivos específicos .............................................................................................. 17
3 FUNDAMENTAÇÃO TEÓRICA ......................................................................... 18
3.1 Estresse salino e seus efeitos sobre as plantas ...................................................... 18
3.2 Mecanismos de tolerância ao estresse salino ....................................................... 20
3.2.1 Ajustamento osmótico e iônico ............................................................................... 20
3.2.2 O estresse oxidativo e o ajustamento redox ............................................................ 22
3.3 Proteômica como ferramenta para elucidação dos mecanismos de tolerância
à salinidade ............................................................................................................. 23
3.4 Fonte de nitrogênio e tolerância ao estresse salino ............................................. 25
3.5 O sorgo .................................................................................................................... 27
4 A DETAILED INVESTIGATION OF NITROGEN SOURCE-
REGULATED SALINITY RESPONSIVE PROTEINS IN SORGHUM
LEAVES ………………………….......................................................................... 28
4.1 Abstract ................................................................................................................... 28
4.2 Introduction ............................................................................................................ 29
4.3 Materials and Methods .......................................................................................... 31
4.3.1 Plant material and growth conditions .................................................................... 31
4.3.2 CO2 assimilation rate and photosystem II efficiency ............................................. 32
4.3.3 Growth parameters .................................................................................................. 32
4.3.4 Determination of inorganic íons ............................................................................ 33
4.3.5 Protein extraction .................................................................................................... 33
4.3.6 SDS-PAGE ............................................................................................................... 33
4.3.7 Bidimensional electrophoresis (2-DE) and image analysis ................................... 34
4.3.8 In-gel digestion ........................................................................................................ 35
4.3.9
Mass spectrometry analysis ..................................................................................... 35
4.3.10 Protein identification .............................................................................................. 36
4.3.11 Experimental design and statystical analysis ........................................................ 36

4.4 Results ..................................................................................................................... 37
4.4.1 Salt tolerance indicators ......................................................................................... 37
4.4.2 2D electrophoresis profile, protein identification and level of regulation of
proteome .................................................................................................................. 39
4.5 Discussion ................................................................................................................ 79
4.5.1 Physiological changes in sorghum plants under salt stress …………………….. 80
4.5.2 Proteins related to photosynthesis and carbon metabolism ……………………... 82
4.5.3 Proteins related to energetic metabolism ………………………………………... 85
4.5.4 Proteins related to antioxidant system .................................................................... 86
4.5.5 Proteins related to response to stress and other cellular processes ……………... 87
4.6 Acknowledgments .................................................................................................. 91
5 CONCLUSÃO…………………………………………………………………..... 92
REFERÊNCIAS...................................................................................................... 93

15
1 INTRODUÇÃO
A salinização dos solos é um importante fator que causa a perda de produtividade
de solos cultivados. Sabe-se que, no mundo, as áreas com solos afetados pela salinidade têm
aumentado, e este fenômeno é particularmente intenso em solos irrigados. Estima-se que 20%
das áreas irrigadas (45 milhões de hectares), as quais produzem um terço dos alimentos
mundiais, sejam afetadas pelo estresse salino (SHRIVASTAVA; KUMAR, 2015;
MACHADO; SERRALHEIRO, 2017). No Brasil, estima-se que cerca de 20 a 25% das áreas
irrigadas exibam algum grau de salinidade, sendo que a maior parte dessas terras se localiza
na região do semiárido brasileiro (CASTELLANOS et al., 2016).
O sorgo (Sorghum bicolor L. Moench) é uma cultura conhecida por possuir
grande tolerância a altas temperaturas e ao déficit hídrico (BERENGUER; FACI, 2001;
TERRA et al., 2010). Essas características, associadas com o eficiente processo fotossintético,
torna seu plantio possível nas regiões semiáridas e subtropicais, nas quais, além das elevadas
temperaturas, são baixas as precipitações pluviométricas anuais (SMITH, FREDERIKSEN,
2000; BARCELOS et al., 2011). O sorgo também é caracterizado por sua moderada
tolerância ao estresse salino (LACERDA et al., 2005), sendo esta característica fundamental
para utilização dessa espécie com rendimentos economicamente aceitáveis, principalmente
quando o cultivo em condições salinas é inevitável (AQUINO; LACERDA; GOMES-FILHO,
2007).
De modo geral, a aclimatação de plantas ao estresse salino depende dos
ajustamentos osmótico, iônico e bioquímico, que incluem: o acúmulo seletivo ou a exclusão
de íons; o controle da absorção de íons pelas raízes e seu transporte para as folhas; a
compartimentalização de íons ao nível celular e de planta inteira; a síntese de solutos
compatíveis, mudanças nas vias fotossintéticas, indução de enzimas e compostos
antioxidativos e de hormônios vegetais, dentre outros (MUCHATE et al., 2016). No nível
molecular, essas regulações podem envolver vários genes associados a múltiplas vias
metabólicas de percepção, sinalização e resposta ao estresse (KURUSU et al., 2015).
A proteômica tornou-se um dos enfoques mais promissores para compreender os
mecanismos de tolerância das plantas aos estresses ambientais, tais como a salinidade
(AHMAD et al., 2016). Por meio dessa abordagem, o padrão de proteínas responsivas aos
estresses ambientais tem sido investigado, utilizando-se de técnicas de eletroforese e
espectrometria de massas (CARUSO et al., 2008; AGRAWAL et al., 2013). Além disso, os
estudos envolvendo aplicações biotecnológicas têm contribuído para melhorar a compreensão
16
das proteínas e processos metabólicos envolvidos nas respostas ao estresse em plantas
(SILVEIRA; CARVALHO, 2016). Recentemente, vários trabalhos abordaram o estudo
proteômico em plantas sob condições de salinidade, sendo verificado que diversas proteínas
diferencialmente expressas pelo estresse pertenciam a importantes processos fisiológicos, tais
como o metabolismo do carbono ou às vias de defesa antioxidantes, bem como a outras
importantes vias metabólicas (SOBHANIAN; AGHAEK; KOMATSU, 2011; ABREU et al.,
2014; MOSTEK et al., 2015).
Miranda et al. (2013), estudando a tolerância de plantas de sorgo à salinidade,
observaram que ela dependia da fonte de nitrogênio presente no meio de crescimento.
Segundo esses autores, as plantas nutridas com amônio (NH4+) exibiram melhores
características fisiológicas que as nutridas com nitrato (NO3-). Recentemente, Miranda et al.
(2017) comprovaram que o NH4+ como única fonte de nitrogênio ativa mecanismos, que
envolvem a expressão gênica de bombas de H+ e transportadores antiporte Na
+/H
+ de
membrana plasmática e de tonoplasto, que controlam o acúmulo de Na+ na planta inteira e
conferem maior tolerância das plantas de sorgo à salinidade. No entanto, apesar desses
avanços não se conhece o conjunto das proteínas que são diferencialmente alteradas sob
condições de estresse salino e na presença de diferentes fontes de nitrogênio (nitrato e
amônio), cujo conhecimento pode contribuir para o esclarecimento das vias metabólicas
envolvidas com a tolerância aos sais.
Diante do exposto, o objetivo do presente trabalho foi estudar as alterações
fisiológicas, especialmente aquelas no proteoma, de folhas de plantas de sorgo (espécie com
genoma completo conhecido e disponível) sob estresse salino e expostas a diferentes fontes de
nitrogênio. Espera-se com isso, contribuir para uma melhor compreensão da aclimatação de
plantas ao estresse salino, bem como entender melhor o papel da fonte de nitrogênio na
tolerância ao estresse salino.

17
2 OBJETIVOS
2.1 Objetivo geral
Investigar as alterações fisiológicas, com ênfase no perfil proteico de folhas, de
plantas Sorghum bicolor sob estresse salino em função da fonte de nitrogênio, bem como
relacioná-las aos mecanismos de tolerância ao estresse salino
2.2 Objetivos específicos
Determinar os parâmetros de crescimento (área foliar, massa seca da parte aérea e das raízes)
de plantas de sorgo nutridas com nitrato ou amônio e submetidas ao estresse salino;
Mensurar o acúmulo dos íons K+ e Na
+ nos tecidos da parte aérea e das raízes de plantas de
sorgo estressadas com NaCl;
Investigar as alterações ocorrentes nas taxas de assimilação de CO2 e na eficiência quântica
máxima e efetiva do fotossistema II de plantas de sorgo estressadas com NaCl e tratadas com
diferentes regimes de nitrogênio inorgânico;
Elaborar mapas proteômicos reprodutíveis e de qualidade das proteínas de folhas, avaliando a
influência dos tratamentos sobre os padrões eletroforéticos bidimensionais;
Analisar os mapas proteômicos e identificar as proteínas diferencialmente expressas nas
folhas das plantas de sorgo dos diferentes tratamentos;
Realizar um estudo da ontologia das proteínas diferencialmente expressas e identificar
possíveis vias metabólicas de aclimatação ao estresse salino.

18
3 FUNDAMENTAÇÃO TEÓRICA
3.1 Estresse salino e seus efeitos sobre as plantas
A salinidade em terras cultiváveis é um problema crescente e limita o
desenvolvimento das plantas, culminando em perda de produtividade. De acordo com Pedrotti
et al. (2015), a área total de solos salinos corresponde a 7% de toda a superfície terrestre,
equivalente a aproximadamente 10.000.000 km2. No Brasil, o problema da salinização é
verificado em todo país, principalmente na região Nordeste, onde aproximadamente 25% das
áreas irrigadas estão salinizadas (PEDROTTI et al., 2015).
A salinidade induz uma série de respostas morfológicas, fisiológicas e
bioquímicas nas plantas decorrentes de mudanças nos processos moleculares (GUPTA;
HUANG, 2014). Essas respostas variam amplamente entre as espécies e dependem do tipo e
concentração do sal, do tempo e número de exposições ao estresse, do estado fenológico da
planta, bem como de outros fatores (SHINOZAKY et al., 2015).
Os efeitos adversos da salinidade sobre as plantas podem ser ocasionados pelo
estresse osmótico, toxicidade iônica e/ou deficiência nutricional (ZHU, 2002). Durante a
exposição ao estresse, em um curto intervalo de tempo, apenas o efeito osmótico atua sobre a
planta, induzindo variações instantâneas (MUNNS, 2002). Nessa condição, os sais na solução
do solo baixam seu potencial hídrico em decorrência da diminuição do potencial osmótico do
solo, o que acarreta na dificuldade da absorção de água pelas plantas. Já os problemas de
toxicidade normalmente surgem quando os íons do solo são acumulados nas plantas em
demasia, ficando dessa maneira dissolvidos no citosol e em outras organelas onde acabam
interferindo em inúmeras reações enzimáticas e provocando danos ao seu crescimento
(MUNNS, 2002; MUNNS; TESTER, 2008; PRISCO; GOMES-FILHO; MIRANDA, 2016).
Em adição a esses efeitos diretos da salinidade sobre as plantas, inúmeros efeitos secundários
também podem surgir. Por exemplo, o estresse salino também provoca um desbalanço no
estado redox das células, gerando um estresse oxidativo através da produção excessiva de
espécies reativas de oxigênio (ROS), tais como o peróxido de hidrogênio oxigênio (H2O2), o
oxigênio singleto (1O2) e os radicais livres superóxido (•O2
-) e hidroxil (HO•). Essas ROS são
altamente reativas e podem alterar o metabolismo celular normal através da oxidação de
biomoléculas (DEMIDCHIK, 2015).
A inibição do crescimento em decorrência desses efeitos ocorre na maioria das
19
espécies cultivadas, mesmo em baixas concentrações de sais (CHINNUSAMY;
JAGENDORF; ZHU, 2005). Contudo, o grau no qual o crescimento das plantas é reduzido
dependerá das diferenças nos níveis de tolerância entre as espécies e entre cultivares de uma
mesma espécie (PARIDA; DAS, 2005). Nesse contexto, as plantas têm sido classificadas em
halófitas e glicófitas, de acordo com a tolerância ao estresse salino. As halófitas são plantas
que crescem em solos salinos e toleram altas concentrações de sais, enquanto que as
glicófitas, que compreendem a maioria das plantas cultivadas, são sensíveis aos sais e não
toleram longa ou breve exposição a ambientes salinos (CHINNUSAMY; JAGENDORF;
ZHU, 2005). Durante o estresse salino, os principais processos metabólicos da planta, como a
fotossíntese, a respiração, a síntese de proteínas, as relações hídricas e as reações enzimáticas,
são afetados e a primeira resposta é a redução da taxa de crescimento foliar, seguida de
supressão do crescimento quando o estresse se acentua (MUNNS, 2002; PARIDA; DAS,
2005).
O acúmulo de Na+ nos tecidos tem sido considerado determinante para a maior
sensibilidade ao estresse salino em diversas espécies de plantas (HAMAMOTO et al., 2015).
Entretanto, as plantas desenvolveram mecanismos para prevenir e aliviar os danos provocados
pelo excesso de sais, a fim de restabelecer as condições homeostáticas, especialmente a
homeostase da relação K+/Na
+, retomando seu crescimento, ainda que com taxas reduzidas
(ZHU, 2001; ZHANG; SHI, 2013). De modo geral, nas glicófitas, a tolerância das plantas à
salinidade depende da habilidade em controlar o acúmulo e o transporte de Na+, envolvendo:
i) seletividade na absorção pelas células das raízes; ii) exclusão ou compartimentalização de
Na+ nas células das raízes; iii) carregamento do K
+ no xilema em detrimento do Na
+; iv)
descarregamento do Na+ da seiva do xilema; v) minimização da translocação dos íons Na
+ e
Cl- para a parte aérea em crescimento (MUNNS; TESTER, 2008; MAATHUIS; AHMAD;
PATISHTAN, 2014). Além disso, as plantas devem ser capazes de alterar a estrutura da
membrana plasmática; induzir a expressão e a atividade de enzimas antioxidativas; e alterar
seu balanço hormonal, a fim de restabelecer sua homeostase celular e, finalmente, retomar seu
crescimento e desenvolvimento (ZHU, 2001; PARIDA; DAS, 2005; MUNNS; TESTER,
2008).
Assim, nas situações em que a salinidade do solo não pode ser mantida em um
nível aceitável para as culturas exploradas economicamente, por meio de um manejo
adequado do solo e da água de irrigação, uma alternativa viável é a seleção criteriosa de
espécies ou cultivares que, ao mesmo tempo, sejam mais tolerantes aos danos causados pelos
20
sais e possam ter produções economicamente satisfatórias.
3.2 Mecanismos de tolerância ao estresse salino
Muitos fatores determinam como as plantas respondem ao estresse salino, e como
suas interações culminam em tolerância ou susceptibilidade à salinidade (SHINOZAKI et al.,
2015). A tolerância ao estresse salino pode ser definida como a capacidade das plantas de
crescerem e completarem seu ciclo de vida, mesmo sob altos níveis de sais no meio (YADAV
et al., 2012). Como referido anteriormente, as glicófitas para sobreviverem ao estresse salino
necessitam ativar complexas redes regulatórias, as quais envolvem mudanças fisiológicas,
bioquímicas, morfológicas e moleculares integradas que não são transmitidas para as gerações
futuras. Esse processo é conhecido como aclimatação e envolve o restabelecimento da
homeostase celular em organismos individuais (CABELLO; LODEYRO; ZURBRIGGEN,
2014).
3.2.1 Ajustamento osmótico e iônico
Para restabelecer o gradiente de potencial hídrico e a consequente absorção de
água, as plantas precisam tornar o potencial hídrico das raízes menor que o do solo. Tal
processo é denominado ajustamento osmótico e é considerado um mecanismo importante para
a aclimatação de plantas à seca e à salinidade, pois possibilita as plantas manter o turgor e
processos relacionados, tais como: a abertura estomática, o crescimento e o alongamento
celular (SINGH et al., 2015).
O ajustamento osmótico ocorre através da absorção de íons e da síntese de solutos
orgânicos como: açúcares, polióis, aminoácidos, amidas e compostos de amônio quaternário
(FLOWERS; MUNNS; COLMER, 2015). Esses solutos compatíveis não são tóxicos às
células, mesmo sob altas concentrações e não possuem carga líquida em pH fisiológico
(FAROOQ et al., 2017). Embora nem todas as culturas sejam capazes de sintetizar essas
moléculas, a maioria das plantas tolerantes ao estresse salino tendem a acumulá-las sob essas
condições, mantendo o teor relativo de água nos tecidos e o consequente crescimento da
planta (SAXENA et al., 2013; NASCIMENTO et al., 2015; FAN et al., 2016).
Em adição ao efeito dos solutos orgânicos, muitos estudos têm evidenciado que
plantas tolerantes à salinidade também podem alcançar o ajustamento osmótico através da

21
distribuição de íons entre o vacúolo e o citosol (HASEGAWA, 2013; NASCIMENTO et al.,
2015; FAN et al., 2016). Fan et al. (2016), ao determinarem o transcriptoma de plantas de
Paulownia tomentosa submetidas ao estresse salino, destacou a expressão aumentada dos
transcritos associados a uma complexa rede regulatória para manter a homeostase intracelular,
tanto osmótica quanto iônica, o que culminou no aumento da tolerância dessa espécie à
salinidade.
Além do seu papel no ajustamento osmótico, é essencial que, sob condições de
estresse salino, as células regulem o fluxo iônico, para manter baixa a concentração de íons
tóxicos, como o Na+ e alta a concentração de íons essenciais, como o K
+. Esse processo é
conhecido por ajustamento iônico, ou seja, plantas tolerantes ao estresse salino são aquelas
capazes de manter alta razão K+/Na
+ citosólica, especialmente nos tecidos fotossintetizantes
(FAROOQ et al., 2017).
Como citado anteriormente, os principais mecanismos relacionados ao
restabelecimento da homeostase iônica envolvem: o efluxo de Na+ de volta para o meio de
crescimento ou para o apoplasto; a compartimentação de Na+ no vacúolo; o controle do
carregamento do xilema; a retenção de Na+ nas células do caule; a recirculação de Na
+ pelo
floema; e a alocação de sais para as folhas mais velhas (YAMAGUCHI; HAMAMOTO;
UOZUMI, 2013). Esses processos são mediados por canais e transportadores associados à
membrana plasmática, ou ao tonoplasto, e são fortemente regulados (SHINOZAKY et al.,
2015).
Os principais transportadores são o SOS1 (Salt Overly Sensitive 1), o NHX
(Na+/H
+ exchanger) e, em menor escala, o HKT (High-affinity K
+ Transporter). Tais
proteínas catalisam o transporte de Na+ à custa da formação de um gradiente de potencial
eletroquímico, gerado por bombas de prótons na membrana plasmática (P-ATPases) e no
vacúolo (V-ATPases e H+-PPases), caracterizando, assim, um transporte ativo secundário. O
SOS1 é localizado na membrana plasmática e é responsável pelo efluxo de Na+ a partir do
citosol, enquanto que NHX é encontrado no tonoplasto e é responsável pela
compartimentação desse íon no vacúolo. Já aos transportadores HKT tem sido atribuído a
recirculação de Na+ entre os órgãos da planta, contribuindo para a menor exposição dos
tecidos fotossintetizantes à toxicidade desse íon (KHAN; AHMAD; KHAN, 2015). Assim,
diversas pesquisas têm evidenciado que o aumento da expressão de genes ou da atividade
fisiológica dos transportadores e bombas contribuem para a regulação da homeostase K+/Na
+

22
e, consequentemente, para o aumento da tolerância das plantas à salinidade (LU et al., 2014;
MANCARELLA et al., 2016; MIRANDA et al., 2017).
Em adição ao seu papel no restabelecimento do gradiente de potencial hídrico
planta-solo, o acúmulo de osmólitos compatíveis pode desempenhar funções protetivas, uma
vez que atuam também como antioxidantes, e com isso, contribuem para a manutenção da
integridade das macromoléculas e para a eliminação de várias ROS. Além disso, esses
osmoprotetores estabilizam enzimas e proteínas (FAROOQ et al., 2017).
3.2.2 O estresse oxidativo e o ajustamento redox
As plantas, sob condições ótimas de crescimento, mantêm baixo nível de ROS,
porém em condições de estresse, como o salino, por exemplo, essas moléculas têm suas
concentrações elevadas, gerando o chamado estresse oxidativo (VAIDYANATHAN et al.,
2003; KAUR; KAUR; ARORA 2016). Nesse caso, as plantas se ajustam com relação a seu
estado de óxido/redução de modo a manter o equilíbrio entre a produção e a eliminação das
ROS, sendo esse processo essencial para a proteção oxidativa das células vegetais (NOCTOR;
FOYER, 2016). De acordo com esses autores, as plantas possuem mecanismos de defesa
oxidativa, os quais podem ser enzimáticos e não enzimáticos. O primeiro é constituído
principalmente pelas enzimas catalase (CAT), peroxidase do ascorbato (APX), peroxidase da
glutationa (GPX), dismutase do superóxido (SOD), redutase da glutationa (GR), redutase do
monodesidroascorbato (MDHAR), redutase do desidroascorbato (DHAR), peroxidases (que
utilizam fenóis para eliminar o H2O2) (POD) dentre outras (NOCTOR; FOYER, 2016);
enquanto o segundo é formado por compostos de baixo peso molecular, que podem ser de
natureza lipofílica, como os tocoferóis e carotenoides, ou hidrofílica, como o ascorbato e a
glutationa. A coordenação entre esses sistemas está intimamente relacionada com a tolerância
das plantas à salinidade (MUCHATE et al., 2016; NOCTOR; FOYER, 2016; SHAFI et al.,
2017).
Sob condições de estresse salino, a regulação positiva de enzimas antioxidantes,
bem como dos níveis de compostos antioxidantes, pode ser considerada como uma resposta
proativa de aclimatação, que resulta em níveis mais baixos de ROS e maior tolerância ao
estresse salino (HOSSAIN et al., 2016). Nesse contexto, Hossain et al. (2017) demonstraram
que a tolerância de plantas de mangue ao estresse salino está diretamente relacionada com o
aumento de atividade das enzimas CAT, APX, SOD, GPX e MDHAR, principalmente nas

23
raízes. Nessa mesma linha de raciocínio, Chakraborty et al. (2016), estudando seis genótipos
de amendoim com tolerância diferencial ao estresse salino, observaram que a atividade da
POD foi significativamente aumentada nos genótipos tolerantes, o que contribuiu para a
redução no conteúdo de H2O2 nesses genótipos. Segundo esses autores, os resultados
encontrados sustentam a hipótese de que a tolerância do amendoim ao estresse salino pode ser
atribuída a uma melhor capacidade de defesa antioxidante. Adicionalmente, a superexpressão
dos genes CuZnSOD e APX em plantas de batata doce sensíveis à salinidade promoveu uma
eficiente limpeza de ROS e o crescimento das raízes nas plantas transgênicas em comparação
às selvagens (YAN et al., 2016).
3.3 Proteômica como ferramenta para elucidação dos mecanismos de tolerância à
salinidade
O estudo sistemático global das proteínas, conhecido como proteômica, aliado a
ensaios fisiológicos e moleculares, tornou-se uma poderosa ferramenta para a identificação de
proteínas e de mecanismos envolvidos nas respostas da tolerância aos estresses ambientais,
pois permite avaliar simultaneamente o perfil proteico e, em paralelo, a identificação de
alterações pós-traducionais induzida por estresses, inclusive o salino (WILKINS et al., 1996;
SOBHANIAN et al., 2010; ABREU et al., 2014).
Pesquisas destinadas à comparação de diversos proteomas são, na maior parte,
dominadas pela separação das proteínas por eletroforese bidimensional em gel de
poliacrilamida e, em seguida, por identificação dessas proteínas por espectrometria de massas
(CARUSO et al., 2008; AGRAWAL et al., 2013). A eletroforese bidimensional (2D) permite
a separação das proteínas pelo ponto isoelétrico e pela massa molecular e, após a confecção
de mapas proteicos bidimensionais, as proteínas podem ser analisadas através de softwares
específicos para a análise da imagem dos géis 2D. Logo após, apenas as proteínas que
apresentarem alterações significativas reprodutíveis são selecionadas para a identificação por
espectrometria de massas (ROGOWSKA-WRZESINSKA et al., 2013).
A espectrometria de massas é uma técnica analítica extremamente valiosa, pois
apresenta acurado grau de sensibilidade. Nela, as moléculas presentes na amostra são
convertidas em íons em fase gasosa, que são subsequentemente separados no espectrômetro
de massas de acordo com a relação massa/carga (m/z) (DASS, 2001; CUNHA; CASTRO;
FONTES, 2006). Essa técnica é crucial nos estudos proteômicos, principalmente nos que
24
empregam uma abordagem comparativa ocasionada por certos estímulos, tais como mudanças
no estádio de desenvolvimento e estresses ambientais. Assim, os passos centrais no emprego
da proteômica em plantas são: (a) extração e solubilização das proteínas; (b) separação das
proteínas por focalização isoelétrica e massa molecular (eletroforese 2D); (c) digestão das
proteínas com uma enzima proteolítica, tal como a tripsina; (d) determinação das massas dos
fragmentos peptídicos por espectrometria de massas; e (e) análise das proteínas de interesse
em bancos de dados (RAMPITSCH; SRINIVASAN, 2006).
Recentemente, vários estudos empregando abordagens proteômicas foram
realizados em diferentes cultivares e espécies de plantas sob condições de salinidade. Em
plântulas de sorgo (Sorghum bicolor L.), Swami et al. (2011) avaliaram as mudanças no
proteoma em resposta ao tratamento com NaCl e identificaram um total de 21 proteínas
diferencialmente sintetizadas pelo sal. A maioria das proteínas identificadas pertencia a vias
de transdução de sinal, transporte de íons inorgânicos e metabolismo.
Ghaffari et al. (2014), por sua vez, em estudos com folhas de arroz (Oryza sativa
L.), demostraram que dos 864 spots detectados de forma reprodutível, 67 spots mostraram
regulação diferencial sob estresse salino. Os autores observaram que as proteínas que
apresentaram alterações estavam envolvidas em importantes processos fisiológicos, tais como
fotossíntese, síntese e processamento de proteínas e transdução de sinal. Além disso, a síntese
de proteínas relacionadas com o mecanismo de defesa antioxidante, conhecidas como
eliminadoras de ROS, também sofreram alterações com a salinidade. De modo similar,
Huerta-Ocampo et al. (2014) investigaram as mudanças no perfil de expressão de proteínas
em raízes de Amaranthus cruentus L. submetidas à salinidade. Na ocasião, os autores
identificaram 77 proteínas diferencias em resposta ao estresse salino, que foram agrupadas em
diferentes categorias de processos biológicos, tais como aquelas envolvidas com o
metabolismo dos carboidratos, a biossíntese e metabolismo dos aminoácidos e ácidos graxos e
as relacionadas com as respostas de defesa. Já a comparação do proteoma de dois genótipos
contrastantes à salinidade de Brassica juncea L. mostrou que 42 proteínas eram responsivas à
salinidade, sendo relacionadas a inúmeros processos celulares, incluindo: fotossíntese,
homeostase redox, metabolismo do nitrogênio, síntese de ATP e síntese e degradação de
proteínas (YOUSUF et al., 2017).
No geral, existe um grande número de informações que os estudos proteômicos
podem oferecer capazes de esclarecer os efeitos da salinidade na gama de proteínas
relacionadas a processos fisiológicos, bioquímicos e moleculares essenciais. Adicionalmente,

25
com o auxílio de ferramentas da bioinformática e de técnicas particulares de proteômicas, tais
como a proteômica redox e a fosfoproteômica, estudos voltados para a integração do
proteoma, transcriptoma, fisiologia e bioquímica poderão constituir uma importante estratégia
para o melhor entendimento dos mecanismos que governam as respostas à salinidade.
(STRÖHER et al., 2006; LV et al., 2014; SILVEIRA; CARVALHO, 2016).
3.4 Fonte de nitrogênio e tolerância ao estresse salino
O nitrogênio (N) é um dos elementos mais importante para o crescimento e
produtividade das plantas, sendo constituinte de biomoléculas essenciais, como ATP, NADH,
NADPH, clorofila, proteínas, enzimas, nucleotídeos (ácidos nucléicos) e muitos outros
metabólitos (HARPER, 1994; MASCLAUX-DAUBRESSE et al., 2010). Este elemento
apresenta-se disponível na solução do solo principalmente nas formas dos íons NO3- e NH4
+,
que podem ser absorvidos pela planta através da membrana plasmática das células da
epiderme e do córtex da raiz, principalmente nas regiões mais jovens (região apical)
(ZHONGHUA et al., 2011).
Após ser absorvido pelas raízes, o NO3- pode ser reduzido a NH4
+ através das
enzimas do metabolismo do nitrogênio ou ser transportado para a parte aérea, via xilema, para
ser assimilado nas folhas, uma vez que somente parte do NO3- absorvido é assimilado nas
raízes (CRAWFORD; GLASS, 1998; TAIZ; ZEIGER, 2013). No interior da célula, o nitrato
é reduzido a nitrito pela ação da redutase do nitrato (NR), o qual, por ser tóxico, é
rapidamente convertido em amônio pela atividade da redutase do nitrito (NiR), seguido pela
assimilação do NH4+
em aminoácidos, os quais podem ser translocados para as outras partes
da planta (WANG et al., 2012; KRAPP, 2015). Em contrapartida, a absorção direta de NH4+
pode ocorrer nas raízes, com rápida assimilação pela atividade das enzimas sintetase da
glutamina (GS) e sintase do glutamato (GOGAT), no chamado ciclo GS/GOGAT, resultando
num processo com menor custo energético de absorção e assimilação, quando comparado à
absorção do NO3- (XU; FAN; MILLER, 2012). A absorção de nitrato ocorre majoritariamente
por meio de transporte ativo secundário mediado pelo simporte 2 H+/NO3
- NRT (do inglês
Nitrate Transporter). Nesse processo, NO3- é transportado passivamente, mas depende de um
gradiente de prótons no apoplasto gerado pela P-ATPase, o qual envolve a hidrólise de ATP.
Contudo, a absorção de amônio pode se dar tanto por transporte ativo secundário, por

26
mecanismo similar àquele observado para o nitrato, ou por transporte passivo, quando a
amônia (NH3) é a forma predominante (XU; FAN; MILLER, 2012).
Em condições de salinidade, as plantas estão sujeitas a impactos que afetam a
aquisição de nutrientes do solo, devido a competição dos íons Na+ e Cl
-, que inibem a
absorção de importantes íons como o K+ e o NO3
- (MUNNS; TESTER, 2008). Estudo com
plântulas de Arabdopsis destaca os efeitos negativos da salinidade na absorção de nitrato e
assimilação do amônio (DEBOUBA et al., 2013), respostas comumente induzidas pelo
estresse salino na maioria das glicófitas, como a inibição da atividade de transportadores e
enzimas relacionados ao metabolismo do nitrogênio nas plantas (DEBOUBA et al., 2007;
SHAO et al, 2015). Assim sendo, recentes estudos apontam que a modificação da fonte de
nitrogênio, com substituição parcial ou total de NO3- por NH4
+, pode favorecer o
desenvolvimento de algumas espécies, principalmente quando estas estão sujeitas a condições
de estresse (KANT et al., 2007; BYBORDI, 2012; HU et al., 2015). Segundo Zhonghua et
al. (2011), plantas de Catharanthus roseus mostraram-se mais resistentes ao estresse salino
quando crescidas em meio nutritivo com quantidades equimolares das formas de NO3- e
NH4+. Para os autores, a nutrição com as formas combinadas de nitrogênio induziram menor
acúmulo de Na+ nos tecidos, maior acúmulo de açúcares solúveis e de aminoácidos livres e
manutenção da fotossíntese líquida em reposta ao estresse salino, resultando na mitigação dos
efeitos deletérios da salinidade no crescimento das plantas.
Apesar da vantagem energética, um dos fatores que limitam o uso do íon NH4+
é
sua toxicidade à célula. Alguns dos sintomas de toxidez comum entre as espécies envolvem
inibição da absorção de cátions, como K+, Mg
2+ ou Ca
2+; acidificação do meio de
crescimento; desbalanço hormonal e aumento do estresse oxidativo (BRITTO;
KRONZUCKER, 2002; BITTSÁNSZKY et al., 2015; ESTEBAN et al., 2016), embora o
mesmo não se aplique para algumas espécies, como o tomate (NIEVES-CORDONES et al.,
2007), o sorgo (MIRANDA et al., 2013) e citrus (FERNÁNDEZ-CRESPO et al., 2014). Para
as espécies Carrizo citrange, Spartina alterniflora e Sorghum bicolor, a nutrição com NH4+,
como fonte exclusiva de nitrogênio, foi determinante para mitigar os danos resultantes do
estresse salino.
Segundo Fernández-Crespo, Camañes e García-Agustín (2012), a nutrição com
NH4+ atuou acionando os sistemas de defesa antioxidante, bem como promoveu a redução do
acúmulo dos íons Cl- nos tecidos fotossintéticos, contribuindo para a aclimatação das plantas
de citrus em condições de salinidade. De forma semelhante, o feito priming foi observado em

27
halófita S. alterniflora, com intensificação das respostas antioxidantes que reduziram os danos
de membrana mesmo em altas concentrações de NaCl a 500 mM (HESSINI et al., 2013). Em
sorgo, a nutrição com NH4+ promoveu o menor acúmulo de Na
+ na planta, através da indução
da atividade e da expressão gênica das bombas P-ATPase e V-ATPase e transportadores
SOS1 e NHX de membrana plasmática e de tonoplasto (ALVAREZ-PIZARRO et al., 2011;
MIRANDA et al., 2013; 2017).
Também podem ser atribuídas à nutrição com amônio as reduções nos danos na
fotossíntese causados pela salinidade (MIRANDA et al., 2014). Embora nos tecidos
fotossintetizantes o NH4+ possa interferir negativamente no transporte de elétrons da
fotofosforilação (SCHORTEMEYER; STAMP; FEIL, 1997), Miranda et al. (2014)
forneceram evidências que as reduções na fotossíntese induzidas pela salinidade foram
mitigadas em plantas de sorgo nutridas com NH4+, resultando na alta taxa fotossintética em
comparação com as plantas nutridas com NO3- sob estresse salino.
O grupo de pesquisa de Fisiologia Vegetal da Universidade Federal do Ceará tem
demonstrado que a nutrição com NH4+ ativa diversas rotas metabólicas, que constituem
mecanismos determinantes para a aclimatação de plantas de sorgo ao estresse salino
(ALVAREZ-PIZARRO et al., 2011; MIRANDA et al., 2013; 2014; 2016; 2017). No entanto,
ainda não se sabe quais proteínas são moduladas pela fonte de nitrogênio prevalecente no
meio de crescimento de plantas de sorgo, bem como não existem relatos de como essas
respostas ocorrem quando as plantas estão expostas ao estresse salino.
3.5 O Sorgo
O sorgo (Sorghum bicolor L. Moench) é uma gramínea anual, pertencente à
família Poaceae (gramínea) e com metabolismo fotossintético do tipo C4. É uma cultura
bastante versátil e eficiente no aspecto fotossintético, sendo tolerante à seca e a temperaturas
elevadas (BERENGUER; FACI, 2001; BARCELOS et al., 2011; TERRA et al., 2010). Sua
significância no mundo deve-se à sua grande aplicabilidade (MEKI et al. 2013), sendo
originário da África, onde é empregado na alimentação básica humana, assim como na China
e Índia. Já nos Estados Unidos, Austrália e América do Sul ele é utilizado principalmente na
dieta animal (BELTON; TAYLOR, 2004; BARCELOS et al., 2011). É uma cultura
moderadamente tolerante à salinidade, sendo o quinto cereal mais cultivado no mundo,
estando atrás apenas do arroz, trigo, milho e cevada, respectivamente (FAO, 2012).

28
Tem sido relatado, na literatura, vários genótipos de sorgo em estudos envolvendo
o estresse salino, como por exemplo, o CSF 20, o qual é moderadamente tolerante
(LACERDA et al., 2003; OLIVEIRA; GOMES-FILHO, 2009) e, portanto, de grande
importância para estudos de fisiologia, visando o esclarecimento dos mecanismos de
tolerância à salinidade em plantas exposta a diferentes fontes de nitrogênio.
4 A DETAILED INVESTIGATION OF NITROGEN SOURCE-REGULATED
SALINITY RESPONSIVE PROTEINS IN SORGHUM LEAVES
(Artigo a ser submetido)
4.1 Abstract
This work aimed to evaluate the modulation of proteome and physiological responses of
sorghum plants [Sorghum bicolor (L.) Moench] under salinity as affected by inorganic
nitrogen (N) sources. Five days after sowing, plants were transferred to complete nutrient
solutions modified to contain 5 mM N, supplied as either NO3- or NH4
+. Seven days after
acclimation in the nutrient solutions, plants were subjected to salt stress with 75 mM NaCl,
which was applied in two doses of 37.5 mM. Plants were harvested ten days after salinity (10
DAS). Salinity promoted significant reductions in leaf area, root and shoot dry mass of
sorghum plants, regardless of the nitrogen source; however, a higher growth was observed in
ammonium-grown plants. The better performance of ammonium-fed stressed plants was
associated with increased CO2 assimilation and higher K+/Na
+ homeostasis under salinity.
Proteomic study revealed that, under salt stress, nitrogen source modulates proteins mainly
related to photosynthesis/carbon metabolism, energetic metabolism, response to stress and
other cellular processes. Nitrate-fed plants induced a series of proteins of thylakoidal electron
transport chain, structural and carbon assimilation enzymes, but these mechanisms seemed to
be not enough to mitigate salt damage in photosynthetic performance. Additionally, plants
from nitrate treatments possibly failed in activating the antioxidant system, once some
enzymes were downregulated under stress, resulting in severe complications in plant
metabolism such as excessive reactive oxygen species generation. In contrast, the greater
tolerance to salinity of ammonium-grown plants may arised from different mechanisms: i.) de
novo synthetis of tilacoidal electron transport chain, structural proteins and upregulation of
enzymes from photosynthetic/carbono metabolism, which resulted in better CO2 assimilation
rates under NaCl-stress; ii.) activation (exclusively or by upregulation) of proteins involved in

29
energetic metabolism which make available energy salt responses, most likely by H+-ATPases
proton pumps and Na+/H
+ antiporters; and iii.) reprogramating of proteins involved in
response to stress and other metabolic processes, constituting intricate pathways of salt
responses. Consequently, the ponctual modulation of proteome in ammonium-fed plants seem
to be more effective to lead a better acclimation to salinity. Overall, our findings not only
provide new insights of molecular basis of salt tolerance in sorghum plants induced by
ammonium nutrition, but also give new perspectives to develop biotechnological strategies to
generate more salt-tolerant crops.
Keywords: Ammonium. Nitrate. Proteomics. Salt stress. Salt tolerance. Sorghum bicolor.
4.2 Introduction
Soil salinization is a significant environmental factor that restricts plant growth,
thus causing serious loss of productivity of cultures around the world, especially in arid and
semiarid regions where land irrigation is widely used. This phenomenon can be caused by
many factors like poor water management, inappropriate drainage systems, weather
conditions, soil features and others. Countries like Australia, India, Pakistan, and the United
States, which face significant salinity and drainage problems that affect between 15 and 36%
of their irrigated lands, are devoting substantial resources toward this problem. Worldwide,
approximately one-third of the irrigated areas that provides 40% of the global food production
is affected by salinization (El-Mageed et al., 2018). This is a worrisome issue, for around 0.3
to 1.5 million of hectares of total arable lands are getting unusable every year (FAO, 2015). In
Northeastern region of Brazil, around 25% of irrigated lands are affected by salinity, which is
equivalent to 9 million hectares of arable soils (Freire et al., 2014). Salt harmful effects on
plant growth and metabolism may arise from two components, the osmotic that causes water
deficit; and the ionic, which is characterized by a severe accumulation of Na+ and Cl
- toxic
ions. Also, salinity may disrupt numerous cellular events, such as enzyme activities,
generation of reactive oxygen species and others. Both aspects can cause growth inhibition as
well as impairment of nutrient uptake, membrane degradation, and cell and tissue death
(Munns and Tester, 2008).
Nitrogen is a crucial macronutrient for plant growth, and its main sources
typically occurring in the soil are nitrate (NO3-) and ammonium (NH4
+). However, when there

30
is low NO3- availability in the soil, ammonium is taken up by plant roots (Zhong et al., 2018).
It has been reported that nitrogen availability can be an efficient approach to generate
acclimation to salinity in plants (Fernández-Crespo et al., 2012; Miranda et al., 2014).
Although NH4+ at high levels becomes toxic to most plants, some species display some
tolerance to this ion, such as rice (Wu et al., 2018), citrus (Fernandez-Crespo et al., 2012) and
sorghum (Miranda et al, 2013; Miranda et al., 2016). Ammonium absorption by plant cells is
more energetically cost-effective than nitrate (Xu et al., 2012), and it has been reported that
salinity can inhibit NO3- uptake through competition with Cl
- ions (Zhonghua et al., 2011). In
addition, NH4+-treated citrus plants had reduced salt-induced oxidative stress by raising
polyamine levels and activating hormone pathways, such as abscisic acid and salicylic acid
(Fernandez-Crespo et al., 2012). In sorghum, NH4+ supply was able to partially overcome the
salt deleterious damages by activating effective mechanisms of defense, including reduced
Na+ accumulation and better photosynthetic performance under salinity (Miranda et al.,
2016). Mrid et al. (2016), studying the effects of nitrogen source and concentration in
sorghum roots, found that at high nitrogen levels, especially ammonium, sorghum roots
showed an increase in biomass accompanied by an increase in protein content, including
some nitrogen metabolism enzymes such as glutamine synthetase and aspartate
aminotransferase, which had their activities raised as well.
Ammonium nutrition has proved to be efficient in alleviating the toxic effects of
salinity in others species. Rajaie and Motieallah (2018), studying the effect of ammonium ion
in lemon seedlings under salt stress, observed that ammonium nutrition not only increased
shoot dry weight even under saline conditions, but also increased shoot contents of
macronutrients (N, P and K) and some micronutrients as well (such as Cu, Fe, Mn, and Zn),
which contributed to alleviate the harmful effects of salinity in this plant. Moreover,
ammonium nutrition has also been stated to atenuate not only salt stress, but also other abiotic
factors like drought and heavy metals. Pereira et al. (2018), analyzing the effects of
ammonium growth in Guzmania monostachia plants under drought stress, reported significant
increases in malic acid and citric acid contents, as well as increases in phosphoenolpyruvate-
carboxylase and malate dehydrogenase enzyme activities, as well as increases in sugar
contents (sucrose, fructose and glucose) and antioxidant enzyme activities (such as superoxide
dismutase, catalase, ascorbate peroxidase) in plants treated with ammonium as a N source.
Cheng et al (2016) reported that ammonium nutrition enhanced root length and surface and
biomass of both species in comparison to the nitrate one under cadmium stress and increased

31
cadmium accumulation in Carpobrotus rossii and Solanum nigrum, two hyperaccumulators.
This proves that ammonium nutrition can also be used to improve strategies like
phytoremediation.
Proteomics approaches have also been used to further understand how plants
adjust to different N sources. For example, the response of whole plant proteome to different
nitrate levels has been studied in maize, Hordeum vulgare, and wheat (Wang et al., 2012).
However, due to the small number of proteins identified from these studies, regulatory
mechanisms of plant nitrogen responses at the protein level remain poorly understood (Wang
et al., 2012). In addition, in sorghum, the alteration of proteomic profile in response to stress
modulated by nitrogen nutrition remains to be elucidated.
Sorghum (Sorghum bicolor L. Moench) is an annual grass species with C4
photosynthetic metabolism. It is a versatile crop with a great adaptability to growth in
stressful environments, being moderately tolerant to abiotic stresses like high temperatures,
salinity, and drought (Venuto and Kindiger, 2008; Meki et al., 2013; Miranda et al., 2016).
Sorghum plants and seeds are widely employed for animal and human food (Yan et al., 2012)
and sugar and ethanol production (Whitfield et al., 2012). This investigative study aimed to
assess the modulation of proteome profile in leaves of sorghum plants affected by salinity as
subjected to two inorganic nitrogen sources, namely nitrate and ammonium.
4.3 Materials and Methods
4.3.1 Plant material and growth conditions
Seeds of Sorghum bicolor L. Moench, CSF 20 genotype supplied from Instituto
Agronômico de Pernambuco (IPA), Recife, PE, Brazil, were surface sterilized in sodium
hypochlorite at 3% (v/v) for 5 min, and then exaustively rinsed with distilled water and
subsequently sown in plastic cups contained vermiculite umedeced with distilled water. After
germination, ten uniform seedlings were transferred to 10 L plastic trays containing one-third
Hoagland’s nutrient solutions modified to contain inorganic nitrogen at 5.0 mM, provided as
either nitrate or ammonium (Miranda et al., 2012). The nutrient solutions were kept under
constant aeration, being renewed every three days. The pH values were daily monitored and
adjusted to 6.0 with 1.0 M HCl or 1.0 M NaOH whenever necessary. After 7 days, sorghum
seedlings were transferred to 3 L plastic containers and submitted to saline treatment with
32
NaCl at 0 mM (control treatment) or 75 mM. This concentration was chosen due to the fact
that it can inhibit growth higher than 50% in sorghum plants (Silva et al., 2003). The final
NaCl concentration was achieved in a daily dose of 37.5 mM NaCl, in order to avoid osmotic
stress. Five plants from control and salt treatments of each nitrogen source were harvested 10
days after salinity (10 DAS). Five plants of each treatment had their leaves stored at -20 ºC
for proteomic analyses and the rest was used for growth parameters, CO2 assimilation and
ions determination.
The experiment was conducted in a greenhouse, and the environmental conditions
were the following: mean air temperature of 32.0 ± 2.0 °C during the day and 27.5 ± 2.0 °C at
night; mean air relative humidity of 65.6 ± 9.2 % and an average midday photosynthetic
photon flux density (PPFD) of approximately 1,300 μmol m-2
s-1
.
4.3.2 CO2 assimilation rate and photosystem II efficiency
Before harvesting, CO2 assimilation and photosystem II efficiency of sorghum
plants was measured in fully expanded leaves using a leaf chamber fluorometer (6400-40, LI-
COR, Lincoln, NE, USA) coupled to a portable photosynthesis system (LI-6400-XT, LI-
COR, Lincoln, NE, USA). Analyses were done under constant CO2 concentration of 380
µmol CO2 mol-1
air and photosynthetic photon flux density of approximatelly 1,200 µmol
photons m-2
s-1
on days with full sun. The parameters measured were CO2 assimilation rate
(A), photosystem II maximum efficiency (Fv/Fm) and effective quantum yield of PSII (
PSII).
4.3.3 Growth parameters
During harvesting, plants were initially separated in roots and shoots and the leaf
area was determined employing an area meter (LI – 3100, Li-Cor, Lincoln, NE, USA). Then,
plant material was divided in two groups: the first one was stored at -20 for protein extraction
and 2-DE analysis; and the latter was dried by lyophilization and the dry mass of shoot and
roots was measured. The material was finely powdered and stored for further analysis.

33
4.3.4 Determination of inorganic ions
Extracts for ion inorganic determination were prepared after incubation of 18 mg
of powdered root and shoot samples in 1.8 mL of deionized water in water bath at 40 ºC for
1.0 h. The homogenate was centrifuged at 3.000 × g for 10 min and the supernatant was
colleted, filtered in filter papers, and then used for determination of K+ and Na
+ using a flame
photometer, according to Malavolta et al. (1989).
4.3.5 Protein extraction
Total soluble protein was extracted from fresh frozen leaves of each treatment
according to Mesquita et al. (2012). Approximately 200 mg of leaf samples were
homogeneized in 10 mL of extraction buffer solution composed by 40 mM Tris-HCL (pH
7.5), 250 mM sucrose, 10 mM EDTA, 1.0 mM PMSF, 1.0 mM DTT, 1% Triton-X 100 (v/v),
2% 2-mercaptoethanol (v/v) and 200 mg of PVPP. The homogenate was kept under constant
agitation for 1.0 h at 4 ºC, being vortexed every 15 min. Thereafter, the material was
centrifuged at 6.000 × g for 15 min, at 4 ºC. The supernatant was collected and submitted to
precipitation with 10 mL of 10% (w/v) TCA in cold acetone for 12 h at -20 ºC. Then, the
homogenate was centrifuged at 6.000 × g for 10 min at 4 ºC, the supernatants were discarded,
and the pellets were submitted to several washes with cold acetone and finally with 80%
ethanol (v/v). The resulting pellet was vacuum dried and dissolved in 400 uL lysis buffer (7
M urea, 2 M thiourea, 2% CHAPS(w/v), 2% IPG buffer 4-7 (v/v) and 1% DTT (w/v)) and
kept in constant agitation for 1.0 h. Finally, the suspension was centrifuged at 12.000 × g for
10 min, at 25 ºC, and the supernatant was collected and used as proteic extract for
bidimensional electroforesis (2-DE) assays. Protein concentrations were determined according
to Bradford (1976) using bovine serum albumin (Sigma-Aldrich, USA) as standard.
4.3.6 SDS-PAGE
Protein samples were submitted to electrophoresis under non-reducing conditions
on 12.5% polyacrylamide gels (SDS-PAGE) according to the method described by Laemmli
(1970), in order to verify protein integrity. A 0.1% coomasie brilliant blue R-250 (w/v) was

34
used to stain protein bands for at least 2 h (Neuhoff et al., 1988). After dying, a solution of
7% acetic acid (v/v) and 40% methanol (v/v) was used for gel discoloration.
4.3.7 Bidimensional electrophoresis (2-DE) and image analysis
Proteic extracts were diluted with rehydration buffer containing 7 M urea, 2 M
thiourea, 2% CHAPS (w/v), 2% IPG buffer (pH 4–7) (v/v), 0.3% DTT (w/v) and 0.002%
bromophenol blue (w/v) (GE Healthcare: Life sciences, USA). Approximately 500 g of
protein was loaded onto a 13-cm, pH 4–7 linear gradient IPG strip (GE Healthcare, USA).
Isoelectric focusing (IEF) was conducted in an Ettan™ IPGPhor™ (GE Healthcare) according
to the manufacturer’s instructions. Briefly, focusing was performed at 20 ºC with the
following steps: 200 V during 1 h; 500 V until 500 Vhr; gradient at 1,000 V until 800 Vhr,
gradient at 8,000 V until 11,300 V; 8,000 V during 0.5 h; and finally, 500 V during 2 h.
After IEF, the strips with proteins were submitted to denaturation with an initial
equilibration buffer [75 mM Tris–HCl (pH 8.8), 6 M urea, 29.3% glycerol (v/v), 2% SDS
(w/v), 0.002% bromophenol blue (w/v) and 1% DTT (w/v)] for 30 min; and then alkylated by
a second equilibration buffer with 2.5 % iodoacetamide (w/v) instead of DTT for 30 min in
the dark, at room temperature. The second dimension of electrophoresis was performed on
12.5% polyacrylamide gels (w/v) using a SE 600 Ruby electrophoresis unit (GE-Healthcare).
The system was powered by an EPS 3501 XL power supply (GE-Healthcare). Alkylated strips
were placed on the top of SDS-PAGE gels and then sealed with 0.5% molten agarose solution
(v/v) (containing 0.002% v/v bromophenol blue). Electrophoresis was run at 10 mA per gel
for one hour and followed by 40 mA per gel until the bromophenol tracking dye ran off the
gel. After SDS-PAGE, gels were fixed overnight with a solution of 10% acetic acid (v/v) and
40% ethanol (v/v). Then, gels were stained for at least 48 h with 0.1% colloidal coomasie blue
G-250. Finally, gels were kept in conservation solutions of 5% (v/v) acetic acid until further
analyses.
2-DE gels were scanned at 300 dpi using a gel densitometer DS-6000 (Loccus,
Cotia, SP, Brazil). Image analysis was conducted by ImageMaster 2D Platinum software
(version 7.05, GE Life Sciences) through LabScan v. 5.0 program (GE-Healthcare), according
to manufacturer’s instructions. At least three gels from each treatment (nitrate control; nitrate
salt; ammonium control; and ammonium salt) were used for the analysis. Background
subtraction, landmark identification, matching of spots within gels, quantification of matched

35
spots and spot analysis were performed according to the software guide. Before spots
matching, one of the gel images was chosen as reference gel. Quantitative image analysis was
performed to display protein spots with reproductible differences in relative abundance
intensity % (1.5-fold and p value < 0.05). Experimental molecular weight (MW) of each
protein was deducted using 2-DE markers (LMW Calibration Kit for SDS Electrophoresis,
GE-Healthcare, UK), and the experimental isoelectrical point was determined by the
migration of the markers on the IPG strip.
5.3.8 In-gel digestion
Selected protein spots with reproductible differences in relative abundance
intensity % (1.5-fold and p value < 0.05) were manually excised from the gel and digested
with sequencing-grade trypsin as described by Shevchenko et al. (2006). Briefly, gel pieces
(around 1 mm²) were destained by washing three times with 25 mM ammonium bicarbonate
in 50% acetonitrile (ACN) (v/v), pH 8.8. The microtubes with the spots were vortexed every
wash, but after the second one, gel pieces were kept in contact with the destaining buffer
overnight. After the third wash, gel pieces were dehydrated twice with 100% ACN for five
min. At the end of this process, ACN was removed and the gel pieces were dried out in a
vacuum concentrator machine (SpeedVac Concentrator, Eppendorf). Gel pieces were
rehydrated again, for 45 min at 4 ºC with a 40 mM ammonium bicarbonate and 10% ACN
containing 20 ngL-1
trypsin (Sequencing Grade Modified Trypsin, Promega). Protein
digestion was conducted at 37ºC for 16 h, with a dry bath Peltier system (Thermomixer,
Bioer). Digested peptides were extracted from the gel pieces using 5% fomic acid (v/v) in 50
% (v/v) ACN in three repetitive steps with an ultrasonicator (UltraCleaner 1400A, Unique,
SP, Brazil). Samples were transferred to sterilized microtubes, vacuum-concentrated
(SpeedVac Concentrator, Eppendorf) and used for protein identification by mass spectrometry
analysis.
4.3.9 Mass spectrometry analysis
Extracted tryptic fragments were analyzed by capillary liquid
chromatografy/nanoelectrospray ionization tandem mass spectrometry (LC-ESI-MS/MS)
using a Q-ToF mass spectrometer (Waters Corporation, Milford, MA, USA) coupled with a

36
Water Nano high-performance liquid chromatography (UPLC) unit. Product ion spectra
collected were processed by Protein Lynx Global Server 2.0 software (Waters Corporation,
MA, USA), being converted to peak-list text files for database searching.
4.3.10 Protein identification
Peptides identification was performed with peptide mass fingerprinting (PMF)
and MS/MS data obtained from ESI-Q-TOF via MASCOT Daemon (Matrix Science; www.
matrixscience.com/search_form_select.html). The National Center for Biotechnology
Information (NCBI) non-redundant and the SwisProt (www.uniprot.org) databases were
utilized under the taxon Viridiplantae (Green Plants). All peptides were hypothesized to be
monoisotopic and [MH]+ (protonated molecular ions). Other searched parameters were: a
mass accuracy of 1.2 Da, complete carbamidomethylation of cysteine residues and partial
oxidation of methionine residues.
To identify a protein by LC–ESI–MS/MS, these criteria were adopted: a minimum
of three independent matching peptides, significant protein scores given by MASCOT (p <
0.05), and a minimum of 2% coverage of protein by matching peptides. The peptides were
also researched for identification by allignment against UniProt/Monocots database
(http://www.uniprot.org/?tab=blast) and also the NCBI/Reference protein/ Monocots
database, (http://blast.st-va.ncbi.nlm.nih.gov/Blast.cgi), with p < 0.05 and max identity =
100%.
4.3.11 Experimental design and statystical analysis
Experimental design was completely randomized design in a 2 × 2 factorial,
composed by two nitrogen sources (NO3- and NH4
+) and two salt treatments (0 and 75 mM
NaCl). Thus, 4 distinct plant groups were formed: a) NH4+-fed plants without NaCl (NH4
+
control treatment - AC); b) NH4+-fed plants in presence of 75 mM NaCl (NH4
+ salt treatment
- AS); c) NO3--treated plants without NaCl (NO3
- control treatment - NC); and d) NO3
--treated
plants in presence of 75 mM NaCl (NO3- salt treatment - NS). For growth, CO2 assimilation,
photosystem II effciency and ion accumulation, the experiments were performed using five
repetitions, being each repetition composed by one plant. The data were submitted to a two-
way analysis of variance (two-way ANOVA) and, when significative at p < 0.05 level, the
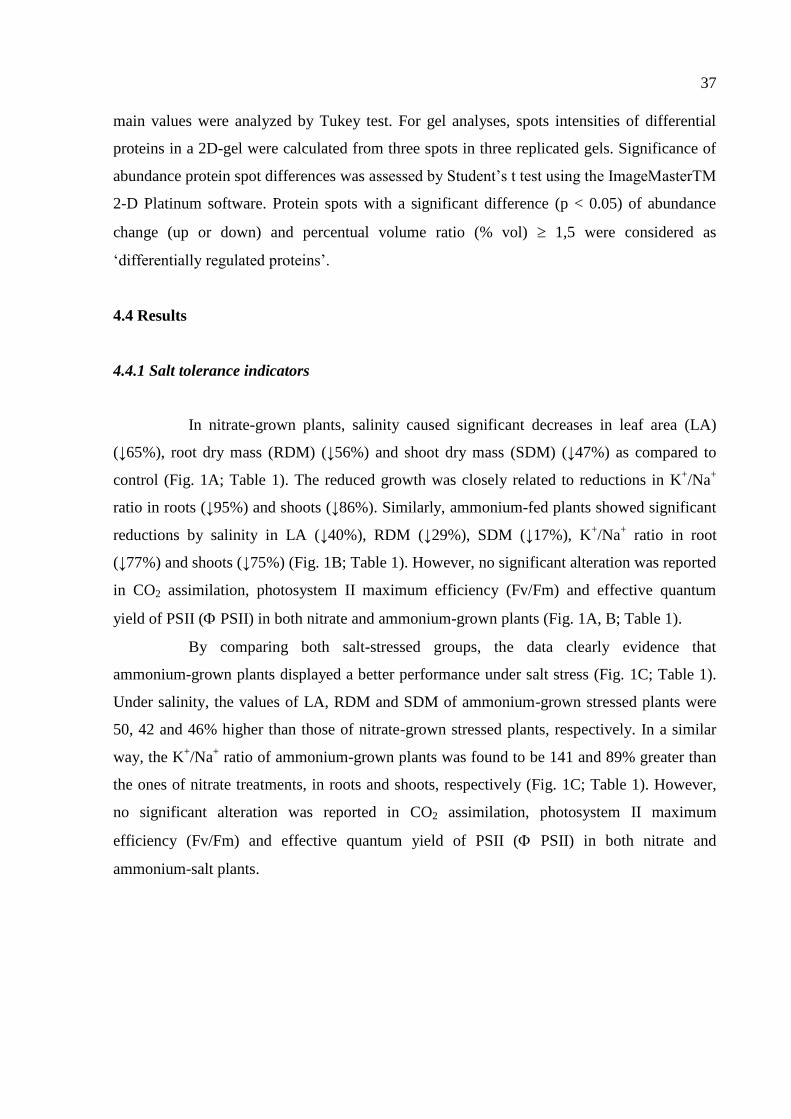
37
main values were analyzed by Tukey test. For gel analyses, spots intensities of differential
proteins in a 2D-gel were calculated from three spots in three replicated gels. Significance of
abundance protein spot differences was assessed by Student’s t test using the ImageMasterTM
2-D Platinum software. Protein spots with a significant difference (p < 0.05) of abundance
change (up or down) and percentual volume ratio (% vol) 1,5 were considered as
‘differentially regulated proteins’.
4.4 Results
4.4.1 Salt tolerance indicators
In nitrate-grown plants, salinity caused significant decreases in leaf area (LA)
(↓65%), root dry mass (RDM) (↓56%) and shoot dry mass (SDM) (↓47%) as compared to
control (Fig. 1A; Table 1). The reduced growth was closely related to reductions in K+/Na
+
ratio in roots (↓95%) and shoots (↓86%). Similarly, ammonium-fed plants showed significant
reductions by salinity in LA (↓40%), RDM (↓29%), SDM (↓17%), K+/Na
+ ratio in root
(↓77%) and shoots (↓75%) (Fig. 1B; Table 1). However, no significant alteration was reported
in CO2 assimilation, photosystem II maximum efficiency (Fv/Fm) and effective quantum
yield of PSII ( PSII) in both nitrate and ammonium-grown plants (Fig. 1A, B; Table 1).
By comparing both salt-stressed groups, the data clearly evidence that
ammonium-grown plants displayed a better performance under salt stress (Fig. 1C; Table 1).
Under salinity, the values of LA, RDM and SDM of ammonium-grown stressed plants were
50, 42 and 46% higher than those of nitrate-grown stressed plants, respectively. In a similar
way, the K+/Na
+ ratio of ammonium-grown plants was found to be 141 and 89% greater than
the ones of nitrate treatments, in roots and shoots, respectively (Fig. 1C; Table 1). However,
no significant alteration was reported in CO2 assimilation, photosystem II maximum
efficiency (Fv/Fm) and effective quantum yield of PSII ( PSII) in both nitrate and
ammonium-salt plants.

38
Figure 1. Overall characterization of sorghum physiological responses to NaCl stress (red line). Comparison
between nitrate-grown sorghum plants without (NC) and under (NS) 75 mM-NaCl stress (A); ammonium-grown
plants without (AC) and under (AS) 75 mM-NaCl stress (B), and nitrate (NS) and ammonium-grown plants (AS)
under 75 mM-NaCl stress (C). In (C), NS is the blue line and was taken as reference, while the orange line
represents AS plants. Leaf area (LA), root dry mass (RDM), shoot dry mass (SDM), root K+/Na
+ ratio, shoot
K+/Na
+ ratio, effective quantum yield of photosystem II ( PSII), photosystem II maximum efficiency (Fv/Fm)
and CO2 assimilation (A) of ammonium-grown plants. Values of control plants were normalized and taken as
reference (control treatment, green line).
Table 1. Comparison between nitrate-grown sorghum plants without (NC) and under (NS) 75
mM-NaCl stress; ammonium-grown plants without (AC) and under (AS) 75 mM-NaCl stress,
and nitrate (NS) and ammonium-grown plants (AS) under 75 mM-NaCl stress (NS x AS).
Shoot dry mass (SDM; g plant-1
), root dry mass (RDM; g plant-1
), leaf area (LA; cm²), net
photosynthesis (A; mol CO2 m-2
s-1
), maximum quantum efficiency of PSII (Fv/Fm),
effective quantum yield of PSII (PSII), shoot K+/Na
+ ratio and root K
+/Na
+ ratio in roots and
shoots.
Variable NC x NS AC x AS NS x AS
NC NS AC AS NS AS
SDM 1.353 a 0.713 b 1.250 a 1.039 b 0.713 b 1.039 a
RDM 0.344 a 0.152 b 0.302 a 0.216 b 0.152 b 0.216 a
LA 227.676 a 80.180 b 199.890 a 120.548 b 80.180 b 120.548 a
A 39.279 a 36.693 a 35.109 a 39.431 b 36.693 a 39.431 b
Fv/Fm 0.762 a 0.756 a 0.755 a 0.772 a 0.756 a 0.772 a
PSII 0.352 a 0.375 a 0.344 a 0.350 a 0.375 a 0.350 a
Shoot K+/Na
+ 12.350 a 1.693 b 12.897 a 3.197 b 1.693 b 3.197 a
Root K+/Na
+ 7.890 a 0.382 b 4.023 a 0.921 b 0.382 b 0.921 a
Note: Data are means of five repetitions. Different lowercase letters indicate significant differences due to salt
stress to each comparison (NC x NS, AC x AS or NS x AS) according to Tukey’s test (p 0.05).
(A) (C) (B)

39
4.4.2 2D electrophoresis profile, protein identification and level of regulation of proteome
To detect the modulation of proteome of sorghum leaves, 2-DE patterns from
control and salt treatments from both nitrogen sources were analyzed. Regulation of
proteomic profile by salt stress in nitrate-grown plants is shown in Fig. 2. In general, 256
proteins were detected in leaves of nitrate-grown plants, of which 67 were characterized as
differentially modulated in response to salinity (Fig. 3; Table 2). A total of 28 proteins was
upregulated and 23 downregulated by salt stress, whereas six proteins were repressed under
NaCl stress and 10 were found to be de novo synthesis (Fig. 3; Table 3). In this treatment,
after identification (Table 2), the proteins differentially regulated were related to
photosynthesis/carbon metabolism (52%), energetic metabolism (21%), response to stresses
(9%), antioxidative system (5%), and other cellular processes (13%) (Fig. 4).
Figure 2. Coomasie brilliant blue G 250-stained two-dimensional gels from leaves of nitrate-fed sorghum plants
in control conditions (A) and in salt stress with 75 mM NaCl (B). Proteins (500 g) were separated in 13 cm IPG
strips (linear 4-7 pH) in isoelectrical focusing and in SDS-PAGE on 12.5% polyacrylamide gels. Differentially
modulated protein spots (intensity % 1.5-fold) are numbered. Spots marked with yellow circles indicate those
ones present in the control treatment that underwent differential protein expression in relation to the salt
treatment. Spots marked with blue and red circles represent proteins that were significantly upregulated (blue) or
downregulated (red); spots with green circles in control plants indicates proteins whose expression was
suppressed by salinity, whereas green circles in the salt gel point out that those spots suffered de novo synthesis
under stress. Spots identified are statistically significant to a level of 95% per group (Student’s t-test) using
biological and analytical replicates (n = 3).

40
Figure 3. Venn diagram representation of different subsets of nitrate-fed Sorghum bicolor L. Moench cv. CSF
20 leaves, displaying their changes in control conditions (NC) and under salt-stress with 75 mM NaCl (NS).

41
Table 2 – List of differentially regulated proteins in leaves of nitrate-grown sorghum plants under salt stress (75 mM NaCl). Differential spots were excised from
2DE gels, comparison NC × NS (see Fig. 3), and the proteins were identified by LC–ESI–MS/MS.
Spot Protein
(Species)
Access number
(NCBI/SwissProt)
Peptide sequences
(MS/MS)
Sequence
coverage
(%)
Score
Biological process
(localization)
pI/MM
(kDa)
Theoretical
pI/MM (kDa)
Experimental
9 Cytochrome b6-f complex
iron-sulfur subunit [Zea
mays]
ACG28186.1 GDPTYLVVEQDK
GPAPLSLALVHADVDDGK VLFVPWVETDFR
18 275
Photosynthesis; electron
transporter, transferring
electrons within
cytochrome b6/f complex
of photosystem II activity
(Chloroplast)
8.52
24
5.65
13
11 Superoxide dismutase [Cu-
Zn] C0HK70.1 AVAVLGSSEGVK 7 71
Cellular response to
oxidative stress
(Cytosol)
5.48
15
6.05
19
13
Ribulose-1,5-bisphosphate
carboxylase/oxygenase
large subunit, partial [Zea
mays]
ANP22077.1 VTPKLGVPPEEAGAAVAAESSTGTWTTVWT- DGLTSLDR
24 87
Carbon fixation
(Chloroplast)
5.17
17
5.20
20
14 FHA domain containing
protein [Sorghum bicolor]
XP_002442729.1
WILDPAGDGDWR
VARPGAIEIISDDAVTVGR
VADKADIVLPIATVSGTHAR KGGSLLVTDLDSTNGTYINER
31 449
Regulation of
developmental growth;
stamen filament
development
mRNA binding
(Nucleus)
8.31
25
4.46
20
15
PEPcase - C4
phosphoenolpyruvate
carboxylase [Saccharum
officinarum]
CAC08829.1 VSEELIQYDALLVDR
FLDILQDLHGPSLR HGDFSDEGSATTESDIEETLKR
5 400 Carbon Fixation
(Cytosol)
5.94
109
5.09
23

42
18
Light-harvesting complex I
chlorophyll a-b binding
protein 1B-21 [Triticum
urartu]
EMS45291.1 DFGFDPLGLATVPENFER
KYPGGAFDPLGFSK 15 103
Photosynthesis, light
harvesting
(Chloroplast)
4.93
22
5.37
23
23 Oxygen-evolving enhancer
protein 2 [Sorghum bicolor] XP_002461438.1
TNTEYIAYNGDGFK
KTITEYGSPEEFLSQVDFLLGK
QAFGGSTDSEGGFETGAVATANVLESSTPVV-DGK
QYYSVSVLTR
TADGDEGGKHQLITATVSDGK
HQLITATVSDGK
38 466
Photosynthesis; light
reaction;
calcium ion binding
(Chloroplast)
8.63
28
6.24
24
31 L-ascorbate peroxidase 2
[Sorghum bicolor] XP_002463451.1
LAWHSAGTFDVATK
NPAEQAHGANAGLEIAVR LPDATQGSDHLR
QVFSTQMGLSDQDIVALSGGHTLGR
SGFEGAWTSNPLIFDNSYFTELLSGEK EGLLQLPSDK
ALLSDPSFRPLVDK
48 600
Cellular response to
oxidative stress
(Cytosol)
5.18
27
5.17
26
38 Soluble inorganic
pyrophosphatase 6
[Sorghum bicolor]
XP_002452886.1
AQGQPETLDYR
KVSPWHDVPLR AGDGVFHFVVEIPK
MEVATDEAFTPIK
VKPLAALAMIDEGELDWK
ASLVNDVDDVEKHFPGTLTAIR
VIEETNESWEK
38 696
Phosphate-containing
compound metabolic
process; response to salt
stress
(Chloroplast)
5.78
32
4.73
29
40 Plastid-lipid-associated
protein 6 [Sorghum bicolor] XP_002449783.1
LLSAVSGLNR
GLAASQEDLDRADAAAR
LLPVTLGQVFQR GSLAQLPPLEVPR
VPDNLRPPSSSSNAGSGEGEFEVTYLDDDTR
32 525
Chloroplast organization.
Resistance to multiple
stresses
(Chloroplast)
8.84
31
4.64
29
41 Oxygen-evolving enhancer
protein 1 [Sorghum bicolor] XP_021305066.1
RLTYDQIQSLTYMEVK GTGTANQCPTIDGGVEAFPFK
KLCLEPTSFTVK
LTYTLDEIEGPLEVGSDGTLKFEEK
FEEKDGIDYAAVTVQLPGGER
DGIDYAAVTVQLPGGER
QLVATGKPESFGGPFLVPSYR GGSTGYDNAVALPAGGR
GDEEELLKENIK
NAAASTGNITLSVTK SNPETGEVIGVFESVQPSDTDLGAK
54 1071
Photosystem II assembly
and stabilization
(Chloroplast)
5.91
35
4.89
29

43
48 Glyoxylase 1 [Saccharum
hybrid cultivar] AHF18211.1
AETPEPLCQVMLR YTIAMLGYADEDK
GNAYAQVAIGTNDVYK
IASFVDPDGWK VVLVDNTDFLR
21 380
Detoxification of
methylglyoxal; Response
to abiotic stresses
(Cytosol)
5.44
33
5.31
35
50 Fructose-bisphosphate
aldolase [Sorghum bicolor] XP_002442893.1
LASIGLENTEANR
IVDILVEQGIVPGIK YAAISQDNGLVPIVEPEILLDGEHGIER
VTAAQDALLLR
17 319
Glycolytic process;
Reduction (Calvin cycle)
(Chloroplast)
6.39
42
5.65
38
55 Ribulose bisphosphate
carboxylase/oxygenase
activase [Sorghum bicolor]
XP_002451328.1
VPLILGIWGGK
MSCLFINDLDAGAGR
VPIIVTGNDFSTLYAPLIR TDGVDEEHVVQLVDTFPGQSIDFFGALR
YLNEAALGAANEDAMK
20 382 Rubisco activation
(Chloroplast)
6.97
49
6.26
40
57
Ribulose 1,5-bisphosphate
carboxylase/oxygenase
activase precursor [Zea
mays]
AAG22094.3
VPLILGIWGGK MSCLFINDLDAGAGR
VPIIVTGNDFSTLYAPLIR
TDGVDEEHVVQLVDTFPGQSIDFFGALR
23 378 Rubisco activation
(Chloroplast)
6.43
34
5.96
39
61 ATP synthase beta subunit
[Radula tasmanica] AHZ11983.1
TVLIMELINNIAK VALVYGQMNEPPGAR
MVQAGSEVSALLGR
21 223 ATP biosynthesis
(Chloroplast)
5.77
21
5.22
42
64
Glyceraldehyde-3-
phosphate dehydrogenase 1
[Sorghum bicolor] XP_021305022.1
VALQSEDVELVAVNDPFITTDYMTYMFK
TLLFGQKPVTVFGIR NPEEIPWGEAGADYVVESTGVFTDK
KVVISAPSK
DAPMFVVGVNEDKYTSDINIVSNASCTTNCL-APLAK
VIHDNFGIIEGLMTTVHAITATQK
VPTVDVSVVDLTVR
GIMGYVEEDLVSTDFVGDSR
LVSWYDNEWGYSNR
55 906 Glycolytic process
(Cytosol)
7.05
36
6.70
42
68
Ribulose 1,5-bisphosphate
carboxylase/oxygenase
activase precursor [Zea
mays]
AAG22094.3 VPLILGIWGGK
VPIIVTGNDFSTLYAPLIR TDGVDEEHVVQLVDTFPGQSIDFFGALR
19 225 Rubisco activation
(Chloroplast)
6.43
34
5.36
44

44
72 Phosphoglycerate kinase
[Sorghum bicolor] XP_002441313.1
SVGDLTEADLEGK ADLNVPLDENQNITDDTR
LSELLGIQVQK
LVDALPIGGVLLLENVR LASLADLYVNDAFGTAHR
ELDYLVGAVSSPK
RPFAAIVGGSK IGVIESLLEK
GVSLLLPTDVVIADK
VGVADVMSHISTGGGASLELLEGK
34 1037
Reductive pentose-
phosphate cycle
(Chloroplast)
5.89
50
4.87
46
78 S-adenosylmethionine
synthase OS [Dendrobium
crumenatum]
METK_DENCR TQVTVEYR
FVIGGPHGDAGLTGR 5 90
S-adenosylmethionine
biosynthetic process
(Cytosol)
5.42
44
5.70
53
86 ATP synthase CF1 beta
subunit [Sorghum bicolor] YP_899414.1
TNPTTSRPGVSTIEEK IDQIIGPVLDITFPPGK
LPYIYNALIVK
DTADKQINVTCEVQQLLGNNR QINVTCEVQQLLGNNR
AVAMSATDGLMR
GMEVIDTGTPLSVPVGGATLGR IFNVLGEPIDNLGPVDTSATFPIHR
SAPAFIELDTK
TVLIMELINNIAK AHGGVSVFGGVGER
TREGNDLYMEMK
VALVYGQMNEPPGAR VGLTALTMAEYFR
DVNKQDVLLFIDNIFR
FVQAGSEVSALLGR MPSAVGYQPTLSTEMGSLQER
KGSITSIQAVYVPADDLTDPAPATTFAHLDA-
TTVLSR GIYPAVDPLDSTSTMLQPR
IVGNEHYETAQR
YKELQDIIAILGLDELSEEDR
68 2288
ATP synthesis coupled
proton transport
(Chloroplast)
5.31
54
5.22
61
91 Rubisco large subunit-
binding protein subunit
alpha [Sorghum bicolor]
XP_002440887.1
LANAVGVTLGPR NVVLDEYGSPK
AIELYDPMENAGAALIR TNDSAGDGTTTASVLAR
LGLLSVTSGANPVSLK
TVQGLIQELENK AVLQDIAIVTGAEFLAK
DLGLLVENATEAQLGTAR
VTIHQTTTTLIADAASKDEIQAR ELAETDSVYDTEK
VGAATETELEDR
34 953 Protein refolding
(Chloroplast)
5.07
61
4.74
67

45
IKDSVWEVGYNAMTDTYENLIEAGVIDPAK
95 Phosphoglucomutase 1 [Zea
mays] PGMC1_MAIZE
YNMGNGGPAPESVTDK
SMPTSAALDVVAK FFEVPTGWK
YDYENVDAGAAK
DSQDALAPLVDVALK
11 177
Glucose metabolic
process
(Cytosol)
5.46
63
5.38
77
108 Photosystem II
stability/assembly factor
HCF136 [Sorghum bicolor]
XP_021318830.1 LETSRPENSGLSAALDLLTEAK
GGPISFADLIQFAAQSALK
TDYEVDLITTLTK
15 214
Cellular response to
oxidative stress
(Chloroplast)
8.43
38
5.73
27
109
Ribulose-1,5-bisphosphate
carboxylase/oxygenase
large subunit [Nasturtium
officinale]
ALF41107.1 VTPQPGDPPEEAGAAVAAESSTGTWTTVWT-
DGLTSLDR
TFQGPPHGIQVER
30 167
Reductive pentose-
phosphate cycle;
photorespiration
(Chloroplast)
5.75
19
5.64
21
110 Luminal-binding protein
[Saccharum hybrid cultivar
R570]
AGT15890.1
ITPSWVAFTDSER
VFSPEEISAMILGK DAGVIAGLNVAR
IINEPTAAAIAYGLDK
VEIESLFDGTDFSEPLTR FEELNNDLFR
SQIHEIVLVGGSTR
14 518
Endoplasmic reticulum
protein complex
assembly
( Endoplasmic reticulum)
5.14
73
5.24
74
115 Fructose-bisphosphate
aldolase [Sorghum bicolor] XP_002450383.1
GILAMDESNATCGK
RLDSIGLENTEANR IVDVLNEQGIVPGIK
GLVPLAGSNNESWCQGLDGLASR
EAAYYQAGAR
YAAISQENGLVPIVEPEILLDGEHGIER
ATPEQVAEYTLK
AAQDALLLR
32 730
Glycolytic process;
Reduction (Calvin cycle)
(Chloroplast)
5.85
42
5.34
69
117 Heat shock 70 kDa protein 6
[Zea mays] ONM07984.1
VVGIDLGTTNSAVAAMEGGKPTIVTNAEGAR
QFAAEEISAQVLR
AVITVPAYFNDSQR IINEPTAASLAYGFEK
NDEGIDLLKDK
AKFEELCSDLLDR DIDEVILVGGSTR
16 611 Protein folding
(Chloroplast)
5.14
73
4.78
75

46
119 Ribulose-1,5-bisphosphate
carboxylase/oxygenase
large subunit [Zea mays]
RBL_MAIZE
LTYYTPEYETK DTDILAAFR
VTPQLGVPPEEAGAAVAAESSTGTWTTVWT-
DGLTSLDR TFQGPPHGIQVER
GGLDFTKDDENVNSQPFMR
DDENVNSQPFMR FVFCAEAIYK
GHYLNATAGTCEEMIKR
24 394
Reductive pentose-
phosphate cycle;
photorespiration
(Chloroplast)
6.33
53
6.50
37
120 V-type proton ATPase
catalytic subunit A
[Sorghum bicolor]
XP_002451639.1
LAADTPLLTGQR
TTLVANTSNMPVAAR DMGYNVSMMADSTSR
EDDLNEIVQLVGK
NIIHFNTLANQAVER FEDPAEGEEALVAK
13 457
ATP hydrolysis coupled
proton transport
(Vacuole)
5.37
69
5.44
73
121 Sedoheptulose-1,7-
bisphosphatase [Triticum
aestivum]
S17P_WHEAT
LLICMGEAMR
LLFEALEYSHVCK
LTGVTGGDQVAAAMGIYGPR DCPGTHEFLLLDEGK
MFSPGNLR
YTGGMVPDVNQIIVK GIFTNVTSPTAK
FEETLYGSSR
26 355
Reductive pentose-
phosphate cycle
(Chloroplast)
6.04
42
5.15
39
132 ATP synthase CF1 beta
subunit [Saccharum hybrid
cultivar]
YP_024386.1
RTNPTTSRPGVSTIEEK
IDQIIGPVLDITFPPGK
QINVTCEVQQLLGNNR
AVAMSATDGLMR
GMEVIDTGTPLSVPVGGATLGR IFNVLGEPIDNLGPVDTSATFPIHR
TVLIMELINNIAK
AHGGVSVFGGVGER VALVYGQMNEPPGAR
VGLTALTMAEYFR DVNKQDVLLFIDNIFR
FVQAGSEVSALLGR
MPSAVGYQPTLSTEMGSLQER KGSITSIQAVYVPADDLTDPAPATTFAHLDA-
TTVLSR
GIYPAVDPLDSTSTMLQPR
IVGNEHYETAQR
YKELQDIIAILGLDELSEEDR
61 1704
ATP synthesis coupled
proton transport
(Chloroplast)
5.31
54
5.53
56
135 Probable NADP-dependent
malic enzyme [Gossypium
arboreum]
KHG05054.1 LLNDEFYIGLR 2 70
Pyruvate and malate
metabolic process
(Cytosol)
5.92
59
5.64
63

47
139 Glutamine synthetase [Zea
mays] GLNAC_MAIZE
LEQLLNMDTTPYTDK TISKPVEDPSELPK
AILNLSLR
HDLHISAYGEGNER
12 162
Glutamine biosynthetic
process
(Chloroplast)
6.42
46
5.45
76
140 Phosphoenolpyruvate
carboxylase 3 [Sorghum
bicolor]
XP_002438521.2
HLLATGFSEISEDAVFTK
IEEFLEPLELCYK AIADGSLLDLLR
HTDVIDAITTHLGIGSYR
RPLLPPDLPMTEEIADVIGAMR
8 351
Photosynthesis; carbon
fixation
(Cytosol)
6.12
116
5.40
47
142 ATP-dependent zinc
metalloprotease FTSH 2
[Sorghum bicolor]
XP_021304746.1
KVDLFENGTIAIVEAISPELGNR
AQGGLGGPNGPGFPLGFGQSR FQMEPNTGVTFDDVAGVDEAK
AKENAPCIVFVDEIDAVGR
QVSVDVPDVR TPGFSGADLANLLNEAAILAGR
IVAGMEGTVMTDGK
AAEEVIFGEPEVTTGAAGDLQQITGLAK QLSDEAYEIALR
ETLTGDEFR
AILSEFVEIPVENR
28 895 Protein catabolic process
(Chloroplast)
5.68
72
5.27
72
153 Triosephosphate isomerase
[Sorghum bicolor] XP_002462733.1
IEVSAQNVWIGK LIACIGELLEER
VATPEQAQEVHAAVR TNVSPEVASSTR
IIYGGSVNAANCAELAK
KEDIDGFLVGGASLK APDFATIVNSVTAK
31 663
Reductive pentose-
phosphate cycle
(Chloroplast)
6.45
33
4.95
26
161 Phosphoglycerate kinase
[Sorghum bicolor] XP_002441313.1
LVDALPIGGVLLLENVR
LASLADLYVNDAFGTAHR ELDYLVGAVSSPK
IGVIESLLEK
GVTTIIGGGDSVAAVEK
15 330
Reductive pentose-
phosphate cycle
(Chloroplast)
5.89
50
4.90
40
164 Probable Glutamine
synthetase [Lactuca sativa] GLNA_LACSA DTNWPLGWPLGGFPGPQGPYYCGIGADK 7 40
Glutamine biosynthetic
process
(Chloroplast)
5.24
40
5.33
46
170 ATP synthase CF1 beta
subunit [Triticum turgidum] ASI07736.1
SAPAFIELDTK
VGLTALTMAEYFR DVNKQDVLLFIDNIFR
8 197
ATP synthesis coupled
proton transport
(Chloroplast)
4.99
54
6.94
62

48
176 Chaperone protein ClpC1,
OS=Oryza sativa subsp.
japonica
CLPC1_ORYSJ VLESLGADPNNIR
VPEPTVDETIQILR AIDLIDEAGSR
4 153 Protein metabolic process
(Chloroplast)
6.14
101
5.73
83
182
Photosynthetic NDH
subunit of lumenal location
5, chloroplastic [Sorghum
bicolor]
XP_002439092.1
VYFDISIGNPVGK IVIGLYGDDVPQTAENFR
VISDFMIQGGDFDK
HVVFGQVLEGMDIVK
35 427
NAD(P)H dehydrogenase
complex assembly;
protein folding
(Chloroplast)
9.26
26
6.94
21
184
Putative C4
phosphoenolpyruvate
carboxylase [Saccharum
officinarum]
CAC08829.1 VSEELIQYDALLVDR
HGDFSDEGSATTESDIEETLKR 3 166
Carbon fixation
(Chloroplast)
5.94
109
5.18
23
185 28 kDa ribonucleoprotein
[Sorghum bicolor] XP_002461966.1
LAQLFEQAGVVEVAEVIYNR
GFGFVTMSTVEEADKAVEMLHR GFGFVTMATQDELDDAIAALDGQSLDGR
23 221 mRNA processing
(Chloroplast)
4.60
32
4.94
23
188 Triosephosphate isomerase
[Sorghum bicolor] XP_002462733.1
IEVSAQNVWIGK LIACIGELLEER
APDFATIVNSVTAK
12 220
Reductive pentose-
phosphate cycle
(Chloroplast)
6.45
33
4.90
27
189 ATP synthase CF1 beta
subunit [Licania
membranacea]
YP_009265111.1 FVQAGSEVSALLGR
YKELQDIIAILGLDELSEEDR
FLSQPFFVAEVFTGSPGRYVGLAETIR
12 297
ATP synthesis coupled
proton transport
(Chloroplast)
5.16
54
4.84
28
190 Glyceraldehyde 3-phosphate
dehydrogenase, partial
[Salvia officinalis]
AIZ00507.1 VPTVDVSVVDLTVR 6 99
Reductive pentose-
phosphate cycle
(Chloroplast)
6.67
21
6.65
30
191 Soluble inorganic
pyrophosphatase 6
[Sorghum bicolor]
XP_002452886.1 AQGQPETLDYR
VIEETNESWEK 7 137
Phosphate-containing
compound metabolic
process; response to salt
stress
(Chloroplast)
5.78
32
4.79
31

49
194 Ferredoxin--NADP
reductase, leaf isozyme
[Glycine soja]
KHN01599.1 LYSIASSAIGDFGDSK 4 92
Photosynthetic electron
transport chain
(Chloroplast)
8.04
41
6.54
35
206 Peptidyl-prolyl cis-trans
isomerase [Sorghum
bicolor]
XP_002444271.1
LAVGLEELQR IVLDGYNAPVTAGNFIDLVER
FYDGMEIQR
TVPLEIMVDGDKAPVYGETLEELGR APVYGETLEELGR
ESELTPSNANILDGR
19 441 Cell differentiation
(Chloroplast)
4.74
46
4.50
42
208 Glycerate dehydrogenase
[Sorghum bicolor] KXG29243.1
TILSVDDILALIGDR
NGIAVGNTPGVLTETTAELAASLTLSAAR GQTVGVIGAGR
MNLIYYDLYQATR
EADVISLHPVLDK TTYHLINPER
EGMATLTALNVLGK
27 485
Oxidative photosynthetic
carbon pathway
(Peroxisome)
6.04
42
6.59
42
209 Ribulose bisphosphate
carboxylase/oxygenase
activase [Sorghum bicolor]
XP_002451328.1
GLAYDVSDDQQDITR
VPLILGIWGGK MGIIPIMMSAGELESGNAGEPAK
MSCLFINDLDAGAGR
VPIIVTGNDFSTLYAPLIR TDGVDEEHVVQLVDTFPGQSIDFFGALR
YLNEAALGAANEDAMK
28 550 Rubisco activation
(Chloroplast)
6.97
49
5.37
43
213 NADP-dependent malic
enzyme [Sorghum bicolor] XP_002455030.1
NVQVICVTDGER
LLNDEFYIGLR
AVFASGSPFAPVEYDGK VHEDMLLAASAALADQATEENFVTGSIFPPF-
TNIR
11 285
Pyruvate and malate
metabolic process
(Chloroplast)
6.23
70
5.74
46
215 Elongation factor Tu
[Sorghum bicolor] XP_002452390.1
TKPHVNIGTIGHVDHGK
TTLTAALTMVLASVGGSAPK
KYDEIDAAPEER GITINTATVEYETETR
HYAHVDCPGHADYVK
NMITGAAQMDGAILVVSGADGPMPQTK
KDMVDDEELLELVELEVR
ALEALMANPALK
QTDLPFLLAVEDVFSITGR VGDTVDIVGIR
TMDDAMAGDNVGLLLR
39 1208 Protein synthesis
(Chloroplast)
6.07
51
5.40
47
217 Putative ADP-glucose
pyrophosphorylase small
subunit [Sorghum bicolor]
ABK97538.1
SSQTCLDPDASTSVLGIILGGGAGTR
IYVLTQFNSASLNR AMMVDTTILGLDDVR
KPVPDFSFYDR
SCISEGAIIEDTLLMGADYYETEADKK ILNADNVQEAAR
20 491
Starch biosynthetic
process
(Chloroplast)
6.65
57
5.42
49
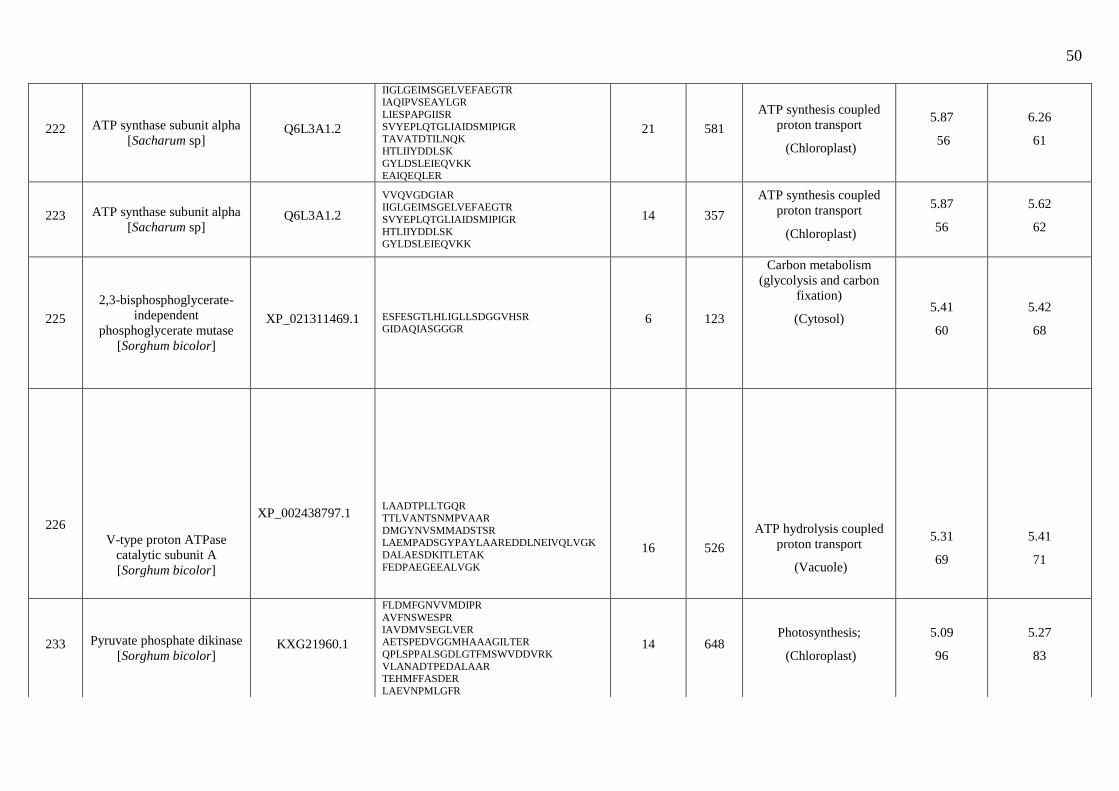
50
222 ATP synthase subunit alpha
[Sacharum sp] Q6L3A1.2
IIGLGEIMSGELVEFAEGTR IAQIPVSEAYLGR
LIESPAPGIISR
SVYEPLQTGLIAIDSMIPIGR TAVATDTILNQK
HTLIIYDDLSK
GYLDSLEIEQVKK EAIQEQLER
21 581
ATP synthesis coupled
proton transport
(Chloroplast)
5.87
56
6.26
61
223 ATP synthase subunit alpha
[Sacharum sp] Q6L3A1.2
VVQVGDGIAR IIGLGEIMSGELVEFAEGTR
SVYEPLQTGLIAIDSMIPIGR
HTLIIYDDLSK
GYLDSLEIEQVKK
14 357
ATP synthesis coupled
proton transport
(Chloroplast)
5.87
56
5.62
62
225
2,3-bisphosphoglycerate-
independent
phosphoglycerate mutase
[Sorghum bicolor]
XP_021311469.1 ESFESGTLHLIGLLSDGGVHSR GIDAQIASGGGR
6 123
Carbon metabolism
(glycolysis and carbon
fixation)
(Cytosol)
5.41
60
5.42
68
226
V-type proton ATPase
catalytic subunit A
[Sorghum bicolor]
XP_002438797.1
LAADTPLLTGQR
TTLVANTSNMPVAAR
DMGYNVSMMADSTSR LAEMPADSGYPAYLAAREDDLNEIVQLVGK
DALAESDKITLETAK
FEDPAEGEEALVGK
16
526
ATP hydrolysis coupled
proton transport
(Vacuole)
5.31
69
5.41
71
233 Pyruvate phosphate dikinase
[Sorghum bicolor] KXG21960.1
FLDMFGNVVMDIPR
AVFNSWESPR
IAVDMVSEGLVER AETSPEDVGGMHAAAGILTER
QPLSPPALSGDLGTFMSWVDDVRK
VLANADTPEDALAAR TEHMFFASDER
LAEVNPMLGFR
14 648 Photosynthesis;
(Chloroplast)
5.09
96
5.27
83

51
IGTMIEIPR
234 Oxygen-evolving enhancer
protein 2 [Dichanthelium
oligosanthes]
OEL30643.1 TADGDEGGKHQLITATVSDGK
HQLITATVSDGK 8 136
Photosynthesis; light
reaction.
(Chloroplast)
8.61
27
5.44
25
237 Chaperone protein ClpC1
[Zea mays] AQK40544.1
VIGQDEAVVAISR
NTLLIMTSNVGSSVIEK IGFDLDSDEKDSSYSR
AKDINLQVTEK
EGDSAIVDVDSEGK
18 364
Chloroplast organization;
regulation of chlorophyll
biosynthetic process
(Chloroplast)
5.15
43
5.13
59
238
Ribulose-1,5-bisphosphate
carboxylase/oxygenase
large subunit, partial [Zea
mays]
ANP22077.1
VTPKLGVPPEEAGAAVAAESSTGTWTTVW-
TDGLTSLDR
TFQGPPHGIQVER
33 172 Carbon fixation
(Chloroplast)
5.17
17
5.21
18
239
Ribulose-1,5-bisphosphate
carboxylase/oxygenase
large subunit, partial [Zea
mays]
ANP22077.1
VTPKLGVPPEEAGAAVAAESSTGTWTTVW-
TDGLTSLDR
TFQGPPHGIQVER
33 163 Carbon fixation
(Chloroplast)
5.17
17
5.26
21
240
Ribulose-1,5-bisphosphate
carboxylase/oxygenase
large subunit, partial [Zea
mays]
ANP22077.1
VTPKLGVPPEEAGAAVAAESSTGTWTTVWT-
DGLTSLDR
TFQGPPHGIQVER
24
59
Carbon fixation
(Chloroplast)
5.17
17
5.19
29
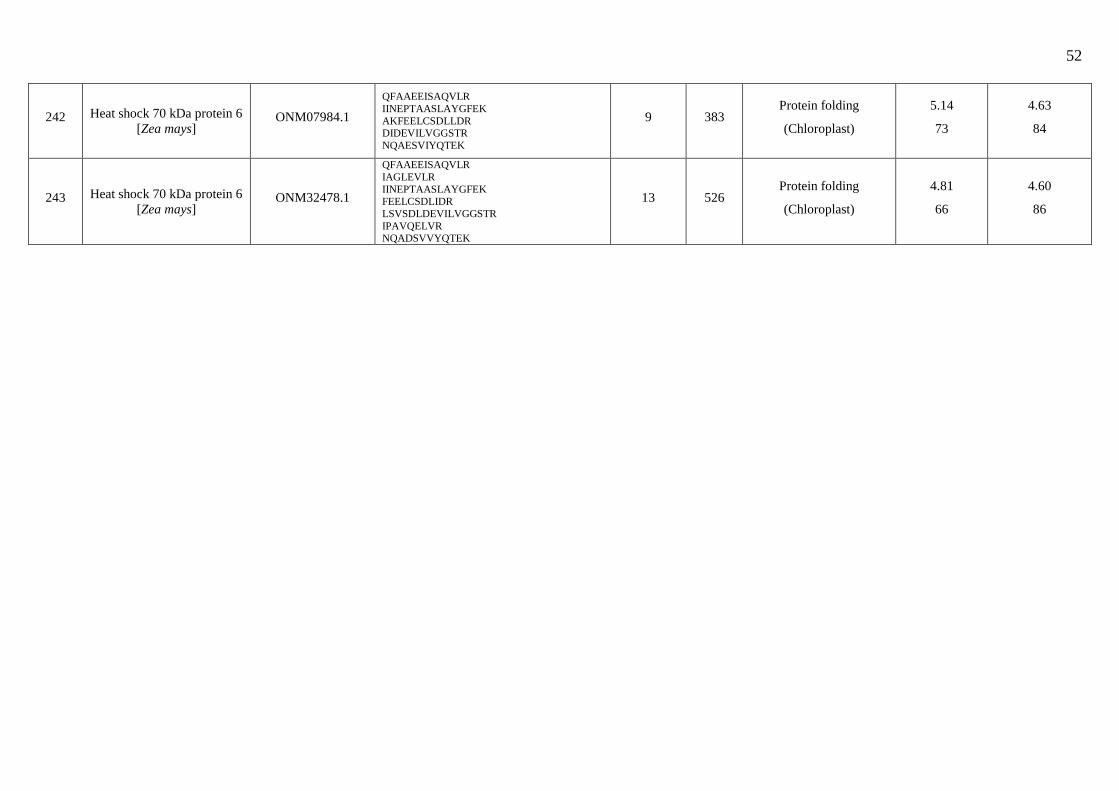
52
242 Heat shock 70 kDa protein 6
[Zea mays] ONM07984.1
QFAAEEISAQVLR
IINEPTAASLAYGFEK
AKFEELCSDLLDR DIDEVILVGGSTR
NQAESVIYQTEK
9 383 Protein folding
(Chloroplast)
5.14
73
4.63
84
243 Heat shock 70 kDa protein 6
[Zea mays] ONM32478.1
QFAAEEISAQVLR
IAGLEVLR
IINEPTAASLAYGFEK FEELCSDLIDR
LSVSDLDEVILVGGSTR
IPAVQELVR
NQADSVVYQTEK
13 526 Protein folding
(Chloroplast)
4.81
66
4.60
86

53
Figure 4. Functional characterization of all differential spots identified in leaves of nitrate-grown sorghum plants, after 10 days in
control conditions (NC) and salt stress with 75 mM-NaCl (NS). Five categories were created according to the results.
Herein, table 2 lists all differentially regulated proteins identified in leaves of nitrate-grown plants
and table 3 shows the level of variation as affected by salt treatment. Interestingly, in photosynthetic/carbon
metabolism of nitrate-grown plants, two rubisco large subunits were upregulated by salinity, two showed
downregulation and three of them were suppressed by stress. Also, three proteins of phosphoenolpyruvate
carboxylase (PEPCase) were de novo synthesized in response to salt stress. In energetic metabolism, whereas
the ATP synthase CF1 beta subunit was reduced by salinity, the alpha subunit displayed an increase; and V-
type proton ATPase catalytic subunits were upregulated (Table 3).
In response to stress, glycerate dehydrogenase and chloroplastic chaperone protein ClpC1 had de
novo synthesis, while plastid-lipid-associated protein 6 and S- adenosylmethionine synthase were inhibited
under salinity (Table 3). Additionally, the antioxidant enzymes cytosolic superoxide dismutase (cSOD) and
glyoxylase 1 were downregulated by salt stress, while cytosolic ascorbate peroxidase 2 (cAPX2) was
upregulated. In terms of other processes, two chloroplastic heat shock 70 kDa protein 6 were suppressed under
salinity, whereas chloroplastic elongation factor Tu was de novo synthesized in response to the stress.
52%
5%
21%
9%
13%
NC × NS
Photosynthesis/Carbon metabolism
Antioxidants
Energetic metabolism
Response to stress
Other cellular processes
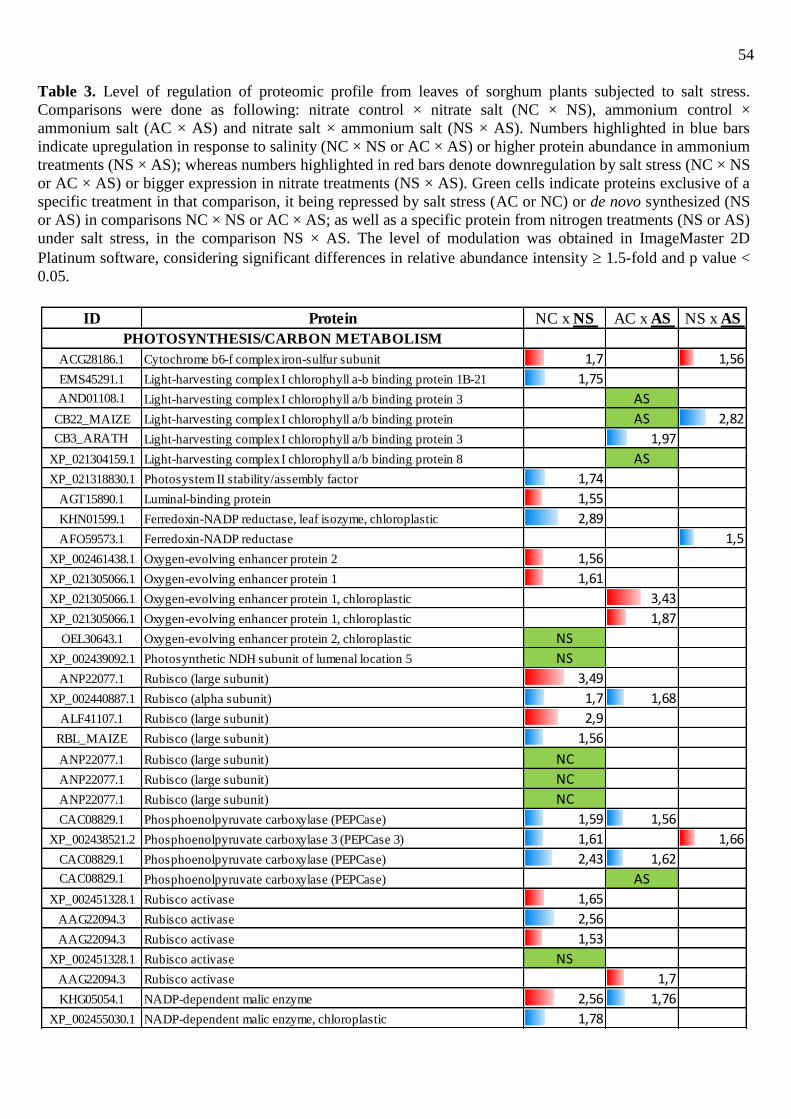
54
Table 3. Level of regulation of proteomic profile from leaves of sorghum plants subjected to salt stress.
Comparisons were done as following: nitrate control × nitrate salt (NC × NS), ammonium control ×
ammonium salt (AC × AS) and nitrate salt × ammonium salt (NS × AS). Numbers highlighted in blue bars
indicate upregulation in response to salinity (NC × NS or AC × AS) or higher protein abundance in ammonium
treatments (NS × AS); whereas numbers highlighted in red bars denote downregulation by salt stress (NC × NS
or AC × AS) or bigger expression in nitrate treatments (NS × AS). Green cells indicate proteins exclusive of a
specific treatment in that comparison, it being repressed by salt stress (AC or NC) or de novo synthesized (NS
or AS) in comparisons NC × NS or AC × AS; as well as a specific protein from nitrogen treatments (NS or AS)
under salt stress, in the comparison NS × AS. The level of modulation was obtained in ImageMaster 2D
Platinum software, considering significant differences in relative abundance intensity 1.5-fold and p value <
0.05.
ID Protein NC x NS AC x AS NS x AS
ACG28186.1 Cytochrome b6-f complex iron-sulfur subunit 1,7 1,56
EMS45291.1 Light-harvesting complex I chlorophyll a-b binding protein 1B-21 1,75
AND01108.1 Light-harvesting complex I chlorophyll a/b binding protein 3 AS
CB22_MAIZE Light-harvesting complex I chlorophyll a/b binding protein AS 2,82
CB3_ARATH Light-harvesting complex I chlorophyll a/b binding protein 3 1,97
XP_021304159.1 Light-harvesting complex I chlorophyll a/b binding protein 8 AS
XP_021318830.1 Photosystem II stability/assembly factor 1,74
AGT15890.1 Luminal-binding protein 1,55
KHN01599.1 Ferredoxin-NADP reductase, leaf isozyme, chloroplastic 2,89
AFO59573.1 Ferredoxin-NADP reductase 1,5
XP_002461438.1 Oxygen-evolving enhancer protein 2 1,56
XP_021305066.1 Oxygen-evolving enhancer protein 1 1,61
XP_021305066.1 Oxygen-evolving enhancer protein 1, chloroplastic 3,43
XP_021305066.1 Oxygen-evolving enhancer protein 1, chloroplastic 1,87
OEL30643.1 Oxygen-evolving enhancer protein 2, chloroplastic NS
XP_002439092.1 Photosynthetic NDH subunit of lumenal location 5 NS
ANP22077.1 Rubisco (large subunit) 3,49
XP_002440887.1 Rubisco (alpha subunit) 1,7 1,68
ALF41107.1 Rubisco (large subunit) 2,9
RBL_MAIZE Rubisco (large subunit) 1,56
ANP22077.1 Rubisco (large subunit) NC
ANP22077.1 Rubisco (large subunit) NC
ANP22077.1 Rubisco (large subunit) NC
CAC08829.1 Phosphoenolpyruvate carboxylase (PEPCase) 1,59 1,56
XP_002438521.2 Phosphoenolpyruvate carboxylase 3 (PEPCase 3) 1,61 1,66
CAC08829.1 Phosphoenolpyruvate carboxylase (PEPCase) 2,43 1,62
CAC08829.1 Phosphoenolpyruvate carboxylase (PEPCase) AS
XP_002451328.1 Rubisco activase 1,65
AAG22094.3 Rubisco activase 2,56
AAG22094.3 Rubisco activase 1,53
XP_002451328.1 Rubisco activase NS
AAG22094.3 Rubisco activase 1,7
KHG05054.1 NADP-dependent malic enzyme 2,56 1,76
XP_002455030.1 NADP-dependent malic enzyme, chloroplastic 1,78
PHOTOSYNTHESIS/CARBON METABOLISM

55
XP_021312698.1 Carbonic anhydrase, chloroplastic isoform X1 1,76
XP_002442893.1 Fructose-bisphosphate aldolase 2,03
XP_002450383.1 Fructose-bisphosphate aldolase 1,59
XP_002441313.1 Phosphoglycerate kinase, chloroplastic 1,91 1,5
XP_002441313.1 Phosphoglycerate kinase, chloroplastic 1,72 1,51
XP_002441313.1 Phosphoglycerate kinase, chloroplastic 1,81
S17P_WHEAT Sedoheptulose-1,7-bisphosphatase 1,66 3,46
XP_002462733.1 Triosephosphate isomerase, chloroplastic 1,84 2,04
XP_002462733.1 Triosephosphate isomerase, chloroplastic 2,52 5,58
ABK97538.1 ADP-glucose pyrophosphorylase small subunit NS
XP_021311469.1 2,3-bisphosphoglycerate-independent phosphoglycerate mutase NS
XP_021304041.1 Pyruvate phosphate dikinase 1 1,5
KXG21960.1 Pyruvate phosphate dikinase NS 2,06
XP_021313843.1 Phosphoribulokinase, chloroplastic 1,78
XP_002463921.1 Glucose-1-phosphate adenylyltransferase large subunit AS
C0HK70.1 Superoxide dismutase cytosolic 1,52
XP_002463451.1 APX2 - Ascorbate peroxidase 2 2,25
AHF18211.1 Glyoxylase 1 1,65
XP_002445671.1 Superoxide dismutase [Cu-Zn], chloroplastic AC
AHZ11983.1 ATP synthase beta subunit 3,16
YP_899414.1 ATP synthase CF1 beta subunit, chloroplast 1,5
YP_024386.1 ATP synthase CF1 beta subunit, chloroplast 2,09
ASI07736.1 ATP synthase CF1 beta subunit, chloroplast 1,63
YP_009265111.1 ATP synthase CF1 beta subunit, chloroplast 2,08
YP_899414.1 ATP synthase CF1 beta subunit, chloroplast 3,68
Q6L3A1.2 ATP synthase subunit alpha, chloroplastic 2,16 4,22
Q6L3A1.2 ATP synthase subunit alpha, chloroplastic 2,19
ATPA_MAIZE ATP synthase subunit alpha, chloroplastic 2,16 3,38
Q6L3A1.2 ATP synthase subunit alpha, chloroplastic 2,25 1,98
ATPA_MAIZE ATP synthase subunit alpha, chloroplastic 1,54
NP_043022.1 ATP synthase CF1 alpha subunit chloroplast AS 3,52
YP_054628.1 ATP synthase CF1 alpha subunit chloroplast 1,92
Q6L3A1.2 F-ATP synthase subunit alpha, chloroplastic AS
Q6L3A1.2 F-ATP synthase subunit alpha, chloroplastic 5,77 AS
Q6L3A1.2 F-ATP synthase subunit alpha, chloroplastic 2,75 AS
Q6L3A1.2 F-ATP synthase subunit alpha, chloroplastic AS 1,61
Q6L3A1.2 F-ATP synthase subunit alpha, chloroplastic AS 1,6
Q6L3A1.2 F-ATP synthase subunit alpha, chloroplastic AS
CAB99314.1 F0-F1 ATPase alpha subunit, mitochondrial 1,86 1,51
ATPM_MAIZE ATP synthase subunit alpha, mitochondrial 2,46
XP_021308049.1 ATP synthase subunit gamma, chloroplastic AS
XP_002451639.1 V-type proton ATPase catalytic subunit A 1,5
XP_002438797.1 V-type proton ATPase catalytic subunit A 1,55
XP_002452886.1 Soluble inorganic pyrophosphatase 6 1,84
XP_002452886.1 Soluble inorganic pyrophosphatase 6, chloroplastic 1,65 1,52
XP_021305022.1 Glyceraldehyde-3-phosphate dehydrogenase 1 1,52
AIZ00507.1 Glyceraldehyde 3-phosphate dehydrogenase NS
XP_021318665.1 Glyceraldehyde-3-phosphate dehydrogenase A 1,64
PGMC1_MAIZE Phosphoglucomutase 1 1,69
XP_002437265.1 Fructose-bisphosphate aldolase 5, cytosolic 4,27
CAA37531.1 Malate dehydrogenase NADP+ 5,14
ANTIOXIDANTS
ENERGETIC METABOLISM

56
2-DE gels from leaves of ammonium–grown plants revealed a total of 318 protein spots, of
which 53 showed differential expressions in response to salt stress (Fig. 5). Under salinity, 25 proteins/peptides
were upregulated, 10 showed downregulation; four were repressed and 14 were de novo synthesized (Fig. 6). In
this treatment, after identification (Table 4), the proteins differentially regulated were related to
photosynthesis/carbon metabolism representing 42% of all spots; energetic metabolism, 28%; response to
stresses, 13%; antioxidative action 2%; and other cellular processes 15% (Fig. 7).
In general, several important proteins of photosynthetic/carbon metabolism were differentially
regulated by salt stress, including structural proteins, enzymes of CO2 assimilation and other metabolic
pathways (Tables 3 and 4). Also, a large number of proteins involved in energetic metabolism and response to
stress (for instance, chloroplastic ATP synthase alpha subunits, glycerate dehydrogenase, cysteine synthase,
cytosolic NADP+-dependent isocitrate dehydrogenase, among others) were upregulated or de novo synthesized
in ammonium-grown plants exposed to NaCl stress.
XP_002449783.1 Plastid-lipid-associated protein 6 1,97 1,59
METK_DENCR S-adenosylmethionine synthase 2,1 1,79
XP_021304746.1 ATP-dependent zinc metalloprotease FTSH 2 1,66
CLPC1_ORYSJ Chaperone protein ClpC1, chloroplastic NS AS
AQK40544.1 Chaperone protein ClpC1 chloroplastic NC AC
KXG29243.1 Glycerate dehydrogenase NS 2,43
XP_021301730.1 Cysteine synthase AS
XP_021302102.1 Polyamine oxidase-like 2,65
XP_021304577.1 Aldehyde dehydrogenase mitochondrial 1,54
XP_002443073.2 beta-D-glucosidase 2, chloroplastic 2,09
XP_002465329.1 Ricin B-like lectin R40C1 1,62
XP_021312414.1 Cytosolic isocitrate dehydrogenase [NADP]-like AS AS
XP_002442729.1 FHA domain containing protein 1,62
ONM07984.1 Heat shock 70 kDa protein 6 1,56
ONM07984.1 Heat shock 70 kDa protein 6 chloroplastic NC AC
ONM32478.1 Heat shock 70 kDa protein 6 chloroplastic NC AC
GLNAC_MAIZE Glutamine synthetase 2,6
GLNA_LACSA Glutamine synthetase 1,59
XP_002461966.1 28 kDa ribonucleoprotein, 1,53
XP_002444271.1 Peptidyl-prolyl cis-trans isomerase, chloroplastic 1,5 1,62
XP_002452390.1 Elongation factor Tu, chloroplastic NS 1,85
XP_002448238.1 Elongation factor G-2, chloroplastic 2,82 1,5
XP_021301657.1 5-methyltetrahydropteroyltriglutamate-homocysteine methyltransferase 1 1,62
XP_021301657.1 5-methyltetrahydropteroyltriglutamate-homocysteine methyltransferase 1 1,52
XP_002467242.1 GDP-mannose 3,5-epimerase 1 1,82
XP_002459396.1 Uncharacterized protein 1,62
RESPONSE TO STRESS
OTHER

57
Surprisingly, in antioxidant activity, the chloroplastic superoxide dismutase (chlSOD) was repressed by
salinity in ammonium-supplied plants (Fig. 5 and Table 3).
Figure 5. Coomasie Brilliant Blue G 250-stained two-dimensional gels of leaves of ammonium-fed sorghum plants in control
conditions (A) and in salt stress with 75 mM NaCl (B). Spots marked with blue and red circles represent proteins that were
significantly upregulated (blue) or downregulated (red); Spots with green circles in control plants indicates proteins whose expression
was suppressed by salinity, whereas green circles in the salt gel point out that those spots suffered de novo synthesis under stress.
Spots identified are statistically significant to a level of 95% per group (Student’s t-test) using biological and analytical replicates (n =
3).
Figure 6. Venn diagram representation of different subsets of ammonium-fed Sorghum bicolor L. Moench cv. CSF 20 leaves,
displaying their changes in control conditions (AC) and under salt-stress with 75 mM NaCl (AS).
On the other hand, in other processes, numerous proteins presented differential regulation under
salt stress, including transcription factors, heat shock proteins and others (Fig. 5 and Table 3). For all cases,
table 4 lists all proteins identified in leaves of ammonium-fed plants and table 3 shows the level of modulation

58
as affected by salt treatment.

59
Table 4 – List of differentially regulated proteins in leaves of ammonium-grown sorghum plants under salt stress (75 mM NaCl). Differential spots were excised
from 2DE gels, comparison AC × AS (see Fig. 6), and the proteins were identified by LC–ESI–MS/MS.
Spot Protein
(Species)
Access number
(NCBI/SwissProt)
Peptide sequences
(MS/MS)
Sequence
coverage
(%)
Score Biological process
(localization)
pI/MM
(kDa)
Theoretical
pI/MM (kDa)
Experimental
28
PEPcase - C4
phosphoenolpyruvate
carboxylase [Saccharum
officinarum]
CAC08829.1 VSEELIQYDALLVDR
FLDILQDLHGPSLR
HGDFSDEGSATTESDIEETLKR
5 400 Carbon fixation
(Cytosol)
5.94
109
5.20
23
56 Plastid-lipid-associated
protein 6 [Sorghum bicolor] XP_002449783.1
LLSAVSGLNR
GLAASQEDLDRADAAAR
LLPVTLGQVFQR GSLAQLPPLEVPR
VPDNLRPPSSSSNAGSGEGEFEVTYLDDDTR
32 525 Chloroplast organization
(Chloroplast)
8.84
31
4.78
32
162 Phosphoglycerate kinase
[Sorghum bicolor] XP_002441313.1
SVGDLTEADLEGK ADLNVPLDENQNITDDTR
LSELLGIQVQK
LVDALPIGGVLLLENVR LASLADLYVNDAFGTAHR
ELDYLVGAVSSPK
RPFAAIVGGSK IGVIESLLEK
GVSLLLPTDVVIADK
VGVADVMSHISTGGGASLELLEGK
34 1037
Reductive pentose phosphate
pathway
(Chloroplast)
5.89
50
4.93
47
149 S-adenosylmethionine
synthase [Dendrobium
crumenatum]
METK_DENCR TQVTVEYR
FVIGGPHGDAGLTGR 5 90
Carbon fixation
(Cytosol)
5.42
44
5.80
51
123 Rubisco large subunit-
binding protein subunit
alpha [Sorghum bicolor]
XP_002440887.1
LANAVGVTLGPR
NVVLDEYGSPK AIELYDPMENAGAALIR
TNDSAGDGTTTASVLAR
LGLLSVTSGANPVSLK TVQGLIQELENK
AVLQDIAIVTGAEFLAK DLGLLVENATEAQLGTAR
VTIHQTTTTLIADAASKDEIQAR
ELAETDSVYDTEK VGAATETELEDR
34 953 Chloroplast organization
(Chloroplast)
5.07
61
4.77
69

60
IKDSVWEVGYNAMTDTYENLIEAGVIDPAK
302 Probable NADP-dependent
malic enzyme [Gossypium
arboreum]
KHG05054.1 LLNDEFYIGLR 2 70
Reductive pentose phosphate
pathway
(Chloroplast)
5.92
59.
5.71
57
159 Triosephosphate isomerase
[Sorghum bicolor] XP_002462733.1
IEVSAQNVWIGK
LIACIGELLEER
VATPEQAQEVHAAVR TNVSPEVASSTR
IIYGGSVNAANCAELAK
KEDIDGFLVGGASLK APDFATIVNSVTAK
31 663
Reductive pentose-
phosphate cycle
(Chloroplast)
6.45
33
5.05
26
84 Phosphoglycerate kinase
[Sorghum bicolor] XP_002441313.1
LVDALPIGGVLLLENVR
LASLADLYVNDAFGTAHR ELDYLVGAVSSPK
IGVIESLLEK
GVTTIIGGGDSVAAVEK
15 330
Reductive pentose phosphate
pathway
(Chloroplast)
5.89
50
4.88
41
312 Chaperone protein ClpC1
[Oryza sativa subsp.
Japonica]
CLPC1_ORYSJ VLESLGADPNNIR
VPEPTVDETIQILR
AIDLIDEAGSR
4 153 Protein metabolic process
(Chloroplast)
6.14
101
5.60
85
191
Putative C4
phosphoenolpyruvate
carboxylase [Saccharum
officinarum]
CAC08829.1 VSEELIQYDALLVDR
HGDFSDEGSATTESDIEETLKR 3 166
Carbon fixation
(Cytosol)
5.94
109
5.12
23
224 Triosephosphate isomerase
[Sorghum bicolor] XP_002462733.1
IEVSAQNVWIGK
LIACIGELLEER APDFATIVNSVTAK
12 220
Reductive pentose-
phosphate cycle
(Chloroplast)
6.45
33
4.89
26

61
95 Peptidyl-prolyl cis-trans
isomerase [Sorghum
bicolor]
XP_002444271.1
LAVGLEELQR
IVLDGYNAPVTAGNFIDLVER
FYDGMEIQR TVPLEIMVDGDKAPVYGETLEELGR
APVYGETLEELGR
ESELTPSNANILDGR
19 441
Cell differentiation;
Chaperone-mediated protein
folding
(Chloroplast)
4.74
46
4.46
44
92 Glycerate dehydrogenase
[Sorghum bicolor] KXG29243.1
TILSVDDILALIGDR
NGIAVGNTPGVLTETTAELAASLTLSAAR GQTVGVIGAGR
MNLIYYDLYQATR
EADVISLHPVLDK
TTYHLINPER
EGMATLTALNVLGK
27 485
Oxidative photosynthetic
carbon pathway
(Peroxisome)
6.04
42
6.61
42
305 ATP synthase subunit alpha
[Sacharum sp] Q6L3A1.2
IIGLGEIMSGELVEFAEGTR IAQIPVSEAYLGR
LIESPAPGIISR
SVYEPLQTGLIAIDSMIPIGR TAVATDTILNQK
HTLIIYDDLSK
GYLDSLEIEQVKK EAIQEQLER
21 581
ATP synthesis coupled
proton transport
(Chloroplast)
5.87
56
6.10
65
153 Pyruvate phosphate dikinase
[Sorghum bicolor] KXG21960.1
FLDMFGNVVMDIPR
AVFNSWESPR
IAVDMVSEGLVER
AETSPEDVGGMHAAAGILTER
QPLSPPALSGDLGTFMSWVDDVRK
VLANADTPEDALAAR TEHMFFASDER
LAEVNPMLGFR
IGTMIEIPR
14 648 Photosynthesis
(Chloroplast)
5.09
96
5.19
89
49 ATP synthase subunit alpha
[Saccharum sp] Q6L3A1.2
IIGLGEIMSGELVEFAEGTR
IAQIPVSEAYLGR
VINALAKPIDGR LIESPAPGIISR
SVYEPLQTGLIAIDSMIPIGR
TAVATDTILNQK HTLIIYDDLSK
19 531
ATP synthesis coupled
proton transport
(Chloroplast)
5.87
56
5.42
28
62 Uncharacterized protein
[Sorghum bicolor] XP_002459396.1
VLATSAVFGEEIWPAK
VDGDGDLTEKEIIR IEAGLSALEEALK
KSEEFEPLLK
NYDESFINENAINAIK
19 406 6.01
38
4.94
34

62
90 Phosphoribulokinase
[Sorghum bicolor] XP_021313843.1
GGNPDSNTLISDTTTVICLDDYHSLDR
DGQAVEKPIYNHVTGLLDPPELITPPK
KPDFDAYIDPQK FFNPVYLFDEGSSISWVPCGR
FAYGPDTYFGK
HADFPGSNNGTGLFQTIIGLK
28 423
Reductive pentose-
phosphate cycle
(Chloroplast)
6.09
46
4.96
41
136
5-
methyltetrahydropteroyltrigl
utamate--homocysteine
methyltransferase 1
[Sorghum bicolor]
XP_021301657.1
FALESFWDGK YIPSNTFSYYDQVLDTTAMLGAVPER
ALGVDTVPVLIGPVSYLLLSKPAK
TLTSLSGVTAYGFDLVR GTQTLGLVTSAGFPAGK
YLFAGVVDGR
LVVSTSCSLMHTAVDLVNETK
GMLTGPVTILNWSFVR VIQIDEAALR
IPSTEEIADR
21
770
Homocysteine metabolic
process;
Response to salt stress
(Cytosol)
5.61
84
5.84
83
138 Elongation factor G-2
[Sorghum bicolor] XP_002448238.1 EDIPVAVTGDIVALAGLK
VEVITPEEHLGDVIGDLNSR 4 141
Protein synthesis
(Chloroplast)
5.42
85
5.05
86
161 Pyruvate phosphate dikinase
1 [Sorghum bicolor] XP_021304041.1
FLDMFGNVVMDIPR
AVFNSWESPR
SINQITGLVGTAVNVQSMVFGNMGNTSGT-
GVLFTR
IAVDMVSEGLVER VIATGLPASPGAAVGQIVFTAEDAEAWHA-
QGK
AETSPEDVGGMHAAAGILTER TVAIGDHVLSEGEWLSLNGSTGEVILGK
VLANADTPEDALAAR
ELCAETGANEEEALER LAEVNPMLGFR
LGISYPELTEMQAR
IGTMIEIPR
24 1116 Photosynthesis
(Chloroplast)
5.54
103
5.21
94

63
VGLDYVSCSPFR
176
5-
methyltetrahydropteroyltrigl
utamate-homocysteine
methyltransferase 1
[Sorghum bicolor]
XP_021301657.1
YIPSNTFSYYDQVLDTTAMLGAVPER
GTQTLGLVTSAGFPAGK YLFAGVVDGR
LVVSTSCSLMHTAVDLVNETK
ELNLPVLPTTTIGSFPQTVELR
GMLTGPVTILNWSFVR
VIQIDEAALR
YGAGIGPGVYDIHSPR
18 635
Homocysteine metabolic
process;
Response to salt stress
(Cytosol)
5.61
84
5.76
83
190 ATP synthase subunit alpha
[Zea mays]
ATPA_MAIZE
VGIENIGR VVQVGDGIAR
LIESPAPGIISR
5
125
ATP synthesis coupled
proton transport
(Chloroplast)
5.87
56
5.61
34
195 ATP synthase subunit alpha
[Zea mays] ATPAM_MAIZE
VVSVGDGIAR
VVDALGVPIDGK
TAIAIDTILNQK NILSTINPELLK
9 160
ATP synthesis coupled
proton transport
(Mitochondrion)
5.85
55
5.92
62
200 F0-F1 ATPase alpha
subunit, partial [Sorghum
bicolor]
CAB99314.1 VVSVGDGIAR
VVDALGVPIDGK TAIAIDTILNQK
7 190
ATP synthesis coupled
proton transport
(Mitochondrion)
5.96
48
5.96
66
228
Ribulose 1,5-bisphosphate
carboxylase/oxygenase
activase precursor, partial
[Zea mays]
AAG22094.3 TDGVDEEHVVQLVDTFPGQSIDFFGALR 9 76 Rubisco activation
(Chloroplast)
6.43
34
6.59
38
280 Chlorophyll a-b binding
protein [Zea mays] CB22_MAIZE
AKPAAASGSPWYGPDR
VLYLGPLSGEPPSYLTGEFPGDYGWDTAG-LSADPETFAK
ELEVIHCR
GPLENLADHIADPVNNNAWAYATNFVPGK
34 138
Photosynthesis;
light harvesting
(Chloroplast)
5.29
28
4.71
26

64
285
Putative C4
phosphoenolpyruvate
carboxylase [Saccharum
officinarum]
CAC08829.1 VSEELIQYDALLVDR HGDFSDEGSATTESDIEETLKR
3 122 Carbon fixation
(Cytosol)
5.94
109
4.94
22
286
ATP synthase subunit alpha
[Zea mays]
ATPA_MAIZE
QSQSNPLPVEEQVATIYTGTR EAIQEQLER
5
79
ATP synthesis coupled
proton transport
(Chloroplast)
5.87
55
5.73
24
287
Light-harvesting complex I
chlorophyll a/b binding
protein 3, partial
[Saccharum officinarum]
AND01108.1 FAMLGAAGAIAPEVFGK LGIIPPETALPWFK
11 115
Photosynthesis;
light harvesting
(Chloroplast)
8.96
29
4.94
24
288 Chlorophyll a-b binding
protein 3 [Arabidopsis
thaliana]
CB3_ARATH INGLDGVGEGNDLYPGGQYFDPLGLADD-
PVTFAELK 13 82
Photosynthesis;
light harvesting
(Chloroplast)
4.96
29
4.64
24
289 ATP synthase CF1 alpha
subunit [Zea mays] NP_043022.1
VVQVGDGIAR IIGLGEIMSGELVEFAEGTR
NVGIVLMGDGLMIQEGSFVK
IAQIPVSEAYLGR VINALAKPIDGR
LIESPAPGIISR
RSVYEPLQTGLIAIDSMIPIGR SVYEPLQTGLIAIDSMIPIGR
HTLIIYDDLSK
23 737
ATP synthesis coupled
proton transport
(Chloroplast)
5.87
56
5.15
28
291 F-ATP synthase subunit
alpha [Saccharum sp] Q6L3A1.2
VVQVGDGIAR
IIGLGEIMSGELVEFAEGTR
LIESPAPGIISR SVYEPLQTGLIAIDSMIPIGR
TAVATDTILNQK
HTLIIYDDLSK
16 459
ATP synthesis coupled
proton transport
(Chloroplast)
5.87
56
5.55
32
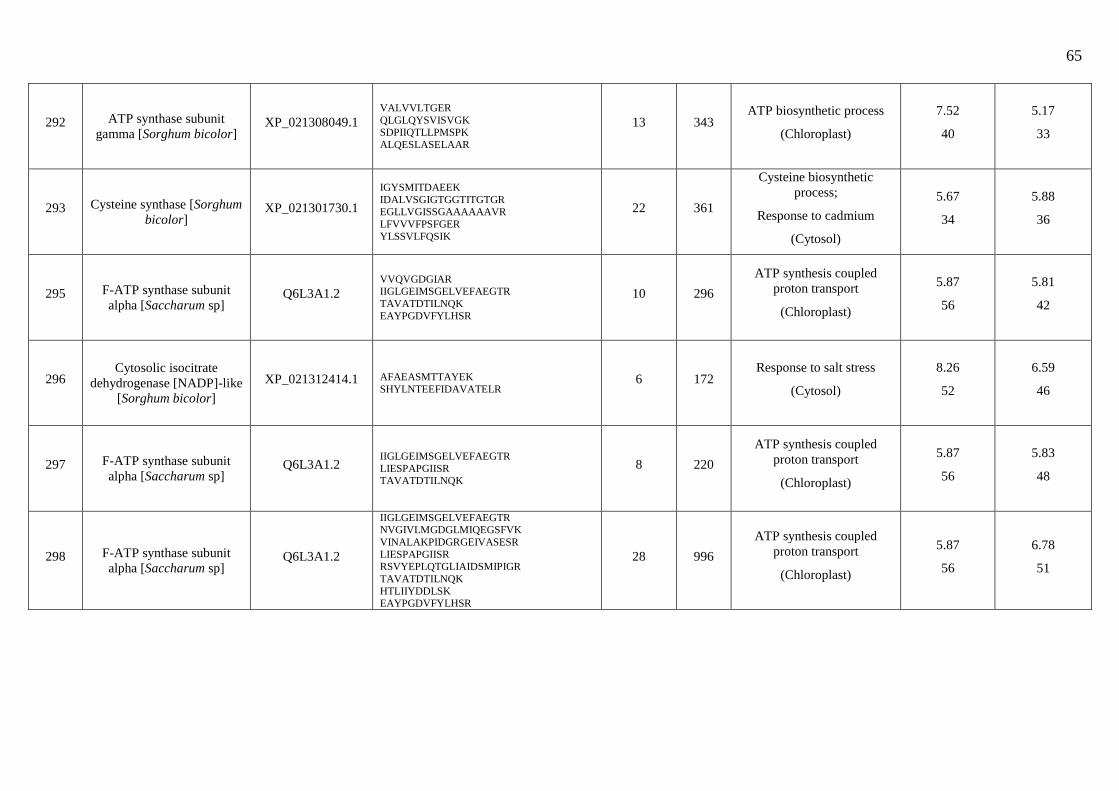
65
292 ATP synthase subunit
gamma [Sorghum bicolor] XP_021308049.1
VALVVLTGER
QLGLQYSVISVGK SDPIIQTLLPMSPK
ALQESLASELAAR
13 343 ATP biosynthetic process
(Chloroplast)
7.52
40
5.17
33
293 Cysteine synthase [Sorghum
bicolor] XP_021301730.1
IGYSMITDAEEK
IDALVSGIGTGGTITGTGR EGLLVGISSGAAAAAAVR
LFVVVFPSFGER
YLSSVLFQSIK
22 361
Cysteine biosynthetic
process;
Response to cadmium
(Cytosol)
5.67
34
5.88
36
295 F-ATP synthase subunit
alpha [Saccharum sp] Q6L3A1.2
VVQVGDGIAR IIGLGEIMSGELVEFAEGTR
TAVATDTILNQK
EAYPGDVFYLHSR
10 296
ATP synthesis coupled
proton transport
(Chloroplast)
5.87
56
5.81
42
296 Cytosolic isocitrate
dehydrogenase [NADP]-like
[Sorghum bicolor]
XP_021312414.1 AFAEASMTTAYEK
SHYLNTEEFIDAVATELR 6 172
Response to salt stress
(Cytosol)
8.26
52
6.59
46
297 F-ATP synthase subunit
alpha [Saccharum sp] Q6L3A1.2
IIGLGEIMSGELVEFAEGTR
LIESPAPGIISR TAVATDTILNQK
8 220
ATP synthesis coupled
proton transport
(Chloroplast)
5.87
56
5.83
48
298 F-ATP synthase subunit
alpha [Saccharum sp] Q6L3A1.2
IIGLGEIMSGELVEFAEGTR NVGIVLMGDGLMIQEGSFVK
VINALAKPIDGRGEIVASESR
LIESPAPGIISR RSVYEPLQTGLIAIDSMIPIGR
TAVATDTILNQK
HTLIIYDDLSK EAYPGDVFYLHSR
28 996
ATP synthesis coupled
proton transport
(Chloroplast)
5.87
56
6.78
51

66
299 F-ATP synthase subunit
alpha [Saccharum sp] Q6L3A1.2
IIGLGEIMSGELVEFAEGTR
IAQIPVSEAYLGR LIESPAPGIISR
8 267
ATP synthesis coupled
proton transport
(Chloroplast)
5.87
56
6.65
55
300 Glucose-1-phosphate
adenylyltransferase large
subunit [Sorghum bicolor]
XP_002463921.1
TVVAVILGGGAGTR
VYILTQFNSQSLNR
WFQGTADAVR AYLFNDYWEDIGTIK
NVIISNSEGVVEADR
13 383 Starch biosynthetic pathway
(Chloroplast)
8.33
56
6.08
56
306 F-ATP synthase subunit
alpha [Saccharum sp] Q6L3A1.2
VVQVGDGIAR LIESPAPGIISR
TAVATDTILNQK
HTLIIYDDLSK GYLDSLEIEQVKK
IIGLGEIMSGELVEFAEGTR
SVYEPLQTGLIAIDSMIPIGR
19 597
ATP synthesis coupled
proton transport
(Chloroplast)
5.87
56
5.78
65
313 Phosphoglycerate kinase
[Sorghum bicolor] XP_002441313.1
LVDALPIGGVLLLENVR
LASLADLYVNDAFGTAHR ELDYLVGAVSSPK
9 227
Reductive pentose phosphate
pathway
(Chloroplast)
5.89
50
4.51
38
315 GDP-mannose 3,5-
epimerase 1 [Sorghum
bicolor]
XP_002467242.1
ISITGAGGFIGSHIAR
FEMWGDGLQTR SFTFIDECVEGVLR
TQGVDIAAYGSSK
VVSTQAPVQLGSLR
17 369
L-ascorbic acid biosynthetic
process; response to
oxidative stress
(cytosol)
5.94
43
6.40
46
316 Chlorophyll a-b binding
protein 8 [Sorghum bicolor] XP_021304159.1 FAMLGAAGAIAPEVFGK
LGIIPPETALPWFK 9 196
Photosynthesis, light
harvesting
(Chloroplast)
9.34
36
5.17
24

67
233 Superoxide dismutase [Cu-
Zn] [Sorghum bicolor] XP_002445671.1
GTSEVEGVVTLTQDDDGPTTVNVR ITGLTPGLHGFHLHEFGDTTNGCISTGPHF-
NPNNLTHGAPEDEVR
HAGDLGNIVANAEGVAEATIVDTQIPLSGP-NSVVGR
AFVVHELEDDLGKGGHELSLSTGNAGGR
GGHELSLSTGNAGGR
64 537
Cellular response to
oxidative stress;
cellular response to salt
stress
(Chloroplast)
5.30
21
4.78
88
244 Oxygen-evolving enhancer
protein 1 [Sorghum bicolor] XP_021305066.1
GTGTANQCPTIDGGVEAFPFK
KLCLEPTSFTVK LCLEPTSFTVK
LTYTLDEIEGPLEVGSDGTLK
LTYTLDEIEGPLEVGSDGTLKFEEK FEEKDGIDYAAVTVQLPGGER
DGIDYAAVTVQLPGGER QLVATGKPESFGGPFLVPSYR
GGSTGYDNAVALPAGGR
NAAASTGNITLSVTK SNPETGEVIGVFESVQPSDTDLGAK
46 893
Photosynthesis; light
reaction
(Chloroplast)
5.91
35
5.20
28
245 Oxygen-evolving enhancer
protein 1 [Sorghum bicolor] XP_021305066.1
LCLEPTSFTVK
DGIDYAAVTVQLPGGER
QLVATGKPESFGGPFLVPSYR GGSTGYDNAVALPAGGR
NAAASTGNITLSVTK
24 450
Photosynthesis; light
reaction
(Chloroplast)
5.91
35
4.99
31
252 V-type proton ATPase
catalytic subunit A
[Sorghum bicolor]
XP_002451639.1
LAADTPLLTGQR
TTLVANTSNMPVAAR
DMGYNVSMMADSTSR EDDLNEIVQLVGK
NIIHFNTLANQAVER
FEDPAEGEEALVAK
13 457
ATP hydrolysis coupled
proton transport
(Vacuole)
5.37
68
5.05
41
254 Fructose-bisphosphate
aldolase 5 [Sorghum
bicolor]
XP_002437265.1 LSSINLENVESNR
YALICQEYGLVPIVEPEILTDGGHDIK 11 153
Glycolytic process;
Gluconeogenesis
(Cytosol)
7.56
38
6.45
42
263 Chaperone protein ClpC1
[Zea mays] AQK40544.1
VIGQDEAVVAISR NTLLIMTSNVGSSVIEK
IGFDLDSDEKDSSYSR
AKDINLQVTEK EGDSAIVDVDSEGK
18 364 Protein metabolic process
(Chloroplast)
5.15
43
5.26
56

68
274 Heat shock 70 kDa protein 6
[Zea mays] ONM07984.1
QFAAEEISAQVLR IINEPTAASLAYGFEK
AKFEELCSDLLDR
DIDEVILVGGSTR NQAESVIYQTEK
9 383
Protein folding; response to
abiotic stresses
(Chloroplast)
5.14
73
4.75
85
276 Heat shock 70 kDa protein 6
[Zea mays] ONM32478.1
QFAAEEISAQVLR
IAGLEVLR IINEPTAASLAYGFEK
FEELCSDLIDR
LSVSDLDEVILVGGSTR
IPAVQELVR
NQADSVVYQTEK
13 526
Protein folding;
response to abiotic stresses
(Chloroplast)
4.81
66
4.72
86

69
Figure 7. Functional characterization of all differential spots identified in leaves of ammonium-grown plants,
after 10 days in control conditions (AC) and salt stress with 75 mM NaCl (AS). Five categories were created
according to the results.
Comparing 2-DE gels from salt treatments of both nitrogen sources, a total of 334
protein spots were registered, being 33 proteins found as differentially regulated as affected
by nitrate or ammonium treatments (Fig. 8). Considering nitrate salt gel as reference,
ammonium salt gel showed 14 proteins upregulated, 11 downregulated, two proteins were
exclusive to nitrate salt treatment, while six were found to be exclusively expressed in
ammonium-grown plants (Fig. 9).
After identification (Table 5), it was observed that the proteins differentially expressed
as affected by nitrogen source were mainly involved in energetic metabolism (40%),
photosynthesis/carbon metabolism (30%), response to stress (21%) and other cellular
processes (9%) (Fig. 10). The level of nitrogen-mediated regulation of proteins, including the
exclusive proteins, is showed in table 3.
42%
2% 28%
13%
15%
AC × AS
Photosynthesis/Carbon metabolism
Antioxidants
Energetic metabolism
Response to stress
Other

70
Figure 8. Coomasie Brilliant Blue G 250-stained two-dimensional gels of leaves from sorghum plants grown in
nutrient solutions with nitrate (A) or ammonium (B), after 10 days of 75 mM-NaCl stress. Spots marked with
yellow circles indicate those ones present in the control treatment that underwent differential protein expression
in relation to the salt treatment. Spots marked with blue and red circles represent proteins that were significantly
upregulated (blue) or downregulated (red); Spots with green circles in indicates proteins whose expression was
found only in the respective treatment. Spots identified are statistically significant to a level of 95% per group
(Student’s t-test) using biological and analytical replicates (n = 3).
Fig. 9. Venn diagram representation of different subsets of proteins of Sorghum bicolor L. Moench cv. CSF 20
leaves grown in nitrate (NS) and ammonium-fed plants under salt stress with 75 mM NaCl (AS). NS was taken
as reference.

71
Table 5 – List of differentially regulated proteins in leaves of salt-stressed sorghum plants as affected by inorganic nitrogen source (nitrate and ammonium).
Differential spots were excised from 2DE gels, comparison NS × AS (see Fig. 9), and the proteins were identified by LC–ESI–MS/MS.
Spot Protein
(Species)
Access number
(NCBI/SwissProt)
Peptide sequences
(MS/MS)
Sequence
coverage
(%)
Score Biological process
(localization)
pI/MM
(kDa)
Theoretical
pI/MM
(kDa)
Experimenta
l
13 Phosphoenolpyruvate
carboxylase 3 [Sorghum
bicolor]
XP_002438521.2
HLLATGFSEISEDAVFTK IEEFLEPLELCYK
AIADGSLLDLLR
HTDVIDAITTHLGIGSYR RPLLPPDLPMTEEIADVIGAMR
8 351 Carbon Fixation
(Cytosol)
6.12
116
5.43
43
18 ATP synthase CF1 beta
subunit [Sorghum bicolor] YP_899414.1
TNPTTSRPGVSTIEEK
IDQIIGPVLDITFPPGK QINVTCEVQQLLGNNR
IFNVLGEPIDNLGPVDTSATFPIHR
SAPAFIELDTK TVLIMELINNIAK
AHGGVSVFGGVGER
VALVYGQMNEPPGAR DVNKQDVLLFIDNIFR
QDVLLFIDNIFR
FVQAGSEVSALLGR GIYPAVDPLDSTSTMLQPR
35 871 ATP biosynthesis
(Chloroplast)
5.31
54
5.60
57
41 Elongation factor Tu
[Sorghum bicolor] XP_002452390.1
TKPHVNIGTIGHVDHGK
TTLTAALTMVLASVGGSAPK KYDEIDAAPEER
GITINTATVEYETETR
HYAHVDCPGHADYVK NMITGAAQMDGAILVVSGADGPMPQTK
KDMVDDEELLELVELEVR
ALEALMANPALK QTDLPFLLAVEDVFSITGR
VGDTVDIVGIR
TMDDAMAGDNVGLLLR
39 1208 Protein synthesis
(Chloroplast)
6.07
51
5.40
47
48 Cytochrome b6-f complex
iron-sulfur subunit [Zea
mays]
ACG28186.1 GDPTYLVVEQDK
GPAPLSLALVHADVDDGK VLFVPWVETDFR
18 275
Photosynthesis; electron
transporter, transferring
electrons within
cytochrome b6/f
complex of photosystem
II activity
(Chloroplast)
8.52
24
5.79
14
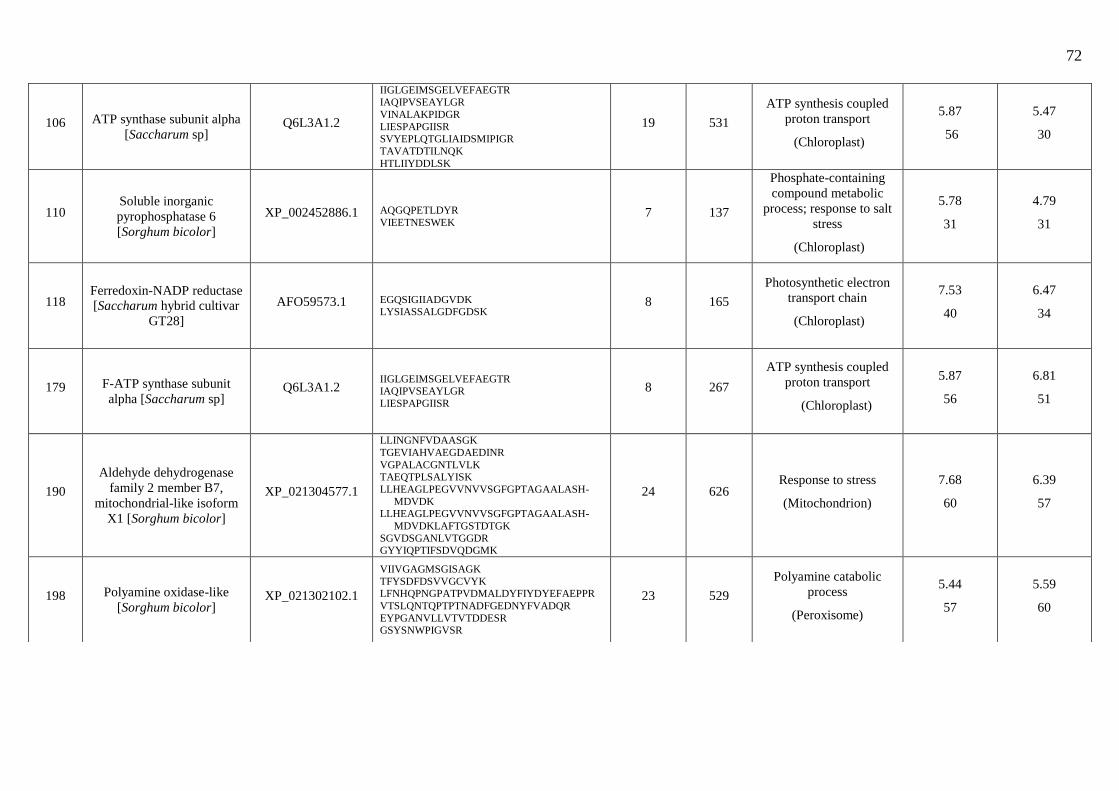
72
106 ATP synthase subunit alpha
[Saccharum sp] Q6L3A1.2
IIGLGEIMSGELVEFAEGTR IAQIPVSEAYLGR
VINALAKPIDGR
LIESPAPGIISR SVYEPLQTGLIAIDSMIPIGR
TAVATDTILNQK
HTLIIYDDLSK
19 531
ATP synthesis coupled
proton transport
(Chloroplast)
5.87
56
5.47
30
110 Soluble inorganic
pyrophosphatase 6
[Sorghum bicolor]
XP_002452886.1 AQGQPETLDYR
VIEETNESWEK 7 137
Phosphate-containing
compound metabolic
process; response to salt
stress
(Chloroplast)
5.78
31
4.79
31
118 Ferredoxin-NADP reductase
[Saccharum hybrid cultivar
GT28]
AFO59573.1 EGQSIGIIADGVDK LYSIASSALGDFGDSK
8 165
Photosynthetic electron
transport chain
(Chloroplast)
7.53
40
6.47
34
179 F-ATP synthase subunit
alpha [Saccharum sp] Q6L3A1.2
IIGLGEIMSGELVEFAEGTR IAQIPVSEAYLGR
LIESPAPGIISR
8 267
ATP synthesis coupled
proton transport
(Chloroplast)
5.87
56
6.81
51
190
Aldehyde dehydrogenase
family 2 member B7,
mitochondrial-like isoform
X1 [Sorghum bicolor]
XP_021304577.1
LLINGNFVDAASGK
TGEVIAHVAEGDAEDINR
VGPALACGNTLVLK TAEQTPLSALYISK
LLHEAGLPEGVVNVVSGFGPTAGAALASH-
MDVDK LLHEAGLPEGVVNVVSGFGPTAGAALASH-
MDVDKLAFTGSTDTGK
SGVDSGANLVTGGDR GYYIQPTIFSDVQDGMK
24 626 Response to stress
(Mitochondrion)
7.68
60
6.39
57
198 Polyamine oxidase-like
[Sorghum bicolor] XP_021302102.1
VIIVGAGMSGISAGK
TFYSDFDSVVGCVYK LFNHQPNGPATPVDMALDYFIYDYEFAEPPR
VTSLQNTQPTPTNADFGEDNYFVADQR
EYPGANVLLVTVTDDESR GSYSNWPIGVSR
23 529
Polyamine catabolic
process
(Peroxisome)
5.44
57
5.59
60

73
201 F0-F1 ATPase alpha
subunit, partial [Sorghum
bicolor]
CAB99314.1 VVSVGDGIAR
VVDALGVPIDGK
TAIAIDTILNQK
7 190
ATP synthesis coupled
proton transport
(Mitochondrion)
5.96
48
5.90
65
203 ATP synthase CF1 alpha
subunit [Saccharum hybrid
cultivar NCo 310]
YP_054628.1
VVQVGDGIAR
IIGLGEIMSGELVEFAEGTR IAQIPVSEAYLGR
VINALAKPIDGR
VINALAKPIDGRGEIVASESR
LIESPAPGIISR
RSVYEPLQTGLIAIDSMIPIGR
SVYEPLQTGLIAIDSMIPIGR TAVATDTILNQK
HTLIIYDDLSK
QMSLLLR EAYPGDVFYLHSR
QSQSNPLPVEEQVATIYTGTR
GYLDSLEIEQVK EAIQEQLER
36 1323
ATP synthesis coupled
proton transport
(Chloroplast)
5.87
56
5.70
66
227 Elongation factor G-2
[Sorghum bicolor] XP_002448238.1 EDIPVAVTGDIVALAGLK
VEVITPEEHLGDVIGDLNSR 4 141
Protein synthesis
(Chloroplast)
5.42
85
5.16
80
233 Carbonic anhydrase,
chloroplastic-like isoform
X1 [Sorghum bicolor]
XP_021312698.1
YMVFACSDSR
VCPSVTLGLQPGEAFTVR
FLTWEPVMDAVDR VCPSVTLGLMPGEAFTVR
YTGIGSAIEYAVCALK
16 316
Photosynthesis; response
to stress
(Chloroplast)
8.95
50
6.97
25
250 F-ATP synthase subunit
alpha [Saccharum sp] Q6L3A1.2
IIGLGEIMSGELVEFAEGTR
NVGIVLMGDGLMIQEGSFVK
VINALAKPIDGRGEIVASESR
LIESPAPGIISR
RSVYEPLQTGLIAIDSMIPIGR TAVATDTILNQK
HTLIIYDDLSK
EAYPGDVFYLHSR
28 996
ATP synthesis coupled
proton transport
(Chloroplast)
5.87
56
6.92
48

74
264 NADP (+)-Malate
dehydrogenase [Sorghum
bicolor]
CAA37531.1
QVQDGVATAEAPATR
DCFGVFCTTYDLK
LASGEVFGQDQPIALK AALLDINGQIFADQGK
VLVVGNPCNTNALICLK
SSAASTAVSIADAIK
21 458
Carbohydrate metabolic
process; response to
redox state
(Chloroplast)
5.97
47
5.17
46
272 Glyceraldehyde-3-
phosphate dehydrogenase A
[Sorghum bicolor]
XP_021318665.1
GDASPLEVIAINDTGGVK
YDSTLGIFDADVKPVGDNAISVDGK
VPTPNVSVVDLVVQVSK TLAEEVNQAFR
17 295
Reductive pentose-
phosphate cycle
(Chloroplast)
7.00
43
6.17
41
275 ATP synthase CF1 alpha
subunit [Zea mays] NP_043022.1
VVQVGDGIAR
IIGLGEIMSGELVEFAEGTR
NVGIVLMGDGLMIQEGSFVK IAQIPVSEAYLGR
VINALAKPIDGR
LIESPAPGIISR RSVYEPLQTGLIAIDSMIPIGR
SVYEPLQTGLIAIDSMIPIGR
HTLIIYDDLSK
23 737
ATP synthesis coupled
proton transport
(Chloroplast)
5.87
55
5.27
29
278
4-hydroxy-7-methoxy-3-
oxo-3,4-dihydro-2H-1,4-
benzoxazin-2-yl glucoside
beta-D-glucosidase 2
[Sorghum bicolor]
XP_002443073.2
DYTDFAGLCFER
VNNWLTFNEPHTFTCLSYGTGILAPGR
GLKDILMITK FGIVYVDR
9 294
Carbohydrate metabolic
process
(Chloroplast)
6.22
65
5.95
68
312 Cytosolic isocitrate
dehydrogenase [NADP]-like
[Sorghum bicolor]
XP_021312414.1 AFAEASMTTAYEK
SHYLNTEEFIDAVATELR 6 172
Response to salt stress
(Cytosol)
8.26
52
6.72
44
315 Chlorophyll a-b binding
protein
[Zea mays]
CB22_MAIZE
AKPAAASGSPWYGPDR
VLYLGPLSGEPPSYLTGEFPGDYGWDTAGL-
SADPETFAK ELEVIHCR
GPLENLADHIADPVNNNAWAYATNFVPGK
34 138
Photosynthesis; light
harvesting
(Chloroplast)
5.29
28
4.71
26

75
316 ATP synthase subunit alpha
[Zea mays] ATPA_MAIZE
VGIENIGR
VVQVGDGIAR
LIESPAPGIISR
5 125
ATP synthesis coupled
proton transport
(Chloroplast)
5.87
56
5.55
34
318 Ricin B-like lectin R40C1
[Sorghum bicolor] XP_002465329.1 ADEGYCLTVR
ADDGFSVTVR 5 127
Stomatal Closure;
response to stress
(Nucleus)
6.27
40
6.69
38
321 F-ATP synthase subunit
alpha [Saccharum sp] Q6L3A1.2
VVQVGDGIAR IIGLGEIMSGELVEFAEGTR
TAVATDTILNQK
EAYPGDVFYLHSR
10 296
ATP synthesis coupled
proton transport
(Chloroplast)
5.87
56
5.81
42
322 F-ATP synthase subunit
alpha [Saccharum sp] Q6L3A1.2
IIGLGEIMSGELVEFAEGTR
LIESPAPGIISR
TAVATDTILNQK
8 220
ATP synthesis coupled
proton transport
(Chloroplast)
5.87
56
5.91
46
323 Isocitrate dehydrogenase
[NADP] [Solanum
tuberosum]
IDHC_SOLTU LIDDMVAYALK
GGETSTNSIASIFAWTR LEAACIGAVESGK
9 126 Response to stress
(Cytosol)
6.54
47
6.23
50
324 Polyamine oxidase-like
[Sorghum bicolor] XP_021302102.1
VIIVGAGMSGISAGK TFYSDFDSVVGCVYK
VTSLQNTQPTPTNADFGEDNYFVADQR
EYPGANVLLVTVTDDESR GSYSNWPIGVSR
17 389
Polyamine catabolic
process
(Peroxisome)
5.44
57
5.39
63
329 Pyruvate orthophosphate
dikinase [Saccharum
officinarum]
AAF06668.1 LAEVNPMLGFR
VLANADTPEDALAAR 2 179
Photosynthesis
(Chloroplast)
5.52
103
4.91
77

76
333 Phosphoglycerate kinase
(Fragment) OS=Spinacia
oleracea
PGKH_SPIOL IGVIESLLEK GVSLLLPTDVVIADK
5 73
Reductive pentose
phosphate pathway
(Chloroplast)
5.83
46
4.30
27
296 Oxygen-evolving enhancer
protein 1 [Sorghum bicolor] XP_021305066.1
GTGTANQCPTIDGGVEAFPFK QLVATGKPESFGGPFLVPSYR
NAAASTGNITLSVTK
17 209
Photosynthesis; light
reaction
(Chloroplast)
7.59
34
4.99
31
297
Enoyl-[acyl-carrier-protein]
reductase [NADH] 1
[Oryza sativa subsp.
Japônica]
FABI1_ORYSJ YAGSSNWTVK
VNTISAGPLGSR 5
70
Fatty acid biosynthetic
process
(Chloroplast)
8.81
39
5.56
36
299 Phosphoribulokinase
[Sorghum bicolor] XP_021313843.1
GGNPDSNTLISDTTTVICLDDYHSLDR KEYGVTALDPR
DGQAVEKPIYNHVTGLLDPPELITPPK
GHSLESIQASIEAR
KPDFDAYIDPQK
FFNPVYLFDEGSSISWVPCGR
FAYGPDTYFGK EVSVLEMDGQFDKLDELIYVESHLSNLSTK
HADFPGSNNGTGLFQTIIGLK
IRDLYEQIVAER
44
763
Reductive pentose-
phosphate cycle
(Chloroplast)
6.09
46
5.25
41
311
Oxygen-evolving enhancer
protein 1
[Sorghum bicolor]
XP_021305066.1
GTGTANQCPTIDGGVEAFPFK LCLEPTSFTVK
LTYTLDEIEGPLEVGSDGTLK
LTYTLDEIEGPLEVGSDGTLKFEEK FEEKDGIDYAAVTVQLPGGER
DGIDYAAVTVQLPGGER
QLVATGKPESFGGPFLVPSYR
GRGGSTGYDNAVALPAGGR
GGSTGYDNAVALPAGGR GDEEELLKENIK
NAAASTGNITLSVTK
SNPETGEVIGVFESVQPSDTDLGAK
50
875
Photosynthesis; light
reaction
(Chloroplast)
5.91
35
5.23
30

77
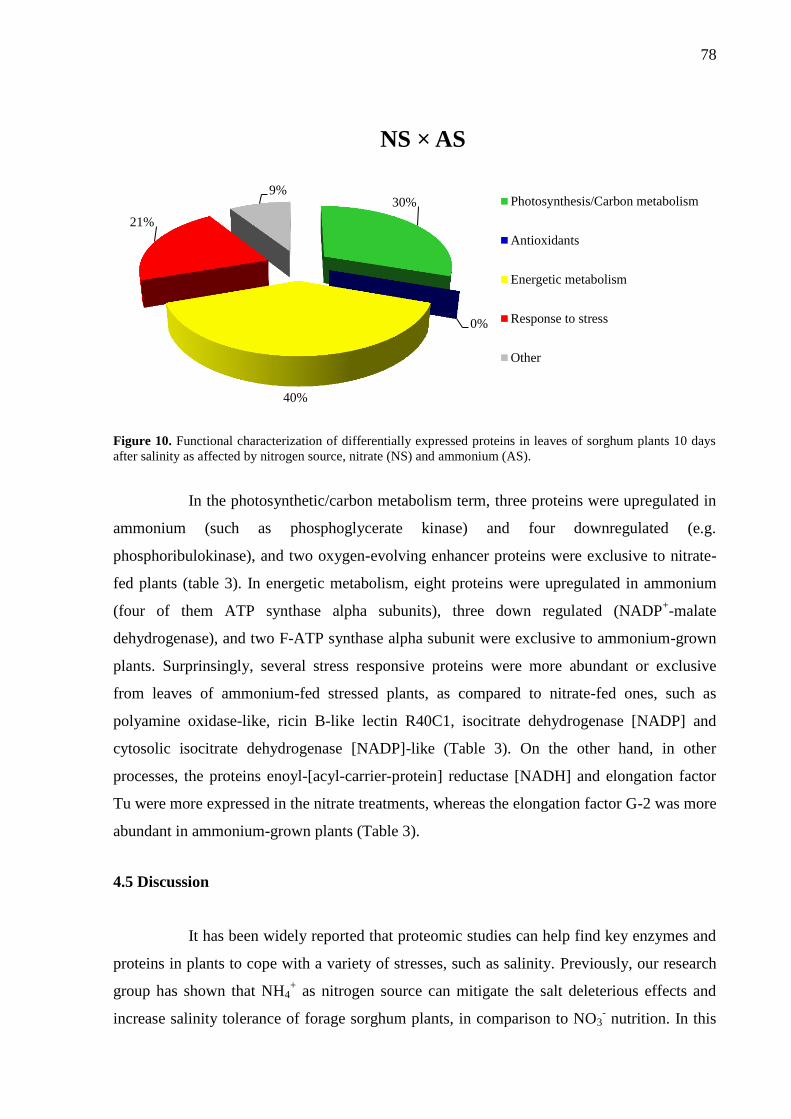
78
Figure 10. Functional characterization of differentially expressed proteins in leaves of sorghum plants 10 days
after salinity as affected by nitrogen source, nitrate (NS) and ammonium (AS).
In the photosynthetic/carbon metabolism term, three proteins were upregulated in
ammonium (such as phosphoglycerate kinase) and four downregulated (e.g.
phosphoribulokinase), and two oxygen-evolving enhancer proteins were exclusive to nitrate-
fed plants (table 3). In energetic metabolism, eight proteins were upregulated in ammonium
(four of them ATP synthase alpha subunits), three down regulated (NADP+-malate
dehydrogenase), and two F-ATP synthase alpha subunit were exclusive to ammonium-grown
plants. Surprinsingly, several stress responsive proteins were more abundant or exclusive
from leaves of ammonium-fed stressed plants, as compared to nitrate-fed ones, such as
polyamine oxidase-like, ricin B-like lectin R40C1, isocitrate dehydrogenase [NADP] and
cytosolic isocitrate dehydrogenase [NADP]-like (Table 3). On the other hand, in other
processes, the proteins enoyl-[acyl-carrier-protein] reductase [NADH] and elongation factor
Tu were more expressed in the nitrate treatments, whereas the elongation factor G-2 was more
abundant in ammonium-grown plants (Table 3).
4.5 Discussion
It has been widely reported that proteomic studies can help find key enzymes and
proteins in plants to cope with a variety of stresses, such as salinity. Previously, our research
group has shown that NH4+ as nitrogen source can mitigate the salt deleterious effects and
increase salinity tolerance of forage sorghum plants, in comparison to NO3- nutrition. In this
30%
0%
40%
21%
9%
NS × AS
Photosynthesis/Carbon metabolism
Antioxidants
Energetic metabolism
Response to stress
Other
79
study we did a complete investigation of the proteome of sorghum leaves submitted to salt
stress and with distinct nitrogen sources, which prove that ammonium nutrition lead to better
physiological results, formerly described by Miranda et al. (2016; 2017).
According to these authors, the positive effects of NH4+ supply under salt stress
were attributed to: (i) increased accumulation of amino acids that could help to osmotic
adjustment in order to maintain a water balance and osmoprotection, as well as ameliorating
the salinity-induced K+ efflux; (ii) a greater efficiency of photosynthetic machinery under salt
stress; and primarily (iii) a control on Na+ accumulation in plant tissues, involving the
activation of Na+/H
+ SOS1 antiporter, enhanced efficiency of proton pumps in roots and low
loading of Na+ into the xylem sap.
4.5.1 Physiological changes in sorghum plants under salt stress
In this study, salinity severely impaired the growth of sorghum plants, irrespective
of the nitrogen source. In nitrate treatments the toxic effects of salt excess in plant growth
were associated with strong decreases in K+/Na
+ ratios (Fig. 1A; Supplementary Table S1).
Similar results were reported in Yang et al. (2013), who verified that sugar beet plants grown
in the Hoagland solution, whose main N source is nitrate, displayed reduced growth and
leaves exhibited chlorosis. Recently, Miranda et al. (2017) showed that NO3--fed plants tend
to accumulate Na+
into vacuole through an increase in Na+/H
+ exchanger (NHX) activity and
gene expression, but the plants are not able to restrict Na+ transport and accumulation in
sorghum shoots. In ammonium-fed plants, although the inhibition in plant growth were also
associated with reductions in K+/Na
+ ratios, it was much less aggravated than those of nitrate-
grown plants (Fig. 1B; Supplementary Table 1). Higher SDM, RDM and LA values in
ammonium-fed plants are probably related to a more efficient restriction of Na+ accumulation
in shoots. Miranda et al. (2017) also found that ammonium nutrition enhanced plants salt
tolerance by increasing expression and activity of Na+/H
+ antiporters (such as SOS1 and
NHX) and V-ATPase, which limited the transport to the leaves via xylem. Fernández-Crespo
et al. (2012) also reported that ammonium nutrition increased salt tolerance in citrus plants,
especially by elevating proline and polyamines levels.
In the present study, we performed a detailed investigation of the proteomic
profile of sorghum plants in order to identify target proteins involved in mechanisms of salt
tolerance induced by external nitrogen source. In attempt to overcome the salt harmful effects,

80
nitrate-fed plants upregulated numerous proteins related to energetic metabolism and a group
of proteins of response to stress and other cellular processes (Table 1); but failed in activating
at least part of the antioxidant system. Although one ascorbate peroxidase 2 was upregulated
in response to salinity, one glyoxylase 1 and a cytosolic superoxide dismutase were
downregulated (Table 1). It is likely that the losses on defense mechanisms were not able to
cope with salt damage, resulting in severe complications in plant metabolism as inhibitions in
LA, RDM e SDM . Our results are in accordance with Zhang et al. (2013), who assessed the
effects of salinity on antioxidant enzymes in roots and leaves of Broussonetia papyfera and
showed inhibition on plant growth and a decrease in activity of SOD. Jakovljević et al. (2017)
also reported similar results with the antioxidant enzyme and plant growth while studying
early sweet basil plants under salt stress and using Hoagland’s nutrient solution.
On the other hand, ammonium-fed plants displayed a specific modulation of
proteome that resulted in a more efficient response to salt stress. Firstly, salt-stressed plants
synthetized de novo some thylakoid structural proteins as well as upregulated diverse
enzymes of photosynthetic/carbon metabolism (Table 1). In parallel, ammonium-fed plants
activated (exclusively or by upregulation) several proteins involved in energetic metabolism,
such as ATP synthase alpha subunits, which in turn provided energy for ammonium
assimilation and mechanisms of salt responses, such as H+-ATPases proton pumps and
Na+/H
+ antiporters. This hypothesis was previously corroborated by Miranda et al. (2017),
who demonstrated that ammonium decrease Na+ accumulation in sorghum tissues through
Na+ efflux from cells by efficiently activating SOS1-like Na
+/H
+ antiporters. These authors
also showed that the increased SOS1 activity is coupled with a higher P-ATPase H+-pumping
activity. Finally, ammonium-fed plants also upregulated or synthetized de novo proteins
related to response to stress and other metabolic processes (Table 1), which composed the
intricate pathway of plant responses and helped alleviate the salt damage and improve salinity
tolerance of sorghum plants (Fig. 1; Supplementary Table 1). For instance, salt-stressed plants
displayed a de novo synthesis of cytosolic isocitrate dehydrogenase [NADP]-like, which is
believed to alleviate oxidative stress in leaves of Arabidopsis (Mhamdi et al., 2010), and
cysteine synthase (Table 1), an important component involved in response to biotic and
abiotic stresses (Romero et al., 2014). Miranda et al. (2016) also verified that NH4+-fed plants
displayed higher biomass values (root and shoot dry mass), higher root and shoot K+/Na
+
ratios, higher free amino acids content and also greater CO2 assimilation under salt stress in
comparison to nitrate nutrition. Such reports are in accordance with results presented here.
81
4.5.2 Proteins related to photosynthesis and carbon metabolism
Photosynthesis is one of the primary plant processes affected by salt stress.
Therefore, the plant ability to survive under salinity is strongly influenced by the activity of
photosynthetic enzymes. It is known that salinity disturbs both photochemical and
biochemical processes in photosynthesis (Munns and Tester, 2008). Although our results of
CO2 assimilation rate, PSII maximum efficiency (Fv/Fm) and effective quantum yield of PSII
( PSII) were not significantly altered by neither salinity nor nitrogen source (Fig. 1A, B;
Supplementary Table 1), unlike our proteomic analyses that revealed several proteins related
to this process underwent modulation in response to salinity.
The light-harvesting complex (LHC) is composed by chlorophylls a and b and the
chlorophyll a-b binding protein. LHC is a light receptor that captures and transfers excitation
energy to photosystems I and II with which is intimately associated. Under changing light
conditions, the reversible phosphorylation of light harvesting chlorophyll a/b binding proteins
(LHCII) represents a system for balancing the excitation energy between the two
photosystems (Liu and Shen, 2004). Ammonium nutrition induced de novo synthesis in three
isoforms of LHC chlorophyll a-b binding protein (Table 1; spots 287, 280 and 316 in fig. 2D)
and one upregulation of these proteins (Table 1; spot 288 in fig. 2C, D), which could have
contributed to the mitigation of the deleterious effects of salinity on photosynthesis and
growth in these plants. In contrast, only one isoform of this protein was upregulated in nitrate-
fed plants (Table 1; spot 18 in fig. 2A, B), which probably contributed to assimilation rate
maintenance. Studies show that this protein can be up or downregulated in plants, according
to species under salt stress. For instance, Rabey et al. (2016) found that salinity caused
downregulation of this protein in date palms under salt stress.
The water-splitting reaction in the PSII is catalyzed by the Mn cluster, which is
attached to a crucial part of the PSII: the oxygen-evolving enhancer (OEE) protein complex.
This complex is composed by three proteins: OEE1, which is bound to the intrinsic subunits
of the PSII complex and provides a binding site for OEE2; and OEE3, which is attached to
PSII by OEE2 (Momonoki et al., 2009). It is believed that OEE1 might be important to keep
the well-functioning of PSII under salt stress (Momonoki et al., 2009). In our studies, this
protein was downregulated by salinity in ammonium-fed sorghum plants (Table 1; spots 244
and 245 in figs. 2C, D). Although these proteins were mostly inhibited, that did not seem to
82
interfere in the photosynthetic process overall. Abreu et al. (2014) showed an upregulation of
this protein in cowpea leaves under salinity and recovery.
Rubisco catalyzes the fixation of atmospheric CO2 into ribulose-1,5-bisphosphate,
generating two molecules of 3-phosphoglycerate. The holoenzyme is composed by eight large
subunits and eight small subunits. In this study, Rubisco large subunit underwent upregulation
(Table 1; spots 91 and 119 in figs. 2A; B), downregulation (Table 1; spots 13 and 109 in figs.
2A, B) and repression (Table 1; spots 238, 239 and 240 in fig. 2A). Despite the strong
inhibition of this protein, it was not enough to affect CO2 assimilation. Rabey et al. (2016)
also reported downregulations of the large subunit of Rubisco in date palms. Our data is also
in accordance with Abreu et al. (2015), who reported the same result with this protein
studying proteomic changes in cowpea leaves submitted to salt stress and recovery.
In the presence of light, rubisco activase replaces inhibitory sugar phosphates such
as ribulose-1,5-bisphosphate or carboxyarabinitol 1-phosphate from the catalytical sites of
rubisco for CO2 in order to activate the enzyme. Under nitrate nutrition two isoforms of this
enzyme were downregulated in response to salinity (Table 1; spots 55 and 68 in figs. 2A;B),
one was upregulated (Table 1; spot 57 in figs. 2A; B) and one underwent de novo synthesis
(Table 1; spot 209 in fig. 2B). On the other hand, ammonium-fed plants only showed one
downregulated isoform (Table 1; spot 228 in figs. 2C;D). Although rubisco activase was
mainly downregulated, it seems NaCl could not interfere on CO2 fixation in the end. Deeba et
al. (2012) also reported similar results of this enzyme in cotton plants under drought stress; In
contrast, two isoforms of rubisco activase underwent upregulation and de novo synthesis,
respectively.
Chloroplastic 3-phosphoglycerate kinase catalyzes the ATP-dependent
phosphorylation of 3-phosphoglycerate to 1,3–bisphosphoglycerate in the Calvin-Benson
cycle. Under salt stress, all isoforms of this protein in both nitrogen sources (Table 1; spots 72
and 161 in figs. 2A; B; spots 84, 162 and 313 in figs. 2C;D; spot 333 in figs. 2E;F) underwent
upregulations. These upregulations in ammonium nutrition could have contributed to the
better results in growth parameters in the presence of NaCl in comparison to nitrate-fed
plants. Zhang et al. (2014) also reported an upregulation of this enzyme by analyzing
proteomic profiles of leaves of two chrysanthemum varieties under heat stress.
Chloroplastic triosephosphate isomerase interconverts glyceraldehydes-3-
phosphate and dihydroxyacetone. In both nitrogen sources, this enzyme underwent
upregulations (Table 1; spots 153 and 188 in figs. 2A;B; spots 159 and 224 in figs. 2C;D).

83
These results might have lead to an unchanged CO2 assimilation in both nitrogen sources.
Wang et al. (2015) also reported an upregulation of this enzyme in halophyte Halogeton
glomeratus seedlings exposed to salt stress.
Two C4 metabolism important proteins were differentially modulated in response
to salinity: phosphoenolpyruvate carboxylase (PEPCase) and pyruvate phosphate dikinase.
The first step in the C4 photosynthetic fixation of CO2 is performed by PEPCase, which
catalyzes the carboxylation of phosphoenolpyruvate in the presence of HCO3- and Mg
2+ to
produce oxaloacetate and inorganic phosphate. In nitrate-fed plants, three isoforms of
PEPCase underwent upregulation (Table 1; spots 15, 140 and 184 in figs. 2A;B). In
ammonium-grown plants, two isoforms were upregulated (Table 1; spots 28 and 191 in figs.
2C;D), and another isoform underwent de novo synthesis (Table 1; spot 285 in fig. 2D).
Comparing both stressed groups, PEPCase was downregulated in ammonium salt stress plants
in comparison to nitrate salt stress ones (Table 1; spot 13 in figs. 2E;F). This upregulation
might have kept CO2 assimilation rates nearly unchanged even under salt stress. Jedmowski et
al (2014) also reported that sorghum plants under drought stress tend to upregulate this
enzyme. Contrary to our findings, Ahmad et al. (2017) reported a downregulation of PEPCase
in Parthenium hysterophorus leaves submitted to salt stress.
Pyruvate phosphate dikinase, the other C4 metabolism enzyme differentially
expressed, performs the ATP and phosphate-driven conversion of pyruvate to
phosphoenolpyruvate, which is the primary CO2 acceptor in C4 photosynthesis. In nitrate-fed
plants, this enzyme underwent de novo synthesis (Table 1; spot 233 in fig. 2B), whereas in
ammonium-grown plants it was observed distinct responses to two isoforms: an upregulation
(Table 1; spot 153 in figs. 2C;D) and a downregulation (Table 1; spot 161 in figs. 2C;D).
Comparing both nitrogen sources under salt stress, this enzyme was exclusive to ammonium-
salt plants (Table 1; spot 329 in fig. 2F). These results could have held CO2 assimilation rates
almost unaltered despite the presence of salt stress in both nitrogen sources. In accordance to
most of our results, Jedmowski et al. (2014), studying the effects of drought and recovery on
the proteic profile of sorghum leaves, detected an upregulation of pyruvate phosphate
dikinase. On the other hand, Thagela et al. (2016) observed a downregulation of this enzyme
in Azolla mycrophylla roots exposed to salinity.
Overall, although nitrate-grown plants increased the abundance of electron
transport chain structural proteins and carbon assimilation enzymes (Table 3), these

84
mechanisms might not be enough to reduce salt damage in photosynthetic performance (Fig.
1A).
4.5.3 Proteins related to energetic metabolism
In nitrate-fed plants, the activation of proteins from energetic metabolism could
provide energy for salt responses but these factors might not be efficient and the plants were
more sensitive to salinity. On the other hand, ammonium-fed plants activated more proteins of
this category, which could have lead to a more efficient alleviation.
Studies have reported that some enzymes involved in sugar and energy
metabolism alter their levels in response to salt stress. Chloroplast ATP synthase synthesizes
ATP from ADP and inorganic phosphate, utilizing the electrochemical proton gradient formed
across these membranes by photosynthetic or respiratory electron transfer reaction (Hisabori
et al., 2013). The holoenzyme is composed of a membrane-peripheral component F1, which
in turn is formed by five different subunits with an α3β3γ1δ1ɛ1 stoichiometry, and a membrane-
embedded part Fo, consisted of three different subunits with a1b2c10–15 stoichiometry (Hisabori
et al., 2013). In this study, ATP synthase subunits responded differentially to the nitrogen
sources: beta subunit was mainly upregulated by nitrate treatment, with some events of
downregulation, whereas alpha subunit was strongly upregulated by ammonium nutrition,
being observed some de novo synthesis. A high production of ATP synthase is crucial for the
mitigation of the deleterious effects of salinity, once the organism will spend more energy to
cope with this stress rather than producing biomass (Hu et al., 2012), which might explain
better results in growth parameters found in ammonium-fed plants than in nitrate-grown
plants. The upregulation of ATP synthase beta subunit is in accordance to Xiong et al. (2017)
who assessed proteomic changes in alfalfa shoots in response to salinity. On the other hand,
Abreu et al (2014) revealed a downregulation of this enzyme in cowpea leaves submitted to
salt stress and recovery. The upregulation of ATP synthase alpha subunit in both nitrogen
sources is in accordance with Jia et al (2016) with Dunaliella salina under high and low salt
stress.
Cytosolic glyceraldehyde 3-phosphate dehydrogenase is an enzyme of the
glycolytic pathway involved in the conversion of glyceraldehyde-3-phosphate to 1,3-
bisphosphoglycerate. Two isoforms of this protein underwent downregulation (Table 1; spots
64 in figs. 2A;B, and spot 272 in figs. 2E;F), whereas one was de novo synthesized in nitrate-

85
fed plants (Table 1; spot 190 in fig. 2B). These reductions could mean a lower energy
production, required for crucial cellular processes, which could explain the higher inhibition
in nitrate-fed plants. Kamal et al (2012), while studying proteomic profiles of wheat
chloroplasts under salt stress, also reported downregulation of three isoforms of this enzyme.
On the other hand, we also have found a de novo synthesis of one isoform of glyceraldehyde
3-phosphate dehydrogenase (Table 1; spot 190 in fig. 2B).
4.5.4 Proteins related to antioxidant system
Reactive oxygen species (ROS) are naturally produced as by-products of several
metabolic pathways, such as photosynthesis and respiration. However, ROS can have its
levels increased in response to biotic and abiotic stresses, such as salinity. Plants cope with
stress-induced ROS accumulation by inducing antioxidant systems, which can be enzymatic
like SOD, APX, and CAT, or non-enzymatic, represented by low molecular weight
compounds, e.g. glutathione, ascorbate, tocopherol, etc. (Munns and Tester, 2008). However,
analyzing protein profiles revealed that both nitrogen sources nutrition did not seem to
activate a significant antioxidant system to mitigate the deleterious effects of salinity.
SOD is a metalloenzyme that catalyses the dismutation of two superoxide radicals
(•O2-), reducing one to a hydrogen peroxide molecule (H2O2) and oxidizing the latter to
molecular oxygen (O2).Three SOD classes in plants have been identified: copper/zinc SOD
(Cu/Zn-SOD), iron SOD (Fe-SOD) and manganese SOD (Mn-SOD). Cu/Zn-SOD is the most
abundant SOD family in plant cells, detected in several cell compartments: chloroplasts,
mitochondria, cytosol, peroxisomes and in the apoplast as well. Fe-SOD is mainly found as a
chloroplastic enzyme. Mn-SOD was already localized in mitochondria and in peroxisomes
(Leonowicz et al., 2018). In nitrate-fed plants, cytosolic SOD was downregulated by salinity
(Table 1; spot 11 in figs. 2A;B), while in ammonium-fed plants chloroplastic SOD was
repressed by the stress (Table 1; spot 233 in fig. 2C). However, despite these results, it seems
ammonium nutrition relies on other strategies than antioxidant system to mitigate the
deleterious effects of salinity. Saleethong et al. (2016) also reported a downregulation of this
enzyme in rice leaves and grains exposed to salt stress pre-treated with exogenous spermidine.
Contrary to our findings, Talei et al (2014) observed an upregulation of SOD enzymes in
Andrographis paniculata roots and shoots in response to salt stress.

86
Another antioxidant enzyme identified was APX, which was only differentially
expressed in nitrate-fed plants, being upregulated in response to salinity (Table 1; spot 31 in
figs. 2A;B). APX (EC, 1.11.1.11) is a plant-type heme peroxidase that catalyzes the reduction
of H2O2 to water and O2 utilizing ascorbate as an electron donor (Munns and Tester, 2008).
Different isoforms are classified into sub-families according to their subcellular localization.
Among nine APX genes identified in Arabidopsis, three were discovered to be encoded in
cytosol whereas the other six were located in stroma, thylakoid, and peroxisome. APX
activity has also been noticed to increase under several stress conditions. For example, APX is
differentially upregulated in response to heavy metal, drought, water, and heat stress (Ozyigit
et al., 2016). . This enzyme was differentially upregulated in nitrate-fed plants (Table 1; spot
31 in fig. 2). It appears this enzyme is the main one involved in H2O2 scavenging in the
presence of NaCl. Our results are in accordance with Xiong et al. (2017), who reported an
upregulation of this enzyme in alfalfa plants submitted to salt stress.
4.5.5 Proteins related to response to stress and other cellular processes
Plants have developed several physiological and biochemical responses in order to
survive in soils with high salt concentration. The main mechanisms are, among others, ion
homeostasis and compartmentalization; ion transport and uptake; biosynthesis of
osmoprotectants and compatible solutes; activation of antioxidant enzymes; synthesis of
antioxidant compounds; and synthesis of polyamines. Salinity can affect other important
cellular processes in plants, such as translation, nitrogen assimilation and amino acid
metabolism (Munns and Tester, 2008).
Chaperone protein ClpC1 is a heat shock protein (HSP) of the AAA+ ATPase
family (ATPases associated with various cellular activities) and it belongs to the subfamily C
of CaseinoLytic Proteases (Trösch et al., 2015). It is known to be required for importing
proteins to the chloroplast, as well as preventing the aggregation of misfolded proteins (Bian
et al., 2017). In our study, in both nitrogen sources, it was observed events of de novo
synthesis (Table 1; spot 176 in fig. 2B; spot 312 in fig. 2D) and repression as well (Table 1;
spot 237 in fig. 2A; spot 263 in fig. 2C). Since one isoform underwent upregulation, it could
play a role in protecting protein structure in response to stress. Our results are in accordance
with Bian et al. (2017), who reported an upregulation of this protein in Brachypodium
distachyon leaves under drought stress. On the other hand, Caprioti et al. (2014) studying

87
wheat leaves under salt stress, observed a downregulation of this enzyme in response to
salinity.
Cysteine synthase (Table 1; spot 293 in fig. 2D) is a heterodimeric complex
formed by the enzymes serine acetyltransferase and O-acetylserine (thiol) lyase (Zargochev et
al., 2013). The first enzyme performs the generation of o-acetylserine from serine and acetyl-
coenzyme A; the latter replaces the acetyl group in o-acetylserine for reduced sulphur in the
form of H2S to form cysteine. This amino acid is a pivotal metabolite, whose role is the
donation of sulphate groups to form methionine, some vitamins such as coenzyme A and
biotin, glutathione, which is a key water-soluble antioxidant with a central role in ROS
scavenging, and other compounds (Zargochev et al., 2013). This complex is also associated
with response to stresses, for example in Cd tolerance in transgenic tobacco plants
overexpressing cysteine-synthase (Zargochev et al., 2013). In our study, this complex was de
novo synthesized in ammonium-fed plants, which highlights the importance of this enzyme in
response to salinity, producing cysteine as a protective measure against high Na+ levels
(Kamal et al., 2012). Our results are in accordance with Kamal et al. (2012), who studied
modulation of the proteome of wheat chloroplasts under salt stress. Shi et al. (2017) also
observed an upregulation of this enzyme in Pyropia haitanensis responding to high
temperature stress.
Poliamine oxidases are FAD-containing enzymes that perform the terminal
catabolism of spermidine and spermine to produce 1,3-diaminopropane, H2O2, and N-(3-
aminopropyl)-4-aminobutanal (spermine catabolism), or 4-aminobutanal (spermidine
catabolism). Other polyamine oxidases catalyze the conversion of polyamines (Liu et al.,
2015). We observed that two isoforms of polyamine oxidases underwent upregulation and de
novo synthesis, respectively (Table 1; spots 198 in figs. 2E-F; and 324 in fig. 2F). It is known
that polyamines are involved in response to several abiotic stresses, such as salinity and
oxidative stress, where they not only mitigate the deleterious effects of the stresses, but also
increase synthesis and activity of antioxidant enzymes (Liu et al., 2015). Our results are in
accordance with Fatehi et al. (2013) who assessed proteomic changes in Hordeum
spontaneum submitted to salt stress. Contrary to our findings, Ahmad et al. (2017), while
studying ecophysiological and proteomic changes in Parthenium hysterophorus in response to
salt stress, reported a downregulation of this enzyme.
NADP-isocitrate dehydrogenase catalyzes the oxidative decarboxilation of
isocitrate to α-ketoglutarate, reducing NADP+ to NADPH, and it is one of the most important

88
enzymes able to generate NADPH-reducing power (Leterrier et al., 2012). Here, two
isoforms of this enzyme were exclusive to ammonium-fed plants (Table 1; spots 312 and 323
in fig. 2F). Studies have reported that this enzyme is involved in ammonia assimilation, as
well as in the promotion of the redox signalling and response to oxidative stress. This might
have mitigated the effects of salinity in ammonium-fed plants. Our results are in accordance
with Yousuf et al. (2017), who studied the effects of salinity on proteomic profiles of indian
mustard leaves. Kamal et al. (2012) also reported an upregulation of this enzyme in wheat
leaves under salt stress.
Heat shock 70 kDa proteins (Hsp70 proteins) are a family of chaperones known to
interact with developing polypeptides, averting their misfolding and aggregation (Jackson-
Constan et al., 2001). This subfamily of HSP has isoforms found in several subcellular
compartments, such as cytosol and chloroplasts. It has been related that Hsp70 is one of the
cytosolic factors involved in keeping the import competence of the precursor of the light-
harvesting chlorophyll a/b-binding protein (Jackson-Constan et al., 2001). Stromal Hsp70
function is yet not elucidated; it is believed that its main role is either part of the protein
import complex or to guide precursor proteins with a targeting signal to the thylakoid
(Jackson-Constan et al, 2001). In the present study, four isoforms of chloroplast Hsp70
proteins were repressed by salinity, both in nitrate- and in ammonium-fed plants (Table 1;
spots 242 and 243 in fig. 2A; spots 274 and 276 in fig. 2C). These results might indicate that
salinity can strongly compromise appropriate protein folding and import from the cytosol to
the chloroplast. Our results are in accordance with Razavizadeh et al. (2009), who studied
proteomic modulations in tobacco leaves in response to salinity and reported a
downregulation of this protein. On the other hand, Li et al. (2013), while assessing the
proteome responses of alfalfa to heat stress, showed an upregulation of this protein.
Glutamine synthetase is a key enzyme for nitrogen assimilation in plants, once it
fixes ammonium into glutamate to generate glutamine. In this study, only the nitrate nutrition
displayed differential modulation of this enzyme, with an isoform upregulated and another
one downregulated, spots 139 and 164, respectively (Table 1; figs. 2A;B). A strong inhibition
of those proteins could represent a serious threat for the organism, once it provides nitrogen
groups for the biosynthesis of all nitrogenous compounds in the plant. Xiong et al. (2017) also
reported an upregulation of this enzyme in alfalfa roots and shoots under salt stress. On the
other hand, Cosentino et al. (2013), while evaluating the proteomic responses of leaves of
Mesembryanthemum crystallinum to salinity, detected a downregulation of this enzyme.

89
Peptidyl-prolyl cis-trans isomerases are enzymes that stabilize the interconversion
of cis and trans conformations in proline residues involved in peptide bonds, which allows
this amino acid to display cis conformation, once the trans configuration is usually the most
sterically favored in peptide bonds. The cis/trans isomerization of an amino acid-proline bond
results in slow stages in protein folding, which is an important step for folding and a crucial
determinant of structure (Kaur et al., 2015). This enzyme was upregulated in nitrate-fed
(Table 1; spot 206 in figs. 2A;B) and downregulated in ammonium-fed plants (Table 1; spot
95 in figs. 2C;D). These results could imply that ammonium nutrition does not prevent
inhibition of this enzyme efficiently. Vitárnvás et al. (2015), studying the proteome of barley
crowns grown under different water deficits, reported two events of upregulation of this
enzyme. On the other hand, Qin et al. (2016) revealed a downregulation of this enzyme in
wheat leaves transformed with maize PEPCase gene in response to drought stress.
Elongation factors are enzymes involved in protein synthesis. Plastid and
mitochondrial elongation factor Tu binds GTP and aminoacyl-tRNA, leading it to the codon-
dependent placement of this aminoacyl-tRNA at the A site of the ribosome (Fu et al., 2012).
We observed that elongation factor Tu underwent a de novo synthesis in nitrate-fed plants
(Table 1; spot 215 in fig. 2B) and a downregulation in ammonium-fed plants (Table 1; spot 41
in figs. 2E;F). These results might imply that nitrate nutrition induces higher production of
elongation factor Tu. Komatsu et al. (2014) also detected an upregulation of this enzyme in
wheat plants in response to salinity. Zhang et al. (2016) reported two events of
downregulation of this enzyme in petunia seedlings submitted to low temperature stress.
Elongation factor G is a plastid and mitochondrial enzyme that translocates the
mRNA one codon further to allow the arrival of the new aminoacyl-tRNA in the A site (Fu et
al., 2012). Contrarily, two isoforms of elongation factor G were upregulated in ammonium-
grown plants in response to salinity (Table 1; spots 138 in figs. 2C;D; and spot 227 in figs.
2E;F). This could mean that ammonium nutrition enhances elongation factor G production
and probably its activity. Our results are in accordance with Wan and Liu (2008), who found
an upregulated isoform while studying rice seedling leaves under hydrogen peroxide stress.
5-methyltetrahydropteroyltriglutamate-homocysteine methyltransferase (also
known as cobalamin-independent methionine synthase or MetE) is a B12 vitamin-
independent methionine synthase that transfers a methyl group to homocysteine, thus
generating methionine (Mordukhova and Pan, 2013). It was observed that two isoforms of
this enzyme were upregulated in response to salinity in ammonium-fed plants (Table 1; spots

90
136 and 176 in figs. 2C;D). One possible explanation for this upregulation is that MetE is
involved in S-adenosyl-methionine cycle, which for its turn is related to the Yang cycle that
generates ethylene, an important hormone involved in responses to abiotic stresses. Our
results are in accordance with Jedmowski et al. (2014), who assessed proteomic changes in
sorghum leaves submitted to drought stress and recovery, the authors reported an upregulation
of MetE. Liu et al (2014) also described an upregulation of MetE in rice plants in response to
salinity.
4.6 Acknowledgements
This work was supported by the Conselho Nacional de Desenvolvimento
Científico e Tecnológico (CNPq), and by the Instituto Nacional de Ciência e Tecnologia em
Salinidade (INCTSal/CNPq).

91
5 CONCLUSÃO
Em suma, nosso estudo investigative mostrou que a fonte externa de nitrogênio
pode alterar as respostas à salinidade em plantas de sorgo ao reprogramar especialmente um
vasto número de proteínas envolvidas no metabolismo energético e de resposta ao estresse.
Em todos os casos, plantas de sorgo nutridas com nitrato ou amônio regularam o perfil
proteômico sob estresse salino; contudo, a modulação em plantas cutltivadas em amônio
parece ser mais eficiente em levar a uma melhor aclimatação à salinidade. Particularmente, a
indução das enzimas PEPCase, fosfoglicerato-quinase, F-ATP sintase, e a síntese de novo de
várias proteínas, assim como taxas mais elevadas das razões K+/Na
+ podem ter contribuído
para a melhor tolerância ao estresse salino em plantas nutridas com amônio. Nossos dados
apresentam informações importantes para uma melhor compreensão dos mecanismos
moleculares de resposta à salinidade em plantas de sorgo mediadas pela fonte de nitrogênio, e
fornece novas perspectivas para o desenvolvimento de estratégias biotecnológicas a fim de se
produzir safras mais tolerantes ao estresse salino.
92
REFERÊNCIAS
ABREU, C. E.; ARAÚJO, G. S.; MONTEIRO-MOREIRA, A. C.; COSTA, J. H.; LEITE, H.
B.; MORENO, F. B.; PRISCO, J. T.; GOMES-FILHO, E. Proteomic analysis of salt stress
and recovery in leaves of Vigna unguiculata cultivars differing in salt tolerance. Plant Cell
Reports, Berlin, v. 33, p. 1289-1306, 2014.
AGRAWAL, G. K.; SARKAR, A.; RIGHETTI, P. G; PEDRESCHI, R.; CARPENTIER, S.;
WANG, T. A decade of plant proteomics and mass spectrometry: Translation of technical
advancements to food security and safety issues. Journal of Mass Spectrometry, Hoboken,
v. 32, p. 335-365, 2013.
AHMAD, P.; ABDEL LATEF, A. A.; RASOOL, S.; AKRAM, N. A.; ASHRAF,
M.; GUCEL, S. Role of proteomics in crop stress tolerance. Frontiers in Plant Science,
Lausanne, v. 7, 1336, 2016.
AHMAD, J. ; BASHIR, H.; BAGHERI, R.; BAIG, A.; AL-HUQAIL, A.; IBRAHIM, M. M.;
QURESHI, M. I. Drought and salinity induced changes in ecophysiology and proteomic
profile of Parthenium hysterophorus. PLOS One, San Francisco, v. 12, p. 1-27, 2017.
ALVAREZ-PIZARRO, J. C.; GOMES-FILHO, E.; PRISCO, J. T.; GROSSI-DE-SÁ, M. F.;
OLIVEIRA-NETO, O. B.; ROCHA FRAGOSO, R. Plasma membrane H+-ATPase in
sorghum roots as affected by potassium deficiency and nitrogen sources. Biologia
Plantarum, Lysolaje, v. 58, p. 507-514, 2011.
AQUINO, A. J. S.; LACERDA, C. F.; GOMES-FILHO, E. Crescimento, partição de matéria
seca e retenção de Na+, K
+ e Cl
- em dois genótipos de sorgo irrigados com águas salinas.
Revista Brasileira de Ciência do Solo, v.31, p.961-971, 2007. Revista Brasileira de Ciência
do Solo, Viçosa, v.31, p.961-971, 2007.
BARCELOS, C. A.; MAEDA, R. N.; BETANCUR, G. J. V.; PEREIRA-JUNIOR, N. Ethanol
production from sorghum grains [Sorghum bicolor (L.) Moench]: evaluation of the enzymatic
hydrolysis and the hydrolysate fermentability. Brazilian Journal of Chemical Engineering,
São Paulo, v. 28, p. 597-604, 2011.
BELTON, P. S.; TAYLOR, J. R. N. Sorghum and Millets: Protein Sources for Africa. Trends
in Food Science and Technology, Amsterdam, v. 15, p. 94-98, 2004.
BERENGUER, M. J.; FACI, J. M. Sorghum (Sorghum bicolor L. Moench) yield
compensation processes under different plant densities and variable water supply. European
Journal of Agronomy. Amsterdam, v. 15, p. 43-55, 2001.
BIAN, Y.; DENG, X.; YAN, X.; ZHOU, J.; YUAN, L.; YAN, Y. Integrated proteomic
analysis of Brachypodium distachyon roots and leaves reveals a synergistic network in the
response to drought stress and recovery. Scientific Reports, London, v. 7, p. 1-15, 2017.
BITTSÁNSZKY, A.; PILINSZKYA, K.; GYULAIB, G.; KOMIVES, T. Overcoming
ammonium toxicity. Plant Science, Amsterdam v. 231, p. 184-190, 2015.

93
BORBA, L. F. P.; FERREIRA, M. A.; GUIM, A.; TABOSA, J. N.; GOMES, L. H. S.;
SANTOS, V. L. F. Nutritive value of diferents silage sorghum (Sorghum bicolor L. Moench)
cultivares. Acta Scientiarum, Maringá, v. 34, p.123-129, 2012.
BRADFORD, M. M. A rapid and sensitive method for the quantitation of microgram
quantities of protein utilizing the principle of protein-dye binding. Analytical Biochemistry,
Amsterdam, v. 72, p. 248-254, 1976.
BRITTO, D. T.; KRONZUCKER, H. J. NH4+
toxicity in plants. Journal of Plant Physiology,
Amsterdam, v. 159, p. 567-584, 2002.
BYBORDI, A. Effect of different ratios of nitrate and ammonium on photosynthesis, and fatty
acid composition of canola under saline conditions. International Journal of Agriculture
and Crop Sciences, Dhaka, v. 4, p. 622-626, 2012.
CABELLO, J. V.; LODEYRO A. F.; ZURBRIGGEN, M. D. Novel perspectives for the
engineering of abiotic stress tolerance in plants. Current Opinion in Biotechnology,
Amsterdam, v. 26, p. 62–70, 2014.
CARUSO, G.; CAVALIERE, C.; GUARINO, C.; GUBBIOTTI, R.; FOGLIA, P.; LAGANÀ,
A. Identification of changes in Triticum durum L. leaf proteome in response to salt stress by
two-dimensional electrophoresis and MALDI-TOF mass spectrometry. Analytical and
Bioanalytical Chemistry, Berlin, v. 391, p. 381-90, 2008.
CASTELLANOS, C I S; ROSA, M. P.; DEUNER, C.; BOHN, A.; BARROS, A. C. S. A.;
MENEGHELLO G. E. Aplicação ao solo de cinza de casca de arroz como fonte de silício:
efeito na qualidade de sementes de trigo produzidas sob stresse salino. Revista de Ciências
Agrárias, Lisboa, v. 39, p. 95-104. 2016.
CHAKRABORTY, K.; BISHI, S. K.; GOSWAMI, N.; SINGH, A. L.; ZALA, P. V.
Differential fine-regulation of enzyme driven ROS detoxification network imparts salt
tolerance in contrasting peanut genotypes. Environmental and Experimental Botany,
Elsevier, v. 128, p. 79–90, 2016.
CHENG, T.; CHEN, J.; ZHANG, J.; SHI, S.; ZHOU, Y.; LU, L.; WANG, P.; JIANG, Z.;
YANG, J.; ZHANG, S.; SHI, J. Physiological and proteomic analyses of leaves from the
halophyte Tangut Nitrariareveals diverse response pathways critical for high salinity
tolerance. Frontiers in Plant Science, Lausanne, v. 10, p. 1-15, 2015.
CHINNUSAMY, V.; JAGENDORF, A.; ZHU, J. K. Understanding and improving salt
tolerance in plants. Crop Science, Madison, v. 45, p. 437-448, 2005.
COSENTINO, C.; DI SILVESTRE, D.; FISCHER-SCHLIEBS, E.; HOMANN, U.; DE
PALMA, A.; COMUNIAN, C.; MAURI, P. L.; THIEL, G. Proteomic analysis of
Mesembryanthemum crystallinum leaf microsomal fractions finds an imbalance in V-ATPase
stoichiometry during the salt-induced transition from C3 to CAM. Biochemical Journal,
London, v. 450, p. 407-415, 2013.
CRAWFORD N. M.; GLASS, A. D. M. Molecular and physiological aspects of nitrate uptake
in plants. Trends in Plant Science, Amsterdam, v. 31, p. 389-395, 1998.

94
CUNHA, R.; CASTRO, M.; FONTES, W. Espectrometria de massa de proteínas – O papel
chave da espectrometria de massa na era pós - genômica. Biotecnologia Ciência e
Desenvolvimento, Brasília, v. 36, p. 40-46, 2006.
DASS, C. Introduction to mass spectrometry. In: Principles and Practice of Biological Mass
Spectrometry. Amsterdam: Wiley, 2001.
DEBOUBA, M., MAAROUFI-DGHIMI, H., SUZUKI, A., GHORBEL, M. H., GOUIA, H.
Changes in growth and activity of enzymes involved in nitrate reduction and ammonium
assimilation in tomato seedlings in response to NaCl stress. Annals of Botany, Oxford, v. 99,
p. 1143–1151, 2007.
DEBOUBA, M.; DGUIMIA, H.M.; GHORBELA, M.; GOUIAA, H.; SUZUKIC, A.
Expression pattern of genes encoding nitrate and ammonium assimilating enzymes in
Arabidopsis thaliana exposed to short term NaCl stress. Journal of Plant Physiology,
Amsterdam, v. 170, p. 155-160, 2013.
DEEBA, F.; PANDEY, A. K.; RANJAN, S.; MISHRA, A.; SINGH, R.; SHARMA, Y. K.;
SHIRKE, P. A.; PANDEY, V. Physiological and proteomic responses of cotton (Gossypium
herbaceum L.) to drought stress. Plant Physiology and Biochemistry, Amsterdam, v. 53, p.
6-18, 2012.
DEMIDCHIK, V. Mechanisms of oxidative stress in plants: From classical chemistry to cell
biology. Environmental and Experimental Botany, Amsterdam, v. 109, p. 212-228, 2015.
EL-MAGEED, T. A. A.; MOHAMMED, S. A.; EL-SAMNOUDI, I. M.; IBRAHIRM, A. E.
M. Interactive effects of soil salinity and water table depth on soil properties and sorghum
(Sorghum bicolor L. Moench) production. Archives of Agriculture and Environmental
Science, Haridwar, v.3, p. 15-24, 2018.
ESTEBAN, R.; ARIZ, I.; CRUZ, C.; MORAN, J.F. Review: Mechanisms of ammonium
toxicity and the quest for tolerance. Plant Science, Amsterdam, v. 248, p. 92-101, 2016.
FAN, G.; WANG, L.; DENG, M.; ZHAO, Z.; DONG, Y.; ZHANG, X.; LI, Y. Changes in
transcript related to osmosis and intracellular ion homeostasis in Paulownia tomentosa under
salt stress. Frontiers in Plant Science,Lausanne, v. 7, p. 1–13, 2016.
FAO - Food and Agriculture Organization. FAOSTAT – Agriculture Data. Rome, Italy,
2012. Disponível em: <http://faostat.fao.org.site/339/default.aspx> . Acesso em 09 set. 2017.
FAROOQ, M.; GOGOI, N.; HUSSAIN, M.; BARTHAKUR, S.; PAUL, S.; BHARADWAJ,
N.; MIGDADI, H. M.; ALGHAMDI, S. S.; SIDDIQUE, K. H. M. Effects, tolerance
mechanisms and management of salt stress in grain legumes. Plant Physiology and
Biochemistry, Amsterdam, v. 118, p.199–217, 2017.
FATEHI, F.; HOSSEINZADEH, A.; ALIZADEH, H.; BRIMAVANDI, T. The Proteome
Response of Hordeum spontaneum to Salinity Stress. Cereal Research Communications,
Budapest, v. 41. p. 78-87, 2013.

95
FERNÁNDEZ-CRESPO, E.; CAMAÑES, G.; GARCÍA-AGUSTÍN, P. Ammonium enhances
resistance to salinity stress in citrus plants. Journal of Plant Physiology, Amsterdam v.169,
p.1183-1191, 2012.
FLOWERS, T. J., MUNNS, R., COLMER, T. D. Sodium chloride toxicity and the cellular
basis of salt tolerance in halophytes. Annals of Botany, Oxford, v. 115, p. 419–431, 2015.
FREIRE, M. B. G. S.; MIRANDA, M. F. A.; OLIVEIRA, E. E. M.; SILVA, L. E.; PESSOA,
L. G. M.; ALMEIDA, B. G. Agrupamento de solos quanto à salinidade no Perímetro Irrigado
de Custódia em função do tempo. Revista Brasileira de Engenharia Agrícola e Ambiental,
Campina Grande, v. 18, p. S86-S91, 2014.
FU, J.; I.; VARA PRASAD, P. V. Roles of Protein Synthesis Elongation Factor EF-Tu in
Heat Tolerance in Plants. Journal of Botany, Cairo, v. 2012, p. 1-8, 2012.
GHAFFARI, A.; GHARECHAHIB, J.; NAKHODAA, B.; SALEKDEHC, G. H. Physiology
and proteome responses of two contrasting rice mutants and their wild type parent under salt
stress conditions at the vegetative stage. Journal of Plant Physiology, Amsterdam v. 171, p.
31-44, 2014.
Gupta, B.; Huang, B. Mechanism of Salinity Tolerance in Plants: Physiological, Biochemical,
and Molecular Characterization. International Journal of Genomics, Cairo, p. 1-18, 2014.
HAMAMOTO, S.; HORIE, T.; HAUSER, F.; DEINLEIN, U.; SCHROEDER, J. I.;
UOZUMI, N. HKT transporters mediate salt stress resistance in plants: from structure and
function to the field. Current Opinion in Biotechnology, Amsterdam, v. 32, p. 113-120,
2015.
HARPER, J. E. Nitrogen metabolism. In: BOOTE, K. J., BENNETT. J. M., SINCLAIR, T.R.;
PAULSEN, G. M. (eds.). Physiology and Determination of Crop Yield. Madison:
ASA/CSSA/SSSA, p. 285-302, 1994.
HASEGAWA, P. M. Sodium (Na+) homeostasis and salt tolerance of plants. Environmental
and Experimental Botany, Amsterdam, v. 92, p.19-31, 2013.
HESSINI, K.; HAMED, K.B.; GANDOUR, M.; MEJRI, M.; ABDELLY, C.; CRUZ, C.
Ammonium nutrition in the halophyte Spartina alterniflora under salt stress: evidence for a
priming effect of ammonium? Plant Soil, Berlin, v. 370, p. 163–173, 2013.
HISABORI, T.; SUNAMUNA, E.; KIM, Y.; KONNO, H. The Chloroplast ATP Synthase
Features the Characteristic Redox Regulation Machinery. Antioxidants & Redox Signaling,
New Rochelle, v. 19, p. 1846-1854, 2013.
HOSSAIN, M.S.; DIETZ, K.-J. Tuning of redox regulatory mechanisms, reactive oxygen
species and redox homeostasis under salinity stress. Frontiers in Plant Science, Lausanne,
v.7, p. 1-15, 2016.
HOSSAIN, M. D.; INAFUKU, M.; IWASAKI, H.; TAIRA, N.; MOSTOFA, M. G.; OKU, H.
Differential enzymatic defense mechanisms in leaves and roots of two true mangrove species
under long- term salt stress. Aquatic Botany. Amsterdam, v. 142, p. 32–40, 2017.
96
HU, L.; YU, J.; LIAO, W.; ZHANG, G.; XIE, J.; LV, J.; XIAO, X.; YANG, B.; ZHOU, R.;
BU, R. Moderate ammonium:nitrate alleviates low light intensity stress in mini Chinese
cabbage seedling by regulating root architecture and photosynthesis, Scientia Horticulturae,
Amsterdam, v. 186, p. 143-153, 2015.
HU, R.; SUN, K.; SU, X.; PAN, Y.; ZHANG, Y.; WANG, X.; Physiological responses and
tolerance mechanisms to Pb in two xerophils: Salsola passerina Bunge and Chenopodium
album L. Journal of Hazardous Materials, Amsterdam, v. 205-206, p. 131-138, 2012.
HUERTA-OCAMPO, J. A.; BARRERA-PACHECO, A.; MENDOZA-HERNANDEZ, C. S.;
ESPITIA-RANGEL, E.; MOCK, H.; ROSA, A. P. B. Salt Stress-Induced Alterations in the
Root Proteome of Amaranthus cruentus L. Journal of Proteome Research, Washington
D.C., v. 13, p. 3607-3627, 2014.
IBGE (Instituto Brasileiro de Geografia e Estatística). Levantamento Sistemático da Produção
Agrícola. Available from:
ftp://ftp.ibge.gov.br/Producao_Agricola/Levantamento_Sistematico_da_Producao_Agric
ola_%5Bmensal%5D/Fasciculo/2015/lspa_201510.pdf. Outubro 2015.
JACKSON-CONSTAN, D.; AKITA, M.; KEEGSTRA, K. Molecular chaperones involved in
chloroplast protein import. Biochimica et Biophysica Acta (BBA) – Molecular Cell
Research, Amsterdam v. 1541, p. 102-113, 2001.
JEDMOWSKI, C.; ASHOUB, A.; BECKHAUS, T.; BERBERICH, T.; KARAS, M.;
BRÜGGEMANN, W. Comparative Analysis of Sorghum bicolor Proteome in Response to
Drought Stress and following Recovery. International Journal of Genomics, Cairo p. 1-11,
2014.
JIA, Y.; CHEN, H.; ZHANG, C.; GAO, L; WANG, X.; QIU, L.; WU, J. Proteomic analysis
of halotolerant proteins under high and low salt stress in Dunaliella salina using two-
dimensional differential in-gel electrophoresis. Genetics and Molecular Biology, North
Carolina, v. 39, p. 239-247, 2016.
KAMAL, A. H. M.; CHO, K.; KIM, D.; UOZUMI, N.; CHUNG, K.; LEE, S.; CHOI, J.;
CHOO, S.; SHIN, C.; WOO, S. H.; Changes in physiology and protein abundance in salt-
stressed wheat chloroplasts. Molecular Biology Reports, Berlin, v. 39, p. 9059-9074, 2012.
KANT, S.; KANT, P.; LIPS, H.; BARAK, S. Partial substitution of NO3- by NH4+
fertilization increases ammonium assimilating enzyme activities and reduces the deleterious
effects of salinity on the growth of barley. Journal of Plant Physiology, Amsterdam, v. 164,
p. 303-311, 2007.
KAUR, G.; SINGH, S.; SINGH, H.; CHAWLA, M.; DUTTA, T.; KAUR, H.; BENDER, K.;
SNEDDEN, W. A.; KAPOOR, S.; PAREEK, A.; SINGH, P. Characterization of Peptidyl-
Prolyl Cis-Trans Isomerase- and Calmodulin-Binding Activity of a Cytosolic Arabidopsis
thaliana Cyclophilin AtCyp19-3. PLOS ONE, San Francisco, v. 10, p. 1-21, 2015.
KAUR, D.; KAUR, A.; ARORA, S. Delineation of attenuation of oxidative stress and
mutagenic stress by Murraya exotica L. leaves. Springer Plus, Berlin, v. 5, p. 1-14, 2016.
97
KHAN, M. S.; AHMAD, D.; KHAN, M. A. Trends in genetic engineering of plants with (Na+
/H+) antiporters for salt stress tolerance. Biotechnology & Biotechnological Equipment,
London, v. 29, p. 815–825, 2015.
KRAPP, A. Plant nitrogen assimilation and its regulation: a complex puzzle with missing
pieces. Current Opinion in Plant Biology, Amsterdam, v. 25, p. 115-122, 2015.
KOMATSU, S.; KAMAL, A. H. M.; HOSSAIN, Z. Wheat proteomics: proteome modulation
and abiotic stress acclimation. Frontiers in Plant Science, Lausanne, v. 5, p. 1-19. 2014.
KURUSU, T.; KUCHITSU, K.; TADA, Y. Plant signaling networks involving Ca2+ and
Rboh/Nox-mediated ROS production under salinity stress. Frontiers in Plant Science,
Lausanne, v. 6, p. 1-8, 2015.
LACERDA, C. F.; CAMBRAIA, J.; CANO, M. A. O.; RUIZ, H. A.; PRISCO, J. T. Solute
accumulation and distribution during shoot and leaf development in two sorghum genotypes
under salt stress. Environmental and Experimental Botany, Amsterdam, v. 49, n.2, p.107-
120, 2003.
LACERDA, C. F.; CAMBRAIA, J.; OLIVA, M. A.; RUIZ, H. A. Changes in growth and in
solute concentration in sorghum leaves and roots during salt stress recovery. Environmental
and Experimental Botany, Amsterdam, v. 54, p. 69-76, 2005.
LAEMMLI, U. K. Cleavage of Structural Proteins during the Assembly of the Head of
Bacteriophage T4. Nature, London, v. 27, p. 680-685, 1970.
LEONOWICZ, G.; TRZEBUNIAK, K. F.; ZIMAK-PIEKARCZYK, P.; SLESAK, I.;
MYSLIWA-KURDZIEL, B. The activity of superoxide dismutases (SODs) at the early stages
of wheat deetiolation. PLOS One, San Francisco, v. 13, p 1-21, 2018.
LETERRIER, M.; BARROSO, J. M.; VALDERRAMA, R.; PALMA, J. M.; CORPAS, F. J.
NADP-Dependent Isocitrate Dehydrogenase from Arabidopsis Roots Contributes in the
Mechanism of Defence against the Nitro-Oxidative Stress Induced by Salinity. The Scientific
World Journal, Cairo, v. 2012, p. 1-9, 2012.
LI, W.; WEI, Z.; QIAO, Z.; WU, Z.; CHENG, L.; WANG, Y. Proteomics Analysis of Alfalfa
Response to Heat Stress. PLOS One, San Francisco, v. 8, p. 1-11, 2013.
LIU, X. D.; SHEN, Y. G. NaCl-induced phosphorylation of light harvesting
chlorophyll a/b proteins in thylakoid membranes from the halotolerant green alga, Dunaliella
salina. FEBS Letters, Hoboken, v. 569, p. 337 – 340, 2004.
LIU, C.; HSU, Y.; CHENG, Y.; YEN, H. ; WU, Y. ;WANG, C.; LAI, C. Proteomic analysis
of salt-responsive ubiquitin-related proteins in rice roots. Rapid Communications in Mass
Spectrometry, Hoboken, v.26, p. 1649-1660, 2012.
LIU, C.; CHANG, T.; HSU, Y.; WANG, A. Z.; YEN, H.; WU, Y.WANG, C.; LAI, C.
Comparative proteomic analysis of early salt stress responsive proteins in roots and leaves of
rice. Proteomics, Hoboken, v. 14, p. 1759-1775, 2014.
98
LIU, J.; WANG, W.; WU, H.; GONG, X.; MORIGUCHI, T. Polyamines function in stress
tolerance: from synthesis to regulation. Frontiers in Plant Science, Lausanne, v. 6, p. 1-10,
2015.
LU, W.; GUO, C.; LI, X.; DUAN, W.; MA, C.; ZHAO, M.; GU, J.; DU, X.; LIU, Z.; XIAO,
K. Overexpression of TaNHX3, a vacuolar Na+/H
+ antiporter gene in wheat, enhances salt
stress tolerance in tobacco by improving related physiological processes. Plant Physiology
and Biochemestry, Amsterdam, v. 76, p. 17–28, 2014.
LV, D. W.; SUBBURAJ, S.; CAO, M.; YAN, X.; LI, X.; APPELS, R. et al., Proteome and
phosphoproteome characterization reveals new response and defense mechanisms of
Brachypodium distachyon leaves under salt stress. Molecular & Cellular Proteomics,
Rockville, v. 13, p. 632-52, 2014.
MAATHUIS, F. J.; AHMAD, I.; PATISHTAN, J. Regulation of Na+ fluxes in plants.
Frontiers in Plant Science, Lausanne, v. 5, p. 1-9, 2014.
MALAVOLTA, E.; VITTI, G. C.; OLIVEIRA, S.A. Avaliação do estado nutricional das
plantas: Princípios e Aplicações. Associação Brasileira para Pesquisa da Potassa e do
Fosfato, Piracicaba, 1989.
MACHADO, R.M.A.; SERRALHEIRO, R.P. Soil Salinity: Effect on Vegetable Crop
Growth. Management Practices to Prevent and Mitigate Soil Salinization. Horticulturae,
Basel, v. 3, p. 1-13, 2017.
MANCARELLA, S.; ORSINI, F.; VAN OOSTEN, M. J.; SANOUBAR, R.;
STANGHELLINI, C.; KONDO, S.; GIANQUINTO, G.; MAGGIO, A. Leaf sodium
accumulation facilitates salt stress adaptation and preserves photosystem functionality in salt
stressed Ocimum basilicum. Environmental and Experimental Botany, Amsterdam, v. 130,
p. 162–173, 2016.
MASCLAUX-DAUBRESSE, C.; DANIEL-VEDELE, F.; DECHORGNAT, J.; CHARDON,
F.; GAUFICHON, L.; SUZUKI, A. Nitrogen uptake, assimilation and remobilization in
plants: challenges for sustainable and productive agriculture. Annals of Botany, Oxford, v.
105, p. 1141-1157, 2010.
MEKI, M. N.; SNIDER, J. L.; KINIRY, J. R.; RAPER, R. L.; ROCATELI, A. C. Energy
sorghum biomass harvest thresholds and tillage effects on soil organic carbon and bulk
density. Industrial Crops and Products, Amsterdam, v. 43, p.172-182, 2013.
MESQUITA, R. O.; SOARES, E. A.; BARROS, E. G.; LOUREIRO, M. E. Method
optimization for proteomic analysis of soybean leaf: improvements in identification of new
and low-abundance proteins. Genetics and Molecular Biology, North Carolina, v. 35, p. 353-
361, 2012.
MHAMDI, A.; MAUVE, C.; GOUIA, H.; SAINDRENAN, P.; HODGES, M.; NOCTOR, G.
Cytosolic NADP‐dependent isocitrate dehydrogenase contributes to redox homeostasis and
the regulation of pathogen responses in Arabidopsis leaves. Plant, Cell and Environment,
Hoboken, v. 33, p. 1112–1123, 2010.

99
MIRANDA, R. S.; ALVAREZ-PIZARRO, J. C.; ARAÚJO, C. M. S.; PRISCO, J. T.;
GOMES-FILHO, E. Influence of inorganic nitrogen sources on K+/Na+ homeostasis and salt
tolerance in sorghum plants. Acta Physiologiae Plantarum, Berlin, v. 35, p.841-852, 2013.
MIRANDA, R. S.; MESQUITA, R, O.; FREITAS, N. S.; PRISCO, J. T.; GOMES-FILHO, E.
Nitrate: ammonium nutrition alleviates detrimental effects of salinity by enhancing
photosystem II efficiency in sorghum plants. Revista Brasileira de Engenharia Agrícola e
Ambiental, Campina Grande, v.18, p. S8-S12, 2014.
MIRANDA, R. S.; GOMES-FILHO, E.; PRISCO, J. T.; ALVAREZ-PIZARRO, J. C.
Ammonium improves tolerance to salinity stress in Sorghum bicolor plants. Plant Growth
Regulation, Berlin, v. 78. p. 121-131, 2016.
MIRANDA, R. S.; MESQUITA, R, O.; COSTA, J. H.; ALVAREZ-PIZARRO, J. C.;
PRISCO, J. T.; GOMES-FILHO, E. Integrative control between proton pumps and SOS1
antiporters in roots is crucial for maintaining low Na+ accumulation and salt tolerance in
ammonium-supplied sorghum bicolor. Plant and Cell Physiology, Oxford, v. 58, p. 522-536,
2017.
MOMONOKI, Y. S.; YAMAMOTO, K.; OGURI, S. Molecular Cloning of Oxygen-Evolving
Enhancer Genes Induced by Salt Treatment in a Halophyte, Salicornia europaea L. Plant
Production Science, London, v. 12, p. 193-198, 2009.
MOSTEK, A.; BÖRNERB, A.; BADOWIECA. A.; WEIDNERA, S. Alterations in root
proteome of salt-sensitive and tolerant barley lines under salt stress conditions. Journal of
Plant Physiology, Amsterdam, v. 174, p. 166-176, 2015.
MORDUKHOVA, E. A.; PAN, J. Evolved cobalamin-independent methionine synthase
(MetE) improves the acetate and thermal tolerance of Escherichia coli. American Society for
Microbiology, United States of America, v. 79, p. 7905-7915, 2013.
MUCHATE, N. S.; NIKALJE, G. C.; RAJURKAR, N. S.; SUPRASANNA, P.; NIKAM,
T.D.; Plant Salt Stress: Adaptive Responses, Tolerance Mechanism and Bioengineering for
Salt Tolerance. Botanical Review. Berlin, v. 82, p. 371–406, 2016.
MUNNS, R. Comparative physiology of salt and water stress. Plant, Cell and Environment,
Hoboken, v. 25, p. 239-250, 2002.
MUNNS, R.; TESTER, M. Mechanisms of salinity tolerance. Annual Review of Plant
Biology, Palo Alto, v. 59, p. 651–681, 2008.
NASCIMENTO, H. H. C.; SANTOS, C. A.; FREIRE, C. S.; SILVA, M. A.; NOGUEIRA, R.
J. M. C. Osmotic adjustment in Jatobá seedlings subjected to salinity. Revista Árvore,
Viçosa, v. 39, p. 641-653, 2015.
NEUHOFF, V.; AROLD, N.; EHRHARDT, W. Improved staining of proteins in
polyacrylamide gels including isoelectric focusing gels with clear background at nanogram
sensitivity using Coomassie Brilliant Blue G-250 and R-250. Electrophoresis, Hoboken, v. 9,
p. 255-262, 1988.

100
NIEVES-CORDONES, M.; MARTÍNEZ-CORDERO, M. A.; MARTÍNEZ, V.; RUBIO, F.
An NH4+-sensitive component dominates high-affinity K
+ uptake in tomato plants. Plant
Science, Amsterdam, v. 172, p. 273-280, 2007.
NOCTOR, G.; FOYER, C. H. Intracellular redox compartmentation and ROS-related
communication in regulation and signaling. Plant Physiology, Rockville, v. 171, p. 1581–
1592, 2016.
OLIVEIRA, A. B.; GOMES-FILHO, E. Germinação e vigor de sementes de sorgo forrageiro
sob estresse hídrico e salino. Revista Brasileira de Sementes, Londrina, v. 31, p. 48-56,
2009.
OZYIGIT, I. I.; FILIZ, E.; VANTANSEVER, R. ; KURTOGLU, K. Y. ; KOC, I. ; ÖZTÜRK,
M. X. ; ANJUM, N. A. Identification and Comparative Analysis of H2O2-Scavenging
Enzymes (Ascorbate Peroxidase and Glutathione Peroxidase) in Selected Plants Employing
Bioinformatics Approaches. Frontiers in Plant Science, Lausanne, v. 7, p. 1-23, 2016.
PARIDA, A. K.; DAS, A. B. Salt tolerance and salinity effects on plants: a review.
Ecotoxicology and Environmental Safety, Amsterdam, v. 60, p. 324-349, 2005.
PEDROTTI, A.; CHAGAS, R. M.; RAMOS, V. C.; PRATA, A. P. N.; LUCAS, A. A. T.;
SANTOS, P. B. Causas e consequências do processo de salinização dos solos. Revista
Eletrônica em Gestão, Educação e Tecnologia Ambiental, Santa Maria, v. 19, p. 1308-
1324, 2015.
PRISCO, J. T.; GOMES-FILHO, E.; MIRANDA, R. S. Physiology and biochemistry of
plants growing under salt stress. In: GREYI, H. R.; DIAS, N.S.; LACERDA, C.F.; GOMES-
FILHO, E. (eds). Manejo da salinidade na agricultura: Estudos básicos e aplicados,
Fortaleza: Instituto Nacional de Ciência e Tecnologia em Salinidade, p.163-180, 2016.
QIN, N.; XU, W.; HU, L.; LI, Y. ; WANG, H. ; QI, X. ; FANG, Y. ; HUA, X. Drought
tolerance and proteomics studies of transgenic wheat containing the maize C4
phosphoenolpyruvate carboxylase (PEPC) gene. Protoplasma, Berlin, v. 253, p. 1503-1512,
2016.
RABEY, H. A. E.; AL-MALKI, A. L.; ABULNAJA, K. O. Proteome analysis of date palm
(Phoenix dactylifera L.) under severe drought and salt stress. International Journal of
Proteomics, Cairo, v. 2016, p. 1-8, 2016.
RAJAIE, M..; MOTIEALLAH, M. E. Ameliorative Effect of Ammonium Sulfate on Salt
Tolerance and Ion Homeostasis in Lemon (C. limon) Seedlings. International Journal of
Horticultural Science and Technology, Tehran, v. 5, p. 111-122, 2018.
RAMPITSCH, C.; SRINIVASAN, M. The application of proteomics to plant biology: a
review. Canadian Jornal of Botany, v. 84, p. 883-892, 2006.
RAZAVIZADEH, R.; EHSANPOUR, A. A.; AHSAN, N.; KOMATSU, S. Proteome analysis
of tobacco leaves under salt stress. Peptides, Amsterdam, v. 30, p. 1651-1659, 2009.

101
ROGOWSKA-WRZESINSKA, A.; LE BIHAN, M. C.; THAYSEN-ANDERSEN, M.;
ROEPSTORFF, P. 2D gels still have a niche in proteomics. Journal of Proteomics,
Amsterdam, v. 88, p. 4-13, 2013.
ROMERO, L. C.; AROCA. M. A.; LAUREANO-MARÍN, A. M. MORENO, I.; GARCÍA, I.;
GOTOR, C. Cysteine and cysteine-related signaling pathways in Arabidopsis thaliana.
Molecular Plant, Amsterdam v. 7, p. 264-276, 2014.
SALEETHONG, P.; ROYTRAKUL, S.; KONG-NGERN, K.; THEERAKULPISUT, P.
Differential Proteins Expressed in Rice Leaves and Grains in Response to Salinity and
Exogenous Spermidine Treatments. Rice Science, Amsterdam, v. 23, p. 09-21, 2016.
SAXENA, S. C.; KAUR, H.; VERMA P.; PETLA, B. P.; ANDUGULA, V. R.; MAJEE, M.
Osmoprotectants: potential for crop improvement under adverse conditions. In: TUTEJA, N.;
GILL, S. S. (eds). Plant Acclimation to Environmental Stress. New York: Springer, p.
197–232, 2013.
SHABALA, S. Learning from halophytes: Physiological basis and strategies to improve
abiotic stress tolerance in crops. Annals of Botany, Oxford, v. 112, p.1209–1221, 2013.
SHAFI, A., PAL, A. K.; SHARMA, V.; KALIA, S.; KUMAR, S.; AHUJA, P. S.; SINGH, A.
K. Transgenic potato plants overexpressing SOD and APX exhibit enhanced lignification and
starch biosynthesis with improved salt stress tolerance. Plant Molecular Biology Reporter.
Berlin, v. 35, p. 504-518, 2017.
SHAO, Q.S.; SHU, S.; DU, J.; XING, W.W.; GUO, S.R.; SUN, J. Effects of NaCl stress on
nitrogen metabolism of cucumber seedlings. Russian Journal of Plant Physiology, Berlin, v.
62, p. 595-603, 2015.
SCHORTEMEYER, M. STAMP, P.; FEIL, B. Ammonium tolerance and carbohydrate status
in maize cultivars. Ann Bot-London, London, v. 79, p. 25-30, 1997.
SHEVCHENKO, A.; TOMAS, H.; HAVLIS, J.; OLSEN, J. V.; MANN, M. In-gel digestion
for mass spectrometric characterization of proteins and proteomes. Nature Protocols,
London, v. 1, p. 2856-2880, 2006.
SHI, J.; CHEN, Y.; XU, Y.; JI, D.; CHEN, C.; XIE. C. Differential Proteomic Analysis by
iTRAQ Reveals the Mechanism of Pyropia haitanensis Responding to High Temperature
Stress. Scientific Reports, London, v. 7, p. 1-11, 2017.
SHINOZAKY, K.; UEMARA, M.; BAILEY-SERRES, J.; BRAY, E. A.; WERETILNYK, E.
Responses to abiotic stresses. In: BUCHANAN, B.; GRUISSEM, W.; JONES, R. L.
Biochemistry and Molecular Biology of Plants, Hoboken, 2 ed. Rockville: American
Society of Plant Physiologists, p. 1051-1100, 2015.
SHRIVASTAVA, P.; KUMAR, R. Soil salinity: A serious environmental issue and plant
growth promoting bacteria as one of the tools for its alleviation. Saudi Jornal of Biological
Sciences, Amsterdam, v. 22, p. 123-131, 2015.

102
SILVA, J. V.; LACERDA, C. F.; AZEVEDO-NETO, A. D.; COSTA, P. H. A.; PRISCO, J.
T.; ENÉAS-FILHO, J.; GOMES-FILHO, E. Growth and osmorregulation in two sorghum
genotypes under salt stress. Revista Ciência Agronômica, Fortaleza, v. 34, p. 125 – 131,
2003.
SILVEIRA, J. A. G.; CARVALHO, F. E. L. Proteomics, photosynthesis and salt resistance in
crops: An integrative view. Journal of Proteomics, Amsterdam, v. 143, p. 24-35, 2016.
SINGH, M.; KUMAR, J.; SINGH, S.; SINGH, V. P.; PRASAD, S. M. Roles of
osmoprotectants in improving salinity and drought tolerance in plants: a review. Reviews in
Environmental Science and Biotechnology, Berlin v. 14, p. 407–426, 2015.
SMITH, C. W.; FREDERIKSEN, R. A. Sorghum: Origin, History, Technology and
Production, p. viii. Wiley, New York, 2000.
SOBHANIAN, H.; RAZAVIZADEH, R.; NANJO, Y.; EHSANPOUR, A. A.; JAZII, F. R.;
MOTAMED, N.; KOMATSU, S. Proteome analysis of soybean leaves, hypocotyls and roots
under salt stress. Proteome Science, London, v. 8, p. 1-15, 2010.
SOBHANIAN, H.; AGHAEI, K.; KOMATSU, S. Changes in the plant proteome resulting
from salt stress: Toward the creation of salt-tolerant crops? Journal of Proteomics,
Amsterdam, v. 74, p. 1323-1337, 2011.
STRÖHER, E.; DIETZ, K. J. Concepts and approaches towards understanding the cellular
redox proteome. Jounal of Plant Biology, Berlin, v.8, p. 407-418, 2006.
SWAMI, A. K.; ALAMB, S. I.; SENGUPTAB, N.; SARINA, R. Differential proteomic
analysis of salt stress response in Sorghum bicolor leaves. Environmental and
Experimental Botany, Amsterdam, v. 71, p. 321-328, 2011.
TALEI, D.; VALDIANI, A.; RAFIIM, Y.; MAZIAH, M. Proteomic analysis of the salt-
responsive leaf and root proteins in the anticancer plant Andrographis paniculata Nees.
PLOS One, San Francisco, v. 9, p. 1-10, 2014.
TERRA, T. G. R.; LEAL, T. C. A. B.; SIEBENEICHLER, S.; C.; CASTRO, D. V.; DIAS
NETO, J. J.; DOS ANJOS, L. M. Desenvolvimento e produtividade de sorgo em função de
diferentes densidades de plantas. Bioscience Journal, Uberlandia, v. 26, p. 208-215, 2010.
THAGELA, P.; YADAV, R. K.; DAHUJA, A.; SINGH, P. K.; ABRAHAM, G. Physiological
and proteomic changes in Azolla microphylla roots upon exposure to salinity. Indian
Journal of Biotechnology, New Delhi, v. 15, p. 101-106, 2016.
Trösch, R.; Mühlhaus, T.; Schroda, M.; Willmund, E. ATP-dependent molecular chaperones
in plastids--More complex than expected. Biochimica et Biophysica Acta (BBA) –
Bioenergetics, Amsterdam, v. 1847, p. 872-888, 2015.
VAIDYANATHAN, H.; SIVAKMUR, P.; CHAKRABARTY, R.; THOMAS, G. Scavenging
of reactive oxygen species in NaCl-stressed rice (Oryza sativa L.) —differential responses in
salt-tolerant and sensitive varieties. Plant Science, Amsterdam, v. 165, p. 1411–1418, 2003.

103
VENUTO, B.; KINDIGER, B. Forage and biomass feedstock production from hybrid forage
sorghum and sorghum–sudangrass hybrids. Grassland Science, v. 54, p. 189–196, 2008.
VITÁRNVÁS, P.; URBAN, M. O.; ŠKODAČEK, Z.; KOSOVÁ, K.; PITELKOVÁ, I.;
VÍTÁMVÁS, J.; RENAUT, J.; PRAŠIL, I. T. Quantitative analysis of proteome extracted
from barley crowns grown under different drought conditions. Frontiers in Plant Science,
Lausanne, v. 6, p. 1-18, 2015.
WAN, X. Y.; LIU, J. Y. Comparative Proteomics Analysis Reveals an Intimate Protein
Network Provoked by Hydrogen Peroxide Stress in Rice Seedling Leaves. Molecular &
Cellular Proteomics, Rockville, v. 6, p. 1469-1488, 2008.
WANG, H., WU, Z., HAN, J., ZHENG, W., YANG, C. Comparison of Ion Balance and
Nitrogen Metabolism in Old and Young Leaves of Alkali-Stressed Rice Plants. PloS One,
San Francisco, v. 7, p, 1-10, 2012.
WANG, X.; CHANG, L.;WANG, B.; WANG, D.; LI, P.; WANG, L.; YI, X.; HUANG, Q.;
PENG, M.; GUO, A. Comparative proteomics of Thellungiella halophila leaves from plants
subjected to salinity reveals the importance of chloroplastic starch and soluble sugars in
halophyte salt tolerance. Molecular and Cellular Proteomics, Rockville, v. 12, p. 2174-
2195, 2013.
WANG. J.; MENG, Y.; LI, B.; MA, X.; LAI, Y.; SI, E.;YANG, K.; XU, X.; SHANG, X.;
WANG, H.; WANG, D. Physiological and proteomic analyses of salt stress response in the
halophyte Halogeton glomeratus. Plant, Cell & Environment, Hoboken, v. 38, p. 655-669,
2015.
WHITFIELD, M. B.; CHINN M. S.; VEAL, M. W. Processing of materials derived from
sweet sorghum for biobased products. Industrial Crops and Products, Amsterdam, v. 37, p.
362–375, 2012.
WILKINS, M. R. ; SANCHEZ, J. C.; GOOLEY, A. A.; APPEL, R. D. HUMPHERY-
SMITH, I.; HOCHSTRASSER, D. F.; WILLIAMS, K. L.. Progress with proteome projects:
why all proteins expressed by a genome should be identified and how to do it. Biotechnology
& Genetic Engineering Reviews, London v. 13, p. 19-50, 1996.
WU, Z.; ZHANG, W.; XU, S.; SHI, H.; WEN, D. ; HUANG, Y.; PENG, L.; DENG, T.; DU.,
R.; LI, F.; WANG, X.; WANG, F. Increasing ammonium nutrition as a strategy for inhibition
of cadmium uptake and xylem transport in rice (Oryza sativa L.) exposed to cadmium stress.
Environmental and Experimental Botany, Amsterdam, v.155, p. 734 – 741, 2018.
XIONG, J.; SUN, Y.; YANG, Q.; TIAN, H.; ZHANG, H.; LIU, Y.; CHEN, M. Proteomic
analysis of early salt stress responsive proteins in alfalfa roots and shoots. Proteome Science,
London, v. 15:19, p. 1-19, 2017.
XU, G.; FAN, X.; MILLER, A. J. Plant nitrogen assimilation and use efficiency. Annual
Review of Plant Biology, Palo Alto, v. 63, p.153–182, 2012.
104
YADAV, N. S.; SHUKLA, P. S.; JHA, A.; AGARWAL, P. K.; JHA, B. The SbSOS1 gene
from the extreme halophyte Salicornia brachiata enhances Na+ loading in xylem and confers
salt tolerance in transgenic tobacco. BMC Plant Biology, Berlin, v.12, p. 1-18, 2012.
YAMAGUCHI, T.; HAMAMOTO, S.; UOZUMI, N. Sodium transport system in plant cells.
Frontiers in Plant Science, Lausanne, v. 4, 401 p. 1-7, 2013.
YAN, K.; CHEN, P.; SHAO, H.; ZHAO, S.; ZHANG, L.; ZHANG, L.; XU, G.; SUN, J.
Responses of photosynthesis and photosystem II to higher temperature and salt stress in
sorghum. Journal of Agronomy and Crop Science, Hoboken, v.198, p. 218-225, 2012.
YAN, H.; LI, Q.; PARK, S. C.; WANG, X.; LIU, Y-JU; ZHANG, Y-G; TANG, W.; KOU,
M.; MA, D-F. Overexpression of CuZnSOD and APX enhance salt stress tolerance in sweet
potato. Plant Physiology and Biochemistry, Amsterdam, v. 109, p. 20–27, 2016.
YANG, L.; ZHANG, Y.; ZHU, N.; KOH, J.; MA, C.; PAN, Y.; YU, B.; CHEN, S.; LI, H.
Proteomic Analysis of Salt Tolerance in Sugar Beet Monosomic Addition Line M14. Journal
of Proteome Research, Washington D. C., v. 12, p. 4931-4950, 2013.
Yousuf, P. Y.; Ahmad, A.; Ganie, A. H.; Sareer, O.; Krishnapriya, V.; Aref, I. M.
ANTIOXIDANT response and proteomic modulations in Indian mustard grown under salt
stress. Plant Growth Regulation, Berlin, v. 81, p. 31-50, 2017.
ZARGOCHEV, L.; SEAL, C. E.; KRANNER, I.; ODJAKOVA, M. A central role for thiols
in plant tolerance to abiotic stress. International Journal of Molecular Sciences, v. 14, p.
7405-7432, 2013.
ZHANG, J. L.; SHI, H. Physiological and molecular mechanisms of plant salt tolerance.
Photosynthesis Research, Berlin, v. 115, p. 1-22, 2013.
ZHANG, M.; FANG, Y.; JI, Y.; JIANG, Z.; WANG, L. Effects of salt stress on ion content,
antioxidant enzymes and protein profile in different tissues of Broussonetia papyrifera. South
African Journal of Botany, Amsterdam, v. 85, p. 1-9, 2013.
ZHANG, Y.; SUN, M.; ZHANG, Q. Proteomic analysis of the heat stress response in leaves
of two contrasting chrysanthemum varieties. Plant Omics Journal, Brisbane, v. 7, p. 229-
236, 2014.
ZHANG, W.; ZHANG, H.; NING, L.; LI, B.; BAO, M. Quantitative proteomic analysis
provides novel insights into cold stress responses in petunia seedlings. Frontiers in Plant
Science, Lausanne, v. 7, p. 1-13, 2016.
ZHONG, F.; WANG, S.; LIN, J.; ROAN, S.F.; LIN, B.; ZHOU, X.; CHEN, I.; LIN, Y.;
PANG, J. Characterization of nitrate assimilation in Lactuca sativa L. under different
nitrogen sources. Plant Growth Regulation, Berlin, v. 86, p. 1-10, 2018.
ZHONGHUA, T.; YANJU, L.; XIAORUI, G.; YUANGANG Z. The combined effects of
salinity and nitrogen forms on Catharanthus roseus: the role of internal ammonium and free
amino acids during salt stress. Journal of Plant Nutrition and Soil Science, Hoboken, v.174,
p. 135–144, 2011.