Embed Size (px)
Citation preview

Universidade de Lisboa
Faculdade de Farmácia
Departamento de Sócio-Farmácia
Assessing drug information sources
For healthcare professionals
Blanca Carolina Argüello Magaz
Doutoramento em Farmácia
Especialidade Sócio-Farmácia
2013

Universidade de Lisboa
Faculdade de Farmácia
Departamento de Sócio-Farmácia
Assessing drug information sources
For healthcare professionals
Blanca Carolina Argüello Magaz
Tese orientada pelo Professor Doutor Fernando Fernández-Llimós,
especialmente elaborada para a obtenção do grau de Doutor em
Farmácia, especialidade Sócio-Farmácia.
2013

i
Declaration
This thesis describes research conducted in the Faculty of Pharmacy, University of Lisbon
and in the Faculty of Pharmacy, Katholieke Universiteit Leuven (Belgium), under the
supervision of Professor Fernando Fernández-Llimós, Associate Professor at the Faculty of
Pharmacy, University of Lisbon and principal investigator of the Research Institute for
Medicines and Pharmaceutical Sciences (iMed.UL).
The research presented in this thesis is, to the best of my knowledge, original, except as
acknowledged in the text. No proportion of this work has been submitted in part or whole for
the award of a degree at any other university. Full acknowledgement has been made where
the work of others has been cited or used. Blanca Argüello participated in the conception,
analysis and interpretation of data, and manuscript preparation.
This thesis will be presented to request the attribution of the European Doctor title under
University regulations. As a prerequisite the candidate performed a three-month research
period at the Katholieke Universiteit Leuven (Belgium), under the supervision of Professor
Gert Laekeman Head of the Research Centre for Pharmaceutical Care and Pharmaco-
Economics.
This study has not received any external funding.
The author declares there is no conflict of interest related to this research.
Blanca C. Argüello
MSc.(Pharm)
Faculty of Pharmacy, University of Lisbon
ii
Acknowledgements
A major research project like this is never the work of anyone alone. The contributions of
many different people, in their different ways, have made this possible. I would like to extend
my appreciation especially to the following:
Foremost, I would like to express my sincere gratitude to my supervisor, Prof. Fernando
Fernandez-Llimos for his unselfish and continued support throughout the research project,
for his motivation, enthusiasm, and knowledge. His valuable guidance helped me during all
the time of research and writing of this thesis. Special thanks to his wife Isabel for her
patience and understanding. I would like to thank Prof. Gert Laekeman, with whom I have
had the pleasure of sharing the research period for the European Doctorate, for his valuable
guidance and advice, and for welcoming me in Leuven University.
Amongst my fellow postgraduate students, I am very grateful to Teresa for her interest, for
our debates, exchange of knowledge and helping me to become integrated with the
Portuguese language and Portuguese system. I also want to thank my colleagues in the
Pharmacy (Ana S. and Ana T.) for their support and understanding. Not forgetting my best
friends who have always been there (Mary, Alejandra and Patricia): thank you for all the
good times together.
Thanks to my parents who have always supported and encouraged me to do my best in all
areas of life. I wish to thank my father for the education and life principles that he has taught
me. In 1985 he dedicated his thesis to me, and he has encouraged me learn to love research
since I was a child. Thank you to my mother for her unconditional support, interest, true love
and excitement and happiness about my projects. Thank you for all your care and patience.
Thanks to my grandfather Amable for being so proud of me and my projects, and for his
lessons about life. Thanks to Tomasa for her sincere interest, support and for having
welcomed me into her heart.
And finally, thanks to the love of my life, Joseba, because without him I would not be who I
am today. Thank you for staying by my side all this time, for your love, constant support,
encouragement, understanding, and shared life together. Thank you for making me begin
each day with a smile. You make my life happy.

iii
Resumo
A informação de alta qualidade é a base para a provisão de cuidados de saúde de alta
qualidade. O objectivo deste estudo foi analisar as características das fontes de informação
sobre medicamentos dirigidas a profissionais de saúde.
Inicialmente, avaliámos as preferências dos profissionais de saúde e investigadores de todo
o mundo aquando da selecção de fontes de informação sobre medicamentos. Tendo como
objectivo abranger a população global, desenhámos um questionário online para o efeito.
Obtivemos respostas válidas de 107 países diferentes (56.5% dos 191 países analisados,
após terem sido excluídos dois), compreendendo 88.3% da população mundial. Os
resultados mostraram que na generalidade os livros de referência de medicamentos,
também designados compêndios de medicamentos, são as principais fontes de informação
utilizadas entre os profissionais de saúde, seguidas da informação de Internet e as revistas
científicas. Variáveis demográficas e socio-económicas como ser membro da Organização
para a Cooperação e Desenvolvimento Económico (OCDE), Produto Interno Bruto (PIB) per
capita, percentagem do PIB como despesa da saúde e Índice de Desenvolvimento Humano
(IDH) foram significativamente associados com a escolha de livros de referência de
medicamentos como fontes preferenciais de informação. Na Europa, os livros de referência
de medicamentos foram as fontes preferenciais de informação, seguidos da informação de
Internet e dos Resumos das Características dos Medicamentos (RCMs).
A publicação de compêndios de medicamentos no mundo foi igualmente avaliada e, dos 193
países existentes no mundo, 84 reportaram publicar um compêndio nacional. Estes países
representaram aproximadamente 62% da população mundial. Numa análise multivariada,
verificou-se que ser membro da OCDE estava positivamente associado e Francês como
língua oficial negativamente associado com a publicação de compêndios. Não se encontrou,
contudo, qualquer associação significativa entre outras covariáveis demográficas e
socioeconómicas, tais como população, PIB per capita e indicadores de cuidados de saúde,
e a publicação de compêndios pelos países. Países sem compêndios nacionais referiram
utilizar compêndios estrangeiros de países desenvolvidos, sendo o British National
Formulary (BNF) o mais citado, seguido do Dictionnaire Vidal. Em 2002, a Organização
Mundial de Saúde (OMS) publicou a primeira edição do Formulário Modelo da OMS, cujo
objectivo era servir como ‘modelo’ para os governos nacionais e instituições que quisessem
desenvolver os seus próprios compêndios e complementar a Lista Modelo de Fármacos
Essenciais da OMS. Nenhum dos países sem um compêndio nacional reportou o uso do

iv
Formulário Modelo da OMS. Existe, por isso, oportunidade para criar um compêndio
internacional de medicamentos sob a alçada da OMS.
Na Europa, a fonte de informação oficial sobre medicamentos para profissionais de saúde é
o Resumo das Características do Medicamento (RCM). Os RCMs foram definidos como “a
base da informação para profissionais de saúde de como utilizar o produto medicinal de
forma segura e efectiva”. O RCM representa uma posição acordada sobre o produto
medicinal entre as entidades reguladoras e os fabricantes, resultante de um processo de
avaliação do produto. Primeiro, procurámos analisar o conteúdo da informação
farmacológica nos RCMs e compará-la com a informação farmacológica contida em outras
fontes oficiais de informação: os folhetos informativos. Com este intuito, utilizámos uma
checklist desenvolvida por Spyker et al. contendo 31 itens de informação. Os resultados
obtidos mostraram que a informação farmacológica encontrada nos RCMs analisados não
poderia ser considerada suficiente. A média da classificação obtida para os RCMs atingiu
apenas 35.2% da classificação máxima possível. Comparando com estudos anteriores
realizados nos Estados Unidos, o conteúdo da informação do Physicians’ Desk Reference
(PDR) foi muito semelhante aos resultados obtidos para os RCMs. A média de classificação
dos folhetos informativos foi apenas 15.9% da classificação máxima possível. O conteúdo
em informação farmacológica neste caso é escasso, mas como os folhetos informativos se
destinam aos doentes em geral, essa informação não se revela necessária. Na verdade, a
inclusão de informação científica aprofundada iria influenciar negativamente a legibilidade
dos folhetos informativos, pelo que se prefere o uso de termos concisos, úteis e
compreensíveis.
Um outro objectivo da investigação foi analisar a informação contida nos RCMs referente ao
uso de medicamentos na gravidez, lactação e em mulheres com potencial para engravidar.
Para tal, foi desenhado um formulário ad-hoc incluindo 18 questões relativas à informação
contida nos RCMs sobre estudos pré-clínicos, ensaios clínicos, vigilância pós-
comercialização, passagem da barreira placentária, influência do fármaco na fertilidade, uso
do fármaco em mulheres com potencial para engravidar, manejo da exposição, excreção no
leite materno, potenciais reacções adversas em lactentes e recomendações para o uso
durante a gravidez e aleitamento. Os resultados revelaram que menos de 17% dos RCMs
possuíam informação sobre experiência clínica em mulheres grávidas. De entre os RCMs
que relatavam ter conduzido ensaios clínicos em mulheres grávidas ou mencionavam dados
de vigilância pós-comercialização, 86% forneciam uma descrição de reacções adversas
obtidas no decurso dos ensaios clínicos ou resultante da experiência clínica. A percentagem
v
de RCMs incluindo informação acerca da passagem (ou não) do fármaco através da barreira
placentária foi de 10%. No que toca à fertilidade, 79% dos RCMs não forneciam qualquer
informação sobre os efeitos do produto medicinal na fertilidade humana e 18% declaravam
que estes efeitos não eram conhecidos. A informação acerca de potenciais efeitos do
produto medicinal em mulheres com potencial para engravidar não foi fornecida em 71% dos
RCMs. Cerca de 13% dos RCMs mencionaram alguma informação sobre o manejo da
exposição ao produto medicinal em mulheres grávidas. A informação acerca da excreção
(ou não) do fármaco no leite materno estava presente em 17% RCMs. Dos RCMs que
referiam a excreção do fármaco no leite materno, 89% não forneciam qualquer informação
sobre reacções adversas em lactentes. Uma percentagem elevada de RCMs continha
declarações não conclusivas em relação ao uso do produto medicinal durante a gravidez
(57%) e aleitamento (17%). O uso do produto medicinal foi restringido em 95% dos RCMs
durante a gravidez e 92% durante o aleitamento.
Após a análise das características específicas de determinadas fontes de informação sobre
medicamentos, propusemo-nos criar uma ferramenta universal que permitisse avaliar o
conteúdo e a compleção de qualquer tipo de fonte de informação direcionada a profissionais
de saúde. Para tal, criou-se uma lista de 162 itens de informação estruturados em 11
secções (características do produto medicinal, uso do fármaco, contraindicações, reacções
adversas, interacções, sobredosagem, propriedades farmacodinâmicas, propriedades
farmacocinéticas, dados de segurança, evidência, e dados de prescrição), a qual foi
avaliada e refinada recorrendo a uma técnica Delphi em 3 rondas que contou com a
participação de 29 peritos de 18 países Europeus, recrutados de entre profissionais de
saúde com conhecimento e experiência em informação sobre medicamentos. A aplicação da
técnica de Delphi resultou em 126 itens de informação definidos pelos participantes como
informação essencial a constar em qualquer fonte de informação sobre medicamentos para
profissionais de saúde. Os peritos chegaram também a um consenso no que toca à
ponderação de cada item de informação com base na sua importância. Para avaliar a
compleção de qualquer fonte de informação para profissionais de saúde, a presença de
cada item de informação deverá ser confirmada na fonte analisada, e a classificação final
deverá ser obtida pelo somatório dos itens tendo em conta a respectiva ponderação. Esta
ferramenta permite apresentar a compleção de uma fonte de informação expressa em
percentagem da fonte de informação ideal.

vi
Palavras-Chave1: Serviços de Informação sobre Medicamentos; Rotulagem de
Medicamentos; Obras de Referência; Pessoal de Saúde; Controle de Qualidade.
1 Palavras-chaves extraídas da base de dados dos Medical Subject Headings e traduzidas da versão
em português dos Descritores de Ciências da Saúde

vii
Abstract
Our objective was to assess the characteristics of medicines information sources designed
for healthcare professionals.
Using a global web-based survey, we identified that medicines compendia are the leading
information source among healthcare professionals, followed by Internet and scientific
journals. Out of 193 countries in the world, 132 answered the survey, with 84 of them
reporting that a national compendium is published in their country. Being member of the
OECD was associated with publishing a national compendium. Other demographic and
socio-economic covariates were not associated to this fact. Countries not publishing their
national compendium reported the British National Formulary as the most commonly used
compendium.
When assessing Summaries of Product Characteristics (SmPCs), we found that their content
on clinical pharmacology information is insufficient. Information on this topic was found to be
very similar to the content of the US Physicians’ Desk Reference.
Completeness and applicability of the information about the use of medicines in pregnancy
and breastfeeding in SmPCs did not appear as remarkable. Information resulting from post-
marketing surveillance is sparse, as well as information on the management of exposure to
the medicinal product in pregnant woman or excretion of the drug in human milk. The
majority of the SmPCs contained non-conclusive statements regarding the use of the
medicinal product during pregnancy and breastfeeding. The use of medicines during
pregnancy and lactation is restricted for most SmPCs.
A three-round Delphi technique with 29 experts from 18 European countries was used to
design a tool to evaluate the completeness of any medicines information source for
healthcare professionals. Starting from a 162-item list, experts identified 126 items as
essential information to be included in any kind of medicines information source. The
resulting scoring tool allows assessment of the completeness of a medicines information
source as a percentage of the ideal source.
Keywords2: Drug Information Services; Drug Labeling; Reference Books; Health Personnel;
Quality Control
2 Keywords extracted from the Medical Subject Headings database

viii
List of Abbreviations
ADR: Adverse Reaction
AFRO: Africa WHO Regional Office
AGREE: Appraisal Guideline Research and Evaluation Europe
AHFS-DI: American Hospital Formulary Service-Drug Information
AIDS: Acquired Immunodeficiency Syndrome
AMRO: Americas WHO Regional Office
ASHSP: American Society of Health Systems Pharmacists
ATC: Anatomical Therapeutic Chemical
BNF: British National Formulary
CHMP: Committee for Medicinal Products for Human Use
CIA: Central Intelligence Agency
CPS: Compendium of Pharmaceuticals and Specialties
EFPIA: European Federation of Pharmaceutical Industries and Associations
EPAR: European Public Assessment Report
EMA: European Medicines Agency
EMRO: Eastern Mediterranean WHO Regional Office
EU: European Union
EURO: Europe WHO Regional Office
FDA: Food and Drug Administration
GCC: Gulf Cooperation Council
GDP: Gross Domestic Product
HALE: Healthy Life Expectancy
HDI: Human Development Index
HINARI: Health InterNetwork Access to Research Initiative
HIV: Human Immunodeficiency Virus
MeSH: Medical Subject Headings
MIMS: Monthly Index of Medical Specialties
NCCN: National Comprehensive Cancer Network
OECD: Organisation for Economic Cooperation and Development
PABAK: Prevalence-Adjusted Bias-Adjusted Kappa
PDR: Physicians’ Desk Reference
SD: standard deviation
SEARO: South-East Asia WHO Regional Office
SmPC: Summary of Product Characteristics

ix
UK: United Kingdom
US: United States
WHO: World Health Organization
WPRO: Western Pacific WHO Regional Office

x
Publications and Communications
Publications
Peer-Reviewed Publications
Arguello, B; Fernandez-Llimos, F. Factors associated with worldwide medicines
compendia publishing. International Journal of Clinical Pharmacy 2013 Mar 28. [Epub
ahead of print]
Maxwell, S; Eichler, HG; Bucsics, A; et al. e-SPC - delivering drug information in the
21st century: developing new approaches to deliver drug information to prescribers.
British Journal of Clinical Pharmacology 2012;73 (1):12-15
Arguello, B; Fernandez-Llimos, F. Clinical pharmacology information in summaries of
product characteristics and package inserts. Clinical Pharmacology and therapeutics
2007;82:566-571
Arguello, B; Fernandez-Llimos, F. Professionals' access to drug package inserts.
Atencion Primaria 2007;39 (4):219
Scientific Communications
Salgado TM, Arguello B, Benrimoj SI, Fernandez-Llimos F. “Discordances in the
classification of renal impairment in summaries of product characteristics”. International
Pharmaceutical Federation (FIP) Centennial Congress, Amsterdam, October 2012.
Salgado, T; Arguello, B; Benrimoj, S; Fernandez-Llimos, F. 2012. "Discordances in the
classification of renal impairment in summaries of product characteristics", 49th ERA-
EDTA Congress, Paris.
Salgado, T; Arguello, B; Benrimoj, S; Fernandez-Llimos, F. 2012. "Discordances in the
Classification of Renal Impairment in Summaries of Product Characteristics", 72nd
International Congress of FIP, In Proceedings, Amsterdam.
Arguello, B; Laekeman, G; Fernandez-Llimos, F. 2011. "Designing a tool to assess
completeness in drug information sources for healthcare professionals", 7th PCNE
Working Conference, Manchester.

xi
Arguello, B; Laekeman, G; Fernandez-Llimos, F. 2011. "Designing a tool to identify the
minimum content required in a drug information source for healthcare professionals", 7th
PCNE Working Conference, Manchester.
Arguello, B; Laekeman, G; Fernandez-Llimos, F. 2011. "Assessing drug information
sources for healthcare professionals: designing a tool", 23rd Drug Information
Association Annual Euromeeting, In Proceedings, Geneva.
Arguello, B; Fernandez-Llimos, F. 2009. "Factors associated to medicines compendia in
different countries", 38th Symposium on Clinical Pharmacy, Geneva.
Arguello, B; Fernandez-Llimos, F. 2008. "Medicines compendia used in countries lacking
a national one", 37th European Symposium on Clinical Pharmacy, Dubrovnik.
Arguello, B; Fernandez-Llimos, F. 2008. "Information sources used by health care
professionals: a world survey", 37th European Symposium on Clinical Pharmacy,
Dubrovnik.
Arguello, B; Fernandez-Llimos, F. 2008. "Assessing participation in a global web-based
survey", 15th International Social Pharmacy Workshop, In Proceedings, Queenstown
(New Zealand).
Arguello B. 2007. "Clinical Pharmacology information in Summaries of Product
Characteristics". Simpodader, San Sebastian (Spain)

xii
List of Tables
Chapter 3: Assessment of medicines information sources used by healthcare
professionals and researchers in the World
Table 03-01: Questionnaire: areas of work of participants
Table 03-02: Questionnaire: first-choice medicines information sources of participants
Table 03-03: Average number of e-mail addresses per country grouped by continent
Table 03-04: Average number of delivered e-mail addresses per country grouped by
continent
Table 03-05: Association of response rate per country with categorical covariates.
Table 03-06: Correlations of response rate per country with continuous variables
Table 03-07: Characteristics of respondents and non-respondent countries regarding
quantitative covariates.
Table 03-08: Characteristics of respondents and non-respondent countries regarding
categorical covariates.
Table 03-09: Distribution of preferred information sources
Table 03-10: Characteristics of respondents selecting internet/not selecting internet
as preferred information source regarding categorical covariates
Table 03-11: Characteristics of countries of respondents selecting internet/not
selecting internet as preferred information source regarding quantitative covariates.
Table 03-12: Characteristics of respondents selecting/not selecting the
pharmaceutical industry as preferred information source regarding categorical
covariates.
Table 03-13: Characteristics of countries of respondents selecting/not selecting the
pharmaceutical industry as preferred information source regarding quantitative
covariates.
Table 03-14: Characteristics of respondents selecting/not selecting reference books
as preferred information source regarding categorical covariates.
Table 03-15: Characteristics of countries of respondents selecting/not selecting
reference books as preferred information source regarding quantitative covariates.
Table 03-16: Characteristics of respondents selecting/not selecting scientific journals
as preferred information source regarding categorical covariates.
Table 03-17: Characteristics of countries of respondents selecting/not selecting
scientific journals as preferred information source regarding quantitative covariates.

xiii
Table 03-18: Characteristics of respondents selecting/not selecting SmPCs as
preferred information source regarding categorical covariates.
Table 03-19: Characteristics of countries of respondents selecting/not selecting
SmPCs as preferred information source regarding quantitative covariates.
Chapter 4: Factors associated with worldwide medicines compendia publishing
Table 04-01: Characteristics of countries reporting having a compendium/not having a
compendium regarding quantitative covariates.
Table 04-02: Characteristics of countries reporting having a compendium/not having a
compendium regarding categorical covariates.
Table 04-03: Mean of quantitative covariates for countries using foreign compendia
and countries issuing those compendia
Chapter 5: Clinical Pharmacology Information in Summaries of Product
Characteristics and Package Inserts
Table 05.01: Clinical pharmacology information of package inserts summarized by
categories
Table 05.02: Clinical pharmacology information of SmPCs summarized by categories
Table 05.03: Results of Spyker’s scoring system for the 91 SmPCs and the 108
package inserts analysed
Chapter 6: Assessment of completeness of Summaries of Product characteristics
regarding fertility and use of medicines in pregnancy and lactation
Table 06-01: FDA categories for drug use in pregnancy
Table 06-02: Australian and Swedish categories for drug use in pregnancy
Table 06-03: Questions and answers in the designed database
Table 06-04: Results of application of exclusion criteria by two independent raters
Table 06-05: Inter-rater agreement
Table 06-06: Results of application of exclusion criteria
Chapter 7: Universal tool to evaluate the content of drug information sources for
healthcare professionals
Table 07-01: Initial questionnaire
Table 07-02: Consensus achieved in the first round (by sections of items)
Table 07-03: New items added by members of the Delphi panel after first round

xiv
Table 07-04: Accumulated consensus achieved after the second round (by groups of
items)
Table 07-05: Accumulated consensus achieved after the third round (by groups of
items)
Table 07-06: Evolution of number of items in each section during the rounds
Table 07-07: Consensus list of essential items
Table 07-08: Consensus list of non-essential items
Table 07-09: Percentage of essential and non-essential items analysed by sections
Table 07-10: Consensus scores of items
Table 07-11: Results of categorical question in first round using different consensus
criteria
Table 07-12: Results of categorical question in second round using different
consensus criteria
Table 07-13: Results of categorical question in third round using different consensus
criteria
Table 07-14: Results of discrete scoring question in first round using different
consensus criteria
Table 07-15: Results of discrete scoring question in second round using different
consensus criteria
Table 07-16: Results of discrete scoring question in third round using different
consensus criteria

xv
List of Figures
Chapter 1: Introduction
Figure 01-01: Levels of organization of evidence from healthcare
Figure 01-02: Levels of organization of evidence from studies
Chapter 3: Assessment of medicines information sources used by healthcare
professionals and researchers in the World
Figure 03-01: Distribution of response rate per country
Chapter 4: Factors associated with worldwide medicines compendia publishing
Figure 04-01: World map distribution of countries publishing medicines compendia
Chapter 7: Universal tool to evaluate the content of drug information sources for
healthcare professionals
Figure 07-01: Map of Invited countries
Figure 07-02: Map of countries accepting the invitation to participate in the Delphi
study
Figure 07-03: Map of countries answering in the first round
Figure 07-04: Map of countries answering in the second round
Figure 07-05: Map of countries answering in the third round

xvi
Chapter 1 1 Introduction 2 Medicines information 2 Medicines information for healthcare professionals 3 Characteristics of the information and analysis of its quality 7 Classification of information sources 14 Primary, secondary and tertiary sources 14 Official information sources 16 Evidence 18 Medicines information sources for healthcare professionals 21 Summaries of Product Characteristics (SmPCs) 21 Package leaflet 24 European Public Assessment Report (EPAR) 25 Drug information centres 26 Internet 27 Medicines Compendia or Reference books 28 Clinical guidelines 31 Information from the pharmaceutical industry 33 Justification of the research 38 References 39 Chapter 2 47 Thesis Objectives 47 Chapter 3 49 Assessment of medicines information sources used by healthcare professionals and researchers in the World 49 Background 50 Objective 53 Methods 54 Sample 54 Study design 56 Data analysis 57 Results 58 E-mail gathering and sending process 58 Response rate 58 Analysis of responding countries 60 Use of medicines information sources 62 Discussion 71 Method used 71 Response rate 72 Analysis of results 74 Conclusions 78 References 79 Chapter 4 83 Factors associated with worldwide medicines compendia publishing 83
Arguello B, Fernandez-Llimos F. Factors associated with worldwide medicines compendia publishing. Int J Clin Pharm. 2013 Mar 28. [Epub ahead of print] 85

xvii
Chapter 5 93 Clinical Pharmacology Information in Summaries of Product Characteristics and Package Inserts 93
Arguello B, Fernandez-Llimos F. Clinical Pharmacology Information in Summaries of Product Characteristics and Package Inserts. Clin Pharmacol Ther. 2007 Nov;82(5):566-71 95
Chapter 6 103 Assessment of completeness of Summaries of Product characteristics regarding fertility and use of medicines in pregnancy and lactation 103 Background 104
Classification of medicinal products according to their risk during pregnancy 105
European Union Regulations 107 Objective 111 Methods 112 Design of the database 112 Analysis of SmPCs 114 Data analysis 116 Results 117 Analysis of SmPCs 117 Information content in SmPCs 118 Recommendations for use 121 Discussion 123 Analysis of SmPCs 123 Information content in SmPCs 124 Expressions and wording in SmPCs 127 Recommendations 129 Limitations 132 Conclusions 133 References 134 Chapter 7 137 A universal tool to evaluate the content of drug information sources for healthcare professionals 137 Background 138 Objective 142 Methods 143 Creating the initial pool of information items 143 Selecting the Delphi panel 149 Establishing consensus requirements 150 Statistical analysis 151 Results 152 Selection of Delphi panel members 152 Delphi first round 153 Delphi second round 156 Delphi third round and resulting instruments 157 Sensitivity Analysis 165 Discussion 168 Method used 168 Minimal set of information (essential items) 168 Completeness scoring tool 173 Limitations 175 Conclusions 177
Appendix 07.01: Glossary with definition of items in the questionnaire 178 Appendix 07.02. Frequencies of scores for the categorical question in the first round. 185

xviii
Appendix 07.03 Frequencies of scores for the discrete-scoring question in the first round. 187 Appendix 07.04. Frequencies of scores for the categorical question in the second round. 191 Appendix 07.05. Frequencies of scores for the discrete-scoring question in the second round. 193 Appendix 07.06. Frequencies of scores for the categorical question in the third round. 197 Appendix 07.07. Frequencies of scores for the discrete-scoring question in the third round. 198
References 202 Chapter 8 205 Concluding Remarks 205 Concluding remarks 206 Future Implications 211 Chapter 9 215 Other publications resulting from this thesis 215
Arguello B, Fernandez-Llimos F. Acceso de los profesionales a los prospectos de los medicamentos. Aten Primaria. 2007 Apr;39(4):219 217 Simon Maxwell, Hans-Georg Eichler, Anna Bucsics, Walter E. Haefeli, Lars L. Gustafsson, on behalf of the e-SPC Consortium. e-SPC - Delivering drug information in the 21st century: developing new approaches to deliver drug information to prescribers. Br J Clin Pharmacol. 2012 Jan;73(1):12-5 219

Chapter 1
Introduction

2
Introduction
Medicines information
The word ‘information’, from the Latin informatio has the meaning of ‘giving form to
materials’ and ‘transmitting or communicating knowledge’, activities which are
intimately related.(1) References from the 14th century already link information to
"formation or moulding of the mind or character, training, instruction, teaching".(2) In
more recent analyses, authors relate information to knowledge, and more specifically to
scientific knowledge. In 1976, Oeser places information as a key concept concerning
the creation of scientific knowledge, and remarks that the objectivity of scientific
knowledge is attained on the basis of the inter-subjective information process.(2)
Accordingly, Dretske states that "knowledge is information-produced belief".(3) Heinz
von Foerster defined information as “the observer's construction or a mental difference
that makes and/or finds a difference in the external world”(4).
Almost every scientific discipline today uses the concept of information within its own
context and with regard to specific phenomena.(2) Indeed, the concept of information
plays a key role in healthcare. Medicines are a core part of healthcare and their use
during the last century has grown enormously with the aim of curing diseases,
preventing illnesses and relieving symptoms. The use of drugs is so extended that the
most common therapeutic intervention in medicine is writing a prescription.(5) Safe
prescribing requires accurate information about medicines and practical advice on their
use. (6)
The huge increase in the number of drugs on the market makes it impossible for
healthcare professionals to have the knowledge necessary for an appropriate use of
medicines (7). This knowledge implies “providing the right medicine at the right dose
when it is needed, and avoiding medicines that are unnecessary or are unlikely to
result in health benefits”.(8) Not only is the information too extensive to be
remembered, but it is also constantly changing. In fact, medical knowledge may
increase four times during a professional lifetime (9), thus updating clinical knowledge
is a constant need of practising healthcare professionals.(10) According to Haynes:
“one of the most frustrating failings of the human mind is its Lilliputian capacity for
storing and retrieving important but infrequently used information”.(11) Consequently,
to choose the best available medicine as regards effectiveness and safety at the lowest
cost of treatment, access to unbiased, complete and useful information about available
treatments is required.(6)

3
Medicines information may be defined as “a system of knowledge and techniques that
allows communication of data and experiences about medicines in order to promote
their rational use by society”.(12) Gaebelein et al. defined and characterised medicines
information as “the provision of data as they relate to any area of pharmacotherapy or
pharmacy practice. At its best, medicines information should be cogent, reliable,
impartial, well-referenced, and critically appraised before being disseminated to other
healthcare providers or the lay public”.(13)
Castillo defined medicines information as “any knowledge or message that may be
used to improve or allow an intervention”, intervention being “any action taken by a
healthcare professional in his/her practice”.(14)
Medicines information aims to improve the safety of patient care by minimising
medication errors.(7) According to the American Society of Health-System Pharmacists
(ASHSP), a medication error is “any preventable event that may cause or lead to
inappropriate medication use or patient harm while the medication is in the control of
the healthcare professional practice, health care products, procedures, and systems
including prescribing; order communication; product labelling; packaging and
nomenclature; compounding; dispensing; administration; education; monitoring and
use”.(15) Information sources providing good prescribing guidance should help to
reduce these prescribing errors, thus decrease the burden of adverse reactions and
optimise rational prescribing.(6)
The importance of the information has been highlighted by several authors. Jimeno
stated that “a medicine is not only a drug, but the drug together with its
information”.(16) Phillips et al. also believe that providing medicines without information
is like providing the information without the drug.(17) Likewise, Garcia also states that
information about a drug is as important as its discovery (18), and other authors
consider information about medicines as important as their quality.(19) Furthermore,
Huth states that the strength of a profession lies in its expert generation of information
and better management of it than other social groups (20), and Haynes highlights that
“a contemporary, comprehensive store of medical knowledge is not a luxury for
practising doctors: it is as vital as an efficient pathology laboratory”.(11)
Medicines information for healthcare professionals
In a broader context, we are all currently living in an information-driven society, and
healthcare professionals are constantly bombarded with huge amounts of data about
thousands of new or already existing medications. There are more than 20,000 journals

4
published annually. In 2004 alone there were 600,000 new biomedical journal
articles.(21) This overwhelming amount of information makes it impossible for
healthcare professionals to remain up-to-date in every aspect of clinical care.
Additionally, healthcare professionals today also face the challenge of the informed
patient, which influences prescribing and modifies the relationship between healthcare
professionals and patients.(22)
Healthcare professionals receive information regularly, and mostly through scientific
and professional journals, followed by newsletters, e-mail alerts and discussion lists.
Although there is an extensive range of information resources available, most
healthcare professionals are not satisfied by current information provision and perform
additional searches for information.(23)
The search for information always begins with the generation of a need for information,
that is, with the healthcare professional asking a question. Ely et al. have described the
steps of asking and answering questions as following:(24)
Recognise a gap in knowledge: recognising gaps in knowledge generates
information needs, which are associated with clinical work.(25) These needs
can be classified as 'expressed needs' or ‘unexpressed needs’. The expressed
need is the recognised need that demands an answer, and prior knowledge is
needed to recognise these gaps in knowledge.(26) The unperceived or
unexpressed need is not recognised as a gap in knowledge. Once the
information need appears and is recognised, characteristics such as willingness
and ability to search for an answer are linked to it.(25)
Formulate a question: most questions are easy to formulate. According to
Davies et al., 60% of questions are simple ones that can be easily answered
just by looking for a fact, (such as, for example, the dose of a drug) rather that
performing an extensive literature search.(25) However, sometimes complex
questions arise, and then the way a question is formulated influences the
finding of an answer. In order to improve performance when formulating
questions, some systems such as the ‘PICO’ system have been developed (for
more information, please refer to the ‘Evidence’ section in this Introduction).
Search for relevant information: in general, there are two main reasons why the
information is sought. One is because the professional considers that the
patient’s problem is urgent, and the second is the belief that an answer exists
and can be found to assist the decision making.(25) However, skills to find the
answers to questions are needed. Selecting the source of information is one of

5
the critical steps in the process of answering any medicines information
question. This decision about which resource should be selected is mainly
based upon personal preference, accessibility and the level of detail needed to
find a complete answer.(21)
Formulate an answer: once the source of information is selected, professionals
expect to answer the question that motivated the search. However, a high
percentage of questions remain unanswered, because one of the earlier stages
fails. A deeper analysis of obstacles to answer questions successfully is shown
below.
Use the answer in patient care: although prior knowledge is crucial and
professionals cannot rely on looking everything up, they must accurately
process substantial information and clinical judgement before making clinical
decisions.(26) Once professionals have answered the question that motivated
the search, this information should be applicable to health care, that is, the
answer should be useful in patient care.
All the above mentioned steps have been thoroughly analysed in the clinical setting.
Studies show that medical practitioners generate between one and six questions per
patient and answers are pursued for around 30% of these questions.(9, 27) According
to Davies et al., although generation of questions varies among settings and
professionals, they range from 0.16 to 1.27 questions per patient.(25)
According to Magrabi et al. 40% of searches by physicians relate to diagnosis and 35%
to treatments.(28) Several other authors concluded that questions about drugs were
the most common type of question.(9, 29) According to Davies et al., top categories of
information needs for physicians are therapies and treatments, followed by diagnosis
and medicines information.(25)
However, although about 60% of the answers are very specific and simple (25), most
questions remain unanswered, either because healthcare professionals do not search
for them or because they do not find them.(30)
Ely et al. found that physicians do not seek 45% of their questions.(30) In a previous
study Ely et al. concluded that only one third of questions are pursued.(29) Reasons for
not seeking information include lack of time, lack of accessibility to reliable and up-to
date evidence, lack of literature searching skills and difficulty in formulating search
strategies.(23, 24, 30-32)

6
Even if healthcare professionals search for information, sometimes answers are not
found. According to Ely et al., 41% of the pursued questions were not answered using
either print or electronic resources.(30)
Once the search for the information begins, the most common obstacles to answering
a question successfully are:(24)
the excessive time required to find an answer
difficulty in formulating a question (often questions are subjective, open to
interpretation and vague)
difficulty in designing a search strategy
failure of the selected resource to cover a topic
uncertainty about when sufficient relevant information has been found and the
search can be halted
inadequate synthesis of the evidence into a clinically useful statement
Some authors consider accessibility one of the main characteristics of information
(please refer to the section: ‘Characteristics of the information and analysis of its
quality’ in this Introduction). The timely access to clinical information sources is
important for all healthcare professionals, but it is especially critical for primary care
physicians, due to the broad scope of their practice. Primary care practice is of
particular importance when accessing information about medicines, because this is
where most of the treatments are prescribed. General practitioners prescribe 98% of
medicines in primary care.(33) General practitioners receive relatively little training in
prescribing and have limited time to assess the large amount of information they
receive.(33) Some studies have shown that family physicians spend an average of less
than two minutes finding an answer when using traditional textbooks and printed
journals.(29).
As far as information sources are concerned, several authors have aimed at describing
the most used sources when searching for information. According to Jackson et al.,
healthcare professionals use the Internet as their principal medium for searches,
followed by informal networks and library and written resources. This study concluded
that the majority of healthcare professionals prefer the provision of information in
electronic format, although general practitioners tend to prefer written materials.(23)
However, the use of electronic sources by healthcare professionals varies among
studies. According to McEntee et al. healthcare professionals infrequently use
evidence-based electronic resources (33), and other authors claim that the most used

7
resources among physicians are textbooks, followed by colleagues and electronic
resources.(25)
Specific characteristics of each professional group also influence their behaviour when
seeking information. Primary care physicians, for example, have limited access to
colleagues compared to specialists, who can consult senior physicians in their own or
other departments and work in a more teaching-oriented setting.(34) This may be one
of the reasons why primary care physicians prefer journals as a source of information
rather than colleagues, followed by meetings and websites.(35)
The relationship between pharmacists and information is also a well-studied topic.
Pharmacists have an important role as educators and providers of information on
medicines. The American Association of Colleges of Pharmacy states that upon
completing a Pharmacy degree, graduates must be able “to retrieve, analyse and
interpret the professional, lay and scientific literature to provide medicines information
to patients, their families and other involved healthcare providers”.(36)
Providing medicines information is an important skill for all pharmacists, regardless of
their setting, as pharmacists have become an integral part of patient care within the
clinical team.(13) All pharmacists require medicines information skills, up-to-date
relevant knowledge, and easy access to evidence-based medicines information to
provide not only patient care, but also support to other professionals.(37)
Among pharmacists, there are also specialists in drug information. Drug information
specialists are those individuals who are trained to have the skills and clinical
knowledge to provide clear, concise and accurate recommendations regarding drug
use.(37) Their responsibilities are, among others, to use medicines information
sources, report and monitor adverse drug events, perform drug use evaluations and
manage policies in different settings to improve patient care.(37)
Characteristics of the information and analysis of its quality
The constant changing of medicines information and, in general, healthcare practice,
leads to a need for continual growth and refinement of the standards of drug
information practice.(37) According to Molloy et al., critically appraised, evidence-
based, comprehensive and up-to-date information leads to physicians prescribing
safely, appropriately and effectively and thus, the satisfaction of physicians and patient
outcomes should improve.(38) High quality information is the basis for high quality
clinical care.

8
Several authors have aimed at describing and evaluating the quality of medicines
information. To assess the quality, several aspects and characteristics of the
information have been defined and analysed.
Fernandez-Llimos described four main characteristics of medicines information:(39)
Accessibility
Reliability
Completeness
Applicability
Accessibility is the capacity to retrieve the information in the specific moment it is
needed.(39) It is the first barrier when choosing an information source: having easy
access is essential when selecting information sources. Authors such as Shaughnessy
et al. have considered accessibility as one of the three main characteristics that define
the best source of information.(40) Hibble et al. highlighted the need for information to
be highly accessible and usable at the point of clinical care, and suggests that these
two characteristics should be ideally achieved by an electronic medium.(41) Although
computerization has increased dramatically in healthcare during the last few decades,
the access to electronic information resources is not universal and no standardization
of electronic decision support systems for healthcare professionals has been achieved
yet.(42, 43)
Reliability is the capacity of the information to be perceived as having a trustworthy
content.(39) The reliability of the information is strongly linked to the producer of the
information and its reliability as a source of information. Some sources tend to
overestimate the benefits of a drug, for example, promotion from the pharmaceutical
industry. On the other hand, independent analyses and summaries by experts with
complete access to all relevant data and no financial conflicts of interest are incredibly
valuable because of their reliability.(44) An example of reliable sources of information
are regulatory authorities. Information provided by regulatory authorities is reliable
because they perform independent reviews of the raw data submitted by
manufacturers. Although being reliable may appear as a very subjective characteristic,
some authors have aimed at developing systems to measure reliability of information.
For example, in order to define the reliability in a study analysing websites, Martin-
Facklam et al. used two criteria: citation of scientific sources and absence of financial
interest.(45)
9
Completeness is not only the capacity of being complete, but also balanced and
updated.(39) To support decision making, healthcare professionals need appropriate
information in suitable format and in the correct amount.(23) Since up-to-date medical
knowledge is paramount to high quality and effective physician performance, the
update of the information is a topic that has generated concern among
researchers.(26) As already mentioned, in a continuously changing practice it is
impossible for healthcare professionals to stay updated, even within limited
pharmacotherapeutic topics.(34) Trifiro et al. have highlighted the need of more
homogeneous information sources and regular updates on the basis of current
evidence from the literature.(46)
If the information about a drug is not updated, the information that healthcare
professionals receive may be information from early studies and not from real practice.
When a new drug is granted a marketing authorisation, clinical trials are the primary
source of information and manufacturers’ recommendations for the use of drugs are
usually selected during phase one, at early stages of the pre-release research
period.(47) These phase one studies are usually brief, limited in time and involving
selected populations. These studies ensure in general that a medicine is effective and
does not cause unacceptable harm.(5) However, the use of data from phase-one
studies in clinical care is controversial. Bates highlighted the inapplicability of pre-
release data to patients in healthcare visits.(48) One of the reasons of this
inapplicability may be the lack of knowledge about the performance of new medicines
in frail patients with multiple illnesses, who are not included in pre-marketing studies.(5)
Other authors also argue that manufacturers’ dosing recommendations are usually
based on these phase one studies. Scarce information about dosing fails to determine
dose-concentration-response relationships, and this may lead to undesired adverse
effects or lack of individualisation in dosing.(47)
After a medicine is authorised, the phase four (post-release phase) begins. This phase
often involves millions of patients for several years and is very informative. New uses,
new adverse effects and true risks of drugs are discovered during phase four. Also
lower doses, maybe with fewer adverse events are proven effective. This new
information is not always incorporated into information sources and physicians still use
doses of medications based on pre-release studies, which may lead to otherwise
preventable dose-related adverse effects.(47) Regarding adverse events, studies show
that only half of newly discovered serious adverse events are detected and
documented in the Physicians’ Desk Reference within seven years after drug
approval.(49)

10
Applicability is the capacity of being useful in the specific decision-making process, that
is, successfully answering the question that motivated the information search.(39) The
applicability derives from the information being a contextual concept, that is, the
information itself should not be considered in isolation, but related to its context.(50)
Furthermore, the applicability of the information in a specific context has been defined
as a ‘knowledge generator’. Probst et al. remark that information is used to designate
isolated pieces of meaningful data that, when integrated within a context, constitute
knowledge.(51)
Other key concepts, such as readability, comprehensibility or clinical relevance have
also been described.(52) According to Aronson et al. these three characteristics
should be favoured over other characteristics of the information such as
compactness.(52) According to Curley, the best sources of information are those that
provide highly relevant and valid information but do not require a lot of effort to use.(53)
Molloy et al. consider that to prescribe safely, appropriately and effectively, physicians
should consistently receive critically appraised, evidence-based, comprehensive and
up-to-date information.(38) Berland et al. defined the quality of the information by
analysing the coverage of topics, accuracy of the information and absence of
conflicting information.(54)
Shaughnessy et al. assessed health information sources according to their usefulness,
and defined the concept with the following equation:(40)
Usefulness of medical information = relevance x validity / work
Relevance is based on “the frequency of your exposure to the problem being
addressed and the type of evidence presented”.(40) These authors divide evidence
between disease-oriented evidence and patient-oriented evidence. Patient-oriented
evidence is described using mortality, morbidity and quality of life information as well as
effects on clinical events. Disease-oriented evidence is described through
pathophysiology, pharmacology and aetiology information.(40) Shaughnessy et al.
define “work” as the effort to access the information source.
Internet as a source of information has attracted researchers analysing medicines
information and many of them have aimed at analysing its characteristics and quality.
Therefore, due to the amount of information present in Internet and the huge number of
authors aiming at analysing the quality of this information, Eysenbach has defined a
new research discipline and methodology: information epidemiology or ‘infodemiology’.
This discipline studies the determinants and distribution of health information and

11
misinformation, identifying areas where there is a knowledge transfer gap between best
evidence and practice, as well as markers for high quality medicines information on the
web.(55)
Eysenbach et al. have defined valid quality criteria on websites as “features that predict
effective health communication in terms of improving knowledge or changing health
behaviour, or which is associated with a measurable effect on health outcomes”.(55)
These criteria that are used to evaluate health information on the web are divided into:
Technical criteria (how the information is presented or the meta-information which is
provided), Design (quality of presentation of the information), Readability (reading level
of a document), Accuracy (degree of concordance of the information with the best
evidence or with generally accepted medical practice) and Completeness
(comprehensiveness, coverage or scope).(56)
Regulatory agencies have also tried to define the characteristics that ensure the quality
of health information on the Internet. The Food and Drug Administration (FDA) also
names some of the most important questions to consider when evaluating internet
health information: who runs the website, aim of the website, sources of information
and evidence provided, updating and review of the content, use of the information
collected from visitors of the webpage and accuracy of e-mails received and chat
rooms.(57)
The European Federation of Pharmaceutical Industries and Associations (EFPIA) sets
out the principles of evaluating company-sponsored websites containing medicines
information for health professionals, patients or the general public. These principles
are: giving the sponsor’s identity; informing about the content of sites (what information
is included on the website); providing general information on the company; providing
balanced and accurate information; stating that the information is for healthcare
professionals and complying with national regulations and industry codes of practice;
providing balanced and accurate patient information which is consistent with the
Summary of Product Characteristic (SmPC), providing copies of the SmPC and patient
leaflet on the webpage; offering e-mail enquiries; providing links including the identity of
the linked site; providing a scientific review of accuracy of the information on the site
and complying with the regulation on privacy of personal information.(58)
Silberg et al. established four basic criteria to assess the quality of information on
Internet:(59)
Authorship: identifying the source of the information and determining its
trustworthiness and qualification
12
Attribution: evaluation of the references cited by the authors
Disclosure: identifying potential conflicts of interest or bias
Currency: update
The Health on the Net (HON) Foundation has established 8 principles, known as the
HON Code, used as criteria to evaluate the quality of web sites containing health
information. These 8 principles are: authority (provide qualifications of authors),
complementarity (information to support, not replace), confidentiality (respect the
privacy of site users), attribution (cite sources and dates of the information), justifiability
(justify claims and provide balanced and objective claims), transparency (accessibility,
provide valid contact details), financial disclosure (provide details of funding),
advertising (clearly distinguish advertising from editorial content).(60)
Although disclosure of the authors’ names is a frequent criterion to define quality of
medicines information on the Internet, according to other authors it is not a predictor of
the site’s reliability, perhaps because government organizations, drug companies and
other organizations do not usually provide names of the authors on their websites.(54)
Nähri et al. developed the DARTS tool to assess medicines information on the Web.
This tool helps find reliable and quality information on the Internet by assessing the
following criteria:(61)
Date: when the information was updated
Author: disclosure of authors and their qualifications
References: validity of the sources of the content
Type: purpose of the site, who it is aimed at
Sponsor: if the site is sponsored and a possible conflict of interest
According to Eysenbach, apart from the main criteria to define the quality of information
on the Web, there are other criteria which are valid because they create context, such
as ‘disclosure of the target audience, scope and purpose of the site’ (help users to filter
inapplicable information), ‘links and references’ (help users to verify the information
provided) and ‘authorship credentials’ (help users to decide if a site is trustworthy). (55)
Taking this into consideration, Eysenbach defined the main characteristics to assess in
a website using the mnemonic ‘CREDIBLE’:
Current and frequently updated
References cited
Explicit purpose and intentions of the site
Disclosure of developers and sponsors

13
Interest disclosed and not influencing objectivity
Balanced content: listing advantages and disadvantages
Labelled with metadata
Evidence level indicated
These systems were designed to analyse information on the Internet. Additionally,
other systems have been developed aiming at assessing the quality of other specific
sources of information. For example, to assess the quality of clinical guidelines the
AGREE rating scale was created by an international group of guideline experts
(Appraisal Guideline Research and Evaluation Europe, AGREE Collaboration). This
instrument provides an appraisal of the predicted validity of a guideline, which is the
likelihood that it will achieve its intended outcome. It evaluates the process of practice
guideline development and the quality of reporting. The AGREE instrument was
created in 2003 and refined in 2009 (AGREE II) and it currently includes 23 items
divided into six categories. Each item should be scored with a four-point Likert scale.
The categories and items are:(62)
Scope and purpose:
o Description of the objectives of the guideline
o Description of health questions covered in the guideline
o Description of population to which the guideline applies
Stakeholder involvement
o The guideline development group includes individuals from all relevant
professional groups
o Views and preferences of the target population have been sought
o Definitions of target users of the guideline
Rigour of development
o Systematic methods were used to search for evidence
o Description of criteria for selecting evidence
o Descriptions of methods for formulating recommendations
o Recommendations were formulated considering health benefits, side
effects and risks
o Recommendations are linked to supporting evidence
o Guideline review by external experts prior to publication
o Updating procedure is provided
Clarity and presentation
o Recommendations are specific and unambiguous
o Different management options are clearly provided

14
o Key recommendations are easily identifiable
Applicability
o Guideline provides tools/advice to put recommendations into practice
o Description of facilitators/barriers to application of the guideline
o Considerations of potential implications of application of the guideline
o Presentation of monitoring/auditing criteria
Editorial independence
o There is no influence of the funding body over the content of the
guideline
o Competing interest of developers have been recorded and addressed
Additionally, the AGREE II included in 2009 two final overall assessment items that
require the appraiser to make overall judgments of the practice guideline and consider
how they rated the 23 items. These two items include rating the overall quality of the
guideline and stating if one would recommend the guideline for use.(62)
Classification of information sources
Information sources may be classified into different categories according to aspects,
such as the producer of the information or their level of evidence. Depending on the
producer of the information, information sources may be defined as primary, secondary
or tertiary sources.
Primary, secondary and tertiary sources
The most common classification of information sources is distinguishing between
primary, secondary and tertiary sources.
Primary sources refer to original scientific research or clinical studies. This original
information is obtained by carrying out specific experimental designs and statistical
analyses, such as randomised control trials, epidemiological studies such as case-
control studies and individual investigations such as case reports.
These primary information sources have been described as the “building blocks” of
biomedical information and are the most current source of information.(13) Primary
sources of information are the basis of evidence-based healthcare practice. Some of
the advantages of primary sources are that they provide original and unique
information, in which the reader knows how the information was obtained (information
about methods is given), they are peer-reviewed and allow a critical review of the
results of the study.(63)

15
However, scientific articles in journals do not alter prescribing habits easily.(47) This
may be because extracting the information from primary sources to formulate a
statement and use it in clinical care is not so obvious. Specific skills are necessary to
critically evaluate primary literature and to understand how to interpret and apply this
information to individual patient care.(21) Assessing the type of studies, the journal
which publishes them, their limitations, and relevancy to the question we are looking at,
are some of the skills needed to perform an assessment of the information found in
primary sources.(21)
Although primary sources are considered the gold standard by some authors, they
have also been criticised by others. Some of their disadvantages are their format,
length, and the skills and time needed to interpret them.(63) Primary literature may also
be biased.(64, 65) There is a known bias toward the publication of positive results. Not
only are positive results more likely to be published, but studies that are not positive
are often published in a way that expresses a positive outcome.(64, 66). There is not
only a publication bias, but also peer reviewers having relationships with the industry
may provide biased reviews in primary sources.(67) Other authors have also studied
the prevalence of ghost authorship in primary sources, which is providing academic
authorship to articles written by pharmaceutical company employees or third
companies working for the pharmaceutical industry.(68) (Please refer to ghost-writing
in section: ‘Information from the industry’ in this Introduction)
Secondary sources of information connect the person looking for information with
primary sources, providing efficient access to primary literature. The role of secondary
sources is to index and provide abstracts of primary literature.
Databases such as Pubmed (www.pubmed.com) are examples of secondary sources.
Pubmed is a very popular database, freely available on the Internet. It provides access
to the citations and abstracts of thousands of biomedical journals and provides links to
the selected articles, sometimes allowing the article to be downloaded at no cost to the
user.
Some of the advantages of secondary sources are that they include extensive
information and provide access to original articles. On the other hand, they generally
only provide summaries of articles and they do not include every journal, only those
which are indexed.(63)
Professionals performing searches also need some skills to retrieve information
successfully. One of the main limitations is that, often, when using broad search terms,

16
secondary sources display a vast number of citations, which have to be individually
reviewed, and this can be a very time-consuming activity. Different databases also
have different systems for searching and specific techniques need to be learnt in order
to perform an optimal search. According to Iwanowicz, another limitation of secondary
sources is that quality assurance is not a major concern in this kind of sources.(21)
Tertiary sources are the media that summarise, integrate and evaluate original
research reports.(13) Textbooks, medicines compendia, computer databases or review
articles are some of the available tertiary sources.
Review articles are published in primary sources of information, but as they do not
provide original research, they are classified as tertiary literature. The advantage of
tertiary literature sources is that they are convenient and easy to use, their information
is usually comprehensive and easily accessible.(21)
These sources offer reliable information, based, at least in part, on a review of the
primary literature. Additionally, many textbooks and most review articles undergo a
peer-review process prior to publication to ensure that the content is accurate and
complete. However, this does not mean that such resources are free of limitations.
Textbooks can be published without peer review and authored by individuals who are
less than well-qualified to write on the matter. Information may appear accurate and
credible but, if poorly referenced, may not be reliable.
The main limitation of tertiary sources of information is that they become easily
outdated due to the gap between writing and publishing. The content often lags behind
by one to two years due to publishing delays.(21) Nevertheless, tertiary sources in
electronic format should overcome this limitation.
Official information sources
Other classification system, according to the producer of the information is
distinguishing between official and non-official information sources. Although this
classification system may not be as popular as the previously mentioned classification,
for our study it is more relevant. An information source is official when it is either
produced or approved by regulatory agencies.
A new drug cannot be marketed without approval from regulatory agencies. This
approval depends on the new drug meeting the criteria of detailed regulations whose
purpose is to guarantee the safety and efficacy of pharmaceuticals.

17
Regulatory agencies do not rely on published literature for their decisions, since they
perform independent reviews of the raw data submitted by manufacturers from pivotal
randomised clinical trials and summaries of other relevant studies.(44) Regulatory
agency reviews have been described as ‘the most complete and accurate syntheses of
clinical trial data available’.(44)
In the European Union (EU) during the authorisation process manufacturers propose
the labelling of the product and its summary of product characteristics, which have to
be approved following the specific regulations addressing their content and format. The
labelling includes both the ‘label’, defined as ‘a display of any written, printed or graphic
matter on the immediate container of the drug” (69); and any written, printed or graphic
material that accompanies the drug, including patient leaflets, containers and wrappers.
The officially approved product information in the European Union consists of the
Package Insert, the Summary of Product Characteristics and the European Public
Assessment Report (EPAR). For more information about these information sources
please refer to the section ‘Medicines information sources for healthcare professionals’
in this Introduction.
In the United States (US) the labelling of a drug must also be approved by the Food
and Drug Administration. There is an important difference between the European Union
and the US concerning labelling. In the EU, prescription drug labelling is mainly
addressed to patients whereas in the US it is primarily aimed at physicians.(70) In the
US patients usually receive prescription drugs from a pharmacist in a container
specifying at least the name and address of the dispenser, prescription serial number
and date, name of prescriber, and when stated by the physician: name of patient,
instructions for use and precautions.(70) Patient leaflets are only required when the risk
of serious adverse effects makes it essential for patients to have complete
instructions.(70) For example, patient leaflets are required for oral contraceptives, or
intrauterine devices. In the European Union patient leaflets are compulsory for all drugs
on the market.
In the US, additional safety information may be added before receiving FDA approval.
This safety information includes new information on warnings, precautions, adverse
reactions, overdose, drug abuse or dependence, as well as adding information on
dosing or administration for a safer use or deleting false or misleading information
about the effectiveness of a medicine. Although the FDA considers the communication
of risks and benefits through its product labelling as ‘the cornerstone of risk
management efforts for prescription drugs’ (71), some authors claim that there are no
18
specific measures to ensure that a minimum amount of risk information is included in
the labelling.(72) Minor information changes may also be made without FDA approval
(for example, change in the size of the package or minor editorial changes).(70)
According to Willy et al. regulations are reasonably flexible regarding the appropriate
wording and placement of safety related information.(72) In the European Union any
changes at any time in the information provided have to be approved by the competent
authorities.
Some authors argue that the information provided by regulatory authorities is not
enough. In 1987 Herxheimer already suggested that regulatory agencies should
publish assessment of medicines describing which medicines offer important, modest,
little or no therapeutic advantages compared to existing treatments for the same
indication.(73) Other authors claim that comprehensive reviews carried out by
regulatory agencies should be more easily accessible to facilitate an accurate
assessment of clinical research.(44)
Evidence
Medicines information sources may also be categorised according to their level of
evidence.
The practice of evidence-based medicine is defined as the explicit application of the
best currently available evidence in making decisions about the care of individual
patients. To provide evidence-based care, health professionals recognise the need of
up-to-date knowledge.(23) Evidence-based medicine is valuable to the extent that the
evidence is complete and unbiased.(64)
Practice of evidence-based medicine implies integrating the best available clinical
evidence from scientific research to the individual clinical skills.(63) The best available
clinical evidence is the evidence coming from patient clinical research, based on the
accuracy and precision of diagnostic tests and prognostic markers and the efficacy and
safety of preventing, therapeutic and rehabilitating regimes.(63)
Practice of evidence-based medicine is a process in which patient care generates the
need for clinically relevant information, and it is based on the following principles:(63)
- Clinical decisions should be based on the best available scientific evidence
- The clinical problem determines which evidence should be used
- To find, identify and evaluate the best evidence, basic knowledge on information
seeking, clinical epidemiology and biostatistics is needed.

19
- Conclusions obtained from evidence are useful only if they are applicable in
healthcare
These principles lead to four steps in clinical practice:(63)
- Formulate a precise question: needs of information should be turned into a simple
and specific question in order to facilitate finding an answer. This step is crucial in
evidence based medicine, and the ‘PICO question’ is a system developed to help
professionals form an appropriate question. To formulate a question following PICO,
professionals should include the following information in the question:(74)
Patient: describe the characteristics of the patient/group of patients
Intervention: the action that the health professional is considering (e.g. to
treat an illness)
Comparison: other action that could be taken instead (e.g. not to treat)
Outcome: what the expected outcome is
- Find the best scientific evidence: evidence is found through the appropriate search to
answer the previous question. This process includes selecting the information
source and the design of a search strategy.
- Critically assess the evidence found: it includes the analysis of published studies,
evaluations of results and determining its clinical applicability.
- Apply results of the evidence found: make a clinical decision considering the clinical
circumstances.
A model to organise evidence-based information sources and rank them according to
the level of evidence has been developed, which is represented in Figure 01-01.(75)
Systems
Summaries
Synopses
Syntheses
Studies
Fig.01-01. Levels of organization of evidence from healthcare

20
In this organization system the definitions of levels are: (75)
systems are “decision support services that match information from individual
patients with the best evidence from research that applies”
summaries “integrate best available evidence from the lower layers (drawing
on syntheses -systematic reviews- as much as possible) to provide a full range
of evidence concerning management options for a given health problem”
synopses are “succinct descriptions of an individual study or a systematic
review”
syntheses are systematic reviews, such as e.g. Cochrane reviews
studies are the original articles (primary sources)
The lower layers (synopses, syntheses, and original studies) most often examine only
one aspect of management, such as a specific drug or drug class, and healthcare
professionals are the ones who should do their own critical appraisal and integration of
the information.(75)
Studies are also categorised in different levels of evidence, which are shown in Figure
01-02: (76)
Fig 01-02. Levels of organization of evidence from studies
Meta-analysis
Systematic review
Randomised Controlled Trial
Cohort studies
Case Control studies
Case Series/Case Reports
Animal research/Laboratory studies
Systematic reviews and meta-analysis have the highest level of scientific evidence.
However, some authors claim that as they are based on the published literature, which
is biased,(64) they are not reliable.(44) According to Dwan et al. the study publication
bias leads to overestimation of efficacy, it is a threat to the validity of meta-analysis,
and can make the readily available evidence unreliable for decision making.(65)
Ely et al. argue that although physicians are urged to practice evidence-based
medicine and advised to evaluate the results of original research, due to the lack of
21
time they are more likely to search readily available sources of information.(24) The
obstacles to finding an answer related to the available evidence arise either because
the evidence found does not address the question or provides incomplete information
about it; or because the available evidence is not synthesised or interpreted.(24)
Therefore Ely et al. consider that in order to provide evidence-based information at
point of care, quickly accessible summaries would be more useful.(24) Other authors
also state that although there is general access to updated primary evidence (e.g.
through ‘Pubmed’), the traditional methods of seeking information in printed sources or
consulting colleagues are still the most popular among physicians.(25)
Medicines information sources for healthcare professionals
Analysing the characteristics of medicines information sources available for healthcare
professionals is essential for this research. Healthcare professionals have a huge
choice of information sources about medicines, and the decision of which source
should be selected may be based not only on personal preferences, but also on
characteristics of the sources such as accessibility, completeness and usefulness.(21)
The main medicines information sources used by healthcare professionals and their
characteristics are described below.
Summaries of Product Characteristics (SmPCs)
As previously mentioned, SmPCs are official information sources in the European
Union. The Directive 2001/83/CE and regulation (EC)726/2004 require that for a
medicine to be granted a marketing authorisation, a Summary of Product
Characteristics must be included in the application. Once the authorisation is approved,
the marketing authorisation holder is informed by the competent authorities of the
approved SmPC. The SmPC forms “an intrinsic and integral part of the marketing
authorisation”.(77)
The SmPC may be defined as ‘the basis of information for healthcare professionals on
how to use the medicinal product safely and effectively’ (77), or ‘the agreed statement
of known facts about a given pharmaceutical compound at a particular point in
time’.(78) Its aim is not to give general advice to treat medical conditions but to specify
the use of a medicinal product, administration and effects, among others.
The SmPC defines an agreed position of the medicinal product between regulators and
manufacturer, as agreed during the product assessment process. Not only is its first
version approved, but every subsequent modification should also be approved by the

22
competent authority. The data submitted by the marketing authorisation holder and
reviewed by the regulatory agency exceeds the published data in the scientific
literature.(78)
All SmPCs have a common structure, which is described in the ‘Guideline on
Summaries of Products Characteristics’.(77) Authorities provide all the information and
advice on how the information should be presented. Headings are common for all
SmPCs and are:
1. Name of the medicinal product: including invented name, name of the active
substance, the strength and pharmaceutical form
2. Qualitative and quantitative composition: full details of the composition including
the active substance and excipients.
3. Pharmaceutical Form: using a full standard term of the Pharmacopoeia
Europea.
4. Clinical Particulars:
a. Therapeutic indications: definition of the target disease or condition,
distinguishing between treatment, prevention and diagnostic indications.
b. Posology and method of administration: dosage and route of
administration including any special precautions related to the
manipulation or administration of the product.
c. Contraindications: situations under which the medicinal product should
not be given for safety reasons.
d. Special warnings and precautions for use: derived from the safety
information of the product.
e. Interactions: information on the potential for clinically relevant
interactions based on pharmacodynamic properties of the product and in
vivo pharmacokinetic studies.
f. Fertility, Pregnancy and Lactation: recommendations for use in
pregnant, lactating women or in women with child-bearing potential.
g. Ability to drive and use machines: information about effects of the
product on the ability to drive and use machines.
h. Undesirable effects: all adverse reactions from clinical trials, post-
authorisation safety studies and spontaneous reporting.
i. Overdose: acute symptoms, signs and potential sequelae of different
dose levels of the product.
5. Pharmacological properties:

23
a. Pharmacodynamic properties: brief description of pharmacotherapeutic
group, ATC code, mechanism of action, pharmacodynamic effects,
clinical efficacy and safety.
b. Pharmacokinetic properties: pharmacokinetic values relevant for the
dose, strength and pharmaceutical formulation marketed.
c. Preclinical safety data: safety profile of the product.
6. Pharmaceutical particulars:
a. List of excipients: expressed qualitatively.
b. Incompatibilities: physical and chemical incompatibilities of the product
with others with which it is likely to be mixed or co-administered.
c. Shelf-life: as package and after dilution, reconstitution or first opening.
d. Special precautions for storage: storage warnings.
e. Nature and contents of container: components of the immediate
container according to the European Pharmacopoeia.
f. Special precautions for disposal: instruction for disposal of the product.
7. Marketing authorisation holder: name and address at least.
8. Marketing Authorisation number(s): numbers included in the community
register.
9. Date of first authorisation/renewal of authorisation
10. Date of revision of the text
11. Dosimetry: internal radiation dosimetry
12. Instructions for preparation of pharmaceuticals
Since they are official, SmPCs are considered reliable information sources.
Nevertheless, SmPCs may also contain errors or discrepancies. Fusier et al. analysed
SmPCs and encountered a problem in 2.7% of SmPCs. Main errors in categories of
information with impact on the patient were related to indications/dose,
contraindications/precautions and interactions.(7) A study in 2008 comparing
information on management of overdose between SmPCs and a specific toxicity
database showed that there were minor discrepancies in 11% of drugs and major
discrepancies in 80%. Only 9% of drugs agreed in both sources.(79)
It is critical that SmPCs are reviewed and amended regularly as new information about
the medicinal product is being published.(78) As previously explained, SmPCs are
submitted to the regulatory authorities when only limited data about the drug are
available. In order to develop a comprehensive picture of clinical safety, medicinal
products should be closely monitored, especially during the first years of
commercialisation.

24
Surveillance of marketed medicines is a shared responsibility of the Regulatory
Authorities and Marketing Authorisation Holders.(80) The Marketing Authorisation
Holder is required to submit periodic update safety reports, which ‘report all the
relevant new safety information from appropriate sources; relate these data to patient
exposure; summarise the market authorisation status in different countries and any
significant variations related to safety; create periodically the opportunity for an overall
safety re-evaluation; and indicate whether changes should be made to product
information in order to optimise the use of the product’.(80) In the European Union,
Council Directive 93/39/EEC and Council Regulation 2309/93 require reports with a
periodicity of six months for two years, annually for the three following years and then
every five years, at the time of renewal of registration.
Despite this requirement for updates, the lack of current information is one of the
reasons why SmPCs are mostly criticised.(79) Arguing that SmPCs are not sufficiently
updated, Wall et al. claim that their information should reflect current practices and
periodic updates should be better encouraged.(79) In contrast, other authors consider
that SmPCs are the best source to aid prescribing decisions, due to the fact that they
are updated more regularly than other sources such as clinical guidelines.(78)
Another limitation of SmPCs is that healthcare professionals are not always fully aware
of the content of SmPCs or how to access them.(78) In a recent study, Bastholm
showed that few physicians had knowledge of the information in the SmPC. (42)
Package leaflet
Package leaflets are official information sources. Although in the European Union they
are not intended to be used by healthcare professionals, it is worth analysing some of
their characteristics.
In the European Union, the package leaflet is always included in the package of every
medicine and it is aimed at informing the patient. Although the primary and main source
of information about medicines for patients is healthcare professionals such as
physicians and pharmacists, the package leaflet supplements this information.(81)
Patients are currently actively involved in clinical decisions about their treatments.
Patients have a right and an increasing expectation, to having access to good quality
and objective information about medicines. Patients cannot express informed
preferences unless they are given sufficient and appropriate information about all
relevant treatment and management options and information about the potential
25
benefits and harms of each. Information to patients should be objective,
comprehensive, readable, accurate and up-to-date.(81)
Package leaflets provide information on how to use medicines safely and effectively
and they are usually the only source of information when the patient actually takes the
medicine. This is particularly critical for over-the-counter medicines where there may be
less direct involvement by a health professional.(81)
The information in package leaflets should be in accordance with the SmPC and its
content and structure is also strongly regulated. Regulatory agencies approve package
leaflets when issuing a marketing authorisation and any modifications and updates also
need approval. The package leaflet is a highly accessible medicines information source
for patients and its information is useful as a reference to be consulted by patients.(82)
As the final reader will be a lay person, extensive scientific information is not needed.
In fact, providing comprehensive scientific information might negatively influence the
readability of the material. However, it is important that the information included is
legible and written in concise and easily understandable terms.(83)
In 2002 a report from the G10 medicines group to the European Commission
highlighted that package inserts frequently do not meet the needs of patients and
recommended a greater flexibility in the way information for each medicine is presented
taking account of the views of regulators, users and all stakeholders, and ensuring that
citizens have access to harmonised, authorised and clear information which takes
account of different levels of health literacy.(81)
Patient package leaflets have been criticised for being inconsistent (84), difficult to
understand (85), and lacking essential information.(86)
In the United States, the package leaflet or package insert is aimed at informing the
physician and serving as a reference for key information.(70) As it is intended for
healthcare professionals, it includes references to scientific evidence to support its
claims.(70)
European Public Assessment Report (EPAR)
The summary of the European Public Assessment Report, EPAR, is an official
medicines information source. Its purpose is to explain how the Committee for
Medicinal Products for Human Use (CHMP) in the European Medicines Agency (EMA)
assessed the studies performed to arrive at their recommendations on how to use the

26
medicine. It is prepared at the end of every centralised evaluation process to provide a
summary of the grounds for the opinion in favour of a marketing authorisation.
The EPAR takes its information from the assessment of the documentation submitted
by the applicant and the scientific discussions undertaken by the CHMP during the
evaluation process. Commercially confidential information is deleted before the EMA
publishes the EPARs. The EPARs are also updated throughout the life cycle of the
product to reflect changes to the original terms and conditions of the marketing
authorisation.
The EPAR abstracts were originally intended to provide information understandable to
the general public. However, since their introduction, the EPARs have become
increasingly technical and complex and therefore less understandable for lay people.
Drug information centres
In 1962 the University of Kentucky was the first to establish a drug information centre,
which was aimed at providing patient-specific medicines information. This was the first
step to integrating the pharmacist into the patient care team by providing their expertise
and knowledge on drug therapies.
The increasing availability of medicines information and the challenges of analysing,
interpreting and communicating it, led to a growing need for qualified specialists who
supported rational therapeutic selections to improve patient care.
During the 1970s and 1980s the number of drug information centres grew as the
clinical role of the pharmacist in patient care was accepted, and the need for quick
access to current information became a common concern of healthcare professionals
and the ability of drug information specialists was perceived as useful to correctly
interpret conflicting therapeutic information.(87)
The main objective of drug information centres is to promote rational drug therapy.(88)
The strength of a drug information service is the pharmacists’ ability to link the
provision of critically appraised information with clinical interpretation.(33) Although all
pharmacists are providers of medicines information, drug information specialists are
trained specifically to retrieve, evaluate and communicate information efficiently aiming
to develop evidence-based recommendations and assist in patient care decisions.(37)
The quality of information activities in drug information centres has traditionally been
assessed by the establishment of internal quality criteria and protocols.(34) In general,

27
physicians consider that the information provided by drug information centres is of high
quality and of significant clinical impact.(88) According to McEntee, 95% of enquirers of
a drug information centre considered the advice useful, and 99% were satisfied with
how the service was provided.(33) General practitioners use drug information centres
more often than specialists. This may be explained by the fact that general practitioners
usually work alone or with a few colleagues, which may increase the need for
support.(88)
Many of the enquirers of a drug information service seek advice to choose an
appropriate treatment in the right dose. In a study carried out by McEntee et al. half of
the participants wanted to confirm the appropriateness of the current or proposed
therapy and 45% used the information to make changes to therapy. Enquiries about
adverse effects and medicine interactions are also common and 25% used the advice
to identify, manage or avoid an adverse effect or drug interaction. However, few used
the information to produce guidelines, inform decisions for formularies or funding
medicines, or make cost improvements.(33)
The quality of the information provided by drug information centres has also been
analysed. For example, a study showed that regarding safety in pregnancy, advice
from a compendium and from drug information centres differs in almost 50% of cases.
In this case, advice from the selected compendium was significantly more restrictive
than that from drug information centres. (89) The authors explain this difference in the
intention of drug information centres to provide advice leading to rational
pharmacotherapy for the individual patient. (89).
Internet
The internet has become an important communication medium providing quick and
cheap access to health information for healthcare professionals and patients. It is
important to clarify that internet is not a source of information itself, but a channel,
through which users can access primary, secondary and tertiary sources alike.
Due to the impact of new technologies on the process of seeking and retrieving health
information, analysing the quality of information on the Internet is a major issue.
Information in internet is varied, and although one of the positive characteristics of the
information retrieved through internet is its accessibility, its quality and reliability remain
a concern.

28
It is a medium in which anyone with a computer can be simultaneously author, editor
and publisher, and can act anonymously in any of these roles. Some authors consider
Internet as a risky channel that escapes any regulatory control.(90) Much of the health
information on the Internet has been described as discordant with information provided
by evidence-based sources.(91) Moreover, even for professionals, it is not always easy
to know if the information on the Internet is credible.(92)
According to Berland et al., when seeking information on the Internet, search engines
are only moderately efficient in locating information about a particular topic.(54) In their
study, only 20% of links provided by English-language search engines and 12.5% of
links provided by Spanish search engines led to a website with relevant content. As far
as the quality of the content is concerned, only half of the topics considered important
by experts about a clinical topic were covered more than minimally.
Nevertheless, in a study in 2005, Bennett et al. found that most physicians (59%) use
the Internet regularly to access clinical information daily or weekly, as well as using it
for personal purposes and e-mail.(35) More recent studies show that these data are
likely to have increased these last years. However, other authors point out that Internet
is rarely used as an information source during patient visits.(93) This may be because
prescribers need instantly available electronic medicines information, which interact
with electronic health records and decision support systems, and this is not available
yet.(43) However, most healthcare professionals choose electronic formats such as
intranets and Internet as preferred formats of information.(23) (For more information on
the use of Internet by healthcare professionals please refer to Chapter 3: ‘Assessment
of medicines information sources used by healthcare professionals and researchers in
the World’).
The main barriers found to seeking information using Internet were navigation or
search difficulties, the overwhelming amount of information found and difficulty in
finding specific information.(35)
The methods used to analyse the quality of the information found on the Internet are
thoroughly analysed in this Introduction, section ‘Characteristics of information and
analysis of its quality’.
Medicines Compendia or Reference books
A compendium is a source containing a wide spectrum of information on prescribing
and pharmacology, including among others, indications, side effects and costs of the

29
prescription of medications available in the country. It is used by prescribers, nurses
and pharmacists as a general reference book on medicines. Compendia are widely
used written references for all healthcare professionals. Synonyms of compendia are
medicine/drug reference books or formularies.
The word Formulary comes from the Indo-European root ‘merbh’, meaning ‘to shine’
(as in ‘morpho’, a genus of butterflies with shiny blue wings). Because everything that
shines is easy to see, ‘merbh’ also meant to appear or take shape. The Greek ‘morph’
transformed into the Latin ‘forma’ (appearance) and its diminutive ‘formula’ (shape).
Formula was defined in 1706 by John Kersey in the edition of the Edward Phillips’
dictionary ‘The New World of English Words’ as a “Physician’s prescription or bill
appointing medicines to be prepared by an Apothecary”. Consequently, a formula
describes how a medicinal product should be prepared and a formulary lists such
formulae and describes the formulations.(94)
Although studies argue that the provision of information to prescribing in the form of
books of reference information is ‘no longer fit for purpose’ (43), some authors have
stated that it is vital that physicians, nurses and pharmacists have at their immediate
disposal up-to-date drug reference books.(49) Some studies point out that primary care
practitioners do not use online information resources as much as print resources (95),
and Internet might be mainly used to search for specific patient problems or the latest
research.(93) According to Bennett et al. when searching information about new
therapeutic options and management of complex cases most physicians consult
colleagues and printed sources.(93) Analysing several studies, Dawes concluded that,
physicians use primarily printed materials as information sources, with utilization
ranging from 50 to 80%.(96)
The content of compendia has been subject of several assessments, concluding that
the information contained in compendia is not homogeneous. Comparing different
compendia has shown important discrepancies among them regarding areas such as
interactions (97-102), off-label indications (103), or hepatotoxicity.(104)
Some studies about compendia argue that the information provided is inaccurate (98),
inconsistent (97), lacks transparency (103), is limited (47), cites little current evidence
(103), lacks systematic methods to review or update evidence (103), lacks standard
terminology (98), lacks clinical guidance (98), is outdated, misleading and even
dangerous.(105) Some authors discuss how respected compendia listing indications,
which are in fact not approved by authorities, may give these indications a somewhat
formal status.(70)

30
In the United States the Physicians’ Desk Reference (PDR) is the leading drug
reference book among physicians.(47) The PDR is a compilation of the official package
leaflets and it is published every year. It was initially conceived as a promotional device
and the pharmaceutical industry pays to have each package leaflet included in the
PDR. However, currently many medicines are only available in generic form, and their
manufacturers may discard listing their medicines in the PDR or restrict the size of the
entry because of the fee.(106) From 82% to 90% of physicians consider the PDR as
their single most useful reference, and the average physician consults it around 8 times
every week.(107) Not only physicians, but also residents, nurses and other healthcare
professionals rely heavily on the PDR. Even consumers buy the PDR for use at
home.(47)
Some of the advantages of the PDR are its easy-to-use format, its handy indexes and
a state-of-the-art pill identification, as well as 500,000 units being freely distributed to
physicians’ offices in the US.(47) In contrast, studies show that its information is often
not comprehensive enough, outdated or inconsistent.(47, 49) Other authors suggest
that in general it lacks basic clinical pharmacology information.(108)
In the US due to the lack of an official medicines information source produced by the
FDA, some compendia are considered authoritative sources for determining medically
accepted indications. According to Abernethy et al. the FDA is not equipped or
authorised to provide the up-to-date, rigorous and comprehensive review expected
from the compendia.(103) These specific compendia are used in oncology, where a
great part of anticancer drug prescriptions are written for off-label indications. In
oncology patients, the Centres for Medicare and Medicaid Services limit coverage of
these drugs to the indications listed in specific compendia. These ‘official’ or ‘standard’
compendia are approved by the Federal Centres for Medicare and Medicaid and are:
American Hospital Formulary Service-Drug Information (AHFS-DI)
National Comprehensive Cancer Network (NCCN) Drugs and Biologics
Compendium
Thomson Micromedex DrugDex
Clinical Pharmacology
One of the best known compendia worldwide is the British National Formulary (BNF).
The BNF is an independent professional publication, which is highly respected and so
widely used by healthcare professionals in the United Kingdom that in a recent study
100% of professionals who work with medicines reported using it.(109) It has been

31
translated into several languages for use outside the United Kingdom and has an
appendix for medicine interactions.
In 1939 the British Health Minister appointed a committee to prepare a wartime
formulary to contain a “selection of medications sufficient in range to meet ordinary
requirements of therapeutics” and the first edition of the BNF was published in
1949.(110) After the end of the war, it was the Royal Pharmaceutical Society and the
British Medical Association that wanted to continue the publication of a formulary for
general use. In 2010 its 60th issue was published. Since September 2005 there is also
a BNF for children (paediatric formulary). However, some authors argue that it does not
give clear information or practical advice to healthcare professionals (111), it is difficult
to read and understand (52), or has inconsistent categorisation of medicines.(52)
Cantrill analysed physicians prescribing outside the recommendations given in the BNF
and demonstrated that the circumstances under which prescriptions of general
practitioners do not conform to the BNF are: difficulty in applying the guidance of the
BNF, not being aware of it or not believing that the guidance was based on sound
evidence.(112)
Clinical guidelines
Clinical practice guidelines are “systematically developed statements to assist
practitioner and patient decisions about appropriate health care for specific clinical
circumstances”.(113) They are developed throughout the world to improve the quality
of healthcare. With the growth of evidence-based medicine in the 1990s, there has
been a movement towards scientific rigor in healthcare decisions. Clinical guidelines
are usually based on research evidence and consensus views of experts on a specific
topic.(114) This research evidence to produce guidelines is usually based on the use of
systematic reviews and meta-analyses.(115) (Please refer to the section ‘evidence’ in
this Introduction)
Recommendations in guidelines should be accompanied by a statement on the
strength of the evidence, which reflects “the extent to which confidence in an estimate
of the effect is adequate to support recommendations”.(116). When making clinical
decisions, healthcare professionals weigh up benefits and disadvantages of alternative
strategies and, after reaching a conclusion, they will be influenced by their confidence
in these estimates.(116) A categorisation of the quality of the evidence of
recommendations indicates whether the evidence is high quality (the desirable effects
clearly outweigh the undesirable effects) or there is a close or uncertain balance.(116)

32
The most used system of defining the quality of evidence is the GRADE system
(Grading of Recommendations Assessment, Development and Evaluation). The
GRADE system classifies quality of evidence into four levels: (117)
High quality: further research is very unlikely to change the confidence in the
estimate of effect
Moderate quality: further research is likely to have an important impact on our
confidence in the estimate of effect and may change the estimate.
Low quality: further research is very likely to have an important impact on our
confidence in the estimate of effect and is likely to change the estimate.
Very low quality: any estimate of effect is very uncertain.
The quality of the evidence is used in guidelines to determine the strength of the
recommendation, together with other three factors: balance between desirable and
undesirable effects, values and preferences, and costs.(118)
This GRADE system is widely used: organizations such as the World Health
Organization, the American College of Physicians and the Cochrane Collaboration
have adopted GRADE. However, some authors claim that the rating of the quality of
the evidence is inconsistent among guidelines.(116)
Other methods have been developed to analyse the quality of guidelines such as the
AGREE method (for a more in-depth description, please refer to the section
‘Characteristics of the information and analysis of its quality’ in this Introduction).
Managers in healthcare systems are aware of the need to ensure the quality of care
and guidelines help managers to differentiate these practices that constitute quality of
care.(116) Although clinical practice guidelines have been playing an increasing role in
clinical and decision-making in the last few years (113), most physicians do not adopt
guidelines into their prescribing habits.(47)
As shown by Grilli et al. guidelines developed by different groups on the same clinical
scenario have sometimes resulted in conflicting clinical recommendations.(119)
Authors such as Pencharz et al. point out that while guidelines contain similar
recommendations in areas where there is strong evidence, they make either no
recommendations or disagree on therapies for which the evidence is not so clear.(113)
Other authors suggest that cultural factors play an important role in the production of
guidelines, both in the selection of literature and in formulation of recommendations.
These cultural factors may be habits, patients’ expectations and the structure of the

33
healthcare system.(120) The same evidence was found to be used for opposite
conclusions.(120) Other studies analysing quality of guidelines conclude that while
rigour of development is moderate among most guidelines, many are difficult to apply,
few are reviewed externally and most do not consider the national or local care
systems or cultural or socioeconomic issues.(121)
Information from the pharmaceutical industry
The pharmaceutical industry plays a key role in the development, manufacturing and
distribution of medicines. In some countries it is also the main funder of continuing
medical education and research. The pharmaceutical sector is highly profitable and
companies are under pressure to continuously expand product sales. In 1993 the
World Health Organization already described that there was “an inherent conflict of
interest between the legitimate business goals of manufacturers and the social,
medical and economic needs of providers and the public to select and use drugs in the
most rational way”.(122)
The percentage of total sales revenues which is spent on marketing is almost twice as
much as that spent on research and development.(123) This expense, however, is an
investment, as increasing promotion is mostly associated with increasing sales.(124)
Pharmaceutical companies see how funding doctors increases requests from hospitals
for their marketed products to be included in hospital formularies.(124))
WHO defines drug promotion as: "all informational and persuasive activities by
manufacturers and distributors, the effect of which is to induce the prescription, supply,
purchase and/or use of medicinal drugs”.(125) By definition the aim of promotion is to
stimulate product sales.
Already in 1985 WHO developed a set of Ethical Criteria for Medicinal Drug Promotion.
These criteria were adopted by the 1988 World Health Assembly and were the result of
a consensus discussion involving health workers, drug regulatory agencies, consumers
and the industry.
The WHO Ethical Criteria state that promotion of medicines should:(125)
Be consistent with national health policies
Contain reliable claims, without misleading or unverifiable statements
Be accurate, truthful, informative, balanced, up-to-date, and in good taste.
Contain no omissions which could lead to health risks

34
Not be designed so as to disguise its real nature, for example as educational or
scientific activities.
When a pharmaceutical product is granted a marketing authorisation, it is accompanied
by the approved product information. This officially approved product information – in
the European Union Package Insert, Summary of Product Characteristics and
European Public Assessment Report – should serve as a basis to develop the
information provided by the pharmaceutical industry. To be consistent with the officially
approved information means strictly sticking to the indications approved and conditions
of use. Although it is forbidden that pharmaceutical companies promote a medicine for
unapproved indications, these ‘off-label’ indications appear commonly in medical
literature.(70)
According to Campbell, 94% of physicians have some type of relationship with the
pharmaceutical industry and most of these relationships involved receiving food in the
workplace, drug samples, reimbursement for professional meetings or continuing
medical education or direct payment for consulting, giving lectures, or enrolling patients
in clinical trials.(126) Many healthcare professionals believe that they are not
influenced by pharmaceutical promotion, but, on the other hand, they also believe that
their colleagues are affected by it.(127) In fact, studies show that physicians are more
influenced by promotion than they realise.(124) Most physicians believe that receiving
gifts from the industry is acceptable and that their prescribing is not influenced by those
gifts.(124) Physicians’ opinions on the usefulness of information from drug companies
vary, but most believe that such information is useful, although biased.(124)
Promotion is often used as a source of medicines information. The profile of physician
relying more on information provided by the industry is an older physician, seeing more
patients, generalist rather than specialist, with less access to peer support and a more
positive attitude to the use of drugs.(124) Promotion is also a very common source of
information for new medicines, in which physicians have less expertise.(124)
Pharmaceutical companies often use other influence techniques in their promotional
activities. Review of advertisements and other promotional information sources shows
that there is a consistent trend to exaggerate benefits of drugs while not mentioning or
underestimating harmful effects.(124) This information may then be misleading for
healthcare professionals. There are also other ways of providing misleading
information, such as inclusion of flawed information (exaggerated, inaccurate,
ambiguous or oversimplified), omission of relevant information or distraction with
irrelevant information.(8)

35
Advertisements in journals
It is almost impossible for physicians today to read a medical journal and not find a new
medication promising to change the course of a disease.(48) Although pharmaceutical
companies spend only a small percentage of marketing expenses on advertisements in
scientific journals (8), they are successful in increasing sales.(128) Some authors claim
that physicians using journal advertisements as an information source prescribe less
appropriately.(129)
Journal advertisements should contain at least the information described in the WHO
Ethical criteria (125), which is name of medicine and manufacturer, indications, key
beneficial and harmful effects, and references to scientific evidence. Nevertheless,
although all these criteria are included, the advertisement may not promote the most
appropriate use.(8) Data, graphics, images and other elements should be carefully
evaluated to critically appraise advertisements.(8)
Many studies show that reviews by journal editors do not provide effective control in
drug advertisements, and these advertisements often do not meet the regulations and
guidelines of the countries where they are published.(124)
Ghost writing
Another form of medicine promotion by the pharmaceutical industry is ghost writing.
Ghost writing consists of publishing research articles with academic authors but written
by pharmaceutical company employees or third companies working for the
pharmaceutical industry. To control ghost writing, most scientific journals have
strengthened guidelines for authorship. However, according to Wislar et al. 21% of
articles published in major scientific journals in 2008 had either honorary or ghost
authorship.(130) Other studies show that research often does not disclose funding from
the industry.(124)
Additionally, most journals publish company-sponsored supplements, which are mainly
extra journal issues consisting of reports of sponsored symposia. In these cases
pharmaceutical companies, paying to publish the report, have a large degree of control
over the content.(8)
Research funded by pharmaceutical companies shows more likely results favourable to
the product being studied than research funded from other sources. There is an
association between the opinions of investigators about products and their source of
36
funding but causality has not been established.(124) Funding not only influences
results of research but also the topics studied.(124)
Pharmaceutical sales representatives
In general, most of sales representatives’ time is spent in direct contact with practising
healthcare professionals. This form of promotion, which is also called ‘detailing’,
represents a high percentage of the budget that pharmaceutical companies spend on
marketing. In 2004, it was estimated that there were 90,000 sales representatives in
the United States, spending more than US$ 10 billion on promotion, which may
account for more than a quarter of the total marketing expenditure.(8)
Evidence shows that information provided by sales representatives is often incomplete
and biased.(131, 132) The information is not balanced, underestimating potential risks
and harmful effects of the medicine and highlighting its benefits. Little information is
given about interactions, adverse effects or contraindications.(131, 132) Although
opinions vary, most physicians also recognise that information provided by sales
representatives is biased.(124)
According to Caudill et al. the frequency of use of information provided by sales
representatives is associated with increased primary care physician prescribing
costs.(133) Other authors have also shown that physicians relying more on promotional
information prescribe less appropriately, prescribe more often or prescribe new drugs
more quickly.(124) Studies show that guidelines and regulations controlling
pharmaceutical sales representatives’ promotion activities are not effective.(124)
Pharmaceutical company drug information centres
Pharmaceutical company drug information centres were established to provide medical
information about company products in response to a request either from healthcare
professionals or from patients. These centres provide information from published
sources, but sometimes also from unpublished resources, such as data from internal
stability studies or details of study methods. Because these data may have legal,
regulatory or medical implications, pharmaceutical companies have specific policies
regarding the use of this unpublished information and the provision of this information
through pharmaceutical company drug information centres. In a study carried out by
Cudny et al. 20% of specialists in pharmaceutical company drug information centres
failed to reference the American package insert when answering questions on drug
safety. Even when they use the package insert as a source, company drug information

37
centres may provide inaccurate or outdated information. Additionally, resources used to
answer safety questions are those which are usually already available in a community
pharmacy.(134) In another study in the European Union, Fernandez-Llimos et al. found
that when asking pharmaceutical company drug information centres for more
information than that included in the SmPC for new medicines, nearly 47% of
pharmaceutical companies did not send any information, 18% sent a minimal reply and
9% sent unacceptable information. Only 27% returned additional information.(135)
38
Justification of the research
Medicines information for healthcare professionals is paramount in clinical practice. A
thorough knowledge of different aspects of medicines information for healthcare
professionals will allow the assessment of its quality and thus improve its usefulness,
optimising clinical care.
There is a wide range of medicines information sources designed for healthcare
professionals, each with different properties regarding characteristics such as
accessibility, reliability, completeness or applicability. With the aim of assessing
medicines information sources to optimise clinical care, research should be conducted
using a practical approach. Consequently, to focus on medicines information sources
used in clinical practice, the assessment of preferences of healthcare professionals
concerning medicines information sources should be the cornerstone of this study.
Once identified the most commonly used medicines information sources, factors
impacting on their quality should be evaluated.
Accessibility to medicines information sources is one of the main characteristics and
barriers to the use of medicines information sources.(39, 40) The analysis of availability
of highly regarded medicines information sources should be one of the main
characteristics to be evaluated. Furthermore, completeness of medicines information
sources is a major need of healthcare professionals for decision making.(23) Although
the general concept of completeness may appear as subjective, completeness may be
addressed from a practical perspective, focusing on specific areas relevant in clinical
practice. Clinical pharmacology information and information about safety have been
considered key in this study to support decision making of healthcare professionals.
Finally, in order to provide healthcare professionals with medicines information sources
adapted to their real needs, a description of the content of the ideal source of
information for healthcare professionals is a challenging goal that should allow us not
only to design more applicable new information sources, but also to assess and
improve the already existing information sources.

39
1. Capurro R. Information: Ein Beitrag zur etymologischen und ideengeschichtlichen Begründung des Informationsbegriffs. München, New York, London, Paris: Saur Verlag; 1978.
2. Capurro R, Hjørland B. The concept of information: B Cronin; 2003. 3. Dretske F. Knowledge and the flow of information. Cambridge, MA: MIT Press;
1981. 4. Von Foerster H. Observing systems. Seaside, CA: Intersystems Publications;
1984. 5. Ray WA, Griffin MR, Avorn J. Evaluating drugs after their approval for clinical
use. N Engl J Med. 1993 Dec 30;329(27):2029-32. 6. Cox AR, Butt TF, Ferner RE. An analysis and comparison of commonly available
United Kingdom prescribing resources. J Clin Pharm Ther. 2009 Aug;35(4):453-64.
7. Fusier I, Tollier C, Husson MC. Infovigilance: reporting errors in official drug information sources. Pharm World Sci. 2005 Jun;27(3):166-9.
8. World Health Organization/Health Action International. Understanding and responding to pharmaceutical promotion, 2011.
9. Smith R. What clinical information do doctors need? BMJ. 1996 Oct 26;313(7064):1062-8.
10. Gonzalez-Gonzalez AI, Dawes M, Sanchez-Mateos J, Riesgo-Fuertes R, Escortell-Mayor E, Sanz-Cuesta T, Hernandez-Fernandez T. Information needs and information-seeking behavior of primary care physicians. Ann Fam Med. 2007 Jul-Aug;5(4):345-52.
11. Haynes RB, McKibbon KA, Fitzgerald D, Guyatt GH, Walker CJ, Sackett DL. How to keep up with the medical literature: VI. How to store and retrieve articles worth keeping. Ann Intern Med. 1986 Dec;105(6):978-84.
12. Garcia G, Alberola C. Informacion sobre medicamentos. Rev AEFH. 1984;4:5-18. 13. Gaebelein C, Gleason B. Contemporary drug information: an evidence-based
approach2008. 14. Castillo P. Promoción y Publicidad de medicamentos: quo vadis? . Med Clin
(Barc) 1992;99:305-9. 15. National Coordinating Council on Medication Error Reporting and Prevention.
About medication errors. www.nccmerp.org (accessed 6 Jun 2010). 16. Jimeno V. La información sobre medicamentos: posiciones actuales. CIF.
1987;6(2):307-11. 17. Phillips JO, Strand LM, Chesteen SA, Morley PC. Functional and structural
prerequisites for clinical pharmacy services. Am J Hosp Pharm. 1987 Jul;44(7):1598-605.
18. Garcia Alvarez C. Informar del medicamento, tan importante como descubrirlo. Indufarma. 1991;3:10-8.
19. Talking about drug treatments - Who should say what to whom? - The second DTB symposium. Drug Therapeutic Bulletin 1994;32(5):35-7.
20. Huth EJ. The underused medical literature. Ann Intern Med. 1989 Jan 15;110(2):99-100.
21. Iwanowicz SL, Marciniak MW, Zeolla MM. Obtaining and providing health information in the community pharmacy setting. Am J Pharm Educ. 2006 Jun 15;70(3):57.
22. McMullan M. Patients using the Internet to obtain health information: how this affects the patient-health professional relationship. Patient Educ Couns. 2006 Oct;63(1-2):24-8.
23. Jackson R, Baird W, Davis-Reynolds L, Smith C, Blackburn S, Allsebrook J. The information requirements and information-seeking behaviours of health and social care professionals providing care to children with health care needs: a pilot study. Health Info Libr J. 2007 Jun;24(2):95-102.

40
24. Ely JW, Osheroff JA, Ebell MH, Chambliss ML, Vinson DC, Stevermer JJ, Pifer EA. Obstacles to answering doctors' questions about patient care with evidence: qualitative study. BMJ. 2002 Mar 23;324(7339):710.
25. Davies K, Harrison J. The information-seeking behaviour of doctors: a review of the evidence. Health Info Libr J. 2007 Jun;24(2):78-94.
26. Holmboe ES, Lipner R, Greiner A. Assessing quality of care: knowledge matters. Jama. 2008 Jan 23;299(3):338-40.
27. Gorman P. Information needs in primary care: a survey of rural and nonrural primary care physicians. Medinfo. 2001;10(Pt 1):338-42.
28. Magrabi F, Coiera EW, Westbrook JI, Gosling AS, Vickland V. General practitioners' use of online evidence during consultations. Int J Med Inform. 2005 Jan;74(1):1-12.
29. Ely JW, Osheroff JA, Ebell MH, Bergus GR, Levy BT, Chambliss ML, Evans ER. Analysis of questions asked by family doctors regarding patient care. BMJ. 1999 Aug 7;319(7206):358-61.
30. Ely JW, Osheroff JA, Maviglia SM, Rosenbaum ME. Patient-care questions that physicians are unable to answer. J Am Med Inform Assoc. 2007 Jul-Aug;14(4):407-14.
31. Hedegaard U, Damkier P. Problem-oriented drug information: physicians' expectations and impact on clinical practice. Eur J Clin Pharmacol. 2009 May;65(5):515-22.
32. Ely JW, Osheroff JA, Chambliss ML, Ebell MH, Rosenbaum ME. Answering physicians' clinical questions: obstacles and potential solutions. J Am Med Inform Assoc. 2005 Mar-Apr;12(2):217-24.
33. McEntee JE, Henderson SL, Rutter PM, Rutter J, Davis HJ. Utility and value of a medicines information service provided by pharmacists: a survey of health professionals. Int J Pharm Pract. 2010 Dec;18(6):353-61.
34. Schjott J, Pomp E, Gedde-Dahl A. Quality and impact of problem-oriented drug information: a method to change clinical practice among physicians? Eur J Clin Pharmacol. 2002 Feb;57(12):897-902.
35. Bennett NL, Casebeer LL, Kristofco R, Collins BC. Family physicians' information seeking behaviors: a survey comparison with other specialties. BMC Med Inform Decis Mak. 2005;5(1):9.
36. Education TACftAoP. Educational outcomes. 2004. 37. Bernknopf AC, Karpinski JP, McKeever AL, Peak AS, Smith KM, Smith WD,
Timpe EM, Ward KE. Drug information: from education to practice. Pharmacotherapy. 2009 Mar;29(3):331-46.
38. Molloy W, Strang D, Guyatt G, Lexchin J, Bedard M, Dubois S, Russo R. Assessing the quality of drug detailing. J Clin Epidemiol. 2002 Aug;55(8):825-32.
39. Fernandez-LLimos F. La informacion sobre medicamentos para la farmacia comunitaria. Pharm Care Esp. 1999;1:90-6.
40. Shaughnessy AF, Slawson DC, Bennett JH. Becoming an information master: a guidebook to the medical information jungle. J Fam Pract. 1994 Nov;39(5):489-99.
41. Hibble A, Kanka D, Pencheon D, Pooles F. Guidelines in general practice: the new Tower of Babel? BMJ. 1998 Sep 26;317(7162):862-3.
42. Rahmner PB, Eiermann B, Korkmaz S, Gustafsson LL, Gruven M, Maxwell S, Eichle HG, Veg A. Physicians' reported needs of drug information at point of care in Sweden. Br J Clin Pharmacol. Jan;73(1):115-25.
43. Maxwell S, Eichler HG, Bucsics A, Haefeli WE, Gustafsson LL. e-SPC - delivering drug information in the 21st century: developing new approaches to deliver drug information to prescribers. Br J Clin Pharmacol. Jan;73(1):12-5.
44. O'Connor AB. The need for improved access to FDA reviews. JAMA. 2009 Jul 8;302(2):191-3.

41
45. Martin-Facklam M, Kostrzewa M, Schubert F, Gasse C, Haefeli WE. Quality markers of drug information on the Internet: an evaluation of sites about St. John's wort. Am J Med. 2002 Dec 15;113(9):740-5.
46. Trifiro G, Corrao S, Alacqua M, Moretti S, Tari M, Caputi AP, Arcoraci V. Interaction risk with proton pump inhibitors in general practice: significant disagreement between different drug-related information sources. Br J Clin Pharmacol. 2006 Nov;62(5):582-90.
47. Cohen JS. Dose discrepancies between the Physicians' Desk Reference and the medical literature, and their possible role in the high incidence of dose-related adverse drug events. Arch Intern Med. 2001 Apr 9;161(7):957-64.
48. Bates DW. Drugs and adverse drug reactions: how worried should we be? JAMA. 1998 Apr 15;279(15):1216-7.
49. Lasser KE, Allen PD, Woolhandler SJ, Himmelstein DU, Wolfe SM, Bor DH. Timing of new black box warnings and withdrawals for prescription medications. JAMA. 2002 May 1;287(17):2215-20.
50. Mahler G. Information. New questions to a multidisciplinary concept. Jacoby KKK, editor. Berlin, Germany: Akademie Verlag.; 1996.
51. Probst G, Raub S, Romhard K. Managing Knowledge. London: Wiley; 1999. 52. Aronson JK. Drug interactions-information, education, and the British National
Formulary. Br J Clin Pharmacol. 2004 Apr;57(4):371-2. 53. Curley SP, Connelly DP, Rich EC. Physicians' use of medical knowledge
resources: preliminary theoretical framework and findings. Med Decis Making. 1990 Oct-Dec;10(4):231-41.
54. Berland GK, Elliott MN, Morales LS, Algazy JI, Kravitz RL, Broder MS, Kanouse DE, Munoz JA, Puyol JA, Lara M, Watkins KE, Yang H, McGlynn EA. Health information on the Internet: accessibility, quality, and readability in English and Spanish. JAMA. 2001 May 23-30;285(20):2612-21.
55. Eysenbach G. Infodemiology: The epidemiology of (mis)information. Am J Med. 2002 Dec 15;113(9):763-5.
56. Eysenbach G, Powell J, Kuss O, Sa ER. Empirical studies assessing the quality of health information for consumers on the world wide web: a systematic review. JAMA. 2002 May 22-29;287(20):2691-700.
57. US Food and Drug Administration. How to evaluate health information on the internet; Available from: http://www.fda.gov/Drugs/ResourcesForYou/Consumers/BuyingUsingMedicineSafely/BuyingMedicinesOvertheInternet/ucm202863.htm (accessed 10 Nov 2011)
58. European Federation of Pharmaceutical Industries and Associations. Guidelines for Internet websites 2001. http://www.efpia.org/Objects/2/Files/Internetguidelines.pdf (accessed 8 Dec 2011)
59. Silberg WM, Lundberg GD, Musacchio RA. Assessing, controlling, and assuring the quality of medical information on the Internet: Caveant lector et viewor--Let the reader and viewer beware. JAMA. 1997 Apr 16;277(15):1244-5.
60. Foundation HOtN. Our commitment to relaiable health and medical information. [Nov 2011]; Available from: http://www.hon.ch/HONcode/Pro/Visitor/visitor.html
61. Narhi U, Pohjanoksa-Mantyla M, Karjalainen A, Saari JK, Wahlroos H, Airaksinen MS, Bell SJ. The DARTS tool for assessing online medicines information. Pharm World Sci. 2008 Dec;30(6):898-906.
62. AGREE Next Steps Consortium 2009. The AGREE II Instrument [Electronic version]; Available from: http://www.agreetrust.org (accessed 8 Dec 2011)
63. Bravo Toledo R. Informacion y documentacion cientifica: busqueda de evidencias.2008.
64. Turner EH, Matthews AM, Linardatos E, Tell RA, Rosenthal R. Selective publication of antidepressant trials and its influence on apparent efficacy. N Engl J Med. 2008 Jan 17;358(3):252-60.

42
65. Dwan K, Altman DG, Arnaiz JA, Bloom J, Chan AW, Cronin E, Decullier E, Easterbrook PJ, Von Elm E, Gamble C, Ghersi D, Ioannidis JP, Simes J, Williamson PR. Systematic review of the empirical evidence of study publication bias and outcome reporting bias. PLoS One. 2008;3(8):e3081.
66. Dickersin K, Min YI. NIH clinical trials and publication bias. Online J Curr Clin Trials. 1993 Apr 28;Doc No 50:[4967 words; 53 paragraphs].
67. DeAngelis CD, Fontanarosa PB. Impugning the integrity of medical science: the adverse effects of industry influence. JAMA. 2008 Apr 16;299(15):1833-5.
68. Ross JS, Hill KP, Egilman DS, Krumholz HM. Guest authorship and ghostwriting in publications related to rofecoxib: a case study of industry documents from rofecoxib litigation. JAMA. 2008 Apr 16;299(15):1800-12.
69. Federal Food, Drug, and Cosmetic Act Sect. 201 (21 U.S.C. 321) (1938). 70. U.S. Congress. Office of Technology Assessment. Drug Labeling in Developing
Countries. Washington D.C.1993. Report No.: OTA-H-464. 71. US Department of Health and Human Services Food and Drug Administration.
Guidance for industry development and use of risk minimization action plans. Center for drug evaluation and research (CDER); http://www.state.gov/s/inr/rls/4250.htm (accessed 29 Aug 2011).
72. Willy ME, Li Z. What is prescription labeling communicating to doctors about hepatotoxic drugs? A study of FDA approved product labeling. Pharmacoepidemiol Drug Saf. 2004 Apr;13(4):201-6.
73. Herxheimer A. Basic information that prescribers are not getting about drugs. Lancet. 1987 Jan 3;1(8523):31-3.
74. Stone PW. Popping the (PICO) question in research and evidence-based practice. Appl Nurs Res. 2002 Aug;15(3):197-8.
75. Haynes RB. Of studies, syntheses, synopses, summaries, and systems: the "5S" evolution of information services for evidence-based healthcare decisions. Evid Based Med. 2006 Dec;11(6):162-4.
76. Duke University Medical Center Library and Health Sciences Library U-CH. Introduction to evidence-based medicine. 2010; Available from: http://www.hsl.unc.edu/Services/Tutorials/EBM/index.htm.
77. European_Commission. Notice to applicants: a guideline on Summary of Product Characteristics. 2009.
78. Savill N, Bushe CJ. A systematic review of the safety information contained within the Summaries of Product Characteristics of medications licensed in the United Kingdom for Attention Deficit Hyperactivity Disorder. how does the safety prescribing advice compare with national guidance? Child Adolesc Psychiatry Ment Health. 2012;6(1):2.
79. Wall AJ, Bateman DN, Waring WS. Variability in the quality of overdose advice in Summary of Product Characteristics (SPC) documents: gut decontamination recommendations for CNS drugs. Br J Clin Pharmacol. 2009 Jan;67(1):83-7.
80. European_Medicines_Agency. Clinical Safety Data Management:Periodic Safety Update Reports for Marketed Drugs. ICH Topic E 2 C (R1) [serial on the Internet]. 1997.
81. G10 Medicines Group. G10 Medicines Report. Recommendations for action. http://ec.europa.eu/enterprise/sectors/healthcare/files/phabiocom/docs/g10-medicines_en.pdf (accessed 6 Nov 2011)
82. Entwistle VA, Watt IS. Disseminating information about healthcare effectiveness: a survey of consumer health information services. Qual Health Care. 1998 Sep;7(3):124-9.
83. Pharmaceutical Committee European Commission. A guideline on the readability of the label and package leaflet of medicinal products for human use. Brussels: EC, 1998.
84. Raynor DK, Britten N. Medicine information leaflets fail concordance test. BMJ. 2001 Jun 23;322(7301):1541.

43
85. Bjerrum L, Foged A. Patient information leaflets--helpful guidance or a source of confusion? Pharmacoepidemiol Drug Saf. 2003 Jan-Feb;12(1):55-9.
86. Fuchs J, Hippius M, Schaefer M. Analysis of German package inserts. Int J Clin Pharmacol Ther. 2006 Jan;44(1):8-13.
87. Amerson AB, Wallingford DM. Twenty years' experience with drug information centers. Am J Hosp Pharm. 1983 Jul;40(7):1172-8.
88. Frost Widnes SK, Schjott J. Drug use in pregnancy--physicians' evaluation of quality and clinical impact of drug information centres. Eur J Clin Pharmacol. 2009 Mar;65(3):303-8.
89. Frost Widnes SK, Schjott J. Advice on drug safety in pregnancy: are there differences between commonly used sources of information? Drug Saf. 2008;31(9):799-806.
90. Greene JA, Kesselheim AS. Pharmaceutical marketing and the new social media. N Engl J Med. 2010 Nov 25;363(22):2087-9.
91. Eysenbach G. Infodemiology and infoveillance: framework for an emerging set of public health informatics methods to analyze search, communication and publication behavior on the Internet. J Med Internet Res. 2009;11(1):e11.
92. Mack J. Quality of medical information on the Internet. JAMA. 1997 Aug 27;278(8):632; author reply -3.
93. Bennett NL, Casebeer LL, Zheng S, Kristofco R. Information-seeking behaviors and reflective practice. J Contin Educ Health Prof. 2006 Spring;26(2):120-7.
94. Jeff A. Formularies and pharmacopoeias. BMJ. 2011-01-18 00:00:00;342. 95. Andrews JE, Pearce KA, Ireson C, Love MM. Information-seeking behaviors of
practitioners in a primary care practice-based research network (PBRN). J Med Libr Assoc. 2005 Apr;93(2):206-12.
96. Dawes M, Sampson U. Knowledge management in clinical practice: a systematic review of information seeking behavior in physicians. Int J Med Inform. 2003 Aug;71(1):9-15.
97. Vitry AI. Comparative assessment of four drug interaction compendia. Br J Clin Pharmacol. 2007 Jun;63(6):709-14.
98. Martins MA, Carlos PP, Ribeiro DD, Nobre VA, Cesar CC, Rocha MO, Ribeiro AL. Warfarin drug interactions: a comparative evaluation of the lists provided by five information sources. Eur J Clin Pharmacol. Jun 24.
99. Abarca J, Malone DC, Armstrong EP, Grizzle AJ, Hansten PD, Van Bergen RC, Lipton RB. Concordance of severity ratings provided in four drug interaction compendia. J Am Pharm Assoc (2003). 2004 Mar-Apr;44(2):136-41.
100. Fulda TR VR, Zanden JV, Parker S, Byrns PJ. Disagreement Among Drug Compendia on Inclusion and Ratings of Drug-Drug Interactions. Current therapeutic research. 2000;61(8):540-8.
101. Chao SD, Maibach HI. Lack of drug interaction conformity in commonly used drug compendia for selected at-risk dermatologic drugs. Am J Clin Dermatol. 2005;6(2):105-11.
102. Wong CM, Ko Y, Chan A. Clinically significant drug-drug interactions between oral anticancer agents and nonanticancer agents: profiling and comparison of two drug compendia. Ann Pharmacother. 2008 Dec;42(12):1737-48.
103. Abernethy AP, Raman G, Balk EM, Hammond JM, Orlando LA, Wheeler JL, Lau J, McCrory DC. Systematic review: reliability of compendia methods for off-label oncology indications. Ann Intern Med. 2009 Mar 3;150(5):336-43.
104. Guo JJ, Wigle PR, Lammers K, Vu O. Comparison of potentially hepatotoxic drugs among major US drug compendia. Res Social Adm Pharm. 2005 Sep;1(3):460-79.
105. Brubacher JR, Purssell R, Kent DA. Salty broth for salicylate poisoning? Adequacy of overdose management advice in the 2001 Compendium of Pharmaceuticals and Specialties. Cmaj. 2002 Oct 29;167(9):992-6.

44
106. Young L, Lawes F, Tordoff J, Norris P, Reith D. Access to prescribing information for paediatric medicines in the USA: post-modernization. Br J Clin Pharmacol. 2009 Mar;67(3):341-6.
107. Cohen JS, Insel PA. The Physicians' Desk Reference. Problems and possible improvements. Arch Intern Med. 1996 Jul 8;156(13):1375-80.
108. Spyker DA, Harvey ED, Harvey BE, Harvey AM, Rumack BH, Peck CC, Atkinson AJ, Jr., Woosley RL, Abernethy DR, Cantilena LR. Assessment and reporting of clinical pharmacology information in drug labeling. Clin Pharmacol Ther. 2000 Mar;67(3):196-200.
109. Kendall M, Enright D. Provision of medicines information: the example of the British National Formulary. Br J Clin Pharmacol. 2012 Jun;73(6):934-8.
110. Wade OL. British National Formulary: its birth, death, and rebirth. BMJ. 1993 Apr 17;306(6884):1051-4.
111. Vidal L, Shavit M, Fraser A, Paul M, Leibovici L. Systematic comparison of four sources of drug information regarding adjustment of dose for renal function. BMJ. 2005 Jul 30;331(7511):263.
112. Cantrill JA. Measuring the appropriateness of long-term prescribing in United Kingdom general practice--is the British National Formulary the 'gold standard'? J Clin Pharm Ther. 2000 Oct;25(5):341-6.
113. Pencharz JN, Grigoriadis E, Jansz GF, Bombardier C. A critical appraisal of clinical practice guidelines for the treatment of lower-limb osteoarthritis. Arthritis Res. 2002;4(1):36-44.
114. Raine R, Sanderson C, Black N. Developing clinical guidelines: a challenge to current methods. BMJ. 2005 Sep 17;331(7517):631-3.
115. Burgers JS, Grol R, Klazinga NS, Makela M, Zaat J. Towards evidence-based clinical practice: an international survey of 18 clinical guideline programs. Int J Qual Health Care. 2003 Feb;15(1):31-45.
116. Guyatt GH, Oxman AD, Vist GE, Kunz R, Falck-Ytter Y, Alonso-Coello P, Schunemann HJ. GRADE: an emerging consensus on rating quality of evidence and strength of recommendations. BMJ. 2008 Apr 26;336(7650):924-6.
117. Atkins D, Eccles M, Flottorp S, Guyatt GH, Henry D, Hill S, Liberati A, O'Connell D, Oxman AD, Phillips B, Schunemann H, Edejer TT, Vist GE, Williams JW, Jr. Systems for grading the quality of evidence and the strength of recommendations I: critical appraisal of existing approaches The GRADE Working Group. BMC Health Serv Res. 2004 Dec 22;4(1):38.
118. Guyatt GH, Oxman AD, Kunz R, Falck-Ytter Y, Vist GE, Liberati A, Schunemann HJ. Going from evidence to recommendations. BMJ. 2008 May 10;336(7652):1049-51.
119. Grilli R, Magrini N, Penna A, Mura G, Liberati A. Practice guidelines developed by specialty societies: the need for a critical appraisal. Lancet. 2000 Jan 8;355(9198):103-6.
120. Christiaens T, De Backer D, Burgers J, Baerheim A. Guidelines, evidence, and cultural factors. Scand J Prim Health Care. 2004 Sep;22(3):141-5.
121. Gaebel W, Weinmann S, Sartorius N, Rutz W, McIntyre JS. Schizophrenia practice guidelines: international survey and comparison. Br J Psychiatry. 2005 Sep;187:248-55.
122. World_Health_Organization. Clinical Pharmacological Evaluation in Drug Control. Copenhaguen1993.
123. Gagnon MA, Lexchin J. The cost of pushing pills: a new estimate of pharmaceutical promotion expenditures in the United States. PLoS Med. 2008 Jan 3;5(1):e1.
124. Norris P, Lexchin J, Herxeimer A, Mansfield P. Drug promotion: what we know, what we have yet to learn: WHO/HAI2005.
125. World_Health_Organization. Ethical criteria for medicinal drug promotion. Geneva1988.

45
126. Campbell EG, Gruen RL, Mountford J, Miller LG, Cleary PD, Blumenthal D. A national survey of physician-industry relationships. N Engl J Med. 2007 Apr 26;356(17):1742-50.
127. Zipkin DA, Steinman MA. Interactions between pharmaceutical representatives and doctors in training. A thematic review. J Gen Intern Med. 2005 Aug;20(8):777-86.
128. Bower AD, Burkett GL. Family physicians and generic drugs: a study of recognition, information sources, prescribing attitudes, and practices. J Fam Pract. 1987 Jun;24(6):612-6.
129. Ferry ME, Lamy PP, Becker LA. Physicians' knowledge of prescribing for the elderly. A study of primary care physicians in Pennsylvania. J Am Geriatr Soc. 1985 Sep;33(9):616-25.
130. Wislar JS, Flanagin A, Fontanarosa PB, Deangelis CD. Honorary and ghost authorship in high impact biomedical journals: a cross sectional survey. BMJ.343:d6128.
131. Ziegler MG, Lew P, Singer BC. The accuracy of drug information from pharmaceutical sales representatives. JAMA. 1995 Apr 26;273(16):1296-8.
132. Lexchin J. What information do physicians receive from pharmaceutical representatives? Can Fam Physician. 1997 May;43:941-5.
133. Caudill TS, Johnson MS, Rich EC, McKinney WP. Physicians, pharmaceutical sales representatives, and the cost of prescribing. Arch Fam Med. 1996 Apr;5(4):201-6.
134. Cudny ME, Graham AS. Adverse-drug-event data provided by pharmaceutical companies. Am J Health Syst Pharm. 2008 Jun 1;65(11):1071-5.
135. Fernandez-Llimos F, Vazquez Gomez I. Information provided by generic and brand-name pharmaceutical manufacturers in response to a request. Pharm World Sci. 2007 Dec;29(6):683-7.

46

Chapter 2
Thesis Objectives

48
Research objectives
General objective: The general objective of this study is the assessment of the
characteristics of medicines information sources designed for healthcare professionals.
Specific objectives:
In addressing the general objective, the research was divided into five specific
objectives. The specific objectives for this research were as follows:
Objective 1: to assess the preferences regarding medicines information sources
among healthcare practitioners and researchers from the entire World.
Objective 2: to evaluate which countries publish their own drug compendia and assess
what factors are associated with drug compendia publishing in the world.
Objective 3: to assess the clinical pharmacology information provided in the
Summaries of Product Characteristics (SmPCs) of European drugs compared to their
package inserts.
Objective 4: to assess completeness of drug information related to safety in European
SmPCs regarding fertility and use of medicines in pregnancy and lactation.
Objective 5: to design a universal tool to evaluate the content of drug information
sources for healthcare professionals.

Chapter 3
Assessment of medicines information sources
used by healthcare professionals
and researchers in the World

50
Background
The healthcare environment is increasingly demanding for healthcare professionals.
The huge amount of treatments available, expanding indications and complexity of
treatment regimens, poly-pharmacy and elderly patients are some of the reasons that
challenge healthcare professionals today.(1) Moreover, the continuously changing
scenario, in which good prescribing today may not necessarily be so in a year, makes
the provision of appropriate information of vital importance in clinical care.(1)
As mentioned in the Chapter one: Introduction (section ‘Medicines information for
healthcare professionals), although professionals receive a range of information
resources on a daily basis (such as scientific and professional journals, newsletters, e-
mail alerts and discussion lists, among others) only a small number of professionals
are satisfied with this provision of information.(2) Seeking information is a frequent
routine for healthcare professionals, and according to Jackson et al., 79% of
professionals perform searches for information, female professionals being more likely
than males to perform searches (85% versus 75%).(2) Loza et al. found that 83% of
community pharmacists consulted medicines information sources regularly.(3)
Professionals need to be able to access information in response to information needs
as they arise (4), and searches for information are often performed in the presence of
the patient.(5, 6) According to Bastholm et al. it is essential for physicians to have
concise medicines information sources available at point of care in order to ensure the
right medicine is prescribed to the right patient in the correct dose.(7)
Several authors have tried to evaluate which information resources are preferred by
healthcare professionals (for more information please refer to chapter 1, Introduction,
section ‘Medicines information for healthcare professionals’). However, most of these
studies concentrate on specific professionals, mainly physicians.
Results of studies are controversial. In the last few years, studies showed that the two
information sources mostly used by physicians are textbooks, followed by
colleagues.(8) Physicians want to know that the information they are using is
documented by experts, up-to-date, structured and short.(7)
The use of electronic sources is variable among studies. The use of computer
searches was reported by only 13% physicians (8), and according to Andrews et al.,
40% of practitioners never or almost never perform literature searches from online
sources.(6) In contrast, other authors have highlighted the general use of online

51
evidence in clinical practice (9), and according to more recent studies, Internet
searches may be the preferred source of retrieving information.(2) According to
Jackson et al., healthcare professionals most frequently use the Internet to perform
searches, followed by informal networks and library and written resources.(2). Other
recent studies consider that professionals mainly use compendia such as the British
National Formulary (BNF) to aid decisions at point of care, and digital resources are
used for review, education and continuing professional development.(10)
In conclusion, although some authors argue that the provision of information to
prescribing in the form of books of reference information is ‘no longer fit for purpose’
(1), others show that practitioners do not use online information resources as much as
print resources.(6) Internet may also be used to search for specific patient problems or
the latest research, but some authors report that few physicians use the Internet during
patient visits. For information about new therapeutic options and management of
complex cases, most physicians consult colleagues and printed sources.(11)
Some authors have considered that the transition from printed text to electronic
resources may lead to a blurring of the line between information and
misinformation.(12) Ideally, electronic drug information, instantly available and
interfacing with the electronic health record and decision support systems may be the
solution for prescribers, provided that an authoritative, standardized, validated and
regularly updated system is developed.(1) Prescribers need instantly available
electronic drug information, capable of interfacing with electronic health records and
decision support systems, but this kind of information systems are not available yet.(1)
Although the computerization of healthcare has increased enormously in the last few
decades, integrated information support systems are not standardized yet.(7) When
asked about the preferred information format for future information delivery, most
healthcare professionals choose electronic formats such as intranets and information
delivered through the Internet.(2)
Primary care physicians and their information-seeking behaviours have been
thoroughly analysed, maybe because general practitioners prescribe 98% of medicines
in primary care.(13) Primary care physicians have limited access to colleagues
compared to specialists (14), and this may be one of the reasons why primary care
physicians prefer journals as a source of information, followed by meetings and
websites.(14) Other authors have also stated that, in comparison to specialists, general
practitioners have a reduced preference for electronic formats, and they prefer
personal collections of written materials.(2) According to McGettigan et al., general

52
practitioners choose compendia as their preferred source, followed by journal articles,
clinical meetings and colleagues. However, for the latest ‘new’ drugs prescribed,
general practitioners receive information through pharmaceutical representatives and
hospital recommendations.(15)
In a study with paediatricians, Kim et al. suggested that the resources mostly used by
these physicians are specialists and generalist colleagues, followed by medicines
compendia and specialty textbooks.(16) Generalist colleagues were, in general,
contacted for confirmation of findings and discussion of diagnostic and management
decisions, and contact was usually face-to-face. Paediatric textbooks were mostly
selected when seeking drug dosing, information about cardiology, dermatology,
genetics, infectious diseases and disease-specific protocols. For information about
medicines (dosing, adverse reactions, packaging information, new treatments, etc),
drug compendia were selected. Guidelines were used for disease management and
continuing education.(16) To access guidelines and other information, professional
organization and federal health Websites were also selected.(16)
In a study in community pharmacies, Loza et al. identified printed resources as the
most used source of information. Among printed texts, medicines compendia were the
preferred source of information. (3) According to Zehnder et al., medicines compendia
are also the preferred source of information for community pharmacies, followed by
information provided by manufacturers, journals and textbooks. The use of Internet was
variable among pharmacists.(17) More recent studies show that community
pharmacists most frequently seek information on drug interactions in their electronic
drug management systems, however most pharmacists are not satisfied about the
information present in these systems.(18)

53
Objective
The aim of this study was to assess preferences regarding medicines information
sources among healthcare practitioners and researchers from the entire World.
54
Methods
In order to serve as a basis to establish the perceived importance of different
medicines information sources for healthcare professionals, an exploratory study was
performed by means of a global survey.
Sample
In order to define the list of countries in the world, an up-to-date list of the independent
ones was selected from the US Department of State (Bureau of Intelligence and
Research) webpage (19), and from the Central Intelligence Agency webpage (“CIA:
The World Factbook”).(20) Countries or independent states refer to “a people politically
organized into a sovereign state with a definite territory recognized as independent by
the United States”.(19) This list comprised 193 countries.
To avoid potential influence in the response rate from the two authors of the study, data
from their countries of origin and current affiliation were obtained from the researchers
themselves. Excluding these two countries (Spain and Portugal) resulted in a pool of
191 countries.
To perform a global web-based survey, a pool of e-mail addresses of potential
participants was gathered. To find potential participants within a broad spectrum of
healthcare professionals, two main approaches were made: the first aiming to identify
healthcare researchers publishing articles, and a second approach to find healthcare
practitioners from different fields of work.
To find healthcare researchers who have published a research article affiliated to a
specific country, the webpage ‘www.pubmed.com’ was used. The search was based on
retrieving between 50 and 250 medicine-related articles which contained the e-mail of
at least one of the authors and were published in that country in the last few years.
Results showing the name of the country in the Affiliation field, because it was
coincident with one of the surnames of the authors were rejected (e.g. Monaco as a
surname). To perform the search a series of Medical Subject Headings (MeSH) terms
was used. The purpose of this filtering process was to obtain the highest amount of
addresses in countries with few research articles. On the other hand, for developed
countries with extensive research activity, the aim was to find researchers working in
fields related to medicines information, which presumably will be more interested in
answering the questionnaire. The following MeSH terms were used:
[Health care category] + [human]: the most general term

55
[Health care category]
[Health services]
[Community health services]
[Pharmaceutical services] + [ambulatory care]
[Drug information services]: the most specific term
The MeSH was selected in order to obtain less than 250 results between the years
2005-2007. If there were more than 250 results, the next MeSH term was selected. For
those countries with more than 250 results when using the term [Drug information
services], which is the most specific one, only the 250 most recent results were
retrieved.
In the second approach the webpage ‘www.google.com’ was used to select healthcare
practitioners from the 191 countries listed. The purpose was to find at least ten e-mail
addresses in every country, trying to cover a broad spectrum of areas of work in the
healthcare field. Individual searches were performed per country using the following
categories:
- Medical associations: general associations of physicians in a country, trying not to
limit to a specific medical specialty, when possible.
- Pharmaceutical associations: general associations of pharmacists.
- WHO: World Health Organization representatives in a country, whose presence is
especially important in underdeveloped and developing countries.
- Ministry of Health: e-mail addresses from the Ministry of Health, or any related to
Governmental Health Institutions, preferably in the medicines area.
- Regulatory Agencies: Agencies that control medicines in a country, being responsible
for its safety and efficiency, and intervening in its authorization, commercialization and
post-commercialization use.
- Hospital: Email addresses of physicians and services in a hospital, mainly in those
areas where a greater contact with patients is present: in this case family medicine
physicians and internal medicine physicians. When it was not possible, other
professionals such as dermatologists, cardiologists, pharmacologists, etc. were used.
- Hospital Pharmacists: pharmacists working at a hospital pharmacy.
- Red Cross/Crescent: Country representatives of the Red Cross or Red Crescent.
- University: Medicine Faculty: Professors or Associates devoted preferably to the fields
of Family Medicine, Community Medicine or Internal Medicine.
- University: Pharmacy Faculty: Professors or Associates devoted preferably to
Pharmacy Practice.

56
- Practitioner Physicians: Physicians currently working (not in hospitals) and preferably
those with most daily contact with patients, such us in General Medicine or Family
Medicine.
- Practitioner Pharmacists: Pharmacists working in Community Pharmacies.
- Others: any other health professional considered relevant during the development of
the study.
Study design
A webpage with all the information for the study was created. Information about the aim
of the study, the involved researchers and the methodology to answer the
questionnaire were displayed in the webpage.
The questionnaire, which could be accessed and answered online, consisted of three
questions, in which participants had to select the country they were working in, their
area of work (presented in Table 03-01) and their preferred source of medicines
information (displayed in Table 03-02). Questions were numbered and check boxes
were provided to answer the questions.
Table 03-01. Questionnaire: areas of work of participants
Public institution University Education (others) Hospital Pharmacy Pharmaceutical industry Non-governmental organization Ambulatory clinic Others
Table 03-02. Questionnaire: first-choice medicines information sources of participants
Internet search engines Information given by manufacturers Medicines reference books Scientific journals Summaries of product characteristics Patient leaflets Congresses Informal contacts with colleagues Formal meetings at workplace
From August 2007 to April 2008, e-mails were sent individually to each country. E-
mails contained an invitation to participate in the study and a link to the webpage with
the questionnaire. Invalid e-mail addresses from returned e-mails were deleted.
Participants with valid e-mail addresses were contacted three times, allowing at least
three weeks between each e-mail.

57
Data analysis
Descriptive statistics were performed using central tendency and dispersion measures.
All the analysis was done using the SPSS v-16, with statistical significance defined as
p<0.05.
Covariates representing socio-economic aspects of the country, such as population,
income, Gross Domestic Product (GDP), or Human Development Index (HDI), were
collected from the US Department of State (Bureau of Intelligence and Research)
webpage (19), the World Bank (21), and the World Health Organization databases.(22)
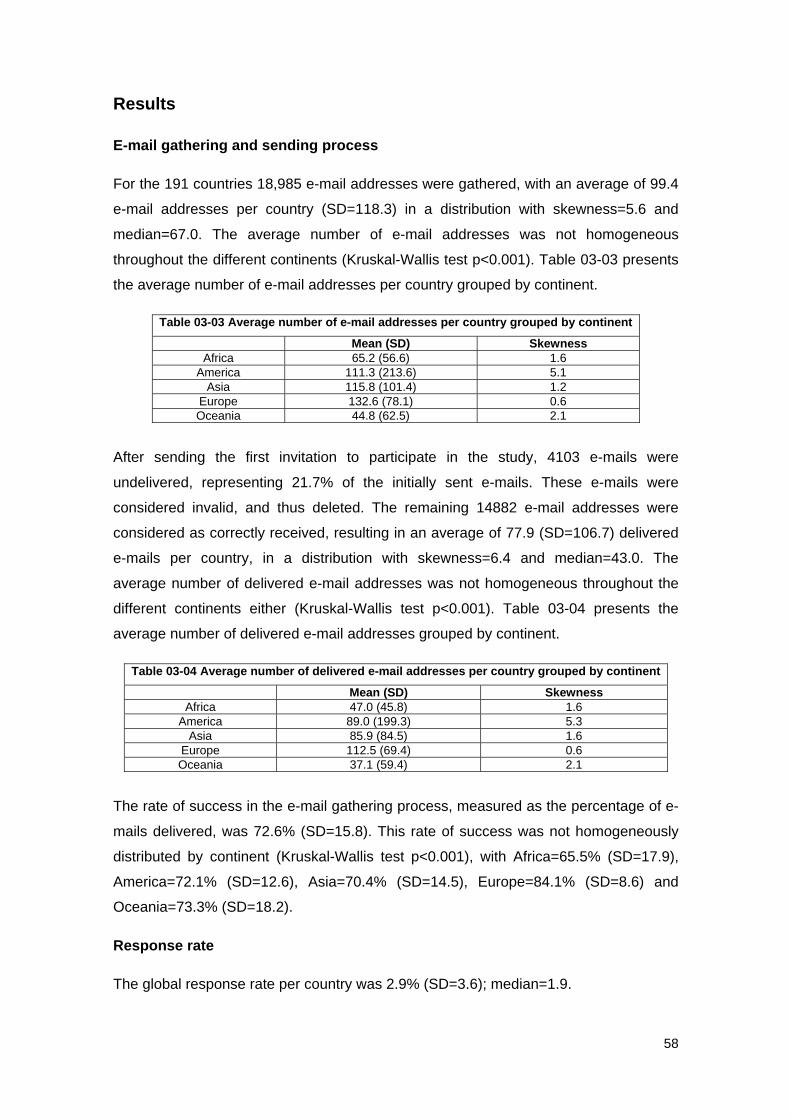
58
Results
E-mail gathering and sending process
For the 191 countries 18,985 e-mail addresses were gathered, with an average of 99.4
e-mail addresses per country (SD=118.3) in a distribution with skewness=5.6 and
median=67.0. The average number of e-mail addresses was not homogeneous
throughout the different continents (Kruskal-Wallis test p<0.001). Table 03-03 presents
the average number of e-mail addresses per country grouped by continent.
Table 03-03 Average number of e-mail addresses per country grouped by continent
Mean (SD) Skewness Africa 65.2 (56.6) 1.6
America 111.3 (213.6) 5.1 Asia 115.8 (101.4) 1.2
Europe 132.6 (78.1) 0.6 Oceania 44.8 (62.5) 2.1
After sending the first invitation to participate in the study, 4103 e-mails were
undelivered, representing 21.7% of the initially sent e-mails. These e-mails were
considered invalid, and thus deleted. The remaining 14882 e-mail addresses were
considered as correctly received, resulting in an average of 77.9 (SD=106.7) delivered
e-mails per country, in a distribution with skewness=6.4 and median=43.0. The
average number of delivered e-mail addresses was not homogeneous throughout the
different continents either (Kruskal-Wallis test p<0.001). Table 03-04 presents the
average number of delivered e-mail addresses grouped by continent.
Table 03-04 Average number of delivered e-mail addresses per country grouped by continent
Mean (SD) Skewness Africa 47.0 (45.8) 1.6
America 89.0 (199.3) 5.3 Asia 85.9 (84.5) 1.6
Europe 112.5 (69.4) 0.6 Oceania 37.1 (59.4) 2.1
The rate of success in the e-mail gathering process, measured as the percentage of e-
mails delivered, was 72.6% (SD=15.8). This rate of success was not homogeneously
distributed by continent (Kruskal-Wallis test p<0.001), with Africa=65.5% (SD=17.9),
America=72.1% (SD=12.6), Asia=70.4% (SD=14.5), Europe=84.1% (SD=8.6) and
Oceania=73.3% (SD=18.2).
Response rate
The global response rate per country was 2.9% (SD=3.6); median=1.9.

59
Fig 03-01. Distribution of response rate per country
This response rate per country was not homogeneously distributed among continents
(Kruskal-Wallis p<0.001), with Africa=1.4% (SD=2.4), America=3.7% (SD=3.9),
Asia=2.4% (SD=2.9), Europe=5.3% (SD=4.1), and Oceania 0.8% (SD=2.2)
Table 03-05 presents the statistical association of the response rate per country with
the main categorical variables in the analysis.
Table 03-05. Association of response rate per country with categorical covariates.
% Response rate (SD) p OECD (n=191)
Y N
4.9 (2.8) 2.6 (3.6)
<0.001*
World Bank income classification (n=188) High
Upper middle Lower middle
Low
3.7 (2.9) 3.7 (4.6) 2.7 (3.4) 1.5 (2.7)
0.001**
WHO regional office (n=189) AFRO AMRO EMRO EURO
SEARO WPRO
1.3 (2.5) 3.7 (3.9) 2.3 (2.0) 5.0 (4.3) 2.5 (2.8) 1.1 (2.0)
<0.001**
English as official language (n=191) Y N
2.0 (2.9) 3.2 (3.8)
0.024*
Spanish as official language (n=191) Y N
5.0 (4.2) 2.6 (3.4)
0.011*
French as official language (n=191) Y N
1.3 (2.5) 3.2 (3.7)
0.001*
Arabic as official language (n=191) Y N
2.2 (1.9) 3.0 (3.7)
0.978*

60
Table 03-05. Association of response rate per country with categorical covariates.
% Response rate (SD) p Portuguese as official language (n=191)
Y N
1.1.(1.9) 2.9 (3.6)
0.156*
*Mann-Whitney test ** Kruskal-Wallis test OECD: Organisation for Economic Cooperation and Development, WHO= World Health Organisation
Table 03-06 presents correlations of response rate per country with the main
continuous variables
Table 03-06. Correlations of response rate per country with continuous variables
Variable Pearson coefficient p-value* Population - 0.538 GDP per capita 0.16 0.025 Physicians per 1000 inh. - 0.559 Pharmacists per 1000 inh. - 0.341 % of GDP as Health expenditure 0.20 0.007 % of GDP as private health expenditure 0.16 0.042 Human Development Index (HDI) 0.31 <0.001 Healthy Life Expectancy at birth (HALE) 0.32 <0.001 * Pearson correlation
Analysis of responding countries
A valid answer was obtained from 107 countries out of the 191 (a response rate of
56.5%). These respondent countries comprised a population of 5,678,190,154
inhabitants, representing 88.29% of the 6,431,274,883 inhabitants populating the 191
countries (subtracting 51,003,712 inhabitants in Spain and Portugal from the
6,482,278,595 world population).
The percentage of responding countries was not equally distributed among continents
(p<0.001):
Africa 35.8%
America 60.0%
Asia 63.8%
Europe 83.3%
Oceania 14.3%
Differences between respondents and non-respondent countries regarding quantitative
covariates are presented in table 03-07:
Table 03-07. Characteristics of respondents and non-respondent countries regarding quantitative covariates.
Mean (SD) Total Respondents
p No Yes
Population (n=191)
33814344 (9256244)
48472764 (186641156)
22306800 (41860014)
0.687*

61
Table 03-07. Characteristics of respondents and non-respondent countries regarding quantitative covariates.
Mean (SD) Total Respondents
p No Yes
GDP per capita (n=190)
10176 (11475)
6384 (9625) 13117 (11963) <0.001*
Physicians per 1000 inh (n=187)
1.70 (3.64) 1.59 (5.33) 1.78 (1.33) <0.001*
Pharmacists per 1000 inh (n=150)
0.37 (0.45) 0.26 (0.38) 0.43 (0.48) 0.002*
% GDP as health expenditure (n=172)
3.57 (2.00) 3.12 (1.54) 3.88 (2.21) 0.075*
% GDP as private health expenditure (n=173)
2.53 (1.33) 2.27 (1.37) 2.70 (1.28) 0.014*
HDI (n=173)
0.72 (0.17) 0.65 (0.16) 0.77 (0.16) <0.001*
HALE (n=185)
57.17 (11.15) 52.09 (10.66) 61.05 (9.94) <0.001*
* Mann-Whitney test SD=standard deviation; GDP=gross domestic product; inh=inhabitants; HDI=Human Development Index.
Differences between respondents and non-respondent countries regarding categorical
covariates are presented in table 03-08:
Table 03-08. Characteristics of respondents and non-respondent countries regarding categorical covariates.
Respondents Num (%)
p No(n=84)
Yes (n=107)
OECD (n=191) Y N
2 (8.0%)
82 (49.4%)
23 (92.0%) 84 (50.6%)
<0.001*
World Bank income classification (n=188) High
Upper middle Lower middle
Low
10 (20.8%) 18 (40.9%) 27 (50.9%) 26 (60.5%)
38 (79.2%) 26 (59.1%) 26 (49.1%) 17 (39.5%)
0.001*
WHO regional office (n=189) AFRO AMRO EMRO EURO
SEARO WPRO
32 (69.6%) 14 (40.0%) 5 (23.8%)
11 (21.6%) 5 (45.5%)
16 (64.0%)
14 (30.4%) 21 (60.0%) 16 (76.2%) 40 (78.4%) 6 (54.5%) 9 (36.0%)
<0.001*
English as official language (n=191) Y N
32 (56.1%) 52 (38.8%)
25 (43.9%) 82 (61.2%)
0.027*
Spanish as official language (n=191) Y N
5 (26.3%)
79 (45.9%)
14 (73.7%) 93 (54.1%)
0.102*
French as official language (n=191) Y N
22 (75.9%) 62 (38.3%)
7 (24.1%)
100 (61.7%) <0.001*
Arabic as official language (n=191) Y N
6 (26.1%)
78 (46.4%)
17 (73.9%) 90 (56.6%)
0.065*
Portuguese as official language (n=191) Y N
5 (71.4%)
79 (42.9%)
2 (28.6%)
105 (57.1%) 0.136*
*Chi-Square test OECD: Organisation for Economic Cooperation and Development, WHO= World Health Organisation

62
Use of medicines information sources
Table 03-09 shows the overall distribution of preferred information sources.
Table 03-09 Distribution of preferred information sources
Frequency Percent
Internet 197 31,3
Manufacturers 35 5,6
Reference books 236 37,5
Journals 94 14,9
SmPCs 46 7,3
Patient leaflets 3 0.5
Congresses 9 1,4
Informal contacts 4 0.6
Formal meetings 6 1,0
Total 630 100,0
Due to the low percentage of respondents choosing patient leaflets, congresses,
informal contacts and formal meetings as preferred information sources, these
information sources were grouped into ‘others’, resulting in 3.5% when combined.
Table 03-10 presents the differences found among the categorical covariates between
respondents reporting using Internet as preferred information source and those not
considering Internet their preferred information source.
Table 03-10. Characteristics of respondents selecting Internet/not selecting Internet as preferred information source regarding categorical covariates.
Internet as preferred information source p No Yes
Continent Africa
America Asia
Europe Oceania
42 (72.4%)
105 (71.4%) 73 (60.3%) 196 (69%) 17 (85%)
16 (27.6%) 42 (28.6%) 48 (39.7%) 88 (31%) 3 (15%)
0.120*
OECD N Y
251 (66.2%) 182 (72.5%)
128 (33.8%) 69 (27.5%)
0.096*
World Bank income classification High
Upper middle Lower middle
Low
219 (70%) 116 (69%) 75 (65.2%) 23 (67.6%)
94 (30%) 52 (31%)
40 (34.8%) 11 (32.4%)
0.823*
WHO regional office AFRO AMRO EMRO EURO
SEARO WPRO
35 (74.5%)
105 (71.4%) 25 (61%)
212 (69.1%) 25 (64.1%) 30 (62.5%)
12 (25.5%) 42 (28.6%) 16 (39%)
95 (30.9%) 14 (35.9%) 18 (37.5%)
0.664*
English as official language N Y
296 (68.5%) 137 (69.2%)
136 (31.5%) 61 (30.8%)
0.866*

63
Table 03-10. Characteristics of respondents selecting Internet/not selecting Internet as preferred information source regarding categorical covariates.
Internet as preferred information source p No Yes
Spanish as official language N Y
373 (67.8%)
60 (75%)
177 (32.2%)
20 (25%)
0.195*
French as official language N Y
397 (68%) 36 (78.3%)
187 (32%) 10 (21.7%)
0.148*
Arabic as official language N Y
414 (69.2%) 19 (59.4%)
184(30.8%) 13 (40.6%)
0.241*
Portuguese as official language N Y
430 (69.1%)
3 (37.5%)
192 (30.9%)
5 (62.5%)
0.055*
Working area Public institution
Education Hospital
Non-governmental University Pharmacy
Industry Ambulatory care
Others
57 (59.4%) 7 (87.5%)
116 (66.3%) 19 (73.1%)
171 (71.5%) 18 (78.3%) 5 (71.4%)
22 (66.7%) 18 (78.3%)
39 (40.6%) 1 (12.5%)
59 (33.7%) 7 (26.9%)
68 (28.5%) 5 (21.7%) 2 (28.6%)
11 (33.3%) 5 (21.7%)
0.355*
*Chi-square test
Table 03-11 presents the differences found among the quantitative covariates of the
countries of origin of respondents reporting use of Internet as their preferred
information source and those not considering Internet their preferred information
source.
Table 03-11. Characteristics of countries of respondents selecting Internet/not selecting Internet as preferred information source regarding quantitative covariates.
Internet as preferred information source p
Mean (SD) No YesPopulation
88,569,334 (201,000,000)
86,248,089 (215,300,000)
0.115*
Healthy life expectancy (HALE) at birth (years)
64.31 (8.54) 63.99 (8.13) 0.212*
GDP per capita 18652.42 (13536.58) 17281.73 (13107.71) 0.341* Physicians per 1000 inh
2.21 (1.24)
2.09 (1.22)
0.357*
Pharmacists per 1000 inh
0.51 (0.41)
0.48 (0.42)
0.306*
% GDP as health expend
4.81 (2.21)
4.62 (2.25)
0.311*
% GDP as private health expend
3.04 (1.93)
2.95 (1.97)
0.337*
HDI
0.83 (0.14)
0.83 (0.14)
0.360*
*Chi-square test
Table 03-12 presents the differences found among the categorical covariates between
respondents reporting using information from the industry as their preferred information
source and those not considering the industry their preferred information source.

64
Table 03-12. Characteristics of respondents selecting/not selecting the pharmaceutical industry as preferred information source regarding categorical covariates.
Industry as preferred information source
p
No YesContinent
Africa America
Asia Europe
Oceania
53 (91.4%) 145 (98.6%) 114 (94.2%) 265 (93.3%)
18 (90%)
5 (8.6%) 2 (1.4%) 7 (5.8%) 19 (6.7%) 2 (10%)
0.115*
OECD N Y
359 (94.7%) 236 (94%)
20 (5.3%) 15 (6%)
0.708*
World Bank income classification High
Upper middle Lower middle
Low
292 (93.3%) 162 (96.4%) 109 (94.8%) 32 (94.1%)
21 (6.7%) 6 (3.6%) 6 (5.2%) 2 (5.9%)
0.555*
WHO regional office AFRO AMRO EMRO EURO
SEARO WPRO
42 (89.4%) 145 (98.6%) 40 (97.6%) 287 (93.5%) 39 (100%) 42 (87.5%)
5 (10.6%) 2 (1.4%) 1 (2.4%) 20 (6.5%)
0 6 (12.5%)
<0.001*
English as official language N Y
407 (94.2%) 188 (94.9%)
25 (5.8%) 10 (5.1%)
0.708*
Spanish as official language N Y
517 (94%) 78 (97.5%)
33 (6%) 2 (2.5%)
0.202*
French as official language N Y
550 (94.2%) 45 (97.8%)
34 (5.8%) 1 (2.2%)
0.298*
Arabic as official language N Y
563 (94.1%) 32 (100%)
35 (5.9%)
0
0.159*
Portuguese as official language N Y
587 (94.4%)
8 (100%)
35 (5.6%)
0
0.490*
Working area Public institution
Education Hospital
Non-governmental University Pharmacy
Industry Ambulatory care
Others
91 (94.8%) 8 (100%)
162 (92.6%) 26 (100%) 227 (95%) 21 (91.3%) 7 (100%) 32 (97%)
21 (91.3%)
5 (5.2)
0 13 (7.4%)
0 12 (5%) 2 (8.7%)
0 1 (3%)
2 (8.7%)
0.758*
*Chi-square test
Table 03-13 presents the differences found among the quantitative covariates of the
countries of origin of respondents reporting using the industry as their preferred
information source and those not considering the industry their preferred information
source.

65
Table 03-13. Characteristics of countries of respondents selecting/not selecting the pharmaceutical industry as preferred information source regarding quantitative covariates.
Industry as preferred information
source p No Yes
Population Mean (SD)
91,059,027 (210,700,000)
33,179,255 (43,910,000)
0.047* Median 22,303,552 10,235,455 Skewness 4,260 1,424 Kurtosis 19,029 0,648
Healthy life expectancy (HALE) at birth (years)
Mean (SD) 64,25 (8.29) 63.47 (10.44) 0.874*
GDP per capita Mean (SD) 18200.84
(13487.46) 18614.29
(12160.40) 0.790*
Physicians per 1000 inh. Mean (SD) 2.15 (1.22) 2.46 (1.39) 0.204* Pharmacists per 1000 inh. Mean (SD) 0.50 (0.41) 0.48 (0.42) 0.779* % GDP as health expend Mean (SD) 4.77 (2.23) 4.48 (2.05) 0.278* % GDP as private health expend
Mean (SD) 3.05 (1.98) 2.45 (1.02) 0.275*
HDI Mean (SD) 0.83 (0.14) 0.83 (0.16) 0.922* * Chi-square test
Table 03-14 presents the differences found among the categorical covariates between
respondents reporting using reference books as their preferred information source and
those not considering reference books their preferred information source.
Table 03-14. Characteristics of respondents selecting/not selecting reference books as preferred information source regarding categorical covariates.
Reference books as preferred information source
p
No YesContinent
Africa America
Asia Europe
Oceania
36 (62.1%) 85 (57.8%) 78 (64.5%)
185 (65.1%) 10 (50%)
22 (37.9%) 62 (42.2%) 43 (35.5%) 99 (34.9%) 10 (50%)
0.440*
OECD N Y
253 (66.8%) 141 (56.2%)
126 (33.2%) 110 (43.8%)
0.007*
World Bank income classification High
Upper middle Lower middle
Low
187 (59.7%) 107 (63.7%) 78 (67.8%) 22 (64.7%)
126 (40.3%) 61 (36.3%) 37 (32.2%) 12 (35.3%)
0.461*
WHO regional office AFRO AMRO EMRO EURO
SEARO WPRO
27 (57.4%) 85 (57.8%) 26 (63.4%)
198 (64.5%) 25 (64.1%) 32 (66.7%)
20 (42.6%) 62 (42.2%) 15 (36.6%)
109 (35.5%) 14 (35.9%) 16 (33.3%)
0.755*
English as official language N Y
285 (66%)
109 (55.1%)
147 (34%) 89 (44.9%)
0.009*
Spanish as official language N Y
341 (62%) 53 (66.2%)
209 (38%) 27 (33.8%)
0.463*
French as official language N Y
368 (63%) 26 (56.5%)
216 (37%) 20 (43.5%)
0.381*
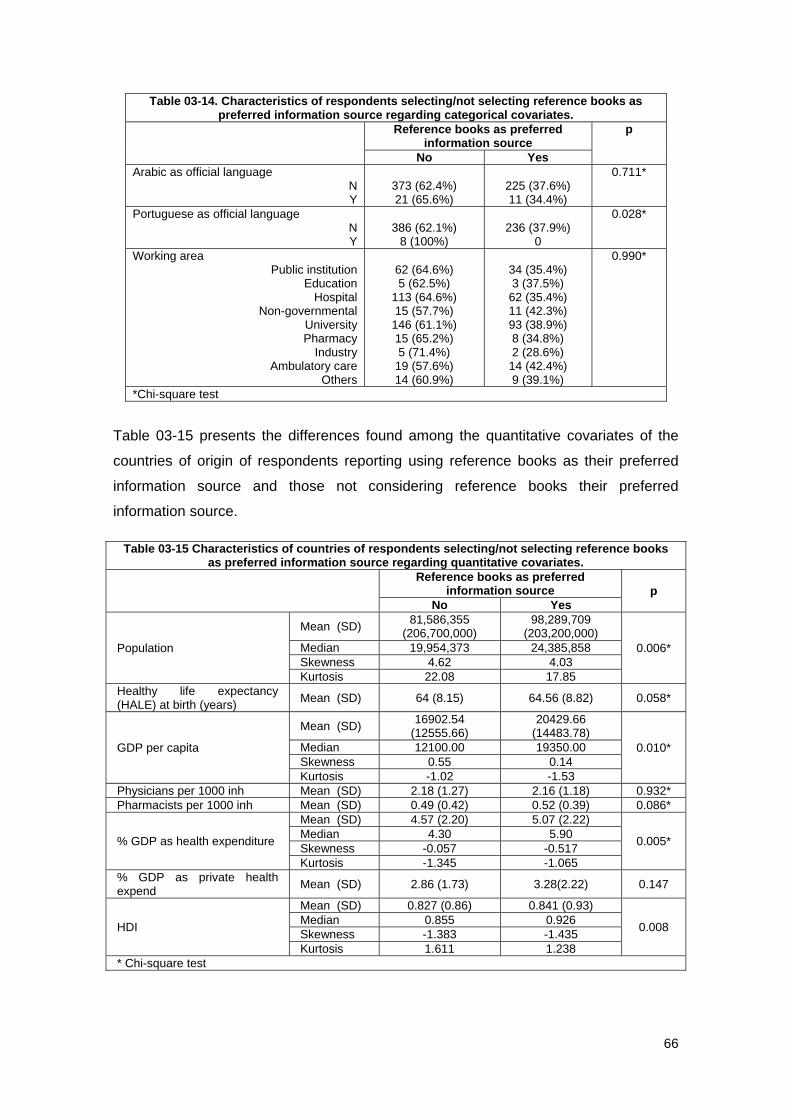
66
Table 03-14. Characteristics of respondents selecting/not selecting reference books as preferred information source regarding categorical covariates.
Reference books as preferred information source
p
No YesArabic as official language
N Y
373 (62.4%) 21 (65.6%)
225 (37.6%) 11 (34.4%)
0.711*
Portuguese as official language N Y
386 (62.1%)
8 (100%)
236 (37.9%)
0
0.028*
Working area Public institution
Education Hospital
Non-governmental University Pharmacy
Industry Ambulatory care
Others
62 (64.6%) 5 (62.5%)
113 (64.6%) 15 (57.7%)
146 (61.1%) 15 (65.2%) 5 (71.4%)
19 (57.6%) 14 (60.9%)
34 (35.4%) 3 (37.5%)
62 (35.4%) 11 (42.3%) 93 (38.9%) 8 (34.8%) 2 (28.6%)
14 (42.4%) 9 (39.1%)
0.990*
*Chi-square test
Table 03-15 presents the differences found among the quantitative covariates of the
countries of origin of respondents reporting using reference books as their preferred
information source and those not considering reference books their preferred
information source.
Table 03-15 Characteristics of countries of respondents selecting/not selecting reference books as preferred information source regarding quantitative covariates.
Reference books as preferred
information source p No Yes
Population
Mean (SD) 81,586,355
(206,700,000) 98,289,709
(203,200,000) 0.006* Median 19,954,373 24,385,858
Skewness 4.62 4.03 Kurtosis 22.08 17.85
Healthy life expectancy (HALE) at birth (years)
Mean (SD) 64 (8.15) 64.56 (8.82) 0.058*
GDP per capita
Mean (SD) 16902.54
(12555.66) 20429.66
(14483.78) 0.010* Median 12100.00 19350.00
Skewness 0.55 0.14 Kurtosis -1.02 -1.53
Physicians per 1000 inh Mean (SD) 2.18 (1.27) 2.16 (1.18) 0.932* Pharmacists per 1000 inh Mean (SD) 0.49 (0.42) 0.52 (0.39) 0.086*
% GDP as health expenditure
Mean (SD) 4.57 (2.20) 5.07 (2.22)
0.005* Median 4.30 5.90 Skewness -0.057 -0.517 Kurtosis -1.345 -1.065
% GDP as private health expend
Mean (SD) 2.86 (1.73) 3.28(2.22) 0.147
HDI
Mean (SD) 0.827 (0.86) 0.841 (0.93)
0.008 Median 0.855 0.926 Skewness -1.383 -1.435 Kurtosis 1.611 1.238
* Chi-square test

67
Table 03-16 presents the differences found among the categorical covariates between
respondents reporting using scientific journals as their preferred information source and
those not considering scientific journals their preferred information source.
Table 03-16. Characteristics of respondents selecting/not selecting scientific journals as preferred information source regarding categorical covariates.
Scientific journals as preferred information source
p
No YesContinent
Africa America
Asia Europe
Oceania
49 (84.5%)
113 (76.9%) 105 (86.8%) 252 (88.7%)
17 (85%)
9 (15.5%)
34 (23.1%) 16 (13.2%) 32 (11.3%)
3 (15%)
0.026*
OECD N Y
310 (81.8%) 226 (90%)
69 (18.2%) 25 (10%)
0.004*
World Bank income classification High
Upper middle Lower middle
Low
280 (89.5%) 133 (79.2%) 95 (82.6%) 28 (82.4%)
33 (10.5%) 35 (20.8%) 20 (17.4%) 6 (17.6%)
0.018*
WHO regional office AFRO AMRO EMRO EURO
SEARO WPRO
42 (89.4%)
113 (76.9%) 105 (86.8%) 272 (88.6%) 31 (79.5%) 44 (91.7%)
5 (10.6%)
34 (23.1%) 16 (13.2%) 35 (11.4%) 8 (20.5%) 4 (8.3%)
0.021*
English as official language N Y
356 (82.4%) 180 (90.0%)
76 (17.6%) 18 (9.1%)
0.005*
Spanish as official language N Y
481 (87.5%) 55 (68.8%)
69 (12.5%) 25 (31.2%)
0.000*
French as official language N Y
500 (85.6%) 36 (78.3%)
84 (14.4%) 10 (21.7%)
0.178*
Arabic as official language N Y
511 (85.5%) 25 (78.1%)
87 (14.5%) 7 (21.9%)
0.257*
Portuguese as official language N Y
530 (85.2%)
6 (75%)
92 (14.8%)
2 (25%)
0.421*
Working area Public institution
Education Hospital
Non-governmental University Pharmacy
Industry Ambulatory care
Others
92 (95.8%)
6 (75%) 150 (85.7%) 22 (84.6%)
194 (81.2%) 19 (82.6%) 5 (71.4%)
29 (87.9%) 19 (82.6%)
4 (4.2%) 2 (25%)
25 (14.3%) 4 (15.4%)
45 (18.8%) 4 (17.4%) 2 (28.6%) 4 (12.1%) 4 (17.4%)
0.088*
*Chi-square test
Table 03-17 presents the differences found among the quantitative covariates of the
countries of origin of respondents reporting using scientific journals as their preferred

68
information source and those not considering scientific journals their preferred
information source.
Table 03-17. Characteristics of countries of respondents selecting/not selecting scientific journals as preferred information source regarding quantitative covariates.
Scientific journals as preferred information
source p No Yes
Population Mean (SD) 86,061,949.72 (202,100,000)
98,002,023.22 (224,100,000)
0.308*
Healthy life expectancy (HALE) at birth (years)
Mean (SD) 64.36 (8.62) 63.36 (7.06)
0.021* Median 66 64 Skewness -1.619 -0.998 Kurtosis 2.516 0.794
GDP per capita
Mean (SD) 18925.00 (13571.76) 14225.53 (11722.36)
0.003* Median 16100.00 10000.00 Skewness 0.308 1.002 Kurtosis -1.333 -0.251
Physicians per 1000 inh Mean (SD) 2.19 (1.22) 2.06 (1.30) 0.161* Pharmacists per 1000 inh Mean (SD) 0.50 (0.40) 0.48 (0.47) 0.216*
% GDP as health expenditure
Mean (SD) 4.86 (2.23) 4.13 (2.08)
0.003* Median 5.70 3.70 Skewness -0.292 0.114 Kurtosis -1.266 -1.332
% GDP as private health expenditure
Mean (SD) 2.98 (1.98) 3.18 (1.71)
0.028* Median 2.40 2.81 Skewness 1.684 1.463 Kurtosis 2.378 2.754
HDI
Mean (SD) 0.84 (0.14) 0.81 (0.13)
0.002* Median 0.87 0.82 Skewness -1.477 -0.937 Kurtosis 1.629 0.342
* Chi-square test
Table 03-18 presents the differences found among the categorical covariates between
respondents reporting using SmPCs as their preferred information source and those
not considering SmPCs their preferred information source.
Table 03-18. Characteristics of respondents selecting/not selecting SmPCs as preferred information source regarding categorical covariates.
SmPCs as preferred information source
p
No YesContinent
Africa America
Asia Europe
Oceania
56 (96.6%)
143 (97.3%) 117 (96.7%) 249 (87.7%)
19 (95%)
2 (3.4%) 4 (2.7%) 4 (3.3%)
35 (12.3%) 1 (5%)
0.001*
OECD N Y
358 (94.5%) 226 (90%)
21 (5.5%) 25 (10%)
0.037*
World Bank income classification High
Upper middle Lower middle
Low
284 (90.7%) 158 (94%)
109 (94.8%) 33 (97.1%)
29 (9.3%) 10 (6%) 6 (5.2%) 1 (2.9%)
0.269*

69
Table 03-18. Characteristics of respondents selecting/not selecting SmPCs as preferred information source regarding categorical covariates.
SmPCs as preferred information source
p
No YesWHO regional office
AFRO AMRO EMRO EURO
SEARO WPRO
46 (97.9%)
143 (97.3%) 40 (97.6%)
272 (88.6%) 37 (94.9%) 45 (93.8%)
1 (2.1%) 4 (2.7%) 1 (2.4%)
35 (11.4%) 2 (5.1%) 3 (6.2%)
0.014*
English as official language N Y
400 (92.6%) 184 (92.9%)
32 (7.4%) 14 (7.1%)
0.88*
Spanish as official language N Y
508 (92.4%)
76 (95%)
42 (7.6%)
4 (5%)
0.397*
French as official language N Y
541 (92.6%) 43 (93.5%)
43 (7.4%) 3 (6.5%)
0.833*
Arabic as official language N Y
553 (92.5%) 31 (96.9%)
45 (7.5%) 1 (3.1%)
0.351*
Portuguese as official language N Y
576 (92.6%)
8 (100%)
46 (7.4%)
0
0.424
Working area Public institution
Education Hospital
Non-governmental University Pharmacy
Industry Ambulatory care
Others
85 (88.5%) 7 (87.5%)
165 (94.3%) 23 (88.5%)
226 (94.6%) 20 (87%) 6 (85.7%)
31 (93.9%) 21 (91.3%)
11 (11.5%) 1 (12.5%) 10 (5.7%) 3 (11.5%) 13 (5.4%) 3 (13%)
1 (14.3%) 2 (6.1%) 2 (8.7%)
0.526*
*Chi-square test
Table 03-19 presents the differences found among the quantitative covariates of the
countries of origin of respondents reporting using SmPCs as their preferred information
source and those not considering SmPCs their preferred information source.
Table 03-19. Characteristics of countries of respondents selecting/not selecting SmPCs as preferred information source regarding quantitative covariates.
SmPCs as preferred information source
p No Yes
Population
Mean (SD) 88,621,563
(202,000,000) 77,965,267
(247,300,000) 0.027* Median 22,303,552 9,815,933
Skewness 4.369 4,507 Kurtosis 20,398 19,914
Healthy life expectancy (HALE) at birth (years)
Mean (SD) 63.99 (8.53) 66.96 (6.10)
0.017* Median 66 70 Skewness -1.528 -1.529 Kurtosis 2.241 3.10
GDP per capita Mean (SD) 18007.19
(13508.82) 20973.91
(11853.65) 0.261*
Physicians per 1000 inh
Mean (SD) 2.14 (1.24) 2.54 (1.13)
0.028* Median 2.30 2.86 Skewness 0.042 -0.537 Kurtosis -0.895 -0.484

70
Table 03-19. Characteristics of countries of respondents selecting/not selecting SmPCs as preferred information source regarding quantitative covariates.
SmPCs as preferred information source
p No Yes
Pharmacists per 1000 inh Mean (SD) 0.49 (0.41) 0.58 (0.40) 0.181*
% GDP as health expenditure
Mean (SD) 4.69 (2.21) 5.52 (2.23)
0.005* Median 4.80 6.50 Skewness -0.194 -0.666 Kurtosis -1.318 -0.858
% GDP as private health expenditure
Mean (SD) 3.08 (1.97) 2.16 (1.12)
0.001* Median 2.70 1.70 Skewness 1.605 1.19 Kurtosis 2.152 0.696
HDI
Mean (SD) 0.83 (0.14) 0.88 (0.10)
0.042* Median 0.86 0.94 Skewness -1.359 -1.545 Kurtosis 1.282 2.295
* Chi-square test

71
Discussion
Method used
When aiming at an extensive population, the method to reach potential participants is a
major challenge. Due to limitations in time, costs and volume of participation requests,
the use of a web-based survey was considered the best option. Some advantages of
web-based surveys are easy access, instant distribution, rapid return of answers and
reduced costs.(23, 24) Additionally, using Internet allows researchers to provide
information of results to participants in a timely manner.(24) When compared to
traditional postal surveys, answered online questionnaires present fewer incomplete
questions, but more address errors are found when collecting e-mail addresses than
with postal addresses and fax numbers.(25) As far as response rates are concerned,
postal, telephone and mixed-mode surveys (postal mail and web surveys) provide
higher levels of response than web surveys. However, postal, telephone or mixed-
mode surveys may not be feasible at a global level.
Some survey researchers have warned that the population online may not be
representative of the general population, as access to the Internet is not universal.(23,
26) Couper et al. identified three main limitations of e-Health surveys: drawing through
the Internet a representative sample of the general population, people’s restrictions to
access the Internet and the potential non-response bias.(27) The non-response bias
refers to the bias that may exist in the data because respondents to the survey are
different from those who did not respond regarding important characteristics. (28) We
should bear in mind that e-Health surveys address general population. However, we
surveyed healthcare professionals and researchers, and the non-response bias should
not be of relevance due to the high level of education they all have.
In general, previous research on surveys addressed specific population groups,
physicians being the most frequent group. Although highly educated professionals
should have theoretically higher response rates than less educated participants (29),
surveys to physicians have been characterized by low response rates.(26) VanGeest et
al. identified several reasons for non-response among physicians: lack of time,
perception of unclear or low value of the study and concerns about the confidentiality of
the results.(26) On the other hand, financial incentives have been seen to improve
physicians’ response to surveys (26, 30), whereas other non-monetary incentives were
much less effective.(26) Personalization and sponsorship of studies by health

72
organizations seem to improve participation among physicians, and the number of
times physicians are contacted is also directly related to participation rates.(26)
Despite the above mentioned limitations of online surveying, e-mail was the only
feasible data collection tool for this study and therefore, it was selected as contacting
method for the 18,985 potential participants. Consequently, the use of a web-based
survey was preferred among all other options.
Response rate
The global response rate of 2.9% may appear as a low response rate; however, it
should be considered that the study was performed at a global level and comprised
14,882 potential participants. Literature about response rates for multiple-country
studies is sparse, as very little research focuses on cross-cultural reaction to
surveys.(31) Although there are studies analysing the effect on response rates of
every possible aspect of surveys (number of questions, format, colour or length of the
questionnaire, author-related or topic-related aspects, etc), they are all performed in a
domestic setting, and scientific literature about international settings is extremely
scarce.(31)
Performing a global survey presents some disadvantages that clearly reduce the
response rate. Some of the known fundamental problems of cross-cultural research
are: definition of cultures, identification of whether a phenomenon is culturally specific
or universal, cultural bias of researchers when designing and conducting the study,
determination of equivalent and identical aspects of the study across cultures and
identification of threats to interpretation caused by cultural aspects.(32) Another aspect
influencing negative response rates is the geographical and/or cultural distance of the
sender of the survey. Foreign surveys have been seen to generate lower response
rates than domestic surveys.(32) Other characteristics such as personalization of the
survey or incentives, which increase response rates, are not feasible in such extensive
populations.(31)
Analysing the figures, this overall 2.9% response rate covered 56.5% of countries and
comprised 88.3% of the world population. Although the individual response rate was
low, the analysis may be considered representative of the world population at a country
level.
A further analyse of the characteristics of countries answering the questionnaire should
be of interest. There were differences in participation rates among countries, Europe
being the most participative continent, followed by America and Asia and being Africa

73
and Oceania the least participative continents. Previous research has shown that
response rates to mail surveys in the US are higher than those in European countries
for questionnaires sent from the US.(31) Conversely, our study shows that while the
response rate in Europe as a continent is 5.3%, response rates in the US are 4.02%
Not only were there differences per continent, but also other demographic and
socioeconomic variables were associated with different response rates. When
analysing development indicators, results showed that members of the ‘Organisation
for Economic Co-operation and Development’ (OECD), with higher Gross Domestic
product (GDP) per capita, higher percentage of GDP as health expenditure and higher
Human Development Index (HDI), and higher Healthy Life Expectancy at birth (HALE)
were significantly associated with a higher response rate. Conversely, countries
classified by the World Bank as low income countries, were the countries with a smaller
response rate.
Developing countries often lack the resources to participate in costly research projects,
and the use of Internet may not be so extended as in developed countries, a fact that is
also seen in the difference in the number of e-mail addresses found for each country
and continent. However, for those healthcare professionals with a valid e-mail address,
participation in the study was easy, simple and free, and resource limitation could not
explain the low response rates. The only resource limitation was that an Internet
connection was needed to retrieve the questionnaire. However, as potential
participants were contacted by e-mail, we may assume that all accepting participants
had Internet access available. Other authors have previously pointed out that
healthcare professionals in developing countries are rarely involved in the promotion of
rational drug use.(33)
Having information about health issues in developing countries is essential to plan the
improvement of the healthcare sector. In fact, deficits in health information have been
seen as an important barrier for the development of countries and the implementation
of health programmes and policies.(34) One of the potential reasons for the low
response rate in these countries may be cultural differences. As previously explained,
the higher the cultural distance, the lower the response rate.(31)
As far as languages are concerned, countries with Spanish or French as official
language and countries in which English is not the official language are associated with
a higher response rate. The language of the survey was expected to influence the
response rates in different countries, so that apparently non-native English speakers
might have declined their participation. However, results showed an opposite trend.

74
The fact that Europe was the continent with the highest response rate, where from 44
countries in Europe only four (Iceland, Ireland, Malta and United Kingdom) have
English as their official language, may be one of the reasons for these results. Spanish
is also related to a high response rate, because it is the main language in Latin
America, and America was also one of the continents with a high response rate.
Regarding categorical covariates, there were also significant differences per World
Bank Income classification of the country and membership of OECD (please refer to
Table 03-08). Only 12% of countries classified as having a ‘high income’ did not
answer the questionnaire. The participation rate of countries increased with higher
World Bank income classification.
Analysis of results
Our results showed that drug reference books, also called medicines compendia, are
the leading information source among healthcare professionals, followed by information
on the Internet and scientific journals. These results are in agreement with previous
studies, which have selected reference books as the preferred source of information
among different healthcare professionals in different settings and countries.(8, 35-37)
When analysing each information source separately, there was a relationship between
using the information from the pharmaceutical industry and the WHO regional office to
which the country belongs. Although, in general, the pharmaceutical industry does not
appear to be very popular as information source, countries belonging to the WPRO
(Western Pacific Region) and AFRO (Africa) WHO offices seemed to use the
information from the pharmaceutical industry significantly more than countries from the
EURO (Europe), EMRO (Eastern Mediterranean), AMRO (America) and SEARO
(South East Asia) WHO offices. The association between the covariate population and
using the pharmaceutical industry as an information source was also statistically
significant. Countries using the industry as their information source had less population
than those not using the industry. Nevertheless, considering the high standard
deviation, as well as the values of skewness and kurtosis, this may occur due to the
influence of countries with a massive population, such as China or Russia.
As far as drug reference books are concerned, which were in general the preferred
information source, there was a statistically significant association between selecting
reference books and being a member of the OECD, having English as an official
language, and having Portuguese as an official language. Members of the OECD used
reference books more often (43.8%) than non-members (33.2%). Possible

75
explanations are that countries that edit the most well-known reference books (BNF,
VIDAL; PDR; Martindale, etc) are all members of the OECD. Moreover, as not every
country has its own reference book, some countries not members of the OECD may
not have their own reference books. Also countries with English as an official language
used reference books more often (44.9%) than those which do not have English as an
official language (34%). This makes sense, because the availability of reference books
in English is very high, and English speaking countries have at their disposal a variety
of reference books, and even if they do not publish their own compendia, foreign
compendia written in English can be used. Although there are other compendia written
in languages such as French, Spanish or Portuguese, the number is not so high and
their accessibility may be lower. For countries with Portuguese as an official language,
none of the respondents chose reference books as their preferred information source,
however, we should be cautious with these results because only eight responses were
analysed.
Other covariates such as population, GDP per capita, percentage of GDP as health
expenditure and HDI were also significantly associated with selecting reference books.
Countries selecting reference books had a higher population, a higher GDP and health
expenditure (expressed as percentage of the GDP) and higher HDI. Those countries
spending more on health services have their own reference books adapted to the
needs and medications of the country, thus reference books would be more easily
available and, in consequence, would be used more frequently by healthcare
professionals.
The use of Internet as the preferred medicines information source ranked second at a
global level, after drug reference books. None of the analysed covariates presented a
significant association with the selection of Internet. This finding indicates that the
selection of Internet is homogeneously preferred around the world, regardless of
development, income or socioeconomic indicators in the countries.
The use of scientific journals was associated with the continent, OECD membership,
World Bank income classification, WHO regional office and English and Spanish as the
official languages. The preference for scientific journals was higher in America,
followed by Africa, Oceania, Asia and lastly Europe. Scientific journals were more
selected by non-members of the OECD and by upper middle income countries.
Surprisingly high income countries selected scientific journals less often than lower
middle and low income countries. Countries with English as their official language used
fewer scientific journals and Spanish countries used more. Countries selecting

76
scientific journals as their preferred information source had a fewer HALE at birth, GDP
per capita, a lower percentage of GDP as health expenditure (public and private), as
well as a lower HDI. Scientific journals may not be the best option for searching for
medicines information in daily clinical practice. The selection of scientific journals in
some developing countries may be associated with their limited access to other
sources of information, such as drug compendia. Currently, the Health Inter-network
Access to Research Initiative (HINARI), which is a WHO initiative, promotes access to
scientific information by providing free (or low cost) online access to major science
journals.(38) Although controversial, this initiative may facilitate access to scientific
journals in developing countries.(39)
The use of SmPCs was associated with the covariates continent, OECD, and WHO
regional office. It is evident that SmPCs, as official information sources in the European
Union intended for healthcare professionals, are mostly used in Europe. The small
percentage of use of SmPCs in other continents may be attributed to European
expatriates or healthcare professionals who have somehow been related to Europe in
their studies or professional living. The use of SmPCs in Europe accounted for 12.3%.
Although some authors consider that healthcare professionals are not aware of the
content of SmPCs or even do not know how to access them (7, 40), our study showed
that SmPCs are the third preferred medicines information source among healthcare
professionals in Europe. Drug reference books and information on Internet ranked
respectively, first and second as preferred medicines information sources.
Members of the OECD used more SmPCs because all European countries belong to
the OECD. As expected, the WHO regional office EURO is the one with a greater use
of SmPCs as the preferred information source. Countries using SmPCs were less
populated, had a higher HALE at birth, had more physicians per 1000 inhabitants, had
a higher percentage of GDP as health expenditure, but a lower percentage of GDP as
private health expenditure, and had a higher HDI. These characteristics reflect in
general the characteristics of European countries. In the European Union public
funding dominates the healthcare sector in most countries, ranging from 56.2% of
public funding in Bulgaria to more than 80% of public funding in countries such as the
Netherlands, Denmark, Luxembourg or Sweden. Private insurances generally
represent a small share of healthcare financing among member states (their relative
share is only greater than 10% in France and Bulgaria).(41)
Lastly, we should notice that the area of work was not significantly associated with the
preference of any of the information sources listed. Our study included a vast range of

77
healthcare professionals and researchers from different areas (practitioners versus
researchers; pharmacists versus physicians; hospital versus community settings).
Remarkably, this whole set of healthcare professionals did not present differences in
their preference when selecting medicines information sources. This may indicate that
creating a good quality medicines information source would be beneficial for all
healthcare professionals, regardless of their area of work.

78
Conclusions
At a global level, drug reference books or medicines compendia were the leading
medicines information source among healthcare professionals.
There were different patterns of preferences associated to socio-demographic
indicators:
Drug reference books were preferred in highly developed countries and high
income countries, as represented by OECD membership, Gross Domestic
Product per capita, Human Development Index and health expenditure.
Internet was the second preferred medicines information source, with a
homogeneous distribution, not associated with any socio-demographic
indicator.
As expected, the preference for Summaries of Product Characteristics was
linked to Europe; however, this official source remained as the third option
when selecting medicines information sources in this continent, after drug
compendia and Internet.
No association was found between area of work and the medicines information source
selected.

79
References
1. Maxwell S, Eichler HG, Bucsics A, Haefeli WE, Gustafsson LL. e-SPC - delivering drug information in the 21st century: developing new approaches to deliver drug information to prescribers. Br J Clin Pharmacol. Jan;73(1):12-5.
2. Jackson R, Baird W, Davis-Reynolds L, Smith C, Blackburn S, Allsebrook J. The information requirements and information-seeking behaviours of health and social care professionals providing care to children with health care needs: a pilot study. Health Info Libr J. 2007 Jun;24(2):95-102.
3. Loza MI, Cordero L, Fernandez-Llimos F, Garcia Corral P, Cadavid MI, Sanz F, Calleja JM. Drug information sources used by community pharmacists in Galicia. Pharm Care Esp. 2000;2:108-22.
4. Ely JW, Osheroff JA, Ebell MH, Chambliss ML, Vinson DC, Stevermer JJ, Pifer EA. Obstacles to answering doctors' questions about patient care with evidence: qualitative study. Bmj. 2002 Mar 23;324(7339):710.
5. Cogdill KW. Information needs and information seeking in primary care: a study of nurse practitioners. J Med Libr Assoc. 2003 Apr;91(2):203-15.
6. Andrews JE, Pearce KA, Ireson C, Love MM. Information-seeking behaviors of practitioners in a primary care practice-based research network (PBRN). J Med Libr Assoc. 2005 Apr;93(2):206-12.
7. Rahmner PB, Eiermann B, Korkmaz S, Gustafsson LL, Gruven M, Maxwell S, Eichle HG, Veg A. Physicians' reported needs of drug information at point of care in Sweden. Br J Clin Pharmacol. Jan;73(1):115-25.
8. Davies K, Harrison J. The information-seeking behaviour of doctors: a review of the evidence. Health Info Libr J. 2007 Jun;24(2):78-94.
9. Westbrook JI, Gosling AS, Coiera E. Do clinicians use online evidence to support patient care? A study of 55,000 clinicians. J Am Med Inform Assoc. 2004 Mar-Apr;11(2):113-20.
10. Kendall M, Enright D. Provision of medicines information: the example of the British National Formulary. Br J Clin Pharmacol. 2012 Jun;73(6):934-8.
11. Bennett NL, Casebeer LL, Zheng S, Kristofco R. Information-seeking behaviors and reflective practice. J Contin Educ Health Prof. 2006 Spring;26(2):120-7.
12. Iwanowicz SL, Marciniak MW, Zeolla MM. Obtaining and providing health information in the community pharmacy setting. Am J Pharm Educ. 2006 Jun 15;70(3):57.
13. McEntee JE, Henderson SL, Rutter PM, Rutter J, Davis HJ. Utility and value of a medicines information service provided by pharmacists: a survey of health professionals. Int J Pharm Pract. 2010 Dec;18(6):353-61.
14. Bennett NL, Casebeer LL, Kristofco R, Collins BC. Family physicians' information seeking behaviors: a survey comparison with other specialties. BMC Med Inform Decis Mak. 2005;5(1):9.
15. McGettigan P, Golden J, Fryer J, Chan R, Feely J. Prescribers prefer people: The sources of information used by doctors for prescribing suggest that the medium is more important than the message. Br J Clin Pharmacol. 2001 Feb;51(2):184-9.
16. Kim GR, Bartlett EL, Jr., Lehmann HP. Information resource preferences by general pediatricians in office settings: a qualitative study. BMC Med Inform Decis Mak. 2005;5:34.
17. Zehnder S, Beutler M, Bruppacher R, Ehrenhofer T, Hersberger KE. Needs and use of drug information sources in community pharmacies: a questionnaire based survey in German-speaking Switzerland. Pharm World Sci. 2004 Aug;26(4):197-202.
18. Indermitte J, Beutler M, Bruppacher R, Meier CR, Hersberger KE. Management of drug-interaction alerts in community pharmacies. J Clin Pharm Ther. 2007 Apr;32(2):133-42.

80
19. U.S._Department_of_State. Independent States in the World. [29-Aug-2011]; Available from: http://www.state.gov/s/inr/rls/4250.htm.
20. U.S._Central_Intelligence_Agency. CIA: The World Factbook. [30 Aug 2011]; Available from: https://www.cia.gov/library/publications/the-world-factbook/index.html
21. The_World_Bank. Data: the World Bank. [30 Aug 2011]; Available from: http://data.worldbank.org/.
22. World_Health_Organization. WHO: Data and Statistics. [30 Aug 2011]; Available from: http://www.who.int/research/en/
23. Schleyer TK, Forrest JL. Methods for the design and administration of web-based surveys. J Am Med Inform Assoc. 2000 Jul-Aug;7(4):416-25.
24. Houston JD, Fiore DC. Online medical surveys: using the Internet as a research tool. MD Comput. 1998 Mar-Apr;15(2):116-20.
25. McMahon SR, Iwamoto M, Massoudi MS, Yusuf HR, Stevenson JM, David F, Chu SY, Pickering LK. Comparison of e-mail, fax, and postal surveys of pediatricians. Pediatrics. 2003 Apr;111(4 Pt 1):e299-303.
26. VanGeest JB, Johnson TP, Welch VL. Methodologies for improving response rates in surveys of physicians: a systematic review. Eval Health Prof. 2007 Dec;30(4):303-21.
27. Couper MP. Issues of representation in eHealth research (with a focus on web surveys). Am J Prev Med. 2007 May;32(5 Suppl):S83-9.
28. Hansen RA, Henley AC, Brouwer ES, Oraefo AN, Roth MT. Geographic Information System mapping as a tool to assess nonresponse bias in survey research. Res Social Adm Pharm. 2007 Sep;3(3):249-64.
29. Kellerman SE, Herold J. Physician response to surveys. A review of the literature. Am J Prev Med. 2001 Jan;20(1):61-7.
30. Donaldson GW, Moinpour CM, Bush NE, Chapko M, Jocom J, Siadak M, Nielsen-Stoeck M, Bradshaw JM, Bichindaritz I, Sullivan KM. Physician participation in research surveys. A randomized study of inducements to return mailed research questionnaires. Eval Health Prof. 1999 Dec;22(4):427-41.
31. Harzing A-W. Response rates in international mail surveys: Results of a 22-country study. International Business Review. 1997;6(6):641-65.
32. Teagarden MB, Von Glinow MA, Bowen DA, Frayne CA, Nason S, Huo YP, Milliman J, Arias ME, Butler MC, Geringer JM, Scullion H, Lowe KB, Drost EA. Toward a theory of comparative management research: an idiographic case study of the best international human resources management project. Academy of Management Journal. 1995 October 1, 1995;38(5):1261-87.
33. Flores Vidotti C. Drug Information Centers in developing countries and the promotion of rational use of drugs: a viewpoint about challenges and perpectives. Intern Pharm J. 2004;18(1):21-3.
34. Warner-Smith-M. The challenge of developing drug information systems in Africa. Bulletin on Narcotics. 2003;55(1-2):95-8.
35. Hedegaard U, Damkier P. Problem-oriented drug information: physicians' expectations and impact on clinical practice. Eur J Clin Pharmacol. 2009 May;65(5):515-22.
36. Cohen JS. Dose discrepancies between the Physicians' Desk Reference and the medical literature, and their possible role in the high incidence of dose-related adverse drug events. Arch Intern Med. 2001 Apr 9;161(7):957-64.
37. Morgan MA, Cragan JD, Goldenberg RL, Rasmussen SA, Schulkin J. Obstetrician-gynaecologist knowledge of and access to information about the risks of medication use during pregnancy. J Matern Fetal Neonatal Med. 2010 Oct;23(10):1143-50.
38. Voronin Y, Myrzahmetov A, Bernstein A. Access to scientific publications: the scientist's perspective. PLoS One. 2011;6(11):e27868.

81
39. Villafuerte-Galvez J, Curioso WH, Gayoso O. Biomedical journals and global poverty: is HINARI a step backwards? PLoS Med. 2007 Jun;4(6):e220.
40. Savill N, Bushe CJ. A systematic review of the safety information contained within the Summaries of Product Characteristics of medications licensed in the United Kingdom for Attention Deficit Hyperactivity Disorder. how does the safety prescribing advice compare with national guidance? Child Adolesc Psychiatry Ment Health. 2012;6(1):2.
41. Eurostat European Commission. Healthcare statistics. 2011 [updated Nov 201230 January 2013]; Available from: http://epp.eurostat.ec.europa.eu/statistics_explained/index.php/Healthcare_statistics.


Chapter 4
Factors associated with worldwide medicines
compendia publishing


85
International Journal of Clinical Pharmacy
(28 Dec 2012: accepted for publication)
Factors associated with worldwide medicines compendia publishing
Blanca Arguello1, Fernando Fernández-Llimós2
1, 2. Research Institute for Medicines and Pharmaceutical Sciences (iMed.UL), Faculty of
Pharmacy, University of Lisbon, Portugal.
Submitted: 03 Jul 2012
Accepted: 28 Dec 2012
Published: 2013 Mar 28. [Epub ahead of print]

86

87

88

89

90

91

92

Chapter 5
Clinical Pharmacology Information
in Summaries of Product Characteristics
and Package Inserts


95
Clin Pharmacol Ther. 2007 Nov;82(5):566-71
Clinical Pharmacology Information in Summaries of Product
Characteristics and Package Inserts
Blanca Arguello1, Fernando Fernández-Llimós2
1. Farmacia Arguello Magaz. León (Spain)
2. Research Institute for Medicines and Pharmaceutical Sciences (iMed.UL), Faculty of
Pharmacy, University of Lisbon, Portugal.
Submitted: 11 Dec 2006
Accepted: 19 Feb 2007
Published: 4 April 2007
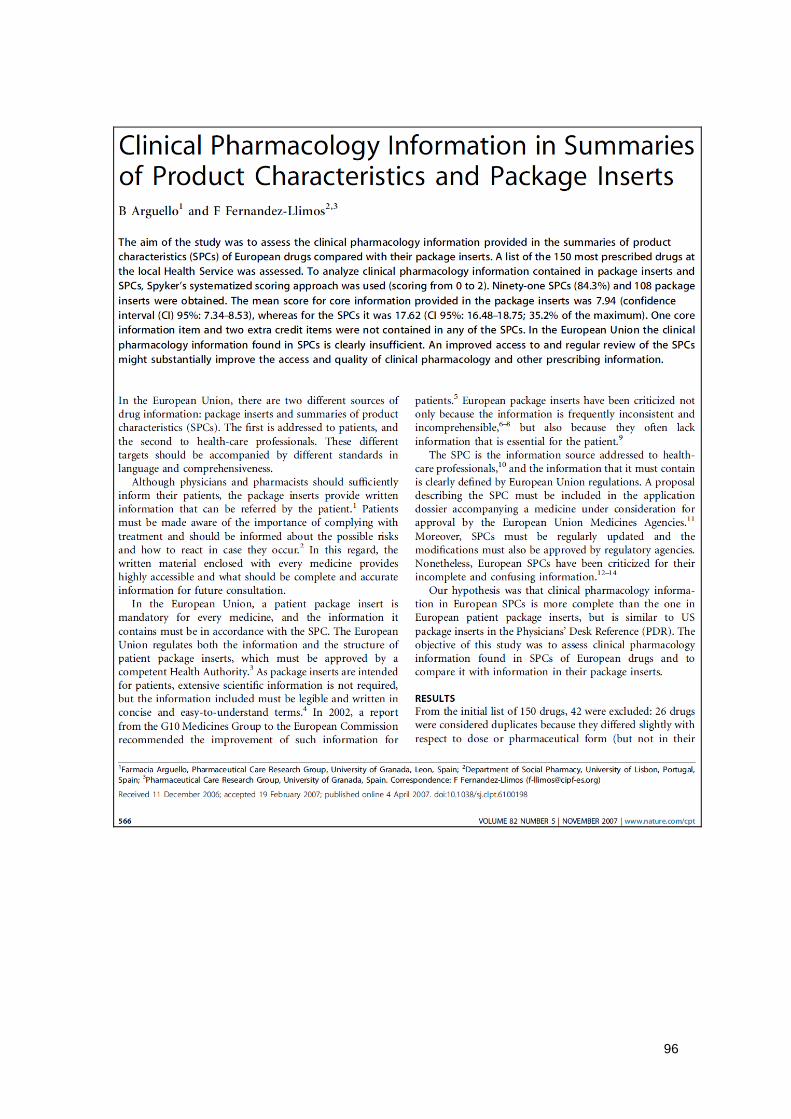
96

97

98

99

100

101


Chapter 6
Assessment of completeness of Summaries of
Product characteristics regarding fertility and
use of medicines in pregnancy and lactation
104
Background
Whenever drug therapy is considered during pregnancy, both potential teratogenic
risks of treatment and the potential risks of no treatment for the mother have to be
carefully weighed.(1) A teratogenic exposure can be defined as ‘one that may produce
a permanent abnormality of structure or function in an organism exposed during
embryonic or foetal life’.(2) According to the European Medicines Agency a teratogen is
an “environmental factor which can cause congenital abnormalities”, congenital
abnormalities (also known as structural birth defect, congenital malformation, or foetal
defect) being: “a consequence of error of morphogenesis, i.e. structural-morphological
defect, grossly or microscopically present at birth whether detected at birth or not”.(3)
The use of drugs in pregnant women is a well-studied subject. Several studies have
concluded that more than 80% of women use at least one drug during pregnancy (1,
4). The most widely used drugs are vitamins, iron preparations, analgesics,
dermatological and gynaecological preparations, antiemetics and antacids, but also
drugs such as nervous system drugs, respiratory drugs and cardiovascular drugs are
used.(4, 5) If folic acid, iron preparations and vitamins are excluded, 69.2% of pregnant
women still use at least one drug.(1) In a study from Schirm et al. more than half of
pregnant women used between one and three different kinds of drugs and 16% used
five of more different types. In addition, drug use increased with trimester, 45.3% of
women used drugs in the first trimester, 57.1% in the second and 70.3% in the third
trimester.(1)
A study among Danish women pointed out that of all prescriptions during pregnancy,
40.9% of prescriptions were for drugs classified as safe by the Swedish classification
system (systems of classification are further explained in this chapter, section
‘Classification of medicinal product according to their risk during pregnancy’), 26% as
potentially harmful and for 28.7% the risk was unknown.(6) It should be noted that the
category ‘potentially harmful’ does not necessarily mean that the drugs with such
classification are not safe. A suspicion of potential adverse effects is enough to classify
a drug under this category.(1) On the other hand, studies showed that the proportion of
women using potentially harmful drugs is lower during pregnancy than before
pregnancy.(1)
Major congenital anomalies occur in approximately 2-4% of all pregnancies, of which
20-25% anomalies have a genetic origin and around 10% have an exogenous and
potentially preventable cause (such as drug teratogenicity, maternal diabetes or alcohol

105
abuse). The aetiology of the remaining 70-75% is unknown.(7) Although teratogenic
effects of drugs cause approximately 1% of birth defects, many health professionals
and patients tend to overestimate them.(7)
Clinicians often have to determine the risk of inadvertent exposure of a pregnant
woman to a medicinal product or decide whether a treatment is appropriate during
pregnancy.(8) One of the main concerns of researchers and healthcare professionals is
the lack of information for clinical practice about the use of medicines during
pregnancy.(9) Pregnant women are frequently considered a ‘special population’ and
thus excluded from clinical trials. The effects of drugs during pregnancy are largely
unknown prior to post-marketing experience (10), and drug safety information is based
on animal studies of variable validity in humans.(11) Teratology testing in rodents and
rabbits is usually required before a new medicinal product is placed on the market, but
in these preclinical studies both false positives and false negatives occur.(2)
Although the opportunities to collect toxicity data before a drug is placed on the market
are very limited, such data can be obtained afterwards.(2) Safety data during clinical
use should help improve the information available on teratogenicity for healthcare
professionals. As explained in the ‘Introduction’ section, Regulatory Authorities and
Marketing Authorisation Holders share responsibility for surveillance of marketed
drugs. Both of them record information on drug safety from different sources, and
procedures have been developed to ensure timely detection and mutual exchange of
safety data.
Classification of medicinal products according to their risk during pregnancy
According to their known or suspected adverse effects on the unborn child, different
classification systems have been developed. These classification systems place drugs
in risk groups to provide guidance for healthcare professionals in the decision of
whether to use a drug during pregnancy.
The most well-known systems include the FDA classification, Swedish classification,
Australian classification and Teratogen Information System (TERIS) risk ratings. These
systems use almost the same codes (A, B, C, D and X) but with different meanings.
The FDA category B, for example might be similar to the Australian and Swedish
category C. Although the aim of these systems is to categorise drugs to help clinicians
in their decision-making, some authors have pointed out differences in the
categorisation of the same drug across the systems. For drugs falling into a specific
risk group, Addis et al. showed that only 26% of the drugs present in the FDA, Swedish

106
and Australian systems were placed in the same risk category.(12) These differences
are a source of confusion for healthcare professionals (1), and the usefulness and
reliability of these classification systems is a matter for debate.(12)
Some authors consider that a possible solution to the ambiguity of the classification
systems and difficulties in the evaluation of teratogenic risk by healthcare professionals
should be the use of narrative statements that describe, summarise and interpret the
available evidence about risks. These narrative statements should replace the existent
rating of drugs to provide estimates of teratogenic risks.(13, 14)
Table 06-01 and 06-02 summarise the FDA, Australian and Swedish classification of
drugs:(15, 16)
Table 06-01. FDA categories for drug use in pregnancy
Category Interpretation
A Adequate, well-controlled studies in pregnant women have not shown an increased risk of foetal abnormalities to the foetus in any trimester of pregnancy.
B Animal studies have revealed no evidence of harm to the foetus, however, there are no adequate and well-controlled studies in pregnant women. OR Animal studies have shown an adverse effect, but adequate and well-controlled studies in pregnant women have failed to demonstrate a risk to the foetus in any trimester.
C Animal studies have shown an adverse effect and there are no adequate and well-controlled studies in pregnant women. OR No animal studies have been conducted and there are no adequate and well-controlled studies in pregnant women.
D Adequate well-controlled or observational studies in pregnant women have demonstrated a risk to the foetus. However, the benefits of therapy may outweigh the potential risk. For example, the drug may be acceptable if needed in a life-threatening situation or serious disease for which safer drugs cannot be used or are ineffective.
X Adequate well-controlled or observational studies in animals or pregnant women have demonstrated positive evidence of foetal abnormalities or risks. The use of the product is contraindicated in women who are or may become pregnant.
Table 06-02. Australian and Swedish categories for drug use in pregnancy
Category Interpretation
A Drugs which have been taken by a large number of pregnant women and women of childbearing age without any proven increase in the frequency of malformations or other direct or indirect harmful effects on the foetus having been observed.
B1 Drugs which have been taken by only a limited number of pregnant women and women of childbearing age, without an increase in the frequency of malformation or other direct or indirect harmful effects on the human foetus having been observed. Studies in animals have not shown evidence of an increased occurrence of foetal damage.
B2 Drugs which have been taken by only a limited number of pregnant women and women of childbearing age, without an increase in the frequency of malformation or other direct

107
Table 06-02. Australian and Swedish categories for drug use in pregnancy
or indirect harmful effects on the human foetus having been observed. Studies in animals are inadequate or may be lacking, but available data show no evidence of an increased occurrence of foetal damage.
B3 Drugs which have been taken by only a limited number of pregnant women and women of childbearing age, without an increase in the frequency of malformation or other direct or indirect harmful effects on the human foetus having been observed. Studies in animals have shown evidence of an increased occurrence of foetal damage, the significance of which is considered uncertain in humans.
C Drugs which, owing to their pharmacological effects, have caused or may be suspected of causing, harmful effects on the human foetus or neonate without causing malformations. These effects may be reversible. Accompanying texts should be consulted for further details.
D Drugs which have caused, are suspected to have caused or may be expected to cause, an increased incidence of human foetal malformations or irreversible damage. These drugs may also have adverse pharmacological effects. Accompanying texts should be consulted for further details.
X -only in the Australian
classification-
Drugs which have such a high risk of causing permanent damage to the foetus that they should not be used in pregnancy or when there is a possibility of pregnancy.
The FDA is currently using the classification previously described. Nevertheless, the
FDA has proposed the amendment of labelling regulations concerning drug use during
pregnancy. The agency proposed a requirement that labelling should include a
summary of the risks of using a drug during pregnancy and lactation and a discussion
of the data supporting that summary. The labelling would also include relevant clinical
information to help healthcare providers to make prescribing decisions and counsel
women about the use of drugs during pregnancy and/or lactation. This proposal would
eliminate the current pregnancy categories A, B, C, D, and X.(17) At the moment, the
Final Rule is in the writing and clearance process. This process requires identification
and consideration of all issues that were raised in the public comments since the
amendment proposal.
European Union Regulations
In the European Union, regulatory authorities have specific rules regulating the
provision of safety information. In the European Union, safety information in SmPCs is
included in two main sections: ‘Contraindications’ (section 4.3) and ‘Special Warnings
and Precautions for Use’ (section 4.4). In section 4.6, specific information about the
use of the drug in pregnancy, lactation and women of child-bearing potential and its
influence on fertility is given (for more information about sections in SmPCs please
refer to chapter one, Introduction, ‘Summaries of Product Characteristics’ section).
108
Fertility is defined as “the actual reproductive performance of an individual, a couple, a
group, or a population, and thus the failure to reproduce defines infertility”.(18)
The European Union highlights the importance of marketing authorisation holders
providing recommendations for use of drugs during pregnancy and lactation and for
women of child-bearing potential and reasons to support these recommendations in
SmPCs.(19) SmPCs do not use any of the previously mentioned systems of drug
classification. Instead, narrative statements are included in the appropriate section. The
European Commission Guideline on Summary of Product Characteristics set the
principles of the content and structure of the information that should be included in this
section.(19)
Because all information cannot be evaluated simultaneously and in order to set
priorities, in most European countries, systems for a rapid transmission of information
have been developed which usually focus on reporting adverse reactions that are both
serious and unexpected.(20) Additionally, the Marketing Authorisation Holder is
required to submit update safety reports periodically. These reports should contain all
reports of drug safety events related to the medicinal product including those coming
from clinical trials, reported spontaneously during clinical use or published in scientific
literature.(21) This monitoring leads to periodical safety changes in the Summaries of
Product Characteristics. As reviewed in the Introduction section, the European Union
requires the Marketing Authorisation Holder to submit reports with a periodicity of six
months for two years, annually for the three following years and then every five years,
at the time of renewal of registration of the medicinal product.(20)
The International Conference on Harmonisation of Technical Requirements for
Registration of Pharmaceuticals for Human Use (ICH) brings together the regulatory
authorities and pharmaceutical industry of Europe, Japan and the US to discuss
scientific and technical aspects of drug registration. ICH's mission is ‘to achieve greater
harmonisation to ensure that safe, effective, and high quality medicines are developed
and registered in the most resource-efficient manner’.
The situation of the submission of periodic update safety reports is different in the three
ICH regions (Europe, United States and Japan). The U.S regulations require quarterly
reports during the first three years, and then annual reports are required. Some authors
consider that the collection of information of safety after a drug is approved by the FDA
is a passive process which is notoriously inefficient and often misleading in the
identification of teratogenic effects.(2) In Japan, the authorities require a survey on a
cohort of a few thousand patients established by a certain number of identified

109
institutions during the six years following authorisation. Systematic information on this
cohort must be reported annually. Regarding other marketing experience, non-serious
adverse reactions, but both mild in severity and unlabelled must be reported every six
months for three years and annually thereafter.(20)
In 2008 the ‘Guideline on risk assessment of medicinal products on human
reproduction and lactation: from data to labelling’ was published in the European Union
in order to describe the process of assessment of non-clinical and human data, and
integrate these assessments for the labelling of the medicinal product. Decision
schemes are provided to determine whether or not a contraindication during pregnancy
should be settled in the labelling and examples of standardized texts are given for
recommendations on use during pregnancy and lactation.(18)
The main recommendations proposed by the guideline regarding use of medicines
during pregnancy are: (18)
[brand] is contraindicated during pregnancy/during (trimester) of pregnancy
[brand] should not be used during pregnancy/during (trimester) of pregnancy
unless the clinical condition of the woman requires treatment with [active
substance]
[brand] is not recommended during pregnancy/during (trimester) of pregnancy
As a precautionary measure, it is preferable to avoid the use of [brand] during
pregnancy/during (trimester) of pregnancy
The use of [brand] may be considered during pregnancy/during (trimester) of
pregnancy, if necessary
[brand] can be used during pregnancy/during (trimester) of pregnancy if
clinically needed
[brand] can be used during pregnancy
These recommendations are suggested in the guideline, taking into account the
information provided from animal and human data.
The main recommendations proposed by the guideline regarding use of medicines
during breastfeeding are: (18)
[brand] is contraindicated during breast-feeding (see section 4.3) (or) should not
be used during breast-feeding (or) breast-feeding should be discontinued during
treatment with [brand] (or) a decision must be made whether to discontinue
breast-feeding or to discontinue/abstain from [brand] therapy taking into

110
account the benefit of breast feeding for the child and the benefit of therapy for
the woman.
[brand] can be used during breast-feeding

111
Objective
To assess completeness of drug information related to safety in European SmPCs
regarding fertility and use of medicines in pregnancy and lactation.

112
Methods
Summaries of product characteristics of medicinal products granted a marketing
authorisation through a centralised procedure in the European Union were retrieved
from the webpage of the European Medicines Agency (www.ema.europa.eu).
From all the retrieved SmPCs those medicinal products which, according to their
indications are not intended to be used in pregnant women, were excluded. Due to the
fact that information in SmPCs is intended to describe the use of the medicinal product
for the indications included in the SmPCs, section 04 ‘Therapeutic Indications’ of the
SmPCs was used to determine which drugs should be excluded from the analysis. Five
groups of indications were used as exclusion criteria: drugs for use in postmenopausal
women, drugs for paediatric use, drugs for male patients, drugs indicated for
contraception, and drugs indicated for assisted reproduction techniques.
For the analysis, all relevant information about the medicinal product included in
section 4.6 (Fertility, pregnancy and lactation) was assessed and included in an ad hoc
created form. When general information about drug class effects was given, it was
considered relevant for the specific medicinal product.
Design of the database
In order to analyse the information from section 4.6 (Fertility, pregnancy and lactation)
on SmPCs an ad-hoc form was created in a Microsoft Access® database. The design
of the database was made taking into consideration scientific literature on the use of
drugs during pregnancy and European Union regulations on the provision of safety
information. According to the EU regulations for the assessment of medicines related to
their use during pregnancy, lactation and in women of child-bearing potential,
knowledge from non-clinical studies, clinical studies, post-marketing surveillance and
knowledge about drugs within the same class should be taken into account.(19) The
form was piloted until the best structure to collect all the relevant information was
agreed. The database consisted of 15 close-ended questions, and two open-ended
questions:
Table 06-03. Questions and answers in the designed database
Questions Answers
1. Is the drug included in the analysis? Yes No: post-menopause No: paediatrics No: men No: contraceptive No: assisted reproduction

113
Table 06-03. Questions and answers in the designed database
Preclinical studies 2. Does the SmPC provide information about the existence of studies in animals for the medicinal product?
Yes, there is information and there are animal studies
Yes: there is information and there are not animal studies
There is no information on this subject
3. Does the SmPC provide information about results of animal studies for the medicinal product?
Yes, there is information No, there is no information on this
subject Not applicable
Clinical trials 4. Does the SmPC provide information about the existence of clinical trials in pregnant women for the medicinal product?
Yes, there is information and there are clinical trials
Yes: there is information and there are not clinical trials
Unclear origin of information There is no information on this
subject Post marketing surveillance 5. Does the SmPC provide information about the existence of clinical experience in pregnant women for the medicinal product?
Yes, there is information and there is clinical experience
Yes: there is information and there is not clinical experience
Unclear origin of information There is no information on this
subject 6. Does the SmPC quantify the existing clinical experience for the medicinal product?
Yes, it quantifies the clinical experience
No, there is no information on this subject
Not applicable Knowledge about the drug 7. Does the SmPC provide information about the drug crossing the human placental barrier?
Yes, there is information and it crosses the placental barrier
Yes: there is information and it does not cross the barrier
It is not known whether it crosses or not
There is no information on this subject
8. Does the SmPC provide information about the effect of the drug on human fertility?
Yes, there is information and it affects fertility
Yes: there is information and it does not affect fertility
The SmPC indicates that it is not known
No, there is no information on this subject
9. Does the SmPC provide information about the need of contraception in women of child-bearing potential taking the medicinal product?
Yes, there is information and women should use contraceptive measures
Yes: there is information and contraceptive measures are not needed
No, there is no information on this subject
10. Does the SmPC indicate how long contraceptive measures should last?
Yes, it specifies how long contraceptive measures should be taken
No, there is no information on this subject
Not applicable

114
Table 06-03. Questions and answers in the designed database
11. Does the SmPC provide information about the excretion of the medicinal product in human milk?
Yes, there is information and the drug is excreted in human milk
Yes, there is information and the drug is not excreted in human milk
The SmPC indicates that it is not known
No, there is no information on this subject
12. Does the SmPC provide information about the adverse reactions (ADRs) of the medicinal product in lactating neonates?
Yes, it provides information about ADRs
No, there is no information on this subject
The SmPC indicates that it is not known
Not applicable 13. Does the SmPC provide information obtained from clinical trials or clinical experience regarding the potential ADRs of the medicinal drug in embryo, foetus, neonates or in pregnant women?
Yes, it provides information about ADRs
No, there is no information on this subject
Not applicable 14. Does the SmPC provide a recommendation for managing the exposure of a pregnant woman to the medicinal product?
Yes, a clear recommendation is given
No, there is no information on this subject
Not applicable Recommendations of use of the medicinal product regarding pregnancy and breastfeeding
15. Does the SmPC include a conclusive recommendation about the use of the medicinal product in pregnant women?
Yes, a conclusive recommendation is given
No, an ambiguous recommendation is given
16. Is the use of the medicinal product during pregnancy somehow restricted?
Yes, there is a restriction to the use of the medicinal product during pregnancy
No, there is no restriction to its use
17. Does the SmPC include a conclusive recommendation about the use of the medicinal product during breastfeeding?
Yes, a conclusive recommendation is given
No, an ambiguous recommendation is given
18. Is the use of the medicinal product during breastfeeding somehow restricted?
Yes, there is a restriction to the use of the medicinal product during breastfeeding
No, there is no restriction to its use
Analysis of SmPCs
Information about the above mentioned fields was retrieved from SmPCs using a
systematic and previously defined guideline. Only specific information items were
sought, using the European regulations on the content and structure of SmPCs as a
model.(19) No deductions or interpretations were made and explicit information items
were sought.
To minimise errors of interpretation and due to the potential lack of homogeneity of
SmPCs, a reference manual was created including the guidelines to fill out the form.

115
Due to the potential use of different terms across the SmPCs, a dictionary of terms was
produced prior to the assessment. The terms ‘human studies’, ‘assessment’ or ‘trials’
were used as synonymous to clinical trials. Clinical experience was assimilated to
‘epidemiological use’, ‘epidemiological evidence’ or ‘experience’. If expressions such as
‘clinical data’, ‘limited data’ or ‘clinical data on exposure’ appear, both clinical trials and
clinical experience were defined as ‘unclear origin’.
In order to define whether the recommendation about the use of the medicinal product
during breastfeeding or pregnancy was conclusive, a list extracting the expressions
found in SmPCs was created and they were categorised as follows:
Conclusive expressions:
Contraindicated
Must not be used
Should not be used
Not recommended
No restrictions to the use
Non-conclusive expressions:
Should not be used, unless… (clearly necessary, the benefits outweigh the
risks, or other ambiguous expressions)
Should be used only if… (ambiguous expression)
It is preferable to
Use with caution
For drugs which are a combination of several active substances, information may be
given separately for each active substance. In these cases if any of the active
substances are known to be excreted into human milk, the whole drug was considered
to be excreted into human milk. Furthermore, if for any of the active substances there
are no animal studies, clinical trials or experience; it was considered that there are no
animal studies, trials or experience for the drug. If the combination drug mentions the
effects of at least one of the substances in nursing neonates, it was considered that it
provided information about ADRs. In case information was given for several active
substances, the most restricted information was selected to complete the form.
If for any of the questions (very) limited data are mentioned, we considered that data
on the topic exist. However, if SmPC states ‘there are limited or no data’ or ‘insufficient’
we considered that data on the subject were lacking.

116
Data extraction was performed independently by two researchers (T.M.S. and B.A.)
who strictly followed the reference manual. When discrepancies existed,
disagreements were adjudicated by a third reviewer (F.F-L).
Data analysis
To avoid potential effects of low component prevalence on Kappa results, inter-rater
agreement was evaluated using a prevalence-adjusted bias-adjusted kappa (PABAK)
(22), by using the WinPepi version 11.25 software. The PABAK was used as an index,
because it allows the adjustment of Kappa for differences in prevalence of the
variables.(22, 23) As standards for strength of agreement for the PABAK coefficient,
we assumed: PABAK≤0=poor, 0.01–0.20=slight, 0.21–0.40=fair, 0.41–0.60=moderate,
0.61–0.80=substantial, and 0.81–1=almost perfect.(23)
After reconciliation of discrepancies between raters, a descriptive analysis with
frequencies of categorical/ordinal variables, as well as central tendency/dispersion
measures for the discrete variables, was performed. Normality for the latter was
assessed using the Kolmogorov–Smirnov test. For non-normally distributed variables,
non-parametric tests were used to explore the association with categorical variables
(Mann-Whitney test). Association between categorical variables was evaluated through
chi-square tests. Statistical analyses were performed using the SPSS version 16
software package.

117
Results
Analysis of SmPCs
A total of 582 SmPCs were retrieved from the EMA website on 29th April 2011, from
which 59 (10.1%) were orphan medicines. The average number of days since the
authorisation date was 2083.5 days (SD=1595.0), approximately 5.7 years old. The
average number of days since publication/last update was 266.9 days (SD=273.3). The
Kolmogorov–Smirnov test revealed that both authorization and last update dates were
not normally distributed (p<0.001).
Table 06-04 presents the results of the application of exclusion criteria by the two
raters:
Table 06-04. Results of application of exclusion criteria by two independent raters
Exclusion criteria T.M.S B.A.
n % n %
No: post-menopause 12 2.1 13 2.2
No: men 11 1.9 11 1.9
No: contraceptive 3 0.5 1 0.2
No: assisted reproduction programmes 7 1.2 7 1.2
No: paediatrics 14 2.4 11 1.9
Included 535 91.9 539 92.6
Table 06-05 presents inter-rater agreement coefficients, expressed as PABAK
(Prevalence-Adjusted Bias-Adjusted Kappa) and percentage of agreement. Out of the
18 variables evaluated, 14 (77.8%) presented an ‘almost perfect’ agreement, three
(16.7%) presented a ‘substantial’ agreement, and one (5.6%) presented a ‘moderate’
agreement.
Table 06-05. Inter-rater agreement
Name PABAK % Agreement
1. Included in the analysis 0.99 98.8
2. Existence animal studies 0.90 92.8
3. Results animal studies 0.90 92.3
4. Existence clinical trials 0.70 75.6
5. Existence clinical experience 0.60 67.9
6. Quantifies clinical experience 0.86 89.3
7. Crosses placental barrier 0.94 95.0
8. Information about influence on human fertility 0.91 92.6
9. Information about need for contraceptive measures 0.66 69.0
10. Information on duration of contraception 0.91 93.3
11. Excretion in human milk 0.91 92.8
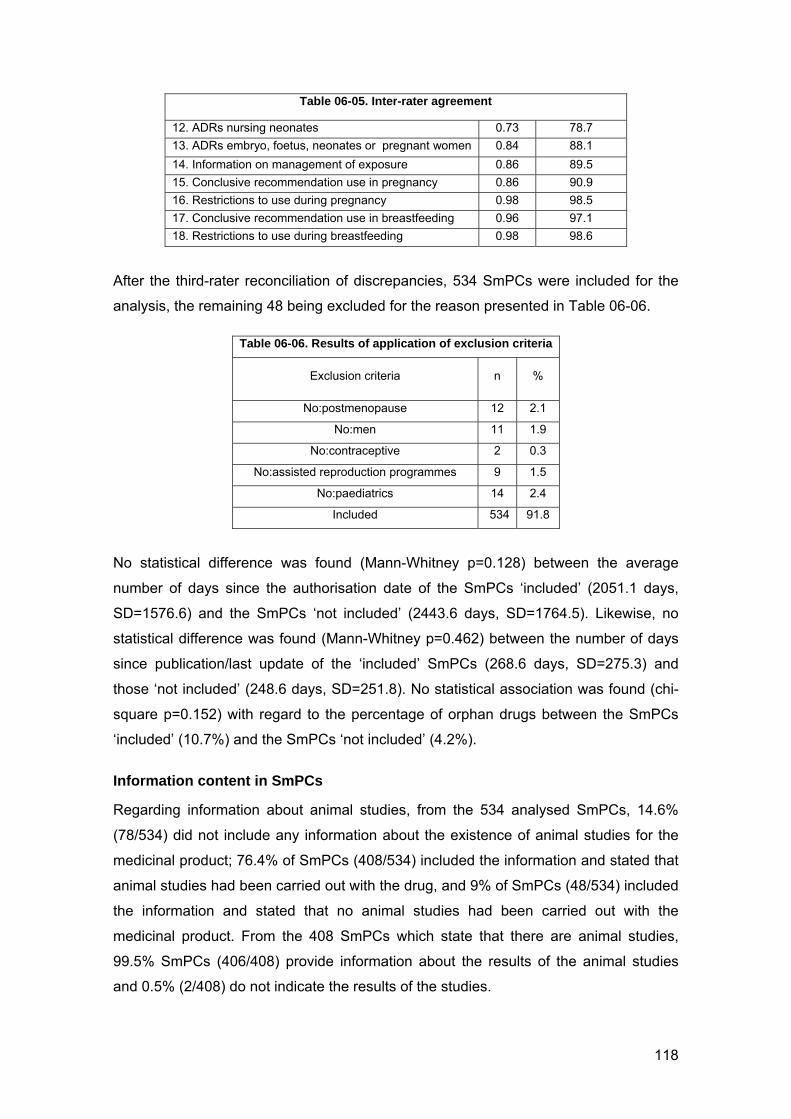
118
Table 06-05. Inter-rater agreement
12. ADRs nursing neonates 0.73 78.7
13. ADRs embryo, foetus, neonates or pregnant women 0.84 88.1
14. Information on management of exposure 0.86 89.5
15. Conclusive recommendation use in pregnancy 0.86 90.9
16. Restrictions to use during pregnancy 0.98 98.5
17. Conclusive recommendation use in breastfeeding 0.96 97.1
18. Restrictions to use during breastfeeding 0.98 98.6
After the third-rater reconciliation of discrepancies, 534 SmPCs were included for the
analysis, the remaining 48 being excluded for the reason presented in Table 06-06.
Table 06-06. Results of application of exclusion criteria
Exclusion criteria n %
No:postmenopause 12 2.1
No:men 11 1.9
No:contraceptive 2 0.3
No:assisted reproduction programmes 9 1.5
No:paediatrics 14 2.4
Included 534 91.8
No statistical difference was found (Mann-Whitney p=0.128) between the average
number of days since the authorisation date of the SmPCs ‘included’ (2051.1 days,
SD=1576.6) and the SmPCs ‘not included’ (2443.6 days, SD=1764.5). Likewise, no
statistical difference was found (Mann-Whitney p=0.462) between the number of days
since publication/last update of the ‘included’ SmPCs (268.6 days, SD=275.3) and
those ‘not included’ (248.6 days, SD=251.8). No statistical association was found (chi-
square p=0.152) with regard to the percentage of orphan drugs between the SmPCs
‘included’ (10.7%) and the SmPCs ‘not included’ (4.2%).
Information content in SmPCs
Regarding information about animal studies, from the 534 analysed SmPCs, 14.6%
(78/534) did not include any information about the existence of animal studies for the
medicinal product; 76.4% of SmPCs (408/534) included the information and stated that
animal studies had been carried out with the drug, and 9% of SmPCs (48/534) included
the information and stated that no animal studies had been carried out with the
medicinal product. From the 408 SmPCs which state that there are animal studies,
99.5% SmPCs (406/408) provide information about the results of the animal studies
and 0.5% (2/408) do not indicate the results of the studies.

119
Regarding information about clinical trials, from the 534 analysed SmPCs, 28.7%
(153/534) did not provide any information; 1.5% (8/534) informed about the existence
of clinical trials in pregnant women; 67.2% (359/534) provided information on the
subject and stated that no clinical trials had been carried out in pregnant women and in
2.6% (14/534) the information was not clear.
As far as clinical experience is concerned, from the 534 analysed SmPCs, 13.1%
(70/534) did not provide any information; 16.7% (89/534) informed of the existence of
clinical experience in pregnant women; 67.6% (361/534) provided information on the
subject and stated that there was no clinical experience in pregnant women and in
2.6% (14/534) the information was not clear. From the 89 SmPCs stating that there is
clinical experience, 37.1% SmPCs (33/89) quantify this clinical experience and 62.9%
(56/89) do not quantify it.
Making an overall assessment of these last variables, from the 408 SmPCs stating that
there are animal studies, 347 SmPCs indicate that there are no clinical trials and there
is no clinical experience or do not provide any information about trials and experience.
This means that in 65.0% of all the analysed SmPCs, the only information provided is
that from preclinical studies.
No statistical difference (Mann-Whitney p=0.185) was found between the days since
marketing authorisation in the 89 SmPCs that inform about the existence of clinical
experience of the medicinal product (mean=2284.9 days; SD=1874.6), and in the 361
SmPCs stating that there is no clinical experience (mean=1885.3 days; SD=1476.0).
In order to analyse the information about ADRs obtained from clinical trials or clinical
experience (item number 13 in the questionnaire), the 106 SmPCs that stated that
there were clinical trials and/or clinical experience of the drug during pregnancy were
further analysed. From those 106 SmPCs, 85.8% SmPCs (91/106) provided
information about potential ADRs in embryo, foetus, neonates or in pregnant women,
and 14.2% (15/105) did not mention any ADRs.
Regarding information about the drug crossing the placental barrier, from the 534
analysed SmPCs, 89.3% (477/534) did not include any information about the drug
crossing (or not) the placental barrier. 8.6% of SmPCs (46/534) included the
information and stated that the drug crossed the placental barrier; 1.3% of SmPCs
(7/534) included the information and stated that the drug did not cross the placental
barrier and 0.7% (4/534) stated that it was not known whether the drug crossed the
placental barrier or not. No statistical difference (Mann-Whitney p=0.574) was found

120
between the days since marketing authorisation in the 53 SmPCs that provide
information about the drug crossing (or not) the placental barrier (mean=2130.7 days;
SD=1580.0), and in the four SmPCs stating that this information is not known
(mean=2339.3 days; SD=1797.4).
Regarding the effect of the drug on human fertility, from the 534 analysed SmPCs, 79%
SmPCs (422/534) did not provide any information on the subject. 2.2% SmPCs
(12/534) provide information and state that the drug affects fertility, 1.1% (6/534)
provide information and state that the drug does not affect fertility and 17.6% (94/534)
state that this fact is not known. No statistical difference (Mann-Whitney p=0.412) was
found between the days since marketing authorisation in the 18 SmPCs that provide
information about the influence (or not) of the medicinal product in human fertility
(mean=1640.6 days; SD=1691.0), and in the 94 SmPCs stating that this information is
not known (mean=1802.9 days; SD=1453.3).
Out of the 112 SmPCs providing any information on human fertility, there is no
statistical difference (Chi-square p=0.656) in the prevalence of SmPCs reporting not
knowing whether the drug affects human fertility between orphan drugs (80.0%) and
non-orphan drugs (84.5%).
About the use of the drug in women with child-bearing potential, from the 534 analysed
SmPCs, 70.6% SmPCs (377/534) do not provide any information on this matter. 29.4%
SmPCs (157/534) provided information and stated that women of child-bearing
potential using the medicinal product should use contraceptive measures. None of the
SmPCs provided information to state that there was no need to take contraceptive
measures. From the 157 which indicated that contraceptive measures were needed,
79% SmPCs (124/157) clearly indicated how long these contraceptive measures
should last and 21% (33/157) did not provide information on the subject.
As far as the excretion of the medicinal product in human milk is concerned, from the
534 analysed SmPCs, 21.5% SmPCs (115/534) do not provide any information on this
matter. 16.5% SmPCs (88/534) provided information and indicated that the drug is
excreted in human milk, 0.6% SmPCs (3/534) provided information and indicated that
the drug is not excreted in human milk, and 61.4% (328/534) indicated that this fact is
not known. From the 88 SmPCs which indicated that the medicinal product was
excreted in human milk, 88.6% (78/88) did not provide information about the ADRs in
lactating neonates, 9.1% (8/88) provided information about potential ADRs in lactating
neonates and 2.3% (2/88) indicated that there is no known information about ADRs in
lactating neonates. No statistical difference (Mann-Whitney p=0.613) was found

121
between the days since marketing authorisation in the 91 SmPCs that provide
information about excretion (or not) of the medicinal product in human milk
(mean=1953.2 days; SD=1456.3), and in the 328 SmPCs stating that this information is
not known (mean=2076.1 days; SD=1571.8). Out of the 419 SmPCs providing any
information on the excretion of the medicinal product in human milk, statistical
difference appears (Chi-square p=0.013) in the prevalence of SmPCs reporting not
knowing whether the drug is excreted into human milk between orphan drugs (91.1%)
and non-orphan drugs (76.3%) appears.
Regarding management of pregnancies exposed to the medicinal product, from the
534 analysed SmPCs, 87.3% SmPCs (448/534) do not provide any information on how
pregnant women exposed to the drug should be managed and 12.7% SmPCs (65/534)
gave a clear recommendation on how to manage this exposure.
Recommendations for use
Finally, analysing the recommendations given about the use of the drug during
pregnancy, from the 534 analysed SmPCs, 94.6% SmPCs (505/534) restricted the use
of the drug to some extent, 3.7% SmPCs (20/534) did not restrict the use of the
medicinal product in pregnant women and 1.7% (9/534) did not provide a
recommendation on the use of the drug during pregnancy. From the 505 SmPCs that
restrict the use of the drug during pregnancy 89.7% (453/505) do not provide
information about the drug crossing or not the placental barrier; 13.1% (66/505) do not
provide information about the existence of studies in animals; 26.9% SmPCs (136/505)
do not provide any information about the existence of clinical trials in pregnant women;
and 12.3% SmPCs (62/505) do not provide any information about the existence of
clinical experience in pregnant women.
From the 525 SmPCs which provide a recommendation, 43% (226/525) included a
conclusive recommendation about the use of the medicinal product in pregnant women
and 57% (299/525) provided an ambiguous recommendation. From those 299 SmPCs
which provide an ambiguous recommendation, 91.6% (274/299) lack information about
the drug crossing the placental barrier; 9.4% (28/299) lack information about the
existence of studies in animals; 21.4% SmPCs (64/299) do not provide any information
about the existence of clinical trials in pregnant women; and 10.7% SmPCs (32/299) do
not provide any information about the existence of clinical experience in pregnant
women.

122
When analysing the recommendations given about the use of the drug during
breastfeeding, from the 534 analysed SmPCs, 92.1% SmPCs (492/534) restricted the
use of the drug to some extent, 6.7% SmPCs (36/534) did not restrict the use of the
medicinal product in breastfeeding women and 1.1% (6/534) did not provide a
recommendation on the use of the drug during breastfeeding. From the 492 SmPCs
that restrict the use of the drug during breastfeeding 16.9% (83/492) do not provide
information about the drug being excreted into human milk.
From the 528 SmPCs which provide a recommendation, 83.5% (441/528) included a
conclusive recommendation about the use of the medicinal product in pregnant women
and 16.5% (87/525) provided an ambiguous recommendation. From those 87 SmPCs
which provide an ambiguous recommendation, 26.4% (23/87) lack information about
the drug being excreted into human milk.

123
Discussion
Analysis of SmPCs
Access to SmPCs through the European Medicines Agency website was complete.
SmPCs retrieved from in the EMA website correspond to medicines authorised through
a centralised procedure. The centralised procedure came into operation in 1995, and
allows a medicinal product to be granted a marketing authorisation throughout the EU,
as well as in Iceland, Liechtenstein and Norway. In our analysis, the average SmPC
was approximately 5.7 years old, which suggests that the centralised procedure has
been increasingly popular in recent years. These data agree with those published by
the European Medicines Agency.(24) Since the centralised procedure has been in
force since 1995, we should expect that medicinal products would be, in general, more
recent than those authorised through the national authorities.
Applying to a marketing authorisation through a centralised procedure is optional for
any medicine as long as it is a significant therapeutic, scientific or technical innovation,
or if its authorisation would be in the interest of public or animal health. For some
medicinal products, it is compulsory to apply through the centralised procedure. These
are the following: (25)
human medicines containing a new active substance which was not authorised
in the Community before 20 May 2004 for the treatment of HIV/AIDS, cancer,
diabetes, neurodegenerative diseases, auto-immune and other immune
dysfunctions, and viral diseases
veterinary medicines for use as growth or yield enhancers
medicines manufactured using biotechnology processes
advanced-therapy medicines, such as gene-therapy, somatic cell-therapy or
tissue-engineered medicines
officially designated 'orphan medicines'
Not only is the authorisation date more recent, but also the last update of the average
SmPC (220 days) was much more recent than the updates seen in SmPCs (3 years) in
our study presented in Chapter 5 (‘Clinical Pharmacology Information in Summaries of
Product Characteristics and Package Inserts’). In this study, most of the analysed
SmPCs belonged to medicinal products authorised by national regulatory authorities.
When reviewing the method selected to analyse the SmPCs, after the production of the
guidelines to help in the process of assessment, according to the PABAK values, we
can consider it was successful. Nearly 95% of the variables achieved an ‘almost

124
perfect’ or ‘substantial’ agreement. This is coincident with the high values of the
percentages of agreement among researchers, which ranged from 67.9 to 98.8%.
Information content in SmPCs
When analysing the content of SmPCs, we should highlight that it is not the purpose of
the SmPC to give general advice, but specific aspects related to use of the medicinal
product and its effects related to the treatment should be mentioned.(19) According to
European regulations, “information on the risks following exposure to the medicinal
product before and during pregnancy, and during lactation should be provided as well
as recommendations on the management of risk in clinical practice”.(18) According to
the European Commission Guideline on SmPCs, which sets the principles to present
the information in SmPCs regarding content and structure, “in the overall assessment,
all available knowledge should be taken into account, including clinical studies and
post-marketing surveillance, pharmacological activity, results from non-clinical studies,
and knowledge about compounds within the same class”.(19) According to this
regulation, all of the mentioned sources of knowledge were evaluated.
Regarding non-clinical studies, more than 75% of SmPCs provided information and
results of animal studies. The European Medicines Agency highlights the importance of
non-clinical studies, specially during drug development, and the early post-marketing
period.(18) However, although these non-clinical studies can be useful to predict
human risk, the extent of this prediction needs ‘to be taken with caution’.(3)
For clinical trials, only 1.5% of SmPCs stated that there were clinical trials on the use of
the drug during pregnancy. Pregnant women have traditionally been excluded from
biomedical research which results in a lack of knowledge about the risks and potential
benefits of medicinal products in this population.(26) Until 1993, the US Food and Drug
Administration had a policy of excluding all women of childbearing potential from
participating in drug research. Today, although the FDA is still cautious about the
inclusion of pregnant women in clinical trials, the FDA ‘Office of Women's Health’,
actively promotes their participation.(26) Other authors also argue that pregnant
women should be enrolled in clinical trials.(26) In the EU, clinical trials rarely include
pregnant women (unless the product is intended specifically for use during pregnancy)
and most clinical trials require women of childbearing age to use effective
contraception.(3)
Another source of clinical information is clinical experience after the medicinal product
has been marketed. Once the medicinal product is granted a marketing authorisation,

125
pharmacovigilance programmes in pregnant women collect information on safety
during pregnancy, aiming to provide better information for healthcare professionals.
This information on drug exposure in pregnancy is necessary to identify agents
potentially harmful to the foetus or establish that the foetal toxicity of a product is
limited.(3) In 2005, the European Medicines Agency adopted its ‘Guideline on the
Exposure to Medicinal Products during Pregnancy’. This guideline proposed active
post-marketing surveillance for collecting data on drug use during pregnancy, not only
for newly marketed drugs but also for established products, for which reliable data in
animals are lacking and experience in humans was poorly documented.(26) Our study
shows that in 2012, fewer than 17% SmPCs informed of the existence of clinical
experience in pregnant women. The other 83% SmPCs either did not provide any
information, stated that there was no clinical experience or their information was
unclear. Additionally, from those in which there was clinical experience only 37%
quantified this experience.
According to EU regulations, the clinical data section should also “include
comprehensive information on relevant adverse events reported in the embryo, the
foetus, neonate, infant and pregnant woman, when appropriate”. From the SmPCs
which provide information about clinical trials or experience, those providing the
potential ADRs observed in the trials or post-marketing surveillance or their absence
represented only 17% of all SmPCs.
In conclusion, according to EU regulations the available knowledge of non-clinical
studies, clinical studies, post-marketing surveillance, pharmacological activity, and
knowledge about compounds within the same class should be taken into account in the
overall assessment.(19) Considering that, according to our results, 65.0% of all the
analysed SmPCs only include information from preclinical studies; and only 17% of all
SmPCs describe the potential ADRs (or the lack of them) observed in clinical trials or
clinical experience, we can conclude that the available information in SmPCs for
healthcare professionals is scarce.
Although no statistical difference was found, the mean ‘age’ of SmPCs informing of the
existence of clinical experience (around 6 years) is greater than the mean ‘age’ of
those which state that there is no clinical experience (around five years). Nevertheless,
five years should be a reasonable amount of time to gain experience through post-
marketing surveillance.
Another of the analysed variables was to know if the medicinal product crosses the
placental barrier. Most medicinal products could have effects on the foetus if they can

126
cross the placenta to at least some extent. The potential to reach the foetus and
consequently, the potential harmful effects, depends on whether the rate and extent of
drug transfer results in sufficient concentrations within the foetus.(3) Although the
information about crossing the placental barrier is not a requirement in the EU
Guideline on SmPCs, we have considered that these data would be of value for the
assessment of the medicinal product. Nearly 90% did not include any information about
this subject and approximately 1% stated that this fact was not known. Although there
was no statistical difference, the average ‘age’ of the SmPCs, which state that it is not
known whether the medicinal product crosses the placental barrier or not is more than
6 years.
Regarding the effect of the medicine on human fertility, nearly 80% SmPCs do not
provide any information on the matter and around 18% state that this fact is not known.
While the Guideline on SmPcs includes a specific section for data on fertility (19), most
SmPCs do not provide information on the matter. It is remarkable that medicines, for
which the effect on human fertility is not known, were authorised on average about five
years ago. This time, added to pre-authorisation research, should be time enough to
have information on the subject.
Information about the use of the medicinal product in women of child-bearing potential
was also assessed. The guideline on SmPCs notes that “recommendations on the use
of the medicinal product in women of childbearing potential should be given when
appropriate, including the need for a pregnancy test or contraceptive measures”.(19)
However, around 70% of SmPCs did not provide any recommendation for use in
women of child-bearing potential. It is also remarkable that none of the analysed SmPC
stated that there was no need to take contraceptive measures. The reason why those
70% SmPCs did not provide any information may be because there is no need to take
contraceptive measures or it is not known. This could be a source of confusion for
healthcare professionals, who do not know if they can safely recommend the use of a
medicinal product in this population. Analysing the SmPCs that did provide information,
nearly 80% indicated how long the contraceptive measures should be taken, but there
was still 20% in which this information was not included.
Regarding the use of drugs in breastfeeding, information on the excretion of the
medicinal product in human milk was evaluated. According to the EMA, there are major
elements of risk assessment during lactation, such as the plasma concentration of the
medicinal product in lactating infants, and the estimation of the amount of medicinal
product received by infants via milk.(18) However, more than 20% SmPCs do not

127
include any information on the excretion of the drug in human milk, and more than 60%
indicated that it is not known. The other major elements for risk assessment during
lactation are “case reports of adverse effects in breastfed infants” and “follow-up of
breastfed infants during treatment”.(18) From the SmPCs indicating that the medicinal
product was excreted in human milk, nearly 89% did not provide any information about
known ADRs in lactating neonates and more than 2% indicated that this information is
not known. Although there is no statistical difference, both the SmPCs providing
information on excretion of the drug in human milk and those which state that it is not
known are on average more than five years old. This time should be considered
sufficient to provide some information about the excretion of the medicinal product into
human milk and efforts should be made to provide these data. Statistical difference
was found between orphan drugs not knowing if the drug was excreted in milk (around
91%) and non-orphan drugs (around 76%). It makes sense that orphan drugs, due to
their characteristics, provide poorer information than non-orphan drugs. However,
values found in the analysis are quite high for both categories.
Regarding management of exposed pregnancies, the guideline on SmPCs indicates
that “recommendations for the management of exposure during pregnancy when
appropriate (including relevant specific monitoring such as foetal ultrasound, specific
biological or clinical surveillance of the foetus or the neonate) should be given”.(19) Our
study found that more than 87% SmPCs do not provide any information on how
pregnant women exposed to the drug should be managed. This information is essential
for the healthcare professional when dealing with a pregnant woman who has already
used the medicinal product. Andrade et al. calculated that approximately one half of all
pregnant women used drugs for which there was no evidence of safety during
pregnancy in humans or which had evidence of foetal risk in animal or human
studies.(27)
Expressions and wording in SmPCs
Lack of homogeneity in word-use was a constant across SmPCs. Although criteria for
the definition of ambiguous expressions were established, some expressions present in
SmPCs and the use of the same words with different meanings across SmPCs led to
difficulties in interpretation during the analysis.
For example, the existence of ‘limited’ data was used in several SmPCs with different
meanings. Although EU regulations set as an example the sentence “there are no or a
limited amount of data from the use of [Active substance] in pregnant women” and
defines ‘limited amount of data’ as less than 300 pregnancy outcomes, and ‘moderate

128
amount of data’ as between 300-1000 pregnancy outcomes(18), the use of ‘limited
data has been shown to be associated to different meanings across SmPCs. Some
SmPCs mentioned that there are limited data available and describe ADRs derived
from these data: e.g. “there is limited data from the use of [brand] in pregnant women.
However, congenital malformations including ear malformations, i.e. abnormally formed
or absent external/middle ear, have been reported in children of patients exposed to
[brand] in combination with other immunosuppressants during pregnancy. Cases of
spontaneous abortions have been reported in patients exposed to [brand]”. (SmPC
number 67); other SmPCs assimilate limited data to ‘no data’, e.g. “there are no or a
limited amount of data from the use of [brand] in pregnant women” (SmPCs numbers
16, 59, 108); others briefly state “there is a limited amount of data from the use of
[brand] in pregnant women” and no further information is provided, and others quantify
‘limited experience’ as more than 800 exposed pregnant women and ‘very limited’ as
more than 300 exposed pregnant women (SmPC number 317).
It is also surprising, that the SmPC being the official drug information source for
healthcare professionals in the European Union, some SmPCs state in their
recommendations “the use of [brand] may be considered during pregnancy if this is
thought to be necessary, taking into account official recommendations” (SmPC
numbers 204, 391) or even just state as a recommendation: “the use of [brand] during
pregnancy has to take into account official recommendations” (SmPC number 180).
Other ambiguous expressions found in SmPCs may lead to confusion of the healthcare
professional in decision-making. For example, one SmPC stated: “If it is used during
pregnancy, the patient must be informed of the potential risk to the foetus and be
monitored carefully. If [brand] is used at the end of pregnancy, potential adverse
reactions should be monitored carefully in the newborn.” (SmPC number 560).
Although information on management of exposure is relevant in clinical practice,
healthcare professionals not receiving additional information may not know what
parameters should be monitored according to the mentioned recommendation.
Finally, some SmPCs make absurd recommendations for the use of the drug during
pregnancy by stating obvious principles, such as: “can be used during pregnancy if the
dosage recommendation in section 4.2 is respected” (SmPC number 141) or “can be
used during pregnancy if clinically needed” (SmPC number 149).

129
Recommendations
Analysing the recommendations given about the use of the drug during pregnancy,
nearly 95% SmPCs restricted to some extent the use of the drug, fewer than 4%
SmPCs did not restrict the use of the medicinal product in pregnant women and fewer
than 2% did not provide a recommendation on the use of the drug during pregnancy.
From the SmPCs in which the use of the drug was restricted, nearly 90% do not
provide information about the drug crossing or not the placental barrier; around 13% do
not provide information about the existence of studies in animals; around 27% SmPCs
do not provide any information about the existence of clinical trials in pregnant women;
and around 12% SmPCs do not provide any information about the existence of clinical
experience in pregnant women. For those mentioned SmPCs, their use is restricted not
because their potential effects on the foetus are known, but because data are not
available. Other authors have previously argued that, although only a few drugs are
known to cause birth defects in humans, it is the uncertainty about the safety of the
majority that may lead to underprescribing for pregnant women.(7) This has also been
demonstrated by our results, in which nearly 95% SmPCs are restricted.
Other authors have stated that information to determine the risks of treatment with a
particular medication during pregnancy is often unavailable.(2) Lo et al. examined 486
drugs authorised between 1980 and 2000 and found that more than 90% of these
drugs did not have a determined teratogenic risk.(2) Adam et al. reviewed prescription
medications approved by the FDA between 2000 and 2010 and the teratogenic risk
was undetermined in 97.7%.(28) Friedman et al. stated that published data are
insufficient to determine teratogenicity in humans of almost half all the analysed drugs,
and moreover, the quality of the available data for those drugs which could be rated for
teratogenicity was only considered as ‘fair’ on average.(29) The American Teratology
Society Public Affairs Committee, in the ‘Workshop on the Use of Data from Animal
Developmental Toxicity Studies in Pregnancy Labels’ agreed that when evaluating
risks of use of drugs during pregnancy, the following statements should be considered:
(8)
Lack of data does not indicate lack of effect.
Lack of effect found in animal studies does not guarantee lack of effect in
humans.
The dose and route of administration affect the likelihood of an adverse effect.
Effects depend on the timing of exposure during pregnancy and several agents
may also have an influence on adverse effects (genetic factors of the patient,
130
exposure to other nutritional agents, drugs, or chemicals, including over-the-
counter medications, herbals, dietary supplements, and environmental agents).
With regard to providing a conclusive statement on the use of the drug during
pregnancy, according to our results 43% of SmPCs contained a conclusive statement
and 57% provided an ambiguous recommendation. Although some of the
recommendations considered ‘ambiguous’ in this study are proposed in the 2008
guideline on risk assessment in human reproduction (18), it is important to identify
which is the main objective of the SmPC. Although the SmPC is a document with legal
value to establish limits to the responsibilities of the marketing authorisation holder, it is
also a source of information for healthcare professionals in clinical practice. Obviously,
a balance between the two roles of the SmPC should be found.
Healthcare professionals are not aware of the meanings of the statements that
recommend or discourage the use of a medicinal product during pregnancy or lactation
that are explained in the EMA guideline.(18) This guideline should therefore reject any
subjectivity in the statements that may lead professionals to confusion in decision-
making.
Moreover, some SmPCs have been updated after the 2008 guideline was published,
and do not use the proposed statements and use other more restrictive statements.
For example, according to the guideline if “a moderate amount of data on pregnant
women (between 300-1000 pregnancy outcomes) indicate no malformative or
feto/neonatal toxicity + Animal studies do not indicate reproductive toxicity” the
statement that should be used is: “the use of [brand] may be considered during
pregnancy/during (trimester) of pregnancy, if necessary”. In one of the reviewed
SmPCs, which states that “the moderate number (approximately 450) of prospectively
collected pregnancies exposed to [active substance] with known outcomes, does not
indicate unexpected effects on pregnancy outcome” and “in a developmental toxicity
study conducted in mice …., there was no indication of maternal toxicity, embryotoxicity
or teratogenicity”, the recommendation provided was “administration of [active
substance] is therefore not recommended during pregnancy” (SmPC number 410).
In SmPCs including an ambiguous recommendation, the decision is to some extent left
to the healthcare professional. When analysing other data provided in those SmPCs,
we found that nearly 92% lacked information about the drug crossing the placental
barrier; around 9% lacked information about the existence of studies in animals; 21%
SmPCs did not provide any information about the existence of clinical trials in pregnant
women; and nearly 11% SmPCs did not provide any information about the existence of
131
clinical experience in pregnant women. Due to the lack of information, a decision is
difficult to make under these circumstances. Other authors consider that for most drugs
information available for healthcare professionals is inadequate to determine whether
the benefits exceed the teratogenic risks.(1)
Regarding breastfeeding, the use of medicines during breastfeeding was restricted in
92.1% SmPCs and 1.1% did not provide any recommendation on the use of the drug
during breastfeeding. From the SmPCs that restrict the use of the drug during
breastfeeding, 16.9% do not provide information about the drug being excreted into
human milk. This can be seen in some examples, such as “it is unknown whether
[brand] is excreted in human milk. No effects on the breastfed newborn/infant are
anticipated since the systemic exposure of the breast-feeding woman to [brand] is
negligible….As a precautionary measure, the use of [brand] during lactation should be
avoided” (SmPC number 242).
Although the use of drugs during breastfeeding is also highly restricted, the
recommendations included are much clearer and 83.5% of SmPCs that provided a
recommendation included a conclusive statement about the use of the medicinal
product in pregnant women. From those 16.5% SmPCs which provide an ambiguous
recommendation, 26.4% lack information about the drug being excreted into human
milk. As an example, one SmPC stated “no specific advice can be given on whether to
use or not in lactating mothers” (SmPC number 19):
Despite the limitations of SmPCs, their value as an official source of information is
undeniable. Savill et al. analysed the safety information in all SmPCs for medicinal
products authorised in the United Kingdom for the treatment of Attention Deficit
Hyperactivity Disorder, and compared it to the safety advice and recommendations
provided in two UK clinical guidelines (SIGN –Scottish Intercollegiate Guidelines
Network- and NICE – National Institute for Health and Clinical Excellence - guidelines).
Indications, contraindications, and warnings and precautions were analysed in the
previous mentioned sources. The results of this study show lack of consistency among
sources, which leads to confusion in healthcare professionals about the suitability of
specific medications in individual patients. Additionally, the clinical guidelines state that
professionals have the responsibility of knowing the information in the SmPC of any
drug and are expected to take this information fully into account when making clinical
decisions.(21) Savill et al. concluded that the SmPC, as an independent and current
source of information, may be the best way of making prescribing decisions based on
sound evidence.(21)

132
Limitations:
This analysis was performed in the SmPCs of medicinal products granted a marketing
authorisation through a centralised procedure. These medicinal products are a small
percentage of all the authorised products in the European Union and the results of this
analysis cannot be extrapolated to SmPCs of medicinal products authorised through
national regulatory agencies. However, we should expect that national agencies also
use the guidelines approved and published by the European Medicines Agency and
European Commission.

133
Conclusions
The percentage of Summaries of Product Characteristics which include information
about the drug crossing (or not) the placental barrier (9.9%) or being excreted (or not)
into human milk (17.1%) can be considered low. From the SmPCs reporting excretion
of the drug into human milk, 88.6% did not provide information on the adverse
reactions in lactating neonates.
Although the analysed medicinal products were granted a marketing authorisation on
average 5.7 years ago, fewer than 17% SmPCs informed of the existence of clinical
experience in pregnant women. However, from the SmPCs that reported having carried
out clinical trials in pregnant women or mentioned data from post-marketing
surveillance, 85.8% provided a description of the adverse reactions obtained from
clinical trials or clinical experience.
Regarding fertility, 79% of SmPcs did not provide any information on the effects of the
medicinal product on human fertility and 17.6% stated that these effects were not
known. Information about the potential effects of the medicinal product in women of
child bearing potential was not provided in 70.6% SmPCs.
The information about management of exposure to the medicinal product in pregnant
women is scarce and 12.7% SmPCs mention this information.
A high percentage of SmPCs contain non-conclusive statements regarding the use of
the medicinal product during pregnancy (57%) and breastfeeding (16.5%). The use of
the medicinal product is restricted in 94.6% of SmPCs during pregnancy and 92.1%
during breastfeeding.

134
References
1. Schirm E, Meijer WM, Tobi H, de Jong-van den Berg LT. Drug use by pregnant women and comparable non-pregnant women in The Netherlands with reference to the Australian classification system. Eur J Obstet Gynecol Reprod Biol. 2004 Jun 15;114(2):182-8.
2. Lo WY, Friedman JM. Teratogenicity of recently introduced medications in human pregnancy. Obstet Gynecol. 2002 Sep;100(3):465-73.
3. European_Medicines_Agency. Guideline on the exposure to medicinal products during pregnancy: need for post-authorisation data2005.
4. Irl C, Kipferler P, Hasford J. Drug use assessment and risk evaluation in pregnancy--the PEGASUS-project. Pharmacoepidemiol Drug Saf. 1997 Oct;6 Suppl 3:S37-42.
5. Jimenez E, Bosch F, Lopez A, Costa J, Cos R, Banos JE. Patterns of regular drug use in Spanish childbearing women: changes elicited by pregnancy. Eur J Clin Pharmacol. 1998 Oct;54(8):645-51.
6. Olesen C, Sorensen HT, de Jong-van den Berg L, Olsen J, Steffensen FH. Prescribing during pregnancy and lactation with reference to the Swedish classification system. A population-based study among Danish women. The Euromap Group. Acta Obstet Gynecol Scand. 1999 Sep;78(8):686-92.
7. Webster WS, Freeman JA. Prescription drugs and pregnancy. Expert Opin Pharmacother. 2003 Jun;4(6):949-61.
8. Scialli AR, Buelke-Sam JL, Chambers CD, Friedman JM, Kimmel CA, Polifka JE, Tassinari MS. Communicating risks during pregnancy: a workshop on the use of data from animal developmental toxicity studies in pregnancy labels for drugs. Birth Defects Res A Clin Mol Teratol. 2004 Jan;70(1):7-12.
9. Baldon J, Correr C, Melchiors A, Rossignoli P, Fernandez-Llimos F, Pontarolo R. "[Attitudes and knowledge of community pharmacists on dispensing drugs to pregnant women]". Pharmacy Practice (Granada). 2006;4(1):38-43.
10. Shields KE, Wiholm BE, Hostelley LS, Striano LF, Arena SR, Sharrar RG. Monitoring outcomes of pregnancy following drug exposure: a company-based pregnancy registry program. Drug Saf. 2004;27(6):353-67.
11. Shahin I, Einarson A. Knowledge transfer and translation: examining how teratogen information is disseminated. Birth Defects Res A Clin Mol Teratol. 2011 Nov;91(11):956-61.
12. Addis A, Sharabi S, Bonati M. Risk classification systems for drug use during pregnancy: are they a reliable source of information? Drug Saf. 2000 Sep;23(3):245-53.
13. Merlob P, Stahl B. Classification of drugs for teratogenic risk: an anachronistic way of counseling. Teratology. 2002 Aug;66(2):61-2.
14. Doering PL, Boothby LA, Cheok M. Review of pregnancy labeling of prescription drugs: is the current system adequate to inform of risks? Am J Obstet Gynecol. 2002 Aug;187(2):333-9.
15. Food_and_Drug_Administration Dohahs. FDA pregnancy categories. Available from: http://depts.washington.edu/druginfo/Formulary/Pregnancy.pdf.
16. Australian_Government., Department-of_health_and_ageing., Therapeutic_Goods_Administration. Australian categorisation system for prescribing medicines in pregnancy. Available from: http://www.tga.gov.au/hp/medicines-pregnancy-categorisation.htm.
17. Food_and_Drug_Administration Dohahs. Content and Format of Labeling for Human Prescription Drug and Biological Products; Requirements for Pregnancy and Lactation Labeling. 2008.
18. European_Medicines_Agency. Guideline on risk assessment of medicinal products on human reproduction and lactation: from data to labelling2008.

135
19. European_Commission. Notice to applicants: a guideline on Summary of Product Characteristics. 2009.
20. European_Medicines_Agency. Clinical Safety Data Management:Periodic Safety Update Reports for Marketed Drugs. ICH Topic E 2 C (R1) [serial on the Internet]. 1997.
21. Savill N, Bushe CJ. A systematic review of the safety information contained within the Summaries of Product Characteristics of medications licensed in the United Kingdom for Attention Deficit Hyperactivity Disorder. how does the safety prescribing advice compare with national guidance? Child Adolesc Psychiatry Ment Health. 2012;6(1):2.
22. Sim J, Wright CC. The kappa statistic in reliability studies: use, interpretation, and sample size requirements. Phys Ther. 2005 Mar;85(3):257-68.
23. Landis JR, Koch GG. The measurement of observer agreement for categorical data. Biometrics. 1977 Mar;33(1):159-74.
24. European_Commission. Evaluation of the European Medicines Agency2010. 25. European_Commission. The Centralised Procedure. [January 2013]; Available
from: http://ec.europa.eu/health/authorisation-procedures-centralised_en.htm. 26. Macklin R. Enrolling pregnant women in biomedical research. Lancet. 2010 Feb
20;375(9715):632-3. 27. Andrade SE, Gurwitz JH, Davis RL, Chan KA, Finkelstein JA, Fortman K,
McPhillips H, Raebel MA, Roblin D, Smith DH, Yood MU, Morse AN, Platt R. Prescription drug use in pregnancy. Am J Obstet Gynecol. 2004 Aug;191(2):398-407.
28. Adam MP, Polifka JE, Friedman JM. Evolving knowledge of the teratogenicity of medications in human pregnancy. Am J Med Genet C Semin Med Genet. 2011 Aug 15;157(3):175-82.
29. Friedman JM, Little BB, Brent RL, Cordero JF, Hanson JW, Shepard TH. Potential human teratogenicity of frequently prescribed drugs. Obstet Gynecol. 1990 Apr;75(4):594-9.


Chapter 7
A universal tool to evaluate the content of drug
information sources for healthcare professionals

138
Background
Assuming that better evidence helps healthcare professionals to provide better care, a
critical analysis of information sources would help professionals to improve patients’
health outcomes.
As reviewed in the chapter one: Introduction (section ‘Characteristics of the information
and analysis of its quality’), different criteria have been used to define the quality of
health information. These different approaches aim to assess different characteristics
of medicines information. To assess the quality of the information some authors have
analysed the content itself, assessing completeness of information regarding different
topics. Molloy et al. considered that to ensure an appropriate, safe and effective
prescription, physicians should consistently receive critically appraised evidence-
based, comprehensive and up-to-date information.(1) Other authors, such as Berland
et al. approached this assessment by analysing not only the coverage of topics, but
also the accuracy of the information and absence of conflicting information.(2) In other
studies, priority was given to how the information was presented, introducing concepts
such as readability or comprehensibility.(3) Other authors, such as Shaughnessy et al.,
assessed health information sources according to their usefulness in the clinical
setting.(4), Curley, et al. described the best sources of information as those that
provide highly relevant and valid information, but do not require a lot of effort to use.(5)
Fernandez-Llimos used other four criteria: accessibility, reliability, completeness and
applicability.(6)
There have been other researchers aiming to analyse the quality of the information in
specific sources, and among them several approaches have been made to analyse the
quality of the information on the Internet. With the advent of new technologies, the
Internet has become an important communication medium, providing quick and cheap
access to health information. However, Internet can also be a risky channel that
escapes to any regulatory control (7), and even for healthcare professionals, it is not
always easy to assess whether the information on the Internet is credible.(8)
The Health on the Net (HON) Foundation established eight principles, known as the
HON Code, used as criteria to evaluate the quality of web sites containing health
information (please refer to chapter one, Introduction, ‘Characteristics of the
information and analysis of its quality’). These eight principles are: authority,
complementarity, confidentiality, attribution, justifiability, transparency, financial
disclosure, and advertising.(9)
139
Eysenbach et al. divided the criteria to evaluate health information on the Internet into
different categories: technical criteria, design, readability, accuracy, and
completeness.(10) Using these categories, Eysenbach et al. defined the main
characteristics to assess on a website using the mnemonic ‘CREDIBLE’: Current,
References cited, Explicit purpose of the site, Disclosure of developers and sponsors,
Interest disclosed, Balanced content, Labelled with metadata and Evidence level
indicated.(11)
The FDA raised several questions when evaluating health information on the Internet:
who runs the website, aim of the website, sources of information and evidence
provided, update and review of the content, how visitors use the information on the
webpage, and accuracy of e-mails sent out to subscribers.(12)
The European Federation of Pharmaceutical Industries and Associations (EFPIA)
defined the principles to evaluate company-sponsored websites containing drug
information. These principles are described in the introduction (section ‘quality of the
information’) and aim to assess whether companies provide balanced and accurate
information consistent with the official information present in the SmPCs.(13)
Nähri et al. developed the DARTS tool, aiming to help identify reliable and quality
information on the Internet by assessing date, authors, references and purpose of the
site.(14) Silberg et al. established four basic criteria to define the quality of the
information on the Internet: authorship, attribution, disclosure and currency.(15)
Other systems to assess the quality of specific drug information sources have been
developed, and clinical guidelines have also been a focus of interest. In 2003, the
AGREE rating scale was created by an international group of guideline experts
(Appraisal Guideline Research and Evaluation Europe, AGREE Collaboration). This
instrument provides an appraisal of the predicted validity of a guideline, which is the
likelihood that it will achieve its intended outcome. Not only does it evaluate the quality
of the information, but also the process of practice guideline development. The AGREE
instrument was refined in 2009 (AGREE II) and it currently includes 23 items divided
into six categories.(16) (For a detailed description please refer to chapter one,
Introduction, ‘Characteristics of the information and analysis of its quality’)
Apart from all the mentioned approaches, some other studies have aimed at assessing
specific aspects of drug information. These studies assessed information on specific
topics such as: adverse drug reactions (17), drug interactions (18), overdose
management (19, 20), and dose adjustment in renal impairment.(21) Others, selected a

140
group of topics like indications, side effects and precautions, and compared them
among different printed materials.(22) Furthermore, other studies focused on a specific
drug class, or groups of drugs with common characteristics, such as antihypertensive
(23) or hepatotoxic drugs.(24, 25) There were also studies analysing the information
contained in a specific source, such as electronic databases, by comparing their
content.(26)
Not only has drug information been analysed from different perspectives, but also the
methodology used in these different approaches should also be considered. The most
commonly used method to analyse the quality of drug information is based on the
comparison of the information provided in different sources. Other methods, such as
assessing the answers that healthcare professionals provide to specific questions
using the analysed sources, have also been used.(26) Berland et al. assessed the
quality of the information by analysing the coverage of topics (all the clinical elements
describing a topic), the accuracy of the information, and the absence of conflicting
information (existence of contradictions in the text or misleading information).(2)
However, this is a very specific approach in which clinical topics were assessed by
specialists in the area, and it is difficult to extrapolate to a general analysis of quality of
information.
Some authors created a scale, a checklist or a score chart for the evaluation. This
method allows a deeper analysis of the information, as well as reproducibility with other
sources, other countries and different environments and settings. This reproducibility
also allows the comparison of studies from different authors.(27) Clauson et al.
designed a checklist to evaluate the scope and completeness of fifteen categories of
drug information in databases.(28) Spyker et al. created a checklist to specifically
assess clinical pharmacology information in drug labelling.(27) Iijima et al. evaluated
drug information in generic medicines according to nine categories of information.(29)
Fernandez-Llimos et al. analysed drug information in product monographs provided by
manufacturers.(30) Strang et al. created a checklist and developed a Delphi study to
determine the information that physicians needed from pharmaceutical representatives
to prescribe a drug appropriately.(31)
When analysing completeness through a checklist, most authors scored the items
using an a priori defined list of elements.(10) These checklists, created by the authors
of the articles, are mainly based on published literature, queries addressed to drug
information centres (28), authors’ criteria (32), FDA requirements for information (18,
25), drug package inserts, and interview forms (29) or clinical guidelines.(10) These

141
checklists seem to be specifically designed for the purpose of each study, and were
frequently created disregarding an international scope. Thus, they should not be
considered universal assessment tools, applicable to different sources of information
and targeting the needs of healthcare professionals in their daily practice.
142
Objective
The aim of this study was to design a general tool to evaluate the content of drug
information sources for healthcare professionals, and to analyse their completeness.

143
Methods
Creating the initial pool of information items
An initial pool with the different drug information topics or items that may describe a
drug and may be included in any drug information source was created by the research
team. To gather these items, a comprehensive literature review in Pubmed
(www.pubmed.com), and an in-depth analysis of all aspects of information concerning
drugs, was carried out. Scientific literature and common sources of information for
healthcare professionals such as drug reference books, official information sources
(SmPCs) and their regulations (which provide a detailed description of all aspects of
the information that should be included), product monographs and web pages with
information for healthcare professionals (official and non-official) were reviewed. In
addition, any other item concerning drug information was included in the initial pool.
The appraisal of the retrieved literature provided a comprehensive pool of medicines
information topics evaluated in previous studies and/or presented in different medicines
information sources. A clear definition for each information item in the pool was created
or retrieved from the reviewed literature and then discussed by the research team to
produce a glossary with all the items in the initial pool (please refer to Appendix 07-01).
A first checklist with the pool of information items was designed. This checklist was
structured and divided into sections according to different information categories. The
information categories comprising the items were the following:
Characteristics of the medicinal product (24 items)
Use of the medicinal product (31 items)
Contraindications (6 items)
Adverse reactions (23 items)
Interactions (10 items)
Overdose (3 items)
Pharmacodynamic properties (13 items)
Pharmacokinetic properties (41 items)
Safety data (5 items)
Evidence (2 items)
Prescription data (4 items)
In order to design an assessment tool to evaluate the content of drug information
sources, an evaluation and refinement of this pool of items was performed using a

144
Delphi technique in three rounds. The Delphi technique is a consensus method based
on the agreement of experts about a given issue. The essence of this method is to
obtain quantitative estimates through the qualitative assessment of evidence.(33)
During the rounds, the experts evaluated all items on the checklist, and every item was
scored twice according to two questions:
1. ‘Do you consider the item to be a minimal set of information?’
This was a ‘yes/no’ question. A minimal set of information was defined as ‘the essential
information needed for clinical practice. Items selected as a minimal set of information
should be included in any information source, regardless of its size, i.e. abridged or
unabridged’.
The aim of this first question was to create a list containing all the information
considered minimal by the panel members. This list defined the minimum and essential
elements that any drug information source should include.
2. ‘How would you score the importance of that item?’
Participants should score every item from 0 (no importance at all) to 10 (essential,
greatest importance).
The aim of this second question was to evaluate the relevance of the information items
on the checklist for healthcare professionals, in order to define a tool to assess the
completeness of drug information sources. This tool was created only with the items
reaching consensus and using the consensus scores that participants attributed to
them. The tool generated allows us to measure, with a continuous variable, the
percentage of completeness of a drug information source. It also allows us to compare
information about completely different drugs.
An equation to calculate completeness is presented below. In this equation the points
obtained by the source of information in the analysis are divided by the maximum
possible points for that source. The maximum possible points differ among drugs
analysed, as not every item in the list is applicable to every drug (e.g. items defining
pharmacokinetics in topical treatments or eye drops).
Completeness (%) = Points obtained by the analysed source of information x 100
Total possible points

145
Not answering an item was also an option for the panel members. In rounds 1 and 2,
participants were allowed to add new items which they considered to be missing in the
checklist, and to make any comment to improve the already existing items and their
definitions. The new items and the comments suggested by the panel members were
included in subsequent rounds, always maintaining the anonymity of the participants
who suggested them.
The initial checklist was reviewed by an independent researcher who estimated the
response time of the questionnaire (30-45 minutes).
The questionnaire in the first round comprised 162 items (Table 07-01):
Table 07-01. Initial questionnaire
SECTION 1: CHARACTERISTICS OF THE MEDICINAL PRODUCT Items
101. Name of the holder of the marketing authorization 102. Address of the holder of the marketing authorization 103. Telephone number of the holder of the marketing authorization 104. Contact to the medical department of the holder of the marketing authorization 105. Identification of the active substance 106. Quantitative composition: the quantity of the active substance, expressed per dosage unit. 107. Excipients (qualitative description) 108. Excipients (quantitative description) 109. Residues that may be present from the manufacturing process (expressed qualitatively) 110. Residues that may be present from the manufacturing process (expressed quantitatively) 111. Pharmaceutical form 112. Visual description of the product 113. Colour pictures for product identification 114. Expiry date 115. Special precautions for storage 116. Hygroscopicity of the active substance 117. Shelf-life after dilution or reconstitution according to instructions given 118. Shelf-life after first opening the container 119. Dissolution test of the product 120. Manufacturing process of the product 121. Pharmacotherapeutic group (ATC code) 122. Type of marketing authorization 123. Marketing authorization numbers 1 24. Date of first authorization/renewal of the authorization

146
Table 07-01. Initial questionnaire
SECTION 2: USE OF THE MEDICINAL PRODUCTItems 201. Therapeutic indications 202. Treatment algorithm 203. Target population 204. Instructions for correct administration/use 205. Posology/Dosing 206. Statement of the therapeutic window 207. Maximum recommended single dose 208. Maximum recommended daily dose 209. Maximum recommended total dose 210. The need for dose titration or not 211. Need for tapering off 212. Dosage individualization based on disease/severity being treated 213. Dosage adjustment in renal impairment 214. Categories of renal impairment related to the dose or interval adjustment 215. Dosage adjustment in liver disease 216. Dosage adjustment in other concomitant diseases 217. Dosage adjustment related to interactions 218. Normal duration of treatment 219. Restrictions on duration 220. What to do if a dose is missing 221. Implications of non-compliance, intermittent dosing 222. Influence of food with the intake of the product 223. Use in the paediatric population 224. Use in the elderly 225. Use during pregnancy 226. Recommendations on the use of the product at different times during pregnancy in respect to gestation 227. Use during lactation 228. Influence on fertility 229. Influence on the ability to drive and use machines 230. Comparison of risks and benefits with drugs in the same class 231. Comparison of risks and benefits with other drugs for the same condition
SECTION 3: CONTRAINDICATIONSItems 301. Contraindications (disease) 302. Contraindications (interactions) 303. Contraindications (hypersensitivity reactions) 304. Contraindications (Patient populations not studied in the clinical trials) 305. Contraindications (Patient populations likely to experience product or class related adverse reactions occurring under normal conditions of use) 306. Steps to take if the contraindicated drug is administered

147
Table 07-01. Initial questionnaire
SECTION 4. ADVERSE REACTIONSItems 401. Description of ALL adverse reactions attributed to the medicinal product 402. Description of only the MOST FREQUENT adverse reactions 403. Serious adverse reactions to which the healthcare professional should be alert 404. Mechanism of action of adverse reactions 405. Circumstances under which patients are at risk of experiencing specified adverse reactions 406. Relationship between dose and adverse reactions 407. The action to take in case those serious adverse reactions related to the treatment appear 408. Warning about the adverse reactions related to the excipients (even traces) 409. Statement of the need to monitor for specific asymptomatic drug reactions (lab tests) 410. Instructions on how frequently asymptomatic reactions should be monitored (lab tests) 411. Instructions on how to respond to monitoring values of asymptomatic drug reactions (lab tests) 412. Assessment of causality of adverse reactions 413. Assessment of severity of adverse reactions 414. Assessment of frequency of adverse reactions 415. Inclusion of a table of adverse reactions according to a standard system organ class 416. Information on frequencies of adverse reactions related to the clinical trials from which they stem 417. Time of onset of adverse reactions 418. Particular risks on initiating the treatment, such as first dose effects 419. Particular risks associated with stopping the treatment 420. Measures to be taken to avoid specific adverse reactions 421. The action to take in case those serious adverse reactions related to the treatment appear 422. Reversibility of adverse reactions 423. Preclinical safety data
SECTION 5: INTERACTIONSItems 501. Clinically relevant interactions suffered by the described medicine 502. Clinically relevant drug interactions produced by the described medicine 503. Interacting medicinal products are listed by drug class 504. Interacting medicinal products are listed as specific compounds 505. Description of the severity of the drug interaction 506. Description of the effect of the drug interaction 507. Food interactions 508. Interactions with alcohol 509. Clinical manifestations and effects on laboratory tests 510. Effects on the results of lab tests not associated to physiological alterations (potential false positives)
SECTION 6: OVERDOSEItems 601. Description of symptoms and signs of overdose of the medicinal product 602. Management of overdose 603. Potential sequelae of overdose
SECTION 7: PHARMACODYNAMIC PROPERTIESItems 701. Description of the mechanism of action of the medicinal product 702. Identification of the principal physiological effects 703. Efficacy data 704. Pharmacodynamic effects 705. Time to onset of effect (with minimal and maximal time) 706. Time to peak effect (with minimal and maximal time) 707. Duration of action/effect with minimal and maximal time 708. Graphical display visualising the mechanism of action 709. Evidence for tachyphylaxis/tolerance and maximum dose 710. Pro-drug: information about whether the medicinal product is a pro-drug or not 711. Chirality 712. Relationship between dose and effect 713. Pharmacogenomic alterations on pharmacodynamics
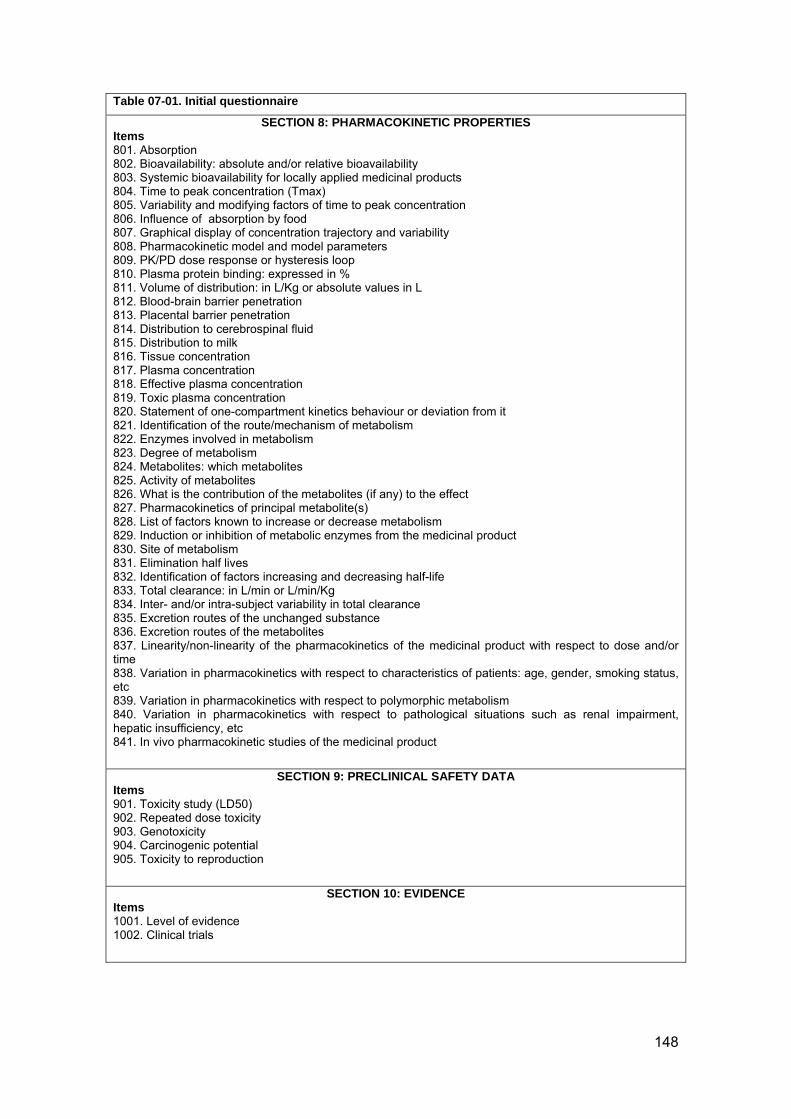
148
Table 07-01. Initial questionnaire
SECTION 8: PHARMACOKINETIC PROPERTIESItems 801. Absorption 802. Bioavailability: absolute and/or relative bioavailability 803. Systemic bioavailability for locally applied medicinal products 804. Time to peak concentration (Tmax) 805. Variability and modifying factors of time to peak concentration 806. Influence of absorption by food 807. Graphical display of concentration trajectory and variability 808. Pharmacokinetic model and model parameters 809. PK/PD dose response or hysteresis loop 810. Plasma protein binding: expressed in % 811. Volume of distribution: in L/Kg or absolute values in L 812. Blood-brain barrier penetration 813. Placental barrier penetration 814. Distribution to cerebrospinal fluid 815. Distribution to milk 816. Tissue concentration 817. Plasma concentration 818. Effective plasma concentration 819. Toxic plasma concentration 820. Statement of one-compartment kinetics behaviour or deviation from it 821. Identification of the route/mechanism of metabolism 822. Enzymes involved in metabolism 823. Degree of metabolism 824. Metabolites: which metabolites 825. Activity of metabolites 826. What is the contribution of the metabolites (if any) to the effect 827. Pharmacokinetics of principal metabolite(s) 828. List of factors known to increase or decrease metabolism 829. Induction or inhibition of metabolic enzymes from the medicinal product 830. Site of metabolism 831. Elimination half lives 832. Identification of factors increasing and decreasing half-life 833. Total clearance: in L/min or L/min/Kg 834. Inter- and/or intra-subject variability in total clearance 835. Excretion routes of the unchanged substance 836. Excretion routes of the metabolites 837. Linearity/non-linearity of the pharmacokinetics of the medicinal product with respect to dose and/or time 838. Variation in pharmacokinetics with respect to characteristics of patients: age, gender, smoking status, etc 839. Variation in pharmacokinetics with respect to polymorphic metabolism 840. Variation in pharmacokinetics with respect to pathological situations such as renal impairment, hepatic insufficiency, etc 841. In vivo pharmacokinetic studies of the medicinal product
SECTION 9: PRECLINICAL SAFETY DATAItems 901. Toxicity study (LD50) 902. Repeated dose toxicity 903. Genotoxicity 904. Carcinogenic potential 905. Toxicity to reproduction
SECTION 10: EVIDENCEItems 1001. Level of evidence 1002. Clinical trials
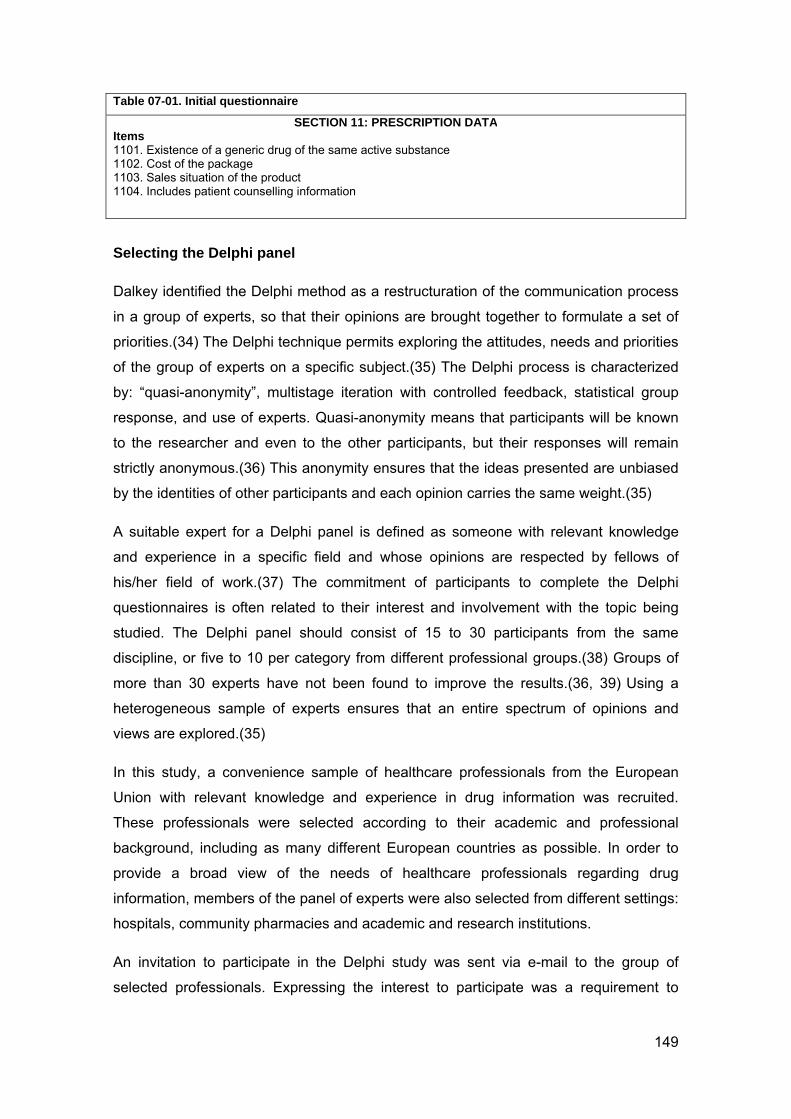
149
Table 07-01. Initial questionnaire
SECTION 11: PRESCRIPTION DATAItems 1101. Existence of a generic drug of the same active substance 1102. Cost of the package 1103. Sales situation of the product 1104. Includes patient counselling information
Selecting the Delphi panel
Dalkey identified the Delphi method as a restructuration of the communication process
in a group of experts, so that their opinions are brought together to formulate a set of
priorities.(34) The Delphi technique permits exploring the attitudes, needs and priorities
of the group of experts on a specific subject.(35) The Delphi process is characterized
by: “quasi-anonymity”, multistage iteration with controlled feedback, statistical group
response, and use of experts. Quasi-anonymity means that participants will be known
to the researcher and even to the other participants, but their responses will remain
strictly anonymous.(36) This anonymity ensures that the ideas presented are unbiased
by the identities of other participants and each opinion carries the same weight.(35)
A suitable expert for a Delphi panel is defined as someone with relevant knowledge
and experience in a specific field and whose opinions are respected by fellows of
his/her field of work.(37) The commitment of participants to complete the Delphi
questionnaires is often related to their interest and involvement with the topic being
studied. The Delphi panel should consist of 15 to 30 participants from the same
discipline, or five to 10 per category from different professional groups.(38) Groups of
more than 30 experts have not been found to improve the results.(36, 39) Using a
heterogeneous sample of experts ensures that an entire spectrum of opinions and
views are explored.(35)
In this study, a convenience sample of healthcare professionals from the European
Union with relevant knowledge and experience in drug information was recruited.
These professionals were selected according to their academic and professional
background, including as many different European countries as possible. In order to
provide a broad view of the needs of healthcare professionals regarding drug
information, members of the panel of experts were also selected from different settings:
hospitals, community pharmacies and academic and research institutions.
An invitation to participate in the Delphi study was sent via e-mail to the group of
selected professionals. Expressing the interest to participate was a requirement to

150
receive the questionnaire in Microsoft Word® format. Participants involved in the panel
of experts were kept anonymous during the whole Delphi process.
Establishing consensus requirements
When using a Delphi technique, establishing the consensus criteria may be
controversial and subject to interpretation. A universally agreed definition of consensus
in the Delphi technique does not exist, as different specialists have established
different consensus criteria.(36) Usually, consensus on a topic can be decided “if a
certain percentage of the votes falls within a prescribed range”.(40) Jones and Hunter
defined the rules to assess the agreement of participants in other consensus methods,
such as nominal groups. However, for Delphi studies the authors suggested that
researchers are responsible for defining their own consensus criteria.(41) McKenna
suggested that consensus should be equated with 51% agreement amongst
respondents.(42) Villiers et al. defined consensus as 70% of respondents agreeing with
a statement.(39) Ulschak recommended accepting as consensus when 80% of panel
members’ votes fall within two adjoining categories on a seven-point scale.(43) Other
authors suggested using measures of the stability of subjects’ responses throughout
the rounds, rather than percentages.(40)
In the present study, consensus criteria were established by the research team based
on a progressive filtering process, using higher consensus requirements in the first
round, and then reducing these requirements in subsequent rounds. In the first round,
consensus criteria were established as ≥90% agreement for the categorical question
‘Do you consider the item a minimal set of information’ For the discrete-scoring
question ‘How would you score the importance of the item?’, consensus was defined
as 80% of the respondents falling within one point on either side of the modal
response. Those responses falling at the extremes of the ten-point scale (zero or ten)
required only 70% of responses to indicate consensus.
In the following rounds, the items for which consensus had been achieved were
retained and not scored again. For non-consensual items, participants received
information about the percentage of affirmative responses to the categorical question,
and about the median, mode, and percentage of answers scoring the mode for the
discrete-scoring question. Additionally, each participant received information about
his/her previous answers for each item. Modifications in the list of items taking into
account comments and new items added by participants were made in subsequent
rounds.

151
In the second round, consensus criteria were established as ≥80% agreement for the
categorical question, whereas in the discrete scoring question, consensus was defined
as 70% of the respondents falling within one point on either side of the modal
response. Responses falling at the extremes of the ten-point scale required 60% of
responses to indicate consensus.
In the third round, consensus criteria were established as ≥75% agreement for the
categorical question, whilst in the discrete scoring question, consensus was defined as
70% of the respondents falling within one point on either side of the modal response.
Responses falling at the limits of the ten-point scale required 60% of responses to
indicate consensus. For the discrete scoring question consensus was kept the same in
the second and third rounds.
After receiving all responses, participation rates (globally and per country) were
analysed. Consensus was analysed separately for the categorical and discrete scoring
questions.
Statistical analysis
Descriptive statistics were performed using the SPSS v.16 software.
In order to assess how the number of items achieving consensus changed by selecting
different consensus criteria, a sensitivity analysis at a 5% interval was performed, both
for the categorical and the discrete-scoring questions.

152
Results
Selection of Delphi panel members
Fifty-eight professionals with relevant knowledge and experience in drug information
were selected and invited to integrate the Delphi panel of experts. These professionals
were affiliated to hospitals, community pharmacies and academic and research
institutions from the following 23 European countries: Austria, Belgium, Croatia, Czech
Republic, Denmark, Finland, France, Germany, Greece, Hungary, Ireland, Italy,
Lithuania, Malta, Netherlands, Poland, Portugal, Serbia, Slovenia, Spain, Sweden,
Switzerland, and United Kingdom (UK). The invitation to participate in the Delphi study
was sent via e-mail in October-November 2009. (Figure 07-01)
Fig.07-01: Map of Invited countries
From the 58 invitations, 43 professionals accepted to participate, 11 did not reply, three
e-mail addresses were incorrect, and one professional declined the invitation. Thus, the
Delphi panel consisted of 43 participants from the following countries: Austria, Belgium,
Croatia, Denmark, Finland, France, Germany, Greece, Hungary, Ireland, Italy,
Lithuania, Malta, Netherlands, Portugal, Serbia, Slovenia, Spain, Sweden, Switzerland
and UK (Figure 07-02).

153
Fig.07-02 Map of countries accepting the invitation to participate in the Delphi study
Delphi first round
Following acceptance to participate in the study, the questionnaire for the first round
was sent by e-mail in October-November 2009 including a link to a webpage containing
the definitions of the items. Participants were initially given seven days to complete the
questionnaire, and then sent a reminder giving some extra days to respond to it.
Reception of questionnaires finished on 30th November, 2009.
Two members decided to leave the panel in the first round. 32 members completed the
questionnaire and nine did not respond at all. These 32 participants were from the
following 18 countries: Austria, Belgium, Croatia, Denmark, Finland, France, Germany,
Ireland, Lithuania, Malta, Netherlands, Portugal, Serbia, Slovenia, Spain, Sweden,
Switzerland and the UK (Figure 07-03).
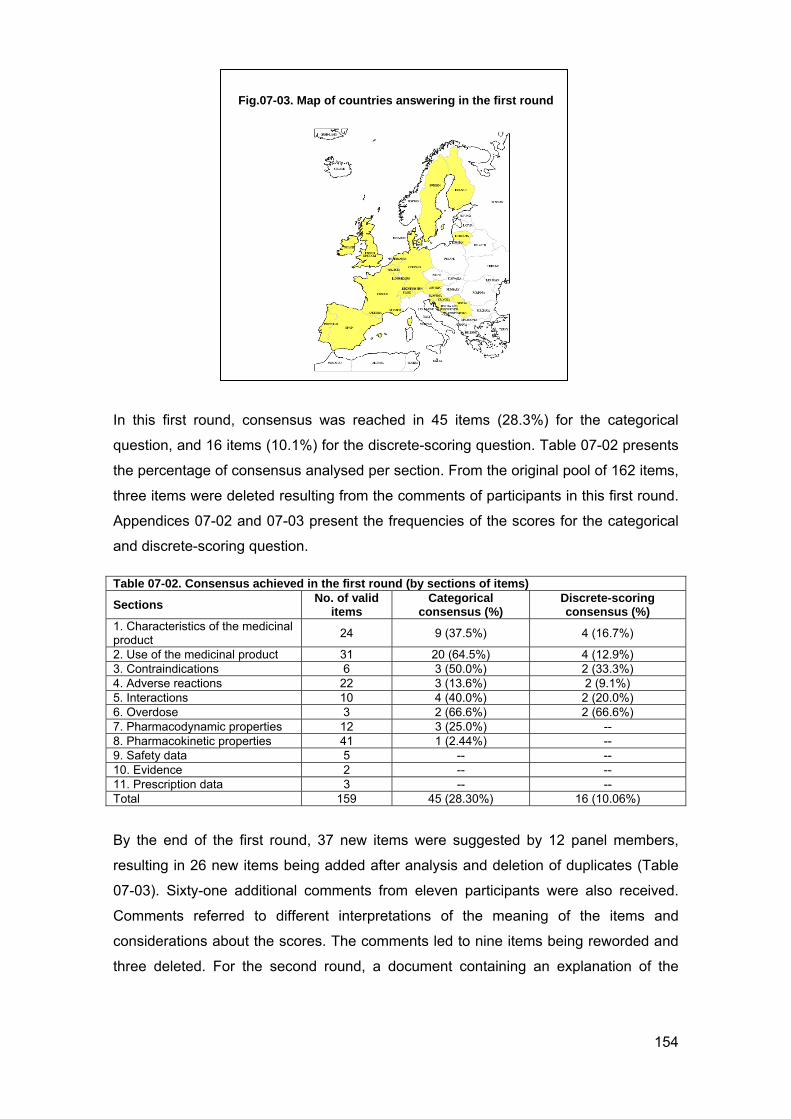
154
Fig.07-03. Map of countries answering in the first round
In this first round, consensus was reached in 45 items (28.3%) for the categorical
question, and 16 items (10.1%) for the discrete-scoring question. Table 07-02 presents
the percentage of consensus analysed per section. From the original pool of 162 items,
three items were deleted resulting from the comments of participants in this first round.
Appendices 07-02 and 07-03 present the frequencies of the scores for the categorical
and discrete-scoring question.
Table 07-02. Consensus achieved in the first round (by sections of items)
Sections No. of valid
items Categorical
consensus (%) Discrete-scoring consensus (%)
1. Characteristics of the medicinal product
24 9 (37.5%) 4 (16.7%)
2. Use of the medicinal product 31 20 (64.5%) 4 (12.9%) 3. Contraindications 6 3 (50.0%) 2 (33.3%) 4. Adverse reactions 22 3 (13.6%) 2 (9.1%) 5. Interactions 10 4 (40.0%) 2 (20.0%) 6. Overdose 3 2 (66.6%) 2 (66.6%) 7. Pharmacodynamic properties 12 3 (25.0%) -- 8. Pharmacokinetic properties 41 1 (2.44%) -- 9. Safety data 5 -- -- 10. Evidence 2 -- -- 11. Prescription data 3 -- -- Total 159 45 (28.30%) 16 (10.06%)
By the end of the first round, 37 new items were suggested by 12 panel members,
resulting in 26 new items being added after analysis and deletion of duplicates (Table
07-03). Sixty-one additional comments from eleven participants were also received.
Comments referred to different interpretations of the meaning of the items and
considerations about the scores. The comments led to nine items being reworded and
three deleted. For the second round, a document containing an explanation of the

155
items which originated more discussion and confusion was created. In conclusion, the
pool of items for the second round consisted of 185 items.
Table 07-03. New items added by members of the Delphi panel after the first round
Section New item Description of the item (if given) 1 Grindable tablet Capability of being grinded for administration 1 Divisibility of oral dosage form If tablet can be divided and if the scoring line
enables production of equal doses after splitting
1 Coating of oral dosage forms Information on eventual coating of oral dosage forms, (e.g. acid resistant)
1 Brand name Commercial name of the medicinal product (if branded)
1 Identification elements Number or letters appearing on the pharmaceutical form (pills or capsules)
2 Instructions on how to prepare the medicinal product before administration
(e.g. oral solutions for reconstitution, injectable forms)
2 Use of the medicinal product among immunocompromised patients
2 Information on duration of brewing (herbal medicines)
If herbal medicinal products are used as a herbal drug (in the form of tea, filter-tea bags), the recommendation for duration of brewing
2 Use during pre-pregnancy period Special precautions needed for the pre-pregnancy period
4 Separate description of Adverse Events from Adverse Reactions
4 Referral to an open access ADR database (official such as FDA, EMEA, local authorities) including the latest information
4 Inclusion of telephone numbers of pharmacovigilance agency
4 Reminder to communicate ADRs to pharmacovigilance services
4 How to communicate ADRs to pharmacovigilance services
5 Interaction mechanism or link to section 'pharmacokinetic properties'
6 Link to literature/reference to published case reports of overdosing (accidentally or suicidal)
6 Measured blood-/plasma-/serum- or urine concentration(s) in monitored cases of overdose
6 Antidote: for drugs with a narrow therapeutic window, specific antidote (if it exists).
7 Relationship between concentration (i.e., blood) and effect
10 EMA/FDA risk management plan Description of the special conditions for using the medicinal product when a risk management plan exists
10 Level of relevance/evidence related to comparators, if any
10 Cost-effectiveness studies: description of these kind of studies
11 Existence of another drug with the same active substance, even if it is not a generic drug
11 Reimbursement data 11 Existence of biosimilars 11 Prescription conditions Specific conditions applicable to prescribers
(OTC product, hospital use…)

156
Delphi second round
The questionnaire for the second round (185 items) was sent in late December 2009 to
41 members of the panel, 32 of which had participated in the first round, and nine
others who accepted to participate but did not answer the questionnaire. Participants
were sent an e-mail two weeks after sending the questionnaire reminding them to
complete the questionnaire. Reception of answers closed on 31st January 2010.
Twenty-seven participants completed the questionnaire and one member left the panel
in the second round. Eight out of nine participants, who did not answer the first round,
did not answer the second round either, and five participants who responded to the first
round, did not complete the second. Members participating in the second round
represented 18 countries: Austria, Belgium, Croatia, Denmark, Finland, France,
Germany, Hungary, Lithuania, Malta, Netherlands, Portugal, Serbia, Slovenia, Spain,
Sweden, Switzerland and UK (Figure 07-04).
Fig 07-04. Map of countries answering in the second round
Eighteen comments and two suggestions for new items from eight participants were
received in the second round. After analysing the suggestions, one new item was
added to the questionnaire (section 2):
- Administration of parenteral drugs: clear instruction for administration (such as type of
administration, duration of perfusion and frequency, incompatibilities)
In the second round, consensus was reached in 69 items (48.94%) for the categorical
question and in 31 items for the discrete-scoring question (18.34%). Data of
accumulated consensus after the second round are displayed in Table 07-04.
Appendices 07-04 and 07-05 present the frequencies of the scores for the categorical
and discrete-scoring question.

157
Table 07-04. Accumulated consensus achieved after the second round (by groups of items)
Sections No. of valid
items Categorical
consensus (%) Discrete-scoring Consensus (%)
1. Characteristics of the medicinal product
29 17 (58.6%) 7 (24.1%)
2. Use of the medicinal product 35 30 (85.7%) 17 (48.6%) 3. Contraindications 6 6 (100%) 3 (50.0%) 4. Adverse reactions 27 15 (55.6%) 4 (14.8%) 5. Interactions 11 8 (72.7%) 5 (45.5%) 6. Overdose 6 4 (66.6%) 2 (33.3%) 7. Pharmacodynamic properties 13 8 (61.5%) 4 (30.8%) 8. Pharmacokinetic properties 41 21 (51.2%) 3 (7.3%) 9. Safety data 5 2 (40.0%) ---- 10. Evidence 5 1 (20.0%) 1 (20.0%) 11. Prescription data 7 2 (28.6%) 1 (14.3%) Total 185 114 (61.62%) 47 (25.41%)
Delphi third round and resulting instruments
The third and final round was sent to participants between late March and April 2010.
Participants were sent a reminder e-mail two weeks after sending the questionnaire.
This questionnaire consisted of 186 items and was sent to 32 participants. Eight
members were excluded from the panel since they did not participate either in the first
round or in the second. Reception of answers closed on 20th May 2010.
One member of the panel had changed the e-mail address, leading to a loss of contact.
Twenty-nine participants from 18 countries completed the questionnaire in this third
round: Austria, Belgium, Croatia, Denmark, Finland, France, Germany, Hungary,
Lithuania, Malta, Netherlands, Portugal, Serbia, Slovenia, Spain, Sweden, Switzerland
and UK (Figure 07-05).

158
Fig 07-05. Map of countries answering in the third round
In the third round, consensus was reached in 42 items (57.53%) for the categorical
question, and 98 items for the non-categorical question (70.50%) (Please refer to Table
07-05 for accumulated consensus data after the third round). Appendices 07-06 and
07-07 present the frequencies of the scores for the categorical and discrete-scoring
question.
Table 07-05. Accumulated consensus achieved after the third round (by groups of items)
Sections No. of valid
items Categorical
consensus (%) Discrete-scoringconsensus (%)
1. Characteristics of the medicinal product
29 22 (75.86%) 19 (65.52%)
2. Use of the medicinal product 36 34 (94.44%) 31 (86.11%) 3. Contraindications 6 6 (100%) 6 (100%) 4. Adverse reactions 27 20 (74.07%) 19 (70.37%) 5. Interactions 11 10 (90.91%) 10 (90.91%) 6. Overdose 6 6 (100%) 5 (83.33%) 7. Pharmacodynamic properties 13 11 (84.62%) 11 (84.62%) 8. Pharmacokinetic properties 41 37 (90.24%) 23 (56.10%) 9. Safety data 5 3 (60.00%) 2 (40.00%) 10. Evidence 5 2 (40.00%) 2 (40.00%) 11. Prescription data 7 5 (71.43%) 2 (28.57%) Total 186 156 (83.87%) 130 (69.89%)
After addition and deletion of items as suggested by panel members, the number of
items in the questionnaire in each round changed as shown in Table 07-06.

159
Table 07-06. Evolution of number of items in each section during the rounds
Section Round 1No. of items
Round 2No. of items
Round 3 No. of items
1. Characteristics of the medicinal product 24 29 29 2. Use of the medicinal product 31 35 36 3. Contraindications 6 6 6 4. Adverse reactions 22 27 27 5. Interactions 10 11 11 6. Overdose 3 6 6 7. Pharmacodynamic properties 12 13 13 8. Pharmacokinetic properties 41 41 41 9. Safety data 5 5 5 10. Evidence 2 5 5 11. Prescription data 3 7 7 Total 159 185 186
The members of the panel reached consensus in defining 126 items (67.74%) as
essential items (minimal set of information) (Table 07-07).
Table 07-07. Consensus list of essential items
Section 1. Characteristics of the medicinal product
101. Name of the holder of the marketing authorization 105. Identification of the active substance 106. Quantitative composition: the quantity of the active substance, expressed per dosage unit. 107. Excipients (qualitative description) 111. Pharmaceutical form 112. Visual description of the product 114. Expiry period 115. Special precautions for storage 117. Shelf-life after dilution or reconstitution according to instructions given 118. Shelf-life after first opening the container 121. Pharmacotherapeutic group (ATC code) 125. Grindable tablet 126. Divisibility of oral dosage form 127. Coating of oral dosage forms 128. Brand name 129. Identification elements
Section 2. Use of the medicinal product
201. Therapeutic indications 202. Treatment algorithm 203. Target population 204. Instructions for correct administration/use 205. Posology/Dosing 206. Statement of the therapeutic window 207. Maximum recommended single dose 208. Maximum recommended daily dose 209. Maximum recommended total dose 210. The need for dose titration or not 211. Need for tapering off 212. Dosage individualization based on disease/severity being treated 213. Dosage adjustment in renal impairment 214. Categories of renal impairment related to the dose or interval adjustment 215. Dosage adjustment in liver disease 216. Dosage adjustment in other concomitant diseases 217. Dosage adjustment related to interactions 218. Normal duration of treatment 219. Restrictions on duration 220. What to do if a dose is missed

160
Table 07-07. Consensus list of essential items
221. Implications of non-compliance, intermittent dosing 222. Influence of food with the intake of the product 223. Use in the paediatric population 224. Use in the elderly 225. Use during pregnancy 226. Recommendations on the use of the product at different times during pregnancy in respect to gestation 227. Use during lactation 228. Influence on fertility 229. Influence on the ability to drive and use machines 232. Instructions on how to prepare the medicinal product before administration (e.g. oral solutions for reconstitution, injectable forms) 233. Use of the medicinal product among immunocompromised patients 234. Information of duration of brewing (herbal medicines) 235. Use during the pre-pregnancy period 236. Administration of parenteral drugs: clear instruction for administration (type of administration, duration of perfusion and frequency, incompatibilities)
Section 3. Contraindications
301. Contraindications (disease) 302. Contraindications (concomitant drug use) 303. Contraindications (hypersensitivity reactions) 304. Contraindications (Patient populations not studied in the clinical trials) 305. Contraindications (Patient populations likely to experience product or class related adverse reactions occurring under normal conditions of use) 306. Steps to take if the contraindicated drug is administered
Section 4. Adverse reactions
402. Description of only the MOST FREQUENT adverse reactions 403. Serious adverse reactions to which the healthcare professional should be alert 405. Circumstances under which patients are at risk of experiencing specified adverse reactions 406. Relationship between dose and adverse reactions 407. The action to take in case those serious adverse reactions related to the treatment appear 408. Warning about adverse reactions related to the excipients (even traces) 409. Statement of the need to monitor for specific asymptomatic drug reactions (lab tests) 410. Instructions on how frequently asymptomatic reactions should be monitored (lab tests) 413. Assessment of severity of adverse reactions 414. Assessment of frequency of adverse reactions 415. Inclusion of a table of adverse reactions according to a standard system organ class 417. Time of onset of adverse reactions 418. Particular risks on initiating the treatment, such as first dose effects 419. Particular risks associated with stopping the treatment 420. Measures to be taken to avoid specific adverse reactions 422. Reversibility of adverse reactions
Section 5. Interactions
501. Clinically relevant drug interactions that affect the effects of the described medicine in the organism 502. Clinically relevant drug interactions produced by the described medicine and affecting the other medicinal products 503. Interacting medicinal products are listed by drug class 504. Interacting medicinal products are listed as specific compounds 505. Description of the severity of the drug interaction 506. Description of the effect of the drug interaction 507. Food interactions 508. Interactions with alcohol 509. Clinical manifestations and effects on laboratory tests 510. Effects on the results of lab tests not associated to physiological alterations (potential false positives)
Section 6. Overdose
601. Description of symptoms and signs of overdose of the medicinal product 602. Management of overdose 603. Potential sequelae of overdose 606. Antidote: for drugs with a narrow therapeutic window, specific antidote (if exists)
Section 7. Pharmacodynamic properties
701. Description of the mechanism of action of the medicinal product 702. Identification of main effects on the organism 703. Efficacy data

161
Table 07-07. Consensus list of essential items
705. Time to onset of effect (with minimal and maximal time) 706. Time to peak effect (with minimal and maximal time) 707. Duration of action/effect with minimal and maximal time 712. Relationship between dose and effect 713. Pharmacogenomic alterations on pharmacodynamics 714. Relationship between concentration (i.e., blood) and effect
Section 8. Pharmacokinetic properties
801. Absorption 802. Bioavailability: absolute and/or relative bioavailability 803. Systemic bioavailability for locally applied medicinal products 804. Time to peak concentration (Tmax) 806. Influence of absorption by food 812. Blood-brain barrier penetration 813. Placental barrier penetration 815. Distribution to milk 818. Minimal effective plasma concentration 819. Toxic plasma concentration 821. Identification of the route/mechanism of metabolism 822. Enzymes involved in metabolism (including P450 isoenzymes) 823. Degree of metabolism 825. Activity of metabolites 826. What is the contribution of the metabolites (if any) to the effect 828. List of factors known to increase or decrease metabolism 829. Induction or inhibition of metabolic enzymes from the medicinal product 830. Site of metabolism 831. Elimination half lives 832. Identification of factors increasing and decreasing half-life 835. Excretion routes of the unchanged substance 836. Excretion routes of the metabolites 838. Variation of pharmacokinetics with respect to characteristics of patients: age, gender, smoking status, etc 840. Variation of pharmacokinetics with respect to pathological situations such as renal impairment, hepatic insufficiency, etc
Section 9. Preclinical safety data
903. Genotoxicity 904. Carcinogenic potencial 905. Toxicity to reproduction
Section 10. Evidence
1001. Level of evidence 1002. Clinical trials
Section 11. Prescription data
1104. Includes patient counselling information 1108 Prescription conditions: specific conditions applicable to prescribers (OTC product, hospital use…)
The members of the panel reached consensus in defining 30 items (16.13%) as non-
essential items (not to include as minimal set of information) (Table 07-08).
Table 07-08. Consensus list of non-essential items
Section 1. Characteristics of the medicinal product
108. Excipients (quantitative description) 110. Residues that may be present from the manufacturing process (expressed quantitatively) 116. Hygroscopicity of the active substance 119. Dissolution test of the product 120. Manufacturing process of the product 123. Marketing authorization numbers
Section 4. Adverse reactions
401. Description of ALL adverse reactions attributed to the medicinal product 404. Mechanism of action of adverse reactions 423. Preclinical safety data

162
424. Separate description of Adverse Events from Adverse Reactions Section 6. Overdose
604. Link to literature/reference to published case reports of overdosing (accidentally or suicidal) 605. Measured blood-/plasma-/serum- or urine concentration(s) in monitored cases of overdose
Section 7. Pharmacodynamic properties
708. Graphical display visualising the mechanism of action 711. Chirality
Section 8. Pharmacokinetic properties
805. Variability and modifying factors of time to peak concentration 807. Graphical display of concentration trajectory and variability 808. Pharmacokinetic model and model parameters 809. PK/PD dose response or hysteresis loop 811. Volume of distribution: in L/Kg or absolute values in L 816. Tissue concentration 817. Plasma concentration (interval) 820. Statement of one-compartment kinetics behaviour or deviation from it 827. Pharmacokinetics of principal metabolite(s) 834. Inter- and/or intra-subject variability in total clearance 837. Linearity/non-linearity of the pharmacokinetics of the medicinal product with respect to dose and/or time 839. Variation of pharmacokinetics with respect to polymorphic metabolism 841. In vivo pharmacokinetic studies of the medicinal product
Section 11. Prescription data
1105. Existence of another drug of the same active substance, even if it is not a generic drug 1106. Reimbursement Data 1107. Existence of biosimilars/bioidenticals
The analysis of consensus scores for the categorical question in each section is
presented in Table 07-09.
Table 07-09. Percentage of essential and non-essential items analysed by sections
Section % of Essential items % of Non-essential items 1. Characteristics of the medicinal product 55.17% 20.69% 2. Use of the medicinal product 94.44% --- 3. Contraindications 100% --- 4. Adverse reactions 59.26% 14.81% 5. Interactions 90.91% --- 6. Overdose 66.66% 33.33% 7. Pharmacodynamic properties 69.23% 15.38% 8. Pharmacokinetic properties 58.54% 31.71% 9. Preclinical safety data 60.00% --- 10. Evidence 40.00% --- 11. Prescription data 28.57% 27.27%
The consensus score values defining the importance of the following items of
information in drug information sources for healthcare professionals are displayed in
Table 07-10:
Table 07-10. Consensus scores of items
Section 1. Characteristics of the medicinal product Score101. Name of the holder of the marketing authorization 10 102. Address of the holder of the marketing authorization 5 103. Telephone of the holder of the marketing authorization 5 104. Contact to the medical department of the holder of the marketing authorization 5 105. Identification of the active substance 10 106. Quantitative composition: the quantity of the active substance, expressed per dosage unit 10

163
Table 07-10. Consensus scores of items
107. Excipients (qualitative description) 10 111. Pharmaceutical form 10 112. Visual description of the product 7 115. Special precautions for storage 10 116. Hygroscopicity of the active substance 4 117. Shelf-life after dilution or reconstitution according to instructions given 10 118. Shelf-life after first opening the container 9 119. Dissolution test of the product 2 120. Manufacturing process of the product 1 121. Pharmacotherapeutic group (ATC code) 10 122. Type of marketing authorization 4 127. Coating of oral dosage forms 7 128. Brand name 10
Section 2. Use of the medicinal product Score201. Therapeutic indications 10 202. Treatment algorithm 8 203. Target population 9 204. Instructions for correct administration/use 10 205. Posology/Dosing 10 206. Statement of the therapeutic window 7 207. Maximum recommended single dose 10 208. Maximum recommended daily dose 10 209. Maximum recommended total dose 10 211. Need for tapering off 9 212. Dosage individualization based on disease/severity being treated 8 213. Dosage adjustment in renal impairment 10 214. Categories of renal impairment related to the dose or interval adjustment 8 215. Dosage adjustment in liver disease 9 217. Dosage adjustment related to interactions 8 218. Normal duration of treatment 8 219. Restrictions on duration 8 220. What to do if a dose is missed 9 221. Implications of non-compliance, intermittent dosing 7 222. Influence of food with the intake of the product 9 223. Use in the paediatric population 10 224. Use in the elderly 10 225. Use during pregnancy 10 226. Recommendations on the use of the product at different times during pregnancy in respect to gestation
10
227. Use during lactation 10 229. Influence on the ability to drive and use machines 10 230. Comparison of risks and benefits with drugs in the same class 8 231. Comparison of risks and benefits with other drugs for the same condition 8 232. Instructions on how to prepare the medicinal product before administration (e.g. oral solutions for reconstitution, injectable forms)
10
233. Use of the medicinal product among immunocompromised patients 7 234. Information of duration of brewing (herbal medicines) 7 235. Use during pre-pregnancy period 8
Section 3. Contraindications Score301. Contraindications (disease) 10 302. Contraindications (concommitant drug use) 10 303. Contraindications (hypersensitivity reactions) 10 304. Contraindications (patient populations not studied in the clinical trials) 8 305. Contraindications (patient populations likely to experience product or class related adverse reactions occurring under normal conditions of use)
9
306. Steps to take if the contraindicated drug is administered 9 Section 4. Adverse reactions Score
402. Description of only the MOST FREQUENT adverse reactions 10 403. Serious adverse reactions to which the healthcare professional should be alert 10 405. Circumstances under which patients are at risk of experiencing specified adverse reactions 8 406. Relationship between dose and adverse reactions 8 407. Action to take in case those serious adverse reactions related to the treatment appear 10

164
Table 07-10. Consensus scores of items
408. Warning about the adverse reactions related to the excipients (even traces) 7 409. Statement of the need to monitor for specific asymptomatic drug reactions (lab tests) 8 410. Instructions of how frequently asymptomatic reactions should be monitored (lab tests) 8 411. Instructions on how to respond to monitoring values of asymptomatic drug reactions (lab tests)
6
412. Assessment of causality of adverse reactions 7 413. Assessment of severity of adverse reactions 8 414. Assessment of frequency of adverse reactions 8 415. Inclusion of a table of adverse reactions according to a standard system organ class 7 417. Time of onset of adverse reactions 8 418. Particular risks on initiating the treatment, such as first dose effects 8 419. Particular risks associated with stopping the treatment 8 420. Measures to be taken to avoid specific adverse reactions 8 422. Reversibility of adverse reactions 7 426. Inclusion of telephone numbers of the pharmacovigilance agency 5
Section 5. Interactions Score501. Clinically relevant drug interactions that affect the effects of the described medicine in the organism
10
502. Clinically relevant drug interactions produced by the described medicine and affecting the other medicinal products
10
503. Interacting medicinal products are listed by drug class 8 504. Interacting medicinal products are listed as specific compounds 8 505. Description of the severity of the drug interaction 8 506. Description of the effect of the drug interaction 8 507. Food interactions 10 508. Interactions with alcohol 10 509. Clinical manifestations and effects on laboratory tests 8 510. Effects on the results of lab tests not associated to physiological alterations (potential false positives)
7
Section 6. Overdose Score601. Description of symptoms and signs of overdose of the medicinal product 10 602. Management of overdose 10 603. Potential sequelae of overdose 8 605. Measured blood-/plasma-/serum- or urine concentration(s) in monitored cases of overdose 5 606. Antidote: for drugs with a narrow therapeutic window, specific antidote (if exists) 10
Section 7. Pharmacodynamic properties Score701. Description of the mechanism of action of the medicinal product 10 702. Identification of main effects on the organism 9 703. Efficacy data 8 705. Time to onset of effect (with minimal and maximal time) 8 706. Time to peak effect (with minimal and maximal time) 8 707. Duration of action/effect with minimal and maximal time 8 709. Evidence for tachyphylaxis/tolerance and maximum dose 6 710. Pro-drug: information about whether the medicinal product is a pro-drug or not 5 712. Relationship between dose and effect 8 713. Pharmacogenomic alterations on pharmacodynamics 7 714. Relationship between concentration (ie, blood) and effect 7
Section 8. Pharmacokinetic properties Score801. Absorption 8 802. Bioavailability: absolute and/or relative bioavailability 8 803. Systemic bioavailability for locally applied medicinal products 8 804. Time to peak concentration (Tmax) 8 806. Influence of the absorption by food 8 810. Plasma protein binding: expressed in % 7 812. Blood-brain barrier penetration 8 813. Placental barrier penetration 8 814. Distribution to cerebrospinal fluid 6 815. Distribution to milk 8 818. Minimal effective plasma concentration 7 819. Toxic plasma concentration 8 822. Enzymes involved in metabolism (including P450 isoenzymes) 8 829. Induction or inhibition of metabolic enzymes from the medicinal product 8

165
Table 07-10. Consensus scores of items
830. Site of metabolism 8 831. Elimination half lives 9 832. Identification of factors increasing and decreasing half-life 8 835. Excretion routes of the unchanged substance 8 836. Excretion routes of the metabolites 7 838. Variation of pharmacokinetics with respect to characteristics of patients: age, gender, smoking status, etc
8
839. Variation of pharmacokinetics with respect to polymorphic metabolism 6 840. Variation of pharmacokinetics with respect to pathological situations such as renal impairment, hepatic insufficiency, etc
8
841. In vivo pharmacokinetic studies of the medicinal product 5 Section 9. Preclinical safety data Score
902. Repeated dose toxicity 5 905. Toxicity to reproduction 9
Section 10. Evidence Score1001. Level of evidence 10 1002. Clinical trials 8
Section 11. Prescription data Score1104. Includes patient counselling information 10 1108 Prescription conditions: specific conditions applicable to prescribers (OTC product, hospital use…)
7
Sensitivity Analysis
The influence of consensus criteria on the number of items achieving consensus for the
categorical question is presented in Tables 07-11 to 07-13.
Table 07-11: Results of categorical question in the first round using different consensus criteria
Section Number of
items
Items achieving consensus at different consensus criteria*
95% 90% 85% 80% 75% 70% 1. Characteristics of the medicinal product
24 5 9 10 10 10 10
2. Use of the medicinal product 31 13 20 24 26 26 27 3. Contraindications 6 2 3 5 6 6 6 4. Adverse reactions 22 1 3 8 12 12 16 5. Interactions 10 1 4 6 8 8 9 6. Overdose 3 1 2 2 3 3 3 7. Pharmacodynamic properties 12 0 3 6 7 7 7 8. Pharmacokinetic properties 41 0 1 4 14 14 23 9. Safety data 5 0 0 0 2 2 2 10. Evidence 2 0 0 1 1 1 1 11. Prescription data 3 0 0 1 1 1 1 Bold represents the consensus criteria which was selected by the research team in the first round *Percentage of participants agreeing in the answer (either yes or no)
Table 07-12: Results of categorical question in the second round using different consensus criteria
Section Number of items Items achieving consensus at different consensus criteria*
95% 90% 85% 80% 75% 70%
1. Characteristics of the medicinal product
29 4 13 17 17 17 17
2. Use of the medicinal product 35 16 24 30 30 30 32 3. Contraindications 6 2 4 5 6 6 6 4. Adverse reactions 27 2 7 11 15 15 18 5. Interactions 11 2 6 7 8 8 9 6. Overdose 6 2 3 3 4 4 4

166
7. Pharmacodynamic properties 13 1 5 8 8 9 10 8. Pharmacokinetic properties 41 1 6 20 21 26 27 9. Safety data 5 0 0 2 2 2 3 10. Evidence 5 0 0 1 1 1 1 11. Prescription data 7 0 0 1 2 2 2 Bold represents the consensus criteria which was selected by the research team in the second round *Percentage of participants agreeing in the answer (either yes or no)
Table 07-13: Results of categorical questions in the third round using different consensus criteriaSection Number of items Items achieving consensus at different
consensus criteria* 95% 90% 85% 80% 75% 70%
1. Characteristics of the medicinal product
29 5 13 20 21 22 22
2. Use of the medicinal product 36 17 25 32 33 34 35 3. Contraindications 6 2 4 5 6 6 6 4. Adverse reactions 27 3 8 14 18 20 21 5. Interactions 11 2 6 7 10 10 10 6. Overdose 6 2 3 3 5 6 6 7. Pharmacodynamic properties 13 1 5 10 10 11 11 8. Pharmacokinetic properties 41 1 6 30 33 37 37 9. Safety data 5 0 0 3 3 3 3 10. Evidence 5 0 0 2 2 2 3 11. Prescription data 7 0 0 1 3 5 5 Bold represents the consensus criteria which was selected by the research team in the third round *Percentage of participants agreeing in the answer (either yes or no)
The influence of consensus criteria on the number of items achieving consensus for the
discrete-scoring question is presented in Tables 07-14 to 07-16.
Table 07-14: Results of the discrete-scoring question in the first round using different consensus criteria
Section Number of
items
Items achieving consensus at different consensus criteria*
95/85 90/80 85/75 80/70 75/65 70/60 65/55 1. Characteristics of the medicinal product
24 2 2 4 4 4 5 6
2. Use of the medicinal product
31 3 3 4 4 6 8 12
3. Contraindications 6 1 1 2 2 3 3 3 4. Adverse reactions 22 0 1 2 2 2 2 7 5. Interactions 10 0 1 2 2 2 2 2 6. Overdose 3 0 0 0 2 2 2 2 7. Pharmacodynamic properties
12 0 0 0 0 0 1 1
8. Pharmacokinetic properties
41 0 0 0 0 0 0 0
9. Safety data 5 0 0 0 0 0 0 1 10. Evidence 2 0 0 0 0 0 1 1 11. Prescription data 3 0 0 0 0 0 1 1 Bold represents the consensus which was used by the research team in the first round *Percentage of participants scoring the mode plus the two adjacent values (please refer to methods: ‘establishing consensus requirements’)

167
Table 07-15: Results of discrete scoring question in the second round using different consensus criteria
Section Number of
items
Items achieving consensus at different consensus criteria*
95/85 90/80 85/75 80/70 75/65 70/60 65/55
1. Characteristics of the medicinal product
29 2 2 5 6 6 7 10
2. Use of the medicinal product
35 5 7 11 14 16 17 19
3. Contraindications 6 2 2 3 3 3 3 5 4. Adverse reactions 27 0 2 2 4 4 4 11 5. Interactions 11 0 1 2 4 4 5 6 6. Overdose 6 0 0 0 2 2 2 2 7. Pharmacodynamic properties
13 0 1 1 1 1 4 6
8. Pharmacokinetic properties
41 0 0 0 0 0 2 6
9. Safety data 5 0 0 0 0 0 0 1 10. Evidence 5 0 0 0 0 1 1 1 11. Prescription data 7 0 0 0 0 1 1 1 Bold represents the consensus which was used by the research team in the second round *Percentage of participants scoring the mode plus the two adjacent values (please refer to methods: ‘establishing consensus requirements’)
Table 07-16: Results of discrete scoring question in the third round using different consensus criteria
Section Number of items
Items achieving consensus at different consensus criteria*
95/85 90/80 85/75 80/70 75/65 70/60 65/55
1. Characteristics of the medicinal product
29 3 5 7 9 14 19 21
2. Use of the medicinal product
36 5 11 15 21 26 31 35
3. Contraindications 6 2 2 4 6 6 6 6 4. Adverse reactions 27 0 3 6 10 14 19 23 5. Interactions 11 0 1 2 6 6 10 11 6. Overdose 6 0 0 1 4 5 5 6 7. Pharmacodynamic properties
13 0 1 1 4 7 11 11
8. Pharmacokinetic properties
41 0 0 1 3 12 23 30
9. Safety data 5 0 0 0 0 1 2 3 10. Evidence 5 0 0 0 0 2 2 2 11. Prescription data 7 0 0 1 1 2 2 2 Bold represents the consensus which was used by the research team in the third round *Percentage of participants scoring the mode plus the two adjacent values (please refer to methods: ‘establishing consensus requirements’)

168
Discussion
Method used
The Delphi technique is a method used to explore the attitudes, needs and priorities of
a group of experts on a specific subject.(35) This technique is ideal for international
research and cooperation as it allows the inexpensive recruitment of a group of experts
without geographical limitations.(39) Not only does this technique enable the collection
of data from diverse geographical locations, but it also easily reaches participants from
different areas of expertise and professional experiences.(35)
The classic Delphi method consists of four rounds, however recent evidence showed
that two or three rounds are preferred.(36) Three rounds are usually sufficient to
achieve consensus, the largest adjustments occurring between rounds one and
two.(39) In addition, maintaining a high response rate in a Delphi study with several
rounds is very difficult.(35)
The most frequently used statistical methods in a Delphi technique are measures of
central tendency (mean, median and mode). The use of median and mode is generally
preferred(40), although sometimes the literature recommends the use of median
scores for Likert scales.(40) Ludwig specifically considers that “a Delphi process has a
tendency to create convergence, and though this is usually to a single point, there is
the possibility of polarization or clustering of the results around two or more points. In
these instances the mean or median could be misleading”.(44) In this study, the mode
was the statistical measure used, in order to avoid the influence of polarised score
distributions, since answers were based on a ten-point Likert scale.
Participation rates in our study were satisfactory, and consensus was reached in both
questions (categorical and discrete-scoring) for a great majority of items (83.87% for
the categorical question, and 69.89% for the discrete-scoring question).
Minimal set of information (essential items)
When analysing the information needs of healthcare professionals, we aimed at
defining the minimal set of information needed by these professionals in clinical
practice. The minimal set of information should comprise the essential items to be
included in any source of information, regardless of its size (SmPCs, product
monographs, monographs in drug reference books, drug web pages, etc.).
The content of this minimal set of information was analysed through the perspective of
healthcare professionals and academics participating in the Delphi study. When
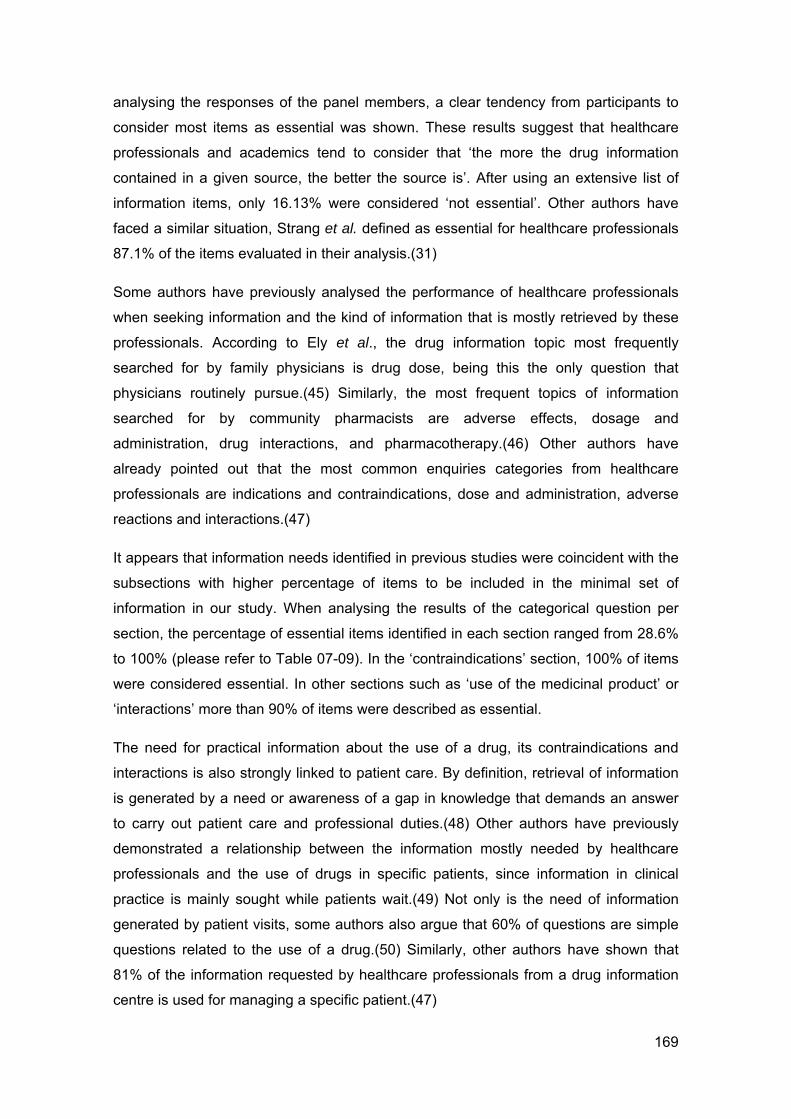
169
analysing the responses of the panel members, a clear tendency from participants to
consider most items as essential was shown. These results suggest that healthcare
professionals and academics tend to consider that ‘the more the drug information
contained in a given source, the better the source is’. After using an extensive list of
information items, only 16.13% were considered ‘not essential’. Other authors have
faced a similar situation, Strang et al. defined as essential for healthcare professionals
87.1% of the items evaluated in their analysis.(31)
Some authors have previously analysed the performance of healthcare professionals
when seeking information and the kind of information that is mostly retrieved by these
professionals. According to Ely et al., the drug information topic most frequently
searched for by family physicians is drug dose, being this the only question that
physicians routinely pursue.(45) Similarly, the most frequent topics of information
searched for by community pharmacists are adverse effects, dosage and
administration, drug interactions, and pharmacotherapy.(46) Other authors have
already pointed out that the most common enquiries categories from healthcare
professionals are indications and contraindications, dose and administration, adverse
reactions and interactions.(47)
It appears that information needs identified in previous studies were coincident with the
subsections with higher percentage of items to be included in the minimal set of
information in our study. When analysing the results of the categorical question per
section, the percentage of essential items identified in each section ranged from 28.6%
to 100% (please refer to Table 07-09). In the ‘contraindications’ section, 100% of items
were considered essential. In other sections such as ‘use of the medicinal product’ or
‘interactions’ more than 90% of items were described as essential.
The need for practical information about the use of a drug, its contraindications and
interactions is also strongly linked to patient care. By definition, retrieval of information
is generated by a need or awareness of a gap in knowledge that demands an answer
to carry out patient care and professional duties.(48) Other authors have previously
demonstrated a relationship between the information mostly needed by healthcare
professionals and the use of drugs in specific patients, since information in clinical
practice is mainly sought while patients wait.(49) Not only is the need of information
generated by patient visits, some authors also argue that 60% of questions are simple
questions related to the use of a drug.(50) Similarly, other authors have shown that
81% of the information requested by healthcare professionals from a drug information
centre is used for managing a specific patient.(47)

170
Bastholm et al. concluded that information systems for physicians should indicate
whether a drug is appropriate for the patient and what effects can be expected with the
use of a drug, deliver dose suggestions and up-to-date drug recommendations and
indicate whether there are other preferable drugs for the patient. It should also prevent
prescribing mistakes using an alert system, warn about interactions (even linking them
to laboratory tests data and diagnoses), provide pharmacological knowledge and aid
decision-making.(51)
A study similar to ours, in which a Delphi panel was used to assess the information
provided by the pharmaceutical representatives, was published by Strang et al. (31)
These authors analysed how much information physicians needed to prescribe a drug
appropriately, and described 31 items to be rated using a seven-point Likert scale
(never include, rarely include, may omit, include if time permits, always include some
information, always include considerable information and always include all available
information). This scoring system evaluated which information should be included in
the drug-detailing process, where pharmaceutical representatives provide healthcare
professionals with face-to-face information about a drug.(31) From the 31 items
analysed by Strang et al, 28 were present in our study. The three items not included in
our study were:
‘Drug endorsed by local colleagues’: we considered that point was not
appropriate for a drug information source other than a pharmaceutical
representative.
‘Indications not approved in Canada’ and ‘other countries where the drug is
licensed’: they were not considered in our study since we are aiming to create a
universal tool, not restricted to a single country.
‘Time remaining on patent’: we used the more specific item ‘existence of a
generic drug of the same active substance’ instead.
In Strang’s study, 26 out of 31 items (83.9%) described the information that should
always be included: eleven were rated as ‘always include all available information’,
eight as ‘always include considerable information’, and seven as ‘always include some
information’. Moreover, the authors considered that the essential information should
also contain the items rated as ‘include if time permits’, and even added one more item
to the essential-item list rated as ‘may omit’ due to the statistically significant
disagreement between medical specialties. The final list of essential items contained
27 items (87.1%).

171
In our study, 126 items (67.7%) were identified as essential items by the panel
members. The difference between these two percentages may arise from the
difference in the number of items in the checklist, as it differs from 186 in the present
study to 31 in the study by Strang et al.
The items considered essential in the study by Strang et al. differ from those in our
study, as shown below:
The item ‘cost to patient and/or drug plan’ which was rated as ‘always
include considerable information’ in Strang’s research, did not reach
consensus in our study (only 58.6% of participants considered it was
essential);
The item ‘reimbursement data’ was classified as ‘always include some
information’ in Strang’s study. In the present study it was agreed as a non-
essential item;
‘Comparison of risks and benefits with drugs in the same class’ was
classified as ‘always include considerable information’ in Strang’s study,
whereas in our study it did not reach consensus as essential item (only
67.9% of participants considered it was essential);
‘Comparison of risks and benefits with drugs for the same condition’ was
classified as ‘always include considerable information’ in Strang’s study,
while in our study it did not reach consensus as essential item (only 71.4%
of participants considered it was essential);
‘Availability of patient teaching aids’ was rated as ‘may omit’ in Strang’s
study and classified as essential in our study. However, Strang added this
item to the list of essential items to be included in the ideal drug detail,
because of the statistically significant disagreement between medical
specialties.
In the final results of Strang et al., four items (12.90%) were not included in the list of
the ideal drug detail, as participants reached consensus in stating that they could or
should be omitted. In our study, 30 items (16.13%) were defined as non-essential by
panel members.
Spyker et al. also analysed the completeness of drug information sources from a
clinical pharmacology perspective. The ‘Clinical Pharmacology Core Information’ was

172
defined by 25 items of information, all of them included in our checklist. However, for
four of them, the Delphi panel did not reach consensus to classify them as a minimal
set of information. The items not reaching consensus were: evidence for
tachyphylaxis/tolerance, metabolites of the drug, degree of plasma protein binding, and
total clearance. Additionally, for two items which were part of Spyker’s ‘Clinical
Pharmacology Core information’, the Delphi panel in our study reached consensus to
define them as non-minimal information. These items were the ‘volume of distribution’
and ‘statement of one-compartment kinetics behaviour or deviation from it’. These
differences may be explained by the different objectives of the studies: Spyker et al.
focused on clinical pharmacology information, while we analysed drug information for
healthcare professionals in general.
Regarding the sensitivity analysis performed in the present study, it is important to
remember that our consensus criteria were established based on a progressive filtering
process, using higher consensus requirements in the first round and then reducing
these requirements in subsequent rounds. In the first round, consensus was defined at
≥90% agreement. For the first round, consensus was purposely very restrictive (using
higher consensus rates, e.g. ≥95%, would not have been very realistic) and thus, only
strongly agreed items were accepted. However, even if we had used less restrictive
consensus criteria, that would not have affected the results greatly (please refer to
Table 07-11). Changes would have been major only for three out of the 11 sections:
‘contraindications’, ‘pharmacodynamic properties’ and ‘pharmacokinetic properties’. In
the second round, consensus was established at ≥80% agreement. Increasing or
reducing consensus criteria would not have changed the results very much (please
refer to Table 07-12). Finally, in the third round, at a ≥75% consensus value,
participants reached satisfactory agreement. If higher consensus rates had been used,
there would have been only slight differences throughout the sections, the section
‘pharmacokinetic properties’ being the one with greater changes (from 33 agreed items
at a 80% consensus rate to 37 agreed items at a 75% consensus rate) (please refer to
Table 07-13). Reducing the consensus rate to 70% would not change the scenario
greatly (only three out of the 11 sections would have changed slightly).
In a nutshell, the list of essential items obtained from the Delphi process will help us
define which items of information are needed in any kind of drug information source for
healthcare professionals. This allows us to assess the compliance of an information
source with the minimal content requirements, but also to design more efficient
abridged information sources by avoiding excessive information.

173
Completeness scoring tool
This study also aimed at designing a general tool to analyse the completeness of any
kind of drug information source.
Completeness has been defined as the capacity of being complete, balanced, and thus
updated.(6) This “fair balance” of information has also been highlighted by Greene et
al. when focusing on information about the risks and benefits of a drug.(7) When this
balance is not achieved, the information may lead to misuse of drugs, with “dangerous
consequences”.(7)
The consensus criteria used to create the completeness scoring tool were also based
on a progressive filtering process. In the first round, consensus was defined at ≥80% of
the respondents falling within one point on either side of the modal response, and
≥70% when the mode fell at the extremes of the ten-point scale (zero or ten). Using
higher consensus criteria would not change the results very much (please refer to
Table 07-14). In the second round, consensus was defined at ≥70% of the respondents
falling within one point on either side of the modal response, and ≥60% when the mode
fell at the extremes of the ten-point scale. A higher consensus criterion was considered
very restrictive, which would in turn lead to slight differences in sections such as
‘pharmacodynamic properties’ or ‘pharmacokinetic properties’ (please refer to Table
07-15). If we had selected less restrictive consensus criteria, eight out of the 11
sections would have changed moderately, however, some of them such as section four
(‘adverse reactions’) would have shown a considerable increase in the number of items
achieving consensus (please refer to Table 07-15). In the last round, consensus criteria
were the same as in round two. Less restrictive consensus criteria would have changed
the results, and a greater consensus would have been reached, especially in the
section ‘pharmacodynamic properties’ (please refer to Table 07-16). Four out of the
eight sections would not have changed at all. For the other four sections, a total of 20
items would have been accepted as consensus items (10.75% of the total 186 items).
However, the consensus of 70%-60% was established as criterion, considering the
most commonly used criteria in scientific literature.(39) The created tool is defined as
general, indicating that it is applicable to any information source and any kind of
medicinal product. As previously mentioned, other authors aimed at assessing specific
aspects of drug information for healthcare professionals in different sources.(17-26)
These previous studies differ from ours in that they aim to assess completeness
regarding specific aspects of drug information (adverse reactions, interactions,
overdose, etc), focusing on specific drug classes or on specific drug information

174
sources. Conversely, the present study aims to design a tool to analyse completeness
of drug information, with the following main characteristics:
Applicable to any medicinal product regardless of its indications, route of
administration, pharmaceutical form, etc.
Applicable to any kind of drug information source, regardless of its size, origin,
format, etc.
Covering all aspects of drug information: pharmaceutical information, clinical
information, and administrative and marketing data.
The following equation allows researchers to measure the completeness of a drug
information source using a continuous variable, expressed in a percentage of the ideal
source (which scores the maximum possible points).
Completeness (%) = Total score for the analysed source of information x 100 Total score of the ideal source
When using this equation, all items of information should be reviewed in the analysed
source, in order to assess whether information about these items is present. The
consensus scores of all the items present in the analysed source will be added up to
obtain the total score for the analysed source of information. However, it is important to
bear in mind that some items may not be applicable for a specific drug. Thus, the score
of these non-applicable items should not be added to the total score of the ideal
source.
For example, for a medicinal product in which all the 186 items presented in the tool
are applicable, the total score of the ideal source of information would be the sum of all
the scores of those 186 items. However, in most cases, not all 186 items will be
applicable. For instance, item number 803 - ‘systemic bioavailability for locally applied
medicinal products’ -, will only be applicable to topical drugs. Therefore its eight points
should not be added up to the ‘total score of the ideal source’ if the medicinal product
analysed has another administration route.
Including such an extensive amount of items and some of them being so specific, is
one of the strengths of this tool, as it allows as many aspects of the information as
possible to be analysed, including the most specific ones.
Moreover, another of the advantages of this tool is that, as completeness is calculated
as a percentage of the ideal source, and only the applicable items are considered in
the total possible points, the tool allows different sources of information for a specific

175
drug to be compared, and, obviously and more importantly, researchers can use this
percentage of completeness to compare information sources of different drugs.
Comparing the completeness of different sources of information using one general tool
is a challenging task. The results of this analysis may help healthcare professionals
recognize the most complete information sources and contribute to the improvement of
information sources regarding completeness.
One of the utilities of the resulting tool may be the analysis of the completeness of
sources such as SmPCs. The SmPC is defined as “the basis of information for
healthcare professionals on how to use the medicinal product safely and
effectively”.(52) However, European Union legislation has not defined a more complete
official drug information source for healthcare professionals, which makes SmPCs the
unique official drug information source. Thus, the analysis of completeness of SmPCs
is paramount.
Product monographs, produced by the pharmaceutical industry with no specific
regulation, may be another source to analyse. Previous studies have evaluated the
completeness of product monographs by using an ad hoc assessing tool.(53) The tool
resulting from this Delphi study will not only allow the evaluation of product
monographs, but also the assessment of their completeness in comparison with
SmPCs or other drug information sources.
Limitations
This Delphi study aimed at evaluating the completeness of a given drug information
source for healthcare professionals. Nevertheless, it should be noted that neither the
quality of the information, nor its applicability or reliability were assessed with this
method. It may happen that the information provided about a topic is complete, by
scoring fully in the tool, but it may be outdated. According to Eysenbach et al.,
completeness may be evaluated as an integral part of accuracy. However, analysing
completeness by using checklists also raises the question of accuracy of the
information provided.(10)
There is a dearth of research about the clinical and public health impact of information
on drugs.(7) Therefore, forecasting the impact for patient health outcomes of the
results of applying the tool developed in this study would be adventurous. However, as
clinicians need data to make the best choices and to use drugs maximising their
benefits and minimising harm (54), this study may contribute to producing more

176
complete information sources specifically addressed to the needs of healthcare
professionals.

177
Conclusions
Experts identified the 126 items of information constituting the essential information
that any medicines information source for healthcare professionals should include,
regardless of its size and format. This list of items gives rise to a tool to assess the
minimal completeness required for any medicines information source for healthcare
professionals.
Experts also achieved consensus in scoring 130 information items according to their
importance for the assessment of completeness in medicines information sources for
healthcare professionals. This list of items gives rise to a tool to quantitatively assess
the completeness of any drug information source, expressed as a percentage of the
ideal source.

178
Appendix 07.01: Glossary with definition of items in the questionnaire
Section 1: Characteristics of the medicinal product
101. Name of the holder of the marketing authorization: Name of the person or company in whose name the
marketing authorization has been granted. This party is responsible for all aspects of the product, including quality and
compliance with the conditions of marketing authorization.
102. Address of the holder of the marketing authorization: main location of the company (street, city, country) in
whose name the marketing authorization has been granted.
103. Telephone of the holder of the marketing authorization: contact number of company in whose name the
marketing authorization has been granted.
104. Contact to the medical department of the holder of the marketing authorization: contact details (telephone, e-
mail address) of the medical department responsible of the product.
105. Identification of the active substance: name of the therapeutically active ingredient(s).
106. Quantitative composition: the quantity of the active substance, expressed per dosage unit.
107. Excipients (qualitative): Components of a finished product other than the claimed therapeutic ingredient(s)
expressed qualitatively
108. Excipients (quantitative): Components of a finished product other than the claimed therapeutic ingredient(s)
expressed quantitatively
109. Residues that may be present from the manufacturing process (expressed qualitatively): identification of
traces of substances (not active substances, nor excipients) that may be present in the final product derived from the
manufacturing process
110. Residues that may be present from the manufacturing process (expressed quantitatively): quantification of
traces of substances (not active substances, nor excipients) that may be present in the final product derived from the
manufacturing process
111. Pharmaceutical form: form in which the medicinal product is presented (tablets, capsules, powders for
reconstitution, transdermal patches, etc)
112. Visual description of the product: appearance of the final product (colour, markings, etc)
113. Colour pictures for product identification: inclusion of pictures of the appearance of the final product
114. Expiry date: the date after which the constant character of the medicine is not any longer guaranteed by the
holder of the marketing authorisation.
115. Special precautions for storage: identification of any conditions that may affect the product when stored.
116. Hygroscopicity of the active substance: The property of a substance of absorbing moisture.
117. Shelf-life after dilution or reconstitution according to instructions given: the length of time the medicine will
last without deteriorating after the dilution or reconstitution of the product (when necessary)
118. Shelf-life after first opening the container: the length of time the medicine will last without deteriorating after
opening the package.
119. Dissolution test of the product: In vitro dissolution testing has been employed for manufacturing process
monitoring and control. Many factors can affect the dissolution rate of a drug product including the granulation process
(wet or dry), the tablet punch pressure, the formulation composition, and the physicochemical properties of both active
120. Manufacturing process of the product: explanation of the manufacturing process of the product
121. Pharmacotherapeutic group (ATC code): classifies the medicinal product according to the ATC code
122. Type of marketing authorization: official document issued by the competent drug regulatory authority for the
purpose of marketing. Indication of authorization being by centralized procedure, decentralized procedure or mutual
recognition procedure.
123. Marketing authorization numbers: code that identifies the marketing authorization of the product
124. Date of first authorization/renewal of the authorization: Date from which marketing of the product is authorized.

179
Section 2: Use of the medicinal product
201. Therapeutic indications: definition of the target disease or aim for which the medicinal product is intended
202. Treatment algorithm: a treatment algorithm is a technique for standardizing decision-making and improving
technical quality of care. By providing a series of questions, it guides the caregiver to the correct diagnosis and
treatment for the most commonly observed pathologies. A treatment algorithm is useful for systematizing or
standardizing clinical behaviour.
203. Target population: population in which the product should be used
204. Instructions for correct administration/use: how and when to take the medicine
205. Dosing: dose recommendations per dose interval for each age category where appropriate
206. Statement of the therapeutic window: the term therapeutic window refers to the range of doses of a drug that
are actually effective in treating a particular disease. Doses below the therapeutic window are too weak to have any
effect; doses above the window cause unacceptable side-effects.
207. Maximum recommended single dose: the largest quantity of the medicinal product administered at one time
consistent with safety.
208. Maximum recommended daily dose: the largest quantity of the medicinal product administered in a day
consistent with safety
209. Maximum recommended total dose: the total largest quantity of the medicinal product to be administered
consistent with safety
210. The need for dose titration or not: the need of gradually adjusting the dose of the medicinal product until the
desired effect is achieved
211. Need for tapering off: statement about the need of decreasing progressively the dose of a medicinal product
before finishing the treatment.
212. Dosage individualization based on disease/severity being treated: indication of the amount of the medicinal
product to be administered according to the disease being treated or the severity o the disease.
213. Dosage adjustment in renal impairment: indication of the amount of the medicinal product to be administered to
patients suffering from acute or chronic malfunction of the kidneys to avoid adverse reactions and to ensure efficacy
214. Categories of renal impairment related to the dose or interval adjustment: indication of the dosage
adjustment for patients with different degrees of malfunction of the kidneys. Explicitly specifies relationship between
dose and degree of renal impairment.
215. Dosage adjustment in liver disease: indication of the amount of the medicinal product to be administered to
patients suffering from liver disease to avoid adverse reactions and to ensure efficacy
216. Dosage adjustment in other concomitant diseases: indication of the amount of the medicinal product to be
administered to patients suffering from other diseases to avoid adverse reactions and to ensure efficacy
217. Dosage adjustment related to interactions: indication of the amount of the medicinal product to be administered
to patients when an interaction with other medicinal drug is present.
218. Normal duration of treatment: duration of use
219. Restrictions on duration: warning about non-desirable effects derived from the duration of the treatment (e.g.
rebound effect)
220. What to do if a dose is missing: actions to take when the patient forgets to take a dose
221. Implications of non-compliance, intermittent dosing: explains the consequences of the patient not taking the
medication or not following the course of therapy.
222. Influence of food with the intake of the product: whether the medicinal product should be taken before, during
or after eating and what the effects of food to the product are.
223. Use in the paediatric population: specific statement about the use of the drug in children (by age groups), and if
there are (in)sufficient data for geriatric use
224. Use in the elderly: specific statement about the use of the drug in elderly population (by age groups), and if there
are (in)sufficient data for paediatric use.
225. Use during pregnancy: assessment of risks associated with the use of the drug during pregnancy

180
226. Recommendations on the use of the product at different times during pregnancy in respect to gestation:
specific statement about the consequences of the use of the product related to different weeks of gestation
227. Use during lactation: information about the excretion of the active substance or its metabolites in milk
228. Influence on fertility: effects of the intake of the drug on the ability to conceive and have children.
229. Influence on the ability to drive and use machines: effects of the intake of the drug on the ability to drive or use
machines
230. Comparison of risks and benefits with drugs in the same class: includes a table or outline of different risks
and benefits of the medicinal product compared to other products of the same drug class
231. Comparison of risks and benefits with other drugs for the same condition: includes a table or outline of
different risks and benefits of the medicinal product compared to other products pursuing the same objective )treat the
same disease, prevent the same condition, etc)
Section 3: Contraindications
301. Contraindications (disease): patients with concomitant diseases by which the medicinal product should not be
used due to safety reasons
302. Contraindications (interactions): medicines which should be specifically avoided for concomitant or consecutive
use
303. Contraindications (hypersensitivity reactions): specifies immune reactions that may occur due to the intake of
the product
304. Contraindications (Patient populations not studied in the clinical trials): those populations in which there are
insufficient data for a safe use of the product
305. Contraindications (Patient populations likely to experience product or class related adverse reactions
occurring under normal conditions of use): e.g ages, body weight, poor metabolisers of a drug-metabolising enzyme
306. Steps to take if the contraindicated drug is administered: actions to take when one of the latter
contraindications occurs
Section 4: Adverse reactions
401. Description of ALL adverse reactions attributed to the medicinal product: indication of ALL adverse reactions
that may occur related to the intake of the medicinal product
402. Description of ONLY the MOST FREQUENT adverse reactions: description of the most frequent (not all)
adverse drug reactions
403. Serious adverse reactions to which the healthcare professional should be alert: any serious adverse reaction
that may be present related to the intake of the medicinal product
404. Mechanism of action of adverse reactions: mechanism of undesired side effects
405. Circumstances under which patients are at risk of experiencing specified adverse reactions: conditions
under which patients are more likely to experience adverse reactions
406. Relationship between dose and adverse reactions: specifically indicates how the dosage influences the
appearance of adverse reactions in patients
407. The action to take in case those serious adverse reactions related to the treatment appear: measures to be
taken when specific adverse reactions appear
408. Warning about the adverse reactions related to the excipients (even traces): any adverse reaction that may
be present due to any of the excipients present in the medicinal product (even those from traces remaining after the
manufacturing process)
409. Statement of the need to monitor for specific asymptomatic drug reactions: specifies if it is needed (or not) to
monitor for asymptomatic reactions of the medicinal product
410. Instructions of how frequently asymptomatic reactions should be monitored: in case monitoring of
asymptomatic reactions is needed, specifies how frequently
411. Instructions on how to respond to monitoring values of asymptomatic drug reactions: actions to take
according to the monitoring values present in patients taking the medicinal product

181
412. Assessment of causality of adverse reactions: relation between the causes and appearance of an undesirable
effect
413. Assessment of severity of adverse reactions: degree of the undesirable effect, e.g. headache
414. Assessment of frequency of adverse reactions: how often patients experience the adverse reaction
415. Inclusion of a table of adverse reactions according to a standard system organ class: specific table (not only
a describing paragraph, but a table lay-out) in which the adverse reactions are organized systematically according to the
organ affected.
416. Information on frequencies of adverse reactions related to the clinical trials from which they stem: indicates
how often patients in clinical trials have experienced the adverse reaction (with references to the trials)
417. Time of onset of adverse reactions: the time when symptoms of adverse reactions first occurred
418. Particular risks on iniciating the treatment, such as first dose effects: any risk that may derive from using a
medicinal product the first time (other than those common adverse effects).
419. Particular risks associated with stopping the treatment: any risk that may derive from stop taking the medicinal
product, such as rebound or withdrawal effects
420. Measures to be taken to avoid specific adverse reactions: actions to take in order to prevent the ocurrance of
adverse reactions
421. The action to take in case those serious adverse reactions related to the treatment appear: measures to be
taken when specific adverse reactions appear
422. Reversibility of adverse reactions: specifies the quality of returning to the original condition after an adverse
reaction occurs
423. Preclinical safety data: Adverse effects not observed in clinical studies, but seen in animals with possible
relevance to clinical use.
Section 5: Interactions
501. Clinically relevant drug interactions suffered by the described medicine: effects resulting from a drug-drug
interaction alterations pf the effect of the described medicine due to a drug interaction
502. Clinically relevant drug interactions produced by the described medicine: alterations of the effect of other
medicines due to a drug interaction of the described medicine
503. Interacting medicinal products are listed by drug class: drugs interacting with the medicinal product are
classified by drug class
504. Interacting medicinal products are listed as specific compounds: the interacting products are not listed as a
drug class in general but indicating the specific name of each product
505. Description of the severity of the drug interaction: the interactions are classified, as e.g. the interaction may be
life threatening, require medical intervention, result in an exacerbation of the patient’s condition, etc)
506. Description of the effect of the drug interaction: fully describes the effects of the interaction (signs, symptoms.
etc)
507. Food interactions: indicates food-drug interactions which may cause the drug to be more or less effective, or
cause effects on the body that are not expected.
508. Interactions with alcohol: indicates alcohol-drug interactions which may cause the drug to be more or less
effective, or cause effects on the body that are not expected.
509. Clinical manifestations and effects on laboratory tests: effects of the intake of the drug on the results of
different laboratory determinations
510. Effects on the results of lab tests not associated to physiological alterations (potential false positives):
potential modifications in the results of lab tests due to analytical alterations not related to actual physiologic
modifications
Section 6: Overdose
601. Description of symptoms and signs of overdose of the medicinal product: how overdose can be identified in
a patient taking the medicinal product

182
602. Management of overdose: actions to take in cases of overdose
603. Potential sequelae of overdose: future consequences of an overdose
Section 7: Pharmacodynamic properties
701. Description of the mechanism of action of the medicinal product: indicates the specific biochemical interaction
through which the drug produces its pharmacological effect. A mechanism of action usually includes mention of the
specific molecular targets to which the drug binds, such as an enzyme or receptor.
702. Identification of the principal physiological effects: indicates the specific effects that the medicinal product
produces in the organism of the patient
703. Efficacy data: data that demonstrate clinical effect of the medicinal product
704. Pharmacodynamic effects: relationship between dose and effect of the medicinal product
705. Time to onset of effect (with minimal and maximal time): the time when the effect of the medicinal product first
begins (with inter-patient variation)
706. Time to peak effect (with minimal and maximal time): time when the effect of the medicinal product (not blood
levels of the medicinal product) reaches its maximum (with inter-patient variation)
707. Duration of action/effect with minimal and maximal time: how long the effect is present in the patient (with
inter-patient variation)
708. Graphical display visualising the mechanism of action: includes graphics, photographs or graphical outlines of
the mechanism of action
709. Evidence for tachyphylaxis/tolerance and maximum dose: warns about the effects (if any) produced by the
medicinal product when used on a continuous basis
710. Pro-drug: information about whether the medicinal product is a pro-drug or not. A prodrug is a
pharmacological substance (drug) that is administered in an inactive (or significantly less active) form. Once
administered, the prodrug is metabolised in vivo into an active metabolite.
711. Chirality: specifies the structural characteristic of the molecule. A chiral molecule has a structure that makes it
impossible to superimpose it on its mirror image.
712. Relationship between dose and effect: indicates how the effect of the medicinal product changes when the dose
is modified
Section 8: Pharmacokinetic properties
801. Absorption: data about whether the absorption is complete or incomplete
802. Bioavailability: absolute and/or relative bioavailability: bioavailability is used to describe the fraction of an
administered dose of unchanged drug that reaches the systemic circulation. Absolute bioavailability compares the
bioavailability of the active drug in systemic circulation following non-intravenous administration (i.e., after oral, rectal,
transdermal, subcutaneous, sublingual administration), with the bioavailability of the same drug following intravenous
administration. Relative bioavailability measures the bioavailability of a certain drug when compared with another
formulation of the same drug, usually an established standard, or through administration via a different route
803. Systemic bioavailability for locally applied medicinal products: fraction of a drug that reaches the systemic
circulation when the drug is applied locally (eyedrops, topical products, etc)
804. Time to peak concentration (Tmax): time after which the concentration of the medicinal product in the organism
is at its maximum
805. Variability and modifying factors of time to peak concentration: Variability and factors that may modify the
time to peak concentration.
806. Influence of the absorption by food: how the intake of food may change the absorption of the medicinal product
807. Graphical display of concentration trajectory and variability: graphical display of concentration (ordinate) vs
time (abscissa)
808. Pharmacokinetic model and model parameters: indication of what pharmacokinetic model the medicinal product
follows in the organism with identification of its values
809. PK/PD dose response or hysteresis loop: de-synchronising between pharmacokinetics and pharmacodynamics.

183
810. Plasma protein binding (expressed in %): the percentage of the medicinal product that is bound to plasma
proteins, mostly plasma albumin.
811. Volume of distribution: in L/Kg or absolute values in L: quantifies the distribution of a medication between
plasma and the rest of the body after oral or parenteral dosing. It is defined as the volume in which the amount of drug
would need to be uniformly distributed to produce the observed blood concentration.
812. Blood-brain barrier penetration: The blood-brain barrier (BBB) is a metabolic or cellular structure in the central
nervous system (CNS) that restricts the passage of various substances between the bloodstream and the neural tissue
itself, while still allowing the passage of substances essential to metabolic function. Extent to which the medicinal
product penetrates this barrier.
813. Placental barrier penetration: extent to which the medicinal product penetrates the developing fetal tissues
814. Distribution to cerebrospinal fluid: extent to which the medicinal product reaches the watery fluid which flows in
the ventricles within the brain and around the surface of the brain and spinal cord.
815. Distribution to milk: extent to which the medicinal product is excreted in mothers’ milk
816. Tissue concentration: concentration of the medicinal product in body tissues
817. Plasma concentration: concentration of the medicinal product in plasma
818. Effective plasma concentration: plasma concentration of the medicinal product with a therapeutic
819. Toxic plasma concentration: plasma concentration of the medicinal product leading to toxic effects
820. Statement of one-compartment kinetics behaviour or deviation from it: situation wherein the medicinal
product remains in the same physiological system compartment (mostly the blood compartment)
821. Identification of the route/mechanism of metabolism: indicates the specific biochemical interaction through
which the drug is metabolised
822. Enzymes involved in metabolism: names of enzymes involved in the metabolism of the medicinal product
(including CYP450 isoenzymes )
823. Degree of metabolism: extent to which the medicinal product is metabolised
824. Metabolites: which metabolites: name of the metabolites that are originated from metabolism from the medicinal
product
825. Activity of metabolites: existence of pharmacologic activity of the metabolites
826. What is the contribution of the metabolites (if any) to the effect: the extent to which metabolites contribute to
the global effect of the medicinal product
827. Pharmacokinetics of principal metabolite(s): distribution and elimination data of the metabolites
828. List of factors known to increase or decrease metabolism: indicates which factors may modify the metabolism
of the medicinal product
829. Induction or inhibition of metabolic enzymes from the medicinal product: indicates if the medicinal product
modifies the activity of any metabolic enzymes
830. Site of metabolism: where metabolism takes place
831. Elimination half lives: The time it takes for the body to eliminate or breakdown half of a dose of the medicinal
product and its active metabolite(s).
832. Identification of factors increasing and decreasing half-life: indicates which factors may modify the half-life of
the medicinal product
833. Total clearance: in L/min or L/min/Kg: the amount of liquid filtered out of the blood that gets processed by the
kidneys or the amount of blood cleaned per time (normally 120 ml/min)..
834. Inter- and/or intra-subject variability in total clearance: indicates possible variation of the clearance values and
its modifying factors
835. Excretion routes of the unchanged substance: Routes through which the medicinal product is discharged from
the organism
836. Excretion routes of the metabolites: Routes through which the metabolites of the medicinal product are discharged from the organism
837. Linearity/non-linearity of the pharmacokinetics of the medicinal product with respect to dose and/or time:
statement of linearity or non-linearity of pharmacokinetics, considering that in case of linearity the plasma curve is dose
related within the considered time frame.
838. Variation of pharmacokinetics with respect to characteristics of patients: age, gender, smoking status, etc

184
839. Variation of pharmacokinetics with respect to polymorphic metabolism: how pharmacokinetics of the
medicinal product change due to the drug metabolism status of a patient
840. Variation of pharmacokinetics with respect to pathological situations such as renal impairment, hepatic
insufficiency, etc: how pharmacokinetics of the medicinal product change due to any pathological situation
841. In vivo pharmacokinetic studies of the medicinal product: references to the in-vivo studies related to
pharmacokinetics
Section 9: Safety data
901. Toxicity study (LD50): LD50 is the dose in which 50% of subjects will die 902. Repeated dose toxicity: information on the toxicity of a product when repeated exposure to the medicinal product
is anticipated
903. Genotoxicity: describes a deleterious action on a cell genetic material affecting its integrity.
904. Carcinogenic potencial: The term carcinogen refers to any medicinal product directly involved in the promotion of
cancer or in its propagation.
905. Toxicity to reproduction: if the medicinal product affects negatively the capacity to conceive children, including
teratogenic effects.
Section 10: Evidence
1001. Level of evidence: refers the level of evidence and cites the original research
1002. Clinical trials: gives information on the clinical trials carried out for the medicinal product and their results,
including clinical trial registered number.
Section 11: Prescription data
1101. Existence of a generic drug of the same active substance: indicates if there is a generic drug with the same
active substance in the market
1102. Cost of the Package: specifies the cost of the medicinal product
1103. Sales situation of the product: indicates sales numbers of the medicinal product in the country
1104. Includes patient counseling information: includes the basic information patients need to know when taking the
medicinal product

185
Appendix 07.02. Frequencies of scores for the categorical question in the
first round.
Y N
Item101 97% 3%
Item102 63% 38%
Item103 63% 38%
Item104 53% 47%
Item105 100% 0%
Item106 94% 6%
Item107 91% 9%
Item108 56% 44%
Item109 59% 41%
Item110 34% 66%
Item111 100% 0%
Item112 84% 16%
Item113 63% 38%
Item114 88% 13%
Item115 100% 0%
Item116 38% 63%
Item117 94% 6%
Item118 97% 3%
Item119 34% 66%
Item120 19% 81%
Item121 94% 6%
Item122 56% 44%
Item123 34% 66%
Item124 50% 50%
Item201 100% 0%
Item202 69% 31%
Item203 84% 16%
Item204 100% 0%
Item205 100% 0%
Item206 72% 28%
Item207 100% 0%
Item208 97% 3%
Item209 78% 22%
Item210 91% 9%
Item211 91% 9%
Item212 91% 9%
Item213 100% 0%
Item214 78% 22%
Item215 97% 3%
Item216 91% 9%
Item217 91% 9%
Item218 88% 13%
Item219 88% 13%
Item220 94% 6%
Item221 66% 34%
Item222 97% 3%
Item223 100% 0%
Item224 100% 0%
Item225 100% 0%
Item226 91% 9%
Item227 100% 0%
Item228 81% 19%
Item229 100% 0%
Item230 69% 31%
Item231 66% 34%
Item301 97% 3%
Item302 97% 3%
Item303 94% 6%
Item304 75% 25%
Item305 81% 19%
Item306 81% 19%
Item401 44% 56%
Item402 84% 16%
Item403 97% 3%
Item404 47% 53%
Item405 81% 19%
Item406 81% 19%
Item407 94% 6%
Item408 72% 28%
Item409 78% 22%
Item410 72% 28%
Item411 63% 38%
Item412 59% 41%
Item413 78% 22%
Item414 78% 22%
Item415 66% 34%
Item416 56% 44%
Item417 72% 28%
Item418 84% 16%
Item419 91% 9%
Item420 78% 22%
Item421 91% 9%
Item422 81% 19%
Item423 47% 53%
Item501 94% 6%
Item502 97% 3%
Item503 63% 38%
Item504 75% 25%
Item505 84% 16%
Item506 88% 13%
Item507 94% 6%

186
Item508 94% 6%
Item509 78% 22%
Item510 72% 28%
Item601 97% 3%
Item602 94% 6%
Item603 75% 25%
Item701 94% 6%
Item702 81% 19%
Item703 75% 25%
Item704 74% 26%
Item705 91% 9%
Item706 88% 13%
Item707 88% 13%
Item708 41% 59%
Item709 61% 39%
Item710 66% 34%
Item711 32% 68%
Item712 94% 6%
Item713 66% 34%
Item801 75% 25%
Item802 72% 28%
Item803 72% 28%
Item804 75% 25%
Item805 59% 41%
Item806 84% 16%
Item807 34% 66%
Item808 31% 69%
Item809 39% 61%
Item810 63% 38%
Item811 59% 41%
Item812 78% 22%
Item813 88% 13%
Item814 59% 41%
Item815 91% 9%
Item816 47% 53%
Item817 50% 50%
Item818 72% 28%
Item819 75% 25%
Item820 41% 59%
Item821 75% 25%
Item822 78% 22%
Item823 72% 28%
Item824 59% 41%
Item825 78% 22%
Item826 69% 31%
Item827 50% 50%
Item828 75% 25%
Item829 72% 28%
Item830 72% 28%
Item831 84% 16%
Item832 78% 22%
Item833 59% 41%
Item834 53% 47%
Item835 72% 28%
Item836 72% 28%
Item837 56% 44%
Item838 75% 25%
Item839 53% 47%
Item840 78% 22%
Item841 45% 55%
Item901 63% 38%
Item902 59% 41%
Item903 66% 34%
Item904 78% 22%
Item905 78% 22%
Item1001 84% 16%
Item1002 69% 31%
Item1101 56% 44%
Item1102 69% 31%
Item1103 31% 69%
Item1104 88% 13%

187
Appendix 07.03 Frequencies of scores for the discrete-scoring question in
the first round.
0 1 2 3 4 5 6 7 8 9 10
Item101 0% 0% 0% 0% 3% 16% 3% 6% 19% 3% 50%
Item102 10% 6% 16% 0% 6% 19% 6% 6% 13% 3% 13%
Item103 9% 9% 6% 9% 3% 13% 16% 6% 13% 9% 6%
Item104 13% 9% 6% 6% 3% 16% 3% 22% 13% 6% 3%
Item105 0% 0% 0% 0% 0% 0% 0% 0% 3% 3% 94%
Item106 0% 3% 0% 3% 0% 0% 0% 0% 3% 9% 81%
Item107 0% 0% 0% 6% 0% 9% 3% 9% 16% 13% 44%
Item108 6% 10% 13% 6% 3% 6% 10% 6% 13% 6% 19%
Item109 9% 6% 6% 3% 6% 19% 19% 13% 3% 6% 9%
Item110 13% 16% 13% 3% 10% 13% 16% 6% 0% 3% 6%
Item111 0% 0% 0% 0% 0% 6% 3% 0% 13% 9% 69%
Item112 6% 3% 0% 0% 6% 19% 16% 13% 19% 3% 16%
Item113 13% 3% 3% 3% 9% 25% 6% 6% 22% 3% 6%
Item114 9% 0% 3% 0% 0% 3% 0% 6% 13% 3% 63%
Item115 0% 0% 0% 0% 0% 3% 9% 6% 9% 19% 53%
Item116 16% 6% 3% 16% 9% 13% 16% 3% 6% 3% 9%
Item117 0% 3% 0% 6% 0% 3% 9% 9% 6% 13% 50%
Item118 0% 0% 0% 0% 0% 3% 16% 13% 16% 9% 44%
Item119 29% 3% 6% 13% 13% 13% 3% 3% 10% 6% 0%
Item120 34% 10% 7% 7% 17% 14% 7% 3% 0% 0% 0%
Item121 0% 0% 0% 3% 0% 13% 13% 9% 13% 9% 41%
Item122 13% 6% 16% 6% 0% 19% 13% 3% 9% 3% 13%
Item123 10% 20% 3% 17% 10% 10% 7% 7% 7% 0% 10%
Item124 16% 6% 6% 6% 3% 25% 13% 3% 13% 0% 9%
Item201 0% 0% 0% 0% 0% 0% 0% 0% 6% 3% 91%
Item202 6% 3% 0% 0% 6% 9% 6% 13% 34% 3% 19%
Item203 3% 0% 3% 3% 0% 6% 6% 16% 13% 13% 38%
Item204 0% 0% 0% 0% 0% 0% 0% 0% 13% 6% 81%
Item205 0% 0% 0% 0% 0% 0% 0% 3% 6% 6% 84%
Item206 3% 0% 0% 6% 6% 13% 0% 22% 16% 6% 28%
Item207 0% 0% 0% 0% 3% 3% 3% 6% 28% 9% 47%
Item208 0% 0% 0% 0% 3% 3% 3% 9% 22% 9% 50%
Item209 3% 0% 0% 0% 3% 6% 6% 0% 25% 6% 50%
Item210 0% 0% 0% 0% 3% 3% 6% 9% 31% 0% 47%
Item211 0% 0% 0% 3% 3% 0% 3% 13% 23% 10% 45%
Item212 0% 3% 0% 0% 9% 3% 13% 3% 25% 9% 34%
Item213 0% 0% 0% 0% 0% 3% 9% 9% 13% 9% 56%
Item214 3% 0% 0% 0% 6% 6% 9% 16% 16% 9% 34%
Item215 0% 0% 0% 0% 0% 9% 6% 13% 22% 13% 38%
Item216 0% 0% 0% 0% 6% 19% 3% 16% 13% 3% 41%
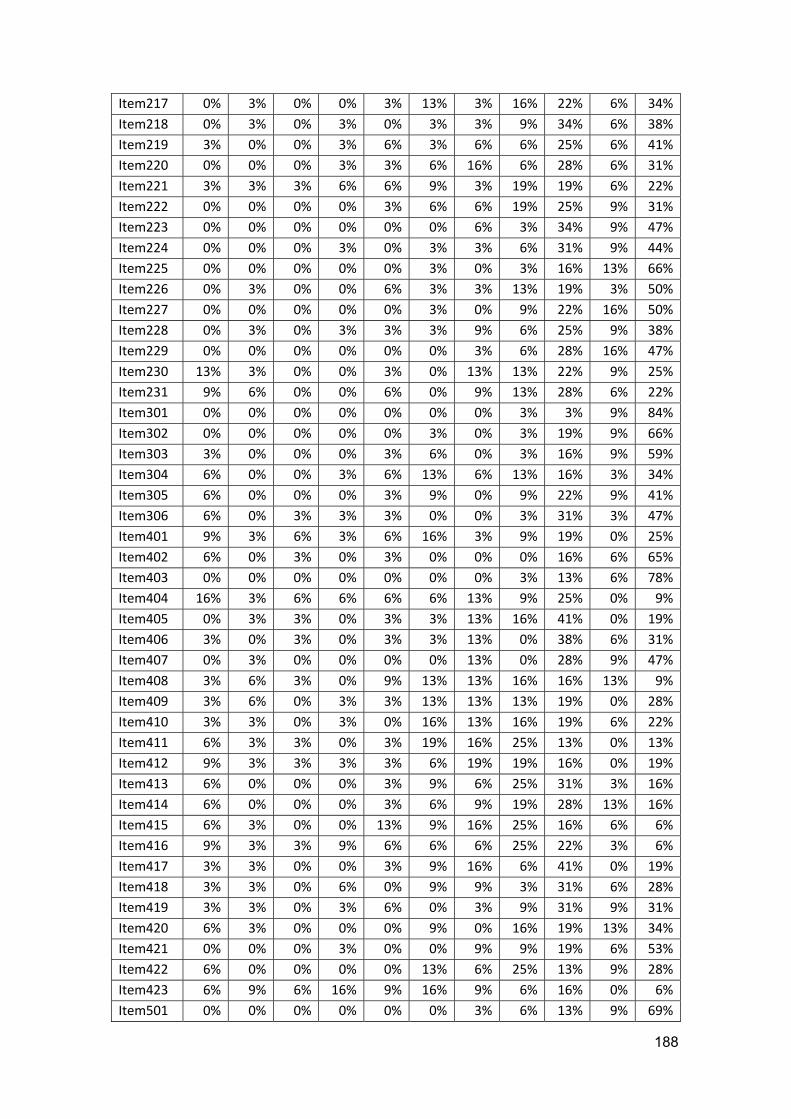
188
Item217 0% 3% 0% 0% 3% 13% 3% 16% 22% 6% 34%
Item218 0% 3% 0% 3% 0% 3% 3% 9% 34% 6% 38%
Item219 3% 0% 0% 3% 6% 3% 6% 6% 25% 6% 41%
Item220 0% 0% 0% 3% 3% 6% 16% 6% 28% 6% 31%
Item221 3% 3% 3% 6% 6% 9% 3% 19% 19% 6% 22%
Item222 0% 0% 0% 0% 3% 6% 6% 19% 25% 9% 31%
Item223 0% 0% 0% 0% 0% 0% 6% 3% 34% 9% 47%
Item224 0% 0% 0% 3% 0% 3% 3% 6% 31% 9% 44%
Item225 0% 0% 0% 0% 0% 3% 0% 3% 16% 13% 66%
Item226 0% 3% 0% 0% 6% 3% 3% 13% 19% 3% 50%
Item227 0% 0% 0% 0% 0% 3% 0% 9% 22% 16% 50%
Item228 0% 3% 0% 3% 3% 3% 9% 6% 25% 9% 38%
Item229 0% 0% 0% 0% 0% 0% 3% 6% 28% 16% 47%
Item230 13% 3% 0% 0% 3% 0% 13% 13% 22% 9% 25%
Item231 9% 6% 0% 0% 6% 0% 9% 13% 28% 6% 22%
Item301 0% 0% 0% 0% 0% 0% 0% 3% 3% 9% 84%
Item302 0% 0% 0% 0% 0% 3% 0% 3% 19% 9% 66%
Item303 3% 0% 0% 0% 3% 6% 0% 3% 16% 9% 59%
Item304 6% 0% 0% 3% 6% 13% 6% 13% 16% 3% 34%
Item305 6% 0% 0% 0% 3% 9% 0% 9% 22% 9% 41%
Item306 6% 0% 3% 3% 3% 0% 0% 3% 31% 3% 47%
Item401 9% 3% 6% 3% 6% 16% 3% 9% 19% 0% 25%
Item402 6% 0% 3% 0% 3% 0% 0% 0% 16% 6% 65%
Item403 0% 0% 0% 0% 0% 0% 0% 3% 13% 6% 78%
Item404 16% 3% 6% 6% 6% 6% 13% 9% 25% 0% 9%
Item405 0% 3% 3% 0% 3% 3% 13% 16% 41% 0% 19%
Item406 3% 0% 3% 0% 3% 3% 13% 0% 38% 6% 31%
Item407 0% 3% 0% 0% 0% 0% 13% 0% 28% 9% 47%
Item408 3% 6% 3% 0% 9% 13% 13% 16% 16% 13% 9%
Item409 3% 6% 0% 3% 3% 13% 13% 13% 19% 0% 28%
Item410 3% 3% 0% 3% 0% 16% 13% 16% 19% 6% 22%
Item411 6% 3% 3% 0% 3% 19% 16% 25% 13% 0% 13%
Item412 9% 3% 3% 3% 3% 6% 19% 19% 16% 0% 19%
Item413 6% 0% 0% 0% 3% 9% 6% 25% 31% 3% 16%
Item414 6% 0% 0% 0% 3% 6% 9% 19% 28% 13% 16%
Item415 6% 3% 0% 0% 13% 9% 16% 25% 16% 6% 6%
Item416 9% 3% 3% 9% 6% 6% 6% 25% 22% 3% 6%
Item417 3% 3% 0% 0% 3% 9% 16% 6% 41% 0% 19%
Item418 3% 3% 0% 6% 0% 9% 9% 3% 31% 6% 28%
Item419 3% 3% 0% 3% 6% 0% 3% 9% 31% 9% 31%
Item420 6% 3% 0% 0% 0% 9% 0% 16% 19% 13% 34%
Item421 0% 0% 0% 3% 0% 0% 9% 9% 19% 6% 53%
Item422 6% 0% 0% 0% 0% 13% 6% 25% 13% 9% 28%
Item423 6% 9% 6% 16% 9% 16% 9% 6% 16% 0% 6%
Item501 0% 0% 0% 0% 0% 0% 3% 6% 13% 9% 69%
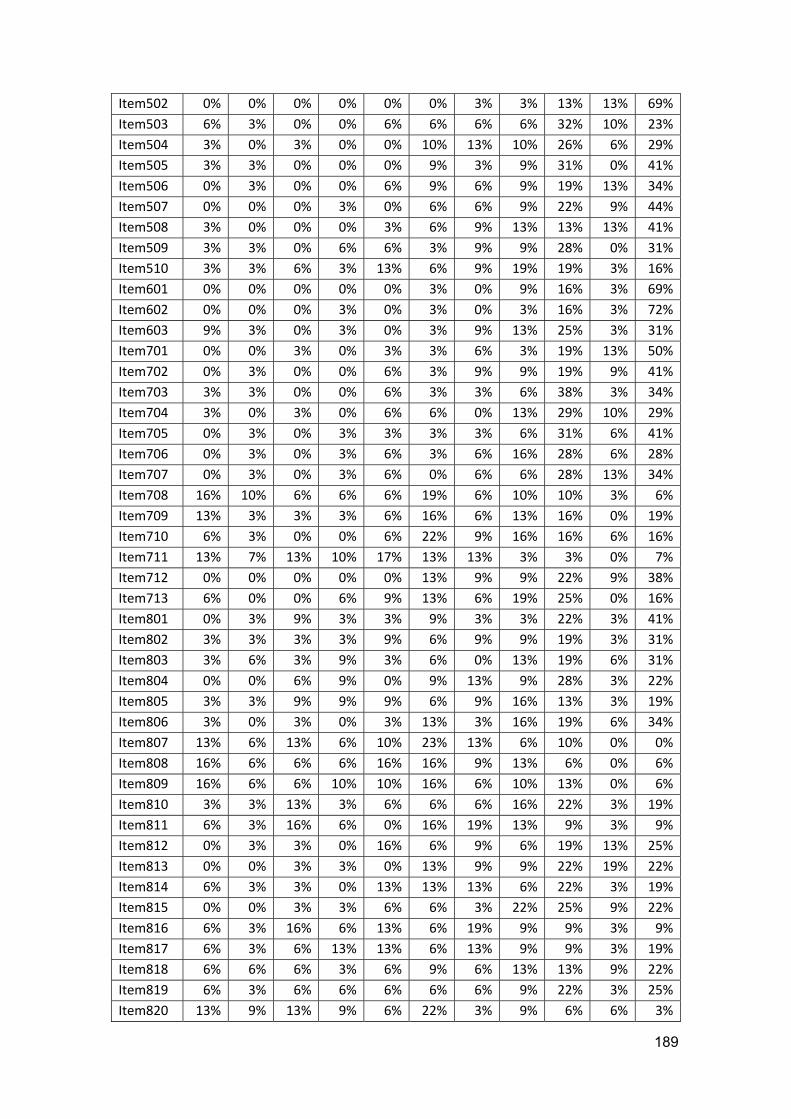
189
Item502 0% 0% 0% 0% 0% 0% 3% 3% 13% 13% 69%
Item503 6% 3% 0% 0% 6% 6% 6% 6% 32% 10% 23%
Item504 3% 0% 3% 0% 0% 10% 13% 10% 26% 6% 29%
Item505 3% 3% 0% 0% 0% 9% 3% 9% 31% 0% 41%
Item506 0% 3% 0% 0% 6% 9% 6% 9% 19% 13% 34%
Item507 0% 0% 0% 3% 0% 6% 6% 9% 22% 9% 44%
Item508 3% 0% 0% 0% 3% 6% 9% 13% 13% 13% 41%
Item509 3% 3% 0% 6% 6% 3% 9% 9% 28% 0% 31%
Item510 3% 3% 6% 3% 13% 6% 9% 19% 19% 3% 16%
Item601 0% 0% 0% 0% 0% 3% 0% 9% 16% 3% 69%
Item602 0% 0% 0% 3% 0% 3% 0% 3% 16% 3% 72%
Item603 9% 3% 0% 3% 0% 3% 9% 13% 25% 3% 31%
Item701 0% 0% 3% 0% 3% 3% 6% 3% 19% 13% 50%
Item702 0% 3% 0% 0% 6% 3% 9% 9% 19% 9% 41%
Item703 3% 3% 0% 0% 6% 3% 3% 6% 38% 3% 34%
Item704 3% 0% 3% 0% 6% 6% 0% 13% 29% 10% 29%
Item705 0% 3% 0% 3% 3% 3% 3% 6% 31% 6% 41%
Item706 0% 3% 0% 3% 6% 3% 6% 16% 28% 6% 28%
Item707 0% 3% 0% 3% 6% 0% 6% 6% 28% 13% 34%
Item708 16% 10% 6% 6% 6% 19% 6% 10% 10% 3% 6%
Item709 13% 3% 3% 3% 6% 16% 6% 13% 16% 0% 19%
Item710 6% 3% 0% 0% 6% 22% 9% 16% 16% 6% 16%
Item711 13% 7% 13% 10% 17% 13% 13% 3% 3% 0% 7%
Item712 0% 0% 0% 0% 0% 13% 9% 9% 22% 9% 38%
Item713 6% 0% 0% 6% 9% 13% 6% 19% 25% 0% 16%
Item801 0% 3% 9% 3% 3% 9% 3% 3% 22% 3% 41%
Item802 3% 3% 3% 3% 9% 6% 9% 9% 19% 3% 31%
Item803 3% 6% 3% 9% 3% 6% 0% 13% 19% 6% 31%
Item804 0% 0% 6% 9% 0% 9% 13% 9% 28% 3% 22%
Item805 3% 3% 9% 9% 9% 6% 9% 16% 13% 3% 19%
Item806 3% 0% 3% 0% 3% 13% 3% 16% 19% 6% 34%
Item807 13% 6% 13% 6% 10% 23% 13% 6% 10% 0% 0%
Item808 16% 6% 6% 6% 16% 16% 9% 13% 6% 0% 6%
Item809 16% 6% 6% 10% 10% 16% 6% 10% 13% 0% 6%
Item810 3% 3% 13% 3% 6% 6% 6% 16% 22% 3% 19%
Item811 6% 3% 16% 6% 0% 16% 19% 13% 9% 3% 9%
Item812 0% 3% 3% 0% 16% 6% 9% 6% 19% 13% 25%
Item813 0% 0% 3% 3% 0% 13% 9% 9% 22% 19% 22%
Item814 6% 3% 3% 0% 13% 13% 13% 6% 22% 3% 19%
Item815 0% 0% 3% 3% 6% 6% 3% 22% 25% 9% 22%
Item816 6% 3% 16% 6% 13% 6% 19% 9% 9% 3% 9%
Item817 6% 3% 6% 13% 13% 6% 13% 9% 9% 3% 19%
Item818 6% 6% 6% 3% 6% 9% 6% 13% 13% 9% 22%
Item819 6% 3% 6% 6% 6% 6% 6% 9% 22% 3% 25%
Item820 13% 9% 13% 9% 6% 22% 3% 9% 6% 6% 3%
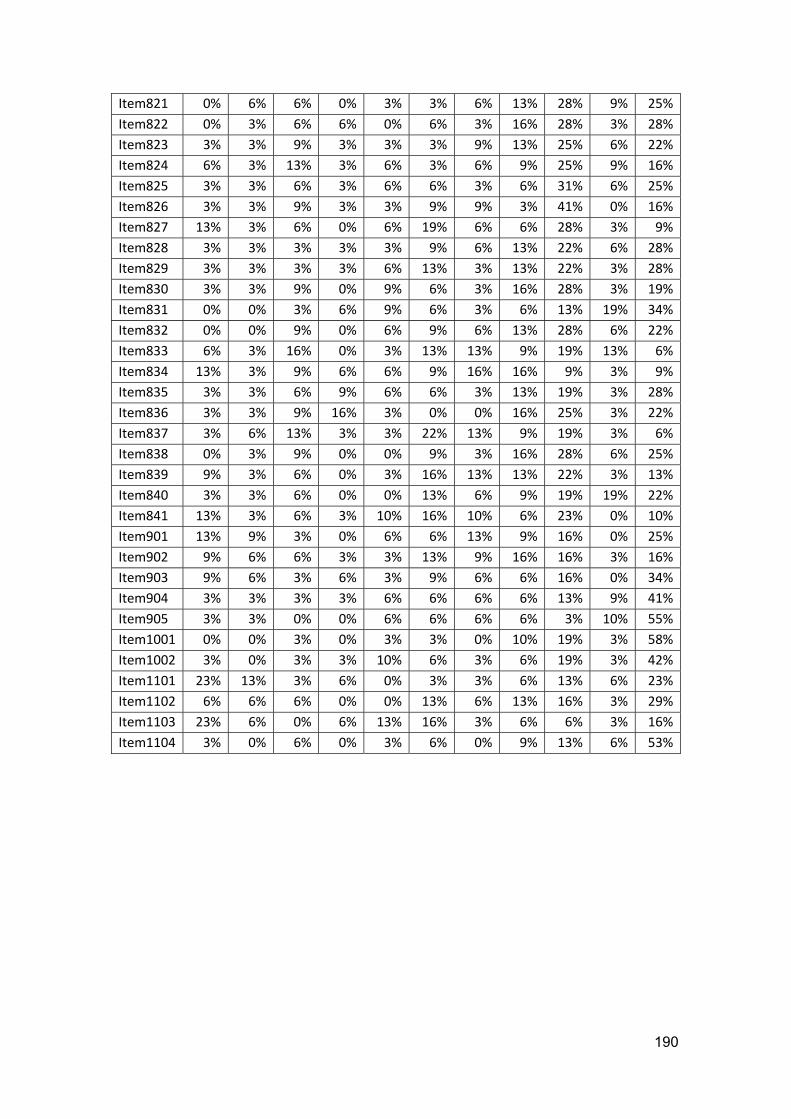
190
Item821 0% 6% 6% 0% 3% 3% 6% 13% 28% 9% 25%
Item822 0% 3% 6% 6% 0% 6% 3% 16% 28% 3% 28%
Item823 3% 3% 9% 3% 3% 3% 9% 13% 25% 6% 22%
Item824 6% 3% 13% 3% 6% 3% 6% 9% 25% 9% 16%
Item825 3% 3% 6% 3% 6% 6% 3% 6% 31% 6% 25%
Item826 3% 3% 9% 3% 3% 9% 9% 3% 41% 0% 16%
Item827 13% 3% 6% 0% 6% 19% 6% 6% 28% 3% 9%
Item828 3% 3% 3% 3% 3% 9% 6% 13% 22% 6% 28%
Item829 3% 3% 3% 3% 6% 13% 3% 13% 22% 3% 28%
Item830 3% 3% 9% 0% 9% 6% 3% 16% 28% 3% 19%
Item831 0% 0% 3% 6% 9% 6% 3% 6% 13% 19% 34%
Item832 0% 0% 9% 0% 6% 9% 6% 13% 28% 6% 22%
Item833 6% 3% 16% 0% 3% 13% 13% 9% 19% 13% 6%
Item834 13% 3% 9% 6% 6% 9% 16% 16% 9% 3% 9%
Item835 3% 3% 6% 9% 6% 6% 3% 13% 19% 3% 28%
Item836 3% 3% 9% 16% 3% 0% 0% 16% 25% 3% 22%
Item837 3% 6% 13% 3% 3% 22% 13% 9% 19% 3% 6%
Item838 0% 3% 9% 0% 0% 9% 3% 16% 28% 6% 25%
Item839 9% 3% 6% 0% 3% 16% 13% 13% 22% 3% 13%
Item840 3% 3% 6% 0% 0% 13% 6% 9% 19% 19% 22%
Item841 13% 3% 6% 3% 10% 16% 10% 6% 23% 0% 10%
Item901 13% 9% 3% 0% 6% 6% 13% 9% 16% 0% 25%
Item902 9% 6% 6% 3% 3% 13% 9% 16% 16% 3% 16%
Item903 9% 6% 3% 6% 3% 9% 6% 6% 16% 0% 34%
Item904 3% 3% 3% 3% 6% 6% 6% 6% 13% 9% 41%
Item905 3% 3% 0% 0% 6% 6% 6% 6% 3% 10% 55%
Item1001 0% 0% 3% 0% 3% 3% 0% 10% 19% 3% 58%
Item1002 3% 0% 3% 3% 10% 6% 3% 6% 19% 3% 42%
Item1101 23% 13% 3% 6% 0% 3% 3% 6% 13% 6% 23%
Item1102 6% 6% 6% 0% 0% 13% 6% 13% 16% 3% 29%
Item1103 23% 6% 0% 6% 13% 16% 3% 6% 6% 3% 16%
Item1104 3% 0% 6% 0% 3% 6% 0% 9% 13% 6% 53%

191
Appendix 07.04. Frequencies of scores for the categorical question in the
second round.
Y N
Item102 56% 44%
Item103 56% 44%
Item104 44% 56%
Item108 33% 67%
Item109 52% 48%
Item110 15% 85%
Item112 93% 7%
Item113 50% 50%
Item114 63% 37%
Item116 22% 78%
Item119 12% 88%
Item120 4% 96%
Item122 48% 52%
Item123 30% 70%
Item124 44% 56%
Item125 85% 15%
Item126 93% 7%
Item127 92% 8%
Item128 85% 15%
Item129 59% 41%
Item202 85% 15%
Item203 93% 7%
Item206 85% 15%
Item209 100% 0%
Item214 89% 11%
Item218 88% 12%
Item219 100% 0%
Item221 70% 30%
Item228 85% 15%
Item230 67% 33%
Item231 63% 38%
Item232 96% 4%
Item233 74% 26%
Item234 85% 15%
Item235 67% 33%
Item304 89% 11%
Item305 93% 7%
Item306 81% 19%
Item401 30% 70%
Item402 89% 11%
Item404 33% 67%
Item405 93% 7%
Item406 96% 4%
Item408 74% 26%
Item409 85% 15%
Item410 85% 15%
Item411 62% 38%
Item412 48% 52%
Item413 81% 19%
Item414 81% 19%
Item415 74% 26%
Item416 44% 56%
Item417 74% 26%
Item418 93% 7%
Item420 85% 15%
Item422 93% 7%
Item423 19% 81%
Item424 12% 88%
Item425 52% 48%
Item426 52% 48%
Item427 63% 37%
Item428 44% 56%
Item503 67% 33%
Item504 85% 15%
Item505 96% 4%
Item506 93% 7%
Item509 85% 15%
Item510 70% 30%
Item511 63% 37%
Item603 81% 19%
Item604 37% 63%
Item605 41% 59%
Item606 96% 4%
Item702 89% 11%
Item703 74% 26%
Item706 89% 11%
Item707 93% 7%
Item708 11% 89%
Item709 52% 48%
Item710 56% 44%
Item711 4% 96%
Item713 68% 32%
Item714 78% 22%
Item801 89% 11%
Item802 81% 19%
Item803 89% 11%
Item804 78% 22%
Item805 41% 59%
Item806 96% 4%
Item807 7% 93%
Item808 7% 93%

192
Item809 11% 89%
Item810 60% 40%
Item811 41% 59%
Item812 85% 15%
Item813 93% 7%
Item814 44% 56%
Item816 22% 78%
Item817 26% 74%
Item818 63% 37%
Item819 85% 15%
Item820 11% 89%
Item821 78% 22%
Item822 85% 15%
Item823 78% 22%
Item824 48% 52%
Item825 89% 11%
Item826 70% 30%
Item827 26% 74%
Item828 85% 15%
Item829 89% 11%
Item830 78% 22%
Item831 93% 7%
Item832 89% 11%
Item833 48% 52%
Item834 37% 63%
Item835 85% 15%
Item836 78% 22%
Item837 33% 67%
Item838 89% 11%
Item839 37% 63%
Item840 89% 11%
Item841 22% 78%
Item901 56% 44%
Item902 52% 48%
Item903 70% 30%
Item904 85% 15%
Item905 89% 11%
Item1001 89% 11%
Item1002 63% 37%
Item1003 59% 41%
Item1004 41% 59%
Item1005 59% 41%
Item1101 52% 48%
Item1102 58% 42%
Item1104 88% 12%
Item1105 26% 74%
Item1106 42% 58%
Item1107 41% 59%
Item1108 81% 19%
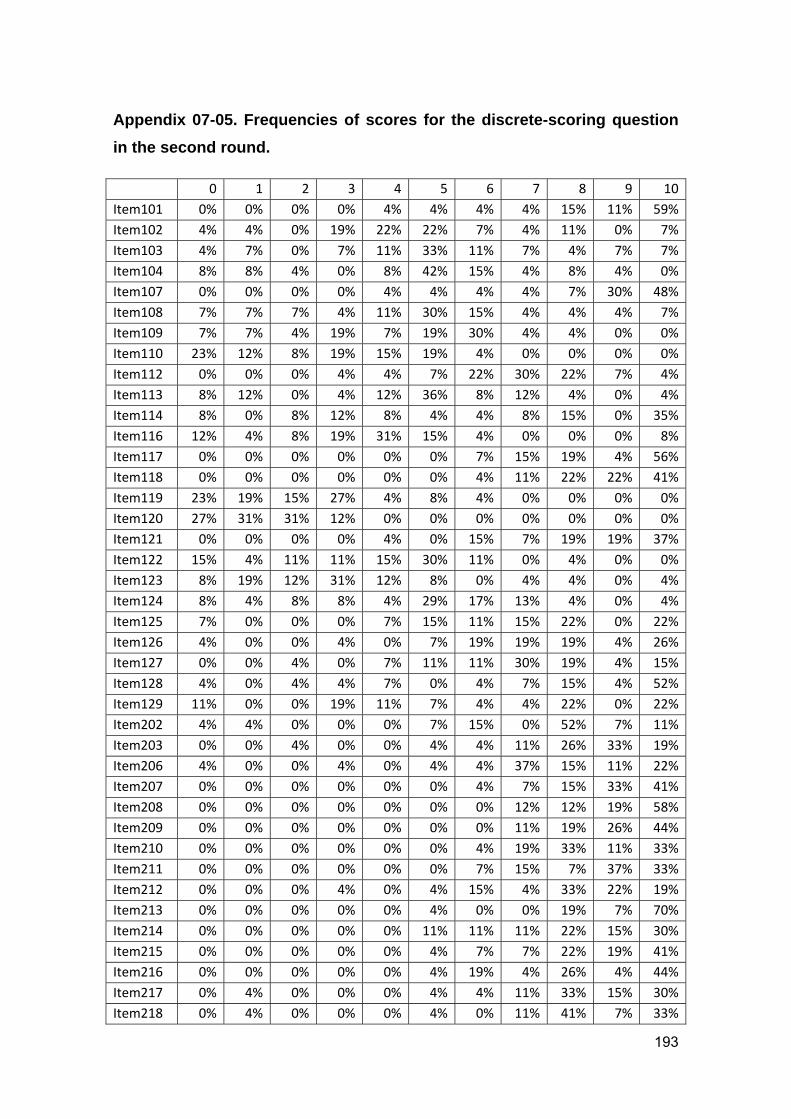
193
Appendix 07-05. Frequencies of scores for the discrete-scoring question
in the second round.
0 1 2 3 4 5 6 7 8 9 10
Item101 0% 0% 0% 0% 4% 4% 4% 4% 15% 11% 59%
Item102 4% 4% 0% 19% 22% 22% 7% 4% 11% 0% 7%
Item103 4% 7% 0% 7% 11% 33% 11% 7% 4% 7% 7%
Item104 8% 8% 4% 0% 8% 42% 15% 4% 8% 4% 0%
Item107 0% 0% 0% 0% 4% 4% 4% 4% 7% 30% 48%
Item108 7% 7% 7% 4% 11% 30% 15% 4% 4% 4% 7%
Item109 7% 7% 4% 19% 7% 19% 30% 4% 4% 0% 0%
Item110 23% 12% 8% 19% 15% 19% 4% 0% 0% 0% 0%
Item112 0% 0% 0% 4% 4% 7% 22% 30% 22% 7% 4%
Item113 8% 12% 0% 4% 12% 36% 8% 12% 4% 0% 4%
Item114 8% 0% 8% 12% 8% 4% 4% 8% 15% 0% 35%
Item116 12% 4% 8% 19% 31% 15% 4% 0% 0% 0% 8%
Item117 0% 0% 0% 0% 0% 0% 7% 15% 19% 4% 56%
Item118 0% 0% 0% 0% 0% 0% 4% 11% 22% 22% 41%
Item119 23% 19% 15% 27% 4% 8% 4% 0% 0% 0% 0%
Item120 27% 31% 31% 12% 0% 0% 0% 0% 0% 0% 0%
Item121 0% 0% 0% 0% 4% 0% 15% 7% 19% 19% 37%
Item122 15% 4% 11% 11% 15% 30% 11% 0% 4% 0% 0%
Item123 8% 19% 12% 31% 12% 8% 0% 4% 4% 0% 4%
Item124 8% 4% 8% 8% 4% 29% 17% 13% 4% 0% 4%
Item125 7% 0% 0% 0% 7% 15% 11% 15% 22% 0% 22%
Item126 4% 0% 0% 4% 0% 7% 19% 19% 19% 4% 26%
Item127 0% 0% 4% 0% 7% 11% 11% 30% 19% 4% 15%
Item128 4% 0% 4% 4% 7% 0% 4% 7% 15% 4% 52%
Item129 11% 0% 0% 19% 11% 7% 4% 4% 22% 0% 22%
Item202 4% 4% 0% 0% 0% 7% 15% 0% 52% 7% 11%
Item203 0% 0% 4% 0% 0% 4% 4% 11% 26% 33% 19%
Item206 4% 0% 0% 4% 0% 4% 4% 37% 15% 11% 22%
Item207 0% 0% 0% 0% 0% 0% 4% 7% 15% 33% 41%
Item208 0% 0% 0% 0% 0% 0% 0% 12% 12% 19% 58%
Item209 0% 0% 0% 0% 0% 0% 0% 11% 19% 26% 44%
Item210 0% 0% 0% 0% 0% 0% 4% 19% 33% 11% 33%
Item211 0% 0% 0% 0% 0% 0% 7% 15% 7% 37% 33%
Item212 0% 0% 0% 4% 0% 4% 15% 4% 33% 22% 19%
Item213 0% 0% 0% 0% 0% 4% 0% 0% 19% 7% 70%
Item214 0% 0% 0% 0% 0% 11% 11% 11% 22% 15% 30%
Item215 0% 0% 0% 0% 0% 4% 7% 7% 22% 19% 41%
Item216 0% 0% 0% 0% 0% 4% 19% 4% 26% 4% 44%
Item217 0% 4% 0% 0% 0% 4% 4% 11% 33% 15% 30%
Item218 0% 4% 0% 0% 0% 4% 0% 11% 41% 7% 33%

194
0 1 2 3 4 5 6 7 8 9 10
Item219 0% 0% 0% 0% 0% 0% 7% 15% 41% 7% 30%
Item220 0% 0% 0% 0% 0% 4% 4% 16% 20% 20% 36%
Item221 0% 0% 7% 7% 0% 7% 11% 37% 15% 11% 4%
Item222 0% 0% 0% 0% 0% 0% 7% 7% 30% 30% 26%
Item223 0% 0% 0% 0% 0% 0% 4% 0% 8% 38% 50%
Item224 0% 0% 0% 4% 0% 0% 0% 4% 12% 27% 54%
Item226 0% 0% 0% 0% 0% 7% 0% 15% 4% 19% 56%
Item227 0% 0% 0% 0% 0% 0% 4% 7% 4% 26% 59%
Item228 0% 4% 0% 0% 4% 7% 7% 7% 26% 15% 30%
Item229 0% 0% 0% 0% 0% 0% 4% 7% 7% 19% 63%
Item230 11% 4% 0% 0% 7% 4% 15% 11% 22% 11% 15%
Item231 8% 4% 4% 0% 8% 4% 4% 13% 42% 4% 8%
Item232 0% 0% 0% 0% 0% 0% 4% 4% 15% 22% 56%
Item233 0% 0% 0% 7% 4% 19% 11% 19% 22% 4% 15%
Item234 4% 4% 0% 7% 4% 15% 11% 7% 26% 7% 15%
Item235 4% 0% 4% 7% 11% 4% 0% 7% 30% 4% 30%
Item303 0% 0% 0% 0% 0% 0% 4% 4% 4% 4% 83%
Item304 0% 0% 0% 4% 0% 7% 0% 22% 26% 11% 30%
Item305 0% 0% 0% 0% 0% 4% 7% 7% 26% 26% 30%
Item306 4% 0% 4% 0% 0% 4% 0% 7% 22% 26% 33%
Item401 4% 0% 12% 8% 8% 19% 15% 8% 12% 12% 4%
Item404 11% 0% 11% 4% 7% 11% 33% 7% 7% 0% 7%
Item405 0% 0% 0% 7% 0% 7% 11% 19% 37% 7% 11%
Item406 0% 0% 0% 4% 0% 4% 11% 15% 41% 11% 15%
Item407 0% 0% 0% 0% 0% 0% 0% 4% 15% 27% 54%
Item408 0% 4% 0% 7% 4% 19% 22% 30% 4% 7% 4%
Item409 0% 0% 0% 0% 4% 19% 19% 15% 30% 11% 4%
Item410 0% 0% 0% 0% 0% 15% 19% 19% 19% 19% 11%
Item411 0% 7% 0% 0% 11% 15% 33% 19% 7% 0% 7%
Item412 7% 4% 4% 0% 15% 7% 11% 26% 22% 0% 4%
Item413 4% 0% 0% 0% 4% 4% 15% 15% 48% 4% 7%
Item414 4% 0% 0% 0% 4% 4% 7% 15% 48% 0% 19%
Item415 0% 4% 4% 4% 0% 15% 19% 37% 11% 4% 4%
Item416 4% 4% 8% 4% 12% 4% 12% 38% 8% 4% 4%
Item417 4% 4% 0% 0% 0% 15% 11% 19% 37% 0% 11%
Item418 0% 0% 0% 4% 0% 4% 7% 15% 48% 4% 19%
Item419 0% 0% 0% 4% 4% 0% 4% 8% 42% 21% 17%
Item420 0% 0% 0% 4% 0% 4% 11% 11% 44% 11% 15%
Item422 0% 0% 0% 0% 4% 7% 15% 26% 30% 4% 15%
Item423 8% 15% 12% 8% 19% 31% 4% 4% 0% 0% 0%
Item424 25% 17% 8% 8% 0% 25% 8% 4% 0% 4% 0%
Item425 11% 7% 0% 7% 11% 19% 11% 7% 11% 0% 15%
Item426 11% 11% 4% 11% 0% 30% 7% 4% 4% 7% 11%
Item427 15% 4% 4% 11% 7% 11% 11% 11% 4% 7% 15%

195
0 1 2 3 4 5 6 7 8 9 10
Item428 19% 11% 4% 4% 4% 19% 15% 15% 4% 7% 0%
Item503 7% 0% 4% 0% 11% 0% 7% 15% 37% 11% 7%
Item504 4% 0% 0% 0% 0% 7% 19% 15% 19% 19% 19%
Item505 0% 0% 0% 0% 0% 7% 4% 11% 56% 7% 15%
Item506 0% 0% 0% 4% 0% 4% 4% 11% 41% 11% 26%
Item507 0% 0% 0% 0% 0% 7% 0% 7% 11% 26% 48%
Item508 0% 0% 0% 0% 4% 4% 4% 7% 7% 30% 44%
Item509 0% 0% 4% 0% 7% 11% 4% 15% 37% 7% 15%
Item510 0% 0% 4% 4% 7% 7% 15% 44% 7% 4% 7%
Item511 0% 0% 0% 11% 19% 15% 15% 15% 19% 0% 7%
Item603 8% 0% 4% 0% 4% 0% 12% 15% 38% 4% 15%
Item604 12% 8% 4% 8% 19% 12% 19% 12% 8% 0% 0%
Item605 7% 15% 0% 4% 19% 26% 15% 11% 4% 0% 0%
Item606 0% 0% 0% 4% 0% 0% 11% 7% 15% 15% 48%
Item701 0% 0% 0% 0% 0% 0% 4% 11% 26% 15% 44%
Item702 0% 0% 4% 0% 0% 0% 4% 0% 35% 42% 15%
Item703 4% 0% 4% 0% 0% 11% 4% 11% 37% 19% 11%
Item705 0% 0% 0% 0% 0% 4% 7% 7% 44% 19% 19%
Item706 0% 4% 0% 0% 4% 4% 7% 15% 52% 7% 7%
Item707 0% 0% 4% 0% 0% 4% 4% 4% 56% 11% 19%
Item708 12% 19% 4% 4% 12% 38% 4% 4% 4% 0% 0%
Item709 7% 0% 4% 4% 15% 19% 33% 4% 7% 4% 4%
Item710 7% 4% 0% 4% 11% 33% 4% 26% 11% 0% 0%
Item711 15% 19% 8% 8% 35% 12% 0% 0% 4% 0% 0%
Item712 0% 0% 0% 0% 0% 4% 15% 8% 31% 23% 19%
Item713 0% 0% 0% 4% 7% 19% 15% 41% 11% 0% 4%
Item714 0% 0% 0% 4% 7% 11% 11% 26% 26% 7% 7%
Item801 0% 4% 0% 4% 0% 7% 15% 15% 26% 19% 11%
Item802 4% 4% 0% 0% 0% 4% 11% 11% 44% 7% 15%
Item803 0% 4% 0% 7% 0% 4% 19% 7% 30% 22% 7%
Item804 0% 4% 4% 7% 4% 0% 19% 11% 44% 0% 7%
Item805 4% 7% 4% 7% 15% 19% 15% 26% 4% 0% 0%
Item806 0% 0% 0% 0% 0% 4% 4% 11% 48% 15% 19%
Item807 12% 12% 4% 8% 19% 38% 0% 4% 0% 0% 0%
Item808 19% 12% 15% 4% 31% 19% 0% 0% 0% 0% 0%
Item809 15% 8% 12% 8% 23% 27% 0% 4% 0% 0% 4%
Item810 7% 0% 11% 0% 7% 0% 19% 33% 19% 0% 4%
Item811 11% 4% 15% 7% 0% 15% 30% 7% 7% 0% 4%
Item812 0% 0% 4% 4% 0% 4% 15% 15% 37% 15% 7%
Item813 0% 0% 4% 4% 0% 4% 7% 15% 37% 15% 15%
Item814 4% 0% 8% 0% 0% 27% 19% 12% 19% 4% 8%
Item815 0% 0% 0% 4% 0% 4% 7% 22% 37% 15% 11%
Item816 11% 0% 15% 11% 7% 19% 26% 4% 4% 0% 4%
Item817 11% 0% 4% 7% 22% 11% 30% 4% 7% 0% 4%

196
0 1 2 3 4 5 6 7 8 9 10
Item818 7% 0% 7% 0% 15% 11% 4% 26% 19% 4% 7%
Item819 4% 0% 0% 0% 7% 19% 4% 19% 37% 0% 11%
Item820 15% 0% 23% 12% 23% 19% 0% 4% 4% 0% 0%
Item821 4% 0% 15% 0% 4% 7% 0% 11% 37% 15% 7%
Item822 4% 0% 4% 4% 0% 11% 4% 11% 33% 15% 15%
Item823 8% 0% 12% 0% 8% 4% 8% 19% 38% 4% 0%
Item824 7% 0% 15% 4% 15% 7% 4% 15% 26% 7% 0%
Item825 0% 0% 4% 4% 4% 7% 15% 4% 44% 11% 7%
Item826 0% 4% 7% 0% 15% 7% 4% 15% 37% 4% 7%
Item827 12% 4% 12% 0% 15% 31% 12% 8% 8% 0% 0%
Item828 4% 0% 4% 4% 4% 4% 11% 7% 52% 4% 7%
Item829 4% 0% 4% 0% 4% 7% 15% 7% 37% 11% 11%
Item830 4% 0% 11% 0% 4% 0% 15% 15% 44% 4% 4%
Item831 0% 0% 4% 4% 0% 4% 4% 0% 30% 30% 26%
Item832 0% 0% 4% 0% 4% 4% 19% 15% 33% 15% 7%
Item833 7% 4% 11% 7% 7% 11% 19% 4% 22% 4% 4%
Item834 11% 7% 0% 4% 19% 15% 22% 7% 11% 4% 0%
Item835 4% 0% 4% 4% 7% 11% 11% 7% 44% 0% 7%
Item836 4% 0% 11% 4% 7% 7% 4% 22% 30% 0% 11%
Item837 8% 0% 12% 19% 4% 27% 19% 4% 8% 0% 0%
Item838 0% 0% 11% 0% 0% 7% 7% 22% 33% 7% 11%
Item839 11% 0% 11% 0% 4% 15% 30% 11% 11% 4% 4%
Item840 0% 0% 7% 0% 0% 11% 4% 7% 30% 22% 19%
Item841 15% 4% 4% 4% 19% 38% 8% 4% 4% 0% 0%
Item901 15% 4% 11% 4% 7% 11% 11% 19% 15% 0% 4%
Item902 4% 0% 4% 19% 11% 15% 11% 19% 11% 0% 7%
Item903 4% 4% 4% 15% 0% 7% 15% 15% 22% 0% 15%
Item904 0% 0% 0% 11% 4% 7% 15% 0% 22% 15% 26%
Item905 0% 0% 0% 0% 7% 7% 15% 0% 15% 7% 48%
Item1001 0% 0% 4% 0% 0% 4% 4% 0% 22% 11% 56%
Item1002 7% 0% 4% 0% 11% 0% 7% 7% 33% 22% 7%
Item1003 0% 4% 7% 0% 19% 7% 7% 15% 15% 7% 19%
Item1004 11% 4% 7% 0% 19% 7% 7% 15% 22% 4% 4%
Item1005 22% 4% 4% 0% 4% 4% 11% 7% 37% 4% 4%
Item1101 15% 7% 4% 0% 7% 15% 11% 26% 15% 0% 0%
Item1102 15% 4% 4% 0% 8% 4% 12% 27% 19% 0% 8%
Item1104 4% 0% 4% 0% 0% 0% 0% 0% 23% 8% 62%
Item1105 19% 8% 4% 4% 15% 15% 15% 4% 8% 0% 8%
Item1106 20% 8% 0% 4% 12% 12% 16% 0% 20% 0% 8%
Item1107 19% 8% 8% 0% 8% 15% 8% 12% 15% 0% 8%
Item1108 7% 4% 0% 7% 0% 11% 11% 26% 11% 11% 11%

197
Appendix 07.06. Frequencies of scores for the categorical question in the
third round.
Y N
Item102 55% 45%
Item103 59% 41%
Item104 31% 69%
Item108 21% 79%
Item109 52% 48%
Item113 45% 55%
Item114 86% 14%
Item116 18% 82%
Item122 31% 69%
Item123 14% 86%
Item124 34% 66%
Item129 81% 19%
Item221 85% 15%
Item230 68% 32%
Item231 71% 29%
Item233 89% 11%
Item235 85% 15%
Item236 96% 4%
Item401 24% 76%
Item404 17% 83%
Item408 89% 11%
Item411 71% 29%
Item412 36% 64%
Item415 96% 4%
Item416 32% 68%
Item417 89% 11%
Item425 57% 43%
Item426 50% 50%
Item427 68% 32%
Item428 43% 57%
Item503 83% 17%
Item510 83% 17%
Item511 66% 34%
Item604 17% 83%
Item605 21% 79%
Item703 89% 11%
Item709 52% 48%
Item710 59% 41%
Item713 79% 21%
Item714 89% 11%
Y N
Item804 83% 17%
Item805 25% 75%
Item810 72% 28%
Item811 24% 76%
Item814 38% 62%
Item816 10% 90%
Item817 10% 90%
Item818 79% 21%
Item821 93% 7%
Item823 90% 10%
Item824 38% 62%
Item826 86% 14%
Item827 14% 86%
Item830 89% 11%
Item833 38% 62%
Item834 24% 76%
Item836 86% 14%
Item837 17% 83%
Item839 14% 86%
Item841 10% 90%
Item901 59% 41%
Item902 55% 45%
Item903 86% 14%
Item1002 86% 14%
Item1003 72% 28%
Item1004 31% 69%
Item1005 57% 43%
Item1101 59% 41%
Item1102 59% 41%
Item1105 21% 79%
Item1106 21% 79%
Item1107 17% 83%

198
Appendix 07-07. Frequencies of scores for the discrete-scoring question
in the third round.
0 1 2 3 4 5 6 7 8 9 10
Item102 3% 3% 0% 7% 21% 41% 14% 7% 3% 0% 0%
Item103 7% 0% 3% 3% 7% 59% 7% 10% 3% 0% 0%
Item104 7% 0% 3% 3% 7% 59% 10% 7% 3% 0% 0%
Item108 10% 3% 10% 3% 17% 34% 3% 10% 3% 0% 3%
Item109 11% 4% 11% 11% 4% 46% 7% 7% 0% 0% 0%
Item110 15% 22% 11% 33% 11% 4% 4% 0% 0% 0% 0%
Item113 7% 3% 3% 10% 7% 48% 3% 0% 14% 0% 3%
Item114 3% 0% 7% 0% 3% 3% 0% 24% 17% 7% 34%
Item116 11% 4% 14% 14% 43% 0% 0% 7% 0% 0% 7%
Item117 0% 0% 0% 0% 0% 0% 4% 0% 14% 18% 64%
Item118 0% 0% 0% 0% 0% 0% 0% 4% 11% 46% 39%
Item119 18% 25% 39% 11% 4% 0% 0% 0% 4% 0% 0%
Item120 0% 100% 0% 0% 0% 0% 0% 0% 0% 0% 0%
Item121 0% 0% 0% 0% 0% 4% 4% 7% 4% 39% 43%
Item122 7% 3% 3% 14% 34% 24% 3% 7% 0% 0% 3%
Item123 3% 14% 14% 52% 3% 3% 0% 3% 7% 0% 0%
Item124 7% 0% 4% 21% 0% 50% 14% 4% 0% 0% 0%
Item125 7% 0% 0% 0% 3% 7% 10% 45% 14% 7% 7%
Item126 3% 0% 0% 0% 3% 3% 7% 34% 21% 14% 14%
Item127 0% 0% 0% 0% 10% 3% 0% 66% 14% 0% 7%
Item128 3% 0% 0% 3% 3% 0% 0% 10% 14% 3% 62%
Item129 7% 0% 0% 3% 7% 28% 24% 14% 17% 0% 0%
Item206 3% 0% 0% 0% 0% 3% 0% 55% 17% 10% 10%
Item210 0% 0% 0% 0% 0% 0% 0% 10% 52% 7% 31%
Item212 0% 0% 0% 3% 0% 0% 0% 7% 66% 10% 14%
Item214 0% 0% 0% 0% 0% 0% 3% 3% 45% 24% 24%
Item215 0% 0% 0% 0% 0% 0% 3% 3% 17% 45% 31%
Item216 0% 0% 0% 0% 0% 0% 7% 7% 34% 28% 24%
Item217 0% 3% 0% 0% 0% 0% 3% 3% 48% 21% 21%
Item218 0% 3% 0% 0% 0% 0% 3% 0% 59% 14% 21%
Item219 0% 0% 0% 0% 0% 0% 0% 7% 59% 17% 17%
Item220 0% 0% 0% 0% 0% 0% 3% 3% 17% 45% 31%
Item221 3% 0% 0% 0% 0% 3% 14% 41% 38% 0% 0%
Item222 0% 0% 0% 0% 0% 0% 7% 0% 18% 57% 18%
Item228 0% 0% 4% 0% 4% 4% 0% 7% 43% 14% 25%
Item230 10% 0% 3% 3% 3% 3% 0% 28% 41% 7% 0%
Item231 7% 3% 0% 7% 3% 3% 0% 14% 55% 7% 0%
Item233 0% 0% 0% 7% 0% 3% 14% 34% 34% 0% 7%

199
Item234 4% 4% 0% 4% 0% 11% 11% 46% 18% 0% 4%
Item235 0% 0% 3% 7% 0% 0% 3% 14% 48% 3% 21%
Item236 0% 0% 0% 0% 0% 0% 8% 4% 23% 19% 46%
Item304 0% 0% 0% 0% 4% 4% 4% 7% 50% 25% 7%
Item305 0% 0% 0% 0% 0% 4% 0% 14% 7% 46% 29%
Item306 4% 0% 0% 4% 0% 0% 0% 7% 0% 54% 32%
Item401 4% 0% 11% 7% 11% 36% 11% 7% 11% 4% 0%
Item404 11% 0% 7% 4% 7% 18% 43% 7% 4% 0% 0%
Item405 0% 0% 0% 7% 0% 0% 14% 11% 57% 4% 7%
Item406 0% 0% 0% 0% 4% 0% 7% 7% 75% 0% 7%
Item408 0% 0% 0% 3% 7% 3% 28% 45% 7% 0% 7%
Item409 0% 0% 0% 0% 0% 11% 14% 18% 54% 0% 4%
Item410 0% 0% 0% 0% 0% 7% 14% 36% 39% 0% 4%
Item411 3% 0% 3% 0% 3% 7% 62% 14% 7% 0% 0%
Item412 7% 0% 7% 3% 3% 3% 21% 41% 10% 0% 3%
Item413 0% 0% 0% 0% 0% 3% 10% 10% 69% 3% 3%
Item414 0% 0% 0% 0% 0% 3% 14% 10% 55% 10% 7%
Item415 0% 0% 0% 0% 0% 3% 21% 55% 17% 0% 3%
Item416 3% 0% 10% 0% 3% 14% 7% 48% 14% 0% 0%
Item417 3% 0% 3% 0% 0% 3% 10% 28% 41% 10% 0%
Item418 0% 0% 0% 0% 3% 0% 3% 14% 69% 3% 7%
Item420 0% 0% 0% 0% 3% 0% 3% 10% 62% 14% 7%
Item422 0% 0% 0% 0% 4% 4% 7% 43% 36% 4% 4%
Item423 7% 11% 7% 11% 29% 32% 0% 4% 0% 0% 0%
Item424 21% 14% 25% 14% 14% 4% 0% 7% 0% 0% 0%
Item425 11% 7% 0% 7% 14% 39% 11% 0% 7% 0% 4%
Item426 10% 7% 0% 3% 7% 45% 21% 3% 3% 0% 0%
Item427 10% 0% 3% 7% 10% 28% 28% 7% 7% 0% 0%
Item428 14% 0% 7% 3% 7% 34% 24% 3% 3% 3% 0%
Item503 0% 7% 3% 3% 0% 0% 3% 3% 69% 7% 3%
Item504 4% 0% 4% 0% 0% 4% 4% 7% 63% 4% 11%
Item506 0% 0% 0% 4% 0% 0% 4% 11% 68% 4% 11%
Item509 0% 0% 4% 0% 0% 7% 7% 7% 67% 4% 4%
Item510 0% 0% 3% 0% 7% 3% 7% 66% 10% 0% 3%
Item511 0% 0% 7% 0% 3% 17% 28% 31% 7% 0% 7%
Item603 4% 0% 0% 4% 4% 4% 0% 11% 61% 11% 4%
Item604 10% 7% 3% 7% 24% 31% 10% 3% 3% 0% 0%
Item605 7% 7% 3% 0% 28% 41% 10% 0% 0% 3% 0%
Item606 0% 0% 0% 0% 4% 0% 0% 4% 14% 25% 54%
Item701 0% 0% 0% 0% 0% 0% 0% 7% 26% 26% 41%
Item703 0% 0% 0% 4% 0% 4% 4% 7% 57% 14% 11%
Item708 10% 17% 3% 7% 17% 38% 3% 3% 0% 0% 0%
Item709 7% 0% 0% 7% 0% 34% 48% 0% 3% 0% 0%

200
Item710 7% 0% 0% 10% 7% 48% 17% 7% 3% 0% 0%
Item711 18% 11% 11% 14% 43% 4% 0% 0% 0% 0% 0%
Item712 0% 0% 0% 0% 0% 4% 14% 0% 54% 21% 7%
Item713 0% 0% 0% 3% 3% 7% 14% 62% 7% 0% 3%
Item714 0% 0% 0% 3% 0% 7% 17% 48% 17% 3% 3%
Item801 0% 3% 0% 0% 0% 10% 0% 7% 69% 7% 3%
Item802 3% 3% 0% 0% 0% 3% 3% 14% 66% 3% 3%
Item803 0% 3% 0% 3% 3% 3% 3% 7% 72% 0% 3%
Item804 0% 3% 0% 7% 0% 7% 0% 10% 66% 3% 3%
Item805 3% 7% 3% 3% 17% 17% 28% 7% 14% 0% 0%
Item807 10% 14% 7% 14% 10% 41% 3% 0% 0% 0% 0%
Item808 17% 7% 14% 17% 34% 10% 0% 0% 0% 0% 0%
Item809 14% 7% 17% 10% 31% 14% 7% 0% 0% 0% 0%
Item811 10% 7% 3% 3% 3% 24% 38% 3% 7% 0% 0%
Item812 0% 0% 3% 0% 3% 0% 7% 17% 55% 7% 7%
Item813 0% 0% 3% 0% 3% 0% 7% 7% 62% 7% 10%
Item814 3% 0% 0% 3% 0% 24% 38% 10% 10% 3% 7%
Item816 7% 4% 14% 4% 7% 29% 29% 0% 7% 0% 0%
Item817 11% 4% 4% 11% 4% 32% 25% 4% 7% 0% 0%
Item818 4% 0% 0% 11% 0% 7% 4% 56% 11% 4% 4%
Item819 4% 0% 0% 0% 4% 4% 7% 14% 57% 4% 7%
Item820 14% 0% 14% 32% 21% 14% 0% 4% 0% 0% 0%
Item821 0% 0% 4% 0% 7% 7% 11% 7% 50% 7% 7%
Item822 0% 0% 0% 0% 7% 4% 7% 11% 61% 4% 7%
Item823 0% 0% 0% 7% 4% 7% 7% 25% 43% 0% 7%
Item824 7% 0% 4% 11% 7% 11% 32% 14% 11% 0% 4%
Item825 0% 0% 0% 7% 4% 4% 7% 7% 57% 4% 11%
Item826 0% 4% 0% 7% 4% 7% 11% 32% 25% 0% 11%
Item827 11% 4% 0% 11% 7% 54% 4% 4% 4% 4% 0%
Item828 0% 0% 0% 0% 0% 11% 15% 0% 63% 4% 7%
Item829 0% 0% 0% 0% 0% 7% 15% 4% 59% 7% 7%
Item830 0% 0% 0% 4% 4% 7% 4% 7% 68% 0% 7%
Item831 0% 0% 0% 0% 4% 4% 4% 4% 21% 54% 11%
Item832 0% 0% 0% 4% 0% 4% 7% 7% 59% 7% 11%
Item833 7% 4% 4% 7% 0% 14% 36% 14% 7% 7% 0%
Item834 7% 4% 7% 0% 11% 46% 11% 4% 4% 7% 0%
Item835 0% 0% 0% 0% 4% 7% 7% 18% 57% 0% 7%
Item836 0% 0% 0% 4% 11% 4% 11% 32% 32% 0% 7%
Item837 7% 0% 7% 18% 4% 54% 7% 4% 0% 0% 0%
Item838 0% 0% 0% 0% 4% 4% 11% 21% 54% 0% 7%
Item839 11% 4% 4% 7% 4% 18% 46% 7% 0% 0% 0%
Item840 0% 0% 4% 4% 0% 0% 11% 18% 43% 11% 11%
Item841 14% 0% 4% 7% 7% 61% 4% 4% 0% 0% 0%

201
Item901 14% 3% 0% 7% 7% 21% 21% 24% 3% 0% 0%
Item902 3% 3% 3% 3% 7% 45% 21% 7% 3% 0% 3%
Item903 0% 0% 3% 3% 3% 7% 14% 28% 38% 0% 3%
Item904 0% 0% 0% 3% 7% 3% 7% 10% 34% 17% 17%
Item905 0% 0% 0% 3% 3% 0% 3% 10% 14% 34% 31%
Item1002 0% 0% 0% 3% 3% 0% 3% 7% 62% 10% 10%
Item1003 0% 0% 3% 10% 3% 7% 0% 31% 17% 21% 7%
Item1004 10% 0% 7% 3% 3% 10% 31% 10% 24% 0% 0%
Item1005 21% 3% 3% 0% 0% 3% 14% 17% 38% 0% 0%
Item1101 14% 3% 7% 3% 0% 10% 21% 31% 10% 0% 0%
Item1102 17% 7% 3% 0% 3% 0% 14% 38% 14% 3% 0%
Item1105 21% 14% 0% 10% 17% 17% 14% 3% 3% 0% 0%
Item1106 17% 7% 3% 0% 14% 34% 14% 0% 7% 0% 3%
Item1107 17% 7% 7% 3% 10% 31% 10% 7% 3% 0% 3%
Item1108 0% 3% 0% 0% 0% 10% 14% 48% 14% 3% 7%

202
1. Molloy W, Strang D, Guyatt G, Lexchin J, Bedard M, Dubois S, Russo R. Assessing the quality of drug detailing. J Clin Epidemiol. 2002 Aug;55(8):825-32.
2. Berland GK, Elliott MN, Morales LS, Algazy JI, Kravitz RL, Broder MS, Kanouse DE, Munoz JA, Puyol JA, Lara M, Watkins KE, Yang H, McGlynn EA. Health information on the Internet: accessibility, quality, and readability in English and Spanish. JAMA. 2001 May 23-30;285(20):2612-21.
3. Aronson JK. Drug interactions-information, education, and the British National Formulary. Br J Clin Pharmacol. 2004 Apr;57(4):371-2.
4. Shaughnessy AF, Slawson DC, Bennett JH. Becoming an information master: a guidebook to the medical information jungle. J Fam Pract. 1994 Nov;39(5):489-99.
5. Curley SP, Connelly DP, Rich EC. Physicians' use of medical knowledge resources: preliminary theoretical framework and findings. Med Decis Making. 1990 Oct-Dec;10(4):231-41.
6. Fernandez-Llimos F. Drug information in the community pharmacy. Pharmaceutical Care España 1999;1:90-6.
7. Greene JA, Kesselheim AS. Pharmaceutical marketing and the new social media. N Engl J Med. 2010 Nov 25;363(22):2087-9.
8. Mack J. Quality of medical information on the Internet. JAMA. 1997 Aug 27;278(8):632; author reply -3.
9. HON. The commitment to reliable health and medical information on the internet; Available from: http://www.hon.ch/HONcode/Pro/Visitor/visitor.html (accessed 9 May 2011)
10. Eysenbach G, Powell J, Kuss O, Sa ER. Empirical studies assessing the quality of health information for consumers on the world wide web: a systematic review. JAMA. 2002 May 22-29;287(20):2691-700.
11. Eysenbach G. Infodemiology: The epidemiology of (mis)information. Am J Med. 2002 Dec 15;113(9):763-5.
12. FDA. How to Evaluate Health Information on the Internet.; Available from: http://www.fda.gov/Drugs/ResourcesForYou/Consumers/BuyingUsingMedicineSafely/BuyingMedicinesOvertheInternet/ucm202863.htm (accessed 9 May 2011)
13. EFPIA. Guidelines for internet web sites available to health professionals, patients and the public in the EU.; Available from: http://www.efpia.org/Objects/2/Files/Internetguidelines.pdf (accessed 9 May 2011)
14. Narhi U, Pohjanoksa-Mantyla M, Karjalainen A, Saari JK, Wahlroos H, Airaksinen MS, Bell SJ. The DARTS tool for assessing online medicines information. Pharm World Sci. 2008 Dec;30(6):898-906.
15. Silberg WM, Lundberg GD, Musacchio RA. Assessing, controlling, and assuring the quality of medical information on the Internet: Caveant lector et viewor--Let the reader and viewer beware. JAMA. 1997 Apr 16;277(15):1244-5.
16. AGREE Next Steps Consortium 2009. The AGREE II Instrument [Electronic version]; Available from: http://www.agreetrust.org (accessed 8 Dec 2011) .
17. Ferner RE, Coleman J, Pirmohamed M, Constable SA, Rouse A. The quality of information on monitoring for haematological adverse drug reactions. Br J Clin Pharmacol. 2005 Oct;60(4):448-51.
18. Vitry AI. Comparative assessment of four drug interaction compendia. Br J Clin Pharmacol. 2007 Jun;63(6):709-14.
19. Mullen WH, Anderson IB, Kim SY, Blanc PD, Olson KR. Incorrect overdose management advice in the Physicians' Desk Reference. Ann Emerg Med. 1997 Feb;29(2):255-61.
20. Brubacher JR, Purssell R, Kent DA. Salty broth for salicylate poisoning? Adequacy of overdose management advice in the 2001 Compendium of Pharmaceuticals and Specialties. CMAJ. 2002 Oct 29;167(9):992-6.

203
21. Vidal L, Shavit M, Fraser A, Paul M, Leibovici L. Systematic comparison of four sources of drug information regarding adjustment of dose for renal function. BMJ. 2005 Jul 30;331(7511):263.
22. Reggi V, Balocco-Mattavelli R, Bonati M, Breton I, Figueras A, Jambert E, Kopp C, Montane E, Rago L, Rocchi F. Prescribing information in 26 countries: a comparative study. Eur J Clin Pharmacol. 2003 Aug;59(4):263-70.
23. Cohen JS. Adverse drug effects, compliance, and initial doses of antihypertensive drugs recommended by the Joint National Committee vs the Physicians' Desk Reference. Arch Intern Med. 2001 Mar 26;161(6):880-5.
24. Guo JJ, Wigle PR, Lammers K, Vu O. Comparison of potentially hepatotoxic drugs among major US drug compendia. Res Social Adm Pharm. 2005 Sep;1(3):460-79.
25. Willy ME, Li Z. What is prescription labeling communicating to doctors about hepatotoxic drugs? A study of FDA approved product labeling. Pharmacoepidemiol Drug Saf. 2004 Apr;13(4):201-6.
26. McKibbon KA, Fridsma DB. Effectiveness of clinician-selected electronic information resources for answering primary care physicians' information needs. J Am Med Inform Assoc. 2006 Nov-Dec;13(6):653-9.
27. Spyker DA, Harvey ED, Harvey BE, Harvey AM, Rumack BH, Peck CC, Atkinson AJ, Jr., Woosley RL, Abernethy DR, Cantilena LR. Assessment and reporting of clinical pharmacology information in drug labeling. Clin Pharmacol Ther. 2000 Mar;67(3):196-200.
28. Clauson KA, Polen HH, Marsh WA. Clinical decision support tools: performance of personal digital assistant versus online drug information databases. Pharmacotherapy. 2007 Dec;27(12):1651-8.
29. Iijima H, Kamei M, Koshimizu T, Shiragami M. Objective evaluation of generic drug information. Yakugaku Zasshi. 2004 Jun;124(6):341-7.
30. Fernandez-Llimos F, Vazquez Gomez I. Information provided by generic and brand-name pharmaceutical manufacturers in response to a request. Pharm World Sci. 2007 Dec;29(6):683-7.
31. Strang DG, Gagnon M, Molloy DW, Darzins P, Etchells E, Bedard M, Davidson W. Development of a standardized, comprehensive "ideal drug detail". Can J Clin Pharmacol. 2001 Summer;8(2):73-7.
32. Hersh WR, Crabtree MK, Hickam DH, Sacherek L, Rose L, Friedman CP. Factors associated with successful answering of clinical questions using an information retrieval system. Bull Med Libr Assoc. 2000 Oct;88(4):323-31.
33. Ferri CP, Prince M, Brayne C, Brodaty H, Fratiglioni L, Ganguli M, Hall K, Hasegawa K, Hendrie H, Huang Y, Jorm A, Mathers C, Menezes PR, Rimmer E, Scazufca M. Global prevalence of dementia: a Delphi consensus study. Lancet. 2005 Dec 17;366(9503):2112-7.
34. Kennedy HP. Enhancing Delphi research: methods and results. J Adv Nurs. 2004 Mar;45(5):504-11.
35. Keeney S, Hasson F, McKenna HP. A critical review of the Delphi technique as a research methodology for nursing. Int J Nurs Stud. 2001 Apr;38(2):195-200.
36. Hasson F, Keeney S, McKenna H. Research guidelines for the Delphi survey technique. J Adv Nurs. 2000 Oct;32(4):1008-15.
37. Goodman CM. The Delphi technique: a critique. J Adv Nurs. 1987 Nov;12(6):729-34.
38. Linstone HA, Turoff M. The Delphi Method: Techniques and Applications. [9-May-2011]; Available from: http://is.njit.edu/pubs/delphibook.
39. de Villiers MR, de Villiers PJ, Kent AP. The Delphi technique in health sciences education research. Med Teach. 2005 Nov;27(7):639-43.
40. Hsu CC SB. The Delphi technique: making sense of consensus. Practical Assessment, Research & Evaluation. 2007;12:1-8.

204
41. Jones J, Hunter D. Consensus methods for medical and health services research. BMJ. 1995 Aug 5;311(7001):376-80.
42. McKenna HP. The Delphi technique: a worthwhile research approach for nursing? J Adv Nurs. 1994 Jun;19(6):1221-5.
43. Ulschak FL. Human Resource Development: The Theory and Practice of Need Assessment Virginia Reston; 1983.
44. Ludwig B. Predicting the future: have you considered using the Delphi methodology? Journal of Extension 1997;35(5):1-4.
45. Ely JW, Osheroff JA, Ebell MH, Bergus GR, Levy BT, Chambliss ML, Evans ER. Analysis of questions asked by family doctors regarding patient care. BMJ. 1999 Aug 7;319(7206):358-61.
46. Iwanowicz SL, Marciniak MW, Zeolla MM. Obtaining and providing health information in the community pharmacy setting. Am J Pharm Educ. 2006 Jun 15;70(3):57.
47. McEntee JE, Henderson SL, Rutter PM, Rutter J, Davis HJ. Utility and value of a medicines information service provided by pharmacists: a survey of health professionals. Int J Pharm Pract. 2010 Dec;18(6):353-61.
48. Castillo P. Promoción y Publicidad de medicamentos: quo vadis? . Med Clin (Barc) 1992;99:305-9.
49. Andrews JE, Pearce KA, Ireson C, Love MM. Information-seeking behaviors of practitioners in a primary care practice-based research network (PBRN). J Med Libr Assoc. 2005 Apr;93(2):206-12.
50. Davies K, Harrison J. The information-seeking behaviour of doctors: a review of the evidence. Health Info Libr J. 2007 Jun;24(2):78-94.
51. Rahmner PB, Eiermann B, Korkmaz S, Gustafsson LL, Gruven M, Maxwell S, Eichle HG, Veg A. Physicians' reported needs of drug information at point of care in Sweden. Br J Clin Pharmacol. Jan;73(1):115-25.
52. European_Commision. A Guideline on Summary of Product Characteristics (SmPC).; Available from: http://ec.europa.eu/health/files/eudralex/vol-2/c/smpc_guideline_rev2_en.pdf (accessed 9 May 2011)
53. Fernandez-Llimos F, Loza MI. Product monographs supplied by drug manufacturers to community pharmacists in Spain. Ann Pharmacother. 2000 Mar;34(3):407.
54. Herxheimer A. Open access to industry's clinically relevant data. BMJ. 2004 Jul 10;329(7457):64-5.

Chapter 8
Concluding Remarks

206
Concluding remarks
The focus of this research was to assess the characteristics of medicines information
sources designed for healthcare professionals. For this purpose, we conducted a
series of studies aiming at five different and complementary specific objectives.
Due to the fact that scientific literature varies considerably when identifying the most
used sources of medicines information among healthcare professionals (1-5), this
research was initiated by aiming at exploring which sources of medicines information
were preferred by healthcare professionals at a global level. Additionally, we analysed
whether there were demographic or socio-economic factors associated to the selection
of specific information sources. Aiming at a global population, the most appropriate
method was to design a web-based survey, and invite a wide range of healthcare
professionals and researchers to participate in the study, trying to cover a broad
spectrum of areas of work in the healthcare sector. The response rate was
approximately 57% of countries, comprising 88% of the world’s population. The
percentage of responding countries was not equally distributed among continents, and
countries members of the ‘Organisation for Economic Co-operation and Development’
(OECD), with higher Gross Domestic Product (GDP) per capita, a higher percentage of
GDP as health expenditure and higher Human Development Index (HDI), and Healthy
Life Expectancy at birth (HALE) were significantly associated with a higher response
rate. Conversely, countries classified by the World Bank as low income countries were
the countries with a smaller response rate. Developing countries often lack the
resources to participate in costly research projects, and the use of Internet may not be
so widespread. However, for those healthcare professionals with a valid e-mail
address, participation in the study was easy, simple and free, and resource limitation
could not explain the observed low response rates. Our results showed that medicines
compendia are the leading information source among healthcare professionals. There
is a tendency to choose medicines compendia as the preferred information source in
highly developed countries and high income countries, as represented by some of the
characteristics analysed, such as OECD membership, GDP per capita, HDI and data
on health expenditure. Use of information sources was homogeneous across different
areas of work of participants. In our immediate environment, Europe, compendia were
also the preferred medicines information source, followed by information retrieved from
the Internet. It is noteworthy that Summaries of Product Characteristics (SmPCs) were
the third preferred medicines information source for healthcare professionals in Europe.
Although some authors consider that healthcare professionals are not aware of the

207
content of SmPCs or they do not even know how to access them (6, 7), the selection of
SmPCs is reasonable, because they are the official information source for healthcare
professionals in the European Union. Therefore, it was obvious that our research
should be focused on these two medicines information sources: medicines compendia
and SmPCs.
One of the potential causes for the heterogeneous selection of medicines information
sources in the world could be the differences in availability and access to national
medicines compendia. A world web survey was designed to identify which countries
publish a national compendium and the demographic and socio-economic factors that
are associated to the publication of medicines compendia. The survey investigated
which countries publish a national compendium, and whether a foreign compendium
was used in countries that did not published one. Results showed that slightly more
than 60% of the world’s population is living in countries with a national compendium.
Although initially some of the demographic and socio-economic characteristics
analysed were associated to publishing a national compendium, the subsequent
multivariate analysis showed that the only covariate associated to publishing a
compendium was being member of the OECD. It is important to highlight that the
OECD is an organization devoted to global development. There are not objective
criteria that define membership of the OECD and its mission is “to promote policies that
will improve the economic and social well-being of people around the world”.(8)
Consequently, we can conclude that the only covariate associated to publishing a
national medicines compendium is the development of a country, in the sense of
OECD membership. Besides that, our study showed that countries which reported not
having a national compendium, indicated that they used one published by a country
with significantly different socio-economic characteristics. The most cited foreign
compendium was the British National Formulary (published in the United Kingdom),
followed by the Dictionnaire Vidal (published in France). The use of these foreign
compendia may not be appropriate for two reasons: there are drugs available in
developing countries which are not marketed in countries where the compendia is
produced, and thus no information about these drugs would be available when using
compendia from developed countries.(9) Furthermore, as daily practice may differ
greatly between developed and developing countries, the information needed in
developed countries may be of no use for developing countries. For example, some
studies claim the need to include pharmacogenomic biomarker information in drug
reference books (10), which might be much appreciated in highly developed
economies, but useless in other countries with completely different needs. In order to

208
overcome this problem, the WHO ‘Expert Committee on the Use of Essential Drugs’
recommended in 1995 that the WHO should develop a medicines compendia,
designated as a ‘Model Formulary’ which would complement the WHO Model List of
Essential Drugs. The first edition of the Model Formulary was issued in August 2002.(8)
The WHO Model Formulary is intended to be a starting point for national governments
to develop their own compendia, as well as serving as an information source for
individual prescribers. The WHO considered that this Model Formulary would be a
useful resource for countries wishing to develop their own national formulary or
compendium, which should be then completed with locally useful information on
treatment of prevalent diseases, prices, distribution rules and other locally relevant
details.(8) We should highlight that this Model Formulary was not mentioned by any of
the respondents to the survey. Especially in countries lacking a national formulary, a
medicines compendia developed by WHO should be a useful source.
In our study about preferences of medicines information sources, one of the most
mentioned sources in Europe was the Summary of Product Characteristics (SmPC),
which has a differential characteristic, it is an official source approved by European
Regulatory Agencies previously to be delivered to professionals. Due to the fact that
our objective was to assess the characteristics of medicines information sources from
the perspective of the healthcare professional, it was considered highly relevant to
determine the content of clinical pharmacology information in SmPCs. To perform this
evaluation, a tool formerly used to analyse the content of clinical pharmacology
information in the US Physicians’ Desk Reference (PDR) was used.(11) This tool
included different categories of information such as mechanism of action,
pharmacodynamics, drug metabolism, pharmacokinetics and dose adjustments. To
evaluate the content in clinical pharmacology information we compared the obtained
score in the SmPCs with that from the package inserts, other official information source
designed for patients. Because package inserts aim at informing patients they were not
expected to have an extensive content in clinical pharmacology information. Our results
showed that the content of clinical pharmacology information, although more extensive
than the content of package leaflets, was clearly insufficient. Moreover, the average
score of SmPCs was very similar to the average score of the initial study performed in
the United States with a commercial source of information: the Physician’s Desk
Reference. .
We were also interested in evaluating the content of information of the SmPCs about
the use of medicines in special groups of considerable relevancy in healthcare, such as
the use of medicines in pregnancy and lactation. To carry out the study, two

209
researchers evaluated independently the content of all SmPCs of medicinal products
approved by the European Medicines Agency through a centralised procedure using an
ad hoc created form. Discrepancies were reconciliated by a third different researcher.
Percentages of agreement between the two independent researchers were
considerably high, suggesting a substantial and robust analysis. Results from the
analysis of the content showed that information about post-marketing surveillance is
sparse, although the average ‘age’ of the medicines was greater than five years.
Although the collection of toxicity data before a medicinal product is marketed is very
limited (12), safety data obtained during clinical use should help improve the
information available. (6) Information about the cross of the placental barrier by the
medicinal product or the excretion of the drug in human milk is lacking in the majority of
SmPCs. Other useful information such as management of pregnancies exposed to the
drug or influence of the drug in fertility are only present in few SmPCs. Apart from the
lack of information, there were subjects in which SmPCs clearly stated that the
information was not known (fertility, excretion in human milk, adverse reactions in
lactating neonates). Despite the lack of information, SmPCs are very restrictive in their
recommendations for use during pregnancy and lactation. Other authors have
previously argued that uncertainty about the safety of the majority of drugs may lead to
under-prescribing for pregnant women. (13) To assess the applicability of the
information, the conclusiveness of the recommendations provided in SmPCs was
evaluated. A high percentage of SmPCs contained non-conclusive statements
regarding the use of the medicinal product during pregnancy. However, for
breastfeeding, most of the statements were conclusive.
Finally, analysis of the content of in different information sources is commonly
performed by comparing the information contained in each source or by using
checklists or score lists created by the authors for the purpose of their study. The main
limitation of this last method is that it does not allow comparison among contents in
different information sources. To overcome this limitation we aimed at developing a
universal tool for the evaluation of the content of any medicines information source.
First, we aimed at defining the minimal set of items of information that should be
present in any medicines information source designed for healthcare professionals.
Subsequently, we aimed at creating a scoring tool that allows the quantitative
comparison of the content of different sources of medicines information. A total of 29 of
the recruited experts from 18 European countries completed a Delphi technique in
three rounds. From an extensive literature search an initial list containing 162 items of
information was created. The experts evaluated the items and refined the list, and after

210
three rounds consensus was achieved to define a list of 126 essential items of
information that any medicine information source should contain. Consensus was also
achieved in scoring 130 information items to develop a completeness score tool. This
tool allows the completeness of a medicine information source to be presented as a
percentage of the ideal source.

211
Future Implications
The absence of national medicines compendia in developing countries may constitute
a major public health problem. Using compendia from more developed countries may
not be the most appropriate solution for these countries. There is room for creating an
international medicines compendium, and the WHO should lead the initiative. This
medicines compendium should be a complete formulary rather than a ‘Model
Formulary’ and contain at least information about the essential list of medicines. The
content of this formulary should address the needs of developing countries, which
would constitute the potential users.
Our analyses have shown that Summaries of Product Characteristics are not a perfect
information source. Apparently, a balance between informing healthcare professionals
and protecting drug industry liability exists in the information in SmPCs. Since the
European Medicines Agency clearly states that SmPCs are ‘the basis of information for
healthcare professionals on how to use the medicinal product safely and effectively’,
not only their content but also their applicability should be revised. Bearing in mind this
objective and in order to aid healthcare professionals in clinical decision making,
SmPCs should have conclusive recommendations instead of ambiguous statements.
This becomes crucial when considering the development of electronic SmPCs, which
should interface with the electronic health records and decision support systems. If
conclusive information is important for human reasoning of healthcare professionals, it
becomes essential to interface with electronic systems that lack relational thinking.
A universal tool to assess completeness of medicines information sources allows the
content of different kinds of information sources to be compared, regardless of their
format. Due to its standard scoring system, this tool allows the completeness of
information on different medicinal products to be compared. Further and foremost, this
tool allows the completeness of medicines information sources to be evaluated and
improved during their production process.

212

213
References
1. Davies K, Harrison J. The information-seeking behaviour of doctors: a review of the evidence. Health Info Libr J. 2007 Jun;24(2):78-94.
2. Andrews JE, Pearce KA, Ireson C, Love MM. Information-seeking behaviors of practitioners in a primary care practice-based research network (PBRN). J Med Libr Assoc. 2005 Apr;93(2):206-12.
3. Westbrook JI, Gosling AS, Coiera E. Do clinicians use online evidence to support patient care? A study of 55,000 clinicians. J Am Med Inform Assoc. 2004 Mar-Apr;11(2):113-20.
4. Kendall M, Enright D. Provision of medicines information: the example of the British National Formulary. Br J Clin Pharmacol. 2012 Jun;73(6):934-8.
5. Jackson R, Baird W, Davis-Reynolds L, Smith C, Blackburn S, Allsebrook J. The information requirements and information-seeking behaviours of health and social care professionals providing care to children with health care needs: a pilot study. Health Info Libr J. 2007 Jun;24(2):95-102.
6. Savill N, Bushe CJ. A systematic review of the safety information contained within the Summaries of Product Characteristics of medications licensed in the United Kingdom for Attention Deficit Hyperactivity Disorder. how does the safety prescribing advice compare with national guidance? Child Adolesc Psychiatry Ment Health. 2012;6(1):2.
7. Rahmner PB, Eiermann B, Korkmaz S, Gustafsson LL, Gruven M, Maxwell S, Eichle HG, Veg A. Physicians' reported needs of drug information at point of care in Sweden. Br J Clin Pharmacol. Jan;73(1):115-25.
8. OECD. Organisation for Economic Co-operation and Development (OECD). [04 Sept 2011]; Available from: www.oecd.org.
9. Flores Vidotti C. Drug Information Centers in developing countries and the promotion of rational use of drugs: a viewpoint about challenges and perpectives. Intern Pharm J. 2004;18(1):21-3.
10. Frueh FW, Amur S, Mummaneni P, Epstein RS, Aubert RE, DeLuca TM, Verbrugge RR, Burckart GJ, Lesko LJ. Pharmacogenomic biomarker information in drug labels approved by the United States food and drug administration: prevalence of related drug use. Pharmacotherapy. 2008 Aug;28(8):992-8.
11. Spyker DA, Harvey ED, Harvey BE, Harvey AM, Rumack BH, Peck CC, Atkinson AJ, Jr., Woosley RL, Abernethy DR, Cantilena LR. Assessment and reporting of clinical pharmacology information in drug labeling. Clin Pharmacol Ther. 2000 Mar;67(3):196-200.
12. Lo WY, Friedman JM. Teratogenicity of recently introduced medications in human pregnancy. Obstet Gynecol. 2002 Sep;100(3):465-73.
13. Webster WS, Freeman JA. Prescription drugs and pregnancy. Expert Opin Pharmacother. 2003 Jun;4(6):949-61.


Chapter 9
Other publications resulting from this thesis


217
Aten Primaria. 2007 Apr;39(4):219
Acceso de los profesionales a los prospectos de los medicamentos
Blanca Arguello1, Fernando Fernández-Llimós2
1, Farmacia Argüello Magaz, Leon (Spain)
2. Grupo de investigación en Atención Farmacéutica, University of Granada (Spain).
Submitted:
Accepted:
Published: April 2007

218
219
Br J Clin Pharmacol. 2012 Jan;73(1):12-5
e-SPC - Delivering drug information in the 21st century: developing new
approaches to deliver drug information to prescribers
Simon Maxwell,1 Hans-Georg Eichler,2 Anna Bucsics,3 Walter E. Haefeli4,
Lars L. Gustafsson,5 on behalf of the e-SPC Consortium6
1, University of Edinburgh, Edinburgh, UK
2, European Medicines Agency, London, UK
3, Hauptverband d. Österr. Sozialversicherungsträger, Vienna, Austria
4, University of Heidelberg, Heidelberg, Germany
5, Karolinska Institute, Stockholm, Sweden
6, Bucsics A, Schoelzky A, Körbler A, Stichele RV, Ganze EV, Herholz H, Bültmann O, Haefeli
WE, Seidling HM, Czock D, Menges K, Grandia L, Bekeringh JJ, Oppenraay ML, Madsen S,
Arnesen EN, Fernandez-Llimos F, Argüello B, Gustafsson LL, Gruvén M, Korkmaz S, Eiermann
B, Veg A, Bastholm P, Godman B, Rodriguez D, Cohen P, Helldén A, Winbladh B, Maxwell S,
Gruvén M, Eichler HG, Wagner HG, Arlett P, Brassart L, Holmgren J, Montes JA, Isaksson G,
Buxton T.
Submitted: 4 January 2011
Accepted: 22 March 2011
Published: 6 April 2011

220

221

222

223