Embed Size (px)
Citation preview

Universidade de Lisboa Faculdade de Ciências
Departamento de Biologia Animal
Impact of slash-and-burn agriculture on key-species regeneration, Cusseque, Angola
Ana Filipa Piedade
DissertaçãoMestrado em Biologia da Conservação
2013

Universidade de Lisboa Faculdade de Ciências
Departamento de Biologia Animal
Impact of slash-and-burn agriculture on key-species regeneration, Cusseque, Angola
Ana Filipa Piedade
DissertaçãoMestrado em Biologia da Conservação
Orientador interno: Drª Cristina Máguas (FCUL)
Orientador externo: Drº Manfred Finckh (UH)
2013


Agradecimentos
Ao Manfred Finckh e à Cristina Máguas, por terem aceite supervisionar o meu trabalho,oferecido disponibilidade e apoio, e contribuído para que pudesse visitar um dos mais beloscontinentes do mundo.
Ao Jens, Rasmus, Cynthia, Monika, Ingo, Thomas, Andrzej, Johannes, Henrike, Zakia,Tene, Ute, Norbert, Laura, Kathrin, Daniel e a todo o grupo de trabalho em Hamburgo, peloapoio, motivação e críticas construtivas, bem como pela companhia divertida e agradável.Em especial, à Friederike, pelo espírito, amizade única, alegria de viver e presença. Pelasnossas aventuras e desventuras por terras africanas (chindeli!).
Aos meus eternos amigos e à minha família, pela constante presença, apoio e motivação.Ao Pedro, pelo amor, presença, optimismo, motivação e força interior, pelo presente e pelofuturo. Ao Cláudio, pela capacidade de raciocínio única e ajuda indispensável, pelo exemplode força interior e pela nossa amizade única. Aos meus pais, Henrique e Cândida, pelo amor,amizade, paciência e apoio, bem como por todas as oportunidades que me proporcionaram.
A todos, obrigada do fundo do coração.
3

Abstract
Thousands of people depend on the Okavango basin to support their livelihoods. Dif-ferent authors have researched about slash-and-burn agriculture, but little is known aboutits impacts on the natural vegetation of Angola. This study aimed to assess how muchtraditional communities impact the regeneration of certain woody species - relevant to theirown livelihoods - through slash-and-burn agriculture.
The study area was at Cusseque, Angola. Free-listing sessions were conducted to un-derstand how wild woody plants were prioritized by the community and 55 people parti-cipated in the exercise. Thirty people answered to semi-structured enquiries about theiragricultural practises. Slash-and-burn �elds were mapped and categorized according to theirage. Twenty-one key-species were selected from the free-listing results and their presence-absence, coverage, height and regeneration type were assessed in 21 �eld plots. Data fromnon-disturbed forest was added as a control group.
Locals identi�ed 61 di�erent woody species used for �ve purposes. Erythrophleum afri-
canum was the most mentioned and used tree. Forest patches for agriculture are usuallyburned twice, �elds are used for about 1 to 3 years, resting years do not usually exceed 3years, the main source of manure is ash and the most important crop is maize. Key-speciesregenerated in the plots across the age-�eld categories. However, di�erences in cover valueswere noted. Brachystegia spiciformis and Cryptosepalum exfoliatum ssp. pseudotaxus werethe most abundant species in all �eld categories. Vegetative regeneration was predominantand only nine out of the 21 key-species managed to reach at least 1 m height, while only sixreached at least 50 cm of perimeter.
This study suggests that slash-and-burn agriculture impacts to some extent the regene-ration of key-species. However, the lack of information regarding the key-species limited theunderstanding of regeneration dynamics. Therefore, further research in the area is criticalfor an e�cient conservation of these species.
Keywords: slash-and-burn agriculture, woody plants, key-species, traditional communi-ties, Angola
4

Resumo
Milhares de pessoas dependem directamente dos recursos naturais oferecidos pela Baciado Rio Okavango para a sua subsistência. Uma grande parte da população de Angola,Botswana e Namíbia ainda vive em condições de extrema pobreza, em especial Angoladevido à passada guerra civil. Como consequência deste con�ito armado, a agricultura desubsistência foi extremamente afectada, forçando a maioria das pessoas a viver um estilo devida nómada. Em 1985, cerca de 300 a 500 milhões de pessoas dependiam da agricultura decorte-e-queima, a grande maioria vivendo em regiões tropicais. Diversos autores investigaramos impactos da agricultura de corte-e-queima em diferentes países africanos, mas pouco aindase sabe sobre os efeitos deste tipo de agricultura de subsistência na vegetação natural deAngola. Assim, o presente estudo tem com objectivo descobrir se as comunidades tradicionaisda região do Cusseque estão a afectar a regeneração de certas espécies de plantas lenhosas- as quais são relevantes para a sua própria subsistência - através do uso de práticas deagricultura de corta-e-queima. Assim, três questões foram propostas: (1) Quais são asespécies de plantas lenhosas mais importantes para as comunidades locais, bem como os seususos?; (2) Como é que a agricultura de corta-e-queima é praticada na região do Cusseque?;(3) Em que medida as espécies-chave são afectadas pela agricultura de corte-e-queima?
A área de estudo localiza-se no núcleo de investigação do projecto TFO, em Cusseque,Angola, o qual situa-se na parte superior da Bacia de Okavango. O tipo de vegetaçãopredominante é a �oresta de miombo, a qual é essencialmente ocupada por espécies dogénero Brachystegia. O clima é tropical com estação seca, com uma precipitação anual quevaria entre os 900 e os 1100 mm por ano. As chuvas ocorrem durante os meses de Verão(Setembro e Março) e as temperaturas médias variam entre os 17 e os 30°C.
De forma a se obter uma visão mais detalhada e holística sobre o real impacto das práticasde corta-e-queima na vegetação local, foram usadas tanto uma abordagem etnobotânicacomo ecológica. Sessões de free-listing foram conduzidas para a compreensão de como é queas plantas lenhosas eram priorizadas pela comunidade, e um total de 55 pessoas (24M:31F)foram envolvidas nas sessões. As categorias de uso pré-seleccionadas foram construção,alimentação, medicina, tintas e superstição. As espécies de árvores obtidas foram registadasde acordo com a ordem em que foram mencionadas, i.e. espécies mencionadas em primeirolugar foram associadas a um maior nível de importância. Inquéritos semi-estruturados foramtambém preparados de forma a aprofundar o conhecimento sobre as práticas de agriculturade corta-e-queima naquela área de estudo especí�ca. Trinta pessoas foram entrevistadasindividualmente, com um sex ratio de 17M:13F.
Campos de agricultura de corta-e-queima foram mapeados e categorizados de acordocom as suas idades, resultando em três grupos diferentes: recente, médio e antigo. Recente
5
diz respeito a todos os campos que foram cortados e queimados recentemente, i.e., entre2011 e 2010, e que ainda estão em uso. Médio inclui todos os campos que foram cortados equeimados em 2009 e 2008 e que ainda estão em uso pelas populações locais. Finalmente,antigo inclui campos que já foram cortados, queimados e usados no passado, mas queestão actualmente abandonados pelas comunidades locais. Sete dos inicialmente mapeadoscampos de agricultura foram escolhidos para cada uma das categorias, resultando em umtotal de 21 campos independentes. A informação referente à idades dos campos foi obtidaatravés da ajuda do assistente de campo local.
Vinte e uma espécies-chave (i.e. as espécies lenhosas mais relevantes para as comu-nidades, baseadas nas categorias de uso pré-estabelecidas) foram seleccionadas a partir dosresultados da free-listing. Em cada campo de agricultura de corta-e-queima, um plot de 50x 20 m foi colocado sobre a vegetação, no qual se incluiu um outro plot de 10 x 10 m. Noquadrado de 10 x 10 m, a presença-ausência (i.e. número de espécies-chave encontradasno plot) e a cobertura das espécies-chave foram anotadas. Adicionalmente, para indivíduospertencentes à lista de espécies-chave com mais de um metro de altura, a altura total e otipo de regeneração que apresentavam (vegetativa ou por semente) foram anotados. No plotde 50 x 20 m, árvores inteiras, com pelo menos 50 cm de perímetro, e pertencentes à lista deespécies-chave, tiveram a sua altura total medida. Mais tarde, dados obtidos em �oresta nãoperturbada por práticas de agricultura foram adicionados como grupo de controlo, cortesiade Rasmus Revermann.
As comunidades locais identi�caram 61 plantas usadas em pelo menos um dos cincousos pré-estabelecidos. Erythrophleum africanum foi a espécies mais mencionada e usadapelos locais. De acordo com as descobertas deste estudo para a região em questão, asáreas �orestais escolhidas para agricultura são queimadas duas vezes, os campos são usadosdurante cerca de um a três anos e o repouso das terras não costuma ultrapassar os trêsanos, sugerindo alguma intensidade de fogo e um período de repouso curto, o último tendojá sido diversas vezes citado por outros autores como uma das principais razões para a nãosustentabilidade destas práticas agrícolas. As espécies-chave foram encontradas a regenerarnos plots ao longo das categorias de campo, no entanto, os valores de cobertura variaram.Os plots mais antigos tiveram valores baixos em relação ao que era expectável. Quatro dossete campos antigos foram encontrados cobertos de fetos, Pteridium aquilinum, espécie estaque já foi diversas vezes relacionada com o atraso na regeneração de �orestas, afectando ariqueza especí�ca e a abundância de árvores e arbustos. Brachystegia spiciformis e Cryp-
tosepalum exfoliatum ssp. pseudotaxus foram as duas espécies-chave mais abundantes nasquatro categorias de campo (incluindo no grupo de controlo). A regeneração vegetativa foiencontrada como sendo predominante em relação à regeneração por semente, em especialnos plots da categoria recente. O fogo já foi anteriormente conectado à morte de sementesna superfície de solos, podendo ser esta a razão para a baixa regeneração por sementes nestacategoria de campo. Mais espécies-chave atingiram maiores alturas nos campos mais anti-gos, em comparação com os campos médios e recentes. Esta diferença foi mais acentuadanos plots de 10 x 10 m, pois a grande maioria das árvores tinha sido cortada e, por isso, aregeneração vegetativa era predominante. Somente nove indivíduos das iniciais 21 espécies-chave conseguiram atingir um metro de altura. De forma semelhante, somente indivíduosde seis espécies-chave foram identi�cadas como tendo um perímetro de pelo menos 50 cm.
6

Os resultados deste estudo sugerem que a agricultura de corte-e-queima afecta a regen-eração das espécies-chave. No entanto, a falta de informação sobre estas espécies limitoua compreensão mais profunda sobre a dinâmica de regeneração. Desta forma, mais estu-dos botânicos sobre as espécies em questão são essenciais, de forma a se colmatar estafalta de conhecimento. Este estudo contribuiu igualmente para uma melhor compreensãosobre as práticas de agricultura de corta e queima na área, bem como as particularidadesassociadas à mesma. A informação obtida será certamente relevante para suportar futurosestudos na área relacionados com este tipo de agricultura e os seus impactos na vegetaçãonatural. Adicionalmente, os resultados obtidos relacionados com o conhecimento local sobreas plantas nativas destacam a importância de documentar o quanto antes o conhecimentodas comunidades tradicionais da área do Cusseque, antes que o mesmo seja perdido parasempre.
Palavras-chave: agricultura de cortar-e-queimar, plantas lenhosas, espécies-chave, co-munidades tradicionais, Angola
7

Contents
List of Figures 10
List of Tables 12
1 Introduction 131.1 Introduction . . . . . . . . . . . . . . . . . . . . . . . . . . . . . . . . . . 131.2 Research Aim . . . . . . . . . . . . . . . . . . . . . . . . . . . . . . . . . 15
2 Methods 162.1 Study Area . . . . . . . . . . . . . . . . . . . . . . . . . . . . . . . . . . . 162.2 Data Collection . . . . . . . . . . . . . . . . . . . . . . . . . . . . . . . . 162.3 Data Analysis . . . . . . . . . . . . . . . . . . . . . . . . . . . . . . . . . 23
3 Results 253.1 Free-listing and Key-Species . . . . . . . . . . . . . . . . . . . . . . . . . . 253.2 Slash-and-Burn Enquiries . . . . . . . . . . . . . . . . . . . . . . . . . . . 253.3 Field . . . . . . . . . . . . . . . . . . . . . . . . . . . . . . . . . . . . . . 33
4 Discussion 39
5 Conclusions and Final Considerations 43
Bibliography 44
A 48
9

List of Figures
1.1 Patch of forest after slash and burn (Cusseque, Angola) . . . . . . . . . . . . . 14
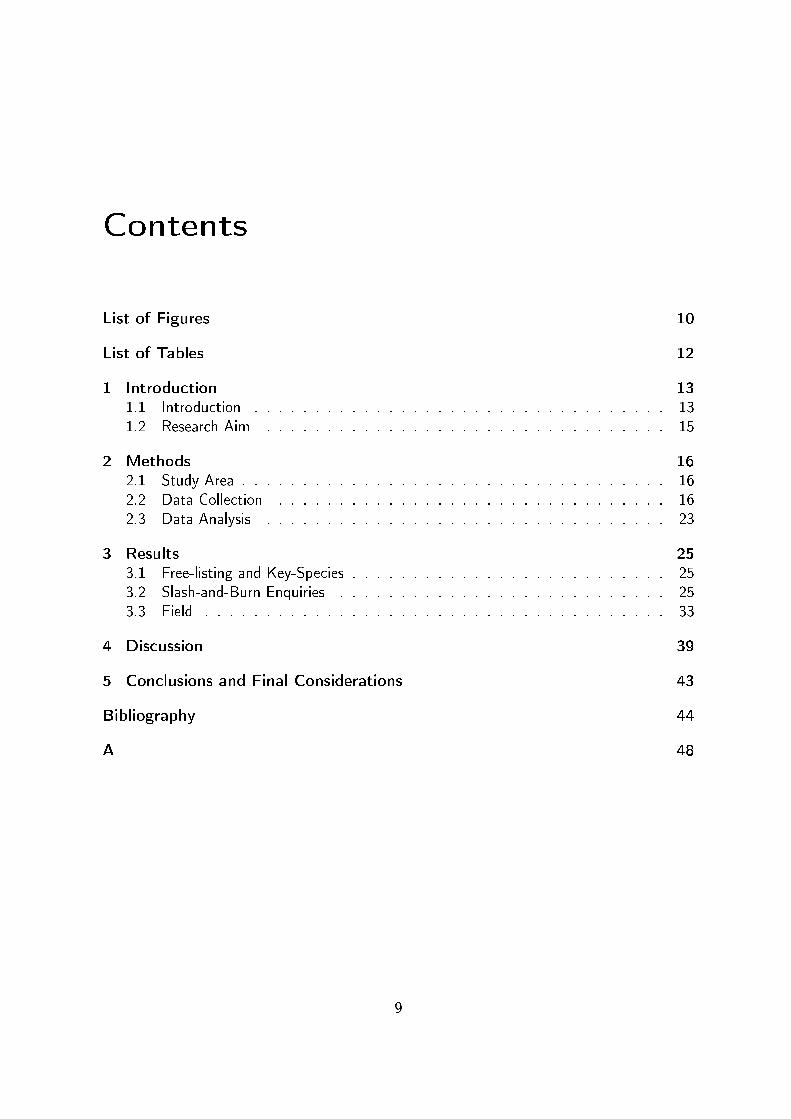
2.1 Position of Angola on the African continent, Angolan provincial capitals, majorcities and core site position . . . . . . . . . . . . . . . . . . . . . . . . . . . . 17
2.2 Okavango basin along Angola, Namibia and Botswana . . . . . . . . . . . . . . 172.3 Biomes of Angola, including the Zambezian biome . . . . . . . . . . . . . . . . 182.4 Monthly rainfall and mean temperatures for the Bié province . . . . . . . . . . 182.5 Pictures representing each �eld category . . . . . . . . . . . . . . . . . . . . . 202.6 Location of the �elds and villages . . . . . . . . . . . . . . . . . . . . . . . . . 212.7 Sketch of the vegetation plot design . . . . . . . . . . . . . . . . . . . . . . . 222.8 Example of vegetative regeneration from the top of the stump after slashing at
around waist height . . . . . . . . . . . . . . . . . . . . . . . . . . . . . . . . 22
3.1 Burning the piled branches . . . . . . . . . . . . . . . . . . . . . . . . . . . . 283.2 Main slashing, burning and cropping months . . . . . . . . . . . . . . . . . . . 283.3 Usual number of cropping years in a slash-and-burn �eld before moving out to a
new forest patch . . . . . . . . . . . . . . . . . . . . . . . . . . . . . . . . . . 303.4 Main sources of manure used by local people . . . . . . . . . . . . . . . . . . . 313.5 Actions taken towards infertility of slash-and-burn �elds . . . . . . . . . . . . . 313.6 Ten most referred crops by interviewees . . . . . . . . . . . . . . . . . . . . . . 323.7 PCO analysis for key-species composition . . . . . . . . . . . . . . . . . . . . . 333.8 Presence-absence and coverage of key-species in the four �eld categories . . . . 363.9 Key-species' presence-absence in each �eld category and their mean abundance . 363.10 Barchart with the main regeneration types inside each �eld category . . . . . . . 373.11 Height and abundance of selected key-species in the di�erent �eld-age categories
(10 x 10 m plots) . . . . . . . . . . . . . . . . . . . . . . . . . . . . . . . . . 383.12 Height and abundance of selected key-species in the di�erent �eld-age categories
(50 x 20 m plots) . . . . . . . . . . . . . . . . . . . . . . . . . . . . . . . . . 38
4.1 Fallow covered with ferns (Pteridium aquilinum) . . . . . . . . . . . . . . . . . 40
A.1 Questions of the semi-structured enquiry (original Portuguese version) . . . . . . 49A.2 Questions of the semi-structured enquiry (translated English version) . . . . . . 50A.3 Age of the participants of the free-listing exercise . . . . . . . . . . . . . . . . . 51A.4 Main job occupations of the participants of the free-listing exercise . . . . . . . 51A.5 Age of the interviewees of the slash-and-burn enquiries . . . . . . . . . . . . . . 52
10

A.6 Main job occupations of the interviewees of the slash-and-burn enquiries . . . . 52A.7 Utmost number of cropping years before moving out to a new �eld . . . . . . . 53A.8 Main sources of manure taking into consideration the position of each answer in
the lists given by the interviewees . . . . . . . . . . . . . . . . . . . . . . . . . 53A.9 Crops which were mentioned more often in the �rst position of the lists given by
the interviewees . . . . . . . . . . . . . . . . . . . . . . . . . . . . . . . . . . 54A.10 Crops which were mentioned more often on each position of the lists given by
the interviewees . . . . . . . . . . . . . . . . . . . . . . . . . . . . . . . . . . 54
11

List of Tables
2.1 Age of the �elds of the three main �eld categories . . . . . . . . . . . . . . . . 202.2 Key-species' family, scienti�c name and Chokwe name . . . . . . . . . . . . . . 23
3.1 Key-species uses given by local people in the Cusseque area with use categories . 263.2 Key-species uses given by local people in the Cusseque area with sum of use
categories and total mentioned times . . . . . . . . . . . . . . . . . . . . . . . 263.3 Main steps taken for the preparation of the �elds for cropping . . . . . . . . . . 273.4 Stated reasons for burning the wood after slashing it . . . . . . . . . . . . . . . 293.5 Agricultural activities following slash and burn . . . . . . . . . . . . . . . . . . 293.6 Answers regarding how slash-and-burn �elds are usually exploited by the locals . 303.7 Answers regarding how slash-and-burn �elds are usually exploited by the locals:
Other answers . . . . . . . . . . . . . . . . . . . . . . . . . . . . . . . . . . . 303.8 ANOSIM analysis of �eld categories with regard to key-species composition (r
values) . . . . . . . . . . . . . . . . . . . . . . . . . . . . . . . . . . . . . . . 333.9 Key-species which contributed the most to the dissimilarities between �eld cat-
egories in terms of species composition . . . . . . . . . . . . . . . . . . . . . . 343.10 Kruskal-Wallis test comparing key-species' coverage between the di�erent �eld
categories . . . . . . . . . . . . . . . . . . . . . . . . . . . . . . . . . . . . . 343.11 Key-species which contributed the most to the dissimilarities between �eld cat-
egories in terms of coverage . . . . . . . . . . . . . . . . . . . . . . . . . . . . 35
A.1 GPS coordinates of used slash-and-burn �elds and non-disturbed forest locations(control group) . . . . . . . . . . . . . . . . . . . . . . . . . . . . . . . . . . . 55
A.2 ANOSIM analysis on species composition with Bonferroni corrected p values . . 56
12

Chapter 1
Introduction
1.1 Introduction
The Okavango river has its source in the rainy highlands of Angola and is one of thelargest perennial rivers in Southern Africa, terminating in the world's largest Ramsar site, theOkavango Delta in Botswana [1], designated as the country's �rst Wetland of InternationalImportance. It comprises the Cuito, Cubango and Okavango subcatchments and its activepart that supplies almost all water to the river is wholly located in south-central Angola,comprising about 112,000 km2 [2].
Only recently the basin is coming under land use pressure as a result of economic changein the basin countries, i.e. Angola, Namibia and Botswana [2], hence still keeping muchof its natural vegetation. About 600,000 people depend on the Okavango Basin, 58% ofthem living in the basin area of Angola [2]. Thus, the relative highest population densitiesare found in the upper Cubango catchment in Angola, nevertheless with a low absolutepopulation density since people living in the basin area of Angola represent less than 3% ofthe total population of this country.
A great part of the population of Angola, Botswana and Namibia still live in extremepoverty, particularly in Angola due to the past civil war [2]. Due to this armed con�ict, whichstarted in 1975 and only ended in 2002, agriculture was heavily a�ected [3] and, in 1990,the use of mines as well as bombers almost completely collapsed farming practises. In theBié province, the con�icts were particularly harsh, heavily a�ecting subsistence agricultureand forcing a nomadic way of life to most of the people. Angola has more than 20 millioninhabitants, from which about 67% lives in poverty [2]. In 2010, it was ranked 146th out of187 countries in terms of human development [3] and it is estimated that about 40% of thepeople are undernourished [3].
Due to this high incidence of poverty in the basin, the majority of people depend onnatural resources freely available from the river and surrounding areas to support their liveli-hoods [2]. Tropical regions are rich in animal and plant biodiversity [4], however, they arealso more prone to high biodiversity losses [5] [6]. In fact, between 1970 and 2008, thetropical terrestrial biodiversity index showed a decline of around 45%, while the Afrotropicalindex declined by 38% [7]. Tropical deforestation related to land use practises is thought tobe one of the main key drivers of tropical biodiversity loss [8] [9].
13

According to Kgathi et al [2], more people are dependent on farming in Angola thanin other parts of the basin, with an estimation of 60,000 farmers involved in small scalearable farming. Only 5% of the households have access to cattle in the Angolan basin [10].Slash-and-burn agriculture, a type of shifting cultivation, is an old and common farmingpractise [4]. Variations of this type of cultivation have been used for centuries [4] and, in1996, Brady [4] quoted a FAO report of 1985 which stated that between 300 and 500 millionpeople depended on slash-and-burn agriculture, the great majority living in tropical regions.The general concept of this kind of agriculture is simple. A certain area of forest is slashedand burned down, so that nutrients accumulated into the biomass are released into the soil(Figure 1.1). Following this procedure, the patch is used for cultivation until the soil losesfertility and the need to slash and burn down another forest area emerges, restarting thecycle. The fallow is then left alone and so the ecological succession is resumed. Trees,shrubs and grasses grow up and accumulate nutrients in their biomass, and organic matterreturns to the soil [4].
Figure 1.1: Patch of forest after slash and burn (Cusseque, Angola)
Traditional slash-and-burn agriculture used to be sustainable since it was practised on asmall or local scale and fallow periods were longer [4] [11] [12]. However, due to the increaseof population densities in the last decades [4], a higher pressure on the land slowly reducedfallow periods, a�ecting plant regeneration and average biomass on the land [12].
Most carbon is stored in tropical forests [7]. Above-ground biomass stores are about247 GtC (gigatonnes of carbon) in tropical forests, from which 25% is in the Africa, hencehighlighting their importance in climate stabilization [7]. However, the presence of �re in
14

slash-and-burn agriculture naturally releases this carbon into the atmosphere, contributingto climate change [13]. Slash-and-burn agriculture is also connected to deforestation, rapidsoil and land degradation, poor crop yields, biodiversity losses, changes in water in�ltrationrates and run-o� rates of the soil [11] [12] [13] [14]. Due to the past civil war, scienti�cresearch was very a�ected and thus there is still a big knowledge gap about the impact ofslash-and-burn agriculture in the forests of Angola.
1.2 Research Aim
The aim of this study was to assess if the practise of slash-and-burn agriculture by thelocal communities in the Cusseque area impacts the regeneration of a selected group ofwoody key-species, which are particularly relevant to their own livelihoods. For this, bothethnobotanical and ecological approaches were used in order to obtain a more holistic anddetailed vision of the real impact of this practice on the local vegetation.
The main hypothesis is that the practise of slash-and-burn agriculture impacts the regen-eration of this selected group of woody key-species. Therefore, the main research questionsare the following:
1) Which woody species are most important for the local communities and what are theyused for?
2) How is slash-and-burn agriculture practised in the Cusseque area?3) How are key-species a�ected by slash-and-burn agriculture?
The present study is inserted in the context of the TFO-Project [15].
15

Chapter 2
Methods
2.1 Study Area
The study area was the research core site of TFO's research project at Cusseque, Angola(Figure 2.1), in the upper part of the Okavango basin (Figure 2.2) (northwest core sitecoordinates: S13°40'45.35� E16°56'32.25�; southeast core site coordinates: S13°43'22.43�E17°07'39.09�). This included four small villages at both sides of the Cusseque river, about40 km south-east of Chitembo, in the Bié province of Angola. Bié has about 1.2 millionpeople of 19 di�erent ethnicities [3] and, in 2011, the municipality of Chitembo comprisedalone about 99,745 inhabitants [3]. The four villages at the core site are Caololo, Sovi,Cusseque (it has the same name as the study area) and Calomba. The population of thesevillages is mainly Chokwe and most people know how to speak Portuguese.
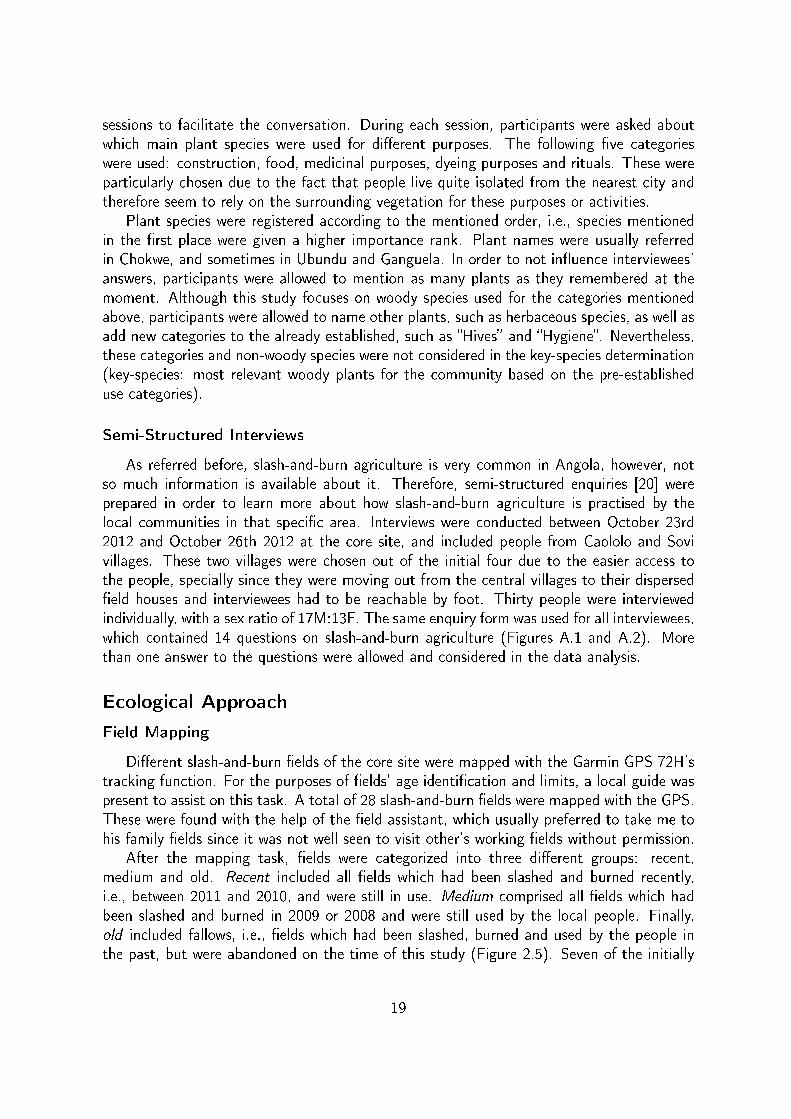
Cusseque, as well as a great part of Bié, is composed by dense Brachystegia miomboforests with open valleys and �oodplains, which constitutes the Zambezian biome [16] (Figure2.3). This biome covers about 80% of the national territory with miombo forests occupying47% of the country [17]. Cusseque has tropical summer rainfall climate with an annual totalprecipitation ranging between 900 and 1100 mm per year [3]. Rainfalls occur during thesummer months (September to March) and monthly mean temperatures range between 17and 30°C [3] (Figure 2.4).
2.2 Data Collection
Ethnobotanical Approach
Free-Listing Sessions
Due to the fact that traditional communities still live essentially o� the land, the free-listing method [18] was used to understand how wild woody plants were categorized andprioritized by the community of the core site. For this, informants were asked to list im-portant plants regarding pre-selected uses. Free-listing sessions were conducted betweenOctober 12th 2012 and October 20th 2012 and the four villages were included: Caololo,Sovi, Cusseque and Calomba. A total of 7 free-listing sessions were held. Due to the di�-culty of having individual and private sessions with the participants, group free-listings were
16
Figure 2.1: Position of Angola on the African continent, Angolan provincial capitals andmajor cities. Core-site's relative position marked in red (dot) [19]
Figure 2.2: Okavango basin along Angola, Namibia and Botswana. The core site is about40 km south-east of Chitembo [15]
17
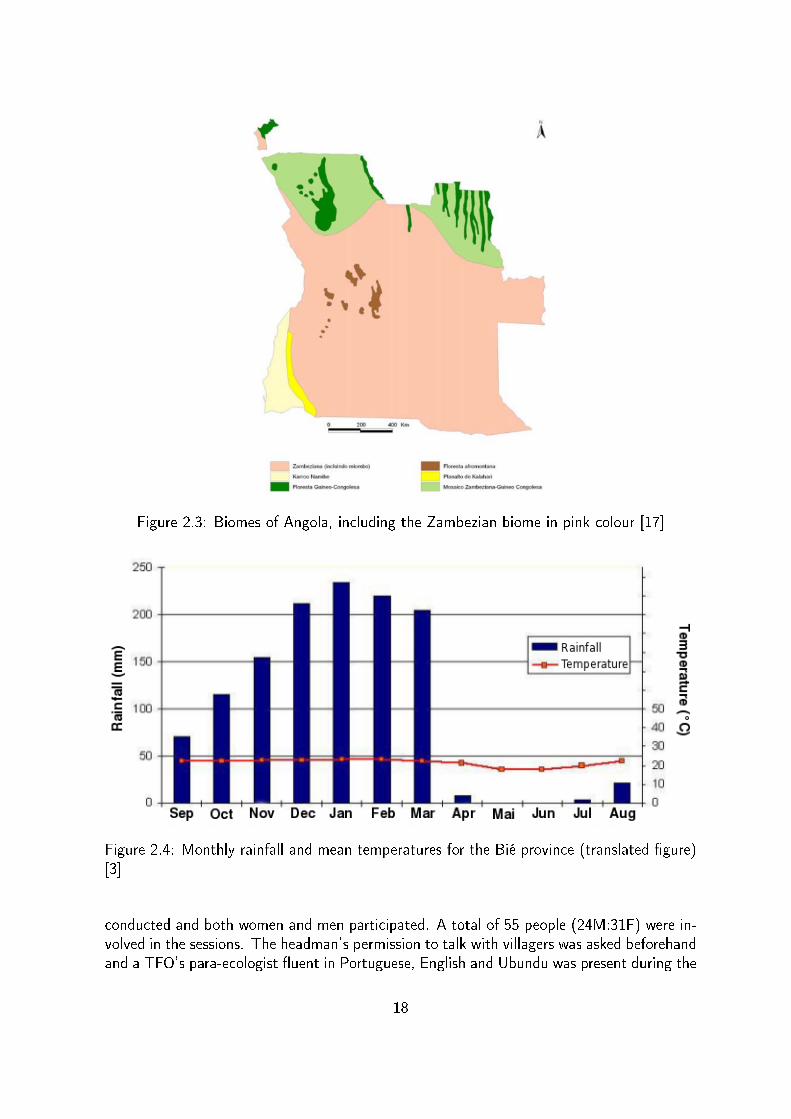
Figure 2.3: Biomes of Angola, including the Zambezian biome in pink colour [17]
Figure 2.4: Monthly rainfall and mean temperatures for the Bié province (translated �gure)[3]
conducted and both women and men participated. A total of 55 people (24M:31F) were in-volved in the sessions. The headman's permission to talk with villagers was asked beforehandand a TFO's para-ecologist �uent in Portuguese, English and Ubundu was present during the
18
sessions to facilitate the conversation. During each session, participants were asked aboutwhich main plant species were used for di�erent purposes. The following �ve categorieswere used: construction, food, medicinal purposes, dyeing purposes and rituals. These wereparticularly chosen due to the fact that people live quite isolated from the nearest city andtherefore seem to rely on the surrounding vegetation for these purposes or activities.
Plant species were registered according to the mentioned order, i.e., species mentionedin the �rst place were given a higher importance rank. Plant names were usually referredin Chokwe, and sometimes in Ubundu and Ganguela. In order to not in�uence interviewees'answers, participants were allowed to mention as many plants as they remembered at themoment. Although this study focuses on woody species used for the categories mentionedabove, participants were allowed to name other plants, such as herbaceous species, as well asadd new categories to the already established, such as �Hives� and �Hygiene�. Nevertheless,these categories and non-woody species were not considered in the key-species determination(key-species: most relevant woody plants for the community based on the pre-establisheduse categories).
Semi-Structured Interviews
As referred before, slash-and-burn agriculture is very common in Angola, however, notso much information is available about it. Therefore, semi-structured enquiries [20] wereprepared in order to learn more about how slash-and-burn agriculture is practised by thelocal communities in that speci�c area. Interviews were conducted between October 23rd2012 and October 26th 2012 at the core site, and included people from Caololo and Sovivillages. These two villages were chosen out of the initial four due to the easier access tothe people, specially since they were moving out from the central villages to their dispersed�eld houses and interviewees had to be reachable by foot. Thirty people were interviewedindividually, with a sex ratio of 17M:13F. The same enquiry form was used for all interviewees,which contained 14 questions on slash-and-burn agriculture (Figures A.1 and A.2). Morethan one answer to the questions were allowed and considered in the data analysis.
Ecological Approach
Field Mapping
Di�erent slash-and-burn �elds of the core site were mapped with the Garmin GPS 72H'stracking function. For the purposes of �elds' age identi�cation and limits, a local guide waspresent to assist on this task. A total of 28 slash-and-burn �elds were mapped with the GPS.These were found with the help of the �eld assistant, which usually preferred to take me tohis family �elds since it was not well seen to visit other's working �elds without permission.
After the mapping task, �elds were categorized into three di�erent groups: recent,medium and old. Recent included all �elds which had been slashed and burned recently,i.e., between 2011 and 2010, and were still in use. Medium comprised all �elds which hadbeen slashed and burned in 2009 or 2008 and were still used by the local people. Finally,old included fallows, i.e., �elds which had been slashed, burned and used by the people inthe past, but were abandoned on the time of this study (Figure 2.5). Seven of the initially
19

mapped slash-and-burn �elds were chosen per category, resulting in a total of 21 independent�elds. Fields were chosen according to their age since the slash-and-burn event, and thisinformation was obtained from the local �eld assistant. The old category was the only onewhich contained a greater �eld age range, while the two others were more balanced (Table2.1). Landsat Satellite Imagery was used to con�rm the real age of each �eld (resolution:30 x 30 m).
Figure 2.5: Pictures representing each �eld category. The three photos below (c) help toshow the variability found between di�erent old �elds. Legend: a - Recent; b - Medium; c -Old; x - Control
Table 2.1: Age of the �elds of the three main �eld categories. (*) �1900's� refers to a �eldwhich was slashed and burned before 2000. These were fallows and local people were notsure about their exact age.
Old Medium RecentPlot 1 1900's* 2008 2010Plot 2 1900's* 2008 2010Plot 3 2003 2009 2010Plot 4 2003 2009 2011Plot 5 2005 2009 2011Plot 6 2006 2009 2011Plot 7 2006 2009 2011
Seven extra �elds (from the original 28 mapped sites) were excluded mainly for tworeasons. The �rst was due to the fact that the �eld assistant got confused about some ofthe �elds' ages, hence jeopardizing some of the categories which required a new organization.
20

The second reason was due to the limited time in the core site, which only allowed me towork on seven �elds per category.
Later on, a control category was added to the previous three groups, which containedplots from �elds in non-disturbed forest of the core site (Figure 2.5). A total of 13 controlplots were added (nine plots from May 2011, two plots from November 2011 and two plotsfrom April 2012), data courtesy of Rasmus Revermann (Figure 2.6 and Table A.1).
Figure 2.6: Location of the �elds and villages. The blue frame represents the limits of thecore site. Legend: Dark green markers - control plots; Light green markers - old plots; Yellowmarkers - medium plots; Red markers - recent plots; Yellow houses - villages
Plots
Slash-and-burn �elds' assessment was conducted between November 14th 2012 andNovember 20th 2012. On each slash-and-burn �eld, a 50 x 20 m vegetation plot wasdone, in which a 10 x 10 m plot was included (Figure 2.7). On the 10 x 10 m square,key-species presence-absence (i.e. nº of key-species found on the plots) and their coveragewere assessed. The later was visually assessed and estimated in percentage. Additionally, forkey-species individuals with more than 1 meter high, their total height was estimated andregeneration type (vegetative or seed regeneration) noted. Vegetative regeneration usuallyhappened from the top of the slashed trunks and therefore height measure included both theold trunk (mostly cut at around waist height) as well as the new branches (Figure 2.8). Onthe 50 x 20 m plot, non-slashed key-species trees with more than 50 cm perimeter had theirtotal height measured with Haglöf Vertex IV Hypsometer.
21
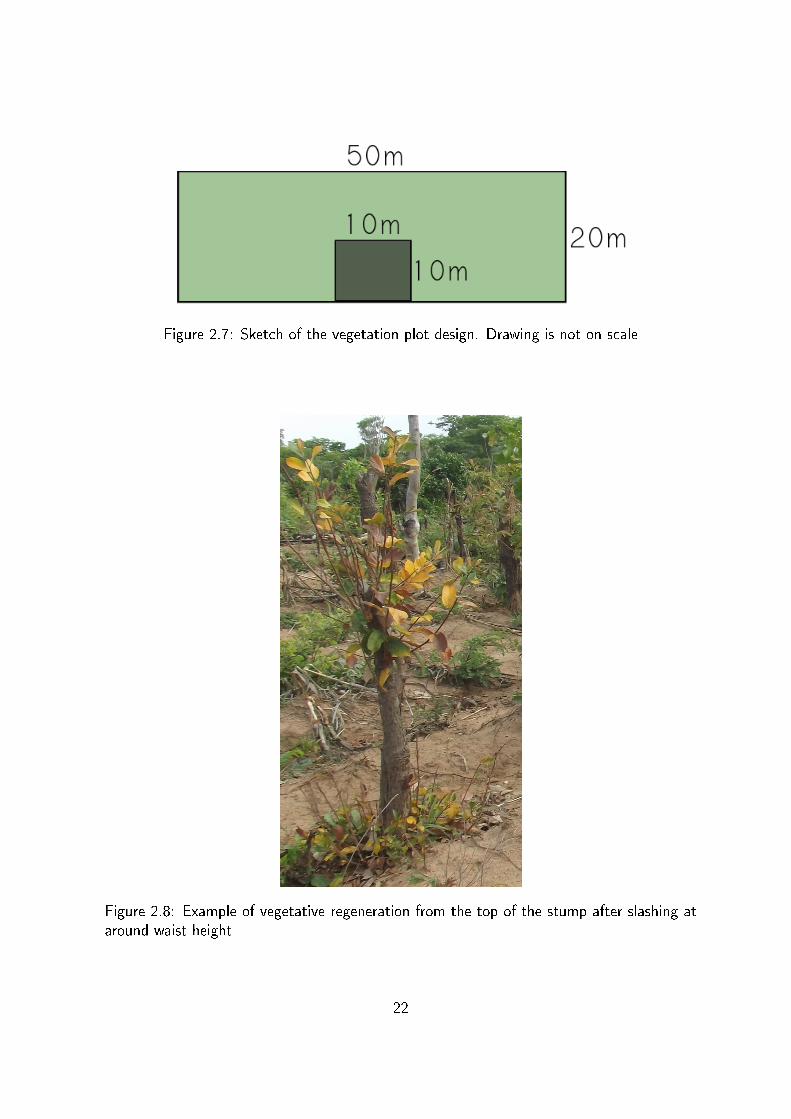
Figure 2.7: Sketch of the vegetation plot design. Drawing is not on scale
Figure 2.8: Example of vegetative regeneration from the top of the stump after slashing ataround waist height
22

2.3 Data Analysis
In order to determine the key-species (i.e. the most relevant woody plants for thecommunity based on the pre-established use categories) through the free-listings, plant nameswere organized in a list and sorted out according to the number of times they were mentionedin total. Then, plants mentioned at least 5 times were chosen, resulting in a total of 21 woodykey-species (Table 2.2). Microsoft Excel 2010 was used for this key-species determination.
Table 2.2: Key-species' family, scienti�c name and Chokwe name. FNR: collection numberof a specimen collected as reference
Family Scienti�c name Chokwe nameAnisophylleaceae Anisophyllea boehmii Engl. MufungoChrysobalanaceae Parinari curatellifolia Planch. ex Benth. MutongoCombretaceae Terminalia brachystemma Welw. ex Hiern MueyaEbenaceae Diospyrus chamaethamnus Dinter ex Mildbr. MujongoloEbenaceae Diospyros pseudomespilus Mildbr. ssp. brevicalyx Mildbr. MuchicalaFabaceae Brachystegia spiciformis Benth. MumangaFabaceae Brachystegia bakeriana Burtt Davy & Hutch. ChikungoFabaceae Bobgunnia madagascariensis (Desv.) J.H.Kirkbr. MuteteFabaceae Burkea africana Hook. MussesseFabaceae Cryptosepalum exfoliatum De Wild. ssp. pseudotaxus Baker f. MukueFabaceae Dialium englerianum Henriq. MussalaFabaceae Erythrophleum africanum (Welw. ex Benth.) Harms MukossoFabaceae Guibourtia coleosperma (Benth.) J.Léonard MuchiFabaceae Julbernardia paniculata (Benth.) Troupin MunhumbeMelastomataceae Warneckea sapinii (De Wild.) Jacq.-Fél. MuzeleMyrtaceae cf. Eugenia [FNR 135873] MusokuaPolygalaceae Securidaca longipedunculata Fresen. MuchachaRubiaceae Rubiaceae [FNR 135866] MussoleRubiaceae cf. Rubiaceae [FNR 135872] MujindoStrychnaceae Strychnos cocculoides Baker MukoloStrychnaceae Strychnos pungens Soler. Muhuma
Enquiries were analysed with the assistance of Microsoft Excel 2010 and �eld data usedPast 2.17c [21] for statistical analysis. One-Way ANOVA was used in order to assess thedi�erences between �eld categories in both key-species' presence-absence and coverage. Datanormality was assessed with the Shapiro�Wilk test which, according to Razali and Wah [22],is the most powerful normality test when compared with Kolmogorov-Smirnov, Lilliefors andAnderson-Darling tests. Nevertheless, the same article states that all these tests are lesspowerful when small sample sizes (30 or less) are used. Therefore, Normal Probability Plotswere used as a complementary visual method to con�rm Shapiro-Wilk results. When datanormality was not found, a Kruskal-Wallis test was used due to fact it is a non-parametricmethod. A Chi2 test (contigency table) was used to test the relation between �eld categoriesand the type of regeneration. Barcharts and stacked column charts were obtained with theassistance of Microsoft Excel 2010.
Multivariate analysis [23] was also used in order to see the relation between di�erentvariables in a multi-dimensional space. An analysis of similarities (ANOSIM) [23] with Bon-ferroni corrected p values provided a way to statistically test whether there was a signi�cantdi�erence between the di�erent �eld categories regarding species composition and coverage.A Principal Coordinates Analysis (PCO) [23] in association with an analysis of similaritieswith R values helped to visualize dissimilarity and group clustering in multivariate space.
23

Finally, a SIMPER analysis [23] for both presence-absence and coverage provided informa-tion on which key-species were contributing the most to the found dissimilarities. Jaccarddistance measure was used for species composition while Bray-Curtis was used for coverage[23].
24

Chapter 3
Results
3.1 Free-listing and Key-Species
Most interviewees were from Caololo (26), followed by Calomba (15), Cusseque (8) andSovi (6). The age ranged between 17 and 80 years old (Figure A.3) and the great majorityof the people were farmers (9M:30F) (Figure A.4). Male interviewees carried a wider varietyof di�erent jobs compared with female ones.
This exploratory study found out that locals were able to recall 61 di�erent plant speciesused for construction, food, medicine, dyes and ritual practices. Tables 3.1 and 3.2 show thekey-species as well as the purposes they were mainly used for.
A total of 11 key-species were used for construction, mainly Erythrophleum africanum (6),Cryptosepalum exfoliatum ssp. pseudotaxus (6), Brachystegia spiciformis (5), Julbernardiapaniculata (5) and Bobgunnia madagascariensis (5). Eleven species were also referred as keyfood sources, most of them mentioned 6 and 5 times with the exception of Erythrophleumafricanum (2) and Diospyrus chamaethamnus (2). Thirteen out of the 21 key-species wereused for medicinal purposes, specially Julbernardia paniculata (5), Burkea africana (5), cf.Eugenia (5) and Securidaca longipedunculata (5). For dyeing purposes, 7 di�erent specieswere mentioned, standing out Guibourtia coleosperma (3) and Burkea africana (3). Finally,only two species were said to be used for rituals purposes, speci�cally to avoid ghosts, withcf. Eugenia the most mentioned woody plant (7). Erythrophleum africanum was the onlykey-species used in all the �ve pre-established categories. It was also mentioned 12 timesin total, which demonstrates the high level of importance of the species. cf. Eugenia andJulbernardia paniculata were also mentioned 12 and 11 times respectively, however, onlyused in 2 and 3 di�erent categories.
3.2 Slash-and-Burn Enquiries
Most male interviewees' ages ranged between 21 and 25 years old, while most womenstated they didn't know their own age (Figure A.5). All women were farmers, with theexception of one single woman which said she was also a midwife (Figure A.6). Regardingmale jobs, most men were farmers as well, but many also held other jobs which seemed to
25
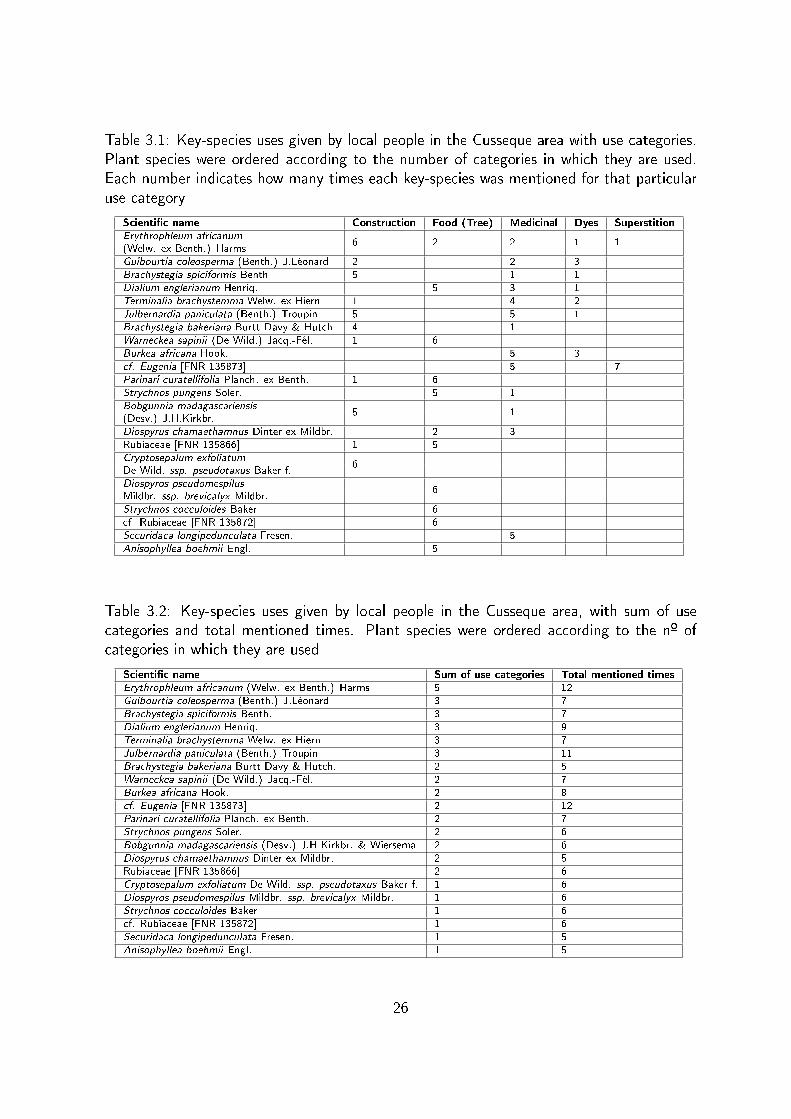
Table 3.1: Key-species uses given by local people in the Cusseque area with use categories.Plant species were ordered according to the number of categories in which they are used.Each number indicates how many times each key-species was mentioned for that particularuse category
Scienti�c name Construction Food (Tree) Medicinal Dyes SuperstitionErythrophleum africanum
6 2 2 1 1(Welw. ex Benth.) HarmsGuibourtia coleosperma (Benth.) J.Léonard 2 2 3Brachystegia spiciformis Benth. 5 1 1Dialium englerianum Henriq. 5 3 1Terminalia brachystemma Welw. ex Hiern 1 4 2Julbernardia paniculata (Benth.) Troupin 5 5 1Brachystegia bakeriana Burtt Davy & Hutch. 4 1Warneckea sapinii (De Wild.) Jacq.-Fél. 1 6Burkea africana Hook. 5 3cf. Eugenia [FNR 135873] 5 7Parinari curatellifolia Planch. ex Benth. 1 6Strychnos pungens Soler. 5 1Bobgunnia madagascariensis
5 1(Desv.) J.H.Kirkbr.Diospyrus chamaethamnus Dinter ex Mildbr. 2 3Rubiaceae [FNR 135866] 1 5Cryptosepalum exfoliatum
6De Wild. ssp. pseudotaxus Baker f.Diospyros pseudomespilus
6Mildbr. ssp. brevicalyx Mildbr.Strychnos cocculoides Baker 6cf. Rubiaceae [FNR 135872] 6Securidaca longipedunculata Fresen. 5Anisophyllea boehmii Engl. 5
Table 3.2: Key-species uses given by local people in the Cusseque area, with sum of usecategories and total mentioned times. Plant species were ordered according to the nº ofcategories in which they are used
Scienti�c name Sum of use categories Total mentioned timesErythrophleum africanum (Welw. ex Benth.) Harms 5 12Guibourtia coleosperma (Benth.) J.Léonard 3 7Brachystegia spiciformis Benth. 3 7Dialium englerianum Henriq. 3 9Terminalia brachystemma Welw. ex Hiern 3 7Julbernardia paniculata (Benth.) Troupin 3 11Brachystegia bakeriana Burtt Davy & Hutch. 2 5Warneckea sapinii (De Wild.) Jacq.-Fél. 2 7Burkea africana Hook. 2 8cf. Eugenia [FNR 135873] 2 12Parinari curatellifolia Planch. ex Benth. 2 7Strychnos pungens Soler. 2 6Bobgunnia madagascariensis (Desv.) J.H.Kirkbr. & Wiersema 2 6Diospyrus chamaethamnus Dinter ex Mildbr. 2 5Rubiaceae [FNR 135866] 2 6Cryptosepalum exfoliatum De Wild. ssp. pseudotaxus Baker f. 1 6Diospyros pseudomespilus Mildbr. ssp. brevicalyx Mildbr. 1 6Strychnos cocculoides Baker 1 6cf. Rubiaceae [FNR 135872] 1 6Securidaca longipedunculata Fresen. 1 5Anisophyllea boehmii Engl. 1 5
26
be considered as very important (Figure A.6). Nineteen people were from Caololo and 11were from Sovi.
100% of the interviewees preferred spots inside the forest for their cropping �elds insteadof spots outside the forest. Also, 100% of the people agreed that they always croppedonly once a year in the same �eld. Since slash-and-burn agriculture is so predominant inthe Cusseque region, one question addressed exactly the way how �elds were prepared forcropping. The results are shown in table 3.3, the grey colour highlighting those activitieswhich were mentioned by more than 15 people (i.e. half of the interviewed population).
Table 3.3: Main steps taken for the preparation of the �elds for cropping. Colour greyhighlights the activities which received more than 15 answers, i.e. half of the interviewedpopulation
Step Action N° Answers1° Find a good forest patch 42° Cut all possible trees and shrubs 26
Cut �rst the small trees/shrubs, then the big trees 3Cut the big trees 1
3° Let the wood get dry 174° Burn the wood 295° Pile the wood 286° Let the wood pile get dry 17° Burn the wood pile 288° Let it get cooler 19° Wait for the rain 110° Cut shrubs and grass 111° Start farming activities 27
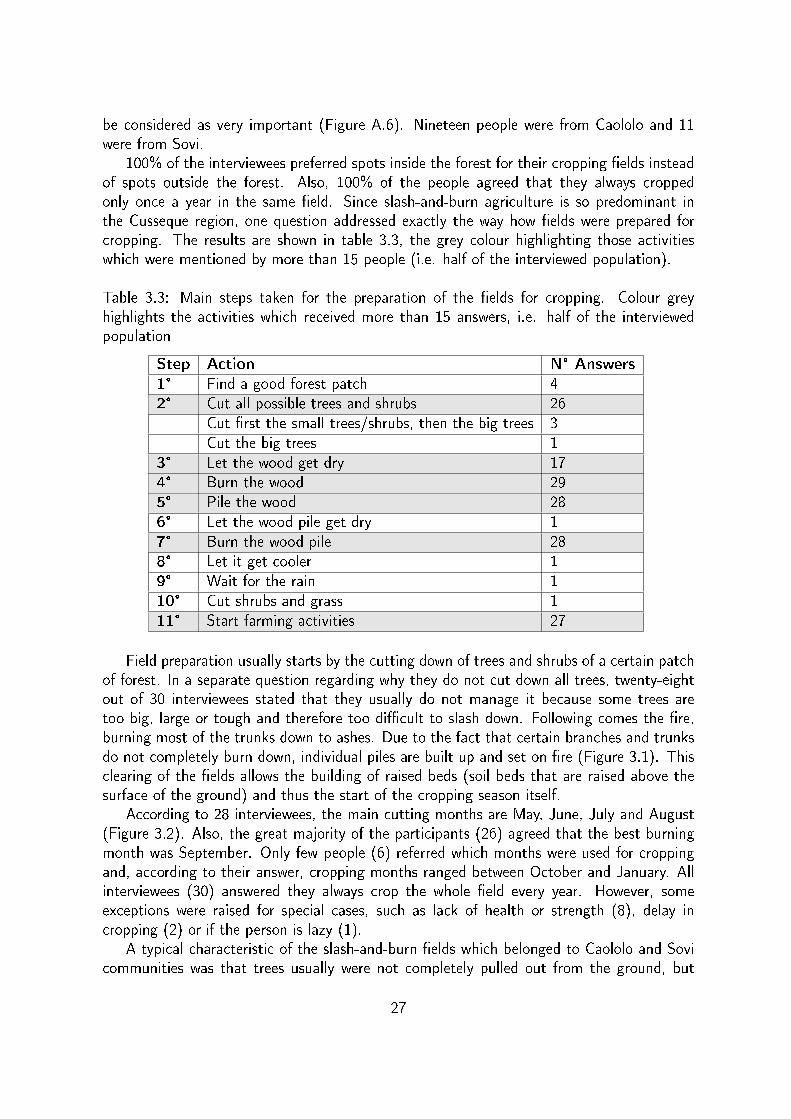
Field preparation usually starts by the cutting down of trees and shrubs of a certain patchof forest. In a separate question regarding why they do not cut down all trees, twenty-eightout of 30 interviewees stated that they usually do not manage it because some trees aretoo big, large or tough and therefore too di�cult to slash down. Following comes the �re,burning most of the trunks down to ashes. Due to the fact that certain branches and trunksdo not completely burn down, individual piles are built up and set on �re (Figure 3.1). Thisclearing of the �elds allows the building of raised beds (soil beds that are raised above thesurface of the ground) and thus the start of the cropping season itself.
According to 28 interviewees, the main cutting months are May, June, July and August(Figure 3.2). Also, the great majority of the participants (26) agreed that the best burningmonth was September. Only few people (6) referred which months were used for croppingand, according to their answer, cropping months ranged between October and January. Allinterviewees (30) answered they always crop the whole �eld every year. However, someexceptions were raised for special cases, such as lack of health or strength (8), delay incropping (2) or if the person is lazy (1).
A typical characteristic of the slash-and-burn �elds which belonged to Caololo and Sovicommunities was that trees usually were not completely pulled out from the ground, but
27
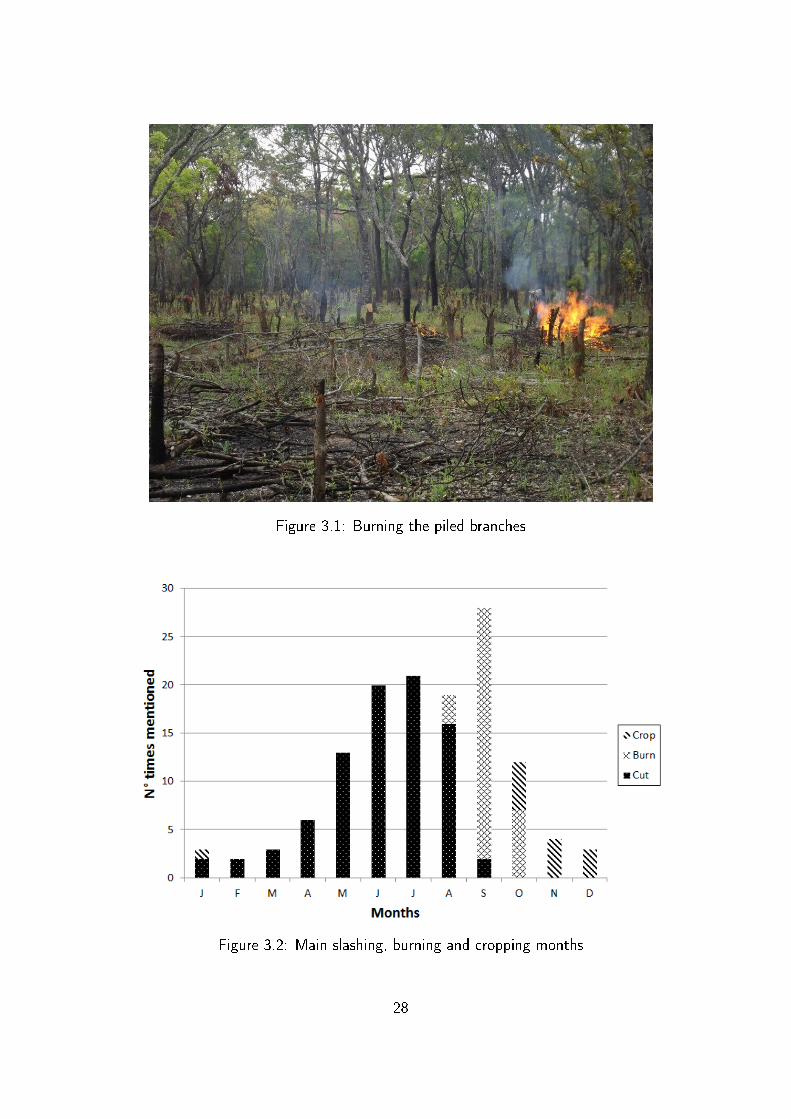
Figure 3.1: Burning the piled branches
Figure 3.2: Main slashing, burning and cropping months
28

actually only cut down at around waist height. Therefore, one of the questions of the enquirywas about these trees and why they were not cut down close to the ground. Twenty-six outof 30 answered that was because they did not use oxen to till the soil.
Twenty-six people stated they burned the slashed trees for the manure they provided(Table 3.4). Many also stated that some of the cut wood could be alternatively used forother purposes such as house construction and �re wood, but only in exceptional cases.
Table 3.4: Stated reasons for burning the wood after slashing it. Other includes otherpossible uses that can be given to the wood in exceptional cases
Answers Nº AnswersManure 26Clean the �eld/space to build the raised beds 5Other uses applied to cut wood:Fire wood 22House construction 15
After the �eld is burnt, the �rst action is to proceed with the building of raised beds andseeds are sown. The next step is to wait for the rain, for this agriculture system is rain fed.Later on, when the grass is already grown up, this is cut down and placed between the raisedbeds in order to fertilize the soil and avoid it casting shade over the crops. Table 3.5 displaysthese after slash-and-burn steps and the grey colour highlights those activities which werementioned by more than 15 people (i.e. half of the interviewed population).
Table 3.5: Agricultural activities following slash and burn. Colour grey highlights the activi-ties which received more than 15 answers, i.e. half of the interviewed population
Step Action N° Answers1° Mix earth with grass, leafs, etc 132° Build raised beds 303° Seeding 284° Wait for the rain 285° Cut the grass 216° Cover the maize roots with dirt 37° Use chemical fertiliser next to the maize roots 1
Eighteen out of 30 interviewees stated they usually explored their �elds until their fertilitylimit (Table 3.6) and only 5 people said they usually cropped the same number of years foreach �eld. The option �other� included the addition of 1 or 2 extra years in case of a goodsoil, the presence of cassava and the use of rotation schemes (Table 3.7).
When asked speci�cally about cropping years, these varied, however, the great majorityseemed to prefer 1 to 3 years of cropping before moving on to a di�erent �eld (Figure 3.3).If the �eld was exceptionally good (i.e. higher in fertility than the average �eld), then thecropping period on the same �eld could be extended up to 4 or 5 years (Figure A.7). Whenenquired about resting years, 20 people said that their �elds rested for some years, while 10
29

stated they didn't have any resting years. Regarding how many years last a resting period,most people (11 out of 20) answered they usually let their �elds rest for about one to threeyears, while only three said they would wait between four to �ve years.
Table 3.6: Answers regarding how slash-and-burn �elds are usually exploited by the locals
Answers Nº AnswersExploited until the limit 18Exploited always the same nº of times 5Other 7
Table 3.7: Answers regarding how slash-and-burn �elds are usually exploited by the locals:Other answers
Other Answers Nº AnswersIf �eld good, plus 1 or 2 years only 5Field used for cassava 1Field rotation scheme 1
Figure 3.3: Usual number of cropping years in a slash-and-burn �eld before moving out to anew forest patch
The main sources of manure were ash and grass (Figure 3.4). Chemical fertilisers werementioned by some as used in certain speci�c situation, such as low �eld fertility. Taking inconsideration the order by which manure types were mentioned, therefore highlighting howimportantly they are perceived by the respondents, the pattern was kept with ash and grassas the most important sources of manure (Figure A.8). Interviewees stated di�erent criteriawhich were crucial for them to leave a certain �eld and look for another one. Out of the 30
30

answers, 28 stated that the most important criteria was the infertility of the �elds. Whenasked about what they usually did when their �elds were infertile, 19 out of 30 people statedthey preferred to change to a new forest patch (Figure 3.5).
Figure 3.4: Main sources of manure used by local people
Figure 3.5: Actions taken towards infertility of slash-and-burn �elds
Focusing now on which crops were the most important, a total of 35 di�erent crops werementioned. The data was analysed in three di�erent ways. In the �rst analysis, the total
31

number of times that each crop was mentioned was accounted, allowing the understandingof how widely this crop was known and used by the local population. According to theobtained results, maize was the most frequently mentioned crop, followed by beans, cowpeaand cassava (Figure 3.6). Figure 3.6 only takes in consideration the 10 most referred crops,however, a total of 35 di�erent foods were mentioned. The second analysis grouped onlythose crops which were mentioned more often in the �rst position of the lists given by theinterviewees. As the results clearly show, the maize is the most important crop in that areawith 20 out of 30 answers in the �rst listing position (Figure A.9). It is then followed bybeans, which only gathered �ve answers on the �rst position. The third analysis took inconsideration the main crops which were mentioned more often on each position of the listsgiven by the interviewees. According to the results below, maize was the most mentionedcrop on the �rst position, beans were the most referred crops on the second position andcowpea was the most mentioned crop in both the third and fourth positions (Figure A.10).Cassava led the �fth listing position.
Figure 3.6: Ten most referred crops by interviewees
32

3.3 Field
Presence-Absence and Species Composition
According to the One-Way ANOVA, recent slash-and-burn �elds di�ered signi�cantlyfrom old �elds with regard to the occurrence of key-species (p value = 0.00564). However,there were no signi�cant di�erences between any other categories.
The PCO analysis (Figure 3.7), together with the Analysis of similarities with R values(Table 3.8), showed that the categories of recent and control formed a clear grouping, eventhough they still overlapped to some extent (R = 0.531). Medium and recent �elds show astrong overlap (R = 0.3746), just like old and recent (R = 0.2692). Finally, when comparingthe control group with the categories of medium and old, there was no signi�cant di�erence,i.e., the categories did not form clear and distinct groups (R < 0.25).
Figure 3.7: PCO analysis for key-species composition (x = 1; y = 2). Colour legend: purple- old plots; green - medium plots; light blue - recent plots; brown - control group
Table 3.8: ANOSIM analysis of �eld categories with regard to key-species composition (rvalues)
Medium Recent ControlOld 0.2255 0.2692 0.1499Medium 0.3746 -0.00444Recent 0.531
33
According to the Analysis of similarities with Bonferroni corrected p values (Table A.2),there were signi�cant dissimilarities between medium and recent plots (p value = 0.0126),and recent and control plots (p value = 0.0006). However, no other comparison between �eldcategories resulted into signi�cant dissimilarities. Table 3.9 summarizes the obtained resultsthrough a SIMPER analysis, which shows that Warneckea sapinii, Brachystegia spiciformis,Erythrophleum africanum, Burkea africana and Brachystegia bakeriana were the key-specieswhich contributed the most to the dissimilarities between �eld categories (i.e. species withthe highest mean �relative presence�).
Table 3.9: Key-species which contributed the most to the dissimilarities between �eld cate-gories in terms of species composition
Comparison Key-speciesMean �relative presence�higher in
Old + Medium Warneckea sapinii OldOld + Recent Warneckea sapinii OldOld + Control Brachystegia spiciformis OldMedium + Recent Erythrophleum africanum MediumMedium + Control Burkea africana MediumRecent + Control Brachystegia bakeriana Control
Key-Species Coverage
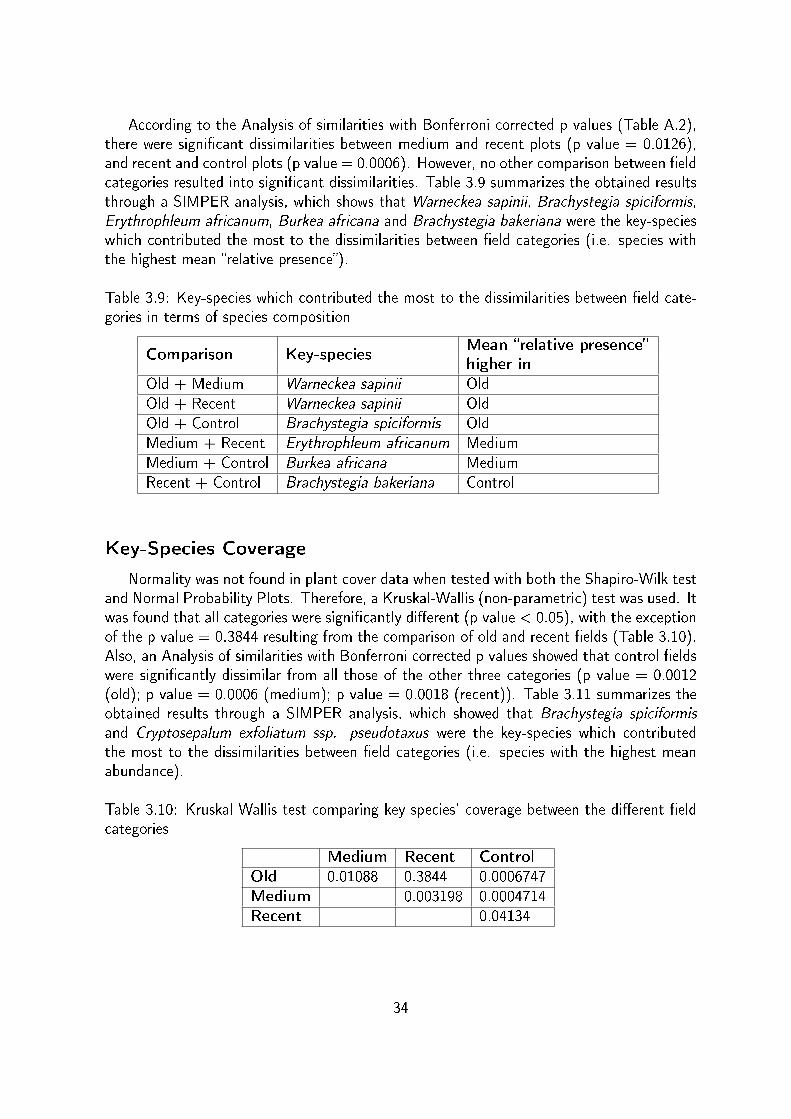
Normality was not found in plant cover data when tested with both the Shapiro-Wilk testand Normal Probability Plots. Therefore, a Kruskal-Wallis (non-parametric) test was used. Itwas found that all categories were signi�cantly di�erent (p value < 0.05), with the exceptionof the p value = 0.3844 resulting from the comparison of old and recent �elds (Table 3.10).Also, an Analysis of similarities with Bonferroni corrected p values showed that control �eldswere signi�cantly dissimilar from all those of the other three categories (p value = 0.0012(old); p value = 0.0006 (medium); p value = 0.0018 (recent)). Table 3.11 summarizes theobtained results through a SIMPER analysis, which showed that Brachystegia spiciformis
and Cryptosepalum exfoliatum ssp. pseudotaxus were the key-species which contributedthe most to the dissimilarities between �eld categories (i.e. species with the highest meanabundance).
Table 3.10: Kruskal-Wallis test comparing key-species' coverage between the di�erent �eldcategories
Medium Recent ControlOld 0.01088 0.3844 0.0006747Medium 0.003198 0.0004714Recent 0.04134
34

Table 3.11: Key-species which contributed the most to the dissimilarities between �eldcategories in terms of coverage
Comparison Key-speciesMean abundancehigher in
Old + medium Brachystegia spiciformis OldOld + Recent Brachystegia spiciformis Recent
Cryptosepalum exfoliatum
Old + Control ssp. pseudotaxus ControlMedium + Recent Brachystegia spiciformis Recent
Cryptosepalum exfoliatum
Medium + Control ssp. pseudotaxus ControlCryptosepalum exfoliatum
Recent + Control ssp. pseudotaxus Control
Presence-Absence and Coverage
Figure 3.8 joins together both presence-absence and cover values for a better visualizationof the results. It shows that the highest number of species was found in old plots, while thehighest coverage of the key-species occurred in the control group. Figure 3.9 relates presence-absence with the mean abundance of each key-species, which shows which regenerated inwhich category and how abundant they were found there. Eighteen out of the 21 key-specieswere present, with three key-species completely absent in the assessed plots. Brachystegia
spiciformis and Cryptosepalum exfoliatum ssp. pseudotaxus were the two species which weremore abundant in the four �eld categories.
Regeneration type
According to the contingency table, there is a relation between the di�erent categoriesand the type of regeneration found on the found key-species, X 2 (2, n = 102) = 37,218, p =0.0001 (a control group was not available for this analysis). In total, 54% of the individualsregenerated in a vegetative way, while 46% did it from a seed. In old slash-and-burn �elds,43 individuals of the key-species were found to be resprouting from seeds, with another 18presenting vegetative regeneration. In recent slash-and-burn �elds, 23 individuals presentedvegetative regeneration and only 4 were found to be resprouting from seed (Figure 3.10). Itwas only found vegetative regeneration (14) in medium �elds.
Height - 10 x 10 m and 50 x 20 m
In general, 10 x 10 m old plots had on average higher trees (from both vegetative andseed regeneration) than those from the other two categories (data for the control groupwere not available for this analysis) (Figure 3.11). In its turn, medium and recent plotscontained, on average, trees with similar heights. Nevertheless, less key-species with at least1 m height were found in medium slash-and-burn �elds. Looking closer to which specieswere contributing the most for these height di�erences between �eld categories, it is possible
35

Figure 3.8: Presence-absence (P/Ab) and coverage of key-species in the four �eld categories
Figure 3.9: Key-species' presence-absence in each �eld category and their mean abundance(logarithmic scale)
36

Figure 3.10: Barchart with the main regeneration types inside each �eld category
to see that Parinari curatellifolia was the highest species in old plots (Figure 3.11). Thehighest tree in medium plots was Brachystegia spiciformis, and in recent plots it was Termi-
nalia brachystemma. Brachystegia spiciformis, Brachystegia bakeriana and Erythrophleum
africanum were present in all categories (Figure 3.11). Terminalia brachystemma, Burkeaafricana and Cryptosepalum exfoliatum ssp. pseudotaxus were present in only two of thethree categories, and Parinari curatellifolia, Dialium englerianum and Bobgunnia madagas-
cariensis were only found in old plots (with more than 1 meter height). Only nine out of the21 key-species managed to reach at least 1 m height.
Old and recent 50 x 20 m plots had on average higher trees than medium plots (con-trol was not possible for this analysis) (Figure 3.12). Looking closer to which species werecontributing the most for this height di�erence, it is possible to see that Brachystegia spici-
formis was the highest species in old plots (Figure 3.12). The highest tree in recent plots wasBrachystegia spiciformis as well, and in medium plots it was Dialium englerianum (only oneindividual). No non-slashed key-species trees appeared in all categories. Brachystegia spici-
formis and Dialium englerianum occurred in only two categories, while Parinari curatellifoliawas only found in recent plots and Burkea africana, Erythrophleum africanum e Cryptosepa-lum exfoliatum ssp. pseudotaxus only in old plots (Figure 3.12). Only six non-slashedindividuals out of the 21 key-species reached at least 50 cm of perimeter.
37

Figure 3.11: Height and abundance of selected key-species in the di�erent �eld-age categories(10 x 10 m plots)
Figure 3.12: Height and abundance of selected key-species in the di�erent �eld-age categories(50 x 20 m plots)
38

Chapter 4
Discussion
The main purpose of this study was to assess if the practise of slash-and-burn agricultureby the local communities in the Cusseque area impacts the regeneration of a selected group ofwoody key-species. Previous studies have approached the negative impacts of slash-and-burnagriculture in forests, connecting it to soil and land degradation and biodiversity losses [11][12] [13] [14]. This present study suggests that shifting agriculture does impact the naturalvegetation to some extent in the Cusseque area. According to Kennard et al [24], the kindof disturbance applied in a patch of forest in�uences the patterns of forest regeneration. Inthe Cusseque area, it was found that forest patches for agriculture are usually burned twice,�elds are used for about 1 to 3 years and resting years do not usually exceed 3 years. Thissuggests some �re intensity and a short fallow period, the later being cited by several authorsas one of the main reasons for the non-sustainability of this form of agriculture due to leadingto soil nutrient loss and land degradation [4] [12] [25].
Less regeneration from seed banks was found in recent �elds compared to old ones. Firehas been linked to the killing of seeds in surface soils, this way a�ecting plant regenerationafter severe disturbances [24]. Therefore, it is possible to assume that seed banks are a�ectedby �re in the Cusseque area, specially taking in consideration that two �re events are held perpatch of forest. Additionally, stump sprouts are also a�ected after slash-and-burn events [24].In the present study, vegetative regeneration was found to be predominant (54%), howevernot with a high lead over seed regeneration (46%). It is then possible to speculate that if�re was suppressed and only slash took place, vegetative regeneration would be stronger,specially in recent plots. Therefore, it would be interesting to test this hypothesis in furtherstudies.
Key-species were found to regenerate across the age categories, however, less key-specieswere found in the control group compared to old �elds. According to the IntermediateDisturbance Hypothesis (IDH), species diversity peaks at intermediate disturbance levels[26]. Old �elds are no longer subjected to slash and burn, therefore reducing disturbanceintensity and allowing a growing in species richness. Moreover, when compared to non-disturbed forest, old plots are still under a certain level of disturbance since canopy is notclosed and therefore allowing less shade-tolerant species to coexist with forest-like species.This way, the number of key-species found in old �elds surpass those in the control groupbecause the old �elds have the needed conditions to lodge both competitive and disturbancetolerant key-species [26].
39

Except for old and recent plots, all other �eld categories were signi�cantly di�erent interms of key-species cover values. This exception might be explained due to the fact thatrecent plots contained an outlier. The raw results from �eld 7 con�rm that Brachystegiaspiciformis (30% coverage) is the main outlier. This is in accordance with the SIMPERresults for coverage (Figure 3.11), where Brachystegia spiciformis was the key-species whichcontributed the most to the dissimilarities between �eld categories and its mean abundancewas higher in recent plots. According to the �eld notes, all trees were slashed in the 10 x 10 mplot where coverage was assessed. Landsat Satellite Imagery helped to refute the possibilityof �eld 7 to be misplaced in its age category. Therefore, since this was an exceptional case,it is possible to speculate that Brachystegia spiciformis regenerated quicker in that �eld dueto local conditions or perhaps local people did slash those trees but not burn them as muchas usual, therefore not damaging the cut trunks so much [24]. Interestingly, four out ofseven old �elds were densely covered by ferns and some grasses (Figures 2.5 and 4.1). Thefern Pteridium aquilinum has been linked to the retardation of forest regeneration and to itsnegative impacts over tree and shrub species richness and abundance [27] [28]. Therefore,the presence of this fern may be linked to the low cover values in older �elds, when comparedto medium and recent �elds.
Figure 4.1: Fallow covered with ferns (Pteridium aquilinum)
Species composition is signi�cantly dissimilar between recent �elds and medium �elds,Erythrophleum africanum contributing the most to these dissimilarities (Table 3.9). Veryfew studies have been done about Erythrophleum africanum, most of them regarding itstoxicological properties [29] [30]. This species was often described by local communities
40

as �pau ferro�, meaning it was too di�cult to cut. Its resistance was also appreciated bylocals, therefore being used for the construction of houses, as seen in table 3.1. In fact,Erythrophleum africanum was the most mentioned and used key-species by interviewees 3.2.This way, it is possible to suggest that this tree is less cut due to its resistance - somethingdescribed very often by locals - or it is let to regenerate earlier than other tree species dueto its usage importance for traditional communities.
Figure 3.9 shows that nine key-species were found in recent �elds and twelve in medium�elds. Strychnos cocculoides, cf. Rubiaceae and Anisophyllea boehmii were exclusivelypresent in medium plots and, according to table 3.1, they were all referred as importantwild fruit trees. No studies were found to relate seed dispersal by humans and fruit treeregeneration in the tropics. Nevertheless, Au�ret and Cousins [31] stated, in the context ofrural communities in Sweden, that humans can indeed work as seed dispersers, contributingto the dispersal of a high proportion of the seeds of local plants. Therefore, it is possibleto suggest that local people in the Cusseque area work as seed dispersers, since fruits arecollected in the forest and might then be transported to the working �elds either with thepurpose for later consumption or indirectly through their digestion.
Species composition is signi�cantly dissimilar between recent �elds and the control groupas well, Brachystegia bakeriana contributing the most to these dissimilarities (Table 3.9).Very little is known about Brachystegia bakeriana. However, as seen in table 3.9, this specieswas present more often in control plots. Also, �gure 3.9 shows a gradual growth of abundancefrom recent �elds to control �elds, suggesting that this species is able to regenerate after slashand burn but prefers forest-like conditions to live. According to �gure 3.9, nine species werecommon in both recent and control categories. The control group added up �ve more key-species in relation to recent plots, which were Guibourtia coleosperma, Dialium englerianum,cf. Eugenia, Strychnos cocculoides and Securidaca longipedunculata. These key-specieswere only present in either the control group and old �elds, with the exception of Strychnoscocculoides which was found in medium �elds as well and has been described as a lightdemanding species [32]. This suggests a sensitivity to slash-and-burn practises and a potentialdependency of G. coleosperma, D. englerianum, cf. Eugenia and S. longipedunculata onforest-like conditions to thrive. When abundance was analysed through species composition,the control group was the highlighted category with higher cover values, Cryptosepalumexfoliatum ssp. pseudotaxus contributing the most to this dissimilarity (Figure 3.11) andsuggesting a close relation between this species and forest-like conditions.
More key-species reached greater heights in old slash-and-burn �elds, comparing tomedium and recent �elds. This di�erence was larger in 10 x 10 m plots since most measuredtrees had been slashed and vegetative regeneration was predominant (Figures 3.10 and 2.8).Only nine out of the 21 key-species managed to reach at least 1 m height and only six outof the 21 key-species (non-slashed individuals) reached at least 50 cm of perimeter. More-over, Brachystegia spiciformis, Cryptosepalum exfoliatum ssp. pseudotaxus, Erythrophleumafricanum, Burkea africana and Dialium englerianum regenerated in 10 x 10 m old plotsbut, when compared with 50 x 20 m plots, they were still far from their potential heights(Figure 3.12) [33]. As referred earlier in this discussion, stump sprouts are a�ected by slashand burn [24] and vegetative regeneration was predominantly found in this study. This way,
41

these results seem to reinforce that slash and burn does impact key-species regeneration tosome extent.
The use of the free-listing method revealed a wealth of traditional knowledge on usefulplants amongst Chokwe people in the Cusseque area. Previous studies on di�erent ruralcommunities in Africa have shown an interdependency between these communities and theirlocal forests [34] [35] [36] [37] [38] [39], and the present free-listing results seem to indicatethe same for the studied traditional communities, specially due to the high incidence ofpoverty in the basin [2]. For instance, wild fruit trees have been related to a better nutritionin other rural communities [40] and, in the present study, it was found that eleven out of the21 key-species were trees whose fruit was consumed by local people (Table 3.1). Therefore,these wild trees might be extremely important nutritional supplements to their staple dietcomposed by mainly maize, beans, cowpea and cassava (Figure 3.6). Another example isthe traditional use of wild plants for medicinal purposes, which has been documented inprevious studies [41] [42] [43] and which is also present in the studied communities, as 13out of the 21 key-species were said to be used to treat health problems. Therefore, medicinalwild trees work as a primary health care in the area. Excluding cf. Eugenia [FNR 135873],Rubiaceae [FNR 135866] and cf. Rubiaceae [FNR 135872] due to the incomplete speciesidenti�cation, all key-species were looked up in the IUCN Red List and only Brachystegia
bakeriana has already been assessed, being categorized as Vulnerable since 1998 [44]. Thisdemonstrates the huge lack of data regarding species in the Cusseque area as well as inother parts of Angola and Africa, and therefore further research in the area is critical for ane�cient conservation of these species.
42
Chapter 5
Conclusions and Final
Considerations
This study suggests that slash-and-burn agriculture impacts to some extent the regene-ration of the key-species. However, the lack of information regarding most of the key-specieslimited the understanding of regeneration dynamics. Therefore, more botanical studies inthe region are needed to help closing this knowledge gap. This study also contributed to abetter understanding of how slash-and-burn agriculture occurs in the area and what particu-larities are present there. This kind of information will be relevant to support further researchrelated to farming practises and their impact on the natural vegetation of that area. Also,the �ndings related to traditional knowledge of local people highlights the importance ofdocumenting these wisdom, which otherwise might be lost forever. Due to the fact that thisstudy was restricted to a small number of key-species, results cannot be generalized out ofthe study area. Nevertheless, these �ndings are de�nitely helpful to support future researchon the core site.
Recommendantions for future research include enlarging the number of studied species,add more questions on semi-structured enquiries regarding local people ideas and perceptionsabout their surrounding natural forests and include more regeneration parameters (e.g. treemortality, survival and recruitment of seedlings) in order to fully understand the impact ofslash-and-burn in the area.
43

Bibliography
[1] Kabii, T. 1997. Okavango - the world's largest Ramsar site. Ramsar (Ramsar Conven-tion on Wetlands), Gland. Available from http://www.ramsar.org/ [accessed September2013].
[2] Kgathi, D., D. Kniveton, S. Ringrose, A. Turton, C. Vanderpost, J. Lundqvist, and M.Seely. 2006. The Okavango; a river supporting its people, environment and economicdevelopment. Journal of Hydrology 331:3-17.
[3] Abdelli, H. and D. Jouen. 2012. Diagnóstico agrário territorial da província do Bié:Municípios do Andulo e Chitembo. FAO (Food and Agriculture Organization of theUnited Nations), Rome.
[4] Brady, N. 1996. Alternatives to slash-and-burn: A global imperative. Agriculture Ecosys-tems & Environment 58:3-11.
[5] Turner, I. M. 1996. Species loss in fragments of tropical rainforest: a review of theevidence. Journal of Applied Ecology 33:200-209.
[6] Giam, X., C. Bradshaw, H. Tan, and N. Sodhi. 2010. Future habitat loss and theconservation of plant biodiversity. Biological Conservation 143:1594-1602.
[7] WWF (World Wildlife Fund). 2012. Living Planet Report 2012: Biodiversity, biocapacityand better choices. WWF, Switzerland.
[8] Kettle, C. 2012. Seeding ecological restoration of tropical forests: Priority setting underREDD+. Biological Conservation 154:34-41.
[9] De Baan, L., R. Alkemade, and T. Koellner. 2013. Land use impacts on biodiversity inLCA: a global approach. International Journal of Life Cycle Assessment 18:1216-1230.
[10] Universität Hamburg. 2011. The Future Okavango (TFO) - Progress Report 2011.Research Programme Sustainable Land Management, Hamburg.
[11] Juo, A., and A. Manu. 1996. Chemical dynamics in slash-and-burn agriculture. Agricul-ture Ecosystems & Environment 58:49-60.
[12] Tinker, P., J. Ingram, and S. Struwe. 1996. E�ects of slash-and-burn agriculture anddeforestation on climate change. Agriculture Ecosystems & Environment 58:13-22.
44
[13] Vosti, S. A. and J. Witcover. 1996. Slash-and-burn agriculture - household perspectives.Agriculture, Ecosystems and Environment 58:23-38.
[14] Kleinman, P., D. Pimentel, and R. Bryant. 1995. The ecological sustainability of slash-and-burn agriculture. Agriculture Ecosystems & Environment 52:235-249.
[15] TFO (The Future Okavango Project), Hamburg. Available from http://www.future-okavango.org/ [accessed September 2013].
[16] Timberlake, J. 2000. Biodiversity of the Zambezi Basin. Biodiversity Foundation forAfrica, Famona, Bulawayo.
[17] Ministério do Urbanismo e Ambiente. 2006. Primeiro Relatório Nacional para a Con-ferência das Partes da Convenção da Diversidade Biológica. Ministério do Urbanismo eAmbiente. Luanda.
[18] Quinlan, M. 2005. Considerations for collecting free-lists in the �eld: examples fromethnobotany. Field Methods, Journal 17 (3):1�16.
[19] Chidumayo, E. N. 1997. Miombo Ecology and Management, an Introduction. IT Pub-lications. Second edition. ITDG Publishing, London.
[20] Barriball, K., and A. While. 1994. Collecting data using a semistructured interview - Adiscussion paper. Journal of Advanced Nursing 19:328-335.
[21] Hammer, Ø., Harper, D.A.T., Ryan, P.D. 2001. PAST: Paleontological statistics soft-ware package for education and data analysis. Palaeontologia Electronica 4(1): 9pp.http://palaeo-electronica.org/2001_1/past/issue1_01.htm
[22] Razali1, N. M. and Y. B. Wah. 2011. Power comparisons of Shapiro-Wilk, Kolmogorov-Smirnov, Lilliefors and Anderson-Darling tests. Journal of Statistical Modeling and An-alytics, Journal 2 (1):21-33.
[23] McCune, B., Grace, J. B. and D. L. Urban. 2002. Analysis of Ecological Communities.MjM Software Design, USA.
[24] Kennard, D., K. Gould, F. Putz, T. Fredericksen, and F. Morales. 2002. E�ect ofdisturbance intensity on regeneration mechanisms in a tropical dry forest. Forest Ecologyand Management 162:197-208.
[25] Harwood, R. 1996. Development pathways toward sustainable systems following slash-and-burn. Agriculture Ecosystems & Environment 58:75-86.
[26] Kershaw, H., and A. Mallik. 2013. Predicting Plant Diversity Response to Disturbance:Applicability of the Intermediate Disturbance Hypothesis and Mass Ratio Hypothesis.Critical Reviews in Plant Sciences 32:383-395.
[27] Yassir, I., J. van der Kamp, and P. Buurman. 2010. Secondary succession after �re inImperata grasslands of East Kalimantan, Indonesia. Agriculture Ecosystems & Environ-ment 137:172-182.
45
[28] Ribeiro, S., S. Botelho, M. Fontes, P. Garcia, and H. Almeida. 2013. Natural regener-ation of deforested areas dominated by Pteridium aquilinum (L.) Kuhn located in theSerra da Mantiqueira Mountain range. Cerne 19:65-76.
[29] Hassan, S. W., Ladan, M.J., Dogondaji, R. A., Umar, R. A., Bilbis, L. S., Hassan, L.G., Ebbo, A. A. and I. K. Matazu. Phytochemical and toxicological studies of aqueousleaves extracts of Erythrophleum africanum. Pakistan Journal of Biological Sciences10:3815-3821.
[30] Kadja, A., J. Mamyrbekova-Bekro, A. Benie, B. Boua, K. N'Gaman, and Y. Bekro.2011. Erythrophleum africanum Afzel. (Caesalpiniaceae), an African toothpick: Phyto-chemical screening, total �avonoid content and antioxidant activity. Journal of MedicinalPlants Research 5:6273-6277.
[31] Au�ret, A., and S. Cousins. 2013. Humans as Long-Distance Dispersers of Rural PlantCommunities. Plos One 8.
[32] Hines, D. A. and K. Eckman. 1993. Indigenous multipurpose trees of Tanzania: uses andeconomic bene�ts for people. FAO (Food and Agriculture Organization of the UnitedNations), Rome. Available from http://www.fao.org/docrep/x5327e/x5327e1k.htm[accessed September 2013].
[33] Palgrave, K. C. 2000. Trees of Southern Africa. Second edition. Struik Publishers, CapeTown.
[34] Rasethe, M., S. Semenya, M. Potgieter, and A. Maroyi. 2013. The utilization andmanagement of plant resources in rural areas of the Limpopo Province, South Africa.Journal of Ethnobiology and Ethnomedicine 9.
[35] Lykke, A. 2000. Local perceptions of vegetation change and priorities for conservation ofwoody-savanna vegetation in Senegal. Journal of Environmental Management 59:107-120.
[36] Obiri, J., M. Lawes, and M. Mukolwe. 2002. The dynamics and sustainable use of high-value tree species of the coastal Pondoland forests of the Eastern Cape Province, SouthAfrica. Forest Ecology and Management 166:131-148.
[37] Shackleton, C., S. Shackleton, E. Buiten, and N. Bird. 2007. The importance of drywoodlands and forests in rural livelihoods and poverty alleviation in South Africa. ForestPolicy and Economics 9:558-577.
[38] De Beer, J., and B. Van Wyk. 2011. An ethnobotanical survey of the Agter-Hantam,Northern Cape Province, South Africa. South African Journal of Botany 77:741-754.
[39] Houehanou, T., A. Assogbadjo, R. Kakai, M. Houinato, and B. Sinsin. 2011. Valuationof local preferred uses and traditional ecological knowledge in relation to three multi-purpose tree species in Benin (West Africa). Forest Policy and Economics 13:554-562.
46
[40] Goenster, S., M. Wiehle, K. Kehlenbeck, R. Jamnadass, J. Gebauer, A. Buerkert, J.Wesonga, and R. Kahane. 2011. Indigenous Fruit Trees in Homegardens of the NubaMountains, Central Sudan: Tree Diversity and Potential for Improving the Nutritionand Income of Rural Communities. I All Africa Horticultural Congress 911:355-364.
[41] Maroyi, A. 2013. Use of weeds as traditional vegetables in Shurugwi District, Zimbabwe.Journal of Ethnobiology and Ethnomedicine 9.
[42] De Wet, H., S. Nciki, and S. van Vuuren. 2013. Medicinal plants used for the treatmentof various skin disorders by a rural community in northern Maputaland, South Africa.Journal of Ethnobiology and Ethnomedicine 9.
[43] Abdillahi, H., and J. Van Staden. 2013. Application of Medicinal Plants in MaternalHealthcare and Infertility: A South African Perspective. Planta Medica 79:591-599.
[44] Phiri, P.S.M. 1998. Brachystegia bakeriana. IUCN (IUCN Red List of ThreatenedSpecies), Version 2013.1., Gland. Available from http://www.iucnredlist.org/ [accessedSeptember 2013].
47

Appendix A
48

Figure A.1: Questions of the semi-structured enquiry (original Portuguese version)
49
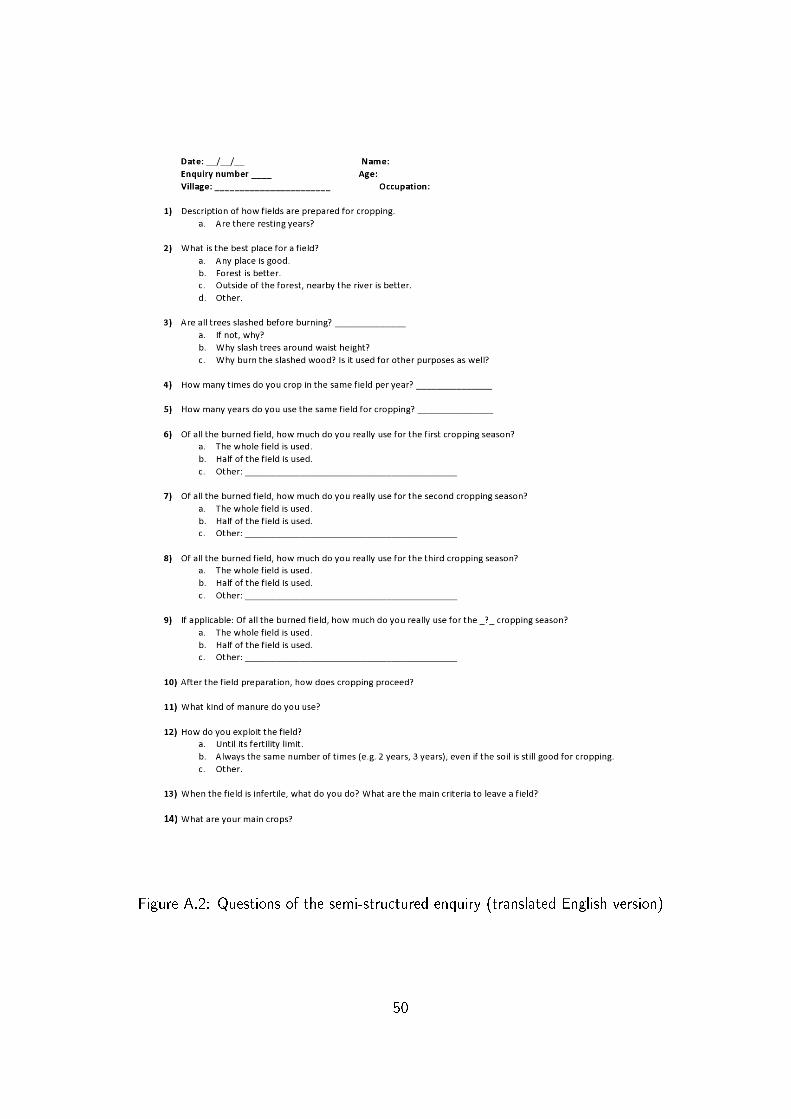
Figure A.2: Questions of the semi-structured enquiry (translated English version)
50

Figure A.3: Age of the participants of the free-listing exercise
Figure A.4: Main job occupations of the participants of the free-listing exercise
51

Figure A.5: Age of the interviewees of the slash-and-burn enquiries
Figure A.6: Main job occupations of the interviewees of the slash-and-burn enquiries
52

Figure A.7: Utmost number of cropping years before moving out to a new �eld
Figure A.8: Main sources of manure taking into consideration the position of each answerin the lists given by the interviewees
53

Figure A.9: Crops which were mentioned more often in the �rst position of the lists givenby the interviewees
Figure A.10: Crops which were mentioned more often on each position of the lists given bythe interviewees
54
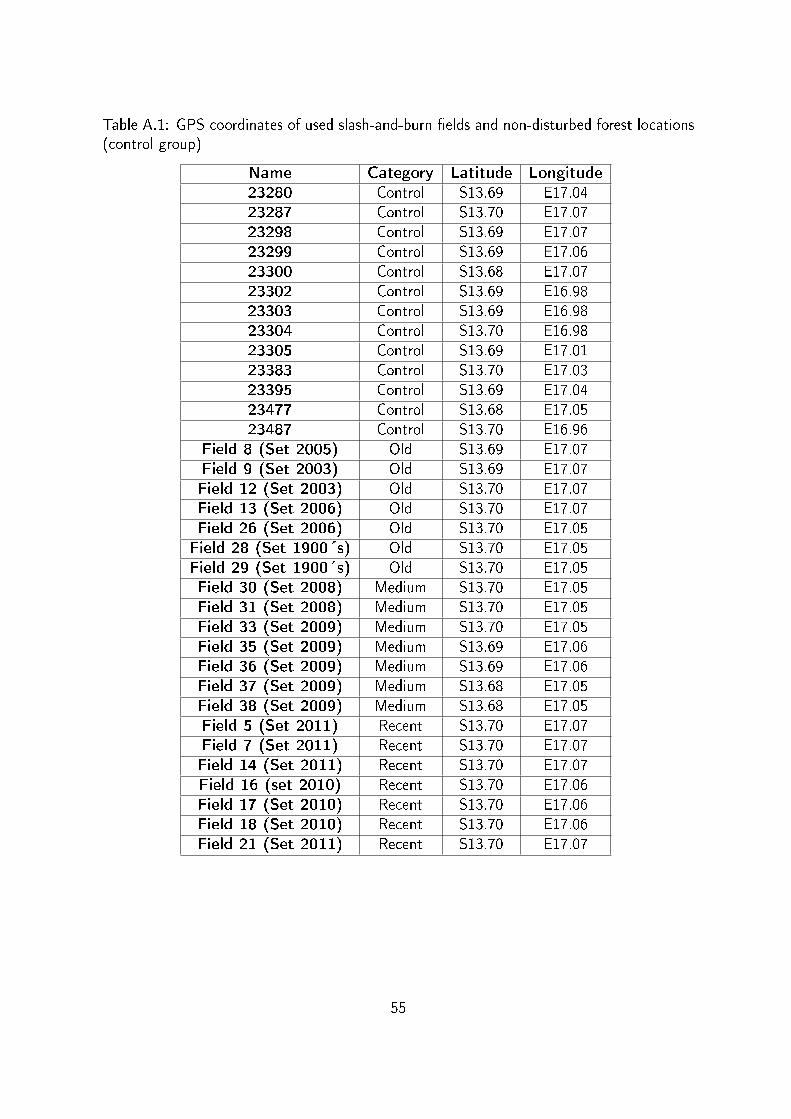
Table A.1: GPS coordinates of used slash-and-burn �elds and non-disturbed forest locations(control group)
Name Category Latitude Longitude23280 Control S13.69 E17.0423287 Control S13.70 E17.0723298 Control S13.69 E17.0723299 Control S13.69 E17.0623300 Control S13.68 E17.0723302 Control S13.69 E16.9823303 Control S13.69 E16.9823304 Control S13.70 E16.9823305 Control S13.69 E17.0123383 Control S13.70 E17.0323395 Control S13.69 E17.0423477 Control S13.68 E17.0523487 Control S13.70 E16.96
Field 8 (Set 2005) Old S13.69 E17.07Field 9 (Set 2003) Old S13.69 E17.07Field 12 (Set 2003) Old S13.70 E17.07Field 13 (Set 2006) Old S13.70 E17.07Field 26 (Set 2006) Old S13.70 E17.05Field 28 (Set 1900´s) Old S13.70 E17.05Field 29 (Set 1900´s) Old S13.70 E17.05Field 30 (Set 2008) Medium S13.70 E17.05Field 31 (Set 2008) Medium S13.70 E17.05Field 33 (Set 2009) Medium S13.70 E17.05Field 35 (Set 2009) Medium S13.69 E17.06Field 36 (Set 2009) Medium S13.69 E17.06Field 37 (Set 2009) Medium S13.68 E17.05Field 38 (Set 2009) Medium S13.68 E17.05Field 5 (Set 2011) Recent S13.70 E17.07Field 7 (Set 2011) Recent S13.70 E17.07Field 14 (Set 2011) Recent S13.70 E17.07Field 16 (set 2010) Recent S13.70 E17.06Field 17 (Set 2010) Recent S13.70 E17.06Field 18 (Set 2010) Recent S13.70 E17.06Field 21 (Set 2011) Recent S13.70 E17.07
55
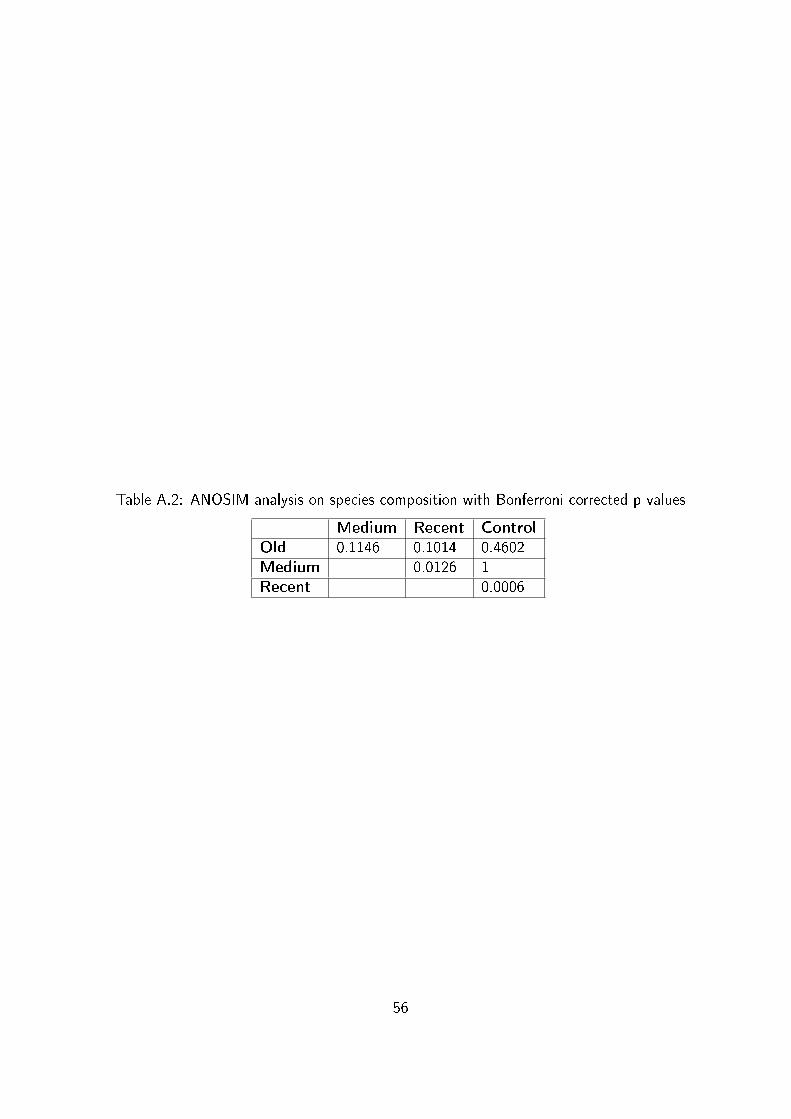
Table A.2: ANOSIM analysis on species composition with Bonferroni corrected p values
Medium Recent ControlOld 0.1146 0.1014 0.4602Medium 0.0126 1Recent 0.0006
56