Embed Size (px)
Citation preview

This article has been accepted for publication in IEEE Transactions on Antennas and Propagation. This is the author's version which has not been fully edited and content may
change prior to final publication. Citation information: DOI 10.1109/TAP.2021.3121173
© 2021 IEEE. Personal use is permitted, but republication/redistribution requires IEEE permission. See https://www.ieee.org/publications/rights/index.html for more information
Universal Path Gain Laws for Common Wireless
Communication Environments Dmitry Chizhik, Fellow, IEEE, Jinfeng Du, Member, IEEE, and Reinaldo A. Valenzuela, Fellow, IEEE
Abstract— Simple and accurate expressions for path gain are
derived from electromagnetic fundamentals in a wide variety of
common environments, including Line-of-Sight (LOS) and Non-
Line-of-Sight (NLOS) indoor, urban canyons, urban/rural
macro, outdoor-indoor and suburban streets with vegetation.
Penetration into a scattering region, sometimes aided by guiding,
is the “universal” phenomenon shared by the diverse
morphologies. Root Mean Square (RMS) errors against extensive
measurements are under 5 dB, better than 3GPP models by 1-12
dB RMS, depending on environment. In urban canyons the
models have 4.7 dB RMS error, as compared to 7.9 dB from
linear fit to data and 13.9/17.2 dB from LOS/NLOS 3GPP
models. The theoretical path gains depend on distance as a power
law with exponents from a small set {1.5, 2, 2.5, 4}, specific to
each morphology. This provides a theoretical justification for
widely used power law empirical models. Only coarse
environmental data is needed as parameters: street width,
building height, vegetation depth, wall material and antenna
heights.
Index terms— indoor propagation, mm wave propagation,
outdoor-indoor, propagation loss, suburban, urban.
I. INTRODUCTION
1Performance of wireless communications is critically
dependent on achieving adequate coverage, particularly
challenging at mm wave bands. This paper concentrates on
modeling path gain, the most basic aspect of propagation, key
in determining coverage. Path gain is defined as the ratio of
average receive and transmit powers for omnidirectional, co-
polarized transmit/receive antennas. Models are needed both
to estimate system performance and requirements in generic
circumstances, such as determining inter-site distance required
for adequate coverage at a given frequency and transmit
power as well as planning and placement of base stations in a
particular area.
Prominent approaches to propagation modeling in
communications include ray-tracing [1][2] as well as
empirical models [3]-[15] derived from field measurements
for various deployment scenarios such as indoor office and
urban street canyons. Ray tracing can handle very general
environments to predict the full impulse response of the
channel but requires detailed environmental information, such
as individual building walls. In outdoor-indoor scenarios, this
includes the need to specify interior walls, which play a key
role in indoor scattering. Furniture information is generally
unavailable and is usually ignored despite being many
wavelengths across. Vegetation and urban street clutter play a
Dmitry Chizhik, Jinfeng Du and Reinaldo A. Valenzuela are with Nokia Bell Laboratories, Murray Hill, NJ 07974, USA (e-mail: dmitry.chizhik@nokia-
bell-labs.com, [email protected], reinaldo.valenzuela@nokia-
bell-labs.com).
critical role in attenuating signal, especially at mm wave
bands, with attenuation through a 10 m crown of a single tree
on the order of 20 dB at 28 GHz. Such detailed information is
often difficult to obtain.
Widely used empirical models, such as 3GPP [3] and
WINNER [4], specify path gain as a function of range for
several important scenarios, such as urban microcell, urban
canyons, rural and indoor. Path gain P is expressed (in dB) as
a function of range r (m) in the “slope-intercept” form in
terms of distance exponent n and 1-m intercept P1:
1
dB 10 10 1 1010log 10log 10 logn
PP P n r
r
= = −
(1)
No environmental details are required, only generic
morphological label, like “urban microcell”. These models are
used as references in current work. Known theoretical
examples of form (1) include Friis free space formula with
n=2 and LOS propagation between antennas of heights h1 and
h2 above a ground plane of reflection coefficient -1, with n=4
beyond the breakpoint 1 24r h h = for wavelength .
Deployment of cellular communication systems is often
preceded by an extensive path gain measurement campaign,
from which P1 and n specific to the area are determined from
Least Means Square (LMS) fit to the data. The RMS goodness
of fit is regarded as shadow fading.
Extensive measurements in both suburban [16] and urban
[17] environments have shown wide variation in path gain
among subsets of data nominally belonging to the same
morphological class, e.g. urban canyon measurements [17]
have shown street-street variation of path loss at similar
distance spanning a range of 30 dB. Since the empirical path
loss models are generally functions of distance and
LOS/NLOS status alone, they do not account for such
variations. It is of interest to develop models adaptable to
local conditions to improve prediction accuracy for coverage
planning.
Most desirable models are a) accurate, b) dependent only on
reasonably available environmental parameters and c) simple
to implement. Closed form expressions (as in empirical
models [3][4]) are attractive in that they are easy to
communicate and do not require complex programming to be
developed and supported. At the same time, reducing or
eliminating site-specific measurements is highly desirable.
The Walfisch-Bertoni model [18] is an example of an
analytical model with a relatively simple path gain expression,
obtained from a numerical solution of over-rooftop
propagation.
In this work we derive simple yet accurate path gain
expressions from electromagnetic fundamentals for important
canonical environments, including urban canyons with and
This article has been accepted for publication in IEEE Transactions on Antennas and Propagation. This is the author's version which has not been fully edited and content may
change prior to final publication. Citation information: DOI 10.1109/TAP.2021.3121173
© 2021 IEEE. Personal use is permitted, but republication/redistribution requires IEEE permission. See https://www.ieee.org/publications/rights/index.html for more information
without trees, outdoor-indoor in canyons, indoor corridors
(LOS and NLOS), traditional urban/rural macro cellular
propagation from above roof-top base to below
rooftop/treetop terminal and suburban propagation through
foliage. Notable aspects are:
• Under 5 dB RMS error against measurements;
• Derived path gain depends on distance as a power law,
justifying the widely used slope-intercept form (1) in
empirical models;
• Morphology dependent distance exponents n of 1.5 for LOS
in canyons, 2.5 for canyon outdoor-indoor (or street-
cluttered sidewalk), 4 for in unguided penetration into a
cluttered space (indoors, behind foliage, etc.);
• 1-m intercept P1 in (1) is found dependent on general
environmental parameters, such as street width, antenna
height and placement in the street, vegetation depth and
wall material properties.
Derivations of the approximate reflection coefficient from
rough surface and propagation from free space into diffuse
half-space, which are an important part of this work, are put
into appendices to make the paper more readable.
Average path gain between omnidirectional antennas,
without multipath fading, is the main channel property
modeled and compared against data. The impact of multipath
fading on narrowband (CW) measurements is reduced through
averaging, either locally over several wavelength (at 2 GHz,
3.5 GHz) or over angle when using a spinning horn antenna
(at 28 GHz). Once the multipath fading is removed, the
resulting average power corresponds to an average over
frequency as well. 28 GHz measurements collected with a
spinning directional horn, were averaged over all azimuth
directions, resulting in equivalent azimuthally omnidirectional
antenna [22].
II. GENERAL PROBLEM FORMULATION
We are interested in modeling fields in canonical
environments arising in radio communications. Here the
quantity of interest is the received power when both transmit
and receive antennas are electrically small (i.e.
“omnidirectional”). Fields from such antennas for both
polarizations are related to corresponding Hertz potentials
[19], each proportional to the scalar Green’s function ( , )sG r r ,
which is the field at r due to a point source at rs. In the time-
harmonic case, it satisfies the scalar Helmholtz equation:
2 2( , ) ( , ) ( )s s sG k G + = −r r r r r r (2)
where wavenumber 2k = and the point source is
represented by the Dirac delta function ( )s −r r . Directional
antenna response may be constructed from elementary
solutions to (2). Cross-polarization coupling, expected due to
scattering, is not addressed here, noting that measured values
of median cross-polarization power ratio have been reported
as below -8 dB in environments of interest [3].
Inhomogeneous media are typically represented by adding
boundary conditions to (2), introducing reflections and
scattering, as is done in subsequent sections, for several
environments. In free space, the solution to (2) is the spherical
wave:
s
0 s
s
( , )4
ike
G
−
=−
r r
r rr r
(3)
The corresponding power received when both transmit and
receive antennas are unit gain is given by:
( )
222
0 0 s 22
s
( , )4
P G
= =−
r rr r
(4)
recognized as the Friis equation [19].
III. LOS PROPAGATION IN A STREET CANYON OR INDOOR
CORRIDOR
This section considers propagation with transmit and
receive antennas placed in a street canyon or indoor corridor,
bounded by walls on either side and the ground. Propagation
in such an environment is modeled here as a combination of
the direct path as well as reflections from the walls and the
ground. Ceiling reflection, relevant for an indoor corridor, is
neglected as under-ceiling ductwork and cabling, common in
commercial buildings, are presumed to scatter incident signals
into steep elevation and azimuth angles, to be scattered many
times and eventually absorbed in lossy materials, like the
concrete floor.
The source and receiver are both taken to be in the middle
of the canyon. Extension to off-center antennas is discussed at
the end of the section. Using the image theory, various order
reflections may be represented as emanating from a sequence
of images, shown in Fig 1. Here the x-axis is along the
canyon, y-axis across the canyon and z is the vertical
coordinate. For a source at s s(0,0, )z=r in the middle of the
waveguide of width w, the mth order reflection appears as
emanating from an image source a distance mw from the
center of the canyon, with coordinates s(0, , )m mw z=r .
Neglecting the ground reflection for the moment, the
scalar Green’s function (point source response) at a receiver at
( ,0, )x z=r for a sum of images corresponding to reflections
from the canyon walls:
1
s 0 s
1
( , ) ( , ) ( , ) ( , )m
m m m m
m
G G G G =−
= −
= + + r r r r r r r r (5)
where the free space Green’s function 0 s( , )G r r is given by
(3) and the mth order reflection response due to image at mr is
( , )4
mikm
m m m
m
eG
−
= −
r r
r rr r
(6)
The sums over negative and positive m account for images
on the either side of the canyon in Fig. 1. The wall reflection
coefficient m , raised to theth
m power to account for m
reflections, is dependent on the wall grazing angle m
( )1tanm m r m rw w −= (7)
with the distance between transmitter and receiver
This article has been accepted for publication in IEEE Transactions on Antennas and Propagation. This is the author's version which has not been fully edited and content may
change prior to final publication. Citation information: DOI 10.1109/TAP.2021.3121173
© 2021 IEEE. Personal use is permitted, but republication/redistribution requires IEEE permission. See https://www.ieee.org/publications/rights/index.html for more information
( )22
sr x z z + − (8)
The average received power
22
s( , )P G= r r (9)
often obtained through local spatial average, is the sum of
powers of the terms in (5)
( )
2
2
224
m
m
m m
P
=−
−
r r (10)
with 0m = corresponding to direct path.
For r m w , m −r r is expanded in terms of r in (8):
( ) ( )2 2
2 22
s2
m
m wx mw z z r
r− = + + − +r r (11)
Fig. 1. Top view of canyon of width w, with an infinite sequence
of source images (in grey) representing wall reflections.
Similarly, using Taylor series expansions to 2nd order,
( )
( ) ( )2 22 2 2
22
1 21 1mw r
m
mw r e
r rr mw
−−=
− +r r (12)
Terms with m large enough to violate the assumption
r m w are attenuated by reflection loss 2 m
m in (10).
Using (12) in (10), leads to
( )2 2
22
4
m mw r
m
m
P er
−
=−
(13)
Contribution of the mth order reflection to total average
power is attenuated by the factor 2 m
m due to m wall
reflections and by the excess spreading loss factor ( )
2 22mw re−
corresponding to path length that increases with m.
Using the approximation (51) in Appendix I to the
reflection coefficient for incidence on a wall at small grazing
angle (7)
222 /2m mmm L L m Lm w r
m e e e − − − = = (14)
in terms of the unitless wall-loss parameter L
3 2 2
eff 1 2 1 24 32L n k A p p + + (15)
The two terms in (15) represent reflection loss from a
smooth dielectric wall with refraction index effn , and loss due
to scatter from wall roughness, respectively. “Roughness”
considered (appendix I) is due to window/door wells in a wall,
with window well half-depth A, relative wall fraction
occupied by the window/door p1, rest of the wall 2 11p p= − ,
and average window/door width 11 and inter-window
spacing 21 .
Substituting (14) into (13), the sum over reflection orders
m in (13) is viewed as a rectangular-rule approximation for an
integral over a continuous variable s:
( ) ( )
( )
2 2m L w r w r s L w r w r
m
r re dse
L w r w Lw
− + − +
=− −
= +
(16)
where the last approximation is justified for L w r , i.e.
excess spreading loss is negligible compared to reflection loss,
e.g. for non-metallic walls and r w . Using (14) and (16),
path gain (13) in LOS canyon becomes
2
LOS canyon 1.5 1.516 P
wL r
(17)
The distance r is raised to the exponent of 1.5, independent of
any environmental variable. Exponent of 1.5 was found [32]
in ocean acoustic waveguides using a different approach. In
(17) the dependence of the 1-m “intercept” of path gain
( )2 1.5
1010log 16 wL (dB) on wall materials through effn
and canyon width w is relatively weak, as changing either by a
factor of 2 changes the intercept by less than 1.5 dB.
Ground (floor) reflection with field reflection coefficient
g is now included by adding an image of the source to (17):
2
2
g1.5 1.516
gikrikrP e ewL r
+ (18)
where rg is the distance from the source image in the ground
to the receiver. As done for wall reflections in Appendix I, the
ground reflection coefficient dependence on the ground
grazing angle ( )1
g s gsin z z r −= + may be approximated for
vertical polarization by ( )2 2
g g g2 1
g
n n
e− −
− (45) for low
grazing angles, with typical ground refraction index
(concrete/dry soil) g 5 2.2n . At ranges before the
breakpoint s4r z z , (18) produces a two-ray beating
pattern with varying range r. Average power in that regime is
obtained by summing the powers of direct and reflected
arrivals, leading to

This article has been accepted for publication in IEEE Transactions on Antennas and Propagation. This is the author's version which has not been fully edited and content may
change prior to final publication. Citation information: DOI 10.1109/TAP.2021.3121173
© 2021 IEEE. Personal use is permitted, but republication/redistribution requires IEEE permission. See https://www.ieee.org/publications/rights/index.html for more information
( )2
2
LOS corridor g1.5 1.51
16 P
wL r
+ (19)
As range r increases, 2
g 1 → .
Predictions (19) are compared against LOS corridor
measurements of path gain at 2 GHz in Fig. 2. The data was
collected using omni antennas in an office corridor w=1.6 m
wide, with transmitter 2.2 m above the floor and receiver at
1 m. Measurement details are in [21]. Parameters defining
wall loss L (15) areeff 1.7n = , A=0.035 m,
1 0.25p = ,
2 0.75p = ,11 1 m = ,
21 3 m = . Path gain (19) has 2.8 dB
RMS deviation from data, slightly greater than 2.6 dB
obtained from linear fit to data. Including ground reflection
coherently as in (18) apparently reproduces the observed
beating pattern in Fig. 2 enough to reduce the RMS deviation
to 2.4 dB.
Fig. 2. Path gain measured and modeled at 2 GHz and 28 GHz in a LOS
office corridor. “Coherent” and “incoherent” ground bounce theory are
(18) and (19), respectively. Wall loss L (15) parameters:eff
1.7n = ,
A=0.035m,1
0.25p = ,2
0.75p = ,1
1 1 m = ,2
1 3 m = .
Single tone LOS path gain measurements collected in the
same corridor at 28 GHz (experimental details in [22]) are
likewise compared against prediction (19) in Fig. 2. Including
wall roughness (second term in (15)) reduces mean error from
3 dB to 0.3 dB, leading to RMS error of 4.1 dB.
Similar agreement is found against 3.5 GHz LOS
measurements collected [23] in an urban canyon in Fig. 3,
with 1.9 dB RMS error using coherent ground reflection (18)
and 2.5 dB RMS error for “incoherent” ground reflection (19).
The observed power and predictions in the unobstructed
canyon cases here are above free space, with additional power
attributed to reflections from canyon walls.
Extension to the case of transmitter and/or receiver being
off-center of the canyon can be obtained by modifying image
source locations in (6) and grazing angles (7), as appropriate.
The resulting average power expression is more complex yet
is found to be insensitive to exact displacement of the
antennas and is thus numerically close to (18) and (19),
particularly for r w . An interesting exception is the case of
an antenna placed within a wavelength from a wall, where
incoherent power sum (10) is inappropriate as coherent
reflection from the near wall is needed to assure the boundary
condition is satisfied, requiring coherent sum (5). For very
short ranges, where r w , the sum (10) is dominated by the
free space term (4), although (19), derived for r w , is
within 2 dB of that.
Fig. 3. Path gain in an outdoor LOS urban canyon, 3.5 GHz, 8.6 m-wide
street. LOS theory is (18), LOS “incoherent” is (19). Wall loss L (15)
parameters:eff
2.2n = ,A=0.1m,1
0.85p = ,2
0.15p = ,1
1 0.33 m = ,
21 2 m = .
This problem was treated in [21][23] using an explicit sum
of modes in the corridor/canyon. While accurate, the sum-of-
modes approach does not scale well with frequency, as a
30 m-wide street supports some 6000 modes at 28 GHz.
Expressions derived here are much more efficient to compute
and allow immediate insight into dependence on range and
material parameters.
IV. PENETRATION THROUGH FOLIAGE IN A SUBURBAN STREET
A. Outdoor terminal on street with trees
We consider propagation between a base station placed in
a region free from clutter (close to middle of a street) and a
terminal placed behind foliage. The case arises in suburban
Fixed Wireless Access (FWA) where lamppost-mounted base
stations communicate with terminals mounted on exterior of
buildings, often behind foliage, such as trees and hedges,
illustrated in Fig. 4.
Fig. 4. Suburban link (top view) illustration for a lamppost base (left) and a terminal on house exterior wall, behind vegetation.

This article has been accepted for publication in IEEE Transactions on Antennas and Propagation. This is the author's version which has not been fully edited and content may
change prior to final publication. Citation information: DOI 10.1109/TAP.2021.3121173
© 2021 IEEE. Personal use is permitted, but republication/redistribution requires IEEE permission. See https://www.ieee.org/publications/rights/index.html for more information
Path gain between a source in free space and a terminal at
depth dv in diffuse clutter (here foliage) of absorptionv
(Nepers/m) is derived in Appendix II. Reflections from
buildings across the street are neglected due to foliage
absorption (~2 dB/m at 28 GHz). Scattering from across-the-
street foliage is also neglected. Setting eff 1T = in (63) (no wall
between vegetation and open space), and adding power
reflected from the ground and the building wall near terminal,
the average path gain for suburban street case is given by:
( )( )v v2 2
2 2
g w2 41 1
8
d
sdP
e
r
−
+ + (20)
where2
g and2
w are the ground and wall power reflection
coefficients, respectively, ds is the separation between the
source and the nearest point on foliage boundary (Fig. 4),
( )22 2
s sr x z z d= + − + is the distance from source to center
of “hot” region on boundary, with base-terminal height
difference sz z− . For v s, r d r −r r , the effective range
to terminal. The distance exponent is 4.
Fig. 5. Suburban street path gain, with ‘lamppost’ base at 3 m height and terminal at 1 m height on the same street behind 10 m of foliage, on
house exterior. Theory is equation (20). ds=20 m, dv=10 m.
Over 1000 NLOS path gain measurements were collected
at 28 GHz for the FWA scenario on 6 streets in a NJ suburb
[16]. Here we are interested in the same-street scenario, with
lamppost node (’base station’) and a ‘terminal’ next to
exterior house wall, behind vegetation. In other words, foliage
is what changes this arrangement from LOS to NLOS.
Average vegetation depth dv in (20), was found from publicly
available satellite views for each measured street, varying
from street to street from 3.1 m to 10.7 m. Fig. 5 shows a
sample path gain data set plotted vs. distance for a street with
about 10 m-thick vegetation layer (trees and bushes)
separating the house from the street. Path gain predicted by
(20) is found to give 3.7 dB RMS error, only slightly worse
than the 2.7 dB RMS deviation from a linear fit to the data and
better than the 6.1 dB RMS for the 3GPP UMi NLOS model
[3]. Using a street-specific foliage depth in (20) for all 6
streets (~1000 links), results in RMS error of 5.5 dB, as
compared to 6.2 dB RMS deviation obtained from a linear fit
to the entire data set, and 6.3 dB RMS from 3GPP UMi
NLOS, which happens to work well for suburban FWA
measurements with dense foliage [16]. An early version of
this result was presented in [24].
B. Indoor terminal on a street with trees
The above formula generalizes directly to the case of a
terminal placed inside the building, illustrated in Fig. 6.
Fig. 6. Suburban link (top view) illustration for a lamppost base (left) and
an indoor terminal.
Fig. 7. Outdoor-indoor suburban path gain, with ‘lamppost’ base at 3 m
height and terminal on the same street behind 10 m of foliage, 1.5 m
inside the house. Theory is equation (21). ds=20 m, dv=10 m, din=1
m, Teff=0.1.
Placement of the terminal inside introduces additional
losses to (20): wall penetration loss effT and loss in inde
− due to
scatter and absorption from indoor clutter, leading to
( )( )v v in in2 2
2 2eff
OI g w2 41 1
8
d
s
dd TP
e e
r
− −
+ + (21)
where ds is the standoff distance between the source and the
nearest point on foliage boundary and
( )22 2
s sr x z z d= + − + is the distance from source to center
of “hot” region on boundary, with base-terminal height
difference sz z− . 2
g accounts for power reflected from the
ground, and 2
w for power reflected from the back wall of a
building. The latter may be approximated either by its
maximum value of 1 or an average over all angles between 0

This article has been accepted for publication in IEEE Transactions on Antennas and Propagation. This is the author's version which has not been fully edited and content may
change prior to final publication. Citation information: DOI 10.1109/TAP.2021.3121173
© 2021 IEEE. Personal use is permitted, but republication/redistribution requires IEEE permission. See https://www.ieee.org/publications/rights/index.html for more information
and 90o, to account for wide spectrum illumination in
scattering indoor environments. As marked in Fig. 6, vd is the
depth of vegetation,ind is the depth of the terminal indoors.
Representative intrinsic material losses in vegetation and
interior space at 28 GHz are v ~0.38 Nep/m (linearly
interpolated in frequency between 0.4 Nep/m at 35 GHz [25]
and 0.07 Nep/m at 2 GHz [26]) andin ~0.18 Nep/m [27],
respectively. For v in s, r d d r+ −r r , the effective range
to receiver. In the usual case of ( )22
s sx z z d+ − , the
distance exponent is 4.
Predictions (21) are compared against measurements in
Fig. 7. The path gain data, reported and characterized
empirically in [28], was collected inside a suburban house
with 2 cm-thick plywood walls with calculated penetration
loss eff 0.1T = (mostly determined by 10% of wall area
occupied by plain glass windows). Theory (21) has 3.2 dB
RMS error, compared to 2.4 dB RMS linear fit deviation.
V. ABOVE CLUTTER BASE AND BELOW CLUTTER TERMINAL
The propagation in the NLOS case of a macro cellular
base mounted above rooftops and a below clutter outdoor
terminal can also be treated as that between a source in free
space and a receiver in a diffusely scattering medium, as in
Appendix II. The idealized geometry is illustrated in Fig. 8.
Fig. 8. Rooftop macro to NLOS mobile terminal geometry, with street
width w, clutter height zc,, base height zBS, mobile height zm.
The path gain is given by adaptation of (63), adding power
reflected from the ground near terminal:
( ) ( )v c m222
BS
4ove p
c ef
t
g
o
f
r- 2
1
8
z z
Pz z e T
r
− −− +
= (22)
Here the source is s BS cd z z= − meters above clutter (local
roof tops or tree tops), at range ( )22
BS cr x z z= + − from the
clutter top immediately above the terminal,
( ) ( )1
eff c m2 tan 2T w z z −= − from middle line of (64) (no
material boundary above the street containing the terminal, so
1T = ), w is the street width and c md z z= − is the “depth” of
the terminal below clutter height cz , essentially equal to
building height for street level terminals. In the absence of
vegetation, absorption v 0 = .
For wide streets, ( )c mw z z− or rural areas where street
width is not well defined, ( )( )1
c mtan 0.5 2w z z − − → and
(22) simplifies to
( ) ( )v c m222
BS c g
2 4over-top
1
8
z zz z e
Pr
− −− +
= (23)
For rural areas, in addition to the “over-the-top” path gain
(23), there is also a direct path through vegetation, important
at short ranges. In such conditions, (23) generalizes to:
( ) ( )v c m
v v
2222
BS c g
2 4rural
1
4 8
z z
r
z z eP e
r r
− −
−
− +
= +
(24)
where rv is the part of the direct path going through
vegetation. For dense trees of height c treez z= less than base
antenna height zBS:
c m
v
BS m
z zr r
z z
−=
− (25)
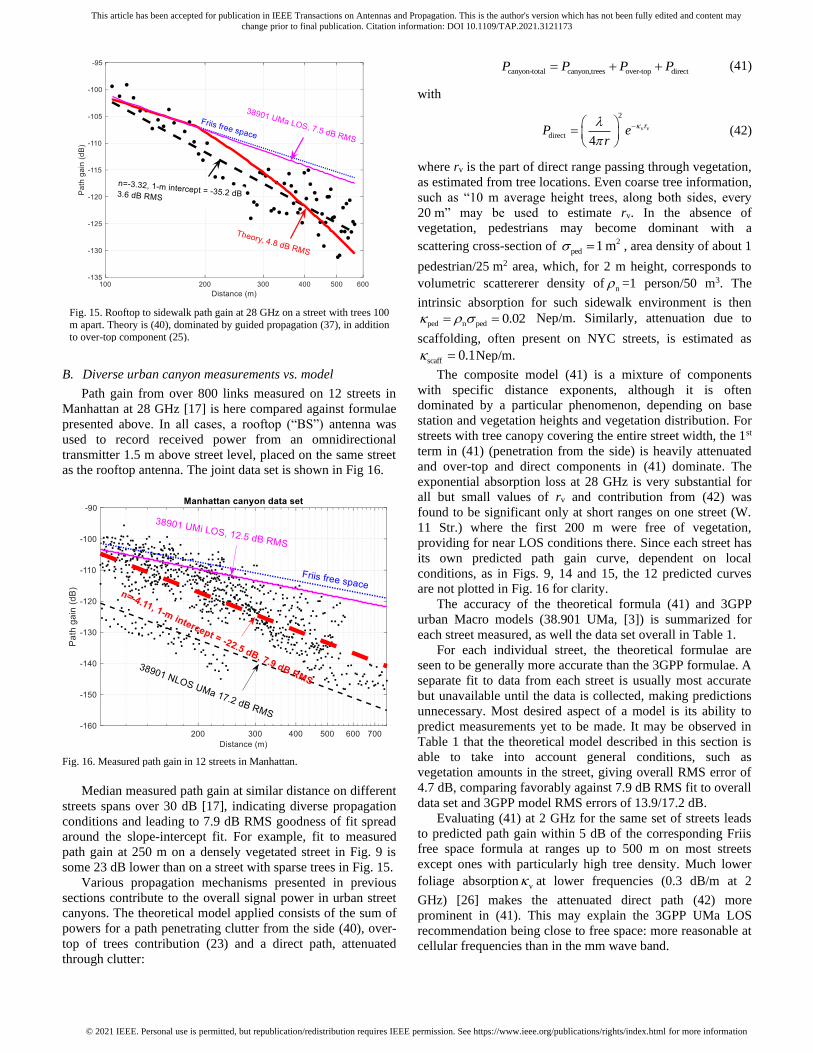
Fig. 9. Measured and predicted path gain on densely vegetated urban
street, compared against over-top (24) and 3GPP urban macro models.
zBS= 14 m, zc=10 m, zm=1.5 m.
Path gain (22) has distance exponent of 4. In conventional
macro-cellular deployment the base station is placed above
clutter to cover large ranges, so that horizontal range
( )BS cx z z− , and the total range r x . Equation (24) is a
corrected version of [30].
Measurements collected [17] at 28 GHz from a rooftop
base to a terminal under the tree canopy of a densely
vegetated street are compared in Fig. 9 to (24) and to the
3GPP 36.814 recommendation for urban macrocells [29] (with
dependence on building height zb (here same as clutter height
zc) and antenna heights zBS and zm, unlike simplified [3]):

This article has been accepted for publication in IEEE Transactions on Antennas and Propagation. This is the author's version which has not been fully edited and content may
change prior to final publication. Citation information: DOI 10.1109/TAP.2021.3121173
© 2021 IEEE. Personal use is permitted, but republication/redistribution requires IEEE permission. See https://www.ieee.org/publications/rights/index.html for more information
UMa_NLOS 10 10 b
2
b BS 10 BS
10 BS 10 3D
2
10 10 m
161 04 7 1log ( ) 7 5log ( )
(24 37 3 7( / ) ) log ( )
(43 42 3 1log ( ))(log ( ) 3)
20log ( ) (3 2(log (11 75 )) 4 97)c
PL . . w + . z
. . z z z
. . z d
f . . z .
= −
− −
+ − −
+ − −
(26)
as well as 38.901 UMa NLOS [3]. All predictions are close to
each other: 3GPP 36.814 UMa NLOS has 4.5 dB RMS error,
38.901 UMa NLOS 4.8 dB and 5.0 dB RMS for (24).
VI. “OUTDOOR-INDOOR” COVERAGE FROM STREET CANYONS
INTO BUILDINGS AND FROM CORRIDORS INTO ROOMS
Here we are interested in path gain between a terminal
inside a building due to a base in a street canyon, say on a
lamppost or rooftop overlooking the street, illustrated in
Fig. 10. The case is distinct from the suburban propagation
examined in Sec. IV in that here foliage is very sparse or
absent, allowing reflections from building walls. Very similar
modeling applies to a channel between a terminal in a room
and a base in a corridor.
Fig. 10. Top view of the “outdoor-indoor” geometry in a street canyon or
indoor corridor-room link. AP is in the canyon, bound by (blue) walls, indoor terminal in cluttered interior at the top.
The field in the street canyon is modeled here as due to
multiple reflections from the canyon walls. The “waveguide”
field is illuminating the exterior wall of a building containing
the terminal. The building interior consists of walls and
furniture, modeled here as diffusely scattering medium with
indoor absorption parameter in (Nep/m), as was done for
indoor propagation in [21][23][27] and for vegetation in Sec.
IV. The received power due to a direct path from the source
with a “standoff distance” d from the building wall (Fig. 10)
has been derived in Appendix II as:
( )( )in in
2 22 2
eff g w
0 2 4
1 1
8
dd T
Pe
r
−+
+
(27)
where the terminal is placed at depth din inside the building,
effT is the effective (power) transmission coefficient (64) or
(65) through the exterior wall and r is the range from a source
in the canyon to the center of the “hot” wall on the building
exterior, closest to the terminal. The total power reaching the
interior terminal is a sum of direct field power (27) and an
infinite set of reflected fields from canyon walls:
( )( )in in2 22
eff g w22
2 40
1 1
8m
m
d
m
m
TP
ed
r
−
=
+ + (28)
where the “standoff” distance of a source image
corresponding to m reflections is:
, 0,2,4...
, 1,3,5...
m
m
d mw d m
d mw w d m
= + =
= + − = (29)
Using approximation (14) for reflection coefficient, (28)
becomes
( )( )
( ) ( )
( ) ( )
in in2 22
eff g w
2 4
2
0,2,4
2 1
1,3,5
1 1
8
Lm m d w w r
m
m
d
L m d w w r
m
TP
r
mw d e
mw w d e
e
− +
=
− + −
−
=
+ +
+
+ + −
(30)
For r Lw (low wall reflection loss and at grazing
incidence), the sums in (30) are dominated by terms for which
1m d w . This allows approximating (30) as
( )( ) n
2
i in2 22
eff g w2 2
2 40,1,2...
1 1
8
Lm w r
d
m
TP m e
ew
r
−
=
−+ +
(31)
Similar to the LOS case in Sec. II, the sum in (31) is now
approximated as an integral over a continuous variable s:
( )( )in in
2
2 22 2
eff g w2
2 4
0
1 1
8
d
Ls w r
T wP s e ds
r
e
−
−
+ + (32)
Evaluating the integral leads to the final expression for the
average path gain in the outdoor-indoor canyon scenario:
( )( ) in in2 22
eff g w
canyon, out-in 1.5 1.5 2.5
1 1
32
dT
wP
e
L r
−+ +
(33)
dependent on wavelength , window/wall power
transmission coefficient effT , indoor absorption in , indoor
terminal depth din, street width w, and loss parameter L (15),
in turn dependent on wall material and roughness. Back wall
reflection coefficient is approximated as 2
w 1 for exterior
wall confining the radiation within the building. Long range
received power decreases with distance r with an exponent of
2.5, which is independent of wall properties and street width.
Narrowband received power measurements were collected
[23] at 3.5 GHz in a street on the campus of Universidad
Técnica Federico Santa María (UTFSM), Valparaiso, Chile.
The 8.6 m street canyon was lined by concrete buildings, with
clear glass windows occupying about 30% of the wall area.
The windows were separated by concrete pillars, with the

This article has been accepted for publication in IEEE Transactions on Antennas and Propagation. This is the author's version which has not been fully edited and content may
change prior to final publication. Citation information: DOI 10.1109/TAP.2021.3121173
© 2021 IEEE. Personal use is permitted, but republication/redistribution requires IEEE permission. See https://www.ieee.org/publications/rights/index.html for more information
resulting concrete-glass surface having 0.2 m depth of
corrugation. A 3.5 GHz tone was emitted from a 10.2 dBi
transmit patch antenna, placed 0.5 m from a wall at 5 m
height, aimed “down the street”. The receiver was a 2.4 dBi
“whip” antenna, placed at a height of 7.7 m inside the building
at depths varying from 1 m to 6 m. The comparison of locally
averaged receive power obtained from measurements,
prediction (33), and free space loss are illustrated in Fig. 11.
Measurements collected with transmitter on different sides of
the street are distinguished: marked blue for same side of the
street as the building containing the receiver and red for
opposite side of the street. Measured average power was
obtained by averaging the instantaneous received power over
60 local displacements of an omnidirectional receive antenna
as it is rotated over a circle of 0.4 m radius. Path gain formula
(33) has 2.8 dB RMS error. The 3GPP UMi LOS O2I [3]
model also does well with 3.3 dB RMSE.
Fig. 11. Measured and predicted signal power for outdoor-indoor case in a street waveguide at 3.5 GHz. Tx antenna patch mounted close to the
wall either opposite (red) or same side (blue) of the street as the building
containing the receiver. Linear fits are dashed, theory (33) is solid. Wall
loss L (15) parameters:eff
2.2n = , A=0.1m,1
0.85p = ,2
0.15p = ,
11 0.33 m = ,
21 2 m = . Teff=0.37, w=8.6m.
The corresponding WINNER Outdoor-indoor model [4],
based on [20], predicted the path gain with RMS errors of
3.9 dB for the transmitter on the opposite side and 6.7 dB
RMS error for the same side.
The fit lines to the same and opposite side data are within
2 dB of each other, despite a large difference in the angle of
incidence on the wall of the building containing the terminal.
The small path gain difference may be explained by
recognizing that reflections from the canyon walls occur at
steeper angles of incidence than direct illumination. Their
inclusion in (33) provides for close agreement with
measurements whether the base in the street is close or far
from the face of the building.
Predicted path gain (33) also applies to the
morphologically similar NLOS indoor case of a base in the
corridor and a terminal inside a room adjacent to that corridor.
Path gain (33) is compared against 74 link measurements
(details in [21]) at 2 GHz and 452 links (details in [22]) at
28 GHz in Fig. 12, with RMS errors of 3.9 dB for both
frequencies. Teff is approximated by (65), where the open door
plays the role of a fully transparent “window” occupying
p=0.25 fraction of the wall. 3GPP indoor NLOS model [3] has
corresponding RMS errors of 5.7 and 7.5 dB
Measured NLOS excess loss relative to free space
increases from 14 dB to 27 dB at 70 m, as the frequency is
increased from 2 GHz to 28 GHz. Theoretical model (33)
reproduces this scaling with frequency, through increased
rough wall scattering loss L (15), dependent on frequency
through wavenumber 2k f c= .
Fig. 12. Path gain in indoor corridor-room NLOS at 2 GHz and 28 GHz.
Wall loss L (15) parameters:eff
1.7n = , A=0.035m,1
0.25p = ,2
0.75p = ,
11 1 m = ,
21 3 m = , Teff=0.27.
This problem has been analyzed in [21][23] using sum of
modes in the canyon waveguide, penetrating into the
scattering interior space behind a wall. As mentioned in the
LOS case in Sec. II, the sum-of-modes approach, while
accurate, is not efficient to compute as frequency increases.
Simple expressions derived here are not only efficient to
evaluate but also allow insight into dependence on range and
material parameters.
VII. URBAN CANYON TO TERMINAL ON CLUTTERED SIDEWALK
A. Urban sidewalk with trees
Here we examine the case of a base antenna on a
rooftop/lamppost and a terminal on a sidewalk “down the
street”, illustrated in Fig. 13.
Fig. 13. Lamppost base to terminal on cluttered sidewalk.
This is treated as a generalization of the “outdoor-indoor”
guided canyon case in Sec. VI, adding absorption through

This article has been accepted for publication in IEEE Transactions on Antennas and Propagation. This is the author's version which has not been fully edited and content may
change prior to final publication. Citation information: DOI 10.1109/TAP.2021.3121173
© 2021 IEEE. Personal use is permitted, but republication/redistribution requires IEEE permission. See https://www.ieee.org/publications/rights/index.html for more information
vegetation to the sum of reflections in (28) and setting eff 1T =
(no material boundary between street and vegetation):
( )( )v
v
v v
v
2 22
g w22
guided 2 40
1 1
8m
d
m r
m m
m
P dr
ee
−
=
−+ +
(34)
where v mr represents path length through vegetation for mth
order reflection path. Length rm is approximated as
2 2 22 2
2 2
m
m m
d m wr r d r r
r r + + + (35)
whilev [0,1] is the tree density on the street, i.e. fraction of
canyon volume below base station occupied by trees, for
average tree height ztree, base height zBS, mobile height zm, and
average tree crown width wtree (e.g. ~ 3-5 m) , and ntree per
meter (linear tree density along the street) estimated as
( )
( )tree m tree
v tree
BS m
2z z wn
z z w
−
− (36)
Accounting for vertical ( ) ( )tree m BS mz z z z− − and horizontal
tree2w w fractions of the canyon, assuming trees on both sides
of the street, and BS treez z , tree2w w . Following the same
derivation steps as those leading to (33), leads to:
( ) v v v v v2 22
g w
guided 1.5 1.5 2.5
1
(1 ) 1
32
d re w
PL r
e
− −+ +
(37)
where the loss parameter L (15) was modified to include
excess absorption suffered by higher order canyon reflections
passing through vegetation:
1 v v 2L L w = + (38)
Guided propagation (37) suffers exponential loss due to
vegetation through the factor v vre
−. Intrinsic absorption
through vegetation at 28 GHz of =0.38 Nep/m (~2 dB/m)
leads to 10 dB of attenuation through a single tree with a 5-m
crown, leading to severe attenuation at ranges of interest when
even a few trees are present. Notably, path directly
illuminating the vegetation near terminal suffers absorption
only through depth dv (~ 5 m) and does not depend on range r.
The propagation is here similar to the suburban case in
Sec.IV, essentially down the middle of the street above
vehicles and through the sidewalk clutter (mostly vegetation)
towards the terminal on a sidewalk. The path gain is then
given by (20):
( )( )v v v2 2
2 2
unguided g w2 41 1
8
s
dd
Pe
r
−
+ + (39)
Power represented by (39) corresponds to the lowest order
term in the sum (34), avoiding approximation (35). For
sd w and base station antennas above trees, next order
contribution is from a path reflecting from buildings across
the street (bottom of Fig. 13) prior to illuminating the
scattering region near terminal. For a base near middle of the
street, this is modeled by setting sd w= in (39).
An effective way to combine the low order contribution
(39) and the infinite sum (37) is through:
canyon,trees guided unguidedmax ,P P P = (40)
It was found that when even a few trees are present, (39)
dominates, with distance exponent 4. Guided propagation (37)
arises only when there are so few trees so as to make loss due
to v vre
−negligible, leading to distance exponent of 2.5.
Fig. 14. Path gain at 28 GHz on a Manhattan sidewalk with trees 15 m apart. Theory is (40), dominated by unguided path (39).
Path gain predicted by (40) is compared to path gain
measurements collected [17] on two representative Manhattan
streets: street with 15 m average tree separation in Fig. 14 and
100 m tree separation in Fig. 15. Measured path gains are seen
to be very different: at 400 m, fit to path gain data from a
street with denser trees in Fig. 14 is about 7 dB lower than in
the case of a street with sparser trees in Fig. 15. For the denser
tree case in Fig. 14, equation (40), dominated by (39), predicts
the measured path gain with 5.2 dB RMS, as compared to
4.7 dB RMS obtained with a slope-intercept fit to data and
10 dB RMS with 3GPP UMa LOS model.
For the street with sparser trees in Fig. 15, theory (40),
now dominated at ranges beyond 200 m by the guided
contribution (37), has RMS error of 4.8 dB, as compared to
3.6 dB RMS linear fit deviation and 7.5 dB 3GPP UMa LOS
[3] error.
This article has been accepted for publication in IEEE Transactions on Antennas and Propagation. This is the author's version which has not been fully edited and content may
change prior to final publication. Citation information: DOI 10.1109/TAP.2021.3121173
© 2021 IEEE. Personal use is permitted, but republication/redistribution requires IEEE permission. See https://www.ieee.org/publications/rights/index.html for more information
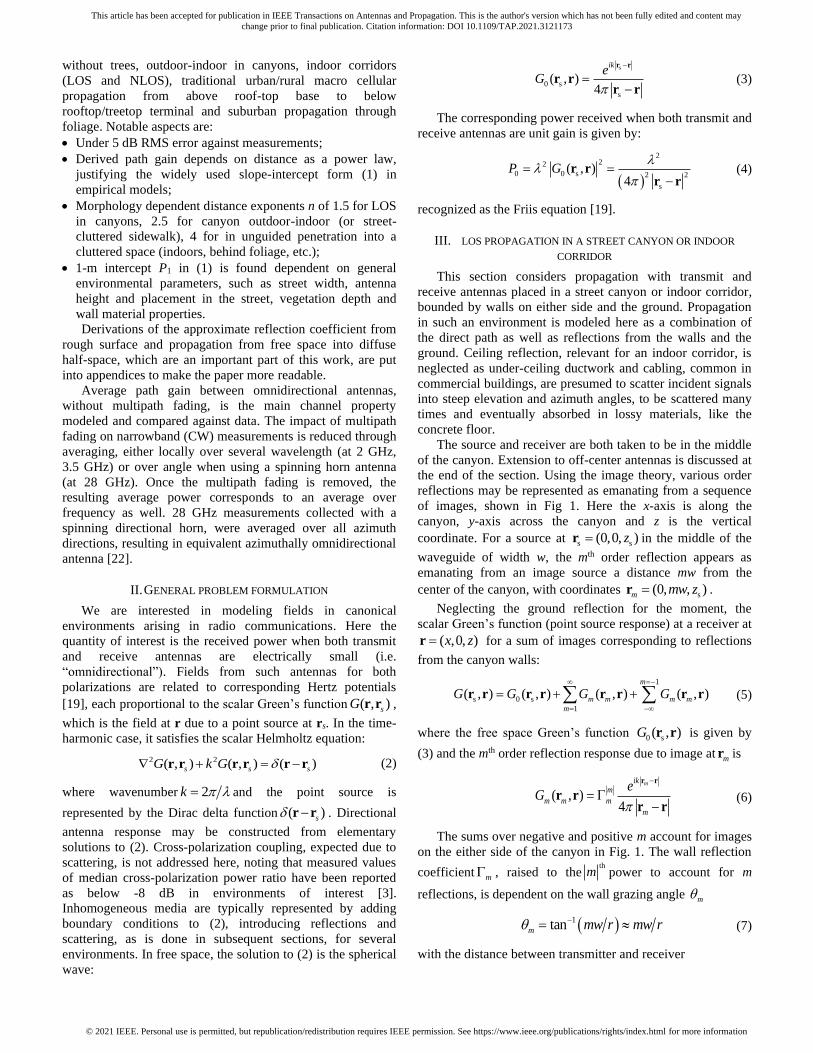
Fig. 15. Rooftop to sidewalk path gain at 28 GHz on a street with trees 100
m apart. Theory is (40), dominated by guided propagation (37), in addition
to over-top component (25).
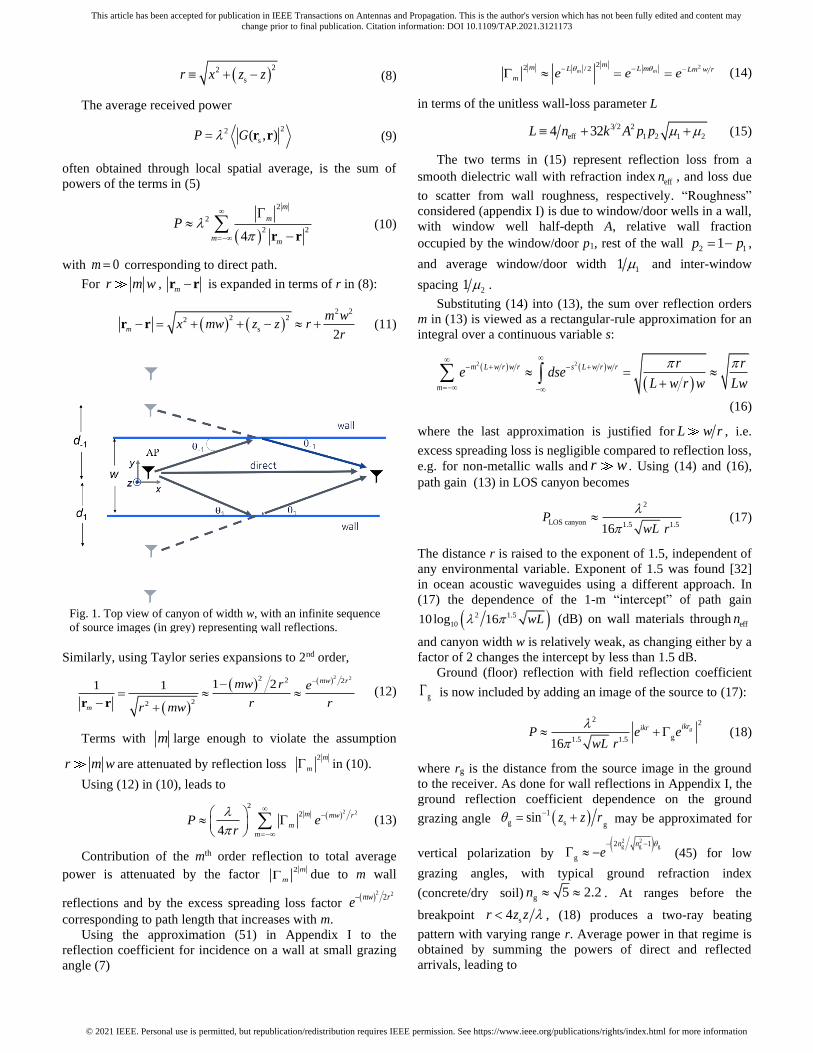
B. Diverse urban canyon measurements vs. model
Path gain from over 800 links measured on 12 streets in
Manhattan at 28 GHz [17] is here compared against formulae
presented above. In all cases, a rooftop (“BS”) antenna was
used to record received power from an omnidirectional
transmitter 1.5 m above street level, placed on the same street
as the rooftop antenna. The joint data set is shown in Fig 16.
Fig. 16. Measured path gain in 12 streets in Manhattan.
Median measured path gain at similar distance on different
streets spans over 30 dB [17], indicating diverse propagation
conditions and leading to 7.9 dB RMS goodness of fit spread
around the slope-intercept fit. For example, fit to measured
path gain at 250 m on a densely vegetated street in Fig. 9 is
some 23 dB lower than on a street with sparse trees in Fig. 15.
Various propagation mechanisms presented in previous
sections contribute to the overall signal power in urban street
canyons. The theoretical model applied consists of the sum of
powers for a path penetrating clutter from the side (40), over-
top of trees contribution (23) and a direct path, attenuated
through clutter:
canyon-total canyon,trees over-top directP P P P= + + (41)
with
v v
2
direct4
rP e
r
− =
(42)
where rv is the part of direct range passing through vegetation,
as estimated from tree locations. Even coarse tree information,
such as “10 m average height trees, along both sides, every
20 m” may be used to estimate rv. In the absence of
vegetation, pedestrians may become dominant with a
scattering cross-section of 2
ped 1 m = , area density of about 1
pedestrian/25 m2 area, which, for 2 m height, corresponds to
volumetric scattererer density of n =1 person/50 m3. The
intrinsic absorption for such sidewalk environment is then
ped n ped 0.02 = = Nep/m. Similarly, attenuation due to
scaffolding, often present on NYC streets, is estimated as
scaff 0.1 = Nep/m.
The composite model (41) is a mixture of components
with specific distance exponents, although it is often
dominated by a particular phenomenon, depending on base
station and vegetation heights and vegetation distribution. For
streets with tree canopy covering the entire street width, the 1st
term in (41) (penetration from the side) is heavily attenuated
and over-top and direct components in (41) dominate. The
exponential absorption loss at 28 GHz is very substantial for
all but small values of rv and contribution from (42) was
found to be significant only at short ranges on one street (W.
11 Str.) where the first 200 m were free of vegetation,
providing for near LOS conditions there. Since each street has
its own predicted path gain curve, dependent on local
conditions, as in Figs. 9, 14 and 15, the 12 predicted curves
are not plotted in Fig. 16 for clarity.
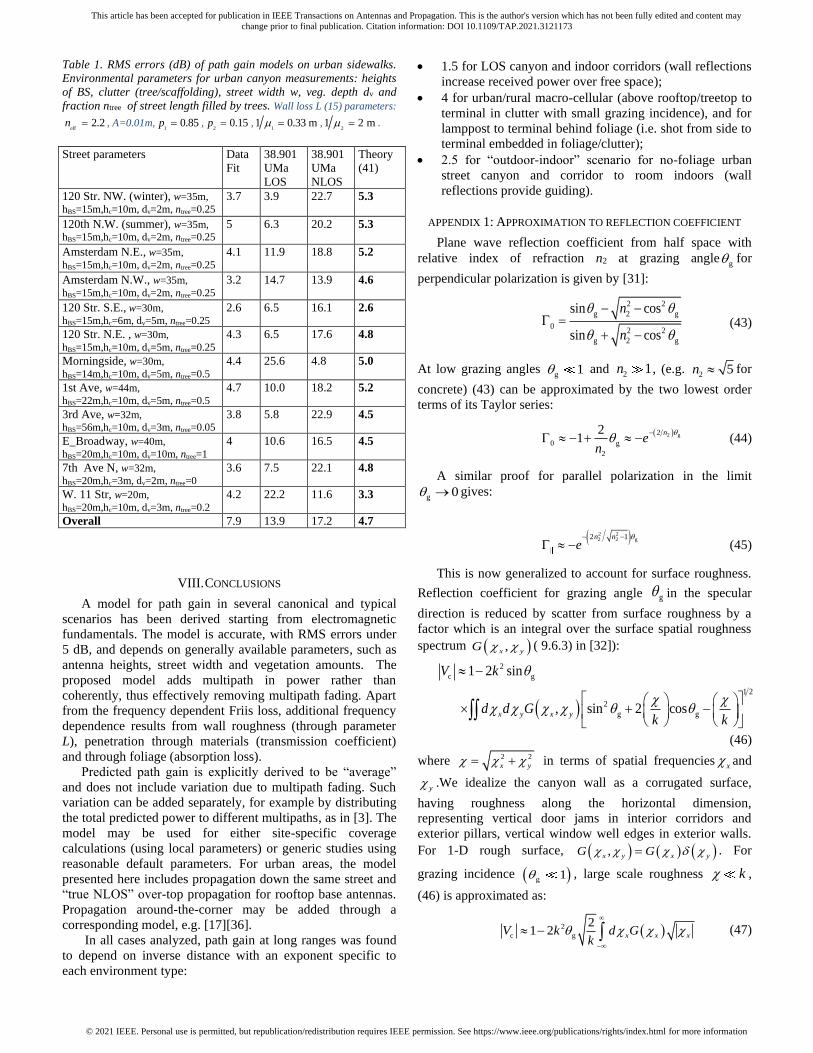
The accuracy of the theoretical formula (41) and 3GPP
urban Macro models (38.901 UMa, [3]) is summarized for
each street measured, as well the data set overall in Table 1.
For each individual street, the theoretical formulae are
seen to be generally more accurate than the 3GPP formulae. A
separate fit to data from each street is usually most accurate
but unavailable until the data is collected, making predictions
unnecessary. Most desired aspect of a model is its ability to
predict measurements yet to be made. It may be observed in
Table 1 that the theoretical model described in this section is
able to take into account general conditions, such as
vegetation amounts in the street, giving overall RMS error of
4.7 dB, comparing favorably against 7.9 dB RMS fit to overall
data set and 3GPP model RMS errors of 13.9/17.2 dB.
Evaluating (41) at 2 GHz for the same set of streets leads
to predicted path gain within 5 dB of the corresponding Friis
free space formula at ranges up to 500 m on most streets
except ones with particularly high tree density. Much lower
foliage absorption v at lower frequencies (0.3 dB/m at 2
GHz) [26] makes the attenuated direct path (42) more
prominent in (41). This may explain the 3GPP UMa LOS
recommendation being close to free space: more reasonable at
cellular frequencies than in the mm wave band.
This article has been accepted for publication in IEEE Transactions on Antennas and Propagation. This is the author's version which has not been fully edited and content may
change prior to final publication. Citation information: DOI 10.1109/TAP.2021.3121173
© 2021 IEEE. Personal use is permitted, but republication/redistribution requires IEEE permission. See https://www.ieee.org/publications/rights/index.html for more information
Table 1. RMS errors (dB) of path gain models on urban sidewalks.
Environmental parameters for urban canyon measurements: heights
of BS, clutter (tree/scaffolding), street width w, veg. depth dv and
fraction ntree of street length filled by trees. Wall loss L (15) parameters:
eff2.2n = , A=0.01m,
10.85p = ,
20.15p = ,
11 0.33 m = ,
21 2 m = .
Street parameters Data
Fit
38.901
UMa
LOS
38.901
UMa
NLOS
Theory
(41)
120 Str. NW. (winter), w=35m, hBS=15m,hc=10m, dv=2m, ntree=0.25
3.7 3.9 22.7 5.3
120th N.W. (summer), w=35m, hBS=15m,hc=10m, dv=2m, ntree=0.25
5 6.3 20.2 5.3
Amsterdam N.E., w=35m, hBS=15m,hc=10m, dv=2m, ntree=0.25
4.1 11.9 18.8 5.2
Amsterdam N.W., w=35m, hBS=15m,hc=10m, dv=2m, ntree=0.25
3.2 14.7 13.9 4.6
120 Str. S.E., w=30m, hBS=15m,hc=6m, dv=5m, ntree=0.25
2.6 6.5 16.1 2.6
120 Str. N.E. , w=30m, hBS=15m,hc=10m, dv=5m, ntree=0.25
4.3 6.5 17.6 4.8
Morningside, w=30m, hBS=14m,hc=10m, dv=5m, ntree=0.5
4.4 25.6 4.8 5.0
1st Ave, w=44m, hBS=22m,hc=10m, dv=5m, ntree=0.5
4.7 10.0 18.2 5.2
3rd Ave, w=32m, hBS=56m,hc=10m, dv=3m, ntree=0.05
3.8 5.8 22.9 4.5
E_Broadway, w=40m, hBS=20m,hc=10m, dv=10m, ntree=1
4 10.6 16.5 4.5
7th Ave N, w=32m, hBS=20m,hc=3m, dv=2m, ntree=0
3.6 7.5 22.1 4.8
W. 11 Str, w=20m, hBS=20m,hc=10m, dv=3m, ntree=0.2
4.2 22.2 11.6 3.3
Overall 7.9 13.9 17.2 4.7
VIII. CONCLUSIONS
A model for path gain in several canonical and typical
scenarios has been derived starting from electromagnetic
fundamentals. The model is accurate, with RMS errors under
5 dB, and depends on generally available parameters, such as
antenna heights, street width and vegetation amounts. The
proposed model adds multipath in power rather than
coherently, thus effectively removing multipath fading. Apart
from the frequency dependent Friis loss, additional frequency
dependence results from wall roughness (through parameter
L), penetration through materials (transmission coefficient)
and through foliage (absorption loss).
Predicted path gain is explicitly derived to be “average”
and does not include variation due to multipath fading. Such
variation can be added separately, for example by distributing
the total predicted power to different multipaths, as in [3]. The
model may be used for either site-specific coverage
calculations (using local parameters) or generic studies using
reasonable default parameters. For urban areas, the model
presented here includes propagation down the same street and
“true NLOS” over-top propagation for rooftop base antennas.
Propagation around-the-corner may be added through a
corresponding model, e.g. [17][36].
In all cases analyzed, path gain at long ranges was found
to depend on inverse distance with an exponent specific to
each environment type:
• 1.5 for LOS canyon and indoor corridors (wall reflections
increase received power over free space);
• 4 for urban/rural macro-cellular (above rooftop/treetop to
terminal in clutter with small grazing incidence), and for
lamppost to terminal behind foliage (i.e. shot from side to
terminal embedded in foliage/clutter);
• 2.5 for “outdoor-indoor” scenario for no-foliage urban
street canyon and corridor to room indoors (wall
reflections provide guiding).
APPENDIX 1: APPROXIMATION TO REFLECTION COEFFICIENT
Plane wave reflection coefficient from half space with
relative index of refraction n2 at grazing angleg for
perpendicular polarization is given by [31]:
2 2
g 2 g
02 2
g 2 g
sin cos
sin cos
n
n
− − =
+ − (43)
At low grazing angles g 1 and 2 1n , (e.g.
2 5n for
concrete) (43) can be approximated by the two lowest order
terms of its Taylor series:
( )2 g2
0 g
2
21
ne
n
− − + − (44)
A similar proof for parallel polarization in the limit
g 0 → gives:
( )2 2
2 2 g2 1n n
e− −
− (45)
This is now generalized to account for surface roughness.
Reflection coefficient for grazing angle g in the specular
direction is reduced by scatter from surface roughness by a
factor which is an integral over the surface spatial roughness
spectrum ( ),x yG ( 9.6.3) in [32]):
( )
2
c g
1 2
2
g g
1 2 sin
, sin 2 cosx y x y
V k
d d Gk k
−
+ −
(46)
where 2 2
x y = + in terms of spatial frequencies x and
y .We idealize the canyon wall as a corrugated surface,
having roughness along the horizontal dimension,
representing vertical door jams in interior corridors and
exterior pillars, vertical window well edges in exterior walls.
For 1-D rough surface, ( ) ( ) ( ),x y x yG G = . For
grazing incidence ( )g 1 , large scale roughness k ,
(46) is approximated as:
( )2
c g
21 2 x x xV k d G
k
−
− (47)

This article has been accepted for publication in IEEE Transactions on Antennas and Propagation. This is the author's version which has not been fully edited and content may
change prior to final publication. Citation information: DOI 10.1109/TAP.2021.3121173
© 2021 IEEE. Personal use is permitted, but republication/redistribution requires IEEE permission. See https://www.ieee.org/publications/rights/index.html for more information
Fig. 17. Top view of a canyon boundary wall as a corrugated 2-state
surface, with alternating wall sections and window well sections of
average width 1/1 and 1/2, respectively.
The wall surface represented as a 2-state random telegraph
signal, Fig. 17, (wall-window well for exterior walls and
wall/doorway in interior corridors) has spatial correlation [23]
( )1 22 2
1 2( ) 4x
R x A p p e
− −
= + (48)
parametrized by amplitude A (half-depth of window well),
state probabilities p1, p2, mean ( )1 2A p p = − and state
transition rates 1 2, (inversely related to average window
width and window separation, respectively). The spectrum
( )xG is the Fourier transform of (48) with respect to x:
( ) ( ) 1 22 2
1 2 2 2
1 2
214
2x x
x
G A p p
+= +
+ +(49)
Substituting (49) into (47) and evaluating the integral leads
to
3 2 21 2 1 2 g163 2 2
c 1 2 1 2 g1 16k A p p
V k A p p e
− +
− + (50)
Total reflection coefficient is taken as a combination of
reflection loss from a smooth dielectric (44) and scatter from
roughness (50):
( ) 3 2 22 g 1 2 1 2 g2 16
0 c
n k A p pV e e
− − + = (51)
APPENDIX II: PATH GAIN FROM FREE SPACE INTO DIFFUSE
HALFSPACE
The canonical problem considered here is the propagation
between a base station placed in free space and a terminal
immersed in a diffusely scattering medium, with the two
regions separated by a planar boundary with a (field)
transmission coefficient T, illustrated in Fig. 18.
Fig. 18. Diffuse halfspace (top) illuminated by a source from free space.
The field ( )OI , sG r r at rs in free half-space, is related [19]
to the field ( )in ,G r r and its normal derivative
( )in , nG r r acting as secondary sources at intermediate
locations r on the boundary between the two regions:
( ) ( )( )
( )( )i
OI
n
in , , ,
, , .s
GG
n n
GdA GG
= −
s
s
r r r rr r r r r r
(52)
In (52), dA is the differential surface area, field ( )in ,G r r is
the field at the boundary point r due to source at r in diffuse
region and ( ) ( )LOS, ,s sG G =r r r r is a field in free space due
to a point source at sr , satisfying the Helmholtz equation (2)
and the boundary condition at the interface between free space
and diffuse scattering half-space:
s i
LOS s
s i
( , ) ,4 4
ik ike e
G
− −
= + − −
r r r r
r rr r r r
(53)
consisting of a spherical wave incident on the surface and a
reflected wave, appearing to emanate from the image source at
ir . The boundary reflection coefficient 1 − for low grazing
angles, approximately valid for grazing incidence over a broad
range of dielectric materials and for both polarizations. This
leads to ( )LOS , 0sG =r r on the boundary, eliminating the 2nd
term in the integrand of (52).
The problem is thus transformed into a problem where there is
a distributed equivalent source, namely a “hot” wall,
illuminated by a field launched from a diffuse interior and
radiating into free space:
( ) ( )( )LOS
OI in
,, ,
w
s
s
y y
GG dAG
y=
=
r r
r r r r (54)
With normal gradient of the free space ( )LOS , sG r r
LOS
0
2.
4
sik r r
s
s sy
G ikd e
y r r r r
−
=
=
− − (55)
The stochastic field ( )in ,G r r at location r on the wall
due to a terminal at depth ind at indoor location r has
undergone scattering and absorption. It is expressed here in
terms of intensity ( ),F r r and a random small-scale
``Rayleigh texture'' ( ), r r [21][30], using [34][35]:
( ) ( ) ( )
( )
( ) ( ) ( )
1/2
in
1*
2
, , ,
, ~ (0,1),
2 ( ) 4, , .
G F
CN
J k
k k
=
− = −
−
r r r r r r
r r
r rr r r r r r
r r
(56)
The field ( )in ,G r r is thus a zero-mean complex Gaussian
process, spatially white in the integration surface (as indicated
This article has been accepted for publication in IEEE Transactions on Antennas and Propagation. This is the author's version which has not been fully edited and content may
change prior to final publication. Citation information: DOI 10.1109/TAP.2021.3121173
© 2021 IEEE. Personal use is permitted, but republication/redistribution requires IEEE permission. See https://www.ieee.org/publications/rights/index.html for more information
by the autocorrelation ( ) −r r ), approximating a surface
field of effective coherence area 2 24 k = [35].
The field intensity ( ) ( )2
r in, ,F G =r r r r is obtained from
the diffusion solution [34] to the radial power flux
in2
in in
(W/m )4
re
r r
− −
, where inr −r r , projected through
angle (Fig. 18) onto the normal to the building wall:
( )
in2
in in
in
, cos4 4
rT eF
r r
r
− = −
−
r r
r r
(57)
where in incos /d r = and the additional factor1 4 is
introduced for consistency between field intensity
( )2
,G r r and power flux. Prior to reaching the free space
half-space, the flux has undergone absorption inre −,
spreading and wall penetration losses 2
T . For radiated power
of unity and in the absence of absorption, 0 = , the radial
power flux incident on the wall at 0 = reduces to 2
in1 4 r ,
as expected from conservation of power.
Substituting (55) and (56) into (54), allows evaluation of
( )2
OI , sG r r as
( )( )
2 2
s
2 42
2
OI
44 (
4, )
s
sGk d
rk
dr
A Fr
=
−r r (58)
Situation of most common interest is when the distance
from the center of the “hot” wall region 0r to the source in
free space is much greater than to the terminal in diffuse
interior region, s 0 inr r −r r . In that case, substituting
(57) into (58) leads to:
( )( )
in2
in
OI 2
in in
2
n
2
i
4
4
4,
4s
srd T
rG
dedA
r rr
−
= −
r r (59)
when the size of the “hot” wall is much greater than r,
integration region in (59) may be first taken as unlimited,
convenient to express in polar coordinates:
( )( )
( )in
22 2
s
4
0 0
s
2in
OI
4
2
2
2
2
4
4
42
4
,4
4
r
s
r
d
d eG
rd
r r
T
r
d er dr
r r
d
r
d Td
r
−
−
= −
−
=
r r
(60)
using2 2
in , r d r dr d = + = . Evaluating (60), and
substituting into (9), produces a remarkably simple form for
average received power
in22 2
s
2 48
dd TP
r
e
−
= (61).
When the effective secondary source field region at the
boundary facing the street/corridor is limited to a 1 2w w
rectangular opening through a high loss wall (e.g. a
window/door in a concrete/plywood wall, especially in mm
wave bands), the area integral in (59) may be evaluated in
rectangular coordinates, using n
2 22
id x yr += + and
indre e −− for in1 d :
( )
1 2in
1 2
in
2 /2 /22 2
s
3 4
/2 /2
22 2 1 1 2s
2 2
1 2
3 4
in
3/22 2 2
in
2
in in
16
tan2 4
4
w wd
w w
d
dP
w
dyd T e
dxr
w wd e T
w
r
d x y
d d
−
− −
− −
+
+ +
+
=
(62)
Equation (62) may be rewritten as
in2 2
s eff
2 48
d
Pd e T
r
−
(63)
In terms of the effective boundary transmission coefficient,
defined for special cases of the aperture
2 1 1 2
eff 1 22 2 2
in 1 2
2 1 1
1
in
2
in
2tan , aperture
2 4
2tan , "street" of width
2
, unbounded aperture
w wT T w w
d w w
wT w
d
d
T
−
−
= + +
=
=
(64)
The 2nd and 3rd line expressions in (64) are obtained as
limiting cases of the 1st line expression by setting 2w → and
1 2,w w → , respectively. Substituting2
effT T= from the last
line in (64) into (63) reproduces (61), as it should for an
unbounded aperture. 2
T is the power transmission coefficient for the material
covering the effective aperture. The material might be glass
for a window, wood for a closed door or air (2
1T = ) for a
street viewed from above. For a more complex boundary with
multiple apertures, e.g. a terminal antenna deep inside a
concrete building with windows, the effective transmission
coefficient may be modeled as a mixture of wall and window
transmission coefficients weighted by corresponding fraction
of the overall building façade [23],[3]:
( )2 2
eff window window window wall1T p T p T= + − (65)
REFERENCES
[1] V. Erceg, S.J. Fortune, J. Ling, A.J.Rustako, R.A. Valenzuela,
"Comparisons of a computer-based propagation prediction tool with experimental data collected in urban microcellular environments," IEEE

This article has been accepted for publication in IEEE Transactions on Antennas and Propagation. This is the author's version which has not been fully edited and content may
change prior to final publication. Citation information: DOI 10.1109/TAP.2021.3121173
© 2021 IEEE. Personal use is permitted, but republication/redistribution requires IEEE permission. See https://www.ieee.org/publications/rights/index.html for more information
J. on Sel. Areas in Communications, May 1997.
[2] K. Rizk, J.-F. Wagen, and F. Gardiol, “Two-dimensional ray-tracing
modeling for propagation prediction in microcellular environments,” IEEE Trans. Veh. Technol., vol. 46, 508–518, May 1997.
[3] 3GPP TR 38.901 V16.1.0 (2019-12), Technical Report,3rd Generation
Partnership Project; Technical Specification Group Radio Access Network; Study on channel model for frequencies from 0.5 to 100 GHz
(Release 16).
[4] WINNER II Channel Models, IST-4-027756, D1.1.2 V1.2, 2007. [5] M. Hata, “Empirical formula for propagation loss in land mobile radio
services,” IEEE Trans. on Vehicular Technology, vol. 29, pp. 317-325,
Aug. 1980. [6] T. S. Rappaport, Y. Xing, G. R. MacCartney, A. F. Molisch, E. Mellios
and J. Zhang, “Overview of millimeter wave communications for fifth-generation (5G) wireless networks-with a focus on propagation models,”
IEEE Transactions on Antennas and Propagation, vol. 65, pp. 6213-
6230, Dec. 2017. [7] J. Ko, Y.-J. Cho, S. Hur, T. Kim, J. Park, A. F. Molisch, K. Haneda, M.
Peter, D. Park, D.-H. Cho, “Millimeter-wave channel measurements and
analysis for statistical spatial channel model in in-building and urban environments at 28 GHz”, IEEE Trans. Wireless Communications, vol.
16, pp. 5853-5868, Sep. 2017.
[8] V. Raghavan, A. Partyka, L. Akhoondzadeh-Asl, M. A. Tassoudji, O. H.
Koymen and J. Sanelli “Millimeter wave channel measurement and
implications for PHY layer design”, IEEE Transactions on Antennas
and Propagation, vol. 65, pp. 6521-6533, Dec. 2017. [9] K. Haneda et al., “5G 3GPP-like channel models for outdoor urban
microcellular and macrocellular environments,” IEEE Vehicular
Technology Conference (VTC Spring), May 2016. [10] K. Haneda, N. Omaki, T. Imai, L. Raschkowski, M. Peter and A.
Roivainen, “Frequency-agile pathloss models for urban street canyons”,
IEEE Transactions on Antennas and Propagation, vol. 64, pp. 1941-1951, May, 2016.
[11] M. Kyro, V. Kolmonen and P. Vainikainen, "Experimental Propagation
Channel Characterization of mm-Wave Radio Links in Urban Scenarios," IEEE Antennas and Wireless Propagation Letters, vol. 11,
pp. 865-868, Aug. 2012.
[12] T. S. Rappaport, F. Gutierrez, E. Ben-Dor, J. N. Murdock, Y. Qiao and J. I. Tamir, "Broadband Millimeter-Wave Propagation Measurements
and Models Using Adaptive-Beam Antennas for Outdoor Urban
Cellular Communications," IEEE Transactions on Antennas and Propagation, vol. 61, pp. 1850-1859, Apr. 2013.
[13] H. J. Thomas, R. S. Cole and G. L. Siqueira, "An experimental study of
the propagation of 55 GHz millimeter waves in an urban mobile radio environment," IEEE Transactions on Vehicular Technology, vol. 43, pp.
140-146, Feb. 1994.
[14] V. Semkin, U. Virk, A. Karttunen, K. Haneda and A. V. Räisänen, "E-band propagation channel measurements in an urban street canyon,"
2015 9th European Conference on Antennas and Propagation (EuCAP),
Lisbon, Portugal, Apr. 2015. [15] H. Masui, T. Kobayashi and M. Akaike, "Microwave path-loss
modeling in urban line-of-sight environments," IEEE Journal on
Selected Areas in Communications, vol. 20, pp. 1151-1155, Aug. 2002. [16] J. Du, D. Chizhik, R. Feick, M. Rodríguez, G. Castro and R. A.
Valenzuela, "Suburban Fixed Wireless Access Channel Measurements
and Models at 28 GHz for 90% Outdoor Coverage," Trans. on Antennas and Propagation, vol. 68, pp. 411-420, Jan. 2020.
[17] J. Du, D. Chizhik, R. A. Valenzuela, R. Feick, G. Castro, M Rodriguez,
T. Chen, M. Kohli, and G. Zussman, “Directional Measurements in Urban Street Canyons from Macro Rooftop Sites at 28 GHz for 90%
Outdoor Coverage," IEEE Trans. on Antennas and Propagation, vol. 69,
pp.3459-3469, Jun. 2021. [18] J. Walfisch, H.L. Bertoni, "A theoretical model of UHF propagation in
urban environments“, IEEE Trans. on Antennas and Propagation, Dec. 1988.
[19] A. Ishimaru, Electromagnetic Wave Propagation, Radiation, and
Scattering, Prentice Hall, 1991. [20] J.-E. Berg, "Building penetration loss along urban street microcells,"
IEEE International Symposium on Personal, Indoor and Mobile Radio
Communications (PIMRC), Oct. 1996. [21] D. Chizhik, J. Ling, and R. A. Valenzuela, “Self-Alignment of
Interference Arising from Hallway Guidance of Diffuse Fields,” IEEE
Trans. on Wireless Communications, vol. 13, July 2014. [22] D. Chizhik, J. Du, R. Feick, M. Rodriguez, G. Castro and R. A.
Valenzuela, "Path Loss and Directional Gain Measurements at 28 GHz
for Non-Line-of-Sight Coverage of Indoors With Corridors," IEEE
Trans. on Antennas and Propagation, vol. 68, pp. 4820-4830, June
2020. [23] D. Chizhik, M. Rodríguez, R. Feick and R. A. Valenzuela, "An Accurate
Field Model Requiring Minimal Map Data for Guiding and Diffusion in
Streets and Buildings," IEEE Trans. on Wireless Communications, vol. 16, pp. 4537-4546, July 2017.
[24] D. Chizhik, J. Du, R. Feick and R. A. Valenzuela, "Theoretical Path
Loss Model for Suburban Fixed Wireless Access and Comparison Against 28 GHz Measurements," 13th European Conference on
Antennas and Propagation (EuCAP), 2019.
[25] A. Y. Nashashibi, K. Sarabandi, S. Oveisgharan, M. C. Dobson, W. S. Walker and E. Burke, "Millimeter-wave measurements of foliage
attenuation and ground reflectivity of tree stands at nadir incidence," IEEE Trans. on Antennas and Propagation, vol. 52, pp. 1211-1222,
May 2004.
[26] Recommendation ITU-R P.833-9, “Attenuation in vegetation”, (09/2016).
[27] D. Chizhik, J. Ling, R.A. Valenzuela, "Radio Wave Diffusion Indoors
and Throughput Scaling with Cell Density," IEEE Trans. on Wireless Communications, Sept. 2012.
[28] J. Du, D. Chizhik, R. Feick, G. Castro, M. Rodríguez and R. A.
Valenzuela, "Suburban Residential Building Penetration Loss at 28 GHz
for Fixed Wireless Access," IEEE Wireless Communications Letters,
vol. 7, pp. 890-893, Dec. 2018.
[29] 3GPP TR 36.814 V9.0.0 (2010-03), Technical Report,3rd Generation Partnership Project;Technical Specification Group Radio Access
Network;Evolved Universal Terrestrial Radio Access (E-UTRA);
Further advancements for E-UTRA physical layer aspects (Release 9). [30] D. Chizhik, J. Ling, "Propagation Over Clutter: Physical Stochastic
Model," IEEE Trans. on Antennas and Propagation, April 2008.
[31] M. Born and E. Wolf, Principles of Optics, Cambridge, U.K., Cambridge Univ. Press, 1997.
[32] L.M.Brekhovskikh,Yu.P. Lysanov, Fundamentals of Ocean Acoustics,
2nd Edition, Springer-Verlag, New York, NY, USA, 1990. [33] A. Papoulis, Probability, Random Variables and Stochastic Processes,
2nd Edition, Mc-Graw-Hill, 2nd Edition, , 1984.
[34] A. Ishimaru, Wave Propagation and Scattering in Random Media, IEEE Press, 1997.
[35] M. Beran and G. Parrent, Theory of Partial Coherence, Prentice-Hall,
1964. [36] J. Lee, H. L. Bertoni, "Coupling at cross, T, and L junctions in tunnels
and urban street canyons," IEEE Trans. on Antennas and Propagation,
May 2003. [37] D. Porrat and D. C. Cox, “UHF propagation in indoor hallways,” IEEE
Trans. Wireless Commun., Jul. 2004.
[38] J. Lahteenmaki, T. Karttaavi, "Measurement of dielectric parameters of wall materials at 60 GHz band," Electronics Letters, vol.32, no.16,
pp.1442-1444, 1 Aug 1996.
[39] M.D. Baker-Jarvis, R.F. Janezic, R.T. Riddle, P. Johnk, C. Kabos, C. Holloway, R.G. Geyer, C.A. Grosvenor, “Measuring the permittivity
and permeability of lossy materials: solids, liquids, metals, building
materials, and negative-index materials”, National Institute of Science and Technology, NIST Technical Note 1536, 2005.
[40] T. Fujii, Y. Ohta, H. Omote, "Empirical Time-Spatial Propagation
formula for outdoor LOS environments," Proc. 5th European
Conference on Antennas and Propagation (EUCAP), April 2011.
Dmitry Chizhik (F'14) received the Ph.D. degree in
electrophysics from Polytechnic University (now NYU), Brooklyn, NY, USA. His thesis work has
been in ultrasonics and non-destructive evaluation.
He joined the Naval Undersea Warfare Center, New London, CT, USA, where he did research in
scattering from ocean floor, geoacoustic modeling of
porous media and shallow water acoustic propagation. In 1996, he joined Bell Laboratories,
working on radio propagation modeling and
measurements, using deterministic and statistical techniques. He has worked on measurement, modeling and channel estimation of MIMO channels. The
results are used both for determination of channel-imposed bounds on channel
capacity, system performance and for optimal antenna array design. His recent work has included system and link simulations of satellite and femto
cell radio communications and mm wave propagation that included all aspects
of the physical layer. His research interests are in acoustic and
This article has been accepted for publication in IEEE Transactions on Antennas and Propagation. This is the author's version which has not been fully edited and content may
change prior to final publication. Citation information: DOI 10.1109/TAP.2021.3121173
© 2021 IEEE. Personal use is permitted, but republication/redistribution requires IEEE permission. See https://www.ieee.org/publications/rights/index.html for more information
electromagnetic wave propagation and scattering, signal processing,
communications, radar, sonar, and medical imaging. He is a recipient of the
Bell Labs President's Award and a Distinguished Member of Technical Staff.
Jinfeng Du (Member, IEEE) received the B.Eng. degree in electronic information engineering from
the University of Science and Technology of
China (USTC), Hefei, China, in 2004, and the M.Sc., Tekn. Lic., and Ph.D. degrees from the
Royal Institute of Technology (KTH), Stockholm,
Sweden, in 2006, 2008, and 2012, respectively. He was a Post-Doctoral Researcher with the
Massachusetts Institute of Technology (MIT), Cambridge, MA, USA, from 2013 to 2015, and
then joined the Bell Labs at Crawford Hill, Holmdel, NJ, USA. His research
interests are in the general area of wireless communications, especially in communication theory, information theory, wireless networks, millimeter-
wave propagation, and channel modeling.
Dr. Du received the Best Paper Award from IC-WCSP in October 2010, and his paper was elected as one of the Best 50 Papers in IEEE GLOBECOM
2014. He received the prestigious Hans Werthen Grant from the Royal
Swedish Academy of Engineering Science (IVA) in 2011, the Chinese
Government Award for Outstanding Self-Financed Students Abroad in 2012,
the International PostDoc Grant from the Swedish Research Council in 2013,
and three grants from the Ericsson Research Foundation.
Reinaldo A. Valenzuela (Fellow, IEEE) received
the B.Sc. degree from the University of Chile, Santiago, Chile, and the Ph.D. degree from the
Imperial College London, London, U.K. He is
currently the Director of the Communication Theory Department and a Distinguished Member of
Technical Staff with Nokia Bell Laboratories,
Murray Hill, NJ. He has published 190 articles and 44 patents. He has over 32, 600 Google Scholar
citations. He is currently engaged in propagation
measurements and models, MIMO/space time systems achieving high capacities using transmit and receive antenna arrays,
HetNets, small cells, and next-generation air interface techniques and
architectures. Dr. Valenzuela is a member of the National Academy of Engineering, a Bell Labs Fellow, a WWRF Fellow, and a Fulbright Senior
Specialist. He was a recipient of the IEEE Eric E. Sumner Award, 2014 IEEE
CTTC Technical Achievement Award, and 2015 IEEE VTS Avant Garde Award. He is a “Highly Cited Author” in Thomson ISI.