Embed Size (px)
Citation preview

1
Universal Health Coverage Assessment: Uganda
Universal Health Coverage Assessment
Uganda
Global Network for Health Equity (GNHE)
December 2014
Zikusooka CM, Kwesiga B, Lagony S, Abewe C

Universal Health Coverage Assessment: Uganda
2
1 HealthNet Consult, Uganda
Universal Health Coverage Assessment:
Uganda
Prepared by Zikusooka CM , Kwesiga B, Lagony S, Abewe C1
For the Global Network for Health Equity (GNHE) With the aid of a grant from the International Development Research Centre (IDRC), Ottawa, Canada
December 2014

3
Universal Health Coverage Assessment: Uganda
IntroductionThis document provides a preliminary assessment of aspects of the Ugandan health system relative to the goal of universal health coverage, with a particular focus on the financing system.
In the 2010 World Health Report, universal health coverage is defined as providing everyone in a country with financial protection from the costs of using health care and ensuring access to the health services they need (World Health Organisation 2010). These services should be of sufficient quality to be effective.
This document presents data that provide insights into the extent of financial protection and access to needed health services in the country.
Key health care expenditure indicators
This section examines overall levels of health expenditure in Uganda and identifies the main sources of health financing (Table 1).2 In 2012, total health expenditure accounted for 8.0% of the country’s GDP. This was a significant commitment of the country’s available resources to the health sector and was considerably higher than the average of 5% for other low-income countries. However, it was still below the global average of 9.2%.
Despite high total spending on health, general government health expenditure as a percentage of total health expenditure was only 24%, compared to the low-income country average of 38%. In addition, the share of total
Table 1: National Health Accounts indicators of health care expenditure and sources of finance in Uganda, 2012
Indicators of the level of health care expenditure
1. Total expenditure on health as % of GDP 8.0%
2. General government expenditure on health as % of GDP 1.9%
3. General government expenditure on health as % of total government expenditure 10.2%
4a. Per capita government expenditure on health at average exchange rate (US$) 10.4
4b. Per capita government expenditure on health (PPP $) 25.7
Indicators of the source of funds for health care
5. General government expenditure on health as % of total expenditure on health* 23.9%
6. Private expenditure on health as % of total expenditure on health** 76.1%
7. External resources for health as % of total expenditure on health# 28.6%
8. Out-of-pocket expenditure on health as % of total expenditure on health 49.3%
9. Out-of-pocket expenditure on health as % of GDP 3.9%
10. Private prepaid plans on health as % of total expenditure on health## 0.2%
Notes:* This includes external revenues (loans and grants) flowing through government accounts.**This includes external resources that flow through NGOs.#Some external resources flow through government and some through NGOs. Indicators 5 and 6 therefore add up to 100% whereas indicator 7 in this Table is a separate indicator altogether. This is different from Figure 1 where donor funds are distinguished from tax-based financing.## This includes voluntary commercial and community-based health insurance.Source: Data drawn from World Health Organisation’s Global Health Expenditure Database (http://apps.who.int/nha/database/Key_Indicators/Index/en)
2 The data quoted in this section all derive from the latest (2012) data in the World Health Organisation’s Global Health Expenditure Database (http://apps.who.int/nha/database/Home/Index/en). The country’s income category is determined from the World Bank’s classification for the same year (http://data.worldbank.org/about/country-and-lending-groups).

Universal Health Coverage Assessment: Uganda
4
government expenditure allocated to the health sector was around 10%: although higher than the average of 8.7% for other low-income countries, this was still well below the 15% target set by the Organisation for African Unity’s 2001 Abuja Declaration (which was equivalent to the global average for 2012).
In fact, government health expenditure translated into only 1.9% of GDP. While this amount was identical to the low-income country average for that year, it is low for what is essentially the mandatory pre-paid component of a health financing system. The global average, for example, was 5.3%.
The challenge faced by the government of Uganda in ensuring adequate coverage is encapsulated by per capita government expenditure on health which was around $26 (in terms of purchasing power parity), similar to the low-income country average of $25 but twenty-five times less than the global average of $652.
As in most low-income countries, Uganda’s share of finances from external resources was considerable at 29% in 2012. This suggests the country is vulnerable to fluctuations in donor financing patterns.
As would have been expected from the relatively low levels of government expenditure, out-of-pocket payments played a significant role in Uganda (at almost half of total
Figure 1: A function summary chart for Uganda (2012)
Sources: Authors’ calculations based on 2011 National Health Accounts from the World Health Organisation’s Global Health Expenditure Database (for revenue) and Uganda’s own National Health Accounts for 2009/10 (Ministry of Health 2013) (for pooling and purchasing)
Private insurance
Private insurance General taxation Donors Out-of-pocket
Ministry of HealthNon-governmental
organizations
Non-governmental organizations
Public providers
Revenuecollection
Pooling No pooling
Individual purchasingPurchasing
Provision Private providers
financing in 2012). This was very high in global terms (where the average was 21% for the same year). It was also well above the 20% limit suggested by the 2010 World Health Report to ensure that financial catastrophe and impoverishment as a result of accessing health care become negligible (World Health Organisation 2010). Given that households’ total consumption constituted a significant proportion of GDP (83%) in 2012,3 high out-of-pocket payments were also likely to have had a significant impact on households’ welfare.
As in most low-income countries, private prepaid plans made a negligible contribution to health financing. All in all, though, private expenditure – which includes out-of-pocket payments, that portion of donor financing that flows through non-governmental organisations and prepaid plans – accounted for three-quarters of health financing in Uganda.
Structure of health system according to health financing functions
Figure 1 provides a summary of the structure of the Ugandan health system, depicted according to the health care financing functions of revenue collection, pooling and
3 This figure was derived from World Bank data accessed at http://data.worldbank.org/indicator/NE.CON.PETC.ZS.

5
Universal Health Coverage Assessment: Uganda
4 The data quoted in this section are slightly different from the previous section because they are based on more detailed disaggregation by the authors of 2011 National Health Accounts from the World Health Organisation’s Global Health Expenditure Database (for revenue) and Uganda’s own National Health Accounts for 2009/10 (Ministry of Health 2013) (for pooling and purchasing).
5 This percentage is estimated based on the Uganda National Household Survey (2010). This is the percentage of the population who reported using government health facilities and community health workers, and excludes those who reported using NGO health facilities and other private facilities (including drug shops, pharmacies and clinics).
purchasing, as well as health service provision. Each block represents the percentage share of overall health care expenditure in the system accounted for by each category of revenue source, pooling and purchasing organisation, and health care provider.4
Revenue collection
As already described, health funding sources in Uganda include tax revenue, substantial out-of-pocket payments, substantial donor funding and minimal voluntary health insurance (through private insurance and community-based insurance).
Tax revenue includes direct and indirect taxes (which account for roughly one-third and two-thirds of taxes respectively). There is no specific tax earmarked for the health sector. Whereas national health insurance (NHI) has been debated in Uganda and significant effort put into designing the policy and sensitising the public, it has not yet been implemented.
External funds (from development partners and global health initiatives) are channelled through general budget support and through projects (on- and off-budget). With respect to the former, development assistance is channelled directly into the central common ‘basket’ from which the Ministry of Finance, Planning and Economic Development allocates to different sectors. A sizeable amount of development assistance is also channelled through specific projects, some implemented by the Ministry of Health and others by NGOs and civil society organisations. A significant proportion of this development assistance for health, some of which is used to procure equipment and commodities outside the country, is provided off-budget (Oliveira Cruz and McPake 2011). Off-budget funds are funds from external sources, which are over and above the Medium-term Expenditure Framework ceilings, and are not channelled through the national budget or planned expenditures for the Ministry of Health.
Private providers, private not-for-profit providers and also the private wings of public sector hospitals charge user fees. Despite the abolition of user fees in the rest of the public sector in 2001, there has been increased use of private facilities because of the poor quality of services in the public sector.
With respect to voluntary private health insurance, the existing schemes cover a very small proportion of the population (less than 1%) and mainly serve corporations (Zikusooka and Kyomuhangi 2007). Most firms pay the full contribution on behalf of employees. A few organizations require their employees to pay a small percentage of the total premium (about 20%). Community-based insurance schemes not only operate on a small scale but have also suffered sustainability problems. This has worsened as the result of a very high dropout rate (Kyomugisha et al. 2008, Basaza et al. 2009).
Pooling
The biggest pool is public funds (that is, tax funding and some development assistance provided through budget support). Unfortunately, this pool is heavily under-resourced. It could be argued that these services should be accessed by the whole population to provide one hundred per cent coverage. However, while the removal of user fees was a welcome reform as far as equity is concerned, Uganda has ended up with a de facto two-tier health system, even within the public sector itself. The poor are left to access the free (but poor quality services) in public health facilities while the rich access services in the private health facilities (of relatively better quality), or in the private wings of public hospitals, but have to pay for them. This means that, in reality, government funding covers services for only a proportion of the population, estimated to be about one third (35.6%).5
Most of the public health budget (85%) is in the form of earmarked funding for specific programmes or health facilities, and this not only limits the flexibility needed in resource allocation but also leads to budgetary distortions (Okwero et al. 2010). Pooled government resources are supposed to be allocated through a resource allocation formula that attempts to take into consideration both equity and efficiency (Ministry of Health 2010). However, the formula in place is currently being revised and, in reality, historical-based budgeting and resource allocation is used, with a few increases and cuts for a few vote holders every year. The allocation of resources from development assistance for donor projects, especially the off-budget support, is not very transparent and is usually based on interventions for specific diseases. In some instances, allocation of external resources is not always in line with core government priorities (ibid).

Universal Health Coverage Assessment: Uganda
6
Funds from development partners that are not channelled through budget support could be considered another pool. Because of the project-by-project approach to providing services, there is a high degree of fragmentation and even duplication of services (particularly given weak systems for the coordination of donor activities). The assessment of development assistance provided through project support is fraught with several challenges: some funding is targeted at national level activities, including procurement, and other funding is targeted at a selected number of districts (varying from one donor to another). Even quantification of project-based funding remains problematic because some donors are not very transparent in reporting their spending. Beyond a two- to three-year timeframe, there is very little predictability and reliability of these funds. Further, many of these funds target vertical activities for a few diseases (such as HIV/AIDs, TB and malaria) and therefore do not benefit the entire health system. This makes this funding approach inefficient, and in some instances funding is not aligned to country priorities. Under these circumstances, it is difficult to establish the proportion of the population benefitting from these resources or the extent to which there are cross-subsidies.
Private voluntary health insurance represents over 20 small risk-pools in the form of small and highly fragmented community-based and commercial health insurance schemes. Community-based schemes are facility-based and have problems with sustainability. Commercial schemes are still in their infancy and cover less than 1% of the population who are based in key urban areas (especially Kampala). They are usually provided by corporate employers for their employees and their dependants. The location and membership of voluntary insurance schemes in Uganda is also a significant factor in limiting risk pooling. Whereas private insurance schemes are mainly located in urban areas, the community-based schemes are in rural areas (Basaza et al. 2009). Cross-subsidies within commercial insurance schemes are further limited by the fact that premiums are related to benefit packages rather than to income level (Zikusooka et al. 2009). There is no formal risk-equalization mechanism in place for existing voluntary health insurance schemes.
Overall, in Uganda the available resource allocation mechanisms are not likely to achieve the objective of attaining equity in resource allocation, as there are many small and fragmented pools with very limited potential for income and risk cross-subsidies. This is aggravated by the heavy reliance on out-of-pocket payments.
Purchasing
Uganda’s health system is made up of multiple purchasers. These are the public sector (the Ministry of health and local government authorities) and the private sector (households, non-profit organisations and health insurers).
The Health Sector Strategic and Investment Plan (2010/2011-2014/2015) defined a benefit package known as the Uganda National Minimum Health Care Package. The package covers five components: health promotion, disease prevention and community health initiatives, epidemic and disaster prevention and response, nutrition, communicable diseases, and non-communicable diseases and conditions. While the package is meant to be accessed by the whole population and fully funded by government, the severe resource constraints mentioned earlier prohibit the provision of the package to its full scope and to the desired quality (Ministry of Health 2010). Issues such as drug shortages and absenteeism of health workers often lead to people having to purchase drugs from private pharmacies or even make informal payments at public facilities (Xu et al. 2006, Svensson and Bjorkman 2009).
The benefit packages provided by donors and private sector providers are not well-defined but their coverage is usually wider in terms of the range of services offered. Private insurance packages are dependent on the individual’s level of contribution and these vary widely. The packages provided by donors and the private sector usually overlap with packages funded through other financing mechanisms, further intensifying fragmentation and inequity in the health sector (Zikusooka et al. 2009).
An important issue to note is that in the Ugandan public sector there is no purchaser-provider split. The Ministry of Health is both a provider and the purchaser of health care services. Individual health care workers are paid for their services using fixed salaries and health facilities are given funding through historical budgets that were initially estimated using a resource allocation formula that took into consideration several factors, including the size of the population served. This means that funding for health facilities is not based on their performance e.g. in terms of a pre-determined set of outputs or outcomes. Therefore the financing incentives provided for improving performance and efficient resource use are relatively weak.
Payment for services in the private sector (including the private wings of public sector hospitals) is on a fee-for-

7
Universal Health Coverage Assessment: Uganda
Table 2: Catastrophic payment indicators for Uganda in 2009/10*
Catastrophic payment headcount index(the percentage of households whose out-of-pocket payments for health care as a percentage of household consumption expenditure exceeded the threshold)
20%
Weighted headcount index** 18.9%
Catastrophic payment gap index(the average amount by which out-of-pocket health care payments as a percentage of household consumption expenditure exceed the threshold)
2.2%
Weighted catastrophic gap index** 1.9%
Notes:* Financial catastrophe is defined as household out-of-pocket spending in excess of the threshold of 10% of gross household expenditure (i.e. including expenditure on food).** The weighted headcount and gap indicate whether it is the rich or poor households who mostly bear the burden of catastrophic payments. If the weighted index exceeds the unweight index, the burden of catastrophic payments falls more on poorer households.Source: HealthNet Consult (2012a)
service basis, often through out-of-pocket payments. This has contributed to the problem of cost escalation in the health sector. There is some degree of competition in the private sector and, with the heavy reliance on out-of-pocket payments, private sector facilities ought to be relatively more inclined to maintain high performance. However, with poor monitoring and regulation of the private sector, and the usual distortions of the health care market, the services in the private sector are not necessarily of the highest quality.
Provision
Uganda has around 5,200 health facilities of varying levels of care. Public health facilities make up around half (55%) of these facilities, while private-not-for-profit and private-for-profit facilities account for 17% and 29% respectively (Ministry of Health 2011). Around 150 of the facilities are hospitals.
Even though there is a wide range of providers, they are concentrated in urban areas while health workers are concentrated in the private sector (Orem and Zikusooka 2010). In addition, the private sector mainly provides curative services, leaving the burden of preventive care to public facilities. As Figure 1 shows, public providers only accounted for 24% of total expenditure, whereas the for-profit sector accounted for as much as 48% with NGOs accounting for the remaining 28% (Ministry of Health 2013). This distribution is inequitable as 85% of the population resides in rural areas and mostly utilises public facilities (Uganda Bureau of Statistics 2010).
6 A Table based on this threshold could not be presented because gap calculations could not be performed when non-subsistence expenditure is used in defining catastrophic payments.
Financial protection and equity in financingA key objective of universal health coverage is to provide financial protection for everyone in the country. Insights into the existing extent of financial protection are provided through indicators such as the extent of catastrophic payments and the level of impoverishment due to paying for health services. This section analyses these indicators for Uganda and then moves on to assess the overall equity of the health financing system.
Catastrophic payment indicators
Using the 10% threshold of gross household expenditure for assessing catastrophic payments, Table 2 shows that as many as a fifth (20%) of Ugandan households incurred catastrophic health expenditures in 2009/10. When a 40% threshold of non-subsistence household expenditure is used, 9% of the households incurred catastrophic payments (HealthNet Consult 2012a).6
Using total consumption expenditure as a measure of welfare, both the catastrophic headcount and the catastrophic gap were concentrated among the richer households, as the weighted estimates are less than the un-weighted estimates. However, when non-subsistence expenditure is used for the calculations, catastrophic payments were concentrated among the poor as the weighted headcount (12.7%) is higher than the unweight headcount (9%). This indicates that for the poor, even very small out-of-pocket payments are likely to be catastrophic.

Universal Health Coverage Assessment: Uganda
8
Impoverishment indicators
While, the extent of catastrophic payments indicates the relative impact of out-of-pocket payments on household welfare, the absolute impact on household welfare is shown by the impoverishment effect. Table 3 shows that, in Uganda, about 66% (or two thirds) of the population lived on less than US$2.5 per day in 2010. When out-of-pocket expenditures on health care are taken into account, another 4% of the population was impoverished, representing a 17.5% relative rise in poverty. This translated into as many as 1.5 million Ugandans.
The normalised poverty gap (also shown in Table 3) measures the percentage of the poverty line necessary to raise an individual who is below the poverty line to that line. The difference between the prepayment and the post payment poverty gaps was high at 2.9%.
Equity in financingEquity in financing is strongly related to financial protection but is a distinct issue and health system goal. It is generally accepted that financing of health care should be according to the ability to pay.
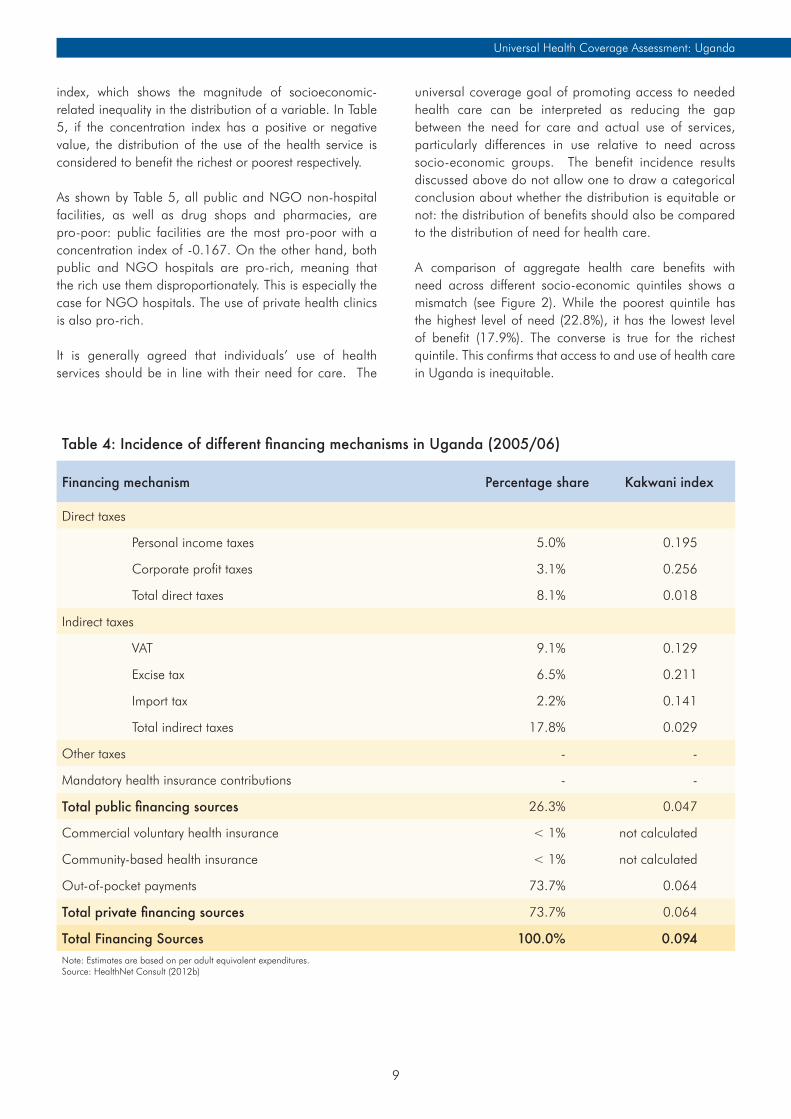
A ‘progressive’ health financing mechanism is one in which the amount richer households pay for health care represents a larger proportion of their income than for poorer households. Relative progressivity is measured by the Kakwani index: a positive value for the index means that the mechanism if progressive; a negative value means that poorer households pay a larger proportion of their income than the rich and that this financing mechanism is therefore regressive. Table 4 provides an overview of the
distribution of the burden of financing the health system across different socio-economic groups (i.e. the financing incidence) as well as the Kakwani index for each financing mechanism.
Table 4 shows that, with respect to direct taxes, both personal and corporate income taxes are progressive with Kakwani indices of 0.195 and 0.256 respectively. Indirect taxes are also progressive, with excise tax the most progressive and value-added tax the least progressive. However, it is important to note that some individual excise taxes are regressive, including taxes on tobacco and kerosene, implying that relying on these specific excise tax components to raise revenue for the health sector may impose the health financing burden on the poor (HealthNet Consult 2012b). Overall, public health financing in Uganda can be considered to have a good element of income cross-subsidies.
Private financing in Uganda, which is predominantly through out-of-pocket payments, is the least progressive of all health care financing mechanisms. However, unlike the situation in many other countries, it is not regressive (possibly because the poorest are not able to access care at all). Nonetheless, the incidence of out-of-pocket payments heavily influences the overall progressivity of health system financing in Uganda, which is only mildly progressive with a Kakwani index of 0.094.
Equitable use of health services and access to needed careThis section considers how benefits from using different types of health services are distributed across socio-economic groups. One measure of this is a concentration
Table 3: Impoverishment indicators for Uganda in 2010 using $2.50 poverty line (2005 PPP)
Pre-payment poverty headcount 65.8%
Post-payment poverty headcount 69.9%
Percentage point change in poverty headcount (pre- to post-payment) 4.0%
Pre-payment normalised poverty gap 26.7%
Post-payment normalised poverty gap 29.6%
Percentage point change in poverty gap (pre- to post-payment) 2.9%
Source: HealthNet Consult 2012a
9
Universal Health Coverage Assessment: Uganda
Table 4: Incidence of different financing mechanisms in Uganda (2005/06)
Financing mechanism Percentage share Kakwani index
Direct taxes
Personal income taxes 5.0% 0.195
Corporate profit taxes 3.1% 0.256
Total direct taxes 8.1% 0.018
Indirect taxes
VAT 9.1% 0.129
Excise tax 6.5% 0.211
Import tax 2.2% 0.141
Total indirect taxes 17.8% 0.029
Other taxes - -
Mandatory health insurance contributions - -
Total public financing sources 26.3% 0.047
Commercial voluntary health insurance < 1% not calculated
Community-based health insurance < 1% not calculated
Out-of-pocket payments 73.7% 0.064
Total private financing sources 73.7% 0.064
Total Financing Sources 100.0% 0.094Note: Estimates are based on per adult equivalent expenditures.Source: HealthNet Consult (2012b)
index, which shows the magnitude of socioeconomic-related inequality in the distribution of a variable. In Table 5, if the concentration index has a positive or negative value, the distribution of the use of the health service is considered to benefit the richest or poorest respectively.
As shown by Table 5, all public and NGO non-hospital facilities, as well as drug shops and pharmacies, are pro-poor: public facilities are the most pro-poor with a concentration index of -0.167. On the other hand, both public and NGO hospitals are pro-rich, meaning that the rich use them disproportionately. This is especially the case for NGO hospitals. The use of private health clinics is also pro-rich.
It is generally agreed that individuals’ use of health services should be in line with their need for care. The
universal coverage goal of promoting access to needed health care can be interpreted as reducing the gap between the need for care and actual use of services, particularly differences in use relative to need across socio-economic groups. The benefit incidence results discussed above do not allow one to draw a categorical conclusion about whether the distribution is equitable or not: the distribution of benefits should also be compared to the distribution of need for health care.
A comparison of aggregate health care benefits with need across different socio-economic quintiles shows a mismatch (see Figure 2). While the poorest quintile has the highest level of need (22.8%), it has the lowest level of benefit (17.9%). The converse is true for the richest quintile. This confirms that access to and use of health care in Uganda is inequitable.

Universal Health Coverage Assessment: Uganda
10
Poorest Second poorest Middle Rich Richest
Figure 2: Distribution of health benefits compared to need for health care in Uganda (2010)
Source: HealthNet Consult (2012c)
% s
hare
of b
enefi
ts a
nd n
eed
100.0%
19.2% 15.7%
21.4%19.0%
22.0%
20.0%
19.5%
22.5%
17.9%22.8%
80.0%
60.0%
40.0%
20.0%
0.0%Total benefits Total need
Table 5: Concentration indexes for benefit incidence of health service use in Uganda 2010Type of Service Concentration Index*Public facilities
Public hospitals (inpatient and outpatient)** 0.095
Public lower-level facilities (outpatient) -0.167
Private not-for-profit facilities NGO hospitals (inpatient and outpatient) 0.233
NGO lower-level facilities (outpatient) -0.039
Private clinics (outpatient) 0.105
Drug shops/pharmacies (outpatient) -0.091
Total not available* Estimates are based on adult-equivalent adjusted household consumption expenditure.** Unfortunately it is not possible to provide a breakdown of information for outpatient and inpatient services.Source: HealthNet Consult (2012c)

11
Universal Health Coverage Assessment: Uganda
ConclusionUganda, like other low-income countries, is characterised by a high burden of disease as well as great resource needs. Yet tax-based funds contribute a relatively small share of total health financing, despite the fact that they are relatively more progressive than out-of-pocket payments. Given that the public sector is heavily constrained in providing an adequate range and quality of services, the population reverts to seeking care from the large private sector, which is perceived to have better quality services. The fact that patients have to pay on an out-of-pocket basis for private care intensifies the exposure to financial risk across the population.
Ugandan households devote a substantial proportion of their household consumption expenditure to out-of-pocket payments for health care, compromising the consumption of other basic household needs such as food, education and housing. For the poor, even very small out-of-pocket payments can be catastrophic and impoverishment due to out-of-pocket payments is high in Uganda. Out-of-pocket payments essentially increase both the extent and the intensity of poverty in the country.
With very limited financial protection and highly fragmented risk pools, there is very little income and risk cross-subsidisation in Uganda. As a consequence, utilisation of health care services is largely dependent on the ability to pay rather than need. Furthermore, purchasing arrangements do not encourage efficient, high-quality service provision or the provision of services that meet patients’ needs. This is mainly due to the lack of active purchasing arrangements to incentivise good performance, especially in the public sector.
One way to look at how Uganda can move from this situation towards universal coverage is to consider the country’s options for expanding fiscal space. Fiscal space has been defined as “the capacity of government to provide additional budgetary resources for a desired purpose without any prejudice to the sustainability of its financial position” (Heller 2006). There are several ways of generating fiscal space, including promoting conducive macroeconomic conditions (in particular stimulating GDP growth and improved tax revenue), prioritising health within the government budget and tapping other sector-specific resources.
Earlier assessments of options for expanding fiscal space for health in Uganda have identified the following issues (see for example, Okwero et al. 2010). Uganda is projected to have a steady growth in GDP of about 6% (Okwero et al. 2010). While this is positive, resource scarcity in Uganda means the country will still have to rely on development assistance in the immediate future, despite the fact that this assistance is unpredictable and comes with allocative inefficiencies.
The country needs to utilise the current mechanisms put in place to ensure donor assistance is more useful by increasing its effectiveness and equity. These include policy frameworks such as the Accra Agenda for Action and the Paris Declaration of 2005 whose principles are set out in the International Health Partnership and related Initiatives (IHP+) compact. These aim to make donor funding more beneficial through alignment with national priorities and the broader development agenda, harmonised donor funding and increased funding predictability.
With respect to re-prioritising within the current government budget, Uganda has failed to attain the Abuja target, let alone reach what it considered a more realistic target of 13% in its health sector strategic plan (Ministry of Health 2010). The prospects of increasing health resources through the budget seem to be dwindling as the health sector has been crowded out by other government priorities, particularly infrastructural development and the education sector.
Leveraging other sector-specific resources through implementing mandatory health insurance is thus seen as an area where Uganda should look to increase public sector health resources. Uganda is still considering this policy option. Significant steps have been made in the preparations and design of the national health insurance (NHI)7 policy, with extensive efforts having gone into development, design and stakeholder sensitisation. However, there is still no consensus around the policy or acceptance of the policy by all stakeholders.
The proposed NHI scheme has potential for improving risk-pooling and increasing coverage of the population through the creation of an integrated risk pool, thereby reducing the current fragmentation. This would only be achieved if the new scheme successfully integrated all the existing small community-based and commercial
7 Different countries use the terms ‘national health insurance,’ ‘social health insurance’ and ‘social security’ differently to describe different types of mandatory health insurance. In each country assessment in this series, the term applied is the one commonly in use in the country in question. Sometimes, then, the term ’national health insurance’ is used for a scheme that does not cover the entire population (and is therefore more akin to what is known as social health insurance in other countries because it covers only a sub-set of the population). This is the case for Uganda, where the proposed NHI will probably only cover formal sector employees.

Universal Health Coverage Assessment: Uganda
12
insurance schemes. Although such considerations have been taken into account in the design of NHI, no concrete practical steps have been articulated on how this would be achieved. There is also a proposal to put in place a solidarity fund as part of NHI to enable rich households to subsidise the poor. However, the fact that the new insurance scheme would only cover the formal sector, which is much smaller than the informal sector, will be a major limitation in extending coverage.
As has been done in other countries in Africa, Uganda could also look at tax levies earmarked for the health sector. This would help address the sustainability limitations associated with premium-based contributions for community-based schemes where the informal sector is dominant.
Finally, wastage is a major issue in use of health sector resources. Making better use of existing resources would require government to institute mechanisms for monitoring and incentivising efficient performance. Improving health workforce performance, and drug procurement and logistics management mechanisms, are important avenues for increasing efficiency and reducing wastage. Generating the necessary political will and political commitment to fight corruption will also go a long way to increase the resources available to finance interventions in the health sector.
In conclusion, while increased mobilisation of resources is important in increasing budgetary resources available for the health sector, utilising available resources more equitably and efficiently is also crucial.

13
Universal Health Coverage Assessment: Uganda
References
Basaza RB, Criel B, Van der Stuyft P. 2010. Community health insurance amidst abolition of user fees in Uganda: the view from policy makers and health service managers. BMC Health Services Research; 10(1): 33.
Basaza R, Pariyo G, Criel B. 2009. What are the emerging features of community health insurance schemes in east Africa? Risk Management and Healthcare Policy; 2: 47-53.
HealthNet Consult. 2012a. Catastrophic health spending and impoverishment analysis for Uganda 2005/6 and 2009/10. Kampala, Uganda: HealthNet Consult.
HealthNet Consult. 2012b. Financing incidence analysis for Uganda 2005/6 and 2009/10. Kampala, Uganda: HealthNet Consult.
HealthNet Consult. 2012c. Who benefits from health care services in Uganda? System-wide benefit incidence analysis for Uganda 2005/6 and 2009/10. Kampala, Uganda: HealthNet Consult.
Heller PS. 2006. The prospects of creating ‘fiscal space’ for the health sector.’ Health Policy and Planning; 21(2): 75-79.
Kyomugisha E, Buregyeya E, Ekirapa E, Mugisha JF, Bazeyo W. 2008. Building strategies for sustainability and equity of pre-payment schemes in Uganda: bridging gaps. Harare: Regional Network for Equity in Southern Africa
McIntyre D, Kutzin J. 2011. Revenue collection and pooling arrangements in health care financing. In: Smith R, Hanson K (eds). 2011. Health systems in low- and middle-income countries. Oxford: Oxford University Press.
McIntyre D, Kutzin J. 2014. Guidance on conducting a situation analysis of health financing for universal health coverage. Geneva: World Health Organisation.
Mills A, Ataguba JE, Akazili J, Borghi J, Garshong B,
Makawia S, Mtei G, Harris B, Macha J, Meheus F, McIntyre D. 2012. Equity in financing and use of health care in Ghana, South Africa, and Tanzania: implications for paths to universal coverage. The Lancet; 380(9837): 126-133.
Ministry of Health. 2010. Health Sector Strategic and Investment Plan (HSSIP). Kampala: Ministry of Health, Uganda.
Ministry of Health. 2013. National Health Accounts FY 2008/09 and FY 2009/10. Tracking resource flows in the health system in Uganda for the Financial Year 2008/09 And Financial Year 2009/10. Kampala: Ministry of Health, Uganda
Ministry of Health. 2012. Annual Health Sector Performance Report Financial year 2010/2011. Kampala: Ministry of Health, Uganda
Okwero P, Tandon A, Sparkes S McLaughlin J, Hoogeveen JG. 2010. Fiscal space for health in Uganda. Washington: The World Bank.
Oliveira Cruz V, McPake B. 2011. Global Health Initiatives and aid effectiveness: insights from a Ugandan case study. Globalization and Health; 7(1): 20.
Orem JN, Zikusooka CM. 2010. Health financing reform in Uganda: how equitable is the proposed National Health Insurance scheme?” International Journal for Equity in Health; 9: 23-23.
Svensson J, Bjorkman M. 2009. Efficiency and demand for health services: survey evidence on public and private providers of primary health care in Uganda. Washington: The World Bank.
Tandon A, Cashin C. 2010. Assessing public expenditure on health from a fiscal space perspective. Washington: The World Bank.
Uganda Bureau of Statistics. 2010. Socio-economic module based on the Uganda National Household Survey of 2009/10. Kampala, UBOS
World Health Organization. 2010. Health system financing: the path to universal coverage. The World Health Report 2010. Geneva: World Health organization.
Xu K., Evans DB, Kadama B, Nabyonga J, Ogwal PO, Nabukhonzo P, Aguilar AM. 2006. Understanding the impact of eliminating user fees: utilization and catastrophic health expenditures in Uganda. Social Science and Medicine; 62(4): 866-876.

Universal Health Coverage Assessment: Uganda
14
Zikusooka C, Kyomuhangi R. 2007. Private medical pre-payment and insurance schemes in Uganda: what can the proposed SHI policy learn from them? Harare: Regional Network for Equity in Southern Africa.
Zikusooka CM, Tumwine M, Tutembe P. 2009. Financing for HIV, AIDS, TB and Malaria in Uganda: an equity analysis: Discussion paper 75. Harare: HealthNet Consult, EQUINET.

15
Universal Health Coverage Assessment: Uganda

Universal Health Coverage Assessment: Uganda
16
Acknowledgments
This country assessment is part of a series produced by GNHE (the Global Network for Health Equity) to profile universal health coverage and challenges to its attainment in countries around the world. The cover photograph for this assessment was taken by Hugh Rigby (© 2001 Hugh Rigby, courtesy of Photoshare).
The series draws on aspects of: McIntyre D, Kutzin J. 2014. Guidance on conducting a situation analysis of health financing for universal health coverage. Version 1.0. Geneva: World Health Organization. The series is edited by Jane Doherty and desk-top published by Harees Hashim.
Chamara Anuranga produced the function summary charts for the series based on data supplied by the authors.
The work of GNHE and this series is funded by a grant from IDRC (the International Development Research Centre) through Grant No. 106439.
More about GNHE …
GNHE is a partnership formed by three regional health equity networks – SHIELD (Strategies for Health Insurance for Equity in Less Developed Countries Network in Africa), EQUITAP (Equity in Asia-Pacific Health Systems Network in the Asia-Pacific, and LANET (Latin American Research Network on Financial Protection in the Americas). The three networks encompass more than 100 researchers working in at least 35 research institutions across the globe.
GNHE is coordinated by three institutions collaborating in this project, namely: the Mexican Health Foundation (FUNSALUD); the Health Economics Unit of the University of Cape Town in South Africa; and the Institute for Health Policy based in Sri Lanka.
More information on GNHE, its partners and its work can be found at http://gnhe.org