Embed Size (px)
Citation preview

09
UNIVERSAL ELECTRONICS INC.
09 ANNUAL REPORT
UNIVERSAL ELECTRONICS INC. 6101 GATEWAY DRIVECYPRESS, CA 90630
www.uei.com
09 UNIVERSAL ELECTRONICS INC. ANNUAL REPORT

CERTIFICATIONS
The Company fi led with the Securities and Exchange com-mission, as Exhibit 31 to the Company’s Annual Report on Form 10-K for the 2009 fi scal year, certifi cations of its Chief Executive Offi cer and Chief Financial Offi cer regarding the quality of the Company’s public disclosures.
FORM 10 -K
Any stockholder who desires a copy of the Company’s 2009 Annual Report on Form 10-K fi led with the Securities and Exchange Commission may obtain a copy (excluding exhibits) without charge by addressing a request to:
Investor RelationsUniversal Electroncis Inc.6101 Gateway DriveCypress, California 90630
A charge equal to the reproduction cost will be made if the exhibits are requested. Universal Electronics’ Internet address is www.uei.com. Universal Electronics makes avail-able through its internet website its annual report on Form 10-K. Investors may also obtain a copy of our 2009 Annual Report on Form 10-K, including exhibits, from the “Investor” section of our website at www.uei.com, clicking on “SEC Filings.”
INTERNET USERS
We invite you to learn more about UEI’s business and growth opportunities by visiting the “Investor” section of our website at www.uei.com. This section includes investor presentations, earnings conference calls, press releases, SEC fi lings, company history, and information about the company’s governance and Board of Directors.
Universal Electronics Inc. is
an equal opportunity employer.
BRIDGING THE GAP BETWEEN TECHNOLOGY AND NEEDS. CONSUMERS AND CUSTOMERS
ARE THE DRIVING FORCE FOR ALL OF OUR TECHNOLOGICAL IDEAS AND APPLICATIONS.
UEI LISTENS DILIGENTLY AND TURNS OUT SOLUTIONS ACCORDINGLY.
UEI
CHNOLOOOGY | TECHNNNNNNNNNNOOOOOOLLLOGGGY || TTEECCHHHHHNNNNNOOOOLLLLLLLLLLOOOOOOOOOOGY|
TECHNO
LOG
Y|
TE
CH
NNNNNNNOOOOOOOOOOOOOO
LO
GY
|T
EC
HN
OL
OG
Y|
TE
CH
NO
LO
GY
|T
EC
HN
OLO
GY
|TEC
HN
OLO
GGGYYY|
CO
N
SUMMM
EERNEEDS
|CONSUMER NEEDS | CONSUMER NEEDS | CONSUM
LLOOEOO
GGRGGYY NN
EEDS
|
CO
NS
UM
ER
NE
ED
S|
CO
NS
UM
ER
NE
ED
S|
CO
NS
UM
ER
NE
ED
S|
C

At UEI, we are obsessed with a certain kind of technology; the kind that makes people’s lives infi nitely simpler.
Our products are designed to cut through the complexity; utility sits up front, ego sits in back.
We start with a simple premise. We ask people, “What do you want our products to do for you?” They tell us; we apply it; and amazing things happen.
We’re obsessed with advancing the power of simplicity, and coming up with the most effi cient, practical, and cost effective solutions.
1

SUCCESS BELONGS TO THE EFFICIENT. INVESTING IN THE MOST ADVANCED MICROPROCESSOR TECHNOLOGY GETS US
TO THE NEXT GENERATION OF WIRELESS CONTROLS QUICKER. STRATEGIC PARTNERSHIPS HELP EXPAND OUR BUSINESS IN
EXCITING NEW WAYS. GOING GLOBAL HELPS US LEVERAGE OUR REACH TO MAKE THE MOST OUT OF EVERY OPPORTUNITY.
A PARTIAL LIST OF UEI’S GLOBAL CUSTOMER BASE
Subscription Broadcasting
Airtel
Astro
Cablevision
Caiway
Canadian Cable Systems Alliance
Charter
Chungwa Telecom
Comcast
Cox Communications
DIRECTV
Dish Network
Echostar
Foxtel
Lodgenet
Motorola
Multichoice
PCCW
Reliance
Rogers
Scientifi c Atlanta
BSkyB
Sky Italia
Sky PerfecTV!
Time Warner Cable
Yes HD
Consumer Electronics
Bose
Denon
Escient
Microsoft
Mitsubishi Electric
Monster
Onkyo
Panasonic
Philips
Sony
Vizio
Yamaha
Consumer Accessories
Argos
Auchan
Audiovox
Best Buy
Carrefour
Costco
Crestron
Dixons
El Corte Ingles
Jasco
Littlewoods
Media Markt
Wal-Mart
2

UEI is a truly global enterprise as diverse and collegial in the makeup of our employee teams as we are in the people, partners, and markets we serve.
And while we have unquestionably broadened our reach along with our products and services, today’s UEI is simply the latest expression of an idea that has never changed: we are still obsessed with turning technology into solutions for customers everywhere.
3

The art of turning technology into solutions
1
3
2
4

Control
Consolidating and simplifying control of home devices demands the ability to understand and control every device in your home. Our global database of control codes and how it’s delivered is vital to utilizing every feature in a device — and assuring compat-ibility of universal controllers. UEI owns over 180 innovative control patents, has over 200 customers worldwide in OEM, Subscription Broadcast, and retail markets, and counts over 20 years experience in leading edge control technology. We’ve got things under control.
Connectivity
A single wireless solution does not address all of the applications and devices connected in the home. UEI’s approach? Create custom-ized solutions based on their intended applications and uses. This ensures simplifi ed, interactive setup and gives the user a per-sonal sense of control. A diverse set of connecting technologies is available, from infrared (IR) to radio frequency (RF), and from Bluetooth® to Wi-Fi®. UEI has the expertise to match the right tech-nology to the right solution. What new technology is coming up next? How about smart, wireless and wired translators seamlessly connecting all of the various “ecosystems” in the home?
Interactivity
The content explosion in the home is astounding. From Internet, to cable, to satellite, to direct-to-home, the options for accessing content are ever-changing and ever-evolv-ing. The more intuitive and interac-tive the experience, the more likely the user is to stay engaged. The handheld controller is key to this experience. UEI has a multitude of advanced; interactive navigation solutions, such as familiar 1-D list navigation, 2-D click or fl ick naviga-tion and selection; full, on-screen cursor control and easy text entry; and pointing devices for true 3-D navigation and interactive gaming. What’s on the horizon? Intelligent remotes that confi gure themselves based on consumer habits.
Life is complicated enough. Do you really need one more complication to take time away from the things you truly enjoy? Things like your family, your friends, or the time you set aside to watch TV, listen to your music, surf the Internet, or just dim the lights and relax? UEI excels at making control technology simple. It helps all of the components in your home perform effortlessly together. Imagine technology that easy.
1 2 3
5 univ
ersa
l el
ectr
onic
s in
c. 0
9 a
nnua
l re
port
is s
impl
icit
y th
e hi
ghes
t fo
rm o
f te
chno
logy
?
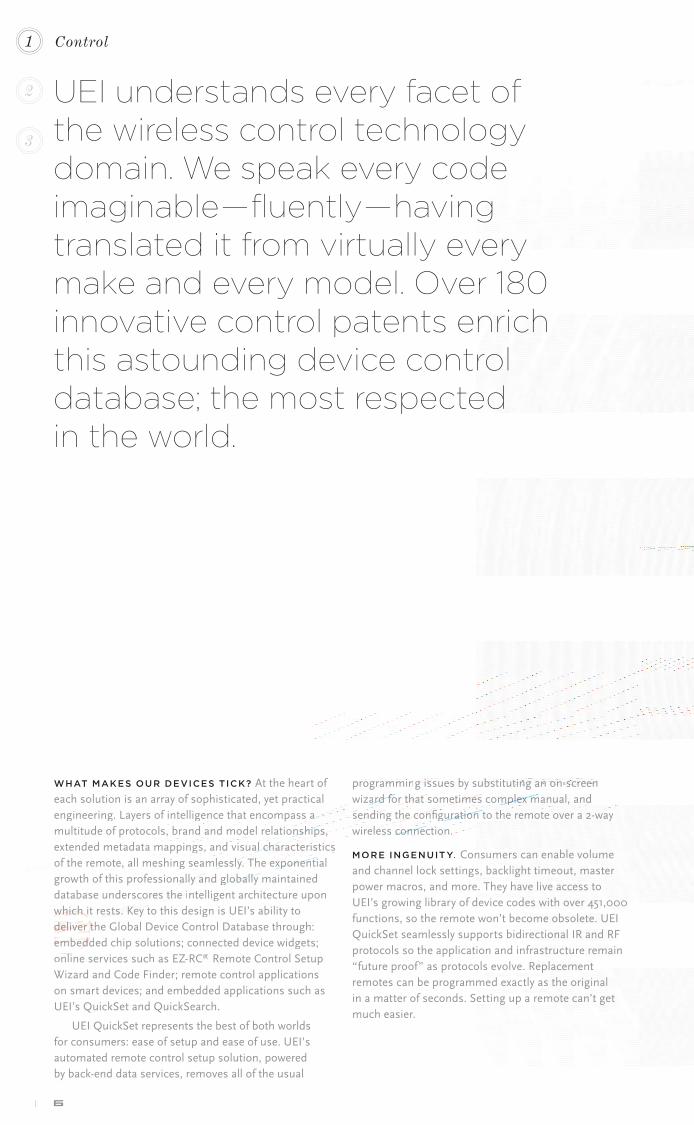
WHAT MAKES OUR DEVICES TICK? At the heart of each solution is an array of sophisticated, yet practicalengineering. Layers of intelligence that encompass a multitude of protocols, brand and model relationnnshshshshshhipipipipipipipps,s,s,extended metadata mappings, and visuall ccc cchahahahahaararactcterrisisstititicscc of the remote, all meshing seamlesesesesslslslslly.y. TThehe eexpxxpxpxpxponononononenenenee iitial growth of this professionaaallllly yyy anand d glglglglg obbobobobalalalallylll maintaineddatabase underscororresesees tthehehehe iiiintntntelligent architecture uponwhwhwhwhwhicicicicich hhhhh it ressstststs. . KeKeKey to this design is UEI’s ability todededededed lilililil veveveveverrrr tthtttt e Global Device Control Database through:ememememe bebbbedddddddddddded chip solutions; connected device widgets; onlillilline services such as EZ-RC® Remote Control SetupWizard and Code Finder; remote control applicationson smart devices; and embedded applications such asUEI’s QuickSet and QuickSearch.
UEI QuickSet represents the best of both worlds for consumers: ease of setup and ease of use. UEI’s automated remote control setup solution, poweredby back-end data services, removes all of the usual
programminnnnnnng ggggggg isisisisisisissueseseseseses bbbbbbyyy substitututututuuutititititititingngnnnnn an on-ssssssssscrcrcrcrcrcrcrcrcrcrrreeeeeeeeeeeeeeeeee n wizaaaardrdrdrdrdrdrd ffffffffor tttthahahahat tttt someetititititimememememes compmpmpmpmpmpmpmppmpleleeleeleelelelex xxxxxxxxxx manual, and seeendndndndininini g the e e cocococonfinfifi ggggggggurrrrrrrratatatatatatatatatioioioioioiooioionn to the remote over a 2-waywiwirereleless ccccccconononononnononnennnnnn ction.
MORE INGENUIT Y. Consumers can enable volumeand channel lock settings, backlight timeout, master power macros, and more. They have live access to UEI’s growing library of device codes with over 451,000functions, so the remote won’t become obsolete. UEI QuickSet seamlessly supports bidirectional IR and RF protocols so the application and infrastructure remain “future proof” as protocols evolve. Replacement remotes can be programmed exactly as the original in a matter of seconds. Setting up a remote can’t get much easier.
UEI understands every facet of the wireless control technology domain. We speak every code imaginable — fl uently — having translated it from virtually every make and every model. Over 180 innovative control patents enrich this astounding device control database; the most respected in the world.
Control1
2
3
6

UEI QUQUQUICKICKSEETETETSESE : S: S: SIMPMPLE,,E,E,,, ON ON ONONONON SC SC SCREEEEEEN SN S SSETET TT UPUP.UPUUPUP.
1 START THE ON-N SCRSCREEN WIWIZARD.
2 USE YOUR RREMOTE EE TO WALALK TK THROHROHROOUUGGHGHGHGH T THTH TTHE SIMPLE E E INININSIINSINSTTRRRRUT CTCCTTTITITITTTTIOONSOOO . .
3 3 TTTHE HE HE TARGETT DE DEDD VICVICVICVICVICVICE PE PE PE PE PE PRRROGROGROGRRRAMMMSSS YYOUR REMOTOTE FOR YYYYOUYOU THROUOUGH TTHEE WIIRRREEEEEEELELEEEEEEEEE ESSESSSS TW TWT O-WO-WWAY YYYAA CONCONCOCCC NECNECN TIOTIOION.N.N..
7 univ
ersa
l el
ectr
onic
s in
c. 0
9 a
nnua
l re
port
what
mak
es o
ur c
ontr
ol d
evic
es s
o lead
ing
edge
? th
e la
yers
of
inte
llig
ence
ins
ide.

THE LIVING ROOM IS THE PLACE WE GO TO RELAX. It’s also our personal multimedia universe. At UEI, we are the innovators of control and happy to share what we know; how to manage easy control over a collection of distinct devices; how to get those devices to synch up and work together; how to fully utilize emerging technology; and how to stay in control of the exponen-tial growth in functionality. That’s a huge to do list, and only the most intelligent interface technology can deliver.
UEI’s early expertise in IR naturally led us to build a strong RF portfolio that meets the growing need to both access and control content in the home. UEI began building RF solutions in 1992. Our RF solutions enable a range of user applications: wireless transfer, stream-ing digital media, remote control browsing, operation of in-home lighting, and universal control of an IR-device without line of sight. We build one-way custom RF solu-tions based on our ASK and FSK technology, two-way RF
solutions based on standards such as Z-wave®, ZigBee®, Wi-Fi®, and proprietary solutions for upcoming stan-dards. Case in point, the 802.15.4 compliant platforms can be extended to the more energy effi cient RF4CE. Likewise, Bluetooth enables interoperability with a standard large system of connected devices in the home. Among them are game consoles, set-top boxes, smartphones, and wireless headsets, all promis-ing exciting new applications. UEI can optimize any of these to meet basic to highly interactive customer application requirements.
Other building blocks of note include XMP2 (eXten-sible Multimedia Protocol) two-way IR that is designed for interactive applications, and services. It is employed by consumer electronics partner Onkyo to enable our automated remote control setup solution, UEI QuickSet, in a line of receivers, and by DIRECTV® to control H24 and HR24D set top boxes.
We empower people with intelligent solutions to keep things simple. We are the architects of the connected home.
Connnectivity
8
1
2
3

A PA PA PROLROLROLOLIFEEI RATR IOIONIONONO OFFFFFFF HO H H MMEME MEMEMEMM DEVDEVDEVDEVDE ICEICECECEES AAAASS ND NDNDN COCONONONCONTENTENT
TTHE EX EXPANPANSION O OOF TECHECHNOLLLLOGYYOOO ININNN THTHTHTH T T TTT E E HOMEOMEOMOMEOMM CRCREATEATATATATAEAA ES EE
A WAA WIDEIDE RA RANGENGE OF TETETECHNCC OLOOLOGY CHOOCHCHC ICECEI S FS FS F FFFFFOR ROO CONCONONONONSUMSS ERSRSSSSSS. . .
MANMANAGIAGING NG THITHIS TECHHHNOLNOLNOLN OGY REREQUIRERERES T THTHE GE GGGGGGUIDUIDUIUIUU ANCANCCCCE OE EEEEEE F
AN EXPERTER , OONENE WHO KNNOWSOWSOWSWSO CONTRROL O DEVDEVDEVICECECES, S, TECTECTETTT HNOOLO-LO-OLLOLOO
GIES, AND COMMUNICATIION ON N PROPROPROPR TOCOLSS —— AN EXEXEXPE ERTERTER LI LLILIKE KEKKK
UEI THAT HAS BEEN A LEADDER ER ER FORFOFOO OVER 20 20 YEAEAARS.RSRRS
9 univ
ersa
l el
ectr
onic
s in
c. 0
9 a
nnua
l re
port
whil
e ot
hers
per
fect
the
pix
els,
we
are
conn
ecti
ng t
he d
igit
al d
ots.

BEFORE WE DESIGN the most engaging interactive navigation solutions, we go to the most knowledgeable and valuable source we know: people who use these products. This has led to an advanced series of practical interactive navigational devices.
Among them are UEI’s next generation remote, Dolphin, which translates all hand movements into on-screen cursor movements, making navigations as simple as pointing and clicking, and Scepter, which offers an ideal pointing device for true 3D navigation.
Glimmer is a demonstration platform that allows customers to experience new technolo-gies in working remotes by integrating IR and
Bluetooth compatible chip solutions. This com-bination leverages an entire network of existing home devices so they can connect and interact with a multitude of other Bluetooth-enabled devices. These range from next-generation set-top boxes to game consoles to SmartPhones. This provides a foundation for other intrigu-ing and powerful applications to emerge. Glimmer2 uses a full touchpad to simplify the familiar remote key layout without sacrifi cing any functionality. It also provides full on-screen cursor control and an easy text entry keyboard.
The litmus test for all these devices is ease of setup, ease of use, and an uncompromising remote control experience.
Home is the center of our digital entertainment culture. The average American household owns 23 CE products and has a growing appetite for more. UEI is at the center, providing simple, more intuitive, and engaging ways for people to interact with the explosion of content coming to home entertainment systems worldwide.
Interactivity
OMMON NAVIGATIONAL DEVICE IN MANY NY PERPERPERSONSOS AL COMPUTTERSERSRS. TTTTTOTOTOOOOUUOUUUUOUTOTT CCHPCCCC ADDDDDDSSSSSSSDSD AR E A C
GGGGLGLGLLLLLLILILLIILIIIIIGGGLGG ILGGLLL MMMMMMMMMMMMMEMMMMM RRRR RR R 222222222RR 22 A FULL TOUCHPAD, FULL ON-SCREEN CURSRSOROR CONCONCONTROTROTROL, AN EASY TY TEEXXTTE AP PLIES
ALL OF THE FAMILIAR FUNCTIONS OF AA ST STTANDANNDDARDARDARD CO CO CONTROL DEVVIICCCEE..EEEENNNNNTTTTTNTTTTENNNE TRRYRYRYYY Y RYRR KEYYYYYBOBOBOOOBOOABOBBOOBOOOOBOB RD, AND
111110100000000000000
1
2
3

NAVIGATING THE EXPLOSION OF CONTENT: WITH VIDEO-ON-DEMAND, IPTV, AND OTHER BROADBAND
SERVICES ON THE RISE, TELEVISION CONTINUES TO GROW AS THE CENTRAL ENTERTAINMENT HUB. THE
DOLPHIN REMOTE WITH POINT AND CLICK TECHNOLOGY MAKES NAVIGATION AND SELECTION EASIER THAN
EVER BY CHANGING THE WAY VIEWERS INTERACT WITH CONTENT.11
it’s
a s
impl
e pr
opos
al.
we w
ant to
see
as
many
peo
ple
get
enga
ged
as p
ossi
ble.
un
iver
sal
elec
tron
ics
inc.
09 a
nnua
l re
port

WHERE DOES IT GO FROM HERE? CREATIVE, SUSTAINABLE DESIGNS, AND ENGINEERING LIKE THIS
UNIQUELY DESIGNED, RECHARGEABLE SOLUTION FOR YES HD, KEEPS UNIVERSAL ELECTRONICS AT THE
FOREFRONT OF HAND HELD REMOTE CONTROLS. FUTURE POSSIBILITIES ARE BOUNDLESS.
12

is s
impl
icit
y th
e hi
ghes
t fo
rm o
f hi
-tec
hnol
ogy?
We live at net speed and work in a “real time” world. That’s the nature of our business. But we also think about the future.
To help in that quest, UEI continues to empower its Innovations Group to constantly imagine the possibilities. We set objectives. We expect accomplishments, blue sky, yet down-to-earth.
We envision the future as a place where UEI products, services, and technologies will fl ourish. Part of that success will come from the insights we draw from our customers. Part from continued growth of our own knowledge. And part from the strong partnerships we’ve developed with leading industry players.
We envision the future as a place where sustainable products make their way into everyday life. And we reach for solutions yet to be imagined.
13 un
iver
sal
elec
tron
ics
inc.
09 a
nnua
l re
port

I am pleased to report that Universal Electronics Inc. achieved a record revenue year in 2009. Net sales reached a milestone level, topping $300 million at $317.6 million for the full year 2009. This is up from $287.1 million the previous year. The fourth quarter 2009 revenue of $84.9 million was a quarterly record for revenue.
2009 represents the eighth straight year of continu-ous revenue growth from just over $100 million in 2002 to over $300 million in 2009, a threefold increase, and marks the company’s 12th straight year of profi tability. These results would be impressive in a normal eco-nomic environment, but in today’s challenging times, perhaps even more so.
STRATEGIC EXPANSION: UEI purchased assets from Zilog Inc. in February 2009, acquiring the company’s universal remote control software technology, intel-lectual property, full library database of codes, software tools, personnel, and related assets. This acquisition expands the breadth and depth of UEI’s customer base in both subscription broadcasting and original equip-ment manufacturing and strengthens our position, especially in Asia. Through additional patents and software, we have further strengthened our leadership
position as a provider of wireless control solutions for which our customers will see immediate benefi ts. We also expanded our relationship with Maxim Integrated Products, a world-class, leading provider of high per-formance semiconductor products. Maxim brings new options to UEI’s current array of diverse and powerful microcontrollers.
MAJOR CUSTOMER WIN: In the business segment, UEI extended its reach by adding Echostar, one of the world’s largest satellite dish technology and set-top box equipment providers as a new customer. This partner-ship broadens UEI’s market share in the subscription TV industry.
UEI QUICKSET DEBUTS, SIMPLIFYING REMOTE SETUP:
Introduced in Fall 2009 on consumer electronics giant Onkyo’s latest line of receivers, UEI QuickSet turns UEI technology into a solution for one of the most frustrating problems people face: setting up their remote to com-municate with their TV and other home theater devices.
UEI QuickSet makes setting up a universal remote effortless by using interactive on-screen menus. People can say goodbye to the sometimes frustrating and lengthy user manual and replace it with a simple, on-screen set up process. UEI Quickset offers the
Dear Stockholders
8 YEARS OF REVENUE GROWTH: SINCE 2002 REVENUES HAVE GROWN CONTINUOUSLY, INCREASING
THREEFOLD FROM $103.9 MILLION TO $317.6 MILLION. 2009 ALSO MARKS THE COMPANY’S 12TH
STRAIGHT YEAR OF PROFITABILITY.
$ 350
$ 300
$ 250
$ 200
$ 150
$ 1002 0 0 2 2 0 0 3 2 0 0 4 2 0 0 5 2 0 0 6 2 0 0 7 2 0 0 8 2 0 0 9
$103.9 $120.5
$158.4
$181.3
$235.8
$272.7
$287.1
$317.6
in millions
14

additional benefi t of saving the settings that have been programmed into the remote. This enables consumers to transfer the setup confi gurations to a replacement remote. No more reprogramming required.
Our solution to the programming issue was to apply technology to simplify the viewer’s life. Installers benefi t too. UEI QuickSet’s simple, turnkey operation translates into fewer service calls and lower operating costs.
UNIVERSAL SOLUTIONS VIA UNIVERSAL ELECTRONICS:
Our vision—to be the interface for the connected home—and our mission—to turn technology into solutions to make it easy for users to connect, control, and interact with entertainment, information and other emerging services — is being played out through a vari-ety of new technologies. UEI has more than a decade of experience developing advanced wireless solutions like RF for connectivity in the home.
We continue to invest resources in new and emerg-ing technologies and applications that show promise in delivering solutions to consumer needs. Likewise, UEI has multiple advanced Point & Click control solu-tions and introduced innovative new products in 2009.
In addition to our strength in innovative product solutions, UEI also continues to be recognized for its fi scal responsibility. For the fourth straight year, UEI was named to Forbes “200 Best Small Companies in America”, based on return on equity, sales growth, profi t growth over the past 12 months and fi ve-year period. We were also named one of “America’s Most Trustworthy Companies” for the third year by Forbes.com, a ranking based on transparent accounting and conservative accounting procedures.
WHAT WE DO AND WHY IT MATTERS: It is esti-mated that more than 250 million people touch our technology every week. This is a clear acknowledgement of something on which UEI has placed a high value since day one: affordable utility.
We are convinced technology is only valuable when measured by its ability to provide solutions to the problems of the people, partners, and industries we serve — simply, quickly, intelligently, effortlessly, afford-ably, and repeatedly.
DRAWING STRENGTH FROM OUR DIVERSIT Y: The reason for our success in 2009 is no mystery. It stands squarely on the shoulders of our people. This is an enterprise of bright, confi dent, energetic, innova-tive and diverse individuals—intellectually as well as geographically—who show a tireless willingness to try something new.
Ideas can come from anywhere. In our global company, they consistently do—California, Ohio, The Netherlands, India, Singapore, and Hong Kong.
But they all come from collaboration and a healthy competition to deliver the very best solutions. It’s all about diligence, effi ciency, and effort. We have made it a system-wide priority to deliver our world-class products and services reliably and economically to meet cus-tomer needs across multiple international markets.
KEEPING OUR EYE ON THE BALL: To stay success-ful, UEI continues to focus on the basics that work; maintaining strong existing customer relationships and bringing in new business opportunities by delivering innovative, customer friendly solutions. This sounds like a simple strategy but it takes lots of hard work and dedication from UEI employees worldwide; our board of directors; and the support of our partners. Thank you. And thank you to our stockholders for your trust and support.
Sincerely,
PAUL ARLING | Chairman and Chief Executive Offi cer
15 univ
ersa
l el
ectr
onic
s in
c. 0
9 a
nnua
l re
port

FORWARD-LOOKING STATEMENTS: This Annual Report on Form 10-K, including “Management’s Discussion and Analysis of Financial Condition and Results of Operations”, contains statements that may constitute forward-looking statements within the meaning of the Private Securities Litigation Reform Act of 1995. All statements other than statements of historical fact are statements that may be deemed forward-looking statements. Forward-looking statements include but are not limited to any projections of revenue, margins, expenses, tax provisions, earnings, cash fl ows, benefi t obligations, share repurchases or other fi nancial items; plans, strategies and objectives of management for future operations; expected development or relating to products or services; future economic conditions or performance; pending claims or disputes; expectation or belief; and assumptions underlying any of the foregoing.
These forward-looking statements are based upon management’s assumptions. While we believe the forward-looking statements made in this report are based upon reasonable assumptions, any assumption is subject to a number of risks and uncertainties. If these risks and uncertain-ties ever materialize and management’s assumptions prove incorrect, our results may differ materially from those expressed or implied by these forward-looking statements and assumptions. Further, any forward-looking statement speaks only as of the date the statement is made. We are not obligated to update forward-looking statements to refl ect unanticipated events or circumstances occurring after the date the statement was made. New factors emerge from time to time. It is not possible for management to predict or assess the impact of all factors on the business, or the extent they may cause actual results to differ materially from those contained in any forward-looking statements. Therefore, forward-looking statements should not be relied upon as a prediction of actual future results.
Management assumptions that are subject to risks and uncertainties include those that are made about macroeconomic and geopolitical trends and events; foreign currency exchange rates; the execution and performance of contracts by customers, suppliers and partners; the challenges of managing asset levels, including inventory; the diffi culty of aligning expense levels with revenue changes; the outcome of pending legislation and accounting pronouncements; and other risks described in this report, including those discussed in “Risk Factors”, and described in our Securities and Exchange Commission fi lings subsequent to this report.
17 17 Business
21 21 Risk Factors
27 27 Selected Consolidated Financial Data
28 28 Management’s Discussion and Analysis of Financial Condition and Results of Operations
38 38 Quantitative and Qualitative Disclosures about Market Risk
39 39 Financial Statements and Supplemental Data
4040 Consolidated
Balance Sheets
4141 Consolidated
Income Statements
4242 Consolidated
Statements of
Stockholders’
Equity
4444 Consolidated
Statements of
Cash Flows
45 45 Notes to Consolidated Financial Statements
69 69 Controls and Procedures
71 71 Performance Chart
UNIVERSAL ELECTRONICS INC.Financial Review09
16

17 univ
ersa
l el
ectr
onic
s in
c. 0
9 a
nnua
l re
port
BusinessBusiness of Universal Electronics Inc.
Universal Electronics Inc. was incorporated under the laws of Delaware in 1986 and began operations in 1987. The principal executive offi ces are located at 6101 Gateway Drive, Cypress, California 90630. As used herein, the terms “we”, “us” and “our” refer to Universal Electronics Inc. and its subsidiaries unless the context indicates to the contrary.
Additional information regarding UEI may be obtained at www.uei.com.
Business Segment
OVERVIEW: Universal Electronics Inc. is a provider of a broad line of products, software, and technologies that are marketed to enhance home entertainment systems. Our offerings include the following:
• easy-to-use, pre-programmed universal infrared (“IR”) and radio frequency (“RF”) remote controls that are sold primarily to multiple systems operators (“MSOs”), consumers, original equipment manufacturers (“OEMs”), and private label customers,
• audio-video (“AV”) accessories sold to consumers,
• integrated circuits, on which our software and universal IR remote control database is embedded, sold primarily to OEMs and private label customers,
• intellectual property which we license primarily to OEMs, software development companies, private label custom-ers, and MSOs, and
• software, fi rmware and technology solutions that can enable devices such as TVs, set-top boxes, stereos, automo-tive audio systems, cell phones and other consumer electronic devices to wirelessly connect and interact with home networks and interactive services to deliver digital entertainment and information.
Our business is comprised of one reportable segment.
PRINCIPAL PRODUCTS AND MARKETS: Our principal markets include MSOs in the cable and satellite subscrip-tion broadcasting markets, as well as OEM, private label, retail and custom installer companies that operate in the consumer electronics market.
We provide MSOs (cable, satellite and Internet protocol television providers) both domestically and internation-ally, with our universal remote control devices and integrated circuits, on which our software and IR code database is embedded, to support the demand associated with the deployment of digital set-top boxes that contain the latest technology and features. We also sell our universal remote control devices and integrated circuits, on which our software and IR code database is embedded, to OEMs that manufacture wireless control devices, cable converters or satellite receivers.
For the years ended December 31, 2009, 2008, and 2007, our sales to DIRECTV® and its sub-contractors col-lectively accounted for 21.1%, 19.3% and 16.9% of our net sales, respectively. Our sales to Comcast Communications, Inc. and its sub-contractors collectively accounted for 11.3%, 13.4% and 13.3% of our net sales for the years ended December 31, 2009, 2008 and 2007, respectively. No other single customer accounted for 10% or more of our net sales in 2009, 2008, or 2007.
We continue to pursue further penetration of the more traditional OEM consumer electronics markets. Customers in these markets generally package our wireless control devices for resale with their AV home entertain-ment products. We also sell customized chips, which include our software and/or customized software packages, to these customers. Growth in this line of business has been driven by the proliferation and increasing complexity of home entertainment equipment, emerging digital technology, multimedia and interactive internet applications, and the increasing number of OEMs.
We continue to place signifi cant emphasis on expanding our sales and marketing efforts to subscription broad-casters and OEMs in Asia, Latin America and Europe. We will continue to add new sales people to support antici-pated sales growth in these markets over the next few years.
In the international retail markets, our One For All® brand name remote control and accessories accounted for 12.6%, 15.6%, and 17.9% of our total net sales for the years ended December 31, 2009, 2008, and 2007, respectively. Throughout 2009, we continued our international retail sales and marketing efforts. Financial information relating to our international operations for the years ended December 31, 2009, 2008, and 2007 is included in “Notes to Consolidated Financial Statements-Note 14”.

18
During the second quarter of 2008 we signed an agreement with Audiovox Accessories Corporation to be the exclusive supplier of embedded microcontrollers and infrared database software for Audiovox’s complete line of RCA universal remote controls sold in the North American retail market. We also agreed to develop remote controls in the future for existing brands in the Audiovox lineup and granted Audiovox an exclusive license to sell and distribute our One For All® brand remote controls and accessories in North America.
TECHNOLOGY: We hold a number of patents in the United States and abroad related to our products and technol-ogy, and have fi led domestic and foreign applications for other patents that are pending. We had a total of 187 and 148 issued and pending United States patents at the end of 2009 and 2008, respectively. The increase in the number of issued and pending patents in the United States resulted from the purchase of 31 issued and pending patents from Zilog Inc. and 10 new patent fi lings, offset by our abandonment of 1 patent and the expiration of 1 patent.
Our patents have remaining lives ranging from approximately one to eighteen years. We have also obtained copyright registration and claim copyright protection for certain proprietary software and libraries of IR codes. Additionally, the names of most of our products are registered, or are being registered, as trademarks in the United States Patent and Trademark Offi ce and in most of the other countries in which such products are sold. These reg-istrations are valid for a variety of terms ranging up to 20 years and may be renewed as long as the trademarks con-tinue to be used and are deemed by management to be important to our operations. While we follow the practice of obtaining patent, copyright and trademark registrations on new developments whenever advisable, in certain cases, we have elected common law trade secret protection in lieu of obtaining such other protection.
Since our beginning in 1986, we have compiled an extensive IR code library that covers over 451,000 individual device functions and over 4,000 individual consumer electronic equipment brand names. Our library is regularly updated with IR codes used in newly introduced AV devices. These IR codes are captured directly from the remote control devices or the manufacturer’s written specifi cations to ensure the accuracy and integrity of the database. We believe that our universal remote control database is capable of controlling virtually all IR controlled TVs, VCRs, DVD players, cable converters, CD players, audio components and satellite receivers, as well as most other infrared remote controlled home entertainment devices and home automation control modules worldwide.
Our proprietary software and know-how permit us to compress IR codes before we load them into our prod-ucts. This provides signifi cant cost and space effi ciencies that enable us to include more codes and features in the memory space of our wireless control devices than are included in the similarly priced products of our competitors.
With today’s rapidly changing technology, upgradeability ensures the compatibility of our remote controls with future home entertainment devices. We have developed patented technology that provides users the capability to easily upgrade the memory of our remote controls with IR codes that were not originally included using their enter-tainment device, personal computer or telephone. These options utilize one or two-way communication to upgrade the remote controls’ IR codes or fi rmware depending on the requirements.
Each of our wireless control devices is designed to simplify the use of home entertainment and other equipment. To appeal to the mass market, the number of buttons is minimized to include only the most popular functions. Another patented ease of use feature we offer in several of our products is our user programmable macro key. This feature allows the user to program a sequence of commands onto a single key, to be played back each time that key is subsequently pressed.
Our remote controls are also designed for easy set-up. For most of our products, the consumer simply inputs a four-digit code for each device to be controlled. During 2007, building on our strategy to develop new products and technologies to further simplify remote control set-up, we created the Xsight™ product line and the EZ-RC™ Remote Control Setup Wizard web-based remote control set-up application. The Xsight™ products may be setup in minutes utilizing the intuitive menu on their color LCD display, without an instruction manual. Alternatively, the mini USB port on the Xsight™ products may be connected to a personal computer. Once connected to a personal computer, our customers may utilize the EZ-RC™ Remote Control Setup Wizard web-based set-up application’s graphical interface to fully program the remote control. Each remote control user may create their own personal profi le on the device with their favorite channels, custom functions, and more. The Xsight™ product line and the EZ-RC™ Remote Control Setup Wizard web-based application were launched into the international retail market during the fourth quarter of 2008 and the North American retail market during the third quarter of 2009.
UEI QuickSet is a fi rmware application that may be embedded on an AV device, such as a set-top box. UEI QuickSet enables universal remote control set-up using guided on-screen instructions and a wireless two-way com-munication link between the remote and the UEI QuickSet embedded AV equipment. UEI’s XMP2 technology, an extensible multimedia protocol, enables the two-way wireless communication between the universal remote control and the AV device, allowing IR code data and confi guration settings to be sent to the remote control from the AV equipment. The user identifi es the type and brand of the device to be controlled and then the UEI QuickSet appli-cation performs a test to confi rm that the remote is controlling the equipment correctly. UEI QuickSet also saves the user-defi ned remote setting, enabling consumers to quickly transfer the setup confi guration to a replacement remote. When the AV device has network connectivity, the IR code database and application may be continually updated to include the latest devices and functions.
METHODS OF DISTRIBUTION: Our distribution methods for our remote control devices are dependent on the sales channel. We distribute remote control devices directly to MSOs and OEMs, both domestically and internation-ally. In the North American retail channel, we license our One For All® brand name to Audiovox, who in turn sells

19 univ
ersa
l el
ectr
onic
s in
c. 0
9 a
nnua
l re
port
products directly to certain domestic retailers and third party distributors. Outside of North America, we sell our wireless control devices and AV accessories under the One For All® and private label brand names to retailers through our international subsidiaries. We utilize third party distributors for the custom installer channel and for retail in coun-tries where we do not have subsidiaries.
We have thirteen international subsidiaries, Universal Electronics B.V., established in the Netherlands, One For All GmbH, established in Germany, One for All Iberia S.L., established in Spain, One For All UK Ltd., established in the United Kingdom, One For All Argentina S.R.L., established in Argentina, One For All France S.A.S., established in France, Universal Electronics Italia S.R.L., established in Italy, UE Singapore Pte. Ltd., established in Singapore, UEI Hong Kong Pte. Ltd., established in Hong Kong, UEI Electronics Pte. Ltd., established in India, UEI Cayman Inc., established in the Cayman Islands, Ultra Control Consumer Electronics GmbH, established in Germany and UEI Hong Kong Holdings Co. Pte. Ltd., established in Hong Kong.
We have developed a broad portfolio of patented technologies and the industry’s leading database of IR codes. We ship integrated circuits, on which our software and IR code database is embedded, directly to manufacturers for inclusion in their products. In addition, we license our software and technology to manufacturers. Licenses are delivered upon the transfer of a product master or on a per unit basis when the software or technology is used in a customer device.
We provide domestic and international consumer support to our various universal remote control marketers, including manufacturers, cable and satellite providers, retail distributors, and audio and video original equipment manufacturers through our automated “InterVoice” system. Live agent help is available through certain programs. We also make available a free web-based support resource, www.urcsupport.com, designed specifi cally for MSOs. This solution offers interactive online demos and tutorials to help users easily setup their remote and commands, and as a result reduces call volume at customer support centers. Additionally, UEI, through its customer call centers, provides customer interaction management services from service and support to retention. Pre-repair calls, post-install surveys, and inbound calls to customers provide greater bottom-line effi ciencies. We continue to review our programs to determine their value in improving the sales of our products.
Raw Materials and Dependence on Suppliers
We utilize third-party manufacturers and suppliers primarily in Asia to produce our wireless control products. In 2009 and 2008, Computime, C.G. Development, Samsung and Samjin each provided more than 10% of our total inventory purchases. They collectively provided 77.5% and 73.1% of our total inventory purchases for 2009 and 2008, respectively. In 2007, Computime, C.G. Development, and Samsung each provided more than 10% of our total inven-tory purchases. They collectively provided 63.2% of our total inventory purchases for 2007.
We continue to evaluate additional contract manufacturers and sources of supply. During 2009, we utilized multiple contract manufacturers and maintained duplicate tooling for certain of our products. Where possible we utilize standard parts and components, which are available from multiple sources. To reduce our dependence on our integrated circuits suppliers we continually seek additional sources, such as our new relationship with Maxim. To further manage our integrated circuit supplier dependence, we include fl ash microcontroller technology in most of our products. Flash microcontrollers can have shorter lead times than standard microcontrollers and may be repro-grammed if necessary. This allows us fl exibility during any unforeseen shipping delays and has the added benefi t of potentially reducing excess and obsolete inventory exposure. This diversifi cation lessens our dependence on any one supplier and allows us to negotiate more favorable terms.
Seasonality
Historically, our business has been infl uenced by the retail sales cycle, with increased sales in the last half of the year. In 2007, our net sales in the fi rst half of the year exceeded our net sales in the second. This was primarily the result of strong demand from our domestic cable customers in the fi rst and second quarters of 2007. This demand was driven by their effort to meet the Open Cable Applications Platform (“OCAP”) July 1, 2007 deadline. In 2008 and 2009, our sales cycle returned to its historical pattern and we expect this pattern to be repeated in 2010.
See “Notes to the Consolidated Financial Statements — Note 22” for further details regarding our quarterly results.
Competition
Our principal competitors in the domestic MSO market is Philips Consumer Electronics, Universal Remote Control and Contec. In the international retail and private label markets for wireless controls we compete with Philips Consumer Electronics, Logitech, Ruwido and Sony as well as various manufacturers of wireless controls in Asia. Our primary competitors in the OEM market are the original equipment manufacturers themselves and wireless control manufacturers in Asia. We compete against Universal Remote Control, Logitech, and Ruwido in the IR database market. Our Nevo product line competes in the custom electronics installation market against AMX, RTI, Control4, Universal Remote Control, Philips Consumer Electronics, Logitech, and many others. Our North American retail products compete against Universal Remote Control, Philips Consumer Electronics, Logitech, Sony and many others. We compete in our markets on the basis of product quality, features, price, intellectual property and customer sup-port. We believe that we will need to continue to introduce new and innovative products to remain competitive and to recruit and retain competent personnel to successfully accomplish our future objectives.
20
Engineering, Research and Development
During 2009, our engineering efforts focused on the following:
• broadening our product portfolio;
• modifying existing products and technologies to improve features and lower costs;
• formulating measures to protect our proprietary technology and general know-how;
• improving our software so that we may pre-program more codes into our memory chips;
• simplifying the set-up and upgrade process for our wireless control products; and
• updating our library of IR codes to include IR codes for new features and devices introduced worldwide.
Our engineering efforts included the development of new remote controls that combine consumer friendly inter-faces and intuitive setup with advance functions, such as our One For All® SmartControl released during the fi rst quarter of 2010. One For All® SmartControl enables the user to control multiple devices without the need to switch between devices on the remote control. One For All® SmartControl also leverages SimpleSet™ technology, and may be setup by simply identifying the target device type and brand.
We also developed new wireless control platforms. UEI’s Glimmer advanced wireless control platform (a joint development with Broadcom® (NASDAQ: BRCM)) integrates an infrared and Bluetooth® compatible chip solution. This platform is optimized to address the emerging Bluetooth eco-system of personal and networked entertainment devices within the home. The Glimmer platform leverages the existing devices in the home to connect and interact with a variety of Bluetooth®-enabled devices ranging from next generation set-top boxes, game consoles, and mobile phones creating an environment where interesting and powerful applications may emerge.
During 2009, we began to integrate the UEI QuickSet fi rmware application into some of our customer’s con-sumer electronic devices. The UEI QuickSet fi rmware application will help our customers simplify the remote control setup process and improve the overall end-user experience.
We continued to improve our existing products during 2009. We released several software updates to our web based EZ-RC™ Remote Control Setup Wizard application and the Xsight™ fi rmware. Our NevoStudio® Pro update enables two-way Z-Wave™ control and communication for home control systems such as lighting, HVAC, window coverings, and others. In addition, this software update enables two-way serial communication, including meta-data transmission, with select third-party devices. These devices include digital media servers and AV distribution systems.
On February 18, 2009, we acquired certain patents, intellectual property and other assets related to the univer-sal remote control business from Zilog Inc. (NASDAQ: ZILG) for approximately $9.5 million in cash. The purchase included Zilog’s full library and database of infrared codes and software tools. We also hired 116 of Zilog’s sales and engineering personnel, including all 107 of Zilog’s personnel located in India. The engineering personnel acquired from Zilog are focused on the capture of IR codes and the development of fi rmware leading to more complete solu-tions to customer needs, the conceptual formulation and design of possible alternatives, as well as the testing of process and product cost improvements. These efforts will enable us to provide customers with reductions in design cycle times, lower costs, and improvements in integrated circuit design, product quality and overall functional perfor-mance. These efforts will also enable us to further penetrate existing markets, pursue new markets more effectively and expand our business.
Our personnel are involved with various industry organizations and bodies, which are in the process of setting standards for infrared, radio frequency, power line, telephone and cable communications and networking in the home. There can be no assurance that any of our research and development projects will be successfully completed.
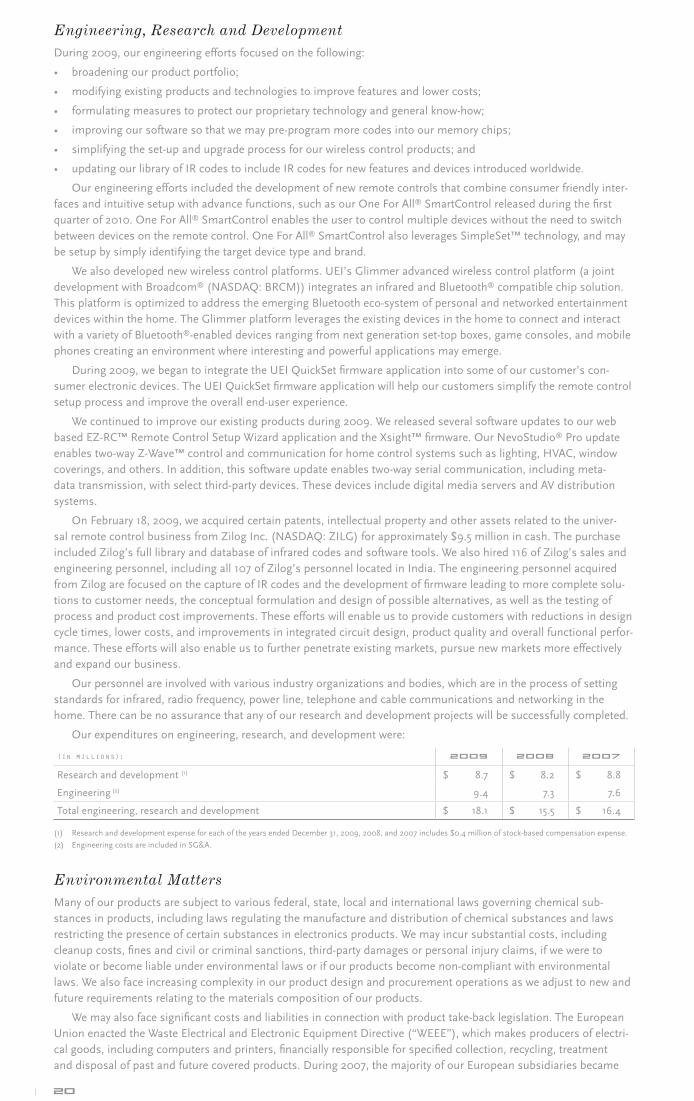
Our expenditures on engineering, research, and development were:
(in millions): 2 0 0 9 2 0 0 8 2 0 0 7
Research and development (1) $ 8.7 $ 8.2 $ 8.8
Engineering (2) 9.4 7.3 7.6
Total engineering, research and development $ 18.1 $ 15.5 $ 16.4
(1) Research and development expense for each of the years ended December 31, 2009, 2008, and 2007 includes $0.4 million of stock-based compensation expense.
(2) Engineering costs are included in SG&A.
Environmental Matters
Many of our products are subject to various federal, state, local and international laws governing chemical sub-stances in products, including laws regulating the manufacture and distribution of chemical substances and laws restricting the presence of certain substances in electronics products. We may incur substantial costs, including cleanup costs, fi nes and civil or criminal sanctions, third-party damages or personal injury claims, if we were to violate or become liable under environmental laws or if our products become non-compliant with environmental laws. We also face increasing complexity in our product design and procurement operations as we adjust to new and future requirements relating to the materials composition of our products.
We may also face signifi cant costs and liabilities in connection with product take-back legislation. The European Union enacted the Waste Electrical and Electronic Equipment Directive (“WEEE”), which makes producers of electri-cal goods, including computers and printers, fi nancially responsible for specifi ed collection, recycling, treatment and disposal of past and future covered products. During 2007, the majority of our European subsidiaries became

21 univ
ersa
l el
ectr
onic
s in
c. 0
9 a
nnua
l re
port
WEEE compliant. Our Italian subsidiary became compliant in February 2008. Similar legislation has been or may be enacted in other jurisdictions, including in the United States, Canada, Mexico, China, and Japan.
We believe that we have materially complied with all currently existing international and domestic federal, state, and local statutes and regulations regarding environmental standards and occupational safety and health matters to which we are subject. During the years ended December 31, 2009, 2008, and 2007, the amounts incurred in comply-ing with federal, state and local statutes and regulations pertaining to environmental standards and occupational safety and health laws and regulations did not materially affect our earnings or fi nancial condition. However, future events, such as changes in existing laws and regulations or enforcement policies, may give rise to additional compli-
ance costs that may have a material adverse effect upon our capital expenditures, earnings or fi nancial condition.
Employees
At December 31, 2009, we employed 565 employees, of which 261 worked in engineering and research and develop-ment, 67 in sales and marketing, 104 in consumer service and support, 58 in operations and warehousing and 75 in executive and administrative functions. On February 18, 2009, we acquired certain patents, intellectual property and other assets related to the universal remote control business from Zilog. As a result of this transaction, we hired 116 of Zilog’s sales and engineering personnel, including all 107 of Zilog’s personnel located in India. None of our employees are subject to a collective bargaining agreement or represented by a union. We consider our employee relations to be good.
International Operations
Financial information relating to our international operations for the years ended December 31, 2009, 2008, and 2007 is incorporated by reference to “Notes to Consolidated Financial Statements — Note 14”.
Available Information
Our Internet address is www.uei.com. We make available free of charge through the website our annual report on Form 10-K, our quarterly reports on Form 10-Q, our current reports on Form 8-K, and any amendments to these reports as soon as reasonably practical after we electronically fi le such reports with the Securities and Exchange Commission. These reports may be found on our website at www.uei.com under the caption “SEC Filings” on the Investor page. Investors may also obtain copies of our SEC fi lings from the SEC website at www.sec.gov.
Risk Factors Forward Looking Statements
We caution that the following important factors, among others (including, but not limited to, factors discussed below in “Management’s Discussion and Analysis of Financial Condition and Results of Operations,” as well as those factors discussed elsewhere in this Annual Report, or in our reports fi led from time to time with the Securities and Exchange Commission), may affect our actual results and may contribute to or cause our actual consolidated results to differ materially from those expressed in any of our forward-looking statements. The factors included here are not exhaustive. Further, any forward-looking statement speaks only as of the date on which such statement is made, and we undertake no obligation to update any forward-looking statement to refl ect events or circumstances after the date on which such statement is made or to refl ect the occurrence of unanticipated events. New factors emerge from time to time, and it is not possible for management to predict all such factors, nor can we assess the impact of each such factor on the business or the extent to which any factor, or combination of factors, may cause actual results to differ materially from those contained in any forward-looking statements. Therefore, forward-looking statements should not be relied upon as a prediction of actual future results.
While we believe that the forward-looking statements made in this report are based on reasonable assumptions, the actual outcome of such statements is subject to a number of risks and uncertainties, including the failure of our markets to continue growing and expanding in the manner we anticipated; the failure of our customers to grow and expand as we anticipated; the effects of natural or other events beyond our control, including the effects a war or terrorist activities may have on us or the economy; the economic environment’s effect on us or our customers; the growth of, acceptance of and the demand for our products and technologies in various markets and geographical regions, including cable, satellite, consumer electronics, retail, digital media/technology, CEDIA, interactive TV, auto-motive, and cellular industries not materializing or growing as we believed; our inability to add profi table comple-mentary products which are accepted by the marketplace; our inability to continue to maintain our operating costs at acceptable levels through our cost containment efforts; our inability to realize tax benefi ts from various tax projects initiated from time to time; our inability to continue selling our products or licensing our technologies at higher or profi table margins; our inability to obtain orders or maintain our order volume with new and existing customers; the possible dilutive effect our stock incentive programs may have on our earnings per share and stock price; our inabil-ity to continue to obtain adequate quantities of component parts or secure adequate factory production capacity on a timely basis; and other factors listed from time to time in our press releases and fi lings with the Securities and Exchange Commission.

22
WE FACE A NUMBER OF RISKS RELATED TO THE RECENT FINANCIAL CRISIS AND SEVERE TIGHTEN-
ING IN THE GLOBAL CREDIT MARKETS: General economic conditions, both domestic and international, have an impact on our business and fi nancial results. The ongoing global fi nancial crisis affecting the banking system and fi nancial markets has resulted in a severe tightening in the credit markets, a low level of liquidity in many fi nancial markets, and extreme volatility in credit and equity markets. This fi nancial crisis may impact our business in a number of ways, including:
Potential Deferment of Purchases and Orders by Customers: Uncertainty about current and future global economic conditions may cause consumers, businesses, and governments to defer purchases in response to tighter credit, decreased cash availability, and declining consumer confi dence. Accordingly, future demand for our products may differ materially from our current expectations.
Customers’ Inability to Obtain Financing to Make Purchases from Us and/or Maintain Their Business: Some of our customers require substantial fi nancing in order to fund their operations and make purchases from us. The inability of these customers to obtain suffi cient credit to fi nance purchases of our products may adversely impact our fi nancial results. In addition, if the fi nancial crisis results in insolvencies for our customers, it may adversely impact our fi nancial results.
Potential Impact on Trade Receivables: Credit market conditions may slow our collection efforts as custom-ers experience increased diffi culty in obtaining requisite fi nancing, leading to higher than normal accounts receivable balances and longer DSOs. This may result in greater expense associated with collection efforts and increased bad debt expense.
Negative Impact from Increased Financial Pressures on Third-Party Dealers, Distributors and Retailers: We make sales in certain regions of the world through third-party dealers, distributors, and retailers. Although many of these third parties have signifi cant operations and maintain access to available credit, others are smaller and more likely to be impacted by the signifi cant decrease in available credit that has resulted from the current fi nancial crisis. If credit pressures or other fi nancial diffi culties result in insolvency for these third parties and we are unable to success-fully transition our end customers to purchase products from other third parties or from us directly, it may adversely impact our fi nancial results.
Negative Impact from Increased Financial Pressures on Key Suppliers: Our ability to meet customers’ demands depends, in part, on our ability to obtain timely and adequate delivery of quality materials, parts and com-ponents from our suppliers. Certain of our components are available only from a single source or limited sources. If certain key suppliers were to become capacity constrained or insolvent as a result of the fi nancial crisis, it may result in a reduction or interruption in supplies or a signifi cant increase in the price of supplies and adversely impact our fi nancial results. In addition, credit constraints at key suppliers may result in accelerated payment of accounts pay-able by us, impacting our cash fl ow.
DEPENDENCE UPON KEY SUPPLIERS: During 2009 and 2008, Computime, C.G. Development, Samsung, and Samjin each provided over 10% of our total inventory purchases. Purchases from these suppliers collectively amounted to $147.1 million, or 77.5%, of our total inventory purchases in 2009. Purchases from these suppliers col-lectively amounted to $135.5 million, or 73.1%, of total inventory purchases during 2008. During 2007, Computime, C.G. Development and Samsung, each provided over 10% of our total inventory purchases. Purchases from these suppliers collectively amounted to $100.7 million, representing 63.2% of total inventory purchases in 2007.
Most of the components used in our products are available from multiple sources. However, we have elected to purchase integrated circuits, used principally in our wireless control products, from three sources, Samsung, Freescale and Maxim. To reduce our dependence on our integrated circuits suppliers we continually seek additional sources. We generally maintain inventories of our integrated chips, which may be used in part to mitigate, but not eliminate, delays resulting from supply interruptions.
We have identifi ed alternative sources of supply for our integrated circuit, component parts, and fi nished goods needs; however, there can be no assurance that we will be able to continue to obtain these inventory purchases on a timely basis. Any extended interruption, shortage or termination in the supply of any of the components used in our products, or a reduction in their quality or reliability, or a signifi cant increase in prices of components, would have an adverse effect on our operating results, fi nancial position and cash fl ows.
DEPENDENCE ON FOREIGN MANUFACTURING: Third-party manufacturers located in Asia manufacture a majority of our products. Our arrangements with our foreign manufacturers are subject to the risks of doing busi-ness abroad, such as tariffs, environmental and trade restrictions, intellectual property protection and enforcement, export license requirements, work stoppages, political and social instability, economic and labor conditions, foreign currency exchange rate fl uctuations, and other factors, which may have a material adverse effect on our business, results of operations and cash fl ows. We believe that the loss of any one or more of our manufacturers would not have a long-term material adverse effect on our business, results of operations and cash fl ows, because numerous other manufacturers are available to fulfi ll our requirements; however, the loss of any of our major manufacturers may adversely affect our business, operating results, fi nancial condition and cash fl ows until alternative manufactur-ing arrangements are secured.
POTENTIAL FLUCTUATIONS IN QUARTERLY RESULTS: Historically, our business has been infl uenced by the retail sales cycle, with increased sales in the last half of the year. In 2007, sales in the fi rst half of the year exceeded our sales in the second half. This was primarily the result of strong demand from our domestic cable customers in the fi rst and second quarters of 2007. This demand was driven by their effort to meet the July 1, 2007 Open Cable
23 univ
ersa
l el
ectr
onic
s in
c. 0
9 a
nnua
l re
port
Applications Platform (“OCAP”) deadline. In 2008 and 2009, our sales cycle returned to its historical pattern and we expect this pattern to be repeated in 2010, however, factors such as those we experienced during 2007 may cause our sales cycles to deviate from historical patterns. Such factors, including quarterly variations in fi nancial results, may have a material adverse affect on the volatility and market price of our common stock.
We may from time to time increase our operating expenses to fund greater levels of research and development, sales and marketing activities, development of new distribution channels, improvements in our operational and fi nancial systems and development of our customer support capabilities, and to support our efforts to comply with various government regulations. To the extent such expenses precede or are not subsequently followed by increased revenues, our business, operating results, fi nancial condition and cash fl ows will be adversely affected.
In addition, we may experience signifi cant fl uctuations in future quarterly operating results that may be caused by many other factors, including demand for our products, introduction or enhancement of products by us and our competitors, the loss or acquisition of any signifi cant customers, market acceptance of new products, price reduc-tions by us or our competitors, mix of distribution channels through which our products are sold, product or supply constraints, level of product returns, mix of customers and products sold, component pricing, mix of international and domestic revenues, foreign currency exchange rate fl uctuations and general economic conditions. In addition, as a strategic response to changes in the competitive environment, we may from time to time make certain pricing or marketing decisions or acquisitions that may have a material adverse effect on our business, results of operations or fi nancial condition. As a result, we believe period-to-period comparisons of our results of operations are not neces-sarily meaningful and should not be relied upon as an indication of future performance.
Due to all of the foregoing factors, it is possible that in some future quarters our operating results will be below the expectations of public market analysts and investors. If this happens the price of our common stock may be materially adversely affected.
DEPENDENCE ON CONSUMER PREFERENCE: We are susceptible to fl uctuations in our business based upon consumer demand for our products. In addition, we cannot guarantee that increases in demand for our products associated with increases in the deployment of new technology will continue. We believe that our success depends on our ability to anticipate, gauge and respond to fl uctuations in consumer preferences. However, it is impossible to predict with complete accuracy the occurrence and effect of fl uctuations in consumer demand over a product’s life cycle. Moreover, we caution that any growth in revenues that we achieve may be transitory and should not be relied upon as an indication of future performance.
DEMAND FOR CONSUMER SERVICE AND SUPPORT: We have continually provided domestic and international consumer service and support to our customers to add overall value and to help differentiate us from our competi-tors. We continually review our service and support group and are marketing our expertise in this area to other potential customers. There can be no assurance that we will be able to attract new customers in the future.
In addition, certain of our products have more features and are more complex than others and therefore require more end-user technical support. In some instances, we rely on distributors or dealers to provide the initial level of technical support to the end-users. We provide the second level of technical support for bug fi xes and other issues at no additional charge. Therefore, as the mix of our products includes more of these complex product lines, support costs may increase, which may have an adverse effect on our business, operating results, fi nancial condition and cash fl ows.
DEPENDENCE UPON NEW PRODUCT INTRODUCTION: Our ability to remain competitive in the wireless con-trol and AV accessory products market will depend considerably upon our ability to successfully identify new product opportunities, as well as develop and introduce these products and enhancements on a timely and cost effective basis. There can be no assurance that we will be successful at developing and marketing new products or enhancing our existing products, or that these new or enhanced products will achieve consumer acceptance and, if achieved, will sustain that acceptance. In addition, there can be no assurance that products developed by others will not render our products non-competitive or obsolete or that we will be able to obtain or maintain the rights to use proprietary technologies developed by others which are incorporated in our products. Any failure to anticipate or respond adequately to technological developments and customer requirements, or any signifi cant delays in product develop-ment or introduction, may have a material adverse effect on our operating results, fi nancial condition and cash fl ows.
In addition, the introduction of new products may require signifi cant expenditures for research and development, tooling, manufacturing processes, inventory and marketing. In order to achieve high volume production of any new product, we may have to make substantial investments in inventory and expand our production capabilities.
DEPENDENCE ON MAJOR CUSTOMERS: The economic strength and weakness of our worldwide customers affect our performance. We sell our wireless control products, AV accessory products, and proprietary technologies to subscription broadcasters, original equipment manufacturers, and private label customers. We also supply our prod-ucts to our wholly owned, non-U.S. subsidiaries and to independent foreign distributors, who in turn distribute our products worldwide, with Europe, Asia, South Africa, and Australia currently representing our principal foreign markets.
In each of the years ended December 31, 2009, 2008 and 2007, we had sales to DIRECTV® and its sub-contrac-tors and to Comcast Communications Inc. and its sub-contractors, that when combined, each exceeded 10% of our net sales. The loss of either of these customers or of any other key customer, either in the United States or abroad or our inability to maintain order volume with these customers, may have an adverse effect on our operating results, fi nancial condition and cash fl ows.

24
CHANGE IN WARRANTY CLAIM COSTS: We rely on third-party companies to service a large portion of our cus-tomer warranty claims. If the cost to service these warranty claims increases unexpectedly, or these outside services cease to be available, we may be required to increase our estimate of future claim costs, which may have a material adverse effect on our operating results, fi nancial condition and cash fl ows.
OUTSOURCED LABOR: We employ a small number of personnel to develop and market additional products that are part of the Nevo® platform as well as products that are based on the Zigbee®, Z-Wave® and other radio frequency technology. Even after these hires, we continue to use outside resources to assist us in the development of these products. While we believe that such outside services will continue to be available to us, if they cease to be available, the development of these products may be substantially delayed, which may have a material adverse effect on our operating results, fi nancial condition and cash fl ows.
COMPETITION: The wireless control industry is characterized by intense competition based primarily on product availability, price, speed of delivery, ability to tailor specifi c solutions to customer needs, quality, and depth of product lines. Our competition is fragmented across our products, and, accordingly, we do not compete with any one com-pany across all product lines. We compete with a variety of entities, some of which have greater fi nancial resources. Our ability to remain competitive in this industry depends in part on our ability to successfully identify new product opportunities, develop and introduce new products and enhancements on a timely and cost effective basis, as well as our ability to successfully identify and enter into strategic alliances with entities doing business within the industries we serve. There can be no assurance that our product offerings will be, and/or remain, competitive or that strategic alliances, if any, will achieve the type, extent, and amount of success or business that we expect them to achieve. The sales of our products and technology may not occur or grow in the manner we expect, and thus we may not recoup costs incurred in the research and development of these products as quickly as we expect, if at all.
PATENTS, TRADEMARKS, AND COPYRIGHTS: The procedures by which we identify, document and fi le for patent, trademark, and copyright protection are based solely on engineering and management judgment, with no assurance that a specifi c fi ling will be issued, or if issued, will deliver any lasting value to us. Because of the rapid innovation of products and technologies that is characteristic of our industry, there can be no assurance that rights granted under any patent will provide competitive advantages to us or will be adequate to safeguard and maintain our proprietary rights. Moreover, the laws of certain countries in which our products are or may be manufactured or sold may not offer protection on such products and associated intellectual property to the same extent that the United States legal system may offer.
In our opinion, our intellectual property holdings as well as our engineering, production, and marketing skills and the experience of our personnel are of equal importance to our market position. We further believe that none of our businesses are materially dependent upon any single patent, copyright, trademark, or trade secret.
Some of our products include or use technology and/or components of third parties. While it may be necessary in the future to seek or renew licenses relating to various aspects of such products, we believe that, based upon past experience and industry practice, such licenses generally may be obtained on commercially reasonable terms; how-ever, there can be no guarantee that such licenses may be obtained on such terms or at all. Because of technological changes in the wireless and home control industry, current extensive patent coverage, and the rapid rate of issuance of new patents, it is possible certain components of our products and business methods may unknowingly infringe upon the patents of others.
POTENTIAL FOR LITIGATION: As is typical in our industry and for the nature and kind of business in which we are engaged, from time to time various claims, charges and litigation are asserted or commenced by third parties against us or by us against third parties, arising from or related to product liability, infringement of patent or other intellectual property rights, breach of warranty, contractual relations or employee relations. The amounts claimed may be substantial, but they may not bear any reasonable relationship to the merits of the claims or the extent of any real risk of court awards assessed against us or in our favor.
RISKS OF CONDUCTING BUSINESS INTERNATIONALLY: Risks of doing business internationally may adversely affect our sales, operations, earnings and cash fl ows due to a variety of factors, including, but not limited to:
• changes in a country or region’s economic or political conditions, including infl ation, recession, interest rate fl uctuations and actual or anticipated military confl icts;
• currency fl uctuations affecting sales, particularly in the Euro and British Pound, which contribute to variations in sales of products and services in impacted jurisdictions and also affect our reported results expressed in U.S. dollars;
• currency fl uctuations affecting costs, particularly the Euro, British Pound and the Chinese Yuan, which contribute to variances in costs in impacted jurisdictions and also affect our reported results expressed in U.S. dollars;
• longer accounts receivable cycles and fi nancial instability among customers;
• trade regulations and procedures and actions affecting production, pricing and marketing of products;
• local labor conditions, customs, and regulations;
• changes in the regulatory or legal environment;
• differing technology standards or customer requirements;

25 univ
ersa
l el
ectr
onic
s in
c. 0
9 a
nnua
l re
port
• import, export or other business licensing requirements or requirements related to making foreign direct invest-ments, which may affect our ability to obtain favorable terms for components or lead to penalties or restrictions;
• diffi culties associated with repatriating cash generated or held abroad in a tax-effi cient manner and changes in tax laws; and
• fl uctuations in freight costs and disruptions at important geographic points of exit and entry.
EFFECTIVENESS OF OUR INTERNAL CONTROL OVER FINANCIAL REPORTING: Pursuant to Section 404 of the Sarbanes-Oxley Act of 2002, we are required to include in our Annual Report on Form 10-K our assessment of the effectiveness of our internal control over fi nancial reporting. Furthermore, our independent registered public accounting fi rm is required to audit our internal control over fi nancial reporting and separately report on whether it believes we maintain, in all material respects, effective internal control over fi nancial reporting. Although we believe that we currently have adequate internal control procedures in place, we cannot be certain that future material changes to our internal control over fi nancial reporting will be effective. If we cannot adequately maintain the effec-tiveness of our internal control over fi nancial reporting, we may be subject to sanctions or investigation by regulatory authorities, such as the Securities and Exchange Commission. Any such action may adversely affect our fi nancial results and the market price of our common stock.
CHANGES IN GENERALLY ACCEPTED ACCOUNTING PRINCIPLES: Our fi nancial statements are prepared in accordance with U.S. generally accepted accounting principles. These principles are subject to revision and interpre-tation by various governing bodies, including the FASB and the SEC. A change in current accounting standards or their interpretation may have a signifi cant adverse effect on our operating results, fi nancial condition and cash fl ows.
UNANTICIPATED CHANGES IN TAX PROVISIONS OR INCOME TAX LIABILITIES: We are subject to income taxes in the United States and numerous foreign jurisdictions. Our tax liabilities are affected by the amounts we charge for inventory and other items in intercompany transactions. From time to time, we are subject to tax audits in various jurisdictions. Tax authorities may disagree with our intercompany charges or other matters and assess additional taxes. We assess the likely outcomes of these audits in order to determine the appropriateness of the tax provision. However, there can be no assurance that we will accurately predict the outcomes of these audits, and the actual outcomes of these audits may have a material impact on our fi nancial condition, results of operations and cash fl ows. In addition, our effective tax rate in the future may be adversely affected by changes in the mix of earnings in countries with differing statutory tax rates, changes in the valuation of deferred tax assets and liabilities, changes in tax laws and the discovery of new information in the course of our tax return preparation process. Furthermore, our tax provisions may be adversely affected as a result of any new interpretative accounting guidance related to accounting for uncertain tax positions.
INABILITY TO USE DEFERRED TAX ASSETS: We have deferred tax assets that we may not be able to use under certain circumstances. If we are unable to generate suffi cient future taxable income in certain jurisdictions, or if there is a signifi cant change in the actual effective tax rates or a signifi cant change in the time period within which the underlying temporary differences become taxable or deductible, we may be required to increase our valuation allow-ances against our deferred tax assets resulting in an increase in our effective tax rate.
ENVIRONMENTAL MATTERS: Many of our products are subject to various federal, state, local and international laws governing chemical substances in products, including laws regulating the manufacture and distribution of chemical substances and laws restricting the presence of certain substances in electronics products. With the pas-sage of the European Union’s Restriction of Hazardous Substances Directive, which makes producers of electrical goods responsible for collection, recycling, treatment and disposal of recovered products, similar restrictions in China effective March 2007 and the European Union’s Waste Electrical and Electronic Equipment Directive, we may face signifi cant costs and liabilities in complying with these laws and any future laws and regulations or enforcement policies that may have a material adverse effect upon our operating results, fi nancial condition, and cash fl ows.
LEASED PROPERTY: We lease all of the properties used in our business. We can give no assurance that we will enter into new or renewal leases, or that, if entered into, the new lease terms will be similar to the existing terms or that the terms of any such new or renewal leases will not have a signifi cant and material adverse effect on our operat-ing results, fi nancial condition and cash fl ows.
TECHNOLOGY CHANGES IN WIRELESS CONTROL: We currently derive substantial revenue from the sale of wireless remote controls based on IR technology. Other control technologies exist or may be developed that may compete with IR. In addition, we develop and maintain our own database of IR and RF codes. There are competing IR and RF libraries offered by companies that we compete with in the marketplace. The advantage that we may have compared to our competitors is diffi cult to measure. If other wireless control technology gains acceptance and starts to be integrated into home electronics devices currently controlled through our IR remote controllers, demand for our products may decrease, resulting in decreased operating results, fi nancial condition, and cash fl ows.
FAILURE TO RECRUIT, HIRE, AND RETAIN KEY PERSONNEL: Our ability to achieve growth in the future will depend, in part, on our success at recruiting, hiring, and retaining highly skilled engineering, managerial, opera-tional, sales and marketing personnel. Our corporate offi ce, including our advanced technology engineering group, is based in Southern California. The high cost of living in Southern California makes it diffi cult to attract talent from outside the region and may also put pressure on overall employment related expense. Additionally, our competi-tors seek to recruit and hire the same key personnel. Therefore, if we fail to stay competitive in salary and benefi ts

26
within the industry it may negatively impact our ability to hire and retain key personnel. The inability to recruit, hire, and retain qualifi ed personnel in a timely manner, or the loss of any key personnel, may make it diffi cult to meet key objectives, such as timely and effective product introductions.
CREDIT FACILITY: On January 8, 2010, we entered into a new $15 million unsecured revolving credit line with U.S. Bank (“Credit Facility”), expiring on October 31, 2011. Presently, we have no borrowings; however, we cannot make any assurances that we will not need to borrow amounts under this facility. If this or any other Credit Facility is not available to us at a time when we need to borrow, we would have to use our cash reserves, including potentially repatriating cash from foreign jurisdictions, which may have a material adverse effect on our operating results, fi nancial condition and cash fl ows.
CHANGE IN COMPETITION AND PRICING: We rely on third-party manufacturers to build our universal wireless control products. Price is always an issue in winning and retaining business. If customers become increasingly price sensitive, new competition may arise from manufacturers who decide to go into direct competition with us or from current competitors who perform their own manufacturing. If such a trend develops, we may experience downward pressure on our pricing or lose sales, which may have a material adverse effect on our operating results, fi nancial condi-tion and cash fl ows.
TRANSPORTATION COSTS; IMPACT OF OIL PRICES: We ship products from our foreign manufacturers via ocean and air transport. It is sometimes diffi cult to forecast swings in demand or delays in production and, as a result, products may be shipped via air which is more costly than ocean shipments. We typically cannot recover the increased cost of air freight from our customers. Additionally, tariffs and other export fees may be incurred to ship products from foreign manufacturers to the customer. The inability to predict swings in demand or delays in produc-tion may increase the cost of freight which may have a material adverse effect on our product margins.
In addition, we have an exposure to oil prices in two forms. The fi rst is in the prices of the oil-based materials that we use in our products, which are primarily the plastics and other components that we include in our fi nished prod-ucts. The second is in the cost of delivery and freight, which would be passed on by the carriers that we use in the form of higher rates. We record freight-in as a cost of sales and freight-out in operating expenses. Rising oil prices may have an adverse effect on cost of sales and operating expenses.
PROPRIETARY TECHNOLOGIES: We produce highly complex products that incorporate leading-edge technology, including hardware, fi rmware, and software. Firmware and software may contain bugs that may unexpectedly inter-fere with product operation. There can be no assurance that our testing programs will detect all defects in individual products or defects that may affect numerous shipments. The presence of defects may harm customer satisfaction, reduce sales opportunities, or increase returns. An inability to cure or repair such a defect may result in the failure of a product line, temporary or permanent withdrawal from a product or market, damage to our reputation, increased inventory costs, or product reengineering expenses, any of which may have a material impact on our operating results, fi nancial condition and cash fl ows.
STRATEGIC BUSINESS TRANSACTIONS: We may, from time to time, pursue strategic alliances, joint ventures, business acquisitions, products or technologies (“strategic business transactions”) that complement or expand our existing operations, including those that may be material in size and scope. Strategic business transactions involve many risks, including the diversion of management’s attention away from day-to-day operations. There is also the risk that we will not be able to successfully integrate the strategic business transaction with our operations, person-nel, customer base, products or technologies. Such strategic business transactions may also have adverse short-term effects on our operating results, and may result in dilutive issuances of equity securities, the incurrence of debt, and the loss of key employees. In addition, these strategic business transactions are generally subject to specifi c account-ing guidelines that may adversely affect our fi nancial condition, results of operations and cash fl ow. For instance, business acquisitions must be accounted for as purchases and, because most technology-related acquisitions involve the purchase of signifi cant intangible assets, these acquisitions typically result in substantial amortization charges, which may have a material adverse effect on our results of operations. There can be no assurance that any such strategic business transactions will occur or, if such transactions do occur, that the integration will be success-ful or that the customer bases, products or technologies will generate suffi cient revenue to offset the associated costs or effects.
GROWTH PROJECTIONS: Management has made the projections required for the preparation of fi nancial state-ments in conformity with accounting principles generally accepted in the United States of America regarding future events and the fi nancial performance of the company, including those involving:
• the benefi ts the company expects as a result of the development and success of products and technologies, including new products and technologies;
• the recently announced new contracts with new and existing customers and new market penetrations;
• the growth expected as a result of the digital from analog conversion;
• the expected continued growth in digital TVs, PVRs and overall growth in the company’s industry; and
• the effects we may experience due to the continued softness in worldwide markets driven by the current eco-nomic environment.
Actual events or results may be unfavorable to management’s projections, which may have a material adverse effect on our projected operating results, fi nancial condition and cash fl ows.

27 univ
ersa
l el
ectr
onic
s in
c. 0
9 a
nnua
l re
port
Selected Consolidated Financial DataThe information below is not necessarily indicative of the results of future operations and should be read in con-junction with “Management’s Discussion and Analysis of Financial Condition and Results of Operations,” and the Consolidated Financial Statements and notes thereto included in “Financial Statements and Supplementary Data,” of this Annual Report, which are incorporated herein by reference, in order to understand further the factors that may affect the comparability of the fi nancial data presented below.
year ended december 31,
(in thousands, except per share data) 2 0 0 9 2 0 0 8 2 0 0 7 2 0 0 6 2 0 0 5
Net sales $ 317,550 $ 287,100 $ 272,680 $ 235,846 $ 181,349
Operating income $ 21,947 $ 20,761 $ 26,451 $ 18,517 $ 11,677
Net income $ 14,675 $ 15,806 $ 20,230 $ 13,520 $ 9,701
Earnings per share:
Basic $ 1.07 $ 1.13 $ 1.40 $ 0.98 $ 0.72
Diluted $ 1.05 $ 1.09 $ 1.33 $ 0.94 $ 0.69
Shares used in calculating earnings per share:
Basic 13,667 14,015 14,410 13,818 13,462
Diluted 13,971 14,456 15,177 14,432 13,992
Cash dividend declared per common share — — — — —
Gross margin 32.0% 33.5% 36.4% 36.4% 37.0%
Selling, general, administrative, research and development expenses as a % of net sales
25.1% 26.3% 26.7% 28.5% 30.6%
Operating margin 6.9% 7.2% 9.7% 7.9% 6.4%
Net income as a % of net sales 4.6% 5.5% 7.4% 5.7% 5.4%
Return on average assets 6.5% 7.3% 10.2% 8.3% 6.8%
Working capital $ 127,086 $ 122,303 $ 140,330 $ 106,179 $ 77,201
Ratio of current assets to current liabilities 3.1 3.0 4.0 3.4 2.8
Total assets $ 233,307 $ 217,555 $ 217,285 $ 178,608 $ 146,319
Cash and cash equivalents $ 29,016 $ 75,238 $ 86,610 $ 66,075 $ 43,641
Long—term debt — — — — —
Stockholders’ equity $ 169,730 $ 153,353 $ 168,242 $ 134,217 $ 103,292
Book value per share (a) $ 12.40 $ 11.24 $ 11.55 $ 9.58 $ 7.63
Ratio of liabilities to liabilities and stockholders’ equity 27.3% 29.5% 22.6% 24.9% 29.4%
(a) Book value per share is defi ned as stockholders’ equity divided by common shares issued, less treasury stock.

28
Management’s Discussion and Analysis of Financial Condition and Results of OperationsThe following discussion should be read in conjunction with the Consolidated Financial Statements and
the related notes that appear elsewhere in this document.
Overview
We have developed a broad line of pre-programmed universal wireless control products and audio-video accessories that are marketed to enhance home entertainment systems. Our customers operate in the consumer electronics market and include OEMs, MSOs (cable and satellite service providers), international retailers, CEDIA (Custom Electronic Design and Installation Association), North American retailers, private labels, and companies in the computing industry. We also sell integrated circuits, on which our software and IR code database is embedded, to OEMs that manufacture wireless control devices, cable converters or satellite receivers for resale in their products. We believe that our universal remote control database contains device codes that are capable of controlling virtually all IR controlled TVs, VCRs, DVD players, cable converters, CD players, audio components and satellite receivers, as well as most other infrared remote controlled devices worldwide.
Beginning in 1986 and continuing today, we have compiled an extensive IR code library that covers over 451,000 individual device functions and over 4,000 individual consumer electronic equipment brand names. Our library is regularly updated with new IR codes used in newly introduced video and audio devices. All such IR codes are captured from the original manufacturer’s remote control devices or manufacturer’s specifi cations to ensure the accuracy and integrity of the database. We have also developed patented technologies that provide the capability to easily upgrade the memory of the wireless control device by adding IR codes from the library that were not originally included.
We operate as one business segment. We have thirteen subsidiaries located in Argentina, Cayman Islands, France, Germany (2), Hong Kong (2), India, Italy, the Netherlands, Singapore, Spain and the United Kingdom.
To recap our results for 2009:
• Our revenue grew 10.6% from $287.1 million in 2008 to $317.6 million in 2009.
• Our sales growth in 2009 was the result of strong demand from the customers in our business category, due in part to the continuation of the upgrade cycle from analog to digital, consumer demand for advanced-function offerings from subscription broadcasters, increased share with existing customers, and new customer wins.
• Our 2009 operating income increased 5.7% to $21.9 million from $20.8 million in 2008. Our operating margin percentage decreased from 7.2% in 2008 to 6.9% in 2009 due primarily to the decrease in our gross margin per-centage from 33.5% in 2008 to 32.0% in 2009. The decrease in our gross margin rate was due primarily to sales mix, as a higher percentage of our total sales was comprised of our lower-margin business category. In addition, the weakening of both the Euro and the British Pound versus the U.S. dollar also contributed to the decline in our gross margin percentage. Partially offsetting the decrease in our gross margin percentage was a 120 basis point improvement in operating expenses as a percentage of net sales in 2009 compared to 2008.
• In spite of challenging worldwide economic conditions that persisted throughout 2009, we continued to grow sales, acquired the remote control assets of Zilog, generated $24 million in cash fl ow from operations, and enter 2010 well-positioned.
Our strategic business objectives for 2010 include the following:
• increase our share with existing customers;
• acquire new customers in historically strong regions;
• continue our expansion into new regions, Asia in particular;
• continue to develop industry-leading technologies and products; and
• continue to evaluate potential acquisition and joint venture opportunities that may enhance our business.
We intend for the following discussion of our fi nancial condition and results of operations to provide informa-tion that will assist in understanding our consolidated fi nancial statements, the changes in certain key items in those fi nancial statements from period to period, and the primary factors that accounted for those changes, as well as how certain accounting principles, policies and estimates affect our consolidated fi nancial statements.
Critical Accounting Policies and Estimates
The preparation of fi nancial statements in conformity with accounting principles generally accepted in the United States of America requires us to make estimates and judgments that affect the reported amounts of assets and liabilities, disclosure of contingent assets and liabilities at the date of the fi nancial statements and the reported amounts of revenues and expenses during the reporting period. On an on-going basis, we evaluate our estimates and judgments, including those related to revenue recognition, allowance for sales returns and doubtful accounts,
29 univ
ersa
l el
ectr
onic
s in
c. 0
9 a
nnua
l re
port
warranties, inventory valuation, business combination purchase price allocations, our review for impairment of long- lived assets, intangible assets and goodwill, income taxes and stock-based compensation expense. Actual results may differ from these judgments and estimates, and they may be adjusted as more information becomes available. Any adjustment may be signifi cant.
An accounting policy is deemed to be critical if it requires an accounting estimate to be made based on assump-tions about matters that are highly uncertain at the time the estimate is made, if different estimates reasonably may have been used, or if changes in the estimate that are reasonably likely to occur may materially impact the fi nancial statements. Management believes the following critical accounting policies affect our more signifi cant judgments and estimates used in the preparation of our consolidated fi nancial statements.
REVENUE RECOGNITION: We recognize revenue on the sale of products when delivery has occurred, there is per-suasive evidence of an arrangement, the sales price is fi xed or determinable and collectability is reasonably assured.
When a sales arrangement contains multiple elements, such as software products, licenses and/or services, we allocate revenue to each element based on its relative fair value. The fair values for the multiple elements are determined based on vendor specifi c objective evidence (“VSOE”), or the price charged when the element is sold separately. The residual method is utilized when VSOE exists for all the undelivered elements, but not for the delivered element. This is performed by allocating revenue to the undelivered elements (that have VSOE) and the residual revenue to the delivered elements. When the fair value for an undelivered element cannot be determined, we defer revenue for the delivered elements until the undelivered element is delivered. We limit the amount of revenue recognition for delivered elements to the amount that is not contingent on the future delivery of products or services or subject to customer-specifi ed return or refund privileges.
Sales allowances reduce gross accounts receivable and gross sales to arrive at accounts receivable, net and net sales in the same period the related receivable and revenue is recorded. We have no obligations after the delivery of our products other than any associated warranties.
We record a provision for estimated retail sales returns. These estimates are based on historical sales returns, analysis of credit memo data and other known factors. The provision recorded for estimated sales returns and allow-ances is deducted from gross sales to arrive at net sales in the period the related revenue is recorded. The allow-ance for sales returns balance at December 31, 2009 and 2008 was $2.0 million and $2.8 million, respectively. The allowance for sales returns balance at December 31, 2009 and 2008 contained reserves for items returned prior to year-end, but that were not completely processed, and therefore not yet removed from the allowance for sales returns balance. We estimate that if these returns had been fully processed the allowance for sales returns balance would have been approximately $1.4 million and $0.8 million on December 31, 2009 and 2008. The value of these returned goods was included in our inventory balance at December 31, 2009 and 2008.
We accrue for discounts and rebates on product sales in the same period as the related revenues are recorded based on our current expectations, after considering historical experience. Changes in such accruals may be required if future rebates and incentives differ from our estimates. Rebates and incentives are recognized as a reduction of sales if distributed in cash or customer account credits. Rebates and incentives are recognized as cost of sales if we provide products or services for payment.
We maintain an allowance for doubtful accounts for estimated losses resulting from the inability of our custom-ers to make payments for products sold or services rendered. The allowance for doubtful accounts is based on a vari-ety of factors, including historical experience, length of time receivables are past due, current economic trends and changes in customer payment behavior. Also, we record specifi c provisions for individual accounts when we become aware of a customer’s inability to meet its fi nancial obligations to us, such as in the case of bankruptcy fi lings or deterioration in the customer’s operating results or fi nancial position. Our historical reserves have been suffi cient to cover losses from uncollectible accounts. We incurred $0.4 million of bad debt expense in 2009 to refl ect certain customer accounts where collection was highly uncertain in the current economic environment. If circumstances related to a customer change, our estimates of the recoverability of the receivables would be further adjusted, either upward or downward.
We have not made any material changes in our methodology for recognizing revenue during the past three fi scal years. We do not believe there is a reasonable likelihood that there will be a material change in the estimates or assumptions we use to recognize revenue. However, if actual results are not consistent with our estimates or assumptions, we may be exposed to losses or gains that may be material.
WARRANTY: We warrant our products against defects in materials and workmanship arising during normal use. We service warranty claims directly through our customer service department or contracted third-party warranty repair facilities. Our warranty periods range up to three years. We estimate and recognize product warranty costs, which are included in cost of sales, as we sell the related products. Warranty costs are forecasted based on the best available information, primarily historical claims experience and the expected cost per claim. The costs we have incurred to service warranty claims have been minimal. Historically, product defects have been less than 0.5% of the net units sold. As a result the balance of our reserve for estimated warranty costs is not signifi cant.
We have not made any material changes in our warranty reserve methodology during the past three fi scal years. We do not believe there is a reasonable likelihood that there will be a material change in the estimates or assump-tions we use to calculate the warranty reserve. However, actual claim costs may differ from the amounts estimated. If a signifi cant product defect were to be discovered on a high volume product, our fi nancial statements may be materi-ally impacted.
30
INVENTORIES: Our inventories consist primarily of wireless control devices and the related component parts, primarily integrated circuits, and are valued at the lower of cost or market value. Cost is determined using the fi rst-in, fi rst-out method. We write-down our inventory for the estimated difference between the inventory’s cost and its esti-mated market value based upon our best estimates about future demand and market conditions.
We carry inventory in amounts necessary to satisfy our customers’ inventory requirements on a timely basis. We continually monitor our inventory status to control inventory levels and write-down any excess or obsolete invento-ries on hand. Our total excess and obsolete inventory reserve as of December 31, 2009 and 2008 was $1.8 million and $1.5 million, respectively, or 4.1% and 3.5% of total inventory. The increase in our excess and obsolete reserve in 2009 was the result of $3.4 million of additional write-downs, offset primarily by $3.1 million of scrapped inventory. This compared to additional write-downs of $2.4 million offset primarily by scrapped inventory of $2.7 million in 2008.
We have not made any material changes in the accounting methodology used to establish our excess and obso-lete inventory reserve during the past three fi scal years. We do not believe there is a reasonable likelihood that there will be a material change in the future estimates or assumptions we use to calculate our excess and obsolete inven-tory reserve. If actual market conditions are less favorable than those projected by management, additional inventory write-downs may be required which may have a material impact on our fi nancial statements. Such circumstances may include, but are not limited to, the development of new competing technology that impedes the marketability of our products or the occurrence of signifi cant price decreases in our component parts, such as integrated circuits. Each percentage point change in the ratio of excess and obsolete inventory reserve to inventory would impact cost of sales by approximately $0.4 million.
BUSINESS COMBINATIONS: We are required to allocate the purchase price of acquired companies to the tangible and intangible assets and the liabilities assumed, as well as in-process research and development (“IPR&D”), based upon their estimated fair values. We engage independent third-party appraisal fi rms to assist us in determining the fair values of assets acquired and liabilities assumed. Such valuations require management to make signifi cant fair value estimates and assumptions, especially with respect to intangible assets. Management estimates the fair value of certain intangible assets by utilizing the following (but not limited to):
• future free cash fl ow from customer contracts, customer lists, distribution agreements, acquired developed tech-nologies, and patents;
• expected costs to develop IPR&D into commercially viable products and cash fl ows from the products once they are completed;
• brand awareness and market position, as well as assumptions regarding the period of time the brand will con-tinue to be used in our product portfolio; and
• discount rates utilized in discounted cash fl ow models.
Our estimates are based upon assumptions believed to be reasonable; however, unanticipated events or cir-cumstances may occur which may affect the accuracy of our fair value estimates, including assumptions regarding industry economic factors and business strategies.
VALUATION OF LONG-LIVED ASSETS AND INTANGIBLE ASSETS: We assess long-lived and intangible assets for impairment whenever events or changes in circumstances indicate that their carrying value may not be recoverable. Factors considered important which may trigger an impairment review if signifi cant include the following:
• underperformance relative to historical or projected future operating results;
• changes in the manner of use of the assets;
• changes in the strategy of our overall business;
• negative industry or economic trends;
• a decline in our stock price for a sustained period; and
• a variance between our market capitalization relative to net book value.
We perform an impairment review when we determine that the carrying value of a long-lived asset or an intan-gible asset may not be recoverable based upon the existence of one or more of the above indicators of impairment. If the carrying value of the asset is larger than the undiscounted cash fl ows, the asset is impaired. We measure an impairment based on the projected discounted cash fl ow method using a discount rate determined by our manage-ment to be commensurate with the risk inherent in our current business model. In assessing the recoverability, we must make assumptions regarding estimated future cash fl ows and other factors to determine the fair value of the respective assets.
We have not made any material changes in our impairment loss assessment methodology during the past three fi scal years. We do not believe there is a reasonable likelihood that there will be a material change in the estimates or assumptions we use to calculate the impairment of long-lived assets and intangible assets. However, if actual results are not consistent with our estimates and assumptions we may be exposed to material impairment charges.
CAPITALIZED SOFTWARE DEVELOPMENT COSTS: At each balance sheet date, we compare the unamortized capitalized software development costs to the net realizable value of the related product. The amount by which the unamortized capitalized software development costs exceed the net realizable value of the related product is written off. The net realizable value is the estimated future gross revenues attributable to each product reduced by its esti-mated future completion costs and disposal. Any remaining amount of capitalized software development costs that

31 univ
ersa
l el
ectr
onic
s in
c. 0
9 a
nnua
l re
port
have been written down are considered to be the cost for subsequent accounting purposes, and the amount of the write-down is not subsequently restored.
We do not believe there is a reasonable likelihood that there will be a material change in the future estimates of net realizable value we use to test for impairment losses on capitalized software development costs. However, if actual results are not consistent with our estimates and assumptions we may be exposed to impairment charges.
GOODWILL: We evaluate the carrying value of goodwill as of December 31 of each year and between annual evalu-ations if events occur or circumstances change that would more likely than not reduce the fair value of the reporting unit below its carrying amount. Such circumstances may include, but are not limited to: (1) a signifi cant adverse change in legal factors or in business climate, (2) unanticipated competition or (3) an adverse action or assessment by a regulator.
When performing the impairment review, we determine the carrying amount of each reporting unit by assigning assets and liabilities, including the existing goodwill, to those reporting units. A reporting unit is defi ned as an oper-ating segment or one level below an operating segment (referred to as a component). A component of an operating segment is deemed a reporting unit if the component constitutes a business for which discrete fi nancial information is available, and segment management regularly reviews the operating results of that component. Our domestic and international operations are components and reporting units of our sole operating segment. On December 31, 2009, the goodwill allocated to the domestic and international reporting units was $8.3 million and $5.4 million, respectively.
To evaluate whether goodwill is impaired, we compare the estimated fair value of the reporting unit to which the goodwill is assigned to the reporting unit’s carrying amount, including goodwill. We estimate the fair value of our reporting units based on income and market approaches. Under the income approach, we calculate the fair value of a reporting unit based on the present value of estimated future cash fl ows. Under the market approach, we estimate the fair value based on market multiples of Enterprise Value to EBITDA for comparable companies. If the carrying amount of a reporting unit exceeds its fair value, the amount of the impairment loss must be measured.
The impairment loss would be calculated by comparing the implied fair value of goodwill to its carrying amount. In calculating the implied fair value of the reporting unit’s goodwill, the fair value of the reporting unit is allocated to all of the other assets and liabilities of that unit based on their fair values. The excess of the reporting unit’s fair value over the amount assigned to its other assets and liabilities is the implied fair value of goodwill. An impairment loss would be recognized when the carrying amount of goodwill exceeds its implied fair value.
Determining the fair value of a reporting unit or an indefi nite-lived purchased intangible asset is judgmental in nature and involves the use of signifi cant estimates and assumptions. These estimates and assumptions include revenue growth rates and operating margins used to calculate projected future cash fl ows, risk-adjusted discount rates, future economic and market conditions and determination of appropriate market comparables. We base our fair value estimates on assumptions we believe to be reasonable but that are unpredictable and inherently uncertain. Actual future results may differ from those estimates. In addition, we make certain judgments and assumptions in allocating shared assets and liabilities to determine the carrying values for each of our reporting units.
We have not made any material changes in our impairment loss assessment methodology during the past three fi scal years. We continue to estimate the fair value of our reporting units to be in excess of their carrying value, and therefore have not recorded any impairment. The amount by which the fair value of our reporting units exceeded their book value utilizing the income and market approaches ranged from 33 percent to 632 percent and therefore we concluded our goodwill was not impaired at December 31, 2009. We do not believe there is a reasonable likelihood that there will be a material change in the future estimates or assumptions we use to test for impairment losses on goodwill. However, if actual results are not consistent with our estimates and assumptions we may be exposed to material impairment charges.
INCOME TAXES: We calculate our current and deferred tax provisions based on estimates and assumptions that may differ from the actual results refl ected in our income tax returns fi led during the subsequent year. We record adjustments based on fi led returns when we have identifi ed and fi nalized them, which is generally in the third and fourth quarters of the subsequent year for U.S. federal and state provisions, respectively.
We recognize deferred tax assets and liabilities for the expected tax consequences of temporary differences between the tax basis of assets and liabilities and their reported amounts using enacted tax rates in effect for the year in which we expect the differences to reverse. We record a valuation allowance to reduce the deferred tax assets to the amount that we are more likely than not to realize. We have considered future market growth, forecasted earn-ings, future taxable income, the mix of earnings in the jurisdictions in which we operate and prudent and feasible tax planning strategies in determining the need for a valuation allowance. In the event we were to determine that we would not be able to realize all or part of our net deferred tax assets in the future, we would increase the valua-tion allowance and make a corresponding charge to earnings in the period in which we make such determination. Likewise, if we later determine that we are more likely than not to realize the net deferred tax assets, we would reverse the applicable portion of the previously provided valuation allowance. In order for us to realize our deferred tax assets we must be able to generate suffi cient taxable income in the tax jurisdictions in which the deferred tax assets are located.
Our effective tax rate includes the impact of certain undistributed foreign earnings for which we have not pro-vided U.S. taxes because we plan to reinvest such earnings indefi nitely outside the United States. The decision to reinvest our foreign earnings indefi nitely outside the United States is based on our projected cash fl ow needs as well

32
as the working capital and long-term investment requirements of our foreign subsidiaries and our domestic opera-tions. Material changes in our estimates of cash, working capital and long-term investment requirements in the various jurisdictions in which we do business may impact our effective tax rate.
We are subject to income taxes in the United States and foreign countries, and we are subject to routine corpo-rate income tax audits in many of these jurisdictions. We believe that our tax return positions are fully supported, but tax authorities are likely to challenge certain positions, which may not be fully sustained. However, our income tax expense includes amounts intended to satisfy income tax assessments that result from these challenges in accordance with the accounting for uncertainty in income taxes prescribed by U.S. GAAP. Determining the income tax expense for these potential assessments and recording the related assets and liabilities requires management judgments and estimates.
We have recorded a liability for uncertain tax positions of $2.8 million at December 31, 2009. We believe that our reserve for uncertain tax positions, including related interest and penalties, is adequate. Our reserve for uncertain tax positions is primarily attributable to uncertainties concerning the tax treatment of our international operations, including the allocation of income among different jurisdictions, and any related interest. We review our reserves quarterly, and we may adjust such reserves due to proposed assessments by tax authorities, changes in facts and circumstances, issuance of new regulations or new case law, previously unavailable information obtained during the course of an examination, negotiations between tax authorities of different countries concerning our transfer prices, execution of advanced pricing agreements, resolution with respect to individual audit issues, the resolution of entire audits, or the expiration of statutes of limitations. The amounts ultimately paid upon resolution of audits may be materially different from the amounts previously included in our income tax expense and, therefore, may have a material impact on our operating results, fi nancial position and cash fl ows.
STOCK-BASED COMPENSATION EXPENSE: Stock-based compensation expense for each employee and director is presented in the same income statement caption as their cash compensation. During the year ended December 31, 2009, 2008 and 2007, we recorded $4.3 million, $4.2 million and $3.5 million, respectively, in pre-tax stock-based compensation expense. The income tax benefi t associated with stock-based compensation expense was $1.5 million, $1.5 million and $1.2 million for the years ended December 31, 2009, 2008 and 2007, respectively.
Stock-based compensation expense by income statement caption for the years ended December 31, 2009, 2008 and 2007 was the following:
(in thousands) 2 0 0 9 2 0 0 8 2 0 0 7
Cost of sales $ 33 $ 17 $ 31
Research and development 434 356 418
Selling, general and administrative 3,845 3,870 3,072
Total stock-based compensation expense $ 4,312 $ 4,243 $ 3,521
Selling, general and administrative expense includes pre-tax stock-based compensation related to restricted stock awards granted to outside directors of $0.5 million, $0.6 million and $0.7 million for the years ended December 31, 2009, 2008 and 2007, respectively. We issue restricted stock awards to the outside directors for services performed. Compensation expense for the restricted stock awards is recognized on a straight-line basis over the requisite service period of one year.
Selling, general and administrative expense includes pre-tax stock-based compensation related to stock option awards granted to outside directors of $0.3 million, $0.2 million and $0 for the years ended December 31, 2009, 2008 and 2007, respectively. We issue stock option awards to the outside directors for services performed. Compensation expense for the stock option awards is recognized on a straight-line basis over the requisite service period of three years.
STOCK OPTION GRANTS: During the year ended December 31, 2009, the Compensation Committee and Board of Directors granted 233,400 stock options to our employees with an aggregate grant date fair value of $1.6 million under various stock incentive plans. The stock options granted to employees during 2009 consisted of the following:
(in thousands, except share amounts)
Stock Option Grant Date
Number of Shares
Underlying Options
Grant Date Fair Value Vesting Period
January 1, 2009 15,000 $ 95 4 -Year Vesting Period (25% each year)
February 18, 2009 15,000 74 4 -Year Vesting Period (25% each year)
February 19, 2009 7,500 33 4 -Year Vesting Period (25% each year)
February 21, 2009 10,000 58 4 -Year Vesting Period (25% each year)
March 10, 2009 185,900 1,340 4 -Year Vesting Period (6.25% each quarter)
233,400 $ 1,600
On October 30, 2009, our Board of Directors appointed Carl E. Vogel to serve as a Class II Director. In connec-tion with his appointment, our directors granted Mr. Vogel 20,000 stock options under the 2006 Stock Incentive Plan. These options are subject to a three-year vesting period (33.3% each year) and are in addition to the employee grants above. The aggregate grant date fair value of this award was $0.2 million.

33 univ
ersa
l el
ectr
onic
s in
c. 0
9 a
nnua
l re
port
During the year ended December 31, 2009, we recognized $0.3 million of pre-tax stock-based compensation expense related to our 2009 stock option grants.
At December 31, 2009, there was $2.9 million of unrecognized pre-tax stock-based compensation expense related to non-vested stock options which we expect to recognize over a weighted-average period of 2.2 years.
During the annual review cycle for 2010, the Compensation Committee granted our Named Executives 99,900 stock options under various Stock Incentive Plans. The options were granted as part of long-term incentive compen-sation to assist us in meeting our performance and retention objectives. The grant, dated January 25, 2010, is subject to a four-year vesting period (0% each quarter during the fi rst year, 8.33% each quarter during the second, third and fourth years). The total grant date fair value of these awards was $1.1 million.
RESTRICTED STOCK GRANTS: During the year ended December 31, 2009, the Compensation Committee and Board of Directors granted 298,170 restricted stock awards under the 2006 Stock Incentive Plan to our employees with an aggregate grant date fair value of $4.5 million. The restricted stock awards granted to employees during 2009 consisted of the following:
(in thousands, except share amounts)
Restricted Stock Grant DateNumber of
Shares GrantedGrant Date Fair Value Vesting Period
January 1, 2009 5,000 $ 74 4-Year Vesting Period (25% each year)
February 12, 2009 77,146 925 3-Year Vesting Period (5% each quarter during years 1-2 and 15% each quarter during year 3)
March 4, 2009 24,723 376 2-Year Vesting Period (12.5% each quarter)
March 10, 2009 147,693 2,400 3-Year Vesting Period (8.75% each quarter during years 1-2 and 7.5% each quarter during year 3)
March 10, 2009 40,500 658 4-Year Vesting Period (6.25% each quarter)
August 18, 2009 3,108 60 3-Year Vesting Period (8.75% each quarter during years 1-2 and 7.5% each quarter during year 3)
298,170 $ 4,493
In addition to the grants to employees, 28,333 shares of restricted stock were granted to our outside directors during 2009. On July 1, 2009, 25,000 shares of restricted stock, with a grant date fair value of $0.5 million, were granted to our outside directors as a part of their annual compensation package. These shares are subject to a one-year vesting period (25% each quarter). On October 30, 2009, our Board of Directors appointed Carl E. Vogel to serve as a Class II Director. In connection with his appointment, Mr. Vogel was granted 3,333 shares of restricted stock with a grant date fair value of $70 thousand (a prorated portion of the annual restricted stock grant made to each direc-tor). These shares are subject to an eight-month vesting period (833 shares vested during the fourth quarter 2009 and 1,250 shares will vest in both the fi rst and second quarter of 2010).
During the year ended December 31, 2009, we recognized $1.5 million of pre-tax stock-based compensation expense related to our 2009 restricted stock grants.
At December 31, 2009, there was $4.5 million of unrecognized pre-tax stock-based compensation expense related to non-vested restricted stock awards which we expect to recognize over a weighted-average period of 1.9 years.
During the annual review cycle for 2010, the Compensation Committee granted our Named Executives 45,500 restricted stock awards under the 2006 Stock Incentive Plan. The awards were granted as part of long-term incentive compensation to assist us in meeting our performance and retention objectives. The grant, dated January 25, 2010, is subject to a four-year vesting period (0% each quarter during the fi rst year, 8.33% each quarter during the second, third and fourth years). The total grant date fair value of these awards was $1.1 million.
Determining the appropriate fair value model and calculating the fair value of share-based payment awards requires the utilization of highly subjective assumptions, including the expected life and forfeiture rate of the share-based payment awards and stock price volatility. Management determined that historical volatility calculated based on our actively traded common stock is a better indicator of expected volatility and future stock price trends than implied volatility. The assumptions used in calculating the fair value of share-based payment awards represent man-agement’s best estimates, but these estimates involve inherent uncertainties and the application of management’s judgment. As a result, if factors change and we use different assumptions, our stock-based compensation expense may be materially different in the future.
We do not believe it is reasonably likely that there will be a material change in the future estimates or assump-tions used to determine stock-based compensation expense. However, if actual results are not consistent with our estimates and assumptions we may be exposed to material stock-based compensation expense. Refer to “Notes to Consolidated Financial Statements - Note 15” for additional disclosure regarding stock-based compensation expense.

34
Results of Operations
The following table sets forth our results of operations expressed as a percentage of net sales for the periods indicated.
year ended december 31,
(in thousands) 2 0 0 9 2 0 0 8 2 0 0 7
Net sales $ 317,550 100.0% $ 287,100 100.0% $ 272,680 100.0%
Cost of sales 215,938 68.0 190,910 66.5 173,329 63.6
Gross profi t 101,612 32.0 96,190 33.5 99,351 36.4
Research and development expenses 8,691 2.7 8,160 2.8 8,820 3.2
Selling, general and administrative expenses
70,974 22.4 67,269 23.5 64,080 23.5
Operating income 21,947 6.9 20,761 7.2 26,451 9.7
Interest income 471 0.1 3,017 1.1 3,104 1.1
Other (expense) income, net (241) (0.0) 311 0.1 7 0.0
Income before income taxes 22,177 7.0 24,089 8.4 29,562 10.8
Provision for income taxes 7,502 2.4 8,283 2.9 9,332 3.4
Net income $ 14,675 4.6% $ 15,806 5.5% $ 20,230 7.4%
Year Ended December 31, 2009 Compared to Year Ended December 31, 2008
CONSOLIDATED: Net sales for the year ended December 31, 2009 were $317.6 million, an increase of 11% com-pared to $287.1 million for the same period last year. Net income for 2009 was $14.7 million or $1.05 per diluted share compared to $15.8 million or $1.09 per diluted share for 2008.
2 0 0 9 2 0 0 8
$ (millions) % of total $ (millions) % of total
Net sales:
Business $ 262.5 82.7% $ 231.5 80.6%
Consumer 55.1 17.3% 55.6 19.4%
Total net sales $ 317.6 100.0% $ 287.1 100.0%
Net sales in our Business lines (subscription broadcasting, OEM, and computing companies) were approximately 83% of net sales for 2009 compared to approximately 81% for 2008. Net sales in our business lines for 2009 increased by approximately 13% to $262.5 million from $231.5 million in 2008. This increase in net sales resulted primarily from an increase in the volume of remote control sales, which was partially offset by lower prices. The increase in remote control sales volume was attributable to the continued deployment of advanced function set-top boxes by the service opera-tors, market share gains with a few key subscription broadcasting customers and new customer wins. These advanced functions include digital video recording (“DVR”), video-on-demand (“VOD”), and high defi nition television (“HDTV”). We expect that the deployment of the advanced function set-top boxes by the service operators will continue into the foreseeable future as penetration for each of the functions cited continues to increase.
Net sales in our Consumer lines (One For All® retail, private label, custom installers, and direct import) were approximately 17% of net sales for 2009 compared to approximately 19% for 2008. Net sales in our consumer lines for 2009 decreased by 1% to $55.1 million from $55.6 million in 2008. The 2009 net sales were negatively impacted by the weakening of the Euro and the British Pound compared to the U.S. dollar, which resulted in a decrease in net sales of approximately $3.6 million. Net of the currency effect, net retail sales outside of the United States were down by an additional $0.9 million. Net private label sales in the United States decreased by $1.4 million, or 70%, to $0.6 million in 2009 from $2.0 million in 2008. In addition, net sales in the CEDIA market decreased by $0.8 million, or 11%, from $7.0 million in 2008 to $6.2 million in 2009. Partially offsetting these decreases was North American retail, which increased net sales by $6.2 million, from $2.0 million in 2008 to $8.2 million in 2009. The increase in North American retail was the result of our distribution agreement with Audiovox, which was signed during the second quarter of 2008.
Gross profi t for 2009 was $101.6 million compared to $96.2 million for 2008. Gross profi t as a percent of sales decreased to 32.0% in 2009 from 33.5% in 2008, due primarily to the following:
• Sales mix, as a higher percentage of our total sales was comprised of our lower margin Business category. In addition, sales mix within our sales categories also contributed to the decrease in our gross margin rate as consumers trended towards value-oriented products. Collectively, the aforementioned resulted in a decrease of 0.7% in the gross margin rate;
• Foreign currency fl uctuations caused a decrease of 0.7% in the gross margin rate driven by the weakening of the Euro and British Pound as compared to the U.S. dollar;
• An increase in inventory scrap expense caused a decrease of 0.2% in the gross margin rate.
Included within the sales mix calculation was the positive benefi t of our relationship with Maxim Integrated Products which resulted in an increase in our gross margin percentage of approximately 1.0%. During 2009 we agreed to be Maxim’s sales agent in return for a sales agency fee. The sales agency fee during 2009 was $4.4 million.

35 univ
ersa
l el
ectr
onic
s in
c. 0
9 a
nnua
l re
port
During 2010, as the transition from the Zilog chip platform to the Maxim chip platform progresses, we will begin to take over full sales and distribution rights, procuring and selling the chips directly to Zilog’s former customers. We anticipate this relationship will lead to growth in revenue and earnings going forward.
Research and development expenses increased 7% from $8.2 million in 2008 to $8.7 million in 2009. The increase is primarily due to additional labor dedicated to general research & development activities.
Selling, general and administrative expenses increased 6% from $67.3 million in 2008 to $71.0 million in 2009. The weakening of the Euro compared to the U.S. dollar resulted in a decrease of $1.6 million; net of the currency effect, selling, general and administrative expenses increased by $5.3 million. Legal, accounting, and advisory profes-sional service expense increased by $1.1 million, due to the acquisition of assets from Zilog, which was completed during the fi rst quarter of 2009. The newly-acquired Zilog operations increased operating expenses by an additional $3.8 million. In addition, severance costs of approximately $0.9 million were incurred in 2009. During the fourth quarter of 2009, we also settled a copyright infringement lawsuit which increased operating expenses by approxi-mately $0.6 million. Partially offsetting these increases was a decline in advertising and tradeshow expense which decreased by $1.1 million.
In 2009, we recorded $0.5 million of net interest income compared to $3.0 million for 2008. The decrease in interest income is due to signifi cantly lower interest rates.
We recorded income tax expense of $7.5 million in 2009 compared to $8.3 million in 2008. Our effective tax rate was 33.8% in 2009 compared to 34.4% in 2008. The decrease in our effective tax rate was due primarily to the completion of our Dutch tax audit for 2002 through 2006 which resulted in approximately $0.4 million of tax reserves being reversed and credited into income in the fourth quarter of 2009, offset partially by a higher percentage of income earned in higher tax rate jurisdictions in 2009 compared to 2008.
Management expects net sales for the year ended December 31, 2010 to be between $325 million and $340 mil-lion as compared to $317.6 million for the year ended December 31, 2009. During 2009, we benefi ted from a signifi -cant customer purchasing the majority of its remote controls from us. In 2010, we expect this customer to return to a more traditional dual source arrangement, where we will continue to supply one-hundred percent of their chipsets, but will share the remote control volume with an additional source. A chipset is sold for less than a fi nished good remote, however they command a slightly higher gross margin percentage. We estimate this will decrease our net sales to this customer by approximately $25.0 million during 2010 compared to the year ended December 31, 2009. However, we believe that growth from our existing customers and the addition of new customers, both domestically and internationally, as well as the impact of the Zilog acquisition, will more than offset this decrease in net sales.
Earnings per share for the year ending December 31, 2010 is expected to be between $1.20 and $1.35 as compared to the $1.05 per diluted share earned in the year ended December 31, 2009.
Year Ended December 31, 2008 Compared to Year Ended December 31, 2007
CONSOLIDATED: Net sales for the year ended December 31, 2008 were $287.1 million, an increase of 5% compared to $272.7 million for the year ended December 31, 2007. Net income for 2008 was $15.8 million or $1.09 per diluted share compared to $20.2 million or $1.33 per diluted share for 2007.
2 0 0 8 2 0 0 7
$ (millions) % of total $ (millions) % of total
Net sales:
Business $ 231.5 80.6% $ 214.7 78.7%
Consumer 55.6 19.4% 58.0 21.3%
Total net sales $ 287.1 100.0% $ 272.7 100.0%
Net sales in our Business lines (subscription broadcasting, OEM, and computing companies) were approxi-mately 81% of net sales for 2008 compared to approximately 79% for 2007. Net sales in our business lines for 2008 increased by approximately 8% to $231.5 million from $214.7 million in 2007. This increase in sales resulted primarily from an increase in the volume of remote control sales, which was partially offset by lower prices. The increase in remote control sales volume was attributable to the continued deployment of advanced function set-top boxes by the service operators, market share gains with a few key subscription broadcasting customers and new customer wins. These advanced functions include digital video recording (“DVR”), video-on-demand (“VOD”), and high defi nition television (“HDTV”). We expect that the deployment of the advanced function set-top boxes by the service operators will continue into the foreseeable future as penetration for each of the functions cited continues to increase.
Net sales in our Consumer lines (One For All® retail, private label, custom installers, and direct import) were approximately 19% of net sales for 2008 compared to approximately 21% for 2007. Net sales in our consumer lines for 2008 decreased by 4% to $55.6 million from $58.0 million in 2007. The sales were negatively impacted by the weakening of the British Pound compared to the U.S. dollar, which resulted in a decrease in net sales of approxi-mately $2.1 million. The strengthening of the Euro compared to the U.S. dollar positively impacted sales, which resulted in an increase of $1.0 million. Net of the currency effect, retail sales outside of the United States were down by $3.1 million, primarily due to lower sales in the UK, Spain and France. Additionally, Private Label sales in the United States decreased by $1.2 million, or 38%, to $2.0 million in 2008 from $3.2 million in 2007. Partially offsetting these decreases is our expanding presence in the CEDIA market which increased sales by $2.2 million, or 47%, from 2007. In addition, other US Retail increased by $0.8 million, from $1.2 million in 2007 to $2.0 million in 2008, due to customer wins.

36
Gross profi t for 2008 was $96.2 million compared to $99.4 million for 2007. Gross profi t as a percent of sales for 2008 was 33.5%, compared to 36.4% for 2007, due primarily to the following reasons:
• Sales mix, as a higher percentage of our total sales was comprised of our lower margin Business category. In addition, sales mix within our sales categories also contributed to the decrease in our gross margin rate as con-sumers trended towards value-oriented products. Collectively, the aforementioned resulted in a decrease of 3.2% in the gross margin rate;
• Foreign currency fl uctuations caused a decrease of 0.3% in the gross margin rate;
• A decrease in freight and handling expense (due to a lower percentage of air freight) caused an increase of 0.5% in the gross margin rate.
Research and development expenses decreased 8% from $8.8 million in 2007 to $8.2 million in 2008. The decrease is primarily due to the completion of the latest development phase for the Nevo platform in late 2007.
Selling, general and administrative expenses increased 5% from $64.1 million in 2007 to $67.3 million in 2008. The strengthening of the Euro compared to the U.S. dollar resulted in an increase of $2.2 million; payroll and benefi ts increased by $0.8 million due to new hires and merit increases; stock-based compensation increased by $0.8 mil-lion; depreciation expense in 2008 increased by $0.7 million, primarily due to increased tooling to support a higher volume of sales and an offi ce renovation completed in early 2008; sales commissions increased by $0.4 million; bad debt expense increased by $0.4 million; and trade show expense increased by $0.4 million. These items were partially offset by lower long term incentive compensation, which decreased by $1.5 million, and a decline in net outside prod-uct development spending, which decreased by $0.9 million.
In 2008, we recorded $3.0 million of net interest income comparable to $3.1 million for 2007.
We recorded income tax expense of $8.3 million in 2008 compared to $9.3 million in 2007. Our effective tax rate was 34.4% in 2008 compared to 31.6% in 2007. The increase in our effective tax rate is due primarily to additional income earned in higher tax-rate jurisdictions as well as lower federal research and development credits.
Liquidity and Capital Resources
SOURCES AND USES OF CASH:
(In thousands)
Year Ended December 31,
2009Increase
(Decrease)
Year Ended December 31,
2008Increase
(Decrease)
Year Ended December 31,
2007
Cash provided by operating activities $ 23,987 $ (6,165) $ 30,152 $ 10,215 $ 19,937
Cash used for investing activities (66,091) (58,671) (7,420) (1,237) (6,183)
Cash (used for) provided by fi nancing activities (4,222) 20,965 (25,187) (26,585) 1,398
Effect of exchange rate changes on cash 104 9,021 (8,917) (14,300) 5,383
December 31, 2009 Increase(Decrease) December 31, 2008
Cash and cash equivalents $ 29,016 $ (46,222) $ 75,238
Working capital 127,086 4,783 122,303
Net cash provided by operating activities in 2009 was $24.0 million compared to $30.2 million during 2008. The decrease in cash fl ows from operating activities in 2009 compared to 2008 was primarily due to our deliberate effort to improve our vendor management which commenced during 2008 and resulted in a $15.6 million cash infl ow by the end of 2008. As a result of the improved vendor terms being negotiated and implemented in 2008, there was minimal opportunity for improvement relating to accounts payable in 2009. Days in payables actually decreased from 81 days at December 31, 2008 to 67 days at December 31, 2009 resulting in a cash outfl ow of approximately $2.1 million in 2009. In addition, during 2009 we had cash outfl ows related to accounts receivable of $4.2 million compared to cash outfl ows of $1.5 million during 2008 due primarily to higher net sales over the last couple of years. Partially offsetting the aforementioned activity was an improvement in inventory turns from 4.4 turns in 2008 to 5.3 turns in 2009. Despite having higher sales, our inventory levels decreased from $43.7 million at December 31, 2008 to $40.9 million at December 31, 2009 compared to an inventory build of $8.8 million from December 31, 2007 to December 31, 2008.
Net cash provided by operating activities in 2008 was $30.2 million compared to $19.9 million during 2007. The increase in cash fl ows from operating activities in 2008 compared to 2007 was primarily due to an increase in accounts payable. Accounts payable increased at a higher rate compared to the prior year due to improved vendor management, including negotiating better payment terms with certain signifi cant vendors.
Our days sales outstanding improved from 82 days for the fourth quarter 2007 to 68 days for the fourth quarter 2008 resulting in a $3.5 million improvement in working capital in 2008 compared to 2007. Partially offsetting the improvement in days sales outstanding is the decrease in inventory turns from 5.0 during 2007 to 4.4 during 2008. The decrease in inventory turns was a result of our deliberate effort to reduce costly air shipments by carrying addi-tional safety stock as well as maintain high customer service levels with existing and newly acquired customers.
Net cash used for investing activities during 2009 was $66.1 million as compared to $7.4 million and $6.2 mil-lion during 2008 and 2007, respectively. The increase in cash used for investing activities in 2009 was primarily due to the acquisition of intangible assets and goodwill of $9.5 million from Zilog and our term deposit investment of $49.2 million. Please refer to “Notes to Consolidated Financial Statements — Notes 7 and 21” for additional disclo-sure regarding our purchase of goodwill and intangible assets from Zilog.
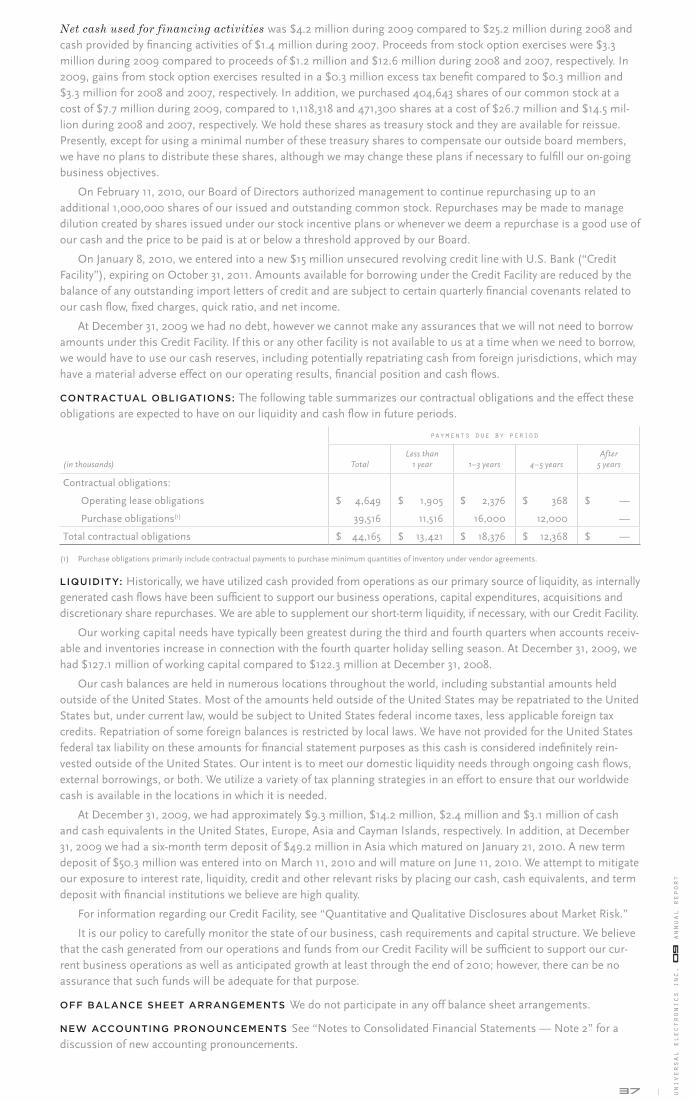
37 univ
ersa
l el
ectr
onic
s in
c. 0
9 a
nnua
l re
port
Net cash used for financing activities was $4.2 million during 2009 compared to $25.2 million during 2008 and cash provided by fi nancing activities of $1.4 million during 2007. Proceeds from stock option exercises were $3.3 million during 2009 compared to proceeds of $1.2 million and $12.6 million during 2008 and 2007, respectively. In 2009, gains from stock option exercises resulted in a $0.3 million excess tax benefi t compared to $0.3 million and $3.3 million for 2008 and 2007, respectively. In addition, we purchased 404,643 shares of our common stock at a cost of $7.7 million during 2009, compared to 1,118,318 and 471,300 shares at a cost of $26.7 million and $14.5 mil-lion during 2008 and 2007, respectively. We hold these shares as treasury stock and they are available for reissue. Presently, except for using a minimal number of these treasury shares to compensate our outside board members, we have no plans to distribute these shares, although we may change these plans if necessary to fulfi ll our on-going business objectives.
On February 11, 2010, our Board of Directors authorized management to continue repurchasing up to an additional 1,000,000 shares of our issued and outstanding common stock. Repurchases may be made to manage dilution created by shares issued under our stock incentive plans or whenever we deem a repurchase is a good use of our cash and the price to be paid is at or below a threshold approved by our Board.
On January 8, 2010, we entered into a new $15 million unsecured revolving credit line with U.S. Bank (“Credit Facility”), expiring on October 31, 2011. Amounts available for borrowing under the Credit Facility are reduced by the balance of any outstanding import letters of credit and are subject to certain quarterly fi nancial covenants related to our cash fl ow, fi xed charges, quick ratio, and net income.
At December 31, 2009 we had no debt, however we cannot make any assurances that we will not need to borrow amounts under this Credit Facility. If this or any other facility is not available to us at a time when we need to borrow, we would have to use our cash reserves, including potentially repatriating cash from foreign jurisdictions, which may have a material adverse effect on our operating results, fi nancial position and cash fl ows.
CONTRACTUAL OBLIGATIONS: The following table summarizes our contractual obligations and the effect these obligations are expected to have on our liquidity and cash fl ow in future periods.
payments due by period
(in thousands) TotalLess than
1 year 1–3 years 4–5 yearsAfter
5 years
Contractual obligations:
Operating lease obligations $ 4,649 $ 1,905 $ 2,376 $ 368 $ —
Purchase obligations(1) 39,516 11,516 16,000 12,000 —
Total contractual obligations $ 44,165 $ 13,421 $ 18,376 $ 12,368 $ —
(1) Purchase obligations primarily include contractual payments to purchase minimum quantities of inventory under vendor agreements.
LIQUIDITY: Historically, we have utilized cash provided from operations as our primary source of liquidity, as internally generated cash fl ows have been suffi cient to support our business operations, capital expenditures, acquisitions and discretionary share repurchases. We are able to supplement our short-term liquidity, if necessary, with our Credit Facility.
Our working capital needs have typically been greatest during the third and fourth quarters when accounts receiv-able and inventories increase in connection with the fourth quarter holiday selling season. At December 31, 2009, we had $127.1 million of working capital compared to $122.3 million at December 31, 2008.
Our cash balances are held in numerous locations throughout the world, including substantial amounts held outside of the United States. Most of the amounts held outside of the United States may be repatriated to the United States but, under current law, would be subject to United States federal income taxes, less applicable foreign tax credits. Repatriation of some foreign balances is restricted by local laws. We have not provided for the United States federal tax liability on these amounts for fi nancial statement purposes as this cash is considered indefi nitely rein-vested outside of the United States. Our intent is to meet our domestic liquidity needs through ongoing cash fl ows, external borrowings, or both. We utilize a variety of tax planning strategies in an effort to ensure that our worldwide cash is available in the locations in which it is needed.
At December 31, 2009, we had approximately $9.3 million, $14.2 million, $2.4 million and $3.1 million of cash and cash equivalents in the United States, Europe, Asia and Cayman Islands, respectively. In addition, at December 31, 2009 we had a six-month term deposit of $49.2 million in Asia which matured on January 21, 2010. A new term deposit of $50.3 million was entered into on March 11, 2010 and will mature on June 11, 2010. We attempt to mitigate our exposure to interest rate, liquidity, credit and other relevant risks by placing our cash, cash equivalents, and term deposit with fi nancial institutions we believe are high quality.
For information regarding our Credit Facility, see “Quantitative and Qualitative Disclosures about Market Risk.”
It is our policy to carefully monitor the state of our business, cash requirements and capital structure. We believe that the cash generated from our operations and funds from our Credit Facility will be suffi cient to support our cur-rent business operations as well as anticipated growth at least through the end of 2010; however, there can be no assurance that such funds will be adequate for that purpose.
OFF BALANCE SHEET ARRANGEMENTS We do not participate in any off balance sheet arrangements.
NEW ACCOUNTING PRONOUNCEMENTS See “Notes to Consolidated Financial Statements — Note 2” for a discussion of new accounting pronouncements.

38
Quantitative and Qualitative Disclosures about Market Risk We are exposed to various market risks, including interest rate and foreign currency exchange rate fl uctuations. We have established policies, procedures and internal processes governing our management of these risks and the use of fi nancial instruments to mitigate our risk exposure.
On January 8, 2010, we entered into a new $15 million unsecured revolving credit line with U.S. Bank (“Credit Facility”), expiring on October 31, 2011. Amounts available for borrowing under the Credit Facility are reduced by the balance of any outstanding import letters of credit and are subject to certain quarterly fi nancial covenants related to our cash fl ow, fi xed charges, quick ratio, and net income. Under the Credit Facility, we may elect to pay interest based on the bank’s prime rate or LIBOR plus a fi xed margin of 1.8%. The applicable LIBOR (1, 3, 6, or 12-month LIBOR) corresponds with the loan period we select. At December 31, 2009, the 12-month LIBOR plus the fi xed margin was 2.8% and the bank’s prime rate was 3.25%. If a LIBOR rate loan is prepaid prior to the completion of the loan period, we must pay the bank the difference between the interest the bank would have earned had prepayment not occurred and the interest the bank actually earned. We may prepay prime rate loans in whole or in part at any time without a premium or penalty.
At December 31, 2009 we had no debt, however we cannot make any assurances that we will not need to borrow amounts under this Credit Facility. If this or any other facility is not available to us at a time when we need to borrow, we would have to use our cash reserves, including potentially repatriating cash from foreign jurisdictions, which may have a material adverse effect on our earnings, cash fl ow and fi nancial position.
At December 31, 2009 we had wholly owned subsidiaries in Argentina, Cayman Islands, France, Germany, Hong Kong, India, Italy, the Netherlands, Singapore, Spain, and the United Kingdom. We are exposed to foreign currency exchange rate risk inherent in our sales commitments, anticipated sales, anticipated purchases, assets and liabilities denominated in currencies other than the U.S. dollar. The most signifi cant foreign currencies to our operations for fi scal 2009 were the Euro and the British Pound. For most currencies, we are a net receiver of the foreign currency and therefore benefi t from a weaker U.S. dollar and are adversely affected by a stronger U.S. dollar relative to the foreign currency. Even where we are a net receiver, a weaker U.S. dollar may adversely affect certain expense fi gures taken alone.
From time to time, we enter into foreign currency exchange agreements to manage the foreign currency exchange rate risks inherent in our forecasted income and cash fl ows denominated in foreign currencies. The terms of these foreign currency exchange agreements normally last less than nine months. We recognize the gains and losses on these foreign currency contracts in the same period as the remeasurement losses and gains of the related foreign currency-denominated exposures.
It is diffi cult to estimate the impact of fl uctuations on reported income, as it depends on the opening and clos-ing rates, the average net balance sheet positions held in a foreign currency and the amount of income generated in local currency. We routinely forecast what these balance sheet positions and income generated in local currency may be and we take steps to minimize exposure as we deem appropriate. Alternatively, we may choose not to hedge the foreign currency risk associated with our foreign currency exposures, primarily if such exposure acts as a natural foreign currency hedge for other offsetting amounts denominated in the same currency or the currency is diffi cult or too expensive to hedge. We do not enter into any derivative transactions for speculative purposes.
The sensitivity of earnings and cash fl ows to the variability in exchange rates is assessed by applying an approxi-mate range of potential rate fl uctuations to our assets, obligations and projected results of operations denominated in foreign currency with all other variables held constant. The analyses cover all of our foreign currency contracts offset by the underlying exposures. Based on our overall foreign currency rate exposure at December 31, 2009, we believe that movements in foreign currency rates may have a material affect on our fi nancial position. We estimate that if the exchange rates for the Euro and the British Pound relative to the U.S. dollar fl uctuate 10% from December 31, 2009, net income and cash fl ows in the fi rst quarter of 2010 would fl uctuate by approximately $0.6 million and $6.7 million, respectively.
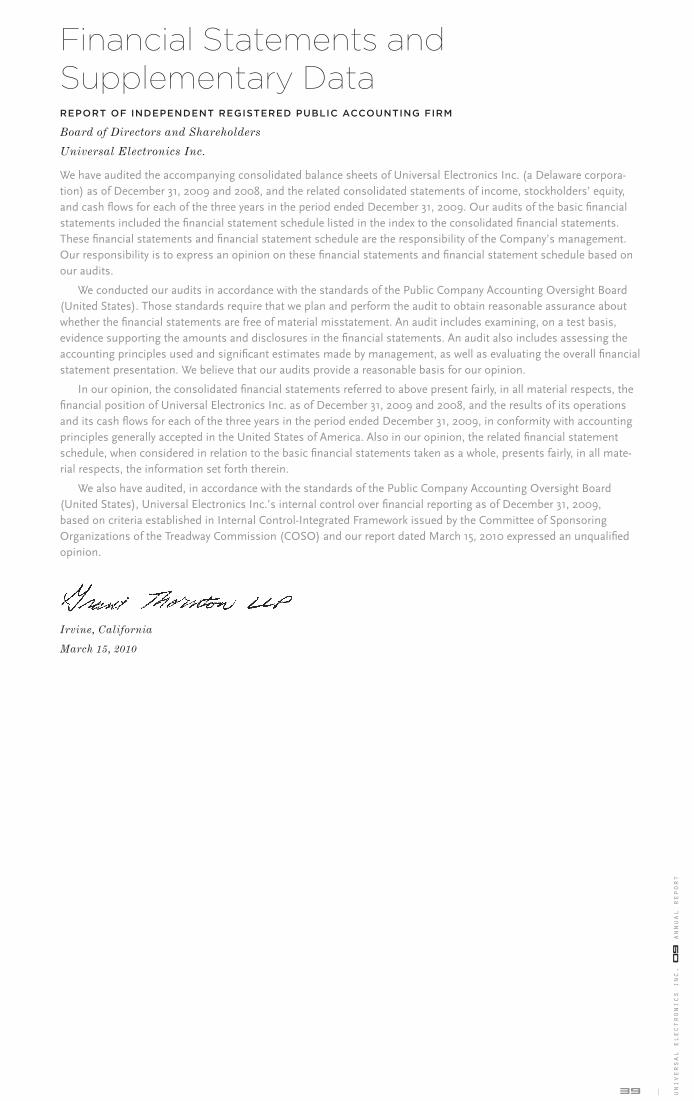
39 univ
ersa
l el
ectr
onic
s in
c. 0
9 a
nnua
l re
port
Financial Statements and Supplementary DataREPORT OF INDEPENDENT REGISTERED PUBLIC ACCOUNTING FIRM
Board of Directors and Shareholders
Universal Electronics Inc.
We have audited the accompanying consolidated balance sheets of Universal Electronics Inc. (a Delaware corpora-tion) as of December 31, 2009 and 2008, and the related consolidated statements of income, stockholders’ equity, and cash fl ows for each of the three years in the period ended December 31, 2009. Our audits of the basic fi nancial statements included the fi nancial statement schedule listed in the index to the consolidated fi nancial statements. These fi nancial statements and fi nancial statement schedule are the responsibility of the Company’s management. Our responsibility is to express an opinion on these fi nancial statements and fi nancial statement schedule based on our audits.
We conducted our audits in accordance with the standards of the Public Company Accounting Oversight Board (United States). Those standards require that we plan and perform the audit to obtain reasonable assurance about whether the fi nancial statements are free of material misstatement. An audit includes examining, on a test basis, evidence supporting the amounts and disclosures in the fi nancial statements. An audit also includes assessing the accounting principles used and signifi cant estimates made by management, as well as evaluating the overall fi nancial statement presentation. We believe that our audits provide a reasonable basis for our opinion.
In our opinion, the consolidated fi nancial statements referred to above present fairly, in all material respects, the fi nancial position of Universal Electronics Inc. as of December 31, 2009 and 2008, and the results of its operations and its cash fl ows for each of the three years in the period ended December 31, 2009, in conformity with accounting principles generally accepted in the United States of America. Also in our opinion, the related fi nancial statement schedule, when considered in relation to the basic fi nancial statements taken as a whole, presents fairly, in all mate-rial respects, the information set forth therein.
We also have audited, in accordance with the standards of the Public Company Accounting Oversight Board (United States), Universal Electronics Inc.’s internal control over fi nancial reporting as of December 31, 2009, based on criteria established in Internal Control-Integrated Framework issued by the Committee of Sponsoring Organizations of the Treadway Commission (COSO) and our report dated March 15, 2010 expressed an unqualifi ed opinion.
Irvine, California
March 15, 2010

40
Consolidated Balance Sheetsdecember 31,
(In thousands, except share-related data) 2 0 0 9 2 0 0 8
ASSETS:
Current assets:
Cash and cash equivalents $ 29,016 $ 75,238
Term deposit 49,246 —
Accounts receivable, net 64,392 59,825
Inventories, net 40,947 43,675
Prepaid expenses and other current assets 2,423 3,461
Deferred income taxes 3,016 2,421
Total current assets 189,040 184,620
Equipment, furniture and fi xtures, net 9,990 8,686
Goodwill 13,724 10,757
Intangible assets, net 11,572 5,637
Other assets 1,144 609
Deferred income taxes 7,837 7,246
Total assets $ 233,307 $ 217,555
LIABILITIES AND STOCKHOLDERS’ EQUIT Y:
Current liabilities:
Accounts payable $ 39,514 $ 44,705
Accrued sales discounts, rebates and royalties 6,028 4,848
Accrued income taxes 3,254 2,334
Accrued compensation 4,619 3,617
Other accrued expenses 8,539 6,813
Total current liabilities 61,954 62,317
Long-term liabilities:
Deferred income taxes 153 130
Income tax payable 1,348 1,442
Other long-term liabilities 122 313
Total liabilities 63,577 64,202
Commitments and contingencies
Stockholders’ equity:
Preferred stock, $.01 par value, 5,000,000 shares authorized; none issued or outstanding — —
Common stock, $.01 par value, 50,000,000 shares authorized; 19,140,232 and 18,715,833 shares issued at December 31, 2009 and 2008, respectively
191 187
Paid-in capital 128,913 120,551
Accumulated other comprehensive income 1,463 750
Retained earnings 118,989 104,314
249,556 225,802
Less cost of common stock in treasury, 5,449,962 and 5,070,319 shares at December 31, 2009 and 2008, respectively
(79,826) (72,449)
Total stockholders’ equity 169,730 153,353
Total liabilities and stockholders’ equity $ 233,307 $ 217,555
The accompanying notes are an integral part of these consolidated fi nancial statements.
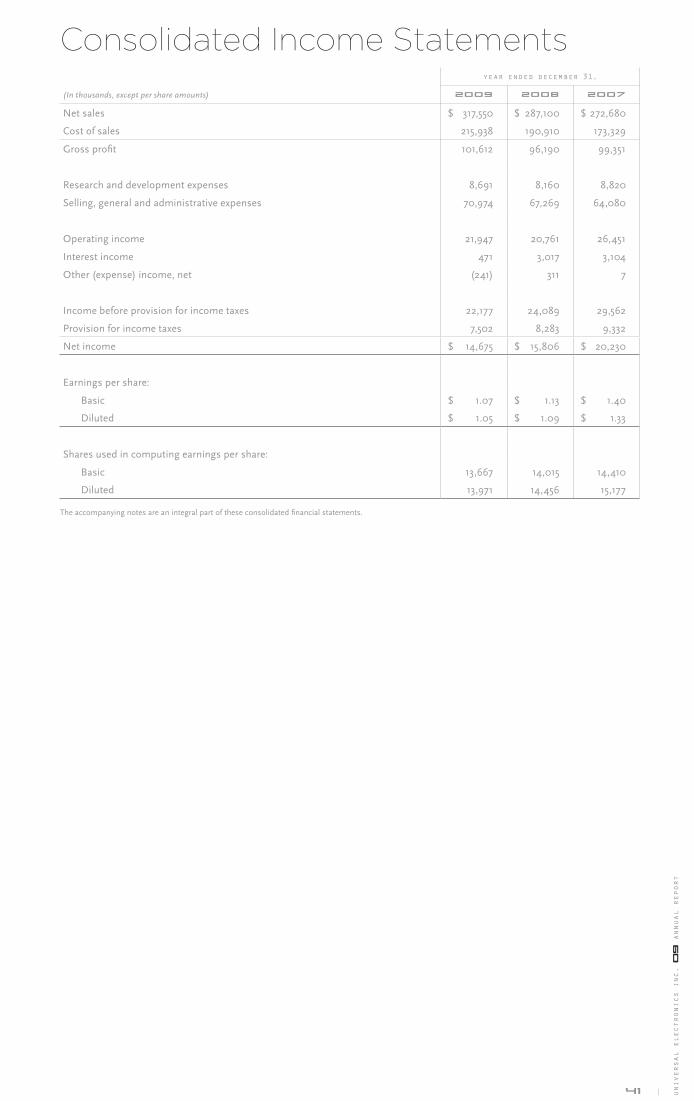
41 univ
ersa
l el
ectr
onic
s in
c. 0
9 a
nnua
l re
port
Consolidated Income Statementsyear ended december 31,
(In thousands, except per share amounts) 2 0 0 9 2 0 0 8 2 0 0 7
Net sales $ 317,550 $ 287,100 $ 272,680
Cost of sales 215,938 190,910 173,329
Gross profi t 101,612 96,190 99,351
Research and development expenses 8,691 8,160 8,820
Selling, general and administrative expenses 70,974 67,269 64,080
Operating income 21,947 20,761 26,451
Interest income 471 3,017 3,104
Other (expense) income, net (241) 311 7
Income before provision for income taxes 22,177 24,089 29,562
Provision for income taxes 7,502 8,283 9,332
Net income $ 14,675 $ 15,806 $ 20,230
Earnings per share:
Basic $ 1.07 $ 1.13 $ 1.40
Diluted $ 1.05 $ 1.09 $ 1.33
Shares used in computing earnings per share:
Basic 13,667 14,015 14,410
Diluted 13,971 14,456 15,177
The accompanying notes are an integral part of these consolidated fi nancial statements.
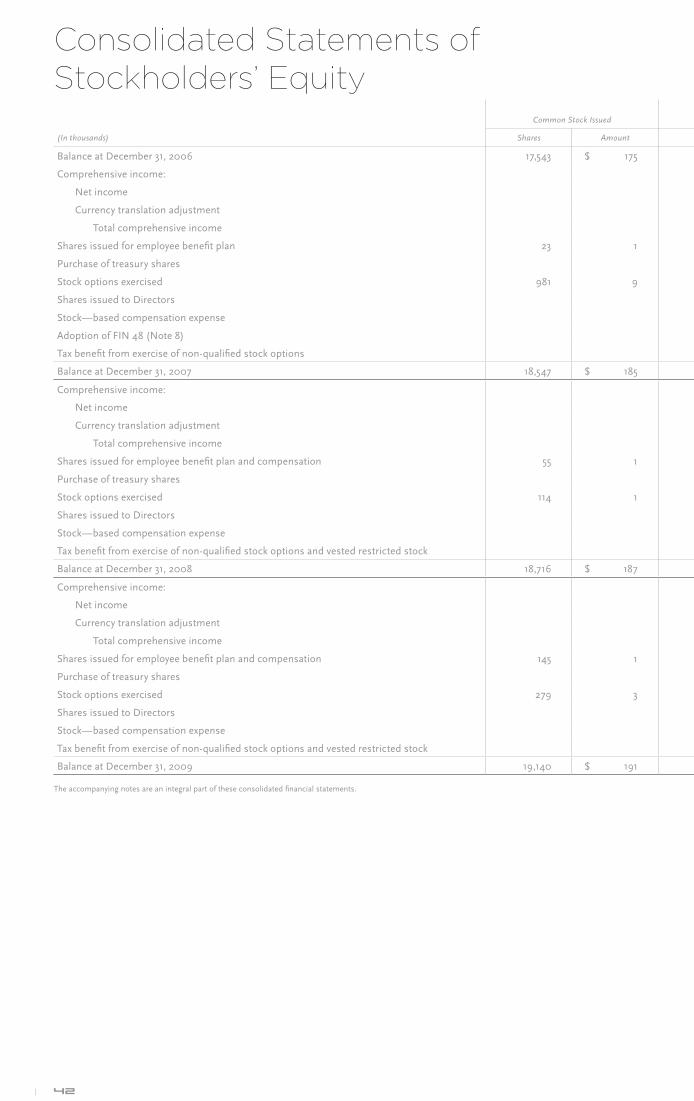
42
Consolidated Statements of Stockholders’ Equity
(In thousands)
Common Stock Issued
Shares Amount
Balance at December 31, 2006 17,543 $ 175
Comprehensive income:
Net income
Currency translation adjustment
Total comprehensive income
Shares issued for employee benefi t plan 23 1
Purchase of treasury shares
Stock options exercised 981 9
Shares issued to Directors
Stock—based compensation expense
Adoption of FIN 48 (Note 8)
Tax benefi t from exercise of non-qualifi ed stock options
Balance at December 31, 2007 18,547 $ 185
Comprehensive income:
Net income
Currency translation adjustment
Total comprehensive income
Shares issued for employee benefi t plan and compensation 55 1
Purchase of treasury shares
Stock options exercised 114 1
Shares issued to Directors
Stock—based compensation expense
Tax benefi t from exercise of non-qualifi ed stock options and vested restricted stock
Balance at December 31, 2008 18,716 $ 187
Comprehensive income:
Net income
Currency translation adjustment
Total comprehensive income
Shares issued for employee benefi t plan and compensation 145 1
Purchase of treasury shares
Stock options exercised 279 3
Shares issued to Directors
Stock—based compensation expense
Tax benefi t from exercise of non-qualifi ed stock options and vested restricted stock
Balance at December 31, 2009 19,140 $ 191
The accompanying notes are an integral part of these consolidated fi nancial statements.

43 univ
ersa
l el
ectr
onic
s in
c. 0
9 a
nnua
l re
port
Common Stock In Treasury
Paid-in Capital
Accumulated Other Comprehensive Income (Loss) Retained Earnings Totals
Comprehensive IncomeShares Amount
(3,529) $ (31,964) $ 94,733 $ 2,759 $ 68,514 $ 134,217
20,230 $ 20,230
8,462 8,462
$ 28,692
630 631
(471) (14,519) (14,519)
12,588 12,597
25 370 (370) —
3,521 3,521
(236) (236)
3,339 3,339
(3,975) $ (46,113) $ 114,441 $ 11,221 $ 88,508 $ 168,242
15,806 $ 15,806
(10,471) (10,471)
$ 5,335
632 633
(1,118) (26,689) (26,689)
1,157 1,158
23 353 (353) —
4,243 4,243
431 431
(5,070) $ (72,449) $ 120,551 $ 750 $ 104,314 $ 153,353
14,675 $ 14,675
713 713
$ 15,388
740 741
(405) (7,747) (7,747)
3,272 3,275
25 370 (370) —
4,312 4,312
408 408
(5,450) $ (79,826) $ 128,913 $ 1,463 $ 118,989 $ 169,730
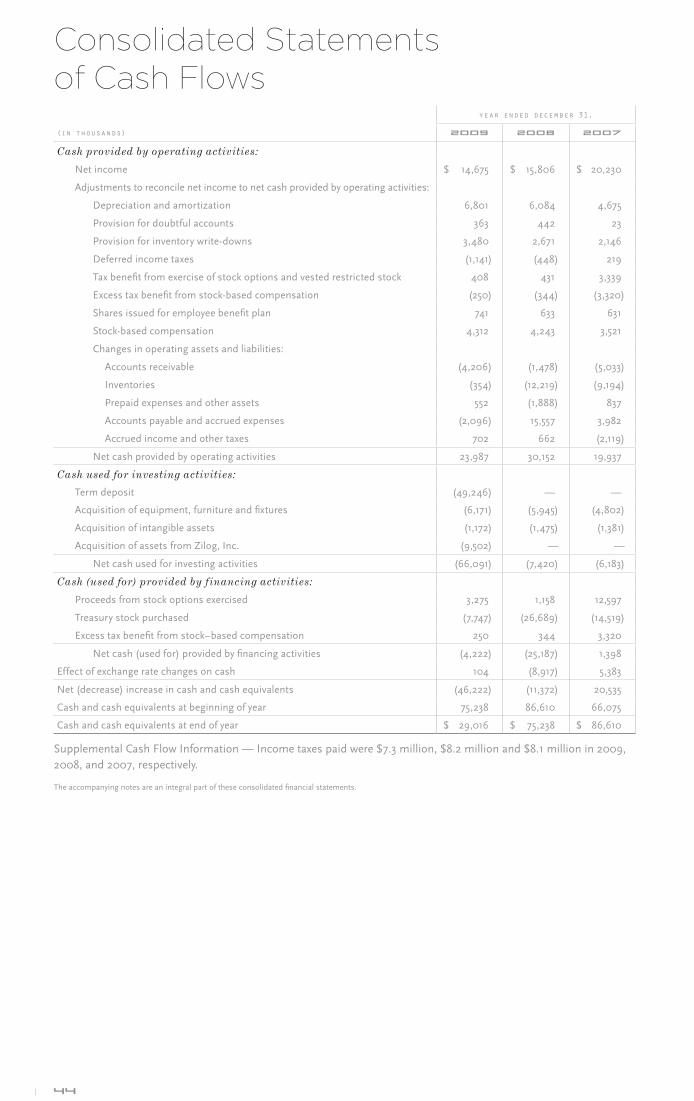
44
Consolidated Statements of Cash Flows
year ended december 31,
(in thousands) 2 0 0 9 2 0 0 8 2 0 0 7
Cash provided by operating activities:
Net income $ 14,675 $ 15,806 $ 20,230
Adjustments to reconcile net income to net cash provided by operating activities:
Depreciation and amortization 6,801 6,084 4,675
Provision for doubtful accounts 363 442 23
Provision for inventory write-downs 3,480 2,671 2,146
Deferred income taxes (1,141) (448) 219
Tax benefi t from exercise of stock options and vested restricted stock 408 431 3,339
Excess tax benefi t from stock-based compensation (250) (344) (3,320)
Shares issued for employee benefi t plan 741 633 631
Stock-based compensation 4,312 4,243 3,521
Changes in operating assets and liabilities:
Accounts receivable (4,206) (1,478) (5,033)
Inventories (354) (12,219) (9,194)
Prepaid expenses and other assets 552 (1,888) 837
Accounts payable and accrued expenses (2,096) 15,557 3,982
Accrued income and other taxes 702 662 (2,119)
Net cash provided by operating activities 23,987 30,152 19,937
Cash used for investing activities:
Term deposit (49,246) — —
Acquisition of equipment, furniture and fi xtures (6,171) (5,945) (4,802)
Acquisition of intangible assets (1,172) (1,475) (1,381)
Acquisition of assets from Zilog, Inc. (9,502) — —
Net cash used for investing activities (66,091) (7,420) (6,183)
Cash (used for) provided by financing activities:
Proceeds from stock options exercised 3,275 1,158 12,597
Treasury stock purchased (7,747) (26,689) (14,519)
Excess tax benefi t from stock–based compensation 250 344 3,320
Net cash (used for) provided by fi nancing activities (4,222) (25,187) 1,398
Effect of exchange rate changes on cash 104 (8,917) 5,383
Net (decrease) increase in cash and cash equivalents (46,222) (11,372) 20,535
Cash and cash equivalents at beginning of year 75,238 86,610 66,075
Cash and cash equivalents at end of year $ 29,016 $ 75,238 $ 86,610
Supplemental Cash Flow Information — Income taxes paid were $7.3 million, $8.2 million and $8.1 million in 2009, 2008, and 2007, respectively.
The accompanying notes are an integral part of these consolidated fi nancial statements.
45 univ
ersa
l el
ectr
onic
s in
c. 0
9 a
nnua
l re
port
Notes to Consolidated Financial StatementsNOTE 1: Description of Business
Universal Electronics Inc., based in Southern California, has developed a broad line of easy-to-use, pre-programmed universal wireless control products and audio-video accessories that are marketed to enhance home entertain-ment systems as well as software designed to enable consumers to wirelessly connect, control and interact with an increasingly complex home environment. Our primary markets include cable and satellite service providers, retail, original equipment manufacturers (“OEMs”), custom installers, private label, and companies in the personal com-puting industry. Over the past 22 years, we have developed a broad portfolio of patented technologies and a database of home connectivity software that we license to our customers, including many leading Fortune 500 companies. In addition, we sell our universal wireless control products and other audio-visual accessories through our European headquarters in the Netherlands and to distributors and retailers in Europe, Australia, New Zealand, South Africa, the Middle East, Mexico, and selected countries in Asia and Latin America under the One For All® brand name.
As used herein, the terms “we”, “us” and “our” refer to Universal Electronics Inc. and its subsidiaries unless the context indicates to the contrary.
NOTE 2: Summary of Significant Accounting Policies
PRINCIPLES OF CONSOLIDATION: The consolidated fi nancial statements include our accounts and those of our wholly-owned subsidiaries. All the intercompany accounts and transactions have been eliminated in the consolidated fi nancial statements.
ESTIMATES AND ASSUMPTIONS: The preparation of fi nancial statements in conformity with accounting prin-ciples generally accepted in the United States of America requires us to make estimates and assumptions that affect the reported amounts of assets and liabilities, disclosure of contingent assets and liabilities at the date of the fi nan-cial statements and the reported amounts of revenues and expenses during the reporting period. On an on-going basis, we evaluate our estimates and assumptions, including those related to revenue recognition, allowance for sales returns and doubtful accounts, warranties, inventory valuation, business combination purchase price alloca-tions, our review for impairment of long-lived assets, intangible assets and goodwill, income taxes and stock-based compensation expense. Actual results may differ from these assumptions and estimates, and they may be adjusted as more information becomes available. Any adjustment may be material.
REVENUE RECOGNITION AND SALES ALLOWANCES: We recognize revenue on the sale of products when delivery has occurred, there is persuasive evidence of an arrangement, the sales price is fi xed or determinable and collectability is reasonably assured. Trade accounts receivable are recorded at the invoiced amount and do not bear interest. Sales allowances reduce gross accounts receivable and gross sales to arrive at accounts receivable, net and net sales in the same period the related receivable and revenue is recorded (see Note 4 for further information concerning our sales allowances).
The provision recorded for estimated sales returns and allowances is deducted from gross sales to arrive at net sales in the period the related revenue is recorded. These estimates are based on historical sales returns, analysis of credit memo data and other known factors. We have no obligations after delivery of our products other than the associated warranties (see Note 12 for further information concerning our warranty obligations).
We accrue for discounts and rebates on product sales in the same period as the related revenues are recorded based on historical experience. Changes in such accruals may be required if future rebates and incentives differ from our estimates. Rebates and incentives are recognized as a reduction of sales if distributed in cash or cus-tomer account credits. Rebates and incentives are recognized as cost of sales if we provide products or services for payment.
We maintain an allowance for doubtful accounts for estimated losses resulting from the inability of our custom-ers to make payments for products sold or services rendered. The allowance for doubtful accounts is based on a vari-ety of factors, including historical experience, length of time receivables are past due, current economic trends and changes in customer payment behavior. Also, we record specifi c provisions for individual accounts when we become aware of a customer’s inability to meet its fi nancial obligations to us, such as in the case of bankruptcy fi lings or deterioration in the customer’s operating results or fi nancial position. If circumstances related to a customer change, our estimates of the recoverability of the receivables would be further adjusted, either upward or downward.
We generate service revenue, which is paid monthly, as a result of providing consumer support programs to some of our customers through our call centers. These service revenues are recognized when services are per-formed, persuasive evidence of an arrangement exists, the sales price is fi xed or determinable, and collectability is reasonably assured.
We also license our intellectual property including our patented technologies, trade secrets, trademarks, and data-base of infrared codes. We record license revenue when our customers ship a product incorporating our intellectual property, persuasive evidence of an arrangement exists, the sales price is fi xed or determinable, and collectability is reasonably assured.

46
We may from time to time initiate the sale of certain intellectual property, including patented technologies, trade-marks, or a particular database of infrared codes. When a fi xed upfront fee is received in exchange for the conveyance of a patent, trademark, or database delivered that represents the culmination of the earnings process, we record rev-enue when delivery has occurred, persuasive evidence of an arrangement exists, the sales price is fi xed or determin-able and collectability is reasonably assured.
When a sales arrangement contains multiple elements, such as software products, licenses and/or services, we allocate revenue to each element based on its relative fair value. The fair values for the multiple elements are determined based on vendor specifi c objective evidence (“VSOE”), or the price charged when the element is sold separately. The residual method is utilized when VSOE exists for all the undelivered elements, but not for the deliv-ered element. This is performed by allocating revenue to the undelivered elements (that have VSOE) and the residual revenue is allocated to the delivered elements. When the fair value for an undelivered element cannot be determined, we defer revenue for the delivered elements until the undelivered element is delivered. We limit the amount of revenue recognition for delivered elements to the amount that is not contingent on the future delivery of products or services or subject to customer-specifi ed return or refund privileges.
We present all non-income government-assessed taxes (sales, use and value added taxes) collected from our cus-tomers and remitted to governmental agencies on a net basis (excluded from revenue) in our fi nancial statements. The government-assessed taxes are recorded in other accrued expenses until they are remitted to the government agency.
INCOME TAXES: Income tax expense includes U.S. and foreign income taxes. We account for income taxes using the liability method. We record deferred tax assets and deferred tax liabilities on our balance sheet for expected future tax consequences of events recognized in our fi nancial statements in a different period than our tax return using enacted tax rates that will be in effect when these differences reverse. We record a valuation allowance to reduce net deferred tax assets if we determine that it is more likely than not that the deferred tax assets will not be realized. A current tax asset or liability is recognized for the estimated taxes refundable or payable for the current year.
A tax position that is more likely than not is measured as the largest amount of benefi t that is greater than fi fty percent likely of being realized upon ultimate settlement, or else a full reserve is established against the tax asset or a liability is recorded. See Note 8 for further information concerning income taxes.
RESEARCH AND DEVELOPMENT: Research and development costs are expensed as incurred and consist primar-ily of salaries, employee benefi ts, supplies and materials.
ADVERTISING: Advertising costs are expensed as incurred. Advertising expense totaled $1.3 million, $2.1 million and $1.9 million for the years ended December 31, 2009, 2008 and 2007, respectively.
SHIPPING AND HANDLING FEES AND COSTS: We include shipping and handling fees billed to customers in net sales. Shipping and handling costs associated with in-bound freight are recorded in cost of goods sold. Other shipping and handling costs are included in selling, general and administrative expenses and totaled $7.9 million, $8.4 million and $7.9 million for the years ended December 31, 2009, 2008 and 2007, respectively.
STOCK-BASED COMPENSATION: We recognize the grant date fair value of stock-based compensation awards as expense, net of estimated forfeitures, in proportion to vesting during the requisite service period, which is generally one to four years. We determined the fair value of the restricted stock awards utilizing the average of the high and low trade prices of our Company’s shares on the date they were granted. We have evaluated the available option pricing models and the assumptions we may utilize to estimate the grant date fair value of stock options granted to employees and directors. We have elected to utilize the Black-Scholes option pricing model. The assumptions utilized in the Black-Scholes model include the following: weighted average fair value of grant, risk-free interest rate, expected volatility and expected life in years. As part of our assessment of possible assumptions, management determined that historical volatility calculated based on our actively traded common stock is a better indicator of expected volatility and future stock price trends than implied volatility. Therefore, we calculate the expected volatility of our common stock utilizing its historical volatility over a period of time equal to the expected term of the stock option. In addition, we examined the historical pattern of stock option exercises in an effort to determine if there were any discernable patterns based on employee classifi cation. From this analysis, we identifi ed two classifi cations: (1) Executives and Board of Directors and (2) Non-Executives. Our estimate of expected life is computed utilizing historical exercise patterns and post-vesting behavior within each of the two identifi ed classifi cations. The risk-free interest rate over the expected term is equal to the prevailing U.S. Treasury note rate over the same period. See Notes 13 and 15 for further information regarding stock-based compensation.
FOREIGN CURRENCY TRANSLATION AND FOREIGN CURRENCY TRANSACTIONS: We use the U.S. dollar as our functional currency for fi nancial reporting purposes. The functional currency for most of our foreign subsid-iaries is their local currency. The translation of foreign currencies into U.S. dollars is performed for balance sheet accounts using exchange rates in effect at the balance sheet dates and for revenue and expense accounts using the average exchange rate during each period. The gains and losses resulting from the translation are included in the foreign currency translation adjustment account, a component of accumulated other comprehensive income in stockholders’ equity, and are excluded from net income. The portions of intercompany accounts receivable and accounts payable that are not intended for settlement are translated at exchange rates in effect at the balance sheet date. Our intercompany foreign investments and long-term debt that are not intended for settlement are translated using historical exchange rates.

47 univ
ersa
l el
ectr
onic
s in
c. 0
9 a
nnua
l re
port
We recorded a foreign currency translation gain of $0.7 million, a loss of $10.5 million and a gain of $8.5 million for the years ended December 31, 2009, 2008 and 2007, respectively. The foreign currency translation gain of $0.7 million for the year ended December 31, 2009 was driven by the weakening of the U.S. dollar versus the Euro. The U.S. dollar/Euro spot rate was 1.43 and 1.39 at December 31, 2009 and 2008, respectively.
The foreign currency translation loss of $10.5 million for the year ended December 31, 2008 was driven by the strengthening of the U.S. dollar versus the Euro. The U.S. dollar/Euro spot rate was 1.39 and 1.46 at December 31, 2008 and 2007, respectively. The foreign currency translation loss during 2008 was compounded by our transfer of €47.0 million, or $60.2 million, into Hong Kong dollars (which are indexed to the U.S. dollar) in November 2008. The U.S. dollar/Euro spot rate at the time of transfer was 1.28. This composed approximately $7.2 million of the foreign currency translation loss for 2008.
The foreign currency translation gain of $8.5 million for the year ended December 31, 2007 was driven by the weakening of the U.S. dollar versus the Euro. The U.S. dollar/Euro spot rate was 1.46 and 1.32 at December 31, 2007 and December 31, 2006, respectively.
Transaction gains and losses generated by the effect of changes in foreign currency exchange rates on recorded assets and liabilities denominated in a currency different than the functional currency of the applicable entity are recorded in other (expense) income, net (see Note 16 for further information concerning transaction gains and losses).
FINANCIAL INSTRUMENTS: Our fi nancial instruments consist primarily of investments in cash and cash equiva-lents, a term deposit, accounts receivable, accounts payable and accrued liabilities. The carrying value of our fi nancial instruments approximate fair value as a result of their short maturities (see Notes 3, 4, 5 and 9 for further informa-tion concerning our fi nancial instruments).
CASH, CASH EQUIVALENTS, AND TERM DEPOSIT: Cash and cash equivalents include cash accounts and all investments purchased with initial maturities of 3 months or less. We attempt to mitigate our exposure to interest rate, liquidity, credit and other relevant risks by placing our cash, cash equivalents, and term deposit with fi nancial institutions we believe are high quality. These fi nancial institutions are located in many different geographic regions. As part of our cash and risk management processes, we perform periodic evaluations of the relative credit standing of our fi nancial institutions. We have not sustained credit losses from instruments held at fi nancial institutions (see Note 3 for further information concerning cash, cash equivalents, and term deposit).
INVENTORIES: Inventories consist of remote controls, audio-video accessories and the related component parts. Inventoriable costs include materials, labor, freight-in and manufacturing overhead related to the purchase and pro-duction of inventories. We value our inventories at the lower of cost or market. Cost is determined using the fi rst-in, fi rst-out method. We attempt to carry inventories in amounts necessary to satisfy our customer requirements on a timely basis (see Note 5 for further information concerning our inventories and suppliers).
Product innovations and technological advances may shorten a given product’s life cycle. We continually moni-tor our inventories to identify any excess or obsolete items on hand. We write-down our inventories for estimated excess and obsolescence in an amount equal to the difference between the cost of the inventories and its estimated net realizable value. These estimates are based upon management’s judgment about future demand and market conditions. Actual results may differ from management’s judgments and additional write-downs may be required. Our total excess and obsolete inventory reserve as of December 31, 2009 and 2008 was $1.8 million and $1.5 million, respectively, or 4.1% and 3.5% of our total inventory balance.
EQUIPMENT, FURNITURE AND FIXTURES: Equipment, furniture and fi xtures are recorded at cost. To qualify for capitalization an asset must have a useful life greater than one year and a cost greater than $1,000 for individual assets or $5,000 for assets purchased in bulk.
We capitalize certain internal and external costs incurred to acquire or create internal use software, principally related to software coding, designing system interfaces and installation and testing of the software.
For fi nancial reporting purposes, depreciation is calculated using the straight-line method over the estimated use-ful lives of the respective assets. When assets are retired or otherwise disposed of, the cost and accumulated depre-ciation are removed from the appropriate accounts and any gain or loss is included as a component of depreciation expense in operating income.
Estimated useful lives consist of the following:
Tooling and equipment 2-7 Years
Computer equipment 3-7 Years
Software 3-5 Years
Furniture and fi xtures 5-7 Years
Leasehold improvements Lesser of lease term or useful life (approximately 2 to 6 years)
See Note 6 for further information concerning our equipment, furniture and fi xtures.
GOODWILL: We record the excess purchase price of net tangible and intangible assets acquired over their esti-mated fair value as goodwill. We evaluate the carrying value of goodwill as of December 31 of each year and between annual evaluations if events occur or circumstances change that may reduce the fair value of the reporting unit below its carrying amount. Such circumstances may include, but are not limited to: (1) a signifi cant adverse change in legal factors or in business climate, (2) unanticipated competition, or (3) an adverse action or assessment by a regulator.

48
When performing the impairment review, we determine the carrying amount of each reporting unit by assigning assets and liabilities, including the existing goodwill, to those reporting units. A reporting unit is defi ned as an oper-ating segment or one level below an operating segment (referred to as a component). A component of an operating segment is deemed a reporting unit if the component constitutes a business for which discrete fi nancial information is available, and segment management regularly reviews the operating results of that component. Our domestic and international operations are components and reporting units of our sole operating segment.
To evaluate whether goodwill is impaired, we compare the estimated fair value of the reporting unit to which the goodwill is assigned to the reporting unit’s carrying amount, including goodwill. We estimate the fair value of our reporting units based on income and market approaches. Under the income approach, we calculate the fair value of a reporting unit based on the present value of estimated future cash fl ows. Under the market approach, we estimate the fair value based on market multiples of Enterprise Value to EBITDA for comparable companies. If the carrying amount of a reporting unit exceeds its fair value, the amount of the impairment loss must be measured.
The impairment loss would be measured by comparing the implied fair value of goodwill to its carrying amount. In calculating the implied fair value of the reporting unit’s goodwill, the fair value of the reporting unit is allocated to all of the other assets and liabilities of that unit based on their fair values. The excess of the reporting unit’s fair value over the amount assigned to its other assets and liabilities is the implied fair value of goodwill. An impairment loss would be recognized when the carrying amount of goodwill exceeds its implied fair value.
We conducted annual goodwill impairment reviews as of December 31, 2009, 2008 and 2007. Based on the anal-ysis performed, we determined that the fair values of our reporting units exceeded their carrying amounts, including goodwill, and therefore they were not impaired. See Notes 7 and 21 for further information concerning goodwill.
LONG-LIVED AND INTANGIBLE ASSETS IMPAIRMENT: Intangible assets consist principally of distribution rights, patents, trademarks, trade names, developed and core technologies, capitalized software development costs (see also Note 2 under the caption Capitalized Software Development Costs) and customer relationships. Capitalized amounts related to patents represent external legal costs for the application and maintenance of patents. Intangible assets are amortized using the straight-line method over their estimated period of benefi t, ranging from two to fi fteen years.
We assess the impairment of long-lived assets and intangible assets whenever events or changes in circum-stances indicate that the carrying value may not be recoverable. Factors considered important which may trigger an impairment review include the following: (1) signifi cant underperformance relative to expected historical or pro-jected future operating results; (2) signifi cant changes in the manner or use of the assets or strategy for the overall business; (3) signifi cant negative industry or economic trends and (4) a signifi cant decline in our stock price for a sustained period.
We conduct an impairment review when we determine that the carrying value of a long-lived or intangible asset may not be recoverable based upon the existence of one or more of the above indicators of impairment. The asset is impaired if its carrying value exceeds the sum of the undiscounted cash fl ows expected to result from the use and eventual disposition of the asset. In assessing recoverability, we must make assumptions regarding estimated future cash fl ows and other factors.
The impairment loss is the amount by which the carrying value of the asset exceeds its fair value. We estimate fair value utilizing the projected discounted cash fl ow method and a discount rate determined by our management to be commensurate with the risk inherent in our current business model. When calculating fair value, we must make assumptions regarding estimated future cash fl ows, discount rates and other factors.
See Notes 6 and 14 for further information concerning long-lived assets. See Notes 7 and 21 for further informa-tion concerning intangible assets.
CAPITALIZED SOFTWARE DEVELOPMENT COSTS: Costs incurred to develop software for resale are expensed when incurred as research and development until technological feasibility has been established. We have determined that technological feasibility for our products is established when a working model is complete. Once technological feasibility is established, software development costs are capitalized until the product is available for general release to customers.
Capitalized software development costs are amortized on a product-by-product basis. Amortization is recorded in cost of sales and is the greater amount computed using:
a. the net book value at the beginning of the period multiplied by the ratio that current gross revenues for a product bear to the total of current and anticipated future gross revenues for that product; or
b. the straight-line method over the remaining estimated economic life of the product including the period being reported on.
The amortization of capitalized software development costs begins when the related product is available for gen-eral release to customers. The amortization periods normally range from one to two years.
We compare the unamortized capitalized software development costs of a product to its net realizable value at each balance sheet date. The amount by which the unamortized capitalized software development costs exceed the product’s net realizable value is written off. The net realizable value is the estimated future gross revenues of a prod-uct reduced by its estimated completion and disposal costs. Any remaining amount of capitalized software develop-ment costs are considered to be the cost for subsequent accounting purposes and the amount of the write-down is not subsequently restored. See Note 7 for further information concerning capitalized software development costs.

49 univ
ersa
l el
ectr
onic
s in
c. 0
9 a
nnua
l re
port
DERIVATIVES: Our foreign currency exposures are primarily concentrated in the Euro, British Pound and Hong Kong dollar. We periodically enter into foreign currency exchange contracts with terms normally lasting less than nine months to protect against the adverse effects that exchange-rate fl uctuations may have on our foreign currency-denominated receivables, payables, cash fl ows and reported income. We do not enter into fi nancial instruments for speculation or trading purposes.
The derivatives we enter into have not qualifi ed for hedge accounting. The gains and losses on both the deriva-tives and the foreign currency-denominated balances are recorded as foreign exchange transaction gains or losses and are classifi ed in other (expense) income, net. Derivatives are recorded on the balance sheet at fair value. The estimated fair value of derivative fi nancial instruments represents the amount required to enter into similar offset-ting contracts with similar remaining maturities based on quoted market prices. See Note 18 for further information concerning derivatives.
FAIR-VALUE MEASUREMENTS: We measure fair value using the framework established by the FASB accounting guidance for fair value measurements and disclosures. This framework requires fair value to be determined based on the exchange price that would be received for an asset or paid to transfer a liability (an exit price) in the principal or most advantageous market for the asset or liability in an orderly transaction between market participants.
The valuation techniques are based upon observable and unobservable inputs. Observable or market inputs refl ect market data obtained from independent sources. Unobservable inputs require management to make certain assumptions and judgments based on the best information available. Observable inputs are the preferred source of values. These two types of inputs create the following fair value hierarchy:
Level 1: Quoted prices (unadjusted) for identical instruments in active markets.
Level 2: Quoted prices for similar instruments in active markets, quoted prices for identical or similar instru-ments in markets that are not active, and model-based valuation techniques for which all signifi cant assumptions are observable in the market or can be corroborated by observable market data for sub-stantially the full term of the assets or liabilities.
Level 3: Prices or valuations that require management inputs that are both signifi cant to the fair value measure-ment and unobservable.
NEW ACCOUNTING PRONOUNCEMENTS: In January 2010, the FASB issued Accounting Standards Update (“ASU”) No. 2010-6 to improve the disclosure and transparency of fair value measurements. These amendments clarify the level of disaggregation required, and the necessary disclosures about the valuation techniques and inputs used to measure fair value for both recurring and nonrecurring fair value measurements. The amendments in the update are effective prospectively for interim and annual periods beginning on or after December 15, 2009, except for the separate disclosures about purchases, sales, issuances, and settlements relating to Level 3 measurements, which are effective for fi scal years beginning on or after December 15, 2010, and for interim periods within those fi scal years. Early adoption is permitted. We have not yet adopted this ASU, and we do not expect its adoption will have a material effect on our consolidated results of operations and fi nancial condition.
In October 2009, the FASB issued ASU No. 2009-14 to address accounting for arrangements that contain tangible products and software. The amendments in this update clarify what guidance should be utilized in allocat-ing and measuring revenue for products that contain software that is “more than incidental” to the product as a whole. Currently, products that contain software that is “more than incidental” to the product as a whole are within the scope of software accounting guidance. Software accounting guidance requires a vendor to use vendor-specifi c objective evidence (“VSOE”) of selling price to separate the software from the product and account for the two elements as a multiple-element arrangement. A vendor must sell, or intend to sell, a particular element separately to assert VSOE for that element. Third-party evidence for selling price is not allowed under the software accounting model. If a vendor does not have VSOE for the undelivered elements in the arrangement, the revenue associated with both the delivered and undelivered elements is combined into one unit of accounting. Any revenue attributable to the delivered elements is then deferred and recognized at a later date, which in many cases is as the undelivered ele-ments are delivered by the vendor. This ASU addresses concerns that the current accounting model may not appro-priately refl ect the economics of the underlying transactions because no revenue is recognized for some products for which the vendor has already completed the related performance. In addition, this ASU addresses the concern that more software enabled products fall within the scope of the current software accounting model than was originally intended because of ongoing technical advancements. The amendments in the update are effective prospectively for revenue arrangements entered into or materially modifi ed in fi scal years beginning on or after June 15, 2010. Early adoption is permitted, however, if early adoption is elected, we would be required to apply the amendments retro-spectively from the beginning of the fi scal year of adoption and make specifi c disclosures. We have not yet adopted this ASU, and we are currently evaluating the impact it may have on our consolidated fi nancial statements.
In October 2009, the FASB issued ASU No. 2009-13 to address the accounting for multiple-deliverable arrange-ments to enable vendors to account for products or services (deliverables) separately rather than as a combined accounting unit. Current accounting guidance requires a vendor to use VSOE or third-party evidence (“TPE”) of selling price to separate deliverables in a multiple-deliverable arrangement. VSOE of selling price is the price charged for a deliverable when it is sold separately or, for a deliverable not yet being sold separately, the price established by management with the appropriate authority. If a vendor does not have VSOE for the undelivered elements in the arrangement, the revenue associated with both the delivered and undelivered elements is combined into one unit of accounting. Any revenue attributable to the delivered products is then deferred and recognized at a later date, which
50
in many cases is as the undelivered elements are delivered by the vendor. An exception to this guidance exists if the vendor has VSOE or TPE of selling price for the undelivered elements in the arrangement but not for the delivered elements. In those situations, the vendor uses the residual value method to allocate revenue to the delivered ele-ment, which results in the allocation of the entire discount in the arrangement, if any, to the delivered element. This ASU addresses concerns that the current accounting model may not appropriately refl ect the economics of the underlying transactions because sometimes no revenue is recognized for products for which the vendor has already completed the related performance. As a result of this amendment, multiple element arrangements will be separated in more circumstances than under the existing accounting model. This amendment establishes a selling price hierarchy for determining the selling price of a deliverable. The selling price utilized for each deliverable will be based on VSOE if available, TPE if VSOE is not available, or estimated selling price if neither VSOE or TPE evidence is available. The residual method is eliminated. The amendments in the update are effective prospectively for revenue arrangements entered into or materially modifi ed in fi scal years beginning on or after June 15, 2010. Early adoption is permitted, however, if early adoption is elected, we would be required to apply the amendments retrospectively from the beginning of the fi scal year of adoption and make specifi c disclosures. We have not yet adopted this ASU, and we are currently evaluating the impact it may have on our consolidated fi nancial statements.
RECENTLY ADOPTED ACCOUNTING PRONOUNCEMENTS: In December 2007, the FASB issued guidance that established principles and requirements for how an acquirer recognizes and measures in its fi nancial statements the identifi able assets acquired, the liabilities assumed, any non-controlling interest in the acquiree and the goodwill acquired. This guidance also establishes disclosure requirements to enable the evaluation of the nature and fi nancial effects of the business combination. The adoption of this guidance will affect the total purchase price of acquisi-tions, as acquisition costs will now be expensed, and the allocation of fair value to specifi c assets and liabilities will be different. This guidance was effective for us January 1, 2009. As a result of adopting this guidance, we recognized $1.1 million of acquisition costs during the year ended December 31, 2009 related to our purchase of assets from Zilog. The acquisition costs recognized during 2009 included $0.1 million of acquisition costs that were capitalized at December 31, 2008.
In addition to the recently adopted accounting standard above, we adopted the following accounting standards during 2009, none of which had a material effect on our consolidated fi nancial position and results of operations:
• In September 2009, the FASB issued an ASU to address the need for additional implementation guidance on accounting for uncertainty in income taxes. We adopted this guidance during the quarter ended September 30, 2009.
• In August 2009, the FASB issued an ASU addressing the measurement of liabilities at fair value and reaffi rmed the practice of measuring fair value using quoted market prices when a liability is traded as an asset. We adopted this guidance during the quarter ended September 30, 2009.
• In June 2009, the FASB issued new guidance establishing the FASB Accounting Standards Codifi cation as the source of authoritative U.S. GAAP and identifi ed the framework for selecting the principles to utilize in the prepa-ration of fi nancial statements for nongovernmental entities. We adopted this guidance during the quarter ended September 30, 2009.
• In April 2009, the FASB issued additional guidance for estimating fair value when the volume and level of activity for an asset or liability have signifi cantly decreased and identifying circumstances that indicate a transaction is not orderly. We adopted this guidance during the quarter ended June 30, 2009.
• In April 2009, the FASB issued new guidance requiring disclosures about the fair value of fi nancial instruments for interim reporting periods of publicly traded companies as well as in annual fi nancial statements. We adopted this guidance during the quarter ended June 30, 2009.
• In April 2009, the FASB issued new guidance to address application issues raised by preparers, auditors, and members of the legal profession on initial recognition and measurement, subsequent measurement and account-ing, and disclosure of assets and liabilities arising from contingencies in a business combination. We adopted this guidance during the quarter ended March 31, 2009.
• In December 2008, the FASB issued guidance requiring employers to disclose certain information about plan assets of a defi ned benefi t pension or other postretirement plan. We adopted this guidance during the quarter ended March 31, 2009.
• In November 2008, the FASB issued guidance clarifying how to account for defensive intangible assets subse-quent to initial measurement. We adopted this guidance during the quarter ended March 31, 2009.
• In June 2008, the FASB issued new guidance addressing whether instruments granted in share-based payment transactions are participating securities prior to vesting and, therefore, need to be included in the earnings alloca-tion in computing earnings per share. We adopted this guidance during the quarter ended March 31, 2009.
• In April 2008, the FASB issued guidance amending the factors that should be considered while developing renewal or extension assumptions to be utilized when determining the useful life of a recognized intangible asset. We adopted this guidance during the quarter ended March 31, 2009.
• In March 2008, the FASB issued guidance that amended and expanded the disclosure requirements for deriva-tive instruments and hedging activities to provide improved transparency into their uses and fi nancial statement impact. We adopted this guidance during the quarter ended March 31, 2009.

51 univ
ersa
l el
ectr
onic
s in
c. 0
9 a
nnua
l re
port
• In December 2007, the FASB issued new guidance changing the accounting for, and the fi nancial statement pre-sentation of, non-controlling equity interests in a consolidated subsidiary. We adopted this guidance during the quarter ended March 31, 2009.
• In November 2007, the FASB issued guidance defi ning collaborative arrangements and establishing reporting requirements for transactions between participants in a collaborative arrangement and between participants in the arrangement and third parties. We adopted this guidance during the quarter ended March 31, 2009.
• In September 2006, the FASB issued new guidance on fair value measurements. This guidance clarifi es the defi nition of fair value, establishes a framework for measuring fair value and expands the disclosures of fair value measurements. In February 2008, the FASB delayed the effective date of the fair value measurements guidance for certain non-fi nancial assets and liabilities. We adopted this new guidance for fi nancial assets and liabilities during the quarter ended March 31, 2008. We adopted this new guidance for non-fi nancial assets and liabilities during the quarter ended March 31, 2009.
NOTE 3: Cash, Cash Equivalents, and Term Deposit
The following table sets forth our cash, cash equivalents, and term deposit that were accounted for at fair value on a recurring basis as of December 31, 2009:
(in thousands)
DescriptionYear Ended 12/31/2009
fair value measurement using
Quoted Prices in Active Markets
for Identical Asset (Level 1)
Signifi cant Other Observable Inputs
(Level 2)
Signifi cant Unobservable Inputs
(Level 3)
Cash and cash equivalents $ 29,016 $ 29,016 $ — $ —
Term deposit 49,246 49,246 — —
$ 78,262 $ 78,262 $ — $ —
At December 31, 2009, we had approximately $9.3 million, $14.2 million, $2.4 million and $3.1 million of cash and cash equivalents in the United States, Europe, Asia and Cayman Islands, respectively. In addition, at December 31, 2009, we had a six-month term deposit cash account at Wells Fargo Bank denominated in Hong Kong dollars. The term began on July 21, 2009 and ended on January 21, 2010. The term deposit earned interest at an annual rate of 0.57%. The deposit amount and interest receivable related to this account as of December 31, 2009 was $49.2 mil-lion and 0.1 million, respectively.
On March 11, 2010, we entered into a three-month term deposit cash account at Wells Fargo Bank denominated in Hong Kong dollars. The term deposit of $50.3 million earns interest at an annual rate of 0.09%.
At December 31, 2008, we had approximately $8.4 million, $6.1 million and $60.7 million of cash and cash equivalents in the United States, Europe, and Asia, respectively.
See Note 2 under the caption Cash, Cash Equivalents, and Term Deposit for further information regarding our accounting principles.
NOTE 4: Accounts Receivable, net and Revenue Concentrations
Accounts receivable, net consisted of the following at December 31, 2009 and 2008:
(in thousands) 2 0 0 9 2 0 0 8
Trade receivables, gross $ 68,458 $ 65,014
Allowance for doubtful accounts (2,423) (2,439)
Allowance for sales returns (1,999) (2,823)
Net trade receivables 64,036 59,752
Other(1) 356 73
Accounts receivable, net $ 64,392 $ 59,825
(1) Other receivables as of December 31, 2009 consisted primarily of a reimbursement due from a vendor for quality issues, sales tax receivables, and interest due
from Wells Fargo Bank on our term deposit (see Note 3).
TRADE RECEIVABLES, GROSS: Trade receivables, gross increased from $65.0 million at December 31, 2008 to $68.5 million at December 31, 2009. The increase in trade receivables, gross was driven primarily by net sales increasing from $78.7 million for the quarter ended December 31, 2008 to $84.9 million for the quarter ended December 31, 2009. Our days sales outstanding were approximately 68 days at both December 31, 2009 and 2008.
ALLOWANCE FOR DOUBTFUL ACCOUNTS: The following changes occurred in the allowance for doubtful accounts during the years ended December 31, 2009, 2008 and 2007:
(in thousands)
Description
Balance at Beginning of
Period
Additions to Costs and Expenses
(Write-offs)/FX Effects
Balance at End of Period
Year Ended December 31, 2009 $ 2,439 $ 363 $ (379) $ 2,423
Year Ended December 31, 2008 $ 2,330 $ 442 $ (333) $ 2,439
Year Ended December 31, 2007 $ 2,602 $ 23 $ (295) $ 2,330
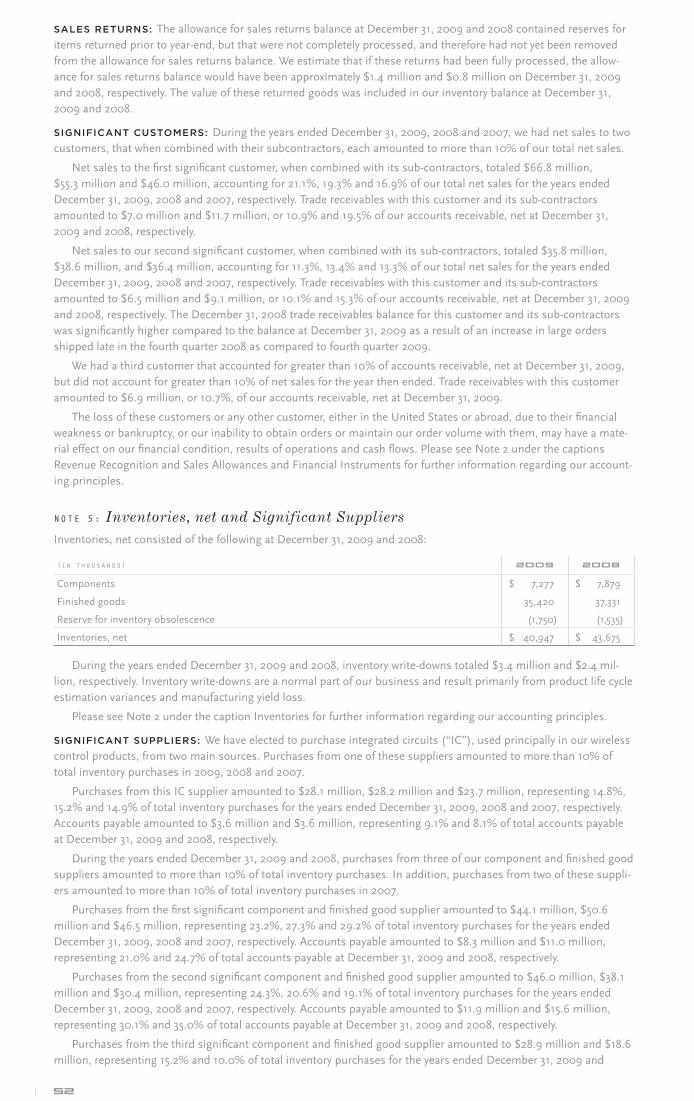
52
SALES RETURNS: The allowance for sales returns balance at December 31, 2009 and 2008 contained reserves for items returned prior to year-end, but that were not completely processed, and therefore had not yet been removed from the allowance for sales returns balance. We estimate that if these returns had been fully processed, the allow-ance for sales returns balance would have been approximately $1.4 million and $0.8 million on December 31, 2009 and 2008, respectively. The value of these returned goods was included in our inventory balance at December 31, 2009 and 2008.
SIGNIFICANT CUSTOMERS: During the years ended December 31, 2009, 2008 and 2007, we had net sales to two customers, that when combined with their subcontractors, each amounted to more than 10% of our total net sales.
Net sales to the fi rst signifi cant customer, when combined with its sub-contractors, totaled $66.8 million, $55.3 million and $46.0 million, accounting for 21.1%, 19.3% and 16.9% of our total net sales for the years ended December 31, 2009, 2008 and 2007, respectively. Trade receivables with this customer and its sub-contractors amounted to $7.0 million and $11.7 million, or 10.9% and 19.5% of our accounts receivable, net at December 31, 2009 and 2008, respectively.
Net sales to our second signifi cant customer, when combined with its sub-contractors, totaled $35.8 million, $38.6 million, and $36.4 million, accounting for 11.3%, 13.4% and 13.3% of our total net sales for the years ended December 31, 2009, 2008 and 2007, respectively. Trade receivables with this customer and its sub-contractors amounted to $6.5 million and $9.1 million, or 10.1% and 15.3% of our accounts receivable, net at December 31, 2009 and 2008, respectively. The December 31, 2008 trade receivables balance for this customer and its sub-contractors was signifi cantly higher compared to the balance at December 31, 2009 as a result of an increase in large orders shipped late in the fourth quarter 2008 as compared to fourth quarter 2009.
We had a third customer that accounted for greater than 10% of accounts receivable, net at December 31, 2009, but did not account for greater than 10% of net sales for the year then ended. Trade receivables with this customer amounted to $6.9 million, or 10.7%, of our accounts receivable, net at December 31, 2009.
The loss of these customers or any other customer, either in the United States or abroad, due to their fi nancial weakness or bankruptcy, or our inability to obtain orders or maintain our order volume with them, may have a mate-rial effect on our fi nancial condition, results of operations and cash fl ows. Please see Note 2 under the captions Revenue Recognition and Sales Allowances and Financial Instruments for further information regarding our account-ing principles.
NOTE 5: Inventories, net and Significant Suppliers
Inventories, net consisted of the following at December 31, 2009 and 2008:
(in thousands) 2 0 0 9 2 0 0 8
Components $ 7,277 $ 7,879
Finished goods 35,420 37,331
Reserve for inventory obsolescence (1,750) (1,535)
Inventories, net $ 40,947 $ 43,675
During the years ended December 31, 2009 and 2008, inventory write-downs totaled $3.4 million and $2.4 mil-lion, respectively. Inventory write-downs are a normal part of our business and result primarily from product life cycle estimation variances and manufacturing yield loss.
Please see Note 2 under the caption Inventories for further information regarding our accounting principles.
SIGNIFICANT SUPPLIERS: We have elected to purchase integrated circuits (“IC”), used principally in our wireless control products, from two main sources. Purchases from one of these suppliers amounted to more than 10% of total inventory purchases in 2009, 2008 and 2007.
Purchases from this IC supplier amounted to $28.1 million, $28.2 million and $23.7 million, representing 14.8%, 15.2% and 14.9% of total inventory purchases for the years ended December 31, 2009, 2008 and 2007, respectively. Accounts payable amounted to $3.6 million and $3.6 million, representing 9.1% and 8.1% of total accounts payable at December 31, 2009 and 2008, respectively.
During the years ended December 31, 2009 and 2008, purchases from three of our component and fi nished good suppliers amounted to more than 10% of total inventory purchases. In addition, purchases from two of these suppli-ers amounted to more than 10% of total inventory purchases in 2007.
Purchases from the fi rst signifi cant component and fi nished good supplier amounted to $44.1 million, $50.6 million and $46.5 million, representing 23.2%, 27.3% and 29.2% of total inventory purchases for the years ended December 31, 2009, 2008 and 2007, respectively. Accounts payable amounted to $8.3 million and $11.0 million, representing 21.0% and 24.7% of total accounts payable at December 31, 2009 and 2008, respectively.
Purchases from the second signifi cant component and fi nished good supplier amounted to $46.0 million, $38.1 million and $30.4 million, representing 24.3%, 20.6% and 19.1% of total inventory purchases for the years ended December 31, 2009, 2008 and 2007, respectively. Accounts payable amounted to $11.9 million and $15.6 million, representing 30.1% and 35.0% of total accounts payable at December 31, 2009 and 2008, respectively.
Purchases from the third signifi cant component and fi nished good supplier amounted to $28.9 million and $18.6 million, representing 15.2% and 10.0% of total inventory purchases for the years ended December 31, 2009 and
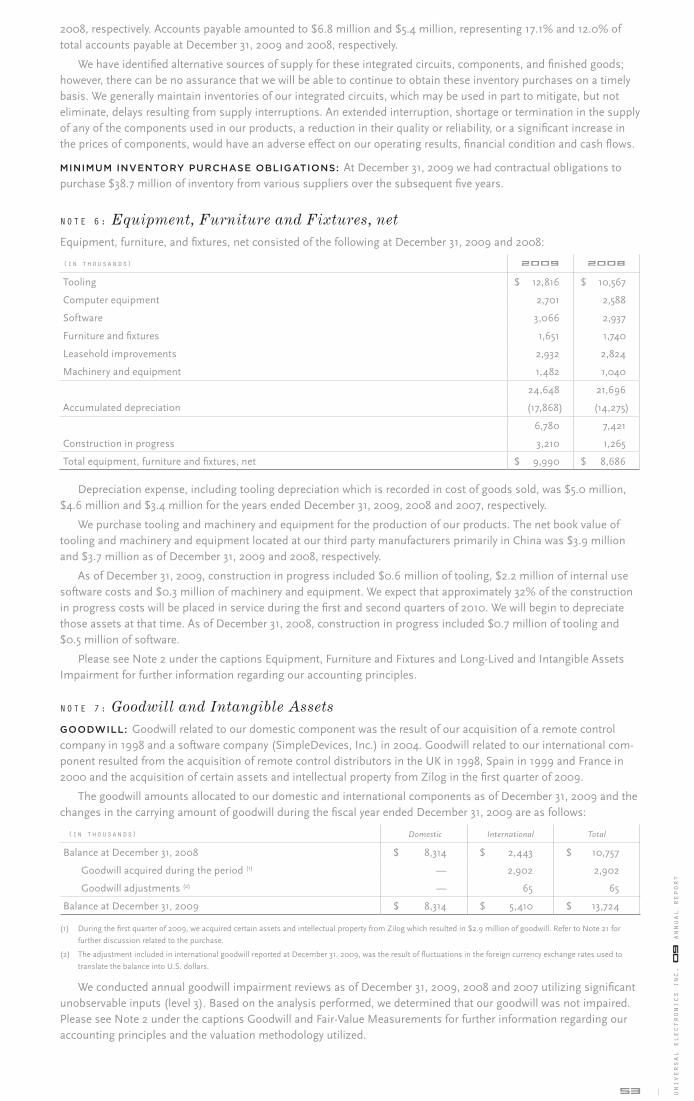
53 univ
ersa
l el
ectr
onic
s in
c. 0
9 a
nnua
l re
port
2008, respectively. Accounts payable amounted to $6.8 million and $5.4 million, representing 17.1% and 12.0% of total accounts payable at December 31, 2009 and 2008, respectively.
We have identifi ed alternative sources of supply for these integrated circuits, components, and fi nished goods; however, there can be no assurance that we will be able to continue to obtain these inventory purchases on a timely basis. We generally maintain inventories of our integrated circuits, which may be used in part to mitigate, but not eliminate, delays resulting from supply interruptions. An extended interruption, shortage or termination in the supply of any of the components used in our products, a reduction in their quality or reliability, or a signifi cant increase in the prices of components, would have an adverse effect on our operating results, fi nancial condition and cash fl ows.
MINIMUM INVENTORY PURCHASE OBLIGATIONS: At December 31, 2009 we had contractual obligations to purchase $38.7 million of inventory from various suppliers over the subsequent fi ve years.
NOTE 6: Equipment, Furniture and Fixtures, net
Equipment, furniture, and fi xtures, net consisted of the following at December 31, 2009 and 2008:
(in thousands) 2 0 0 9 2 0 0 8
Tooling $ 12,816 $ 10,567
Computer equipment 2,701 2,588
Software 3,066 2,937
Furniture and fi xtures 1,651 1,740
Leasehold improvements 2,932 2,824
Machinery and equipment 1,482 1,040
24,648 21,696
Accumulated depreciation (17,868) (14,275)
6,780 7,421
Construction in progress 3,210 1,265
Total equipment, furniture and fi xtures, net $ 9,990 $ 8,686
Depreciation expense, including tooling depreciation which is recorded in cost of goods sold, was $5.0 million, $4.6 million and $3.4 million for the years ended December 31, 2009, 2008 and 2007, respectively.
We purchase tooling and machinery and equipment for the production of our products. The net book value of tooling and machinery and equipment located at our third party manufacturers primarily in China was $3.9 million and $3.7 million as of December 31, 2009 and 2008, respectively.
As of December 31, 2009, construction in progress included $0.6 million of tooling, $2.2 million of internal use software costs and $0.3 million of machinery and equipment. We expect that approximately 32% of the construction in progress costs will be placed in service during the fi rst and second quarters of 2010. We will begin to depreciate those assets at that time. As of December 31, 2008, construction in progress included $0.7 million of tooling and $0.5 million of software.
Please see Note 2 under the captions Equipment, Furniture and Fixtures and Long-Lived and Intangible Assets Impairment for further information regarding our accounting principles.
NOTE 7: Goodwill and Intangible Assets
GOODWILL: Goodwill related to our domestic component was the result of our acquisition of a remote control company in 1998 and a software company (SimpleDevices, Inc.) in 2004. Goodwill related to our international com-ponent resulted from the acquisition of remote control distributors in the UK in 1998, Spain in 1999 and France in 2000 and the acquisition of certain assets and intellectual property from Zilog in the fi rst quarter of 2009.
The goodwill amounts allocated to our domestic and international components as of December 31, 2009 and the changes in the carrying amount of goodwill during the fi scal year ended December 31, 2009 are as follows:
(in thousands) Domestic International Total
Balance at December 31, 2008 $ 8,314 $ 2,443 $ 10,757
Goodwill acquired during the period (1) — 2,902 2,902
Goodwill adjustments (2) — 65 65
Balance at December 31, 2009 $ 8,314 $ 5,410 $ 13,724
(1) During the fi rst quarter of 2009, we acquired certain assets and intellectual property from Zilog which resulted in $2.9 million of goodwill. Refer to Note 21 for
further discussion related to the purchase.
(2) The adjustment included in international goodwill reported at December 31, 2009, was the result of fl uctuations in the foreign currency exchange rates used to
translate the balance into U.S. dollars.
We conducted annual goodwill impairment reviews as of December 31, 2009, 2008 and 2007 utilizing signifi cant unobservable inputs (level 3). Based on the analysis performed, we determined that our goodwill was not impaired. Please see Note 2 under the captions Goodwill and Fair-Value Measurements for further information regarding our accounting principles and the valuation methodology utilized.
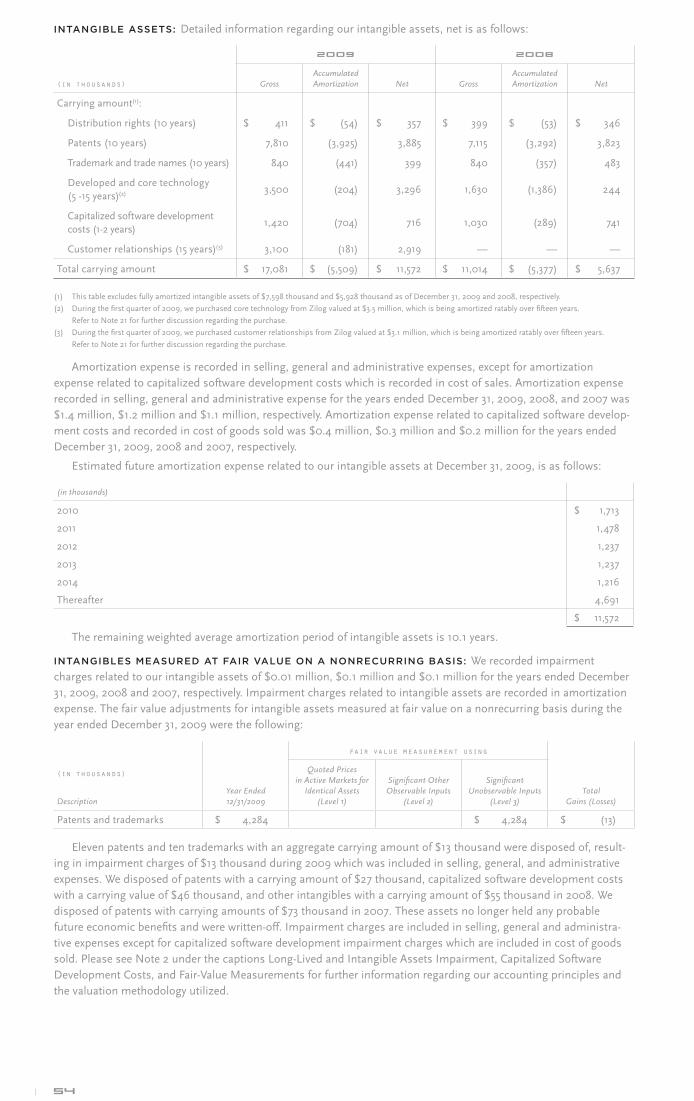
54
INTANGIBLE ASSETS: Detailed information regarding our intangible assets, net is as follows:
2 0 0 9 2 0 0 8
(in thousands) GrossAccumulated Amortization Net Gross
Accumulated Amortization Net
Carrying amount(1):
Distribution rights (10 years) $ 411 $ (54) $ 357 $ 399 $ (53) $ 346
Patents (10 years) 7,810 (3,925) 3,885 7,115 (3,292) 3,823
Trademark and trade names (10 years) 840 (441) 399 840 (357) 483
Developed and core technology (5 -15 years)(2) 3,500 (204) 3,296 1,630 (1,386) 244
Capitalized software development costs (1-2 years)
1,420 (704) 716 1,030 (289) 741
Customer relationships (15 years)(3) 3,100 (181) 2,919 — — —
Total carrying amount $ 17,081 $ (5,509) $ 11,572 $ 11,014 $ (5,377) $ 5,637
(1) This table excludes fully amortized intangible assets of $7,598 thousand and $5,928 thousand as of December 31, 2009 and 2008, respectively.
(2) During the fi rst quarter of 2009, we purchased core technology from Zilog valued at $3.5 million, which is being amortized ratably over fi fteen years.
Refer to Note 21 for further discussion regarding the purchase.
(3) During the fi rst quarter of 2009, we purchased customer relationships from Zilog valued at $3.1 million, which is being amortized ratably over fi fteen years.
Refer to Note 21 for further discussion regarding the purchase.
Amortization expense is recorded in selling, general and administrative expenses, except for amortization expense related to capitalized software development costs which is recorded in cost of sales. Amortization expense recorded in selling, general and administrative expense for the years ended December 31, 2009, 2008, and 2007 was $1.4 million, $1.2 million and $1.1 million, respectively. Amortization expense related to capitalized software develop-ment costs and recorded in cost of goods sold was $0.4 million, $0.3 million and $0.2 million for the years ended December 31, 2009, 2008 and 2007, respectively.
Estimated future amortization expense related to our intangible assets at December 31, 2009, is as follows:
(in thousands)
2010 $ 1,713
2011 1,478
2012 1,237
2013 1,237
2014 1,216
Thereafter 4,691
$ 11,572
The remaining weighted average amortization period of intangible assets is 10.1 years.
INTANGIBLES MEASURED AT FAIR VALUE ON A NONRECURRING BASIS: We recorded impairment charges related to our intangible assets of $0.01 million, $0.1 million and $0.1 million for the years ended December 31, 2009, 2008 and 2007, respectively. Impairment charges related to intangible assets are recorded in amortization expense. The fair value adjustments for intangible assets measured at fair value on a nonrecurring basis during the year ended December 31, 2009 were the following:
Year Ended 12/31/2009
fair value measurement using
Total Gains (Losses)
(in thousands)
Description
Quoted Prices in Active Markets for
Identical Assets (Level 1)
Signifi cant Other Observable Inputs
(Level 2)
Signifi cant Unobservable Inputs
(Level 3)
Patents and trademarks $ 4,284 $ 4,284 $ (13)
Eleven patents and ten trademarks with an aggregate carrying amount of $13 thousand were disposed of, result-ing in impairment charges of $13 thousand during 2009 which was included in selling, general, and administrative expenses. We disposed of patents with a carrying amount of $27 thousand, capitalized software development costs with a carrying value of $46 thousand, and other intangibles with a carrying amount of $55 thousand in 2008. We disposed of patents with carrying amounts of $73 thousand in 2007. These assets no longer held any probable future economic benefi ts and were written-off. Impairment charges are included in selling, general and administra-tive expenses except for capitalized software development impairment charges which are included in cost of goods sold. Please see Note 2 under the captions Long-Lived and Intangible Assets Impairment, Capitalized Software Development Costs, and Fair-Value Measurements for further information regarding our accounting principles and the valuation methodology utilized.

55 univ
ersa
l el
ectr
onic
s in
c. 0
9 a
nnua
l re
port
NOTE 8: Income Taxes
In 2009, 2008 and 2007, pre-tax income was attributed to the following jurisdictions:
year ended december 31,
(in thousands) 2 0 0 9 2 0 0 8 2 0 0 7
Domestic operations $ 17,060 $ 16,650 $ 18,332
Foreign operations 5,117 7,439 11,230
Total $ 22,177 $ 24,089 $ 29,562
The provision for income taxes charged to operations was as follows:
year ended december 31,
(in thousands) 2 0 0 9 2 0 0 8 2 0 0 7
Current tax expense:
U.S. federal $ 7,003 $ 5,407 $ 5,537
State and local 631 1,230 490
Foreign 904 2,205 3,130
Total current 8,538 8,842 9,157
Deferred tax expense (benefi t):
U.S. federal (918) 206 (60)
State and local (376) (627) 84
Foreign 258 (138) 151
Total deferred (1,036) (559) 175
Total provision $ 7,502 $ 8,283 $ 9,332
Net deferred tax assets were comprised of the following at December 31, 2009 and 2008:
(in thousands) 2 0 0 9 2 0 0 8
Deferred tax assets:
Inventory reserves $ 272 $ 258
Allowance for doubtful accounts 154 117
Capitalized research costs 105 19
Capitalized inventory costs 768 757
Net operating losses 2,046 2,473
Amortization of intangibles 572 686
Accrued liabilities 1,155 764
Income tax credits 1,763 1,476
Depreciation 991 786
Stock-based compensation 2,769 2,270
Long term incentive compensation — 201
Other 450 530
Total deferred tax assets 11,045 10,337
Deferred tax liability:
Intangible assets (154) (292)
Other (495) (675)
Total deferred tax liabilities (649) (967)
Net deferred tax assets before valuation allowance 10,396 9,370
Less: Valuation allowance (179) (189)
Net deferred tax assets $ 10,217 $ 9,181
As of December 31, 2009 and 2008, $0.5 million and $0.4 million, respectively, of current deferred tax liabilities were recorded in other accrued expenses (see Note 9).
The deferred tax valuation allowance was $0.2 million as of December 31, 2009 and 2008.

56
The provision for income taxes differs from the amount of income tax determined by applying the applicable U.S. statutory federal income tax rate to pre-tax income from operations as a result of the following:
year ended december 31,
(in thousands) 2 0 0 9 2 0 0 8 2 0 0 7
Tax provision at statutory U.S. rate $ 7,764 $ 8,431 $ 10,347
Increase (decrease) in tax provision resulting from:
State and local taxes, net 166 392 373
Foreign tax rate differential (36) (154) (649)
Nondeductible items 682 251 302
Federal research and development credits (272) (424) (918)
Change in tax rate related to deferred taxes — — (147)
Settlements (449) — —
Other (353) (213) 24
Tax provision $ 7,502 $ 8,283 $ 9,332
At December 31, 2009, we had state Research and Experimentation (“R&E”) income tax credit carryforwards of approximately $1.7 million. The state R&E income tax credits do not have an expiration date.
At December 31, 2009, we had federal, state and foreign net operating losses of approximately $4.6 million, $5.0 million and $0.4 million, respectively. All of the federal and state net operating loss carryforwards were acquired as part of the acquisition of SimpleDevices. The federal and state net operating loss carryforwards begin to expire in 2020 and 2012, respectively. Approximately $0.2 million of the foreign net operating losses will begin to expire in 2020 and the remaining $0.2 million have an unlimited carryforward.
Internal Revenue Code Section 382 places certain limitations on the annual amount of net operating loss carryfor-wards that may be utilized if certain changes to a company’s ownership occur. Our acquisition of SimpleDevices was a change in ownership pursuant to Section 382 of the Internal Revenue Code, and the federal and state net operating loss carryforwards of SimpleDevices are limited but considered realizable in future periods.
The annual federal limitation is as follows: approximately $1.2 million for 2009 and approximately $0.6 million thereafter. California has suspended utilization of net operating losses for 2008 and 2009.
As of December 31, 2009, we believed it was more likely than not that certain deferred tax assets related to the impairment of the investment in a private company (a capital asset) would not be realized due to uncertainties as to the timing and amounts of future capital gains. Accordingly, a valuation allowance of approximately $0.1 million was recorded as of December 31, 2009 and 2008. Additionally, we recorded $0.1 million of various state and foreign valu-ation allowances at December 31, 2009 and 2008.
During the years ended December 31, 2009, 2008 and 2007 we recognized a credit to paid-in capital and a reduc-tion to income taxes payable of $0.4 million, $0.4 million and $3.3 million, respectively, related to the tax benefi t from the exercises of non-qualifi ed stock options and vesting of restricted stock under our stock-based incentive plans.
During 2009, we settled an audit in the Netherlands by the Dutch Tax Authorities for the fi scal years 2002 through 2006, which resulted in the reversal of $0.4 million of previously recorded uncertain tax positions being credited into income.
The undistributed earnings of our foreign subsidiaries are considered to be indefi nitely reinvested. Accordingly, no provision for U.S. federal and state income taxes or foreign withholding taxes has been provided on such undis-tributed earnings. Determination of the potential amount of unrecognized deferred U.S. income tax liability and foreign withholding taxes is not practicable because of the complexities associated with its hypothetical calculation; however, unrecognized foreign tax credits would be available to reduce some portion of the U.S. liability.
UNCERTAIN TAX POSITIONS: On January 1, 2007, we adopted the provisions of ASC 740-10. As a result of the implementation of ASC 740-10, we recognized a $0.2 million increase in the liability for unrecognized tax benefi ts, which was accounted for as a reduction to the January 1, 2007 balance of retained earnings. We also recognized a decrease of $0.3 million in other comprehensive income related to foreign currency translation. At December 31, 2009 and 2008, we had unrecognized tax benefi ts of approximately $2.8 million and $8.7 million, including interest and penalties, respectively.
In accordance with accounting guidance, we have elected to classify interest and penalties as components of tax expense. Interest and penalties were $0.2 million, $1.2 million and $1.0 million at December 31, 2009, 2008 and 2007, respectively. Interest and penalties are included in the unrecognized tax benefi ts.
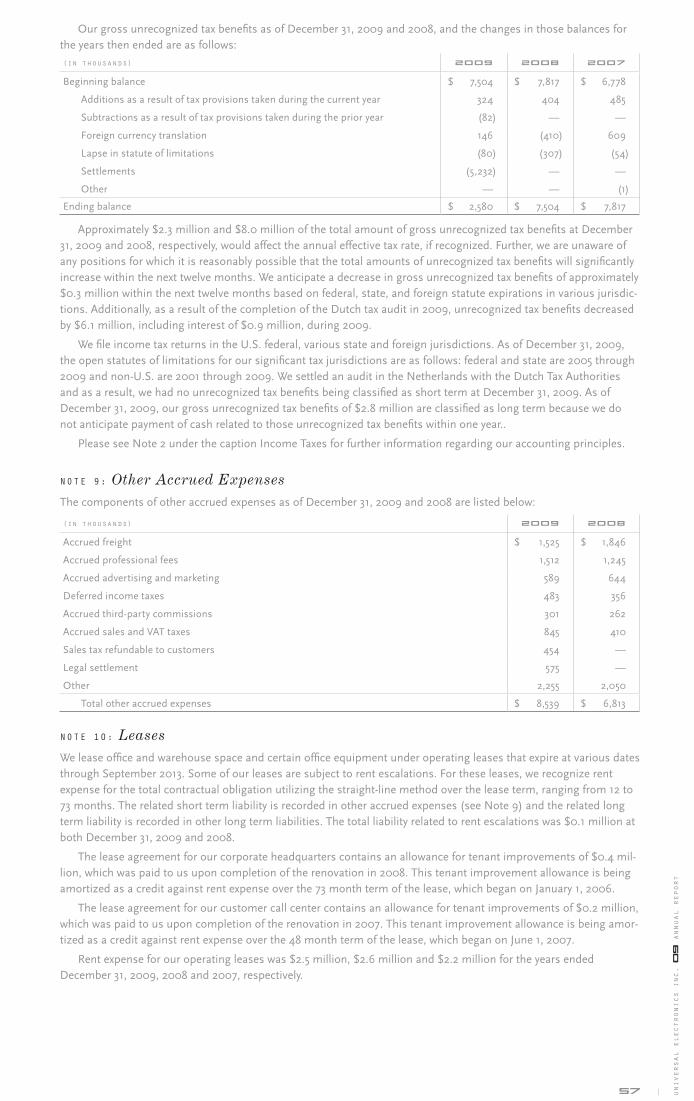
57 univ
ersa
l el
ectr
onic
s in
c. 0
9 a
nnua
l re
port
Our gross unrecognized tax benefi ts as of December 31, 2009 and 2008, and the changes in those balances for the years then ended are as follows:
(in thousands) 2 0 0 9 2 0 0 8 2 0 0 7
Beginning balance $ 7,504 $ 7,817 $ 6,778
Additions as a result of tax provisions taken during the current year 324 404 485
Subtractions as a result of tax provisions taken during the prior year (82) — —
Foreign currency translation 146 (410) 609
Lapse in statute of limitations (80) (307) (54)
Settlements (5,232) — —
Other — — (1)
Ending balance $ 2,580 $ 7,504 $ 7,817
Approximately $2.3 million and $8.0 million of the total amount of gross unrecognized tax benefi ts at December 31, 2009 and 2008, respectively, would affect the annual effective tax rate, if recognized. Further, we are unaware of any positions for which it is reasonably possible that the total amounts of unrecognized tax benefi ts will signifi cantly increase within the next twelve months. We anticipate a decrease in gross unrecognized tax benefi ts of approximately $0.3 million within the next twelve months based on federal, state, and foreign statute expirations in various jurisdic-tions. Additionally, as a result of the completion of the Dutch tax audit in 2009, unrecognized tax benefi ts decreased by $6.1 million, including interest of $0.9 million, during 2009.
We fi le income tax returns in the U.S. federal, various state and foreign jurisdictions. As of December 31, 2009, the open statutes of limitations for our signifi cant tax jurisdictions are as follows: federal and state are 2005 through 2009 and non-U.S. are 2001 through 2009. We settled an audit in the Netherlands with the Dutch Tax Authorities and as a result, we had no unrecognized tax benefi ts being classifi ed as short term at December 31, 2009. As of December 31, 2009, our gross unrecognized tax benefi ts of $2.8 million are classifi ed as long term because we do not anticipate payment of cash related to those unrecognized tax benefi ts within one year..
Please see Note 2 under the caption Income Taxes for further information regarding our accounting principles.
NOTE 9: Other Accrued Expenses
The components of other accrued expenses as of December 31, 2009 and 2008 are listed below:
(in thousands) 2 0 0 9 2 0 0 8
Accrued freight $ 1,525 $ 1,846
Accrued professional fees 1,512 1,245
Accrued advertising and marketing 589 644
Deferred income taxes 483 356
Accrued third-party commissions 301 262
Accrued sales and VAT taxes 845 410
Sales tax refundable to customers 454 —
Legal settlement 575 —
Other 2,255 2,050
Total other accrued expenses $ 8,539 $ 6,813
NOTE 10: Leases
We lease offi ce and warehouse space and certain offi ce equipment under operating leases that expire at various dates through September 2013. Some of our leases are subject to rent escalations. For these leases, we recognize rent expense for the total contractual obligation utilizing the straight-line method over the lease term, ranging from 12 to 73 months. The related short term liability is recorded in other accrued expenses (see Note 9) and the related long term liability is recorded in other long term liabilities. The total liability related to rent escalations was $0.1 million at both December 31, 2009 and 2008.
The lease agreement for our corporate headquarters contains an allowance for tenant improvements of $0.4 mil-lion, which was paid to us upon completion of the renovation in 2008. This tenant improvement allowance is being amortized as a credit against rent expense over the 73 month term of the lease, which began on January 1, 2006.
The lease agreement for our customer call center contains an allowance for tenant improvements of $0.2 million, which was paid to us upon completion of the renovation in 2007. This tenant improvement allowance is being amor-tized as a credit against rent expense over the 48 month term of the lease, which began on June 1, 2007.
Rent expense for our operating leases was $2.5 million, $2.6 million and $2.2 million for the years ended December 31, 2009, 2008 and 2007, respectively.
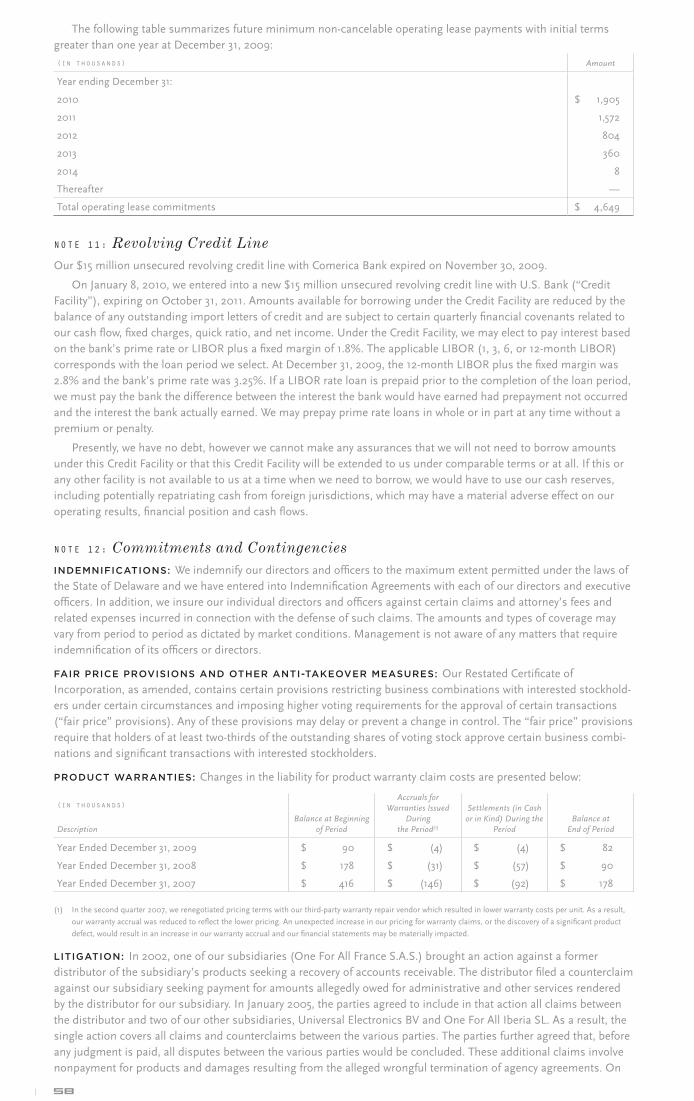
58
The following table summarizes future minimum non-cancelable operating lease payments with initial terms greater than one year at December 31, 2009:
(in thousands) Amount
Year ending December 31:
2010 $ 1,905
2011 1,572
2012 804
2013 360
2014 8
Thereafter —
Total operating lease commitments $ 4,649
NOTE 11: Revolving Credit Line
Our $15 million unsecured revolving credit line with Comerica Bank expired on November 30, 2009.
On January 8, 2010, we entered into a new $15 million unsecured revolving credit line with U.S. Bank (“Credit Facility”), expiring on October 31, 2011. Amounts available for borrowing under the Credit Facility are reduced by the balance of any outstanding import letters of credit and are subject to certain quarterly fi nancial covenants related to our cash fl ow, fi xed charges, quick ratio, and net income. Under the Credit Facility, we may elect to pay interest based on the bank’s prime rate or LIBOR plus a fi xed margin of 1.8%. The applicable LIBOR (1, 3, 6, or 12-month LIBOR) corresponds with the loan period we select. At December 31, 2009, the 12-month LIBOR plus the fi xed margin was 2.8% and the bank’s prime rate was 3.25%. If a LIBOR rate loan is prepaid prior to the completion of the loan period, we must pay the bank the difference between the interest the bank would have earned had prepayment not occurred and the interest the bank actually earned. We may prepay prime rate loans in whole or in part at any time without a premium or penalty.
Presently, we have no debt, however we cannot make any assurances that we will not need to borrow amounts under this Credit Facility or that this Credit Facility will be extended to us under comparable terms or at all. If this or any other facility is not available to us at a time when we need to borrow, we would have to use our cash reserves, including potentially repatriating cash from foreign jurisdictions, which may have a material adverse effect on our operating results, fi nancial position and cash fl ows.
NOTE 12: Commitments and Contingencies
INDEMNIFICATIONS: We indemnify our directors and offi cers to the maximum extent permitted under the laws of the State of Delaware and we have entered into Indemnifi cation Agreements with each of our directors and executive offi cers. In addition, we insure our individual directors and offi cers against certain claims and attorney’s fees and related expenses incurred in connection with the defense of such claims. The amounts and types of coverage may vary from period to period as dictated by market conditions. Management is not aware of any matters that require indemnifi cation of its offi cers or directors.
FAIR PRICE PROVISIONS AND OTHER ANTI-TAKEOVER MEASURES: Our Restated Certifi cate of Incorporation, as amended, contains certain provisions restricting business combinations with interested stockhold-ers under certain circumstances and imposing higher voting requirements for the approval of certain transactions (“fair price” provisions). Any of these provisions may delay or prevent a change in control. The “fair price” provisions require that holders of at least two-thirds of the outstanding shares of voting stock approve certain business combi-nations and signifi cant transactions with interested stockholders.
PRODUCT WARRANTIES: Changes in the liability for product warranty claim costs are presented below:
(in thousands)
DescriptionBalance at Beginning
of Period
Accruals for Warranties Issued
During the Period(1)
Settlements (in Cash or in Kind) During the
PeriodBalance at
End of Period
Year Ended December 31, 2009 $ 90 $ (4) $ (4) $ 82
Year Ended December 31, 2008 $ 178 $ (31) $ (57) $ 90
Year Ended December 31, 2007 $ 416 $ (146) $ (92) $ 178
(1) In the second quarter 2007, we renegotiated pricing terms with our third-party warranty repair vendor which resulted in lower warranty costs per unit. As a result,
our warranty accrual was reduced to refl ect the lower pricing. An unexpected increase in our pricing for warranty claims, or the discovery of a signifi cant product
defect, would result in an increase in our warranty accrual and our fi nancial statements may be materially impacted.
LITIGATION: In 2002, one of our subsidiaries (One For All France S.A.S.) brought an action against a former distributor of the subsidiary’s products seeking a recovery of accounts receivable. The distributor fi led a counterclaim against our subsidiary seeking payment for amounts allegedly owed for administrative and other services rendered by the distributor for our subsidiary. In January 2005, the parties agreed to include in that action all claims between the distributor and two of our other subsidiaries, Universal Electronics BV and One For All Iberia SL. As a result, the single action covers all claims and counterclaims between the various parties. The parties further agreed that, before any judgment is paid, all disputes between the various parties would be concluded. These additional claims involve nonpayment for products and damages resulting from the alleged wrongful termination of agency agreements. On
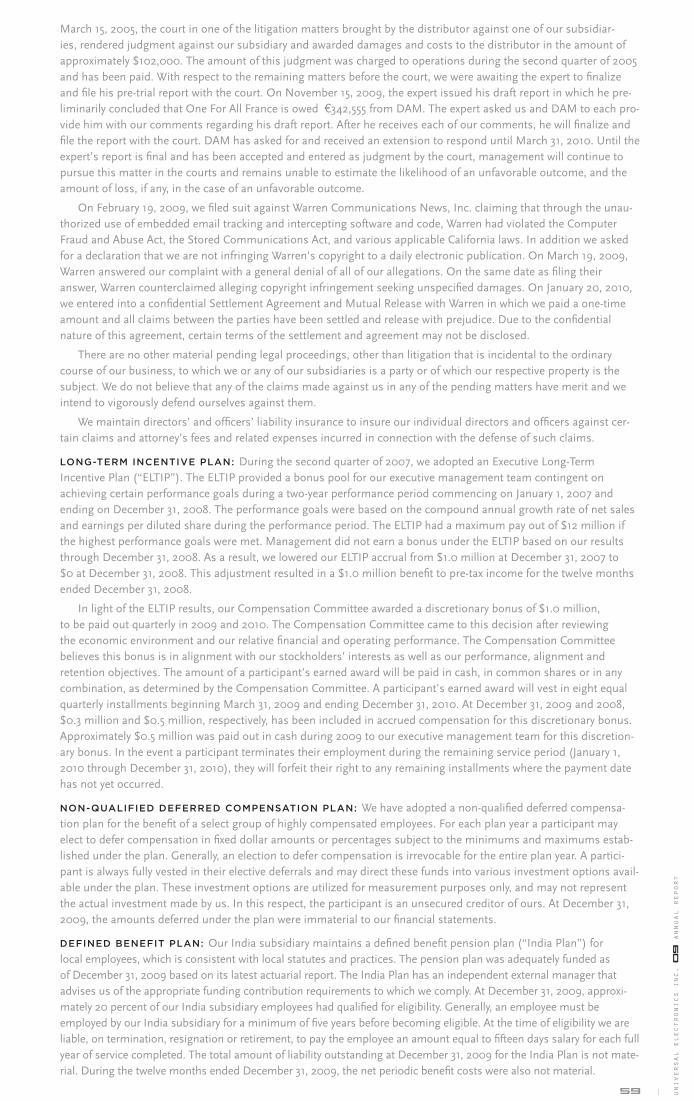
59 univ
ersa
l el
ectr
onic
s in
c. 0
9 a
nnua
l re
port
March 15, 2005, the court in one of the litigation matters brought by the distributor against one of our subsidiar-ies, rendered judgment against our subsidiary and awarded damages and costs to the distributor in the amount of approximately $102,000. The amount of this judgment was charged to operations during the second quarter of 2005 and has been paid. With respect to the remaining matters before the court, we were awaiting the expert to fi nalize and fi le his pre-trial report with the court. On November 15, 2009, the expert issued his draft report in which he pre-liminarily concluded that One For All France is owed €342,555 from DAM. The expert asked us and DAM to each pro-vide him with our comments regarding his draft report. After he receives each of our comments, he will fi nalize and fi le the report with the court. DAM has asked for and received an extension to respond until March 31, 2010. Until the expert’s report is fi nal and has been accepted and entered as judgment by the court, management will continue to pursue this matter in the courts and remains unable to estimate the likelihood of an unfavorable outcome, and the amount of loss, if any, in the case of an unfavorable outcome.
On February 19, 2009, we fi led suit against Warren Communications News, Inc. claiming that through the unau-thorized use of embedded email tracking and intercepting software and code, Warren had violated the Computer Fraud and Abuse Act, the Stored Communications Act, and various applicable California laws. In addition we asked for a declaration that we are not infringing Warren’s copyright to a daily electronic publication. On March 19, 2009, Warren answered our complaint with a general denial of all of our allegations. On the same date as fi ling their answer, Warren counterclaimed alleging copyright infringement seeking unspecifi ed damages. On January 20, 2010, we entered into a confi dential Settlement Agreement and Mutual Release with Warren in which we paid a one-time amount and all claims between the parties have been settled and release with prejudice. Due to the confi dential nature of this agreement, certain terms of the settlement and agreement may not be disclosed.
There are no other material pending legal proceedings, other than litigation that is incidental to the ordinary course of our business, to which we or any of our subsidiaries is a party or of which our respective property is the subject. We do not believe that any of the claims made against us in any of the pending matters have merit and we intend to vigorously defend ourselves against them.
We maintain directors’ and offi cers’ liability insurance to insure our individual directors and offi cers against cer-tain claims and attorney’s fees and related expenses incurred in connection with the defense of such claims.
LONG-TERM INCENTIVE PLAN: During the second quarter of 2007, we adopted an Executive Long-Term Incentive Plan (“ELTIP”). The ELTIP provided a bonus pool for our executive management team contingent on achieving certain performance goals during a two-year performance period commencing on January 1, 2007 and ending on December 31, 2008. The performance goals were based on the compound annual growth rate of net sales and earnings per diluted share during the performance period. The ELTIP had a maximum pay out of $12 million if the highest performance goals were met. Management did not earn a bonus under the ELTIP based on our results through December 31, 2008. As a result, we lowered our ELTIP accrual from $1.0 million at December 31, 2007 to $0 at December 31, 2008. This adjustment resulted in a $1.0 million benefi t to pre-tax income for the twelve months ended December 31, 2008.
In light of the ELTIP results, our Compensation Committee awarded a discretionary bonus of $1.0 million, to be paid out quarterly in 2009 and 2010. The Compensation Committee came to this decision after reviewing the economic environment and our relative fi nancial and operating performance. The Compensation Committee believes this bonus is in alignment with our stockholders’ interests as well as our performance, alignment and retention objectives. The amount of a participant’s earned award will be paid in cash, in common shares or in any combination, as determined by the Compensation Committee. A participant’s earned award will vest in eight equal quarterly installments beginning March 31, 2009 and ending December 31, 2010. At December 31, 2009 and 2008, $0.3 million and $0.5 million, respectively, has been included in accrued compensation for this discretionary bonus. Approximately $0.5 million was paid out in cash during 2009 to our executive management team for this discretion-ary bonus. In the event a participant terminates their employment during the remaining service period (January 1, 2010 through December 31, 2010), they will forfeit their right to any remaining installments where the payment date has not yet occurred.
NON-QUALIFIED DEFERRED COMPENSATION PLAN: We have adopted a non-qualifi ed deferred compensa-tion plan for the benefi t of a select group of highly compensated employees. For each plan year a participant may elect to defer compensation in fi xed dollar amounts or percentages subject to the minimums and maximums estab-lished under the plan. Generally, an election to defer compensation is irrevocable for the entire plan year. A partici-pant is always fully vested in their elective deferrals and may direct these funds into various investment options avail-able under the plan. These investment options are utilized for measurement purposes only, and may not represent the actual investment made by us. In this respect, the participant is an unsecured creditor of ours. At December 31, 2009, the amounts deferred under the plan were immaterial to our fi nancial statements.
DEFINED BENEFIT PLAN: Our India subsidiary maintains a defi ned benefi t pension plan (“India Plan”) for local employees, which is consistent with local statutes and practices. The pension plan was adequately funded as of December 31, 2009 based on its latest actuarial report. The India Plan has an independent external manager that advises us of the appropriate funding contribution requirements to which we comply. At December 31, 2009, approxi-mately 20 percent of our India subsidiary employees had qualifi ed for eligibility. Generally, an employee must be employed by our India subsidiary for a minimum of fi ve years before becoming eligible. At the time of eligibility we are liable, on termination, resignation or retirement, to pay the employee an amount equal to fi fteen days salary for each full year of service completed. The total amount of liability outstanding at December 31, 2009 for the India Plan is not mate-rial. During the twelve months ended December 31, 2009, the net periodic benefi t costs were also not material.

60
NOTE 13: Treasury Stock
During the years ended December 31, 2009, 2008 and 2007, we repurchased 404,643, 1,118,318 and 471,300 shares of our common stock at a cost of $7.7 million, $26.7 million and $14.5 million, respectively. Repurchased shares are recorded as shares held in treasury at cost. We generally hold these shares for future use as management and the Board of Directors deem appropriate, including compensating our outside directors. During the years ended December 31, 2009, 2008 and 2007, we issued 25,000, 23,438 and 24,688 shares, respectively, to outside directors for services performed (see Note 15).
On February 11, 2010, our Board of Directors authorized management to continue repurchasing up to an addi-tional 1,000,000 shares of our issued and outstanding common stock. Repurchases may be made whenever we deem a repurchase is a good use of our cash and the price to be paid is at or below a threshold approved by our Board.
STOCK AWARDS TO OUTSIDE DIRECTORS: We issue restricted stock awards to our outside directors as com-pensation for services performed. We grant each of our outside directors 5,000 shares of our common stock annually each July 1st. When an additional outside director is appointed to our Board of Directors, they receive a prorated number of shares based on the number of months they will serve during the initial year. Compensation expense related to restricted stock awards is based on the grant date fair value the shares awarded. The fair value of these shares is amortized on a straight-line basis over the requisite service period of one year (see Note 2 under the cap-tion Stock-Based Compensation and Note 15). The shares are issued from treasury stock using a fi rst-in-fi rst-out cost basis, which amounted to $0.4 million and $0.4 million in 2009 and 2008, respectively.
NOTE 14: Business Segment and Foreign Operations
REPORTABLE SEGMENT: An operating segment, in part, is a component of an enterprise whose operating results are regularly reviewed by the chief operating decision maker to make decisions about resources to be allocated to the segment and assess its performance. Operating segments may be aggregated only to a limited extent. We operate in a single operating and reportable segment.
FOREIGN OPERATIONS: Our net sales to external customers by geographic area for the years ended December 31, 2009, 2008 and 2007 were the following:
(in thousands) 2 0 0 9 2 0 0 8 2 0 0 7
Net sales:
United States $ 194,279 $ 162,855 $ 151,034
International:
Asia 54,931 48,511 31,624
United Kingdom 20,873 21,234 31,290
Australia 1,558 4,190 2,772
France 3,603 5,359 4,940
Germany 6,752 7,771 6,228
Italy 3,471 2,608 2,506
Portugal 4,168 1,780 816
South Africa 6,495 5,827 7,192
Spain 3,929 7,523 8,483
Switzerland 578 1,099 6,473
All Other 16,913 18,343 19,322
Total international 123,271 124,245 121,646
Total net sales $ 317,550 $ 287,100 $ 272,680
Specifi c identifi cation of the customer location was the basis used for attributing revenues from external custom-ers to individual countries.
Long-lived asset information by our domestic and international components as of December 31, 2009, 2008 and 2007 were as follows:
2 0 0 9 2 0 0 8 2 0 0 7
Long-lived tangible assets:
United States $ 7,440 $ 6,525 $ 5,238
All other countries 3,693 2,770 2,689
Total $ 11,133 $ 9,295 $ 7,927
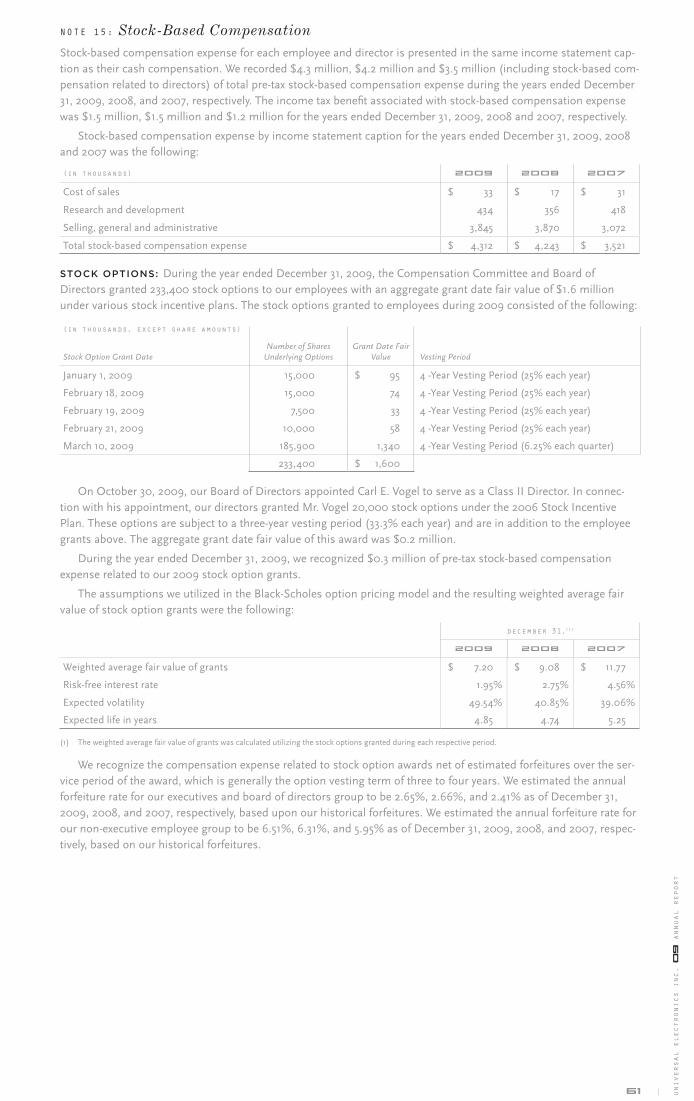
61 univ
ersa
l el
ectr
onic
s in
c. 0
9 a
nnua
l re
port
NOTE 15: Stock-Based Compensation
Stock-based compensation expense for each employee and director is presented in the same income statement cap-tion as their cash compensation. We recorded $4.3 million, $4.2 million and $3.5 million (including stock-based com-pensation related to directors) of total pre-tax stock-based compensation expense during the years ended December 31, 2009, 2008, and 2007, respectively. The income tax benefi t associated with stock-based compensation expense was $1.5 million, $1.5 million and $1.2 million for the years ended December 31, 2009, 2008 and 2007, respectively.
Stock-based compensation expense by income statement caption for the years ended December 31, 2009, 2008 and 2007 was the following:
(in thousands) 2 0 0 9 2 0 0 8 2 0 0 7
Cost of sales $ 33 $ 17 $ 31
Research and development 434 356 418
Selling, general and administrative 3,845 3,870 3,072
Total stock-based compensation expense $ 4,312 $ 4,243 $ 3,521
STOCK OPTIONS: During the year ended December 31, 2009, the Compensation Committee and Board of Directors granted 233,400 stock options to our employees with an aggregate grant date fair value of $1.6 million under various stock incentive plans. The stock options granted to employees during 2009 consisted of the following:
(in thousands, except share amounts)
Stock Option Grant DateNumber of Shares
Underlying OptionsGrant Date Fair
Value Vesting Period
January 1, 2009 15,000 $ 95 4 -Year Vesting Period (25% each year)
February 18, 2009 15,000 74 4 -Year Vesting Period (25% each year)
February 19, 2009 7,500 33 4 -Year Vesting Period (25% each year)
February 21, 2009 10,000 58 4 -Year Vesting Period (25% each year)
March 10, 2009 185,900 1,340 4 -Year Vesting Period (6.25% each quarter)
233,400 $ 1,600
On October 30, 2009, our Board of Directors appointed Carl E. Vogel to serve as a Class II Director. In connec-tion with his appointment, our directors granted Mr. Vogel 20,000 stock options under the 2006 Stock Incentive Plan. These options are subject to a three-year vesting period (33.3% each year) and are in addition to the employee grants above. The aggregate grant date fair value of this award was $0.2 million.
During the year ended December 31, 2009, we recognized $0.3 million of pre-tax stock-based compensation expense related to our 2009 stock option grants.
The assumptions we utilized in the Black-Scholes option pricing model and the resulting weighted average fair value of stock option grants were the following:
december 31,(1)
2 0 0 9 2 0 0 8 2 0 0 7
Weighted average fair value of grants $ 7.20 $ 9.08 $ 11.77
Risk-free interest rate 1.95% 2.75% 4.56%
Expected volatility 49.54% 40.85% 39.06%
Expected life in years 4.85 4.74 5.25
(1) The weighted average fair value of grants was calculated utilizing the stock options granted during each respective period.
We recognize the compensation expense related to stock option awards net of estimated forfeitures over the ser-vice period of the award, which is generally the option vesting term of three to four years. We estimated the annual forfeiture rate for our executives and board of directors group to be 2.65%, 2.66%, and 2.41% as of December 31, 2009, 2008, and 2007, respectively, based upon our historical forfeitures. We estimated the annual forfeiture rate for our non-executive employee group to be 6.51%, 6.31%, and 5.95% as of December 31, 2009, 2008, and 2007, respec-tively, based on our historical forfeitures.

62
Stock option activity during the years ended December 31, 2009, 2008 and 2007 was the following:
2 0 0 9 2 0 0 8 2 0 0 7
Number of Options
(in 000’s)
Weighted- Average Exercise
Price
Weighted- Average
Remaining Contractual
Term (in years)
Aggregate Intrinsic
Value (in 000’s)
Number of Options
(in 000’s)
Weighted- Average Exercise
Price
Weighted- Average
Remaining Contractual
Term (in years)
Aggregate Intrinsic
Value (in 000’s)
Number of Options
(in 000’s)
Weighted- Average Exercise
Price
Weighted- Average
Remaining Contractual
Term (in years)
Aggregate Intrinsic
Value (in 000’s)
Outstanding at beginning of the year 1,729 $ 17.64 1,739 $ 16.83 2,480 $ 13.73
Granted 253 16.26 140 23.46 329 27.80
Exercised (278) 11.75 $ 2,320 (114) 10.19 $ 1,562 (981) 12.83 $ 17,263
Forfeited/cancelled/ expired (11) 22.43 (36) 24.70 (89) 14.91
Outstanding at end of year 1,693 $ 18.37 5.40 $ 9,677 1,729 $ 17.64 5.06 $ 3,045 1,739 $ 16.83 5.58 $ 28,884
Vested and expected to vest at end of year 1,655 $ 18.30 5.33 $ 9,532 1,688 $ 17.42 4.98 $ 3,045 1,650 $ 16.43 5.41 $ 28,079
Exercisable at end of year 1,239 $ 17.33 4.30 $ 8,034 1,267 $ 15.34 3.97 $ 3,044 1,081 $ 13.84 4.05 $ 21,187
The aggregate intrinsic value in the table above represents the total pre-tax intrinsic value (the difference between our closing stock price on the last trading day of 2009, 2008 and 2007 and the exercise price, multiplied by the num-ber of in-the-money options) that would have been received by the option holders had all option holders exercised their options on December 31, 2009, 2008 and 2007. This amount will change based on the fair market value of our stock. The total intrinsic value of stock options exercised in 2009, 2008 and 2007 was $2.3 million, $1.6 million and $17.3 million, respectively.
During 2009, 2008 and 2007, there were no modifi cations made to outstanding stock options.
Cash received from option exercises for the years ended December 31, 2009, 2008 and 2007 was $3.3 million, $1.2 million and $12.6 million, respectively. The actual tax benefi t realized from option exercises of the share-based payment awards was $0.4 million, $0.4 million and $3.3 million for the years ended December 31, 2009, 2008 and 2007, respectively.
As of December 31, 2009, we expect to recognize $2.9 million of total unrecognized pre-tax stock-based compen-sation expense related to non-vested stock options over a remaining weighted-average life of 2.2 years.
RESTRICTED STOCK: During the year ended December 31, 2009, the Compensation Committee and Board of Directors granted 298,170 restricted stock awards to our employees with an aggregate grant date fair value of $4.5 million under the 2006 Stock Incentive Plan. The restricted stock awards granted to employees during 2009 con-sisted of the following:
(in thousands, except share amounts)
Restricted Stock Grant DateNumber of
Shares GrantedGrant Date Fair Value Vesting Period
January 1, 2009 5,000 $ 74 4-Year Vesting Period (25% each year)
February 12, 2009 77,146 925 3-Year Vesting Period (5% each quarter during years 1-2 and 15% each quarter during year 3)
March 4, 2009 24,723 376 2-Year Vesting Period (12.5% each quarter)
March 10, 2009 147,693 2,400 3-Year Vesting Period (8.75% each quarter during years 1-2 and 7.5% each quarter during year 3)
March 10, 2009 40,500 658 4-Year Vesting Period (6.25% each quarter)
August 18, 2009 3,108 60 3-Year Vesting Period (8.75% each quarter during years 1-2 and 7.5% each quarter during year 3)
298,170 $ 4,493
In addition to the grants to employees, 28,333 shares of restricted stock were granted to our outside directors during 2009. On July 1, 2009, 25,000 shares of restricted stock, with a grant date fair value of $0.5 million, were granted to our outside directors as a part of their annual compensation package. These shares are subject to a one-year vesting period (25% each quarter). On October 30, 2009, our Board of Directors appointed Carl E. Vogel to serve as a Class II Director. In connection with his appointment, 3,333 shares of restricted stock with a grant date fair value of $0.07 million were granted to Mr. Vogel (a prorated portion of the annual restricted stock grant made to each director). These shares are subject to an eight-month vesting period (833 shares vested during the fourth quarter 2009 and 1,250 shares will vest in both the fi rst and second quarter of 2010).
During the year ended December 31, 2009, we recognized $1.5 million of pre-tax stock-based compensation expense related to our 2009 restricted stock grants.

63 univ
ersa
l el
ectr
onic
s in
c. 0
9 a
nnua
l re
port
Non-vested restricted stock award activity during the years ended December 31, 2009, 2008 and 2007 (including restricted stock issued to directors as described in Note 13) was the following:
Shares Granted (in 000’s)
Weighted- Average Grant Date Fair Value
Non-vested at December 31, 2006 13 $ 18.74
Granted 25 36.25
Vested (25) 27.49
Forfeited (3) 36.25
Non-vested at December 31, 2007 10 36.25
Granted 142 23.15
Vested (62) 25.15
Forfeited — —
Non-vested at December 31, 2008 90 23.23
Granted 326 15.58
Vested 18.66
Forfeited — —
Non-vested at December 31, 2009 280 $ 16.54
As of December 31, 2009, we expect to recognize $4.5 million of total unrecognized pre-tax stock-based compen-sation expense related to non-vested restricted stock awards over a weighted-average life of 1.9 years.
See Note 2 under the caption Stock-Based Compensation for further information regarding our accounting principles.
STOCK INCENTIVE PLANS
1993 Stock Incentive Plan: On January 19, 1993, the 1993 Stock Incentive Plan (“1993 Plan”) was approved. Under the 1993 Plan, 400,000 shares of common stock were reserved for the granting of incentive and other stock options to offi cers, key employees and directors. The 1993 Plan provided for the granting of incentive and other stock options through January 18, 2003. All options outstanding at the time of termination of the 1993 Plan shall continue in full force and effect in accordance with their terms. The option price for incentive stock options and non-qualifi ed stock options was not less than the fair market value at the date of grant. The Compensation Committee determined when each option was to expire, but no option was exercisable more than ten years after the date the option was granted. The 1993 Plan also provided for the award of stock appreciation rights subject to terms and conditions specifi ed by the Compensation Committee. No stock appreciation rights have been awarded under this 1993 Plan. There are no remaining options available for grant under the 1993 Plan. There are 17,400 shares outstanding under this plan as of December 31, 2009.
1995 Stock Incentive Plan: On May 19, 1995, the 1995 Stock Incentive Plan (“1995 Plan”) was approved. Under the 1995 Plan, 800,000 shares of common stock were available for distribution to our key offi cers, employees and direc-tors. The 1995 Plan provided for the issuance of stock options, stock appreciation rights, performance stock units, or any combination thereof through May 18, 2005. The option prices for the stock options were equal to the fair market value at the date of grant. The Compensation Committee determined when each option was to expire, but no option was exercisable more than ten years after the date the option was granted. No stock appreciation rights or perfor-mance stock units have been awarded under this 1995 Plan. There are no remaining options available for grant under the 1995 Plan. There are 20,910 shares outstanding under this plan as of December 31, 2009.
1996 Stock Incentive Plan: On December 1, 1996, the 1996 Stock Incentive Plan (“1996 Plan”) was approved. Under the 1996 Plan, 800,000 shares of common stock were available for distribution to our key offi cers and employ-ees. The 1996 Plan provided for the issuance of stock options, stock appreciation rights, performance stock units, or any combination thereof through November 30, 2007. The option price for the stock options was equal to the fair market value at the date of grant. The Compensation Committee determined when each option was to expire, but no option was exercisable more than ten years after the date the option was granted. No stock appreciation rights or performance stock units have been awarded under this 1996 Plan. There are no remaining options available for grant under the 1996 Plan. There are 21,334 shares outstanding under this plan as of December 31, 2009.
1998 Stock Incentive Plan: On May 27, 1998, the 1998 Stock Incentive Plan (“1998 Plan”) was approved. Under the 1998 Plan, 630,000 shares of common stock were available for distribution to our key offi cers, employees, and directors. The 1998 Plan provided for the issuance of stock options, stock appreciation rights, performance stock units, or any combination thereof through May 26, 2008. The option price for the stock options was not less than the fair market value at the date of grant. The Compensation Committee determined when each option was to expire, but no option was exercisable more than ten years after the date the option was granted. No stock appreciation rights or performance stock units have been awarded under this 1998 Plan. There are no remaining options available for grant under the 1998 Plan. There are 83,865 shares outstanding under this plan as of December 31, 2009.
1999 Stock Incentive Plan: On January 27, 1999, the 1999 Stock Incentive Plan (“1999 Plan”) was approved. Under the 1999 Plan, 630,000 shares of common stock were available for distribution to our key offi cers and employees.
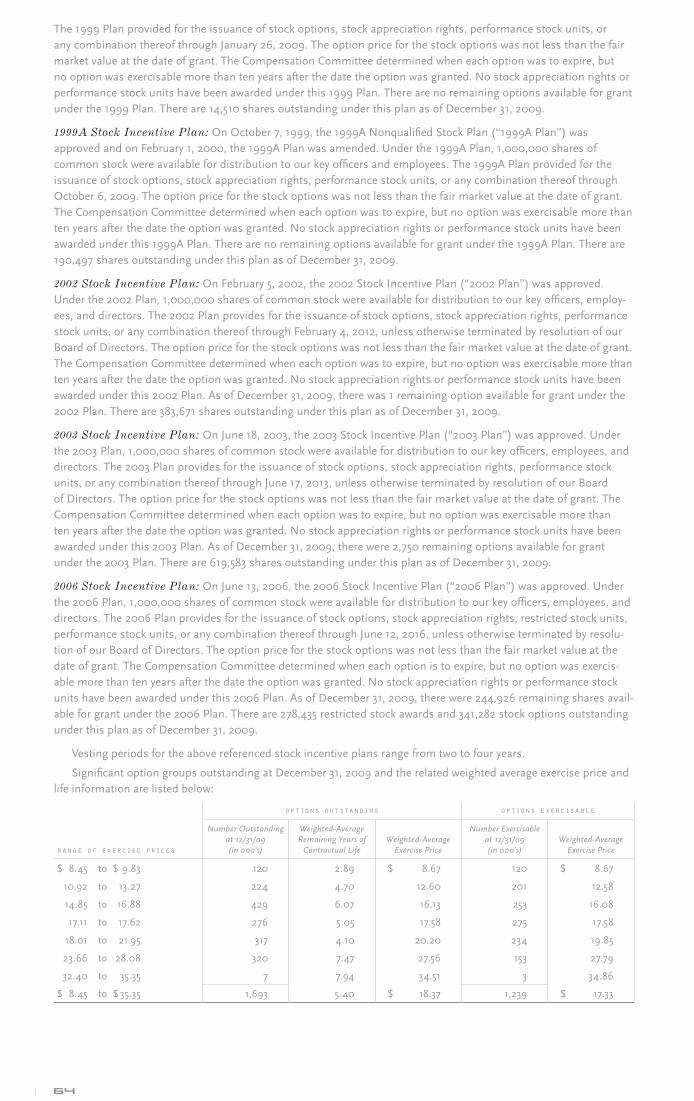
64
The 1999 Plan provided for the issuance of stock options, stock appreciation rights, performance stock units, or any combination thereof through January 26, 2009. The option price for the stock options was not less than the fair market value at the date of grant. The Compensation Committee determined when each option was to expire, but no option was exercisable more than ten years after the date the option was granted. No stock appreciation rights or performance stock units have been awarded under this 1999 Plan. There are no remaining options available for grant under the 1999 Plan. There are 14,510 shares outstanding under this plan as of December 31, 2009.
1999A Stock Incentive Plan: On October 7, 1999, the 1999A Nonqualifi ed Stock Plan (“1999A Plan”) was approved and on February 1, 2000, the 1999A Plan was amended. Under the 1999A Plan, 1,000,000 shares of common stock were available for distribution to our key offi cers and employees. The 1999A Plan provided for the issuance of stock options, stock appreciation rights, performance stock units, or any combination thereof through October 6, 2009. The option price for the stock options was not less than the fair market value at the date of grant. The Compensation Committee determined when each option was to expire, but no option was exercisable more than ten years after the date the option was granted. No stock appreciation rights or performance stock units have been awarded under this 1999A Plan. There are no remaining options available for grant under the 1999A Plan. There are 190,497 shares outstanding under this plan as of December 31, 2009.
2002 Stock Incentive Plan: On February 5, 2002, the 2002 Stock Incentive Plan (“2002 Plan”) was approved. Under the 2002 Plan, 1,000,000 shares of common stock were available for distribution to our key offi cers, employ-ees, and directors. The 2002 Plan provides for the issuance of stock options, stock appreciation rights, performance stock units, or any combination thereof through February 4, 2012, unless otherwise terminated by resolution of our Board of Directors. The option price for the stock options was not less than the fair market value at the date of grant. The Compensation Committee determined when each option was to expire, but no option was exercisable more than ten years after the date the option was granted. No stock appreciation rights or performance stock units have been awarded under this 2002 Plan. As of December 31, 2009, there was 1 remaining option available for grant under the 2002 Plan. There are 383,671 shares outstanding under this plan as of December 31, 2009.
2003 Stock Incentive Plan: On June 18, 2003, the 2003 Stock Incentive Plan (“2003 Plan”) was approved. Under the 2003 Plan, 1,000,000 shares of common stock were available for distribution to our key offi cers, employees, and directors. The 2003 Plan provides for the issuance of stock options, stock appreciation rights, performance stock units, or any combination thereof through June 17, 2013, unless otherwise terminated by resolution of our Board of Directors. The option price for the stock options was not less than the fair market value at the date of grant. The Compensation Committee determined when each option was to expire, but no option was exercisable more than ten years after the date the option was granted. No stock appreciation rights or performance stock units have been awarded under this 2003 Plan. As of December 31, 2009, there were 2,750 remaining options available for grant under the 2003 Plan. There are 619,583 shares outstanding under this plan as of December 31, 2009.
2006 Stock Incentive Plan: On June 13, 2006, the 2006 Stock Incentive Plan (“2006 Plan”) was approved. Under the 2006 Plan, 1,000,000 shares of common stock were available for distribution to our key offi cers, employees, and directors. The 2006 Plan provides for the issuance of stock options, stock appreciation rights, restricted stock units, performance stock units, or any combination thereof through June 12, 2016, unless otherwise terminated by resolu-tion of our Board of Directors. The option price for the stock options was not less than the fair market value at the date of grant. The Compensation Committee determined when each option is to expire, but no option was exercis-able more than ten years after the date the option was granted. No stock appreciation rights or performance stock units have been awarded under this 2006 Plan. As of December 31, 2009, there were 244,926 remaining shares avail-able for grant under the 2006 Plan. There are 278,435 restricted stock awards and 341,282 stock options outstanding under this plan as of December 31, 2009.
Vesting periods for the above referenced stock incentive plans range from two to four years.
Signifi cant option groups outstanding at December 31, 2009 and the related weighted average exercise price and life information are listed below:
options outstanding options exercisable
range of exercise prices
Number Outstanding at 12/31/09 (in 000’s)
Weighted-Average Remaining Years of
Contractual LifeWeighted-Average
Exercise Price
Number Exercisable at 12/31/09 (in 000’s)
Weighted-Average Exercise Price
$ 8.45 to $ 9.83 120 2.89 $ 8.67 120 $ 8.67
10.92 to 13.27 224 4.70 12.60 201 12.58
14.85 to 16.88 429 6.07 16.13 253 16.08
17.11 to 17.62 276 5.05 17.58 275 17.58
18.01 to 21.95 317 4.10 20.20 234 19.85
23.66 to 28.08 320 7.47 27.56 153 27.79
32.40 to 35.35 7 7.94 34.51 3 34.86
$ 8.45 to $ 35.35 1,693 5.40 $ 18.37 1,239 $ 17.33

65 univ
ersa
l el
ectr
onic
s in
c. 0
9 a
nnua
l re
port
NOTE 16: Other (Expense) Income, net
Other (expense) income, net in the Consolidated Income Statements consisted of the following:
(in thousands) 2 0 0 9 2 0 0 8 2 0 0 7
Net (loss) gain on foreign currency exchange transactions $ (246) $ 315 $ (35)
Other income (expense) 5 (4) 42
Other (expense) income, net $ (241) $ 311 $ 7
NOTE 17: Earnings Per Share
Basic earnings per share is computed by dividing net income available to common stockholders by the weighted average number of common shares outstanding during the period. Diluted earnings per share is computed by divid-ing net income by the weighted average number of common shares and dilutive potential common shares, which includes the dilutive effect of stock options and restricted stock grants. Dilutive potential common shares for all periods presented are computed utilizing the treasury stock method.
In the computation of diluted earnings per common share for the years ended December 31, 2009, 2008 and 2007, we have excluded 785,186, 534,418 and 153,705 stock options, respectively, with exercise prices greater than the average market price of the underlying common stock, because their inclusion would have been anti-dilutive. Furthermore, for the years ended December 31, 2009, 2008 and 2007, we have excluded 235,887, 105,944 and 10,174 of unvested shares of restricted stock, respectively, whose combined unamortized fair value and excess tax benefi ts were greater in each of those periods than the average market price of the underlying common stock, as their effect would be anti-dilutive.
Earnings per share for the years ended December 31, 2009, 2008 and 2007 were calculated as follows:
(in thousands, except per-share amounts) 2 0 0 9 2 0 0 8 2 0 0 7
Basic
Net income $ 14,675 $ 15,806 $ 20,230
Weighted-average common shares outstanding 13,667 14,015 14,410
Basic earnings per share $ 1.07 $ 1.13 $ 1.40
Diluted
Net income $ 14,675 $ 15,806 $ 20,230
Weighted-average common shares outstanding for basic 13,667 14,015 14,410
Dilutive effect of stock options and restricted stock 304 441 767
Weighted-average common shares outstanding on a diluted basis 13,971 14,456 15,177
Diluted earnings per share $ 1.05 $ 1.09 $ 1.33
NOTE 18: Derivatives
DERIVATIVES MEASURED AT FAIR VALUE ON A RECURRING BASIS: We are exposed to market risks from foreign currency exchange rates, which may adversely affect our operating results and fi nancial position. Our foreign currency exposures are primarily concentrated in the Euro, British Pound, and Hong Kong dollar. We periodically enter into foreign currency exchange contracts with terms normally lasting less than nine months to protect against the adverse effects that exchange-rate fl uctuations may have on our foreign currency-denominated receivables, pay-ables, cash fl ows and reported income. Derivative fi nancial instruments are used to manage risk and are not used for trading or other speculative purposes. We do not use leveraged derivative fi nancial instruments and these derivatives have not qualifi ed for hedge accounting.
The gains and losses on both the derivatives and the foreign currency-denominated balances are recorded as for-eign exchange transaction gains or losses and are classifi ed in other (expense) income, net. Derivatives are recorded on the balance sheet at fair value. The estimated fair values of our derivative fi nancial instruments represent the amount required to enter into offsetting contracts with similar remaining maturities based on quoted market prices.
We have determined that the fair value of our derivatives is derived from level 2 inputs in the fair value hierarchy (see Note 2 under the captions Derivatives and Fair-Value Measurements for further information concerning the accounting principles and valuation methodology utilized). The following table sets forth our fi nancial assets that were accounted for at fair value on a recurring basis as of December 31, 2009:
fair value measurement using
(in thousands)
DescriptionYear Ended 12/31/2009
Quoted Prices in Active Markets for
Identical Assets (Level 1)
Signifi cant Other Observable Inputs
(Level 2)
Signifi cant Unobservable Inputs
(Level 3)
Foreign currency exchange futures contract $ (5) $ — $ (5) $ —
Foreign currency exchange put option contract 2 — 2 —
$ (3) $ — $ (3) $ —
We held foreign currency exchange contracts which resulted in a net pre-tax loss of approximately $0.7 million for the year ended December 31, 2009, a net pre-tax loss of approximately $0.5 million for the year ended December 31, 2008 and a net pre-tax gain of $0.8 million for the year ended December 31, 2007.
66
FUTURES CONTRACTS: We held one USD/Euro futures contract with a notional value of $1.5 million and a for-ward rate of $1.4386 USD/Euro at December 31, 2009. We held the Euro position on this contract, which settled on January 15, 2010. The loss on this contract as of December 31, 2009 was $5 thousand and is included in other accrued expenses. This contract was settled at a loss of $11 thousand resulting in a loss of $6 thousand in January 2010.
We held one USD/Euro futures contract with a notional value of $9.0 million and a forward rate of $1.277 USD/Euro at December 31, 2008. We held the Euro position on this contract, which settled on January 7, 2009. The gain on this contract as of December 31, 2008 was $0.8 million and is included in prepaid expenses and other current assets. This contract was settled at $0.4 million resulting in a loss of $0.4 million in January 2009.
PUT OPTION: We entered into a USD/GBP put option with a notional value of $4.3 million in July 2009. The strike price of the put is $1.64 USD/GBP. The contract expired on December 31, 2009 and settled on January 5, 2010. The loss recorded related to this contract was $138 thousand during the year ended December 31, 2009. The fair value of this put option was approximately $2 thousand at December 31, 2009 and is included in accounts receivable, net (see Note 4).
We entered into a USD/GBP put option with a notional value of $5.0 million in August 2008. The strike price of the put is $1.85 USD/GBP. The contract expired on December 31, 2008 and settled on January 5, 2009. The gain recorded related to this contract was $0.5 million during the year ended December 31, 2008. The fair value of this put option was approximately $0.6 million at December 31, 2008 and was included in prepaid expenses and other current assets.
NOTE 19: Employee Benefit Plans
We maintain a retirement and profi t sharing plan under Section 401(k) of the Internal Revenue Code for all of our domestic employees that meet certain qualifi cations. Participants in the plan may elect to contribute up to the maximum allowed by law. We match 50% of the participants’ contributions up to 15% of their gross salary in the form of newly issued shares of our common stock. We may also make other discretionary contributions to the plan. We recorded $0.8 million, $0.7 million, and $0.6 million of expense for company contributions for the years ended December 31, 2009, 2008 and 2007, respectively.
NOTE 20: Related Party Transactions
In April 1999, we provided a non-recourse interest bearing secured loan to our chief executive offi cer. The loan was in the amount of $200,000 and bore interest at the rate of 5.28% per annum, with interest payable annually to us on each December 15. The loan was collateralized by the primary residence purchased and the principal was payable on the earlier of (i) December 15, 2007, (ii) within twelve months following a demand from us but only in the event the chief executive offi cer ceases being our employee or in the event of a default under the loan; or (iii) on the closing of a sale or transfer of the property. This note, including accrued interest, was paid in full on December 14, 2007.
NOTE 21: Business Combination
On February 18, 2009, we acquired certain patents, intellectual property and other assets related to the universal remote control business from Zilog (NASDAQ: ZILG) for approximately $9.5 million in cash. The purchase included Zilog’s full library and database of infrared codes, software tools and certain fi xed assets. We also hired 116 of Zilog’s sales and engineering personnel, including all 107 of Zilog’s personnel located in India. In a related transaction, Maxim Integrated Products (NASDAQ: MXIM) acquired two of Zilog’s product lines, namely, the hardware portion of Zilog’s remote control business and Zilog’s secured transaction product line.
We have cross—licensed the remote control technology and intellectual property with Maxim Integrated Products for purpose of conducting our respective businesses. The arrangement involves an agreement to source silicon chips from Maxim. During 2009, we agreed to be Maxim’s sales agent in return for a sales agency fee. The sales agency fee during 2009 was $4.4 million. This arrangement was mildly accretive to our earnings in 2009, excluding acquisition costs. During 2010, as the transition from the Zilog chip platform to the Maxim chip platform progresses, we will begin to take over full sales and distribution rights, procuring and selling the chips directly to Zilog’s former custom-ers. We anticipate this position will lead to growth in revenue and earnings going forward. Our consolidated fi nancial statements include the operating results of the acquired assets, employees hired, and the related agreement with Maxim from February 18, 2009.
The total purchase price of approximately $9.5 million has been allocated to the net assets acquired based on their estimated fair values as follow:
(in thousands)
Intangible assets:
Database $ 3,500
Customer relationships 3,100
Goodwill 2,902
Equipment, furniture and fi xtures 44
Purchase price $ 9,546
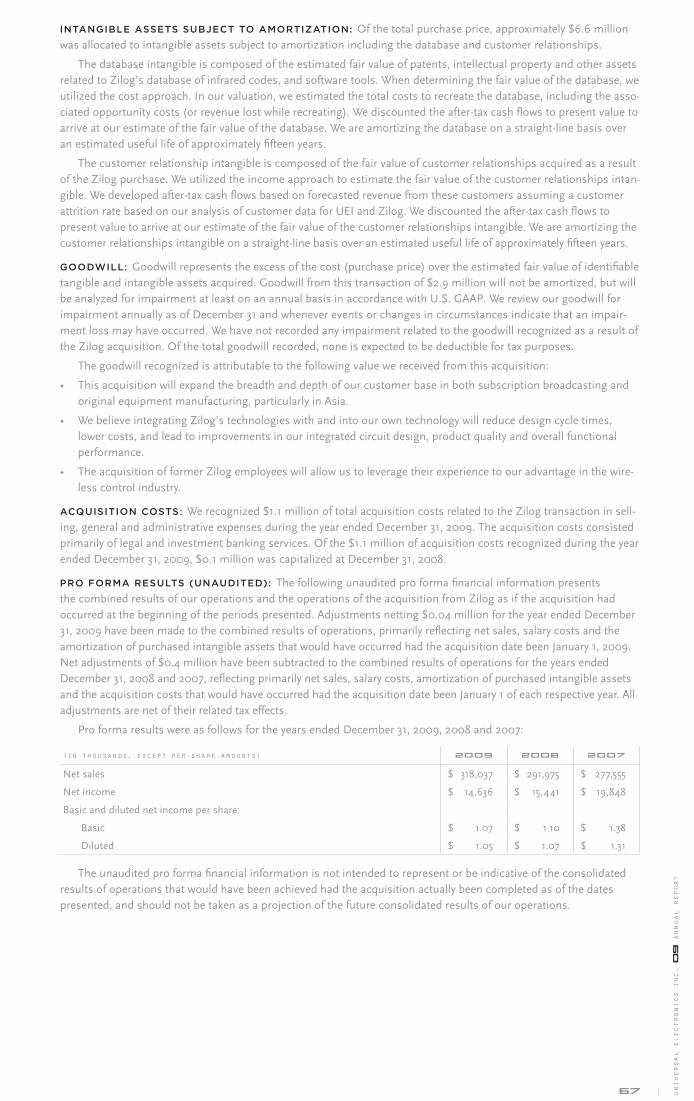
67 univ
ersa
l el
ectr
onic
s in
c. 0
9 a
nnua
l re
port
INTANGIBLE ASSETS SUBJECT TO AMORTIZATION: Of the total purchase price, approximately $6.6 million was allocated to intangible assets subject to amortization including the database and customer relationships.
The database intangible is composed of the estimated fair value of patents, intellectual property and other assets related to Zilog’s database of infrared codes, and software tools. When determining the fair value of the database, we utilized the cost approach. In our valuation, we estimated the total costs to recreate the database, including the asso-ciated opportunity costs (or revenue lost while recreating). We discounted the after-tax cash fl ows to present value to arrive at our estimate of the fair value of the database. We are amortizing the database on a straight-line basis over an estimated useful life of approximately fi fteen years.
The customer relationship intangible is composed of the fair value of customer relationships acquired as a result of the Zilog purchase. We utilized the income approach to estimate the fair value of the customer relationships intan-gible. We developed after-tax cash fl ows based on forecasted revenue from these customers assuming a customer attrition rate based on our analysis of customer data for UEI and Zilog. We discounted the after-tax cash fl ows to present value to arrive at our estimate of the fair value of the customer relationships intangible. We are amortizing the customer relationships intangible on a straight-line basis over an estimated useful life of approximately fi fteen years.
GOODWILL: Goodwill represents the excess of the cost (purchase price) over the estimated fair value of identifi able tangible and intangible assets acquired. Goodwill from this transaction of $2.9 million will not be amortized, but will be analyzed for impairment at least on an annual basis in accordance with U.S. GAAP. We review our goodwill for impairment annually as of December 31 and whenever events or changes in circumstances indicate that an impair-ment loss may have occurred. We have not recorded any impairment related to the goodwill recognized as a result of the Zilog acquisition. Of the total goodwill recorded, none is expected to be deductible for tax purposes.
The goodwill recognized is attributable to the following value we received from this acquisition:
• This acquisition will expand the breadth and depth of our customer base in both subscription broadcasting and original equipment manufacturing, particularly in Asia.
• We believe integrating Zilog’s technologies with and into our own technology will reduce design cycle times, lower costs, and lead to improvements in our integrated circuit design, product quality and overall functional performance.
• The acquisition of former Zilog employees will allow us to leverage their experience to our advantage in the wire-less control industry.
ACQUISITION COSTS: We recognized $1.1 million of total acquisition costs related to the Zilog transaction in sell-ing, general and administrative expenses during the year ended December 31, 2009. The acquisition costs consisted primarily of legal and investment banking services. Of the $1.1 million of acquisition costs recognized during the year ended December 31, 2009, $0.1 million was capitalized at December 31, 2008.
PRO FORMA RESULTS (UNAUDITED): The following unaudited pro forma fi nancial information presents the combined results of our operations and the operations of the acquisition from Zilog as if the acquisition had occurred at the beginning of the periods presented. Adjustments netting $0.04 million for the year ended December 31, 2009 have been made to the combined results of operations, primarily refl ecting net sales, salary costs and the amortization of purchased intangible assets that would have occurred had the acquisition date been January 1, 2009. Net adjustments of $0.4 million have been subtracted to the combined results of operations for the years ended December 31, 2008 and 2007, refl ecting primarily net sales, salary costs, amortization of purchased intangible assets and the acquisition costs that would have occurred had the acquisition date been January 1 of each respective year. All adjustments are net of their related tax effects.
Pro forma results were as follows for the years ended December 31, 2009, 2008 and 2007:
(in thousands, except per-share amounts) 2 0 0 9 2 0 0 8 2 0 0 7
Net sales $ 318,037 $ 291,975 $ 277,555
Net income $ 14,636 $ 15,441 $ 19,848
Basic and diluted net income per share:
Basic $ 1.07 $ 1.10 $ 1.38
Diluted $ 1.05 $ 1.07 $ 1.31
The unaudited pro forma fi nancial information is not intended to represent or be indicative of the consolidated results of operations that would have been achieved had the acquisition actually been completed as of the dates presented, and should not be taken as a projection of the future consolidated results of our operations.
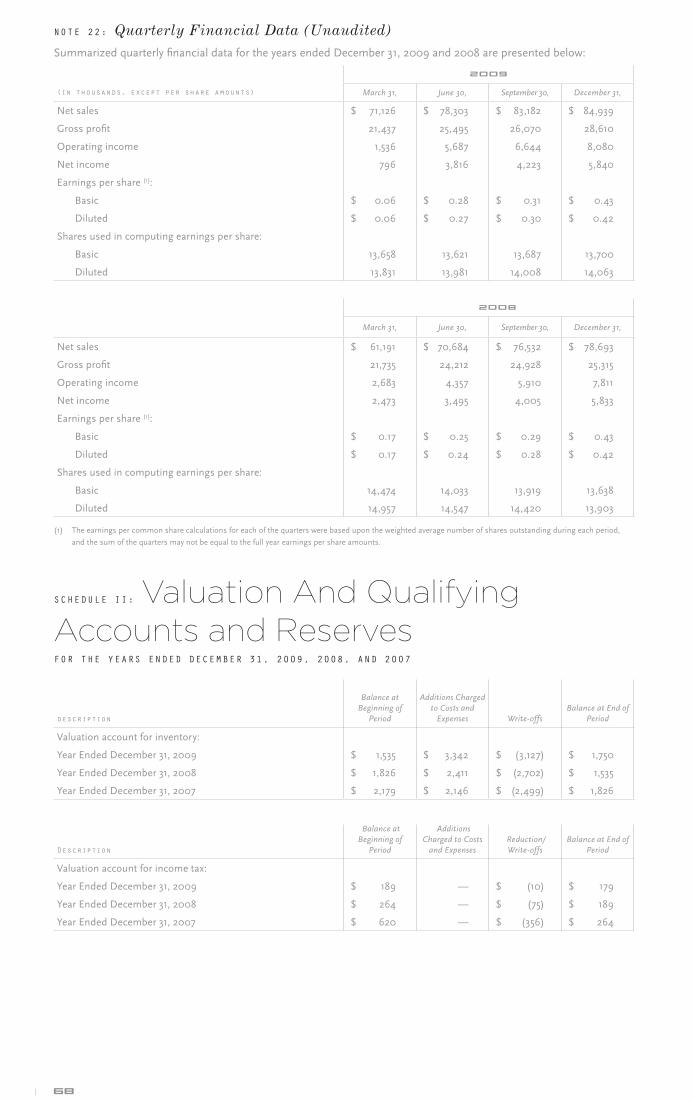
68
NOTE 22: Quarterly Financial Data (Unaudited)
Summarized quarterly fi nancial data for the years ended December 31, 2009 and 2008 are presented below:
2 0 0 9
(in thousands, except per share amounts) March 31, June 30, September 30, December 31,
Net sales $ 71,126 $ 78,303 $ 83,182 $ 84,939
Gross profi t 21,437 25,495 26,070 28,610
Operating income 1,536 5,687 6,644 8,080
Net income 796 3,816 4,223 5,840
Earnings per share (1):
Basic $ 0.06 $ 0.28 $ 0.31 $ 0.43
Diluted $ 0.06 $ 0.27 $ 0.30 $ 0.42
Shares used in computing earnings per share:
Basic 13,658 13,621 13,687 13,700
Diluted 13,831 13,981 14,008 14,063
2 0 0 8
March 31, June 30, September 30, December 31,
Net sales $ 61,191 $ 70,684 $ 76,532 $ 78,693
Gross profi t 21,735 24,212 24,928 25,315
Operating income 2,683 4,357 5,910 7,811
Net income 2,473 3,495 4,005 5,833
Earnings per share (1):
Basic $ 0.17 $ 0.25 $ 0.29 $ 0.43
Diluted $ 0.17 $ 0.24 $ 0.28 $ 0.42
Shares used in computing earnings per share:
Basic 14,474 14,033 13,919 13,638
Diluted 14,957 14,547 14,420 13,903
(1) The earnings per common share calculations for each of the quarters were based upon the weighted average number of shares outstanding during each period,
and the sum of the quarters may not be equal to the full year earnings per share amounts.
SCHEDULE II: Valuation And Qualifying Accounts and Reserves FOR THE YEARS ENDED DECEMBER 31, 2009, 2008, AND 2007
description
Balance at Beginning of
Period
Additions Charged to Costs and
Expenses Write-offsBalance at End of
Period
Valuation account for inventory:
Year Ended December 31, 2009 $ 1,535 $ 3,342 $ (3,127) $ 1,750
Year Ended December 31, 2008 $ 1,826 $ 2,411 $ (2,702) $ 1,535
Year Ended December 31, 2007 $ 2,179 $ 2,146 $ (2,499) $ 1,826
Description
Balance at Beginning of
Period
Additions Charged to Costs
and Expenses Reduction/Write-offs
Balance at End of Period
Valuation account for income tax:
Year Ended December 31, 2009 $ 189 — $ (10) $ 179
Year Ended December 31, 2008 $ 264 — $ (75) $ 189
Year Ended December 31, 2007 $ 620 — $ (356) $ 264
69 univ
ersa
l el
ectr
onic
s in
c. 0
9 a
nnua
l re
port
Changes in and Disagreements with Accountants on Accounting and Financial DisclosureNone.
Controls And Procedures Disclosure Controls and Procedures
Exchange Act Rule 13a-15(d) defi nes “disclosure controls and procedures” to mean controls and procedures of a company that are designed to ensure that information required to be disclosed by the company in the reports that it fi les or submits under the Exchange Act is recorded, processed, summarized and reported, within the time periods specifi ed in the Commission’s rules and forms. The defi nition further states that disclosure controls and procedures include, without limitation, controls and procedures designed to ensure that the information required to be disclosed by a company in the reports that it fi les or submits under the Exchange Act is accumulated and communicated to the company’s management, including its principal executive and principal fi nancial offi cers, or persons performing similar functions, as appropriate to allow timely decisions regarding required disclosure.
An evaluation was performed under the supervision and with the participation of our management, including our principal executive and principal fi nancial offi cers, of the effectiveness of the design and operation of our disclosure controls and procedures as of the end of the period covered by this report. Based on that evaluation, our principal executive and principal fi nancial offi cers have concluded that our disclosure controls and procedures were effective, as of the end of the period covered by this report, to provide reasonable assurance that information required to be disclosed by us in reports that we fi le or submit under the Exchange Act is recorded, processed, summarized and reported within the time periods specifi ed in Securities and Exchange Commission rules and forms and is accumu-lated and communicated to our management to allow timely decisions regarding required disclosures.
Management’s Annual Report on Internal Control Over Financial Reporting
Management is responsible for establishing and maintaining adequate internal control over fi nancial reporting, as such term is defi ned in Exchange Act Rule 13a-15(f). Our internal control over fi nancial reporting is a process designed to provide reasonable assurance regarding the reliability of fi nancial reporting and preparation of fi nancial statements for external purposes in accordance with accounting principles generally accepted in the United States of America. Because of inherent limitations, internal control over fi nancial reporting may not prevent or detect misstate-ments. Also, projections of any evaluation of effectiveness to future periods are subject to the risk that controls may become inadequate because of changes in conditions, or that the degree of compliance with the policies or proce-dures may deteriorate.
Under the supervision and with the participation of our management, including our principal executive and principal fi nancial offi cers, we evaluated the effectiveness of our internal control over fi nancial reporting based on the Internal Control-Integrated Framework issued by the Committee of Sponsoring Organizations of the Treadway Commission (“COSO”) in Internal Control Integrated Framework. Based on our evaluation under this framework, our management concluded that our internal control over fi nancial reporting was effective as of December 31, 2009.
The effectiveness of our internal control over fi nancial reporting as of December 31, 2009 has been audited by Grant Thornton LLP, an independent registered public accounting fi rm, as stated in its attestation report which is included herein.
Changes in Internal Control Over Financial Reporting
There have been no changes in internal controls or in other factors that may signifi cantly affect our internal controls during 2009.

70
Report Of Independent Registered Public Accounting FirmBoard of Directors and Shareholders
Universal Electronics Inc.
We have audited Universal Electronics Inc.’s (a Delaware Corporation) internal control over fi nancial reporting as of December 31, 2009, based on criteria established in Internal Control-Integrated Framework issued by the Committee of Sponsoring Organizations of the Treadway Commission (COSO). Universal Electronics Inc.’s management is responsible for maintaining effective internal control over fi nancial reporting and for its assessment of the effective-ness of internal control over fi nancial reporting, included in the accompanying Management’s Annual Report on Internal Control Over Financial Reporting. Our responsibility is to express an opinion on Universal Electronics Inc.’s internal control over fi nancial reporting based on our audit.
We conducted our audit in accordance with the standards of the Public Company Accounting Oversight Board (United States). Those standards require that we plan and perform the audit to obtain reasonable assurance about whether effective internal control over fi nancial reporting was maintained in all material respects. Our audit included obtaining an understanding of internal control over fi nancial reporting, assessing the risk that a material weakness exists, testing and evaluating the design and operating effectiveness of internal control based on the assessed risk, and performing such other procedures as we considered necessary in the circumstances. We believe that our audit provides a reasonable basis for our opinion.
A company’s internal control over fi nancial reporting is a process designed to provide reasonable assurance regarding the reliability of fi nancial reporting and the preparation of fi nancial statements for external purposes in accordance with generally accepted accounting principles. A company’s internal control over fi nancial reporting includes those policies and procedures that (1) pertain to the maintenance of records that, in reasonable detail, accurately and fairly refl ect the transactions and dispositions of the assets of the company; (2) provide reasonable assurance that transactions are recorded as necessary to permit preparation of fi nancial statements in accordance with generally accepted accounting principles, and that receipts and expenditures of the company are being made only in accordance with authorizations of management and directors of the company; and (3) provide reasonable assurance regarding prevention or timely detection of unauthorized acquisition, use, or disposition of the company’s assets that could have a material effect on the fi nancial statements.
Because of its inherent limitations, internal control over fi nancial reporting may not prevent or detect misstate-ments. Also, projections of any evaluation of effectiveness to future periods are subject to the risk that controls may become inadequate because of changes in conditions, or that the degree of compliance with the policies or proce-dures may deteriorate.
In our opinion, Universal Electronics Inc. maintained, in all material respects, effective internal control over fi nancial reporting as of December 31, 2009, based on criteria established in Internal Control-Integrated Framework issued by COSO.
We also have audited, in accordance with the standards of the Public Company Accounting Oversight Board (United States), the consolidated balance sheets of Universal Electronics Inc. as of December 31, 2009 and 2008, and the related consolidated statements of income, stockholders’ equity, and cash fl ows for each of the three years in the period ended December 31, 2009, and our report dated March 15, 2010 expressed an unqualifi ed opinion.
Irvine, California
March 15, 2010
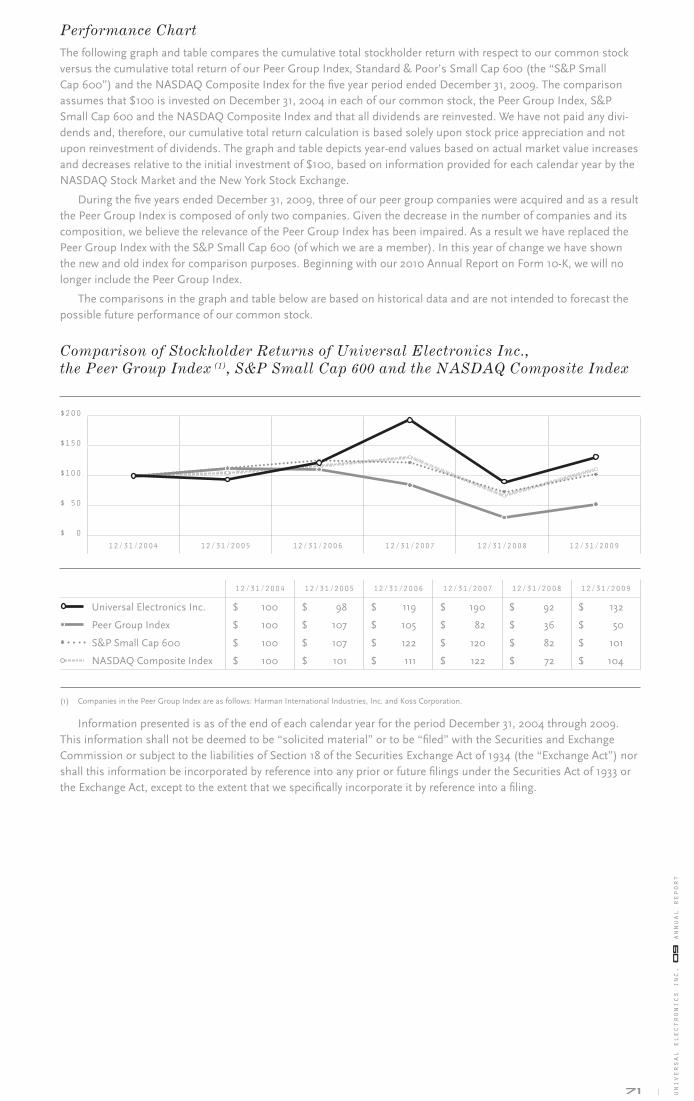
71 univ
ersa
l el
ectr
onic
s in
c. 0
9 a
nnua
l re
port
Performance Chart
The following graph and table compares the cumulative total stockholder return with respect to our common stock versus the cumulative total return of our Peer Group Index, Standard & Poor’s Small Cap 600 (the “S&P Small Cap 600”) and the NASDAQ Composite Index for the fi ve year period ended December 31, 2009. The comparison assumes that $100 is invested on December 31, 2004 in each of our common stock, the Peer Group Index, S&P Small Cap 600 and the NASDAQ Composite Index and that all dividends are reinvested. We have not paid any divi-dends and, therefore, our cumulative total return calculation is based solely upon stock price appreciation and not upon reinvestment of dividends. The graph and table depicts year-end values based on actual market value increases and decreases relative to the initial investment of $100, based on information provided for each calendar year by the NASDAQ Stock Market and the New York Stock Exchange.
During the fi ve years ended December 31, 2009, three of our peer group companies were acquired and as a result the Peer Group Index is composed of only two companies. Given the decrease in the number of companies and its composition, we believe the relevance of the Peer Group Index has been impaired. As a result we have replaced the Peer Group Index with the S&P Small Cap 600 (of which we are a member). In this year of change we have shown the new and old index for comparison purposes. Beginning with our 2010 Annual Report on Form 10-K, we will no longer include the Peer Group Index.
The comparisons in the graph and table below are based on historical data and are not intended to forecast the possible future performance of our common stock.
Comparison of Stockholder Returns of Universal Electronics Inc.,
the Peer Group Index (1), S&P Small Cap 600 and the NASDAQ Composite Index
$ 200
$ 150
$ 100
$ 50
$ 012/31/2004 12/31/2005 12/31/2006 12/31/2007 12/31/2008 12/31/2009
12/31/2004 12/31/2005 12/31/2006 12/31/2007 12/31/2008 12/31/2009
Universal Electronics Inc. $ 100 $ 98 $ 119 $ 190 $ 92 $ 132
Peer Group Index $ 100 $ 107 $ 105 $ 82 $ 36 $ 50
S&P Small Cap 600 $ 100 $ 107 $ 122 $ 120 $ 82 $ 101
NASDAQ Composite Index $ 100 $ 101 $ 111 $ 122 $ 72 $ 104
(1) Companies in the Peer Group Index are as follows: Harman International Industries, Inc. and Koss Corporation.
Information presented is as of the end of each calendar year for the period December 31, 2004 through 2009. This information shall not be deemed to be “solicited material” or to be “fi led” with the Securities and Exchange Commission or subject to the liabilities of Section 18 of the Securities Exchange Act of 1934 (the “Exchange Act”) nor shall this information be incorporated by reference into any prior or future fi lings under the Securities Act of 1933 or the Exchange Act, except to the extent that we specifi cally incorporate it by reference into a fi ling.

72
Corporate Information
DIRECTORS
Paul D. Arling*Chairman and Chief Executive Offi cerUniversal Electronics Inc.
Cypress, California
Satjiv S. Chahil 2, 3
Executive AdvisorHewlett-Packard
Company
Palo Alto, California
William C. Mulligan 1, 3
Managing DirectorPrimus Capital Funds
Cleveland, Ohio
J.C. Sparkman 2, 3
Retired Executive Vice President and Chief Operating Offi cer Telecommunications, Inc.
(TCI) Denver, Colorado
Gregory P. Stapleton 2
Founder and OwnerFalcon One Enterprises
Camarillo, California
Carl E. Vogel 1
PartnerSCP Worldwide
New York City, New York
Edward K. Zinser 1
Chief Financial Offi cerBoingo Wireless Inc.
Los Angeles, California
1 Member, Audit Committee
2 Member, Compensation Committee
3 Member, Corporate Governance and Nominating Committee
* Executive Offi cer as defi ned by the Security Exchange Act of 1934.
OFFICERS
Paul D. Arling*Chairman and Chief Executive Offi cer
Bryan M. Hackworth*Senior Vice President and Chief Financial Offi cer
Paul J.M. Bennett*Executive Vice President and Managing Director, Europe
Mark S. Kopaskie*Executive Vice President and General Manager, U.S.
Richard A. Firehammer, Jr.*Senior Vice President, General Counsel and Secretary
Ramzi S. AmmariSenior Vice PresidentGlobal Product Planning and Strategy
David C.H. ChongSenior Vice President OEM Global
Joseph E. MiketoSenior Vice President Global Operations
Olav B.M. PouwSenior Vice President Subscription Broadcast EMEA & Asia
Pamela L. PriceSenior Vice President Subscription Broadcast Americas
OFFICERS
Norman G. SheridanSenior Vice President Engineering
Graham S. WilliamsSenior Vice President Technology Development
Bruce G. AnnisVice President Retail Sales, North America
Douglas J. DurrantVice PresidentGlobal Information Technology
Stephen L. GutmanVice PresidentCable Sales Americas
J. Lee HaughawoutVice PresidentProgram Management
Patrick H. HayesVice PresidentIntellectual Property
Louis S. HughesVice President Corporate Development
Emmelyn A. KlaverVice President Custom Electronics Global
Michael J. KochVice President Finance and Treasurer
Menno V. KoopmansVice President Retail Sales EMEA/International
Hrag G. OhannessianVice President Subscription Broadcast OEM Americas
Kenneth G. SweeneyVice President Global OEM Sales
WORLDWIDE HEADQUARTERS
Universal Electronics Inc.6101 Gateway DriveCypress, CA 90630
EUROPEAN HEADQUARTERS
The NetherlandsUniversal Electronics BVInstitutenweg 21 7521 PHEnschede, Netherlands
INVESTOR INFORMATION
Annual Meeting of StockholdersJune 15, 20104:00 p.m. PTUniversal Electronics Inc.6101 Gateway DriveCypress, CA 90630
Independent Registered Public Accounting FirmGrant Thornton LLP
Irvine, California
Registrar & Transfer AgentComputershare
Trust Company, N.A.
250 Royall StreetCanton, MA 02021(800) 962-4284
DESIGNED AND PRODUCED BY: VAN DEMAN CREATIVE | VANDEMANCREATIVE.COM

CERTIFICATIONS
The Company fi led with the Securities and Exchange com-mission, as Exhibit 31 to the Company’s Annual Report on Form 10-K for the 2009 fi scal year, certifi cations of its Chief Executive Offi cer and Chief Financial Offi cer regarding the quality of the Company’s public disclosures.
FORM 10 -K
Any stockholder who desires a copy of the Company’s 2009 Annual Report on Form 10-K fi led with the Securities and Exchange Commission may obtain a copy (excluding exhibits) without charge by addressing a request to:
Investor RelationsUniversal Electroncis Inc.6101 Gateway DriveCypress, California 90630
A charge equal to the reproduction cost will be made if the exhibits are requested. Universal Electronics’ Internet address is www.uei.com. Universal Electronics makes avail-able through its internet website its annual report on Form 10-K. Investors may also obtain a copy of our 2009 Annual Report on Form 10-K, including exhibits, from the “Investor” section of our website at www.uei.com, clicking on “SEC Filings.”
INTERNET USERS
We invite you to learn more about UEI’s business and growth opportunities by visiting the “Investor” section of our website at www.uei.com. This section includes investor presentations, earnings conference calls, press releases, SEC fi lings, company history, and information about the company’s governance and Board of Directors.
Universal Electronics Inc. is
an equal opportunity employer.
BRIDGING THE GAP BETWEEN TECHNOLOGY AND NEEDS. CONSUMERS AND CUSTOMERS
ARE THE DRIVING FORCE FOR ALL OF OUR TECHNOLOGICAL IDEAS AND APPLICATIONS.
UEI LISTENS DILIGENTLY AND TURNS OUT SOLUTIONS ACCORDINGLY.
UEI
CHNOLOOOGY | TECHNNNNNNNNNNOOOOOOLLLOGGGY || TTEECCHHHHHNNNNNOOOOLLLLLLLLLLOOOOOOOOOOGY|
TECHNO
LOG
Y|
TE
CH
NNNNNNNOOOOOOOOOOOOOO
LO
GY
|T
EC
HN
OL
OG
Y|
TE
CH
NO
LO
GY
|T
EC
HN
OLO
GY
|TEC
HN
OLO
GGGYYY|
CO
N
SUMMM
EERNEEDS
|CONSUMER NEEDS | CONSUMER NEEDS | CONSUM
LLOOEOO
GGRGGYY NN
EEDS
|
CO
NS
UM
ER
NE
ED
S|
CO
NS
UM
ER
NE
ED
S|
CO
NS
UM
ER
NE
ED
S|
C

09
UNIVERSAL ELECTRONICS INC.
09 ANNUAL REPORT
UNIVERSAL ELECTRONICS INC. 6101 GATEWAY DRIVECYPRESS, CA 90630
www.uei.com
09 UNIVERSAL ELECTRONICS INC. ANNUAL REPORT