Embed Size (px)
Citation preview

Unity in Diversity?
Ethnicity, Migration, and Nation Building in Indonesia∗
Samuel Bazzi†Boston University
and CEPR
Arya Gaduh‡University of Arkansas
Alexander Rothenberg§RAND Corporation
Maisy Wong¶University of Pennsylvania
April 2017
Abstract
While diversity has long been associated with adverse social outcomes, much less is known abouthow to unite different groups and foster nation building. Many governments introduce policies toestablish a shared sense of national identity and to encourage integration. However, intergroup rela-tionships at the local level are often slow to develop and confounded by endogenous sorting. We shednew light on this local, long-run process of integration using a large resettlement program in Indonesiadesigned to encourage mixing between the several hundred ethnic groups across the archipelago. Be-tween 1979 and 1988, the Transmigration program relocated two million voluntary migrants from theInner Islands of Java and Bali to the Outer Islands. These migrants could not choose their destinations,and by exploiting certain features of the planning and implementation process, our research designisolates plausibly exogenous variation in long-run diversity. Moreover, the unprecedented scale ofthe program created hundreds of new communities with varying degrees of ethnic diversity, allowingus to estimate the nonlinear ways in which diversity shapes incentives to integrate and influencesidentity formation. Using rich microdata on marriage, language use at home, and intergenerationalidentity choices, we find substantial changes in socialization and preferences consistent with deeperintegration amidst rising diversity. Overall, our findings provide a unique lens into the slow inter-generational process of weakening ethnic attachment and converging towards new forms of sharedidentity.
JEL Classifications: D02, D71, J15, O15, R23
Keywords: Diversity, Identity, Language, Migration, Intergenerational Transmission, Nation Building
∗We thank Oriana Bandiera, Toman Barsbai, Giorgio Chiovelli, Ben Olken, Imran Rasul and seminar participants at BostonUniversity, Georgetown University, Harvard University, MIT, University of Colorado Denver, University of Southern Cali-fornia, the Barcelona Graduate School Summer Forum, the Ninth International Migration and Development Conference, theAnnual European Conference of ASREC, and the Northeast Universities Development Consortium 2016 Conference for helpfulsuggestions. Maisy Wong is grateful for financial support from the Research Sponsors Program of the Zell/Lurie Real EstateCenter and the Wharton Global Initiatives program. Jeremy Kirk, Gedeon Lim, JoonYup Park, and Xuequan Peng providedexcellent research assistance. All errors remain ours.†Department of Economics. 270 Bay State Rd., Boston, MA 02215. Email: [email protected].‡Sam M. Walton College of Business. Department of Economics. Business Building 402, Fayetteville, AR 72701-1201. Email:
[email protected].§1200 South Hayes St., Arlington, VA 22202-5050. Email: [email protected].¶Wharton Real Estate. 3620 Locust Walk, 1464 SHDH, Philadelphia, PA 19104-6302. Email: [email protected].
1

1 Introduction
Uniting people from diverse cultures is a founding principle of many nation states.1 Throughout his-tory, many leaders have introduced nation building policies that socialize citizens to establish a sharednational identity and minimize divisions across diverse groups (Alesina and Reich, 2015; Miguel, 2004).These policies remain important today given concerns that increased geographic mobility may exac-erbate intergroup tension amidst rising diversity.2 Some argue that exposure to new cultures evokesnegative sentiments against outsiders and may incite conflict, particularly in the short run (Fearon andLaitin, 2011; Weiner, 1978). However, other research posits that these negative sentiments may dissipateas intergroup relationships form over time (Allport, 1954; Putnam, 2007). We know little about theselonger run integration processes because diverse communities are often unstable due to segregation andtipping forces (Schelling, 1971), and the diverse ones that persist tend to be confounded by geographyand endogenous sorting (Michalopoulos, 2012).
We study the Transmigration program in Indonesia, one of the largest resettlement efforts in history,to understand how encouraging integration can promote a shared national identity. After the end ofDutch colonization in 1945, the newly independent government faced urgent pressures to forge a newIndonesian identity that would span the archipelago’s diverse islands and help to overcome secessionisttendencies. The government viewed resettlement as part of a broader nation building effort, to foster in-tegration between geographically segregated and culturally disparate ethnic groups. Between 1979 and1988, the Transmigration program assigned two million voluntary migrants (hereafter, transmigrants)from the Inner Islands of Java and Bali to nearly 900 new settlements across the Outer Islands. Eachsettlement was endowed with the same institutions and included a mix of Inner and Outer Islanderswith the goal of bridging one of the country’s most salient intergroup cleavages.3
We find significant improvements in integration between Inner and Outer Island groups one to twodecades after the initial policy shock. We characterize the nation building process using comprehensivemicrodata on marriage, language, and identity choices, which together capture intergenerational shiftsin ethnic attachment and national affinity. Our identification strategy leverages three sources of plausiblyexogenous variation induced by the program. First, transmigrants could not choose their destinationsand received farm plots and new housing units by lottery upon arrival in the new settlements. Moreover,imperfect land markets tied migrants to the land, limiting ex post sorting. Second, the unprecedentedscale of the program created a continuum of communities with policy-induced diversity that allows usto identify nonlinearities in individual choices with social externalities. Third, abrupt budget cutbacksfollowing a sharp drop in global oil prices resulted in hundreds of planned villages never receivingstate-sponsored transmigrants.
This policy experiment provides a unique opportunity to understand whether and how ethnic inte-
1For example, the motto for the European Union is “United in Diversity,” and “Unity in Diversity” is the motto for South Africaand Indonesia. Also, E pluribus unum (out of many, one) is a motto on The Great Seal of the United States.
2Recent estimates suggest there are around 230 million international migrants and 760 million internal migrants (Bell andCharles-Edwards, 2013). Based on recent trends, migration pressures are growing among minorities within rich countries (seeFrey, 2006, on the United States) and in newer migration corridors from poor to rich countries (Hanson and McIntosh, 2016).
3Historically, regional inequality between the (core) Inner Islands and the (peripheral) Outer Islands have been a major sourceof tension. Indonesia is home to more than 700 ethnolinguistic groups, with eight groups native to the Inner Islands (theJavanese represent the dominant group, comprising 40 percent of the national population). The Outer Islands have manydistinct ethnic groups (around 20 have more than 1 million members).
1

gration happens at a local level and in the long run. First, to assess whether the program achieved itsnation building goal of integrating Inner and Outer Island ethnic groups, we compare Transmigrationvillages (treated) to those planned settlements that never received the program (control). The fact thatboth treated and control villages were largely unpopulated before the program mitigates biases fromcomparing Transmigration villages to older settlements that tend to be naturally advantaged with bettermarket access. We further address sequential site selection using a reweighting procedure common inthe place-based evaluation literature (Kline and Moretti, 2014). We estimate individual-level effects ofprogram exposure that rule out potential confounders including education, age, occupation, and migra-tion. Additionally, we estimate village-level impacts that account for equilibrium effects and externalitiesin marriage choices.
Next, to identify how diversity affects incentives to integrate with other groups, we exploit program-induced variation in diversity within treated areas. Planners determined the local mix of Inner andOuter Island groups within settlements depending on land availability, which was a function of boththe quality of arable land and the size of the indigenous population in nearby areas. We leverage thisvariation and other features of the planning process to identify the role of relative group sizes in shapingidentity and socialization decisions within Transmigration communities. We present both OLS and IVestimates that allow for nonlinear relationships between the share of Inner Island ethnic groups andindividual choices.
We first illustrate the program-induced variation in diversity, showing that resettlement efforts ledto large and persistent demographic changes in treated villages, relative to the almost treated placebovillages in the Outer Islands. While program villages are no more populous on average, they are morediverse and less segregated than control areas. Ethnic fractionalization—the probability that any twovillage residents belong to different ethnicities—increases by nearly 50 percent. Most of that differentialis due to the initial influx and natural rate of increase of transmigrants with the share of Inner Islandethnicities increasing from 6 percent in control villages to nearly 60 percent in settlement villages. More-over, we also show that Inner and Outer Islanders are more residentially integrated across census blocksthan in control areas. Importantly, the persistence of this local diversity for up to two decades suggestslimited sorting or tipping behavior that would have otherwise neutralized the initial shock.
We link these significant demographic shifts to marriage and language outcomes to assess whetherthe Transmigration program achieved its nation building objectives. We begin by estimating individual-level exposure effects on intermarriage rates. We measure intermarriage rates between Inner and OuterIsland ethnic groups using data for more than one million individuals from the 2000 Population Cen-sus. We identify sharp increases in intermarriage rates among young natives in Transmigration villages(who married after the program) relative to older cohorts. By contrast, the trend is flat across cohortsfor control villages. Our exposure effects are identified by comparing native Outer Islanders living inTransmigration areas exposed to program-induced Inner Islanders with natives who live in control areasand were exposed to endogenous immigration-as-usual, differentiating between the initial generation ofadults and children who grew up in these diverse communities.
While the program did not change overall marriage rates, it did significantly alter the compositionof new marriages. Village-level estimates suggest that intermarriage rates for young cohorts more thantriple from a low control group mean of 2.3 percent. This effect is large given the relatively low inter-
2

marriage rates across the country (around 10 percent), especially in rural areas. As a benchmark, this isroughly equivalent to the difference in intermarriage rates between primary and junior secondary edu-cated individuals in Indonesia’s ethnically diverse and cosmopolitan capital, Jakarta. Additionally, theeffects do not appear to be driven by differences in public goods or other complementary nation buildingactivities such as primary school expansion (Duflo, 2001).
Further investigation suggests that the increase in intermarriage cannot be explained entirely bychanges in exposure to transmigrants (supply), suggesting that preferences for intermarriage (demand)may have changed as well. Intermarriages increase above and beyond what would be expected if indi-viduals randomly matched in the more ethnically diverse marriage markets in Transmigration villages.Reduced form results suggest that around two–thirds of the differential increase in intermarriage is as-sociated with changes in preferences.
These changes in marriage behavior point to shifts in identity that we further corroborate by identi-fying more intense use of the national language (Bahasa Indonesia or Indonesian) at home in settlementareas. Nationalist leaders chose Indonesian as a language of unity, having its roots not in the languageof the largest ethnic group (Javanese) but rather in Malay, a lingua franca historically spoken by tradersacross the archipelago. In diverse countries like Indonesia where each group speaks its own nativelanguage, a shared national language can allow individuals to interact while preserving their native(ethno)linguistic identity. Consistent with an array of social science research, we view daily use of In-donesian at home as a key means by which parents socialize the national identity among children.
Using household survey data from 2006, we show that the Transmigration program significantlyincreased Indonesian use at home. Individuals in treated areas are around three times more likely toreport Indonesian as the primary language at home relative to 12 percent in control areas. This largeeffect is robust to controlling for age, schooling, and other confounders and is similar in magnitude tothe gap in speaking Indonesian at home between rural and urban areas or between those with less thanprimary and those with junior secondary education.
We further investigate how diversity shapes incentives to integrate by using the large number ofprogram settlements to estimate nonlinear relationships between language use and diversity. Our semi-parametric estimates reveal a significant inverted U shape for national language use at home. Interest-ingly, the turning point is relatively high at around 40–45 percent Inner Island ethnic share, suggestingthat national affinity is strongest in communities where Inner and Outer Islanders are in roughly equalproportion. This is interesting given that with roughly equal mixes, individuals need not develop in-tergroup relationships as they tend to have enough own-group members to sustain segregation withinthe marriage market and broader socioeconomic interactions. Meanwhile, in villages with imbalancedgroup sizes, individuals are more likely to retain their native language, or to adopt the majority languagein the case of minorities. The nonlinear relationships we identify are consistent with social externalitiesand multiple equilibria in language use (Lazear, 1999). Moreover, we find that conditional on overallvillage-level diversity, ethnic residential segregation within villages is associated with lower nationallanguage use at home, which provides further evidence on the role of contact in shaping integration.
Finally, we shed light on how diversity affects the intergenerational transmission of ethnic identity.In settlements where Inner Islanders are a dominant majority (as induced by the initial assignment), chil-dren in mixed marriages are more likely to adopt the majority Inner Islands ethnicity. The opposite holds
3

in settlements where Inner Islanders are a minority. However, in villages with more balanced shares ofInner and Outer Islanders (30–70 percent mix), there is no relationship between increased parental groupsize and child ethnic identity. The fact that we do not observe a linear relationship or tipping towards themajority identity beyond the 50/50 threshold suggests that ethnic identity transmission is more neutralin mixed communities.4
Together, our findings on marriage, language, and identity choices suggest that although manyaspects of identity are resilient to change, some are produced through social interactions and henceamenable to policy. The deeper long-run integration in Transmigration villages is striking in light of pre-vailing concerns that such large-scale resettlement was a form of Java-centric cultural imperialism thatwould stoke ethnic conflict. Overall, the Transmigration program provides a rich laboratory for under-standing how diversity shapes incentives to connect with other groups, in turn influencing socializationand identity choices that spill over into subsequent generations. Indeed, auxiliary household panel datareveals that exposure to intermarriage or the national language at home as a child is associated withweaker ethnic attachment and stronger national affinity later in life.
Our findings contribute to important questions in the political economy literature. Although a largeliterature identifies adverse consequences of diversity (see Alesina and LaFerrara, 2005; Ray and Esteban,2017), little is known about how diverse countries might effectively manage such divisions. Alesina andReich (2015) formally model the process of nation building and policies to promote a shared nationalidentity. We use the Transmigration program to deepen our understanding of the process of nationbuilding and uniting diverse groups. We contribute policy lessons using plausibly exogenous variationin very localized diversity to study intergroup relationships obscured at higher levels of geographicaggregation. Our results on integration resonate with a small but growing body of research on the roleof policies and leaders in influencing intergroup relationships.5
Second, we provide a unique lens into the slow process by which new forms of shared identity arecreated and socialized. Our results suggest that ethnic mixing can offer additional vehicles for identityformation. We show that interethnic marriage and a shared national language can be such vehicles,consistent with work by Bisin et al. (2008) and Laitin and Ramachandran (2015).6 Overall, our findings
4These findings are consistent with recent work showing how identity formation depends upon the relative size of one’s owngroup in society (Abramitzky et al., 2015; Jia and Persson, 2015; Nix and Qian, 2015).
5For example, Miguel (2004) investigates nation building policies to promote intergroup cooperation in Tanzania. Blouin andMukand (2016) demonstrate how strong propaganda and sanctioning by the central government in post-genocide Rwandaled to a weakening of interethnic biases. Bazzi and Gudgeon (2016) show for Indonesia that less ethnically polarized admin-istrative units can mitigate conflict. Glennerster et al. (2013) show in Sierra Leone that strong local leaders can coordinateinterethnic cooperation from above. Okunogbe (2015) shows that exposure of youth volunteers to other ethnic groups inNigeria boosts own group pride but also strengthens national affinity. Additionally, our study complements recent work onschool-based nation building policies (Bandiera et al., 2015; Lleras-Muney and Shertzer, 2015). A related literature on segrega-tion in cities investigates the impact of ethnic or racial residential desegregation on public goods in urban France (Algan et al.,forthcoming), housing prices in Singapore (Wong, 2013), and schooling and earnings in the United States (Cutler et al., 2008).
6Laitin and Ramachandran argue that the choice of an appropriate national language—typically, a lingua franca rather than adominant ethnic group’s language—can undo the well-established negative cross-country correlation between national eth-nolinguistic diversity and socioeconomic development. We offer a uniquely localized investigation of this claim in a widelytouted case of successful national language policy. In other work, Advani and Reich (2015) identify diversity tipping pointsin English language adoption and interethnic marriage within U.S. counties during the period of mass immigration in theearly 20th century. We differ in our focus on policy and ability to rule out confounding due to endogenous sorting. Moresubstantively, there is an important distinction between immigrant minorities assimilating to the English-speaking native ma-jority in the U.S. versus multiple groups converging towards a new shared, national identity in Indonesia. This latter settingis arguably the more relevant one in diverse developing countries in the post-colonial era.
4

provide strong micro evidence consistent with recent studies arguing that contact between different eth-nic groups can foster local learning that mitigates the adverse effects of segregation in diverse countries(Alesina and Zhuravskaya, 2011; Desmet et al., 2016).
We consider several potential explanations as to why abrupt ethnic-based immigration shocks didnot lead to prolonged social disintegration. First, the lottery-based allocation of resources within newsettlements limited initial ethnic inequality, which can be associated with intergroup grievances (seeAlesina et al., 2016b). Second, in these settings, minorities likely face low returns to establishing anoppositional identity (see Bisin et al., 2011). The newly salient Indonesian identity offers an alternativesource of pro-social identification that does not imply succumbing to a majority culture. Additionally,the opportunity costs of opposition could be high given that minorities are increasingly more likely to beworking in trader-related occupations, enjoying pecuniary returns from interactions with the majoritygroup. Third, our results suggest that in communities with major groups in roughly equal proportion,the cultural and economic tradeoffs of intergroup interactions may be less stark. In the conclusion, werevisit the potential policy implications and discuss lessons for resettlement programs.
The rest of the paper proceeds in seven sections. Section 2 provides background on nation buildingefforts in Indonesia. Section 3 provides relevant details on the Transmigration program. Section 4 detailsour main data sources on diversity and nation building measures. Section 5 develops the empiricalstrategies for identifying causal impacts of resettlement and diversity. Section 6 presents the main impactestimates for marriage and language outcomes. Section 7 discusses the nonlinear impacts of diversityon language and identity choices, and Section 8 concludes with a discussion of policy implications.
2 Background: Nation Building and the Transmigration Program
With a population of more than 250 million, Indonesia is the world’s fourth most populous country. Itis also among the world’s most diverse. According to the 2010 Population Census, Indonesia is hometo more than 1,200 self-identified ethnic groups living on roughly 6,000 islands. By far, the Javanese arethe largest ethnic group, constituting 40.1 percent of the population, followed by the Sundanese with15.5 percent (Ananta et al., 2013). Both groups originate from the Inner Island of Java. Each of the nextthirteen largest ethnic groups comprise between 1.2 and 3.7 percent of the country’s population. Nation-ally, Indonesia’s index of ethnolinguistic fractionalization (Easterly and Levine, 1997), ELF , constructedusing 2000 Population Census data, is around 0.7.
Despite this vast diversity, most Indonesians live in ethnically homogeneous communities. Of themore than 60,000 urban and rural villages in Indonesia, the median village has an ELF of 0.05.7 Thismeans that in half of Indonesia’s villages, there is no more than a five percent chance that two randomlychosen individuals would belong to different ethnicities. The combination of significant national diver-sity and local homogeneity presented Indonesia’s political leaders with the problem of nation buildingfrom the earliest stages of the country’s struggle for independence. This section details the problem ofnation building as it relates to the Transmigration program.
7In the Outer Islands (i.e., outside of Java and Bali), the ELF of the median village is 0.14, suggesting similarly homogeneouscommunities. Villages (desa or kelurahan) comprise the lowest level of governance in Indonesia with an average population ofover 2,000 (7,000) in rural (urban) areas in the early 2000s. They are the main administrative unit of analysis in our study.
5

2.1 Indonesia’s Nation Building Challenges
For most of its history, the peoples of the Indonesian archipelago were governed by a collection of in-dependent kingdoms (kerajaan), many of which were isolated from one another, separated by immensewaterways and dense vegetation.8 The absence of a common ruler, together with geographic isolation,enabled the persistence of many different cultures, religious practices, and languages throughout the re-gion. After establishing their first outpost in Indonesia in 1603, it took centuries for the Dutch East IndiaCompany (VOC) to govern the disparate peoples scattered across the archipelago under one commonrule.9 Ironically, this unification was achieved partly through a divide-and-rule policy that pitted onekingdom against another. As such, by the end of the nineteenth century, the peoples of Indonesia hadlittle shared history, apart from their experiences with Dutch colonialism.10
Movement towards the recognition of a shared national identity began in the early twentieth century.The push toward political unity culminated in the Second Youth Congress in 1928, where regional or-ganizations of young intellectuals from across the archipelago pledged to create “satu nusa, satu bangsa,satu bahasa” (one fatherland, one nation, one language). Nation building has been a priority among In-donesia’s political leaders ever since. National unity is one of the five key principles of Pancasila, thestate ideology, while “Bhinneka Tunggal Ika” (Unity in Diversity) is the state motto inscribed on its coat ofarms. Indeed, as noted by Feith (1962/2007, p. 34), nation building “was probably the central goal whichthe nationalist leaders believed should and would be realized with the attainment of independence.”11
After Indonesia declared independence in 1945, for at least a decade, political and military tensionsacross the archipelago threatened to derail nation building efforts. Tensions often grew out of oppositionto the increasing concentration of power in the capital, Jakarta, which many associated with a growingdominance of the the Javanese (Bertrand, 2004; Feith, 1962/2007). These frustrations often coincidedwith rising ethnic sentiment, and anti-Javanese sentiments from the Outer Islands would surface fromtime to time (see, e.g., Ananta et al., 2004; Mulder, 1996; Thornton, 1972). After General Suharto rose tothe presidency—following the 1966 military coup and political crisis—and consolidated power, some ofthese regional threats began to subside.
One important nation building instrument that, in retrospect, anticipated some of these challengeswas the choice of Bahasa Indonesia as a national language. Of the nearly 700 languages currently spokenin Indonesia, almost all belong to the Austronesian language family, but many are very different from
8In pre-colonial history, the nearest Indonesia came to experiencing a unified government was under the Majapahit empire(1293-1500). However, governance was not particularly strong or centralized during this period, and different religious prac-tices, customs, and languages persisted. The empire collapsed as a result of civil wars and political infighting among thegoverning elites, leaving a power vacuum for the Dutch. See Reid (1998) for further background.
9Friend (2009, p. 21) notes, “The Dutch brought a layer of assiduous modernity to political vacuums strung throughout a vastarchipelago. Geographically disconnected and culturally discordant but now administratively centralized, the NetherlandsEast Indies was for the length of one human generation the first comprehensive empire that region had ever known.”
10As noted by Ricklefs (2008, p.189): “In 1905. . . [a sense] of a common Indonesian identity or of common goals simply didnot yet exist. Most Javanese, for instance, neither knew nor cared about what happened in Aceh, except for those who werefighting beside the Dutch to destroy its independence.”
11Feith (1962/2007, pp. 34-35) notes further that nationalist leaders envisioned “The creation of a nation—a people unifiedby ties of common language, common outlook, and common political participation, a people enthusiastically severing itsoutworn ties to local traditions and loyalties and achieving kesadaran, consciousness of the nation . . . For some leaders thefirst task was the destruction of ethnic barriers and the creation in society at large of the sort of all-Indonesian culture whichalready existed inside the nationalist movement.”
6
one another, and the differences are particularly large across the Inner–Outer Island divide.12 BahasaIndonesia, or Indonesian, is a modified version of Malay that originated along the eastern coast of Suma-tra (and peninsular Malaysia) but had been used as a trading language in the archipelago for centuries.Prior to its recognition as the national language at the 1928 Youth Congress, Malay was only spoken asthe native language by 5 percent of the population living under Dutch colonial authority, whereas nearly40 percent spoke Javanese. By unanimously choosing a minority language, the delegates of the congressavoided the resistance of non-Javanese ethnic groups and signaled their commitment to political unity.13
Its status as the national language was cemented in the 1945 Constitution.Subsequent policies leveraged the national language for broader nation building efforts. Indone-
sian was established as the language for official communication and was incorporated in the nationalcurriculum (Nababan, 1991; Suryadinata, 1988; Wright, 2016).14 Along with the expansion of access toeducation, this policy helped to spread the adoption of the national language. Given its vast diversity,Indonesia’s national language policy is often considered an exemplary success.15 Today, many viewIndonesian as “a symbol of national unity identification” rather than simply an official language usedin politics or business (Sneddon, 2003), and as one early observer argued, “the more [the Indonesianpeople] learned to express themselves in Indonesian, the more conscious they became of the ties whichlinked them” (Alisjahbana, 1962). However, despite nearly universal knowledge of Indonesian and itswidespread use in formal communication and media, less than 20 percent of households use it as theprimary language at home (based on the 2010 Census).
2.2 Transmigration and Nation Building
Another important element of Indonesia’s nation building effort was the Transmigration program. De-signed to alleviate population pressures, the program subsidized the relocation of agricultural house-holds from rural Java/Bali (transmigrants) to newly created rural settlements in the Outer Islands. His-torically, Transmigration began during the Dutch colonial period and was revived after independence.However, it received a major overhaul in the third and fourth Five-Year Development periods (or Pelita)from 1979–1988 under Suharto (see below).
During this period, planners envisioned the program as a vehicle for nation building by fosteringinteractions between the country’s diverse but segregated ethnic groups (Hoey, 2003; Kebschull, 1986;MacAndrews, 1978; World Bank, 1988). In speeches and policy documents, government officials alludeto the program’s role in enhancing interethnic cooperation. For instance, in 1985, the Minister of Trans-migration, stated “By way of transmigration, we will try to ... integrate all the ethnic groups into onenation, the Indonesian nation. The different ethnic groups will in the long run disappear because of
12For example, the linguistic distance between Javanese and prominent Outer Islands languages in Transmigration areas (e.g.,Minangkabau, Batak, Toraja) is akin to the linguistic distance between German and French (Lewis et al., 2009).
13As Sneddon (2003) points out, this choice avoided the type of opposition from minority ethnic groups that was found, forexample, in India during attempts to establish Hindi as the national language.
14In his assessment of the Indonesian education system in the late 1970s, Beeby (1979, p. 148) notes that “Bahasa Indonesia, thenational language, is seen as the main educational instrument making for a sense of national unity; in the regulation it isgiven 20 percent of the school time, but this is often exceeded.”
15To cite Paauw (2009): “[No] other post-colonial nation has been able to develop and implement a national language with thespeed and degree of acceptance which Indonesia has. No other national language in a post-colonial nation is used in as widea range of domains as Indonesian, a feat made more impressive by the size and ethnic, linguistic and cultural diversity ofIndonesia.”
7

integration and there will be one kind of man, Indonesian.” (Hoey, 2003).16
However, the program stoked suspicions of a “Javanization” agenda in the Outer Islands (see, e.g.,Hoshour, 1997; Mangunrai, 1977). Echoing some of the sentiments from the early days of independence,there were questions of whether Transmigration was a vehicle for cultural imperialism over Outer Islandcultures or a way for Suharto’s government to solidify power in frontier regions (see e.g., Aspinall, 2008;Charras and Pain, 1993; Levang, 1995). Their concerns reflect the unease among indigenous, “sons of thesoil” minority ethnic groups experiencing rapid immigration of majority ethnic groups from the politi-cal and economic center of the country. Locally, the Inner–Outer cleavage tends to be the most salientdivision, and in Transmigration areas, natives often refer to transmigrants as pendatang or newcomers.
3 Transmigration: Program Design and Implementation
We describe here two features of the design and implementation of the Transmigration program that willbe central to our empirical analysis. First, due to a large shock to oil prices in the mid-1980s, programfunds were cut drastically, and a large number of villages that had been selected to receive transmigrantsultimately never did. Second, because of the scale and pace of implementation, individual transmigrantscould not select their destinations, and coordination issues led to an as-if-random assignment of trans-migrants to destinations, where they were encouraged to interact with local native groups.
3.1 Budget Shock and Counterfactual Settlements
Figure 1 illustrates the impact of oil prices on the resettlement program, showing how large fluctua-tions in the annual number of transmigrants placed coincided with large fluctuations in global oil prices.During the third development planning period (Pelita III, 1979–1983), the Transmigration program re-settled nearly 1.5 million people, and in its plan for Pelita IV (1984–88), the government was even moreambitious, targeting 3.75 million people for relocation. From 1984 to 1985, the government resettledaround 307,000 people, but in January 1986, oil prices fell dramatically, and declining revenues forcedthe government to cut the Transmigration budget by 44 percent in that fiscal year.
As detailed in Section 5.1 below, we use the negative budget shock and the sequential site selectionprocess to construct counterfactual settlements in the Outer Islands. According to planning manuals,Transmigration sites were selected using a three stage process. First, potential settlement areas wereidentified using large-scale maps capturing basic information about topography, market access, and ex-isting settlements. Second, aerial reconnaissance identified “recommended development areas” (RDAs)based on agroclimatic conditions and nearby indigenous populations. Finally, local surveys of theseconditions helped determine the total number of transmigrants to be allocated to the settlement.
Given the large, unexpected fiscal shock, all land clearing in RDAs slotted for the final stage of sitepreparation was deferred indefinitely. In practice, given the scale of the program and associated logisticalconstraints, the planning process was much less careful or detailed than intended and often deteriorated
16Discussing the program objective, World Bank (1988, p. 5) noted: “[Transmigration] has been seen by national leaders as atool for national integration . . . Migration of outer island residents, mainly to Javanese cities, and of inner island residents,mainly to rural areas in the outer islands, is seen by national leaders, from both Java and the other islands, as a means ofpromoting cultural contact and building national unity.”
8

to an ad hoc, “plan-as-you-proceed” approach (World Bank, 1988). We argue below that the planned butunfinished RDA villages provide a credible counterfactual for what Transmigration villages would havelooked like today in the absence of the program.
3.2 Selection of Transmigrants and Initial Placement
Transmigrants volunteered for the program, but to participate, they had to be Indonesian citizens in goodphysical health. The program targeted entire families for resettlement, and couples had to be legally mar-ried, with the household head between 20 and 40 years of age. In practice, most participants were poor,landless agricultural laborers, with few assets, and limited schooling (Kebschull, 1986).17 Transmigrantsreceived free transport to the new settlements, housing, and farm plots assigned by lottery.
As described at length in Bazzi et al. (2016), the process by which transmigrants were assigned to des-tination settlements was neither rigorous nor systematic. Many reports indicate that the process sufferedfrom time, information, and institutional constraints that led to haphazard implementation. Coordina-tion problems between government agencies made it infeasible to systematically match transmigrants tosettlements. Ultimately, the allocation of transmigrants was largely driven by the coincidental timing oftransmigrants’ arrival to transit camps in Java/Bali and the opening of settlements in the Outer Islands(Hardjono, 1988). Participants could not choose their destinations and were often ill-informed about theconditions they would face in the new settlements (Levang, 1995; Kebschull, 1986).
To reduce the potential for conflict, promote integration, and encourage the transfer of agriculturalknowledge, official guidelines stipulated that a share of each settlement would be allocated to localinhabitants from around the settlement areas. In 1979, this share—officially known as Alokasi Pemukimanbagi Penduduk Daerah Transmigrasi (APPDT)—was recommended to be 10 percent, and it was increased to20–25 percent in 1982. In practice, these thresholds varied considerably across settlements (Clauss et al.,1988; Rigg, 2013), and planners determined the number of transmigrants to be sent to a given settlementbased in part on the size of the nearby Outer Islands population.
The combination of the haphazard assignment of Transmigrants to destination villages and variationin APPDT shares resulted in plausibly exogenous variation in initial ethnic diversity across settlements.Below, we use this variation to identify the effects of diversity, addressing important concerns aboutselection into the program and ex post sorting that could confound estimates.
4 Data: Policy and Outcomes
This section presents first our main data sources on the geography of resettlement and second our keyintegration and identity outcomes consistent with nation building.
17Government-sponsored migrants in Indonesia are more comparable to non-migrants than to typical non-sponsored or sponta-neous migrants. On average, Java/Bali-born individuals who moved to Transmigration villages had 0.5 fewer years of school-ing compared to stayers in their origin district in Java/Bali (based on the 2000 Population Census). By contrast, Java/Baliborn individuals who moved to urban areas in Java/Bali or to the Outer Islands have 3 to 4 more years of schooling comparedto stayers. While transmigrants surely had unobservable traits similar to other frontier settlers throughout history, they wereoften among the poorest and least educated members of their home villages. This mitigates some of the first-order confoundsof tolerance, but we revisit these concerns about selection when interpreting key results.
9

4.1 Measuring Treatment and Site Selection
The main source of data on Transmigration villages is the 1998 Transmigration Census, produced bythe Ministry of Transmigration (MOT). We digitize this Census to identify 911 Transmigration villages(outside of Papua) established from 1979 to 1988. These villages, which comprise our core treatmentgroup, received on average 1,872 transmigrant individuals in the initial year of settlement. However,some villages received as few as 350 transmigrants while others received as many as 8,500.
We identify control villages using the MOT’s high resolution maps of recommended developmentareas (RDAs) constructed in the second phase of site selection described above. We digitally trace theseRDAs and define as “almost-treated” (controls) those 907 non-Transmigration villages observed in 2000that share any area with the RDAs from the 1980s. As a baseline, we exclude control villages that arewithin 10 kilometers of Transmigration settlements to minimize potential bias from spillovers. Our con-clusions are similar using other cutoffs. This leaves us with 832 treated villages and 668 control villagesafter accounting for missing data.
Figure 2 depicts the locations of both Transmigration and control villages. Transmigration settle-ments are scattered throughout the Outer Islands. More than half of these sites are located on the islandof Sumatra, but many are also found on Kalimantan and Sulawesi. Control sites are also distributedacross the archipelago, making it possible to allow for a within-island analysis that accounts for the vastsocioeconomic differences across these large island groups.
We also draw on several geospatial data sources—detailed in the Online Appendix of Bazzi et al.(2016)—to measure the characteristics used to identify RDAs and select settlements in the Outer Islands.These include measures of: (i) topography (land area, elevation, slope, ruggedness, and altitude), (ii)pre-program market access (distance to (sub)district capitals, roads, rivers, and the sea coast), and (iii)soil quality such as texture, drainage, sodicity, acidity, and carbon content. Many of these variables areexplicitly listed in program manuals from 1978 in the MOT archives that provided guidance for siteselection. By measuring these variables at a high spatial resolution, we are able to account for importantdifferences in natural advantages between treated, control, and other villages in the Outer Islands.
4.2 Integration and Identity Outcomes
We first draw on the universal coverage 2000 Population Census microdata to capture not only the de-mographic shock induced by the Transmigration program but also its impact on integration and identitychoices. Key demographic measures include total population, the share of Inner Islands immigrants,ethnic (and religious) diversity, and residential segregation between Inner and Outer Islanders based onthe standard Bell (1954) isolation index applied here to census blocks within villages. Appendix TableA.1 provides summary statistics for these and other outcomes.
In addition to the fine block-level detail on residence, the Census reports 14 Inner Island ethnicgroups and over 900 Outer Island groups.18 Most of our analysis focuses on the Inner–Outer group di-
18This is the first time that ethnicity is reported in the Population Census since the last Census conducted by the Dutch in1930. The 14 Inner Island groups include all of those native to Java/Bali with the top four—Javanese, Sundanese, Madurese,and Balinese—comprising nearly 99 percent of Inner Islanders in study areas, which is in line with their population sharein Java/Bali itself. Meanwhile, the top 50 Outer Island ethnicities in study villages only cover around 80 percent of OuterIslanders in these areas. More generally, although many Outer Island groups are relatively small nationally, they are relativelylarge in many areas exposed to the Transmigration program.
10

vide for reasons detailed in Section 2, but we leverage the full granularity in ethnic identity in additionalchecks. Note that the Census only allows individuals to report a single ethnicity, and the household headtypically reports that ethnicity for all members (Ananta et al., 2013). Hence, beyond marriage choices,we view the reported ethnicity of children within mixed marriages as an important identity decision.
Using the same Census data, we examine program impacts on interethnic marriage rates to capturelocal integration. Despite Indonesia’s diversity, intermarriage is relatively uncommon with around 10percent of individuals marrying outside their ethnic group and an even lower rate in rural areas. Inter-marriage has long been viewed by social scientists as a key marker of assimilation (see Gordon, 1964),and as Babcock (1986) notes, officials in the Ministry of Transmigration often monitored marriage be-tween Inner and Outer Islanders as a barometer for successful integration. For each household head, wecan identify their marital status as well as the ethnicity of their co-resident spouse if married.19 More-over, because we observe all individuals in each village, we can benchmark the observed intermarriagerates to those that would obtain under random matching. This helps address the fact that more diverseplaces tend to have more intermarriages merely due to greater opportunity for marrying outside one’sgroup rather than changes in preferences for exogamy.
We aim to isolate changes in marriage patterns for cohorts who were likely to have been affectedby the program (had they lived in a Transmigration settlement). We therefore investigate intermarriageeffects across the age distribution and focus part of our analysis on young couples. For treated villages,a young couple is one in which the ages of both spouses were less than 15 (the legal age of marriage) inthe village’s year of settlement. For control villages, we define “the year of settlement” as the medianyear of settlement of treated villages in the same district or province. By 2000, the average age for theseyoung individuals is around 25, and 84 percent of them are married. Our results are robust to alternativedefinitions of young cohorts, and we also report estimates of program effects on .
Beyond marriage decisions, we also investigate language use at home as a leading indicator of so-cialization and identity. Because language information is not available in the 2000 Population Census,we utilize auxiliary, individual-level data from the National Socioeconomic Survey (known as Susenas)to examine language use.20 The socioeconomic module of the 2006 survey contains questions on ethnicidentity and on the primary language used daily at home by the household head.
Finally, as a validation check on our integration outcomes, we draw upon Susenas data from 2012to measure interethnic preferences. One relevant question asks, “How do you feel about the activitiesof other ethnic groups in your community?” They are also asked their level of agreement with thestatement, “The district mayor [elected by popular vote every 5 years] must be a native of the region.”
Intermarriage and Indonesian Language Use as Nation Building. Ultimately, by facilitating inte-gration, both intermarriages and national language use contribute to long-term nation building. Both
19For extended households with multiple married couples, we are not able to identify secondary couples in the household asthe data only provide information on relationship to the household head. Among all married individuals in our study area,only around 5 percent is neither a household head nor a spouse, suggesting that this measurement error is relatively limited.Moreover, we develop an algorithm to identify some subset of these other marriages, and doing so leaves all of our resultsunchanged. Hence, we maintain the cleaner household head measure as our baseline.
20Susenas is a nationally representative household survey that collects detailed data on Indonesian households. Althoughreported in the 2010 Census, language data are not available with village-level administrative codes as required for ouranalysis. Despite the relatively small sample of households within each village, the Susenas data provides enough variationto identify key patterns of language use even as we face limitations in statistical power for some purposes.
11

of these intrahousehold decisions have important intergenerational implications for identity formationand intergroup trust. We use the Indonesia Family Life Survey (IFLS) panel dataset to provide evidenceof this socialization process leading to weaker ethnic attachment and stronger national affinity.21
Using the entire IFLS panel, we take the sample of individuals observed in 1997 that subsequentlyformed new households and construct two indicators: (i) whether individuals are children from intereth-nic marriages, and (ii) whether, as children, their parents spoke Indonesian daily at home. Table 1 reportsregressions relating these indicators to five outcomes in the 2014 IFLS wave: in Panel (A) whether In-donesian is used at home today, (B) whether the individual switched ethnicites between 1997 and 2014,(C) whether the individual is in an interethnic marriage (if married), and (D) a normalized index of mis-trust of other ethnic groups. All regressions control for age, gender, education, and village fixed effects.
Overall, Table 1 reveals a consistent pattern that having intermarried parents and speaking Indone-sian at home are both associated with nation building. Individuals growing up in such households aresignificantly more likely to speak Indonesian at home. They are less likely to consistently report thesame ethnicity after they leave their parents’ homes, are more likely to intermarry, and are less likely toexhibit parochial trust of people of their own ethnic group.22 Across columns, we see that the effect ofeach measure from 1997 is not significantly different when controlling for the other. This suggests thatnational language use at home and intermarriage may capture distinct socialization mechanisms.
Together, these measures capture an array of social identity decisions and preferences reflective ofthe extent of interethnic integration. Using these as outcomes, our empirical strategy described nextallows us to paint a rich picture of the otherwise slow process of breaking down interethnic cleavagesand converging towards new forms of shared national identity.
5 Empirical Strategy
This section develops our empirical strategy in several steps. First, we describe our strategy for esti-mating causal effects of the Transmigration program on nation building outcomes. Our framework cancapture both equilibrium effects at the village level as well as identify differential effects of programexposure across cohorts while addressing individual-specific confounders. Next, we demonstrate thatthe program significantly changed the ethnic composition of treated areas, thereby increasing the scopefor intergroup relationships. Third, we present a method for isolating plausibly exogenous variation inethnic diversity within the new Transmigration settlements based on initial planning assessments.
5.1 Identifying the Impact of the Transmigration Program
To identify the impact of the Transmigration program, we use the set of planned villages that never re-ceived transmigrants as a counterfactual for what would have happened in the absence of the program.Some of these planned RDAs had been partially settled by local populations prior to the program, andvillages continued to arise in these areas through spontaneous settlement processes thereafter. By us-
21The IFLS is an incredibly rich household survey that tracks individuals over multiple decades even after changes in theoriginal household structure due to migration and formation of new households by children. Unfortunately, the sample istoo small and geographically diffuse to be used in econometric analysis of the Transmigration program (see Bazzi et al., 2016).
22The weaker intermarriage effects compared to other outcomes is due in part to the fact that ethnicity is fluid.
12

ing these “almost treated” villages as the counterfactual, we assume that if Transmigration settlementshad never been a part of the program, they would have been settled anyway, but settlement wouldhave taken place organically, by endogenously sorting migrants. Without these almost treated villages,our comparison would suffer from omitted variable bias since Transmigration villages tend to be lowerquality locations that were settled later. Additionally, focusing on individuals in newly created villagesallows us to shed light on how intergroup relationships develop in a village’s formative years, whenmultiple equilibria are possible and social norms are still in flux.
Our main individual-level estimating equation is given by:
yij = α+ θTransmigrationj + x′jβ + w′iφ + νij , (1)
where yij is an outcome measure for individual i in village j, wi is a vector of individual-level controls,Transmigrationj is a treatment indicator equal to one for Transmigration villages and zero for RDAvillages, and xj includes the predetermined control variables capturing natural advantages and used byplanners in site selection, including island fixed effects, and νij is an error term. The coefficient θ capturesthe average treatment effect on the treated (ATT), which we can estimate for different subgroups.
From the perspective of Outer Islands natives, θ captures individual-level effects of exposure to theTransmigration program. The basic strategy for identifying these exposure effects is akin to a commonapproach with exogenously assigned immigrants (e.g., Dahlberg et al., 2012; Edin et al., 2003). Thisgranular specification allows for exposure to affect older and younger generations differently, which willbe especially useful for investigating marriage decisions. Additionally, by progressively adding controlsto wi, we are able to rule out confounding effects of schooling, occupation, and migration choices. Tocapture aggregate effects across all Inner and Outer Island residents, we can estimate a village-levelanalogue of equation (1).
Table 2 demonstrates the building blocks of our identification strategy. We first show why it is im-portant to restrict the counterfactual to almost-treated villages. Consistent with the program targetingunderdeveloped rural areas, Transmigration villages statistically differ in terms of nearly all x charac-teristics, most of which were used to select sites in the planning phase. When restricting non-programvillages to the almost-treated RDAs, these differences become smaller. However, some agroclimatic andgeographic characteristics remain significantly different, suggesting that more suitable settlement areasmay have been selected earlier in the planning process. A causal interpretation of the Transmigrationeffect in equation (1) requires that we rule out these first-order sources of program placement bias.
We address this potential targeting bias using a reweighting procedure akin to recent evaluations ofplace-based policies (see Kline and Moretti, 2014). We use the Oaxaca-Blinder approach of Kline (2011),which is equivalent to a propensity score reweighting estimator that rebalances control villages to matchthe covariate distribution of treated villages. To demonstrate the value of this approach, we first predictthe probability of being a Transmigration village:
P(Transmigrationj = 1) = Λ(x′j ζ), (2)
where Λ(·) is a logit function.23 The covariates explain over one-third of the variation in site selection;
23Consistent with the bivariate comparisons in Table 2, the conditional estimates of ζ reported in Appendix Table A.2 are
13

with province fixed effects, which we use in robustness checks, they explain over half. The estimatedprobabilities, Pj , exhibit considerable overlap across treated and control villages (see Appendix FigureA.1). We then reweight control village j by its odds of being a Transmigration site, κ = Pj/(1− Pj).
This reweighting of RDA villages helps to rebalance the sample as if planners in 1978 randomlychose Transmigration sites from the initial potential settlements, with selection probabilities based onobservables. Comparing the final two columns in Table 2, we find that without the κ weights, more thanhalf of the site selection variables exhibit large and statistically significant differences across treated andcontrol villages. After reweighting, that share falls to less than 10 percent. Removing these observablesite selection differentials brings us closer to a causal interpretation of the ATT by removing importantgeographic drivers of local demographic composition. We address additional sources of selection biasaffecting the ATT when presenting results in Section 6.
5.2 Demographic Impact of the Transmigration Program
Table 3 shows how the Transmigration program affected the demographic composition of treated vil-lages, increasing the scope for interactions between otherwise isolated ethnic groups. In Column 1, wecompare Transmigration villages to all other Outer Island villages, while in columns 2 and 3, we restrictthe sample to the set of treated and control villages. Column 2 controls for the predetermined site selec-tion characteristics in xj , while column 3 implements the Kline (2011) reweighting estimator on whichwe focus our discussion. Below each point estimate, we report robust standard errors, clustered at thedistrict level, in parentheses.
The results from column 3 show that although the program did not lead to significant changes inthe total number of people in the average village, there were substantial compositional effects. Relativeto a control group mean of 2 percent, treated villages have 34 percentage points (p.p.) higher InnerIsland immigrant population share.24 Most of these immigrants and their descendants identify withethnicities native to Java/Bali (hereafter, transmigrant or Inner Island ethnicities). As a result, treatedvillages have a 54 p.p. higher Inner Island ethnic share than control villages, where only 6 percent ofindividuals claim Inner Islands ethnicity on average.25 Additionally, residential segregation betweenInner and Outer Islanders is significantly lower in treated areas. The program led to a nearly 50 percentreduction in the Bell (1954) isolation index relative to a control group mean of 0.34; some of this effect canbe explained directly by the random allocation of plots to farmers when villages were initially settled.
Overall, the Transmigration program significantly increased ethnic diversity in the Outer Islands.Ethnic fractionalization increases by 0.13 relative to a control group mean of 0.23. However, thesechanges are not due to an increase in the number of ethnic groups, which is around 20 in the average
indicative of sequential site selection among eligible settlement areas. For example, treated villages are at lower altitude,have better soil drainage, and are closer to major roads.
24The combination of null total population effects and significant ethnic composition effects is worth noting, because it suggeststhat in the absence of the program, Transmigration villages would have been just as populated as control villages, but theywould have received less diverse migrants through the same forces of spontaneous settlement observed in control areas withsimilar natural advantages. This validates our village-level comparison and underscores the importance of holding the ageof the village constant in the analysis.
25Most of the gap between the Inner Island-born and Inner Island ethnic share in Transmigration villages can be explainedby the second generation born to Inner Island natives who migrated as children with their transmigrant parents. Indeed, aShapley decomposition suggests that 50 percent of the variation in the Inner Island ethnic share is explained by those born inJava/Bali while 41 percent is due to those born in the same district as the given Transmigration village.
14

control village. There are slightly more groups in treated villages, but these differences are insignificantafter reweighting. Hence, much of the increase in diversity can be attributed to changes in the size andcomposition of ethnic groups and in particular those hailing from Java/Bali. At the same time, we findsmaller, insignificant changes in religious diversity.26
Figure 3 illustrates the extent of these persistent program-induced effects on diversity in the Outer Is-lands. The kernel densities reveal an important feature of the natural experiment, namely the continuumof diversity across Transmigration villages. This local variation, which is not found in longstanding set-tlements or recent settlements in control areas, allows us to identify nonlinear effects of diversity usinga strategy developed next.
5.3 Identifying Nonlinear Impacts of Diversity
To identify nonlinear relationships between diversity and nation building outcomes, we exploit the factthat planners determined the number of Inner Island transmigrants to allocate to each settlement basedon an assessment of carrying capacity. These decisions were made before the plausibly exogenous mixof transmigrants was realized, and this capacity was influenced by the same site selection characteristicsin x and the size of the native Outer Islands population in nearby areas. Sites with greater agriculturalpotential—as proxied by the quality and quantity of available land—received more Inner Islanders inthe initial year of settlement. In practice, conditional on natural advantages x, a large (small) initialtransmigrant population implied a small (large) initial native population (i.e., local APPDT migrantsnoted in Section 3).
We leverage this initial variation in settlement composition to investigate how diversity affects lan-guage, identity, and other individual choices with social spillovers. In particular, we aim to relate choicesby individual i in Transmigration village j to a possibly nonlinear function g(·) of diversity in 2000:
yij = α+ g(diversityj) + x′jβ + εij . (3)
Again, our main focus lies in the Inner–Outer divide and hence diversityj as the population share ofInner Island ethnic groups, but we also consider overall ethnic fractionalization in further checks. Ofcourse, the diversity levels observed 10–20 after resettlement may reflect endogenous ex post sorting ofindividuals based on their tastes for diversity.
We therefore instrument for the current Inner Island ethnic share using the number of Inner Islandtransmigrants placed in the initial year of settlement. This instrument isolates that portion of ex postdiversity due to the initial influx of settlers from the Inner Islands. In Appendix A.1, we provide evi-dence supporting the exclusion restriction that conditional on x, the number of initial transmigrants onlyaffects nation building outcomes through its effect on ethnic diversity. In particular, we show that theinstrument is uncorrelated with other measures of diversity, predetermined measures of political andeconomic development not explicitly used for site selection, and the linguistic similarity between Innerand indigenous Outer Islands groups.
26According to the 2000 Population Census, 88.2 percent of the population were Muslims, followed by Protestants (5.9 percent),Catholics (3.1 percent), Hindus (1.8 percent) and Buddhists (0.8 percent). As in the case of ethnicity, people tend to livein relatively religiously homogeneous communities. The religious fractionalization index for a median village in the OuterIslands is 0.01 compared to 0.14 for ethnic fractionalization.
15

6 Did the Transmigration Program Foster Nation Building?
This section presents a set of ATT estimates demonstrating that the Transmigration program fosteredintegration and nation building. As discussed above, policy makers viewed the program as a vehiclefor enhancing nation building by encouraging the mixing of Inner and Outer Islanders. Our results onintermarriage and national language use at home provide evidence consistent with these goals.
6.1 Intermarriage
We first present individual- and village-level impacts of the Transmigration program on intermarriageand then rule out concerns about selection biases. As noted in Section 4.2, Transmigration plannersviewed intermarriages between Inner and Outer Islanders as a key marker of program success vis-a-visthe goal of national integration. A priori, the program could increase intermarriage rates by exposingOuter Islanders to more Inner Islanders. However, at the time of implementation, there were concernsthat the large demographic changes could sharpen ethnic cleavages, leading to oppositional identitiesand even stronger assortative marriage patterns within ethnic groups. Furthermore, given the large sizeof the transmigrant influx, even in villages with a balance of Inner and Outer Islanders, migrants couldeasily marry other migrants without needing to search outside their own ethnic group.
Figure 4 presents individual-level ATT estimates for intermarriage rates. Each panel reports esti-mates of θ from equation (1), grouping individuals into five-year age bins. The reported 95 percentconfidence intervals are based on robust standard errors clustered by district, of which there are 94. Thebaseline sample in panel (a) includes 1,215,730 married individuals from the 2000 Population Census.
Across panels, the results consistently show greater intermarriage rates for younger cohorts in Trans-migration villages relative to similar cohorts in control villages. The youngest cohort (age 16–20) wasless than five years old during program implementation in the 1980s and in some cases not even bornyet. Looking across younger cohorts less than age 35, we find that intermarriage rates are around 4–5p.p. higher in Transmigration villages relative to a control mean around 3 percent. For older cohorts,these differences decline substantially. The large, differential ATT effects for the younger cohorts providereassurance that these are new marriages initiated after the program.
The subsequent panels (b)–(d) in Figure 4 show further that young natives growing up in villagesexposed to transmigrants were more likely to intermarry Inner Island ethnic groups than young nativesin almost treated villages. These remaining panels include district of birth fixed effects to ensure that weare comparing individuals hailing from similar origins. In panel (b), we restrict the sample to individualsborn in the Outer Islands and belonging to Outer Island ethnic groups. We further refine the comparisonin panel (c) by restricting the sample in (b) to only those individuals residing in the same district in whichthey were born and lived in 1995, and in panel (d) by adding individual ethnicity fixed effects. Thislatter specification helps rule out important cross-ethnicity differences in tolerance and predisposition toInner Islanders. It also helps address any remaining concern that policymakers systematically assignedtransmigrants across settlements on the basis of ethnicity.
In Table 4, we estimate the village-level version of equation (1) to identify the overall impact ofthe Transmigration program on intermarriage rates for young household heads defined based on thelocation-specific age cutoffs discussed in Section 4.2. These aggregate outcomes are based roughly on
16

individuals less than 35 in the foregoing graphs. While there are no ATT effects on the marriage rate,the ATT estimate in row 2 implies a tripling of intermarriage rates in treated villages relative to a meanof 2.3 percent in control villages. The 5 p.p. effect size is large, comparable in magnitude to differencesin intermarriage rates between primary versus junior secondary educated individuals in Indonesia’sethnically diverse and cosmopolitan capital, Jakarta.
Next, we investigate the extent to which the effects are driven by a diversity shock that expanded thesupply of Inner Islanders versus a demand-side story of changing preferences. Using two reduced formapproaches, we adjust for aggregate supply effects at the village level.27 In the last row of Table 4, weshow that the changes in intermarriages are not entirely due to supply effects. We do this by dividing theactual intermarriage rate by the average intermarriage rate from 10,000 simulations of random matchingamong the young, married population. This measure allows us to identify how much intermarriagewe observe relative to what would be expected solely from the policy-induced shock to the supply ofpotential non-coethnic partners. In the typical control village, the actual intermarriage rate is only 25.3percent of the (random) potential intermarriage rate. The ATT implies that this ratio increases by 17.7p.p. for Transmigration villages.
Additionally, the village-level specification also allows us to control flexibly for aggregate supplyeffects using linear, quadratic, or cubic terms of the random intermarriage rate as “bad controls” inthe ATT equation. The conclusions are similar; the nonlinear controls reduce the ATT to around 0.03(instead of 0.05), but the effects remain statistically significant at the 1 percent level. These reducedform adjustments imply that around two–thirds of the ATT effect for intermarriage among the youngergeneration can be explained by a change in marriage preferences.
We provide additional suggestive evidence that preferences changed in Transmigration villages us-ing subjective measures of social preferences. Appendix Table A.7 corroborates higher levels of intereth-nic tolerance in Transmigration villages by estimating ATT specifications for the proxies of individual-level tolerance from Susenas 2012 (see Section 4.2). Specifically, respondents in Transmigration villagesare more likely to be tolerant towards activities of other ethnic groups in the village and are less likely tobelieve that district leaders have to be natives from the region.
Further Checks against Selection Biases. We take additional steps to address concerns that the ATTestimates are confounded by selection biases. First, we address the potential threat that the greaterintegration outcomes in Transmigration villages are driven by tolerant, intermarried individuals whoselected into the program ex ante or endogenously migrated to Transmigration villages ex post. Impor-tantly, the differential cohort effects in Figure 4(d) remain unchanged when including a further set ofexhaustive fixed effects for years of schooling, occupation, and migration status.
Similarly, retaining the same specification as Figure 4(d), we show in Appendix Figure A.2 that thecohort-specific trends are mostly unchanged when we split the sample by gender, education, or by oc-cupation. The lack of gender-specific differences suggests that natives are not intermarrying to acquireland or resources through marriages. The similar patterns for individuals with high and low education
27This exercise treats the village as the marriage market. If we used the district as the marriage market, we would likely havesmaller supply adjustments. This is because supply effects due to the program are concentrated at the village level, and quitemuted at the district level. Therefore, supply adjustments at the village level are more conservative. It is also important tonote that the regression results in Tables 3 and 4 are robust to including all villages within 5 kilometers of Transmigrationvillage centroids. This helps rule out concerns about treatment misclassification due to noise in the underlying shapefiles.
17

suggests that intermarriage is not allowing for differential assortativity that may not be possible withinone’s own ethnic group. Finally, the similar cohort trends for individuals in trading and services oc-cupations imply that the increased intermarriage is not driven by those seeking new opportunities foreconomic exchange outside their own group.28
Next, we augment the village-level estimates to account for a host of location-specific omitted vari-ables. As detailed in Appendix A.2, the results are robust to accounting for spillovers to neighboringvillages, to including province or ethnolinguistic homeland fixed effects, and to controlling for an arrayof predetermined measures of political and economic development not explicitly used by the planners.Additionally, the ATT for Inner–Outer intermarriages is roughly similar to the ATT of 0.072 (0.011)*** forintermarriage between any ethnic groups, suggesting that most of the changes can be accounted for bythe increased mixing between Inner and Outer Island ethnic groups.
We further address concerns that the ATT effects might be confounded by a direct Transmigrationimpact on local public goods provided to new settlements as part of the program. As discussed inAppendix A.2, we find very similar results after controlling for a host of public goods at the village level.While there is an extensive literature documenting a strong relationship between ethnic diversity andpublic goods (see Alesina and LaFerrara, 2005), this is less salient in our context for a few reasons. First,our outcomes are measured in 2000 when public goods are still largely mandated and provided by higherlevels of government above the village. At the time of the program, the centralized government largelyfollowed a Village Law (introduced in 1979) that required all villages to have the same institutionalstructure, thereby ensuring that the newly created villages—both treated and control—in our study wereendowed with similar initial de jure institutions and public goods.29
Overall, the results in Figure 4 and Table 4 point to potentially significant changes in matching behav-ior within the marriage market, and these effects are not driven by supply shocks alone. Demonstratingthat preferences for and tolerance of other groups likely changed has far-reaching implications for so-cialization efforts associated with nation building.
6.2 National Language Use at Home
Beyond intermarriage, we also consider a second key nation building outcome from the 2006 Susenas,namely daily use of the Indonesian language at home. We view this outcome as primarily reflecting asocialization decision by parents to inculcate specific cultural preferences in children. Since the questionspecifically asks about which language is most frequently used at home, it is less likely that this decisionreflects purely economic motives.30 Moreover, since everyone is able to speak Indonesian, the program
28Appendix Figure A.4 shows similar differential cohort-specific trends for interethnic marriage rates including all ethnicgroups rather than just Inner versus Outer Island ethnicities. Meanwhile, Appendix Figure A.3 shows that there are nulltreatment effects across the entire age distribution for marriages in which both spouses are born in Java/Bali, consistent withthe discussion above that we are isolating marriages that formed after the program.
29Reassuringly, the village-level estimates are relatively stable across all of the above robustness checks. Based on the Oster(forthcoming) tests described in Appendix A.2, this stability suggests that selection on unobservables is unlikely to explainthe overall ATT estimates.
30One potential issue with this interpretation is that parents choose to speak the national language at home primarily as ameans of helping their children succeed in primary school, which is conducted in Indonesian. However, Beeby (1979) arguesthat even as early as the 1970s, this was not a first order concern: “It would be natural to expect students speaking BahasaIndonesia in their homes or in their communities to have an advantage in schooling and examinations in that language. Recentsystematic research on students’ achievements in four subjects in grade 6 throughout Indonesia has confirmed that constant
18

would not have had direct effects on the supply of Indonesian speakers. Hence, Indonesian use at homeat home represents a choice to integrate with those outside one’s native linguistic group and to instillnational cultural affinity among one’s children. It is also important to note that interethnic marriagerates are significantly lower than rates of national language use at home, suggesting that many coethnicspouses are choosing to socialize their children in a language besides the one native to their ethnic group.
We begin by showing that the Transmigration program increased use of the national language athome. We estimate an individual-level ATT as in equation (1) for individuals residing within 10 kilome-ters of treated or control village boundaries based on the 2006 Susenas sample of villages. We expand thetreatment and control areas beyond the Transmigration and RDA village boundaries in order to increasethe number of village observations given the limited survey sampling frame.31
Table 5 reports the impact of the Transmigration program on language use at home. Each cell is aseparate ATT estimate where the dependent variable is an indicator for whether the individual’s primarydaily language at home is Indonesian (column 1), native to Inner Islands ethnicities (column 2), or nativeto Outer Islands ethnicities (column 3). The baseline specification in row 1 shows that individuals inTransmigration areas are 25 p.p. more likely to report Indonesian as their primary daily language relativeto the control area mean of 12 percent. Columns 2 and 3 show that the increased national language use isdriven by switches from the respective mother tongues. As in the intermarriage results presented above,most of these overall changes in language use are due to differential rates of Indonesian use amongOuter Islanders living in Transmigration areas relative to their co-ethnics living in control areas.32
The remaining rows of Table 5 show that these results are robust to accounting for several individual-and village-level confounders. First, controlling for basic demographics and dummies for years ofschooling (row 2) leaves the ATT estimates unchanged as does restricting to those less than the me-dian age of 40 (row 3). These specifications rule out concerns about cohort composition effects andexposure to Bahasa Indonesia in primary school. Second, although individuals in certain occupationsare more inclined to use Indonesian on a daily basis, the main ATTs are robust to controlling for 17 ex-haustive occupation dummies (row 4), and to controlling for household expenditures per capita (row 5).Although perhaps jointly determined with language decisions (and due to the Transmigration program),these controls help rule out potential channels through which the program hastened the diffusion of thenational language at home. Additionally, the effects cannot be explained by differential ease of speakingIndonesian as seen in rows 6 and 7, which control for linguistic similarity between the local indigenouslanguage and Malay (the root of Indonesian).
The results presented so far in Table 5 suggest that some of the increased Indonesian use could beexplained by the Transmigration program’s impact on ethnic diversity. In row 8, we provide sugges-tive evidence supporting this interpretation. In particular, controlling for a quadratic in the Inner Islandethnic share in 2000 effectively reduces the ATT to zero. This finding motivates a more rigorous inves-
or frequent use of Bahasa Indonesia in the home does give some advantage to students at this level; but the difference betweenthem and the rest is much less that one might have expected. The advantage is, naturally, greatest in the language test, butdisappears in the tests on mathematics and science.”
31The spatial demographic spillovers presented in Appendix A.2 further support this expanded definition of treatment. Thesurvey covers a random sample of around 15–20 percent of villages. The samples are drawn proportional to district popula-tion size, and because Transmigration and RDA sites are in underdeveloped areas, they tend to be undersampled relative toa simple random draw of villages.
32Restricting the ATT estimates to Outer Islanders, we find that those in Transmigration areas are 27 p.p. more likely to reportnative Indonesian relative to those in control areas (10 percent of whom report Indonesian) as their primary daily one.
19

tigation of how language use at home is shaped by relative group sizes and one’s relationship to themajority group.
7 Diversity, Socialization, and Identity Choices
Despite the mass immigration of Inner Island ethnic groups, we find little evidence of long-term so-cial disintegration in the Outer Islands as a result of the Transmigration program. Instead, the ATTestimates presented so far suggest that the resettlement process facilitated integration, contributing tonation building. In this section, we enrich this characterization by exploring how diversity shapes the in-centives to integrate. Crucially, we are able to leverage the large scale of the program and the continuumof policy-induced diversity to identify potentially nonlinear effects arising from social externalities.
7.1 Diversity and Language Use At Home
In this section, we exploit the variation in ethnic diversity within Transmigration areas to identify howrelative group sizes affect diffusion of the use of the national language at home. In order to capturenonlinear relationships between local diversity and home language use, we estimate a semiparametric,partially linear version of equation (3) using the approach due to Robinson (1988). The estimates arerestricted to all individuals residing in villages less than 10 km from a Transmigration village. We use alocal linear (probability) estimator with the Fan and Gijbels (1996) rule-of-thumb (optimal) bandwidthand an Epanechnikov kernel, but results are similar using other specifications.
Figure 5 reveals a significant inverted U relationship between use of the national language at homeand the share of Inner Island ethnicities. The fraction of the population speaking Indonesian at homeincreases in the proportion of Inner Island natives residing in the village but starts to decline after 40percent. The parametric test due to Lind and Mehlum (2010) suggests that this inverted U shape isstatistically significant at the 1 percent level. Moreover, based on the Hardle and Mammen (1993) test,we cannot reject the null hypothesis of a quadratic parametric shape.33
Furthermore, the inverted U shape in Figure 5 is robust to the instrumental variables approach out-lined in Section 5.3 that accounts for potential endogeneity in diversity. In particular, we instrument theInner Island ethnic share in village j with the number of transmigrants placed from 1979–88 within 10 kmof j. We capture nonlinearities by allowing g(·) in equation (3) to have a flexible parametric functionalform in the form of quadratic or terciles of diversity. Similar results are found using a semiparametric IVcontrol function approach developed in Su and Ullah (2008) (see Appendix A.3).
Table 6 reports flexible parametric specifications of the IV regression. The result in column 1 is theparametric version of the corresponding partially linear results in Figure 5 on which the turning pointcalculation is based. In column 2, we approximate a nonlinear first stage by using 30 dummy variables
33The inverted U is even more stark when expanding the settlement catchment area to 20 or 30 km, at which point we still finda significant Inner Island ethnic population due to the program (see Appendix Figure A.7). Regardless of the catchment area,the turning point is close to the 50 percent threshold where diversity is maximized based on this two group measure. Mean-while, Appendix Figure A.8 shows that this positive relationship between diversity and national language use generalizes tothe measure of overall ethnic fractionalization. In this case, individuals in the most fractionalized villages are most likely toemploy Indonesian on a daily basis. The sharpest increase occurs in villages where there is more than a 50 percent chance ofencountering a non-coethnic neighbor.
20

with equal numbers of villages along the continuum of the number of initial transmigrants. These instru-ments provide a relatively strong first stage as reflected in the Kleibergen and Paap (2006) and Sandersonand Windmeijer (2016) Wald statistics.34 We use generalized method of moments (GMM) to account forthe many instruments and find slightly larger point estimates on both the linear and quadratic terms.However, the turning point only slightly increases to around 0.44, suggesting that there is less of a differ-ence in the implied inverted U shape. Columns 4 and 5 pursue analogous specifications based on tercilesof the Inner Island ethnic share, and the patterns are very similar with peak Indonesian use at home inthe middle tercile and indistinguishable usage between the bottom and top tercile.35
Across all specifications, we consistently find greater national language use in places with nearlyequal mixes. The turning point (40 percent) is also relatively high compared to other nonlinear estimatesof social choices.36 While exposure to diverse groups increases the potential opportunities for and ben-efits from integrating, once the group sizes reach a certain scale, segregation preferences may dominateintegration forces as individuals have enough own-group members with whom to interact. The strongerintegration outcomes in the middle tercile of Inner Island ethnic share are consistent with our finding ofstronger national affinity and weaker segregation forces.
Additionally, in Appendix A.3, we further clarify the drivers of this inverted U by presenting resultsseparately for native Inner and Outer Islanders. With multiple languages and no clear majority, thepresence of a shared national language in the middle tercile can serve as a coordination tool for disparategroups to connect with each other. However, in places where there is a clear majority, we see that Innerand Outer Island minorities adopt the majority group’s language, which is also consistent with weakerethnic attachment. These patterns are consistent with a generalization of the Lazear (1999) model oflanguage adoption to a setting with multiple native languages and a single national language.
Table 6 provides additional policy-relevant insights by showing that residential mixing fosters na-tional language diffusion above and beyond overall ethnic diversity. In particular, columns 3 and 6 aug-ment the IV specifications with a control for the residential segregation between Inner and Outer Islandgroups within the village.37 The isolation index enters negatively with the estimated effects pointingto significantly lower national language use at home in villages where Inner and Outer Islanders aremore segregated across census blocks. A one standard deviation increase in isolation is associated withroughly 4-8 p.p. lower Indonesian use relative to a mean of 25 percent. These results are consistent withclaims in Desmet et al. (2016) about the potentially differential effects of local (here, census block) and
34Instrumenting with a smaller number of bins≥10 yields very similar albeit slightly noisier results. Moreover, based on theHansen (1982) test, we cannot reject the null hypothesis that the instruments are uncorrelated with the error term and correctlyexcluded from the second stage. Coupled with the rejection of the null under the Anderson and Rubin (1949) test (that thecoefficients on the endogenous variables jointly equal zero and the overidentifying restrictions are valid), these diagnosticspoint to a fairly well-specified IV model.
35All results in this table are further robust to the inclusion of fixed effects for the ethnolinguistic homelands native to eachvillage in the sample (see Appendix Table A.5). Additionally, Appendix Table A.6 presents parametric IV estimates foroverall ethnic fractionalization corresponding to the OLS results in Appendix Figure A.8.
36For example, in the context of immigration into the United States during the 19th and early 20th century, Advani and Reich(2015) estimate tipping points for intermarriage and English language use ranging from 20 percent to 35 percent.
37Although potentially endogenous, residential segregation is quite persistent and due in large part to the initial lottery assign-ments across housing and farming units. The isolation index for households headed by older and younger individuals (asdefined for marriage cohorts in Section 6.1) are correlated at around 0.95, which is consistent with the fact that many childrenexpand into plots adjacent to their parents when forming their own households in rural areas. We find nearly unchangedresults when instrumenting the overall isolation index with the isolation index among the older cohort of Java/Bali-borntransmigrants that plausibly formed the initial households.
21
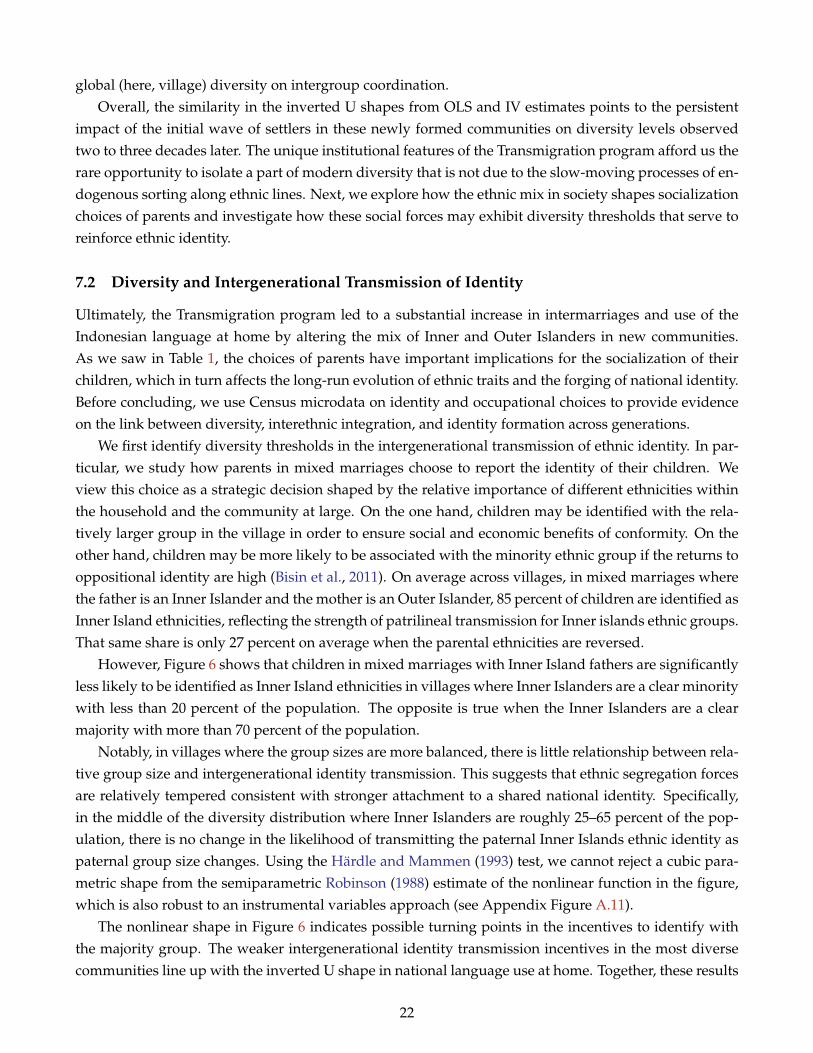
global (here, village) diversity on intergroup coordination.Overall, the similarity in the inverted U shapes from OLS and IV estimates points to the persistent
impact of the initial wave of settlers in these newly formed communities on diversity levels observedtwo to three decades later. The unique institutional features of the Transmigration program afford us therare opportunity to isolate a part of modern diversity that is not due to the slow-moving processes of en-dogenous sorting along ethnic lines. Next, we explore how the ethnic mix in society shapes socializationchoices of parents and investigate how these social forces may exhibit diversity thresholds that serve toreinforce ethnic identity.
7.2 Diversity and Intergenerational Transmission of Identity
Ultimately, the Transmigration program led to a substantial increase in intermarriages and use of theIndonesian language at home by altering the mix of Inner and Outer Islanders in new communities.As we saw in Table 1, the choices of parents have important implications for the socialization of theirchildren, which in turn affects the long-run evolution of ethnic traits and the forging of national identity.Before concluding, we use Census microdata on identity and occupational choices to provide evidenceon the link between diversity, interethnic integration, and identity formation across generations.
We first identify diversity thresholds in the intergenerational transmission of ethnic identity. In par-ticular, we study how parents in mixed marriages choose to report the identity of their children. Weview this choice as a strategic decision shaped by the relative importance of different ethnicities withinthe household and the community at large. On the one hand, children may be identified with the rela-tively larger group in the village in order to ensure social and economic benefits of conformity. On theother hand, children may be more likely to be associated with the minority ethnic group if the returns tooppositional identity are high (Bisin et al., 2011). On average across villages, in mixed marriages wherethe father is an Inner Islander and the mother is an Outer Islander, 85 percent of children are identified asInner Island ethnicities, reflecting the strength of patrilineal transmission for Inner islands ethnic groups.That same share is only 27 percent on average when the parental ethnicities are reversed.
However, Figure 6 shows that children in mixed marriages with Inner Island fathers are significantlyless likely to be identified as Inner Island ethnicities in villages where Inner Islanders are a clear minoritywith less than 20 percent of the population. The opposite is true when the Inner Islanders are a clearmajority with more than 70 percent of the population.
Notably, in villages where the group sizes are more balanced, there is little relationship between rela-tive group size and intergenerational identity transmission. This suggests that ethnic segregation forcesare relatively tempered consistent with stronger attachment to a shared national identity. Specifically,in the middle of the diversity distribution where Inner Islanders are roughly 25–65 percent of the pop-ulation, there is no change in the likelihood of transmitting the paternal Inner Islands ethnic identity aspaternal group size changes. Using the Hardle and Mammen (1993) test, we cannot reject a cubic para-metric shape from the semiparametric Robinson (1988) estimate of the nonlinear function in the figure,which is also robust to an instrumental variables approach (see Appendix Figure A.11).
The nonlinear shape in Figure 6 indicates possible turning points in the incentives to identify withthe majority group. The weaker intergenerational identity transmission incentives in the most diversecommunities line up with the inverted U shape in national language use at home. Together, these results
22
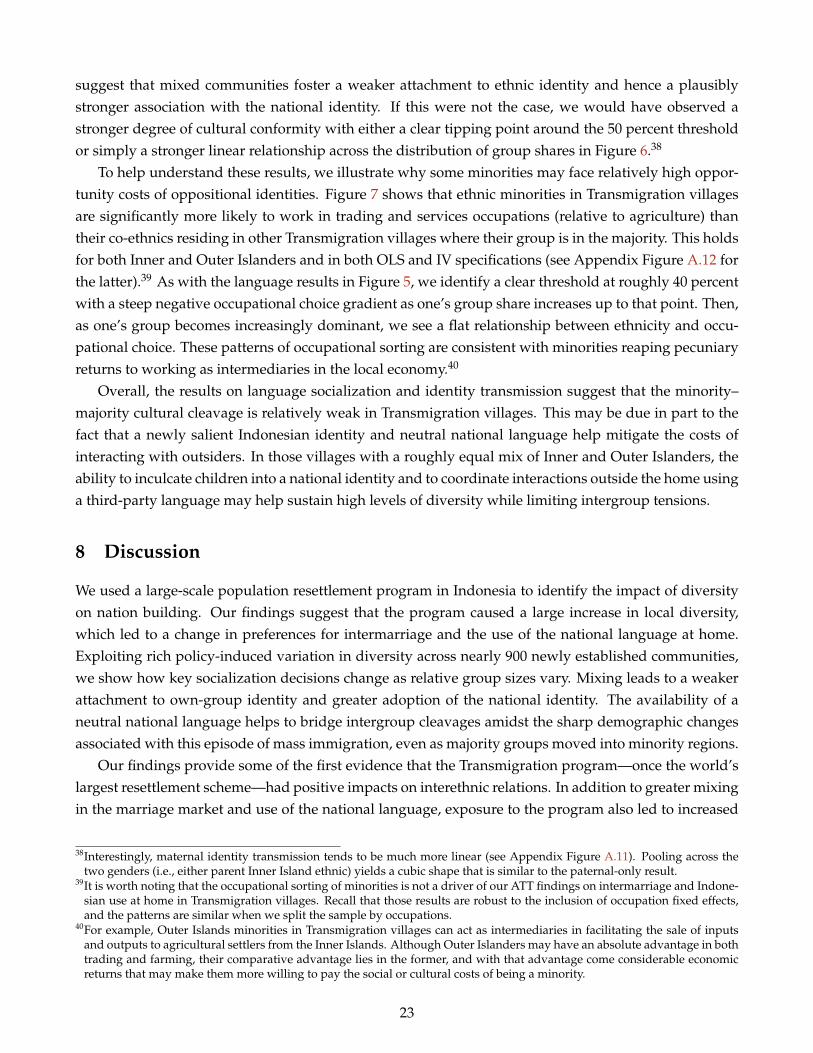
suggest that mixed communities foster a weaker attachment to ethnic identity and hence a plausiblystronger association with the national identity. If this were not the case, we would have observed astronger degree of cultural conformity with either a clear tipping point around the 50 percent thresholdor simply a stronger linear relationship across the distribution of group shares in Figure 6.38
To help understand these results, we illustrate why some minorities may face relatively high oppor-tunity costs of oppositional identities. Figure 7 shows that ethnic minorities in Transmigration villagesare significantly more likely to work in trading and services occupations (relative to agriculture) thantheir co-ethnics residing in other Transmigration villages where their group is in the majority. This holdsfor both Inner and Outer Islanders and in both OLS and IV specifications (see Appendix Figure A.12 forthe latter).39 As with the language results in Figure 5, we identify a clear threshold at roughly 40 percentwith a steep negative occupational choice gradient as one’s group share increases up to that point. Then,as one’s group becomes increasingly dominant, we see a flat relationship between ethnicity and occu-pational choice. These patterns of occupational sorting are consistent with minorities reaping pecuniaryreturns to working as intermediaries in the local economy.40
Overall, the results on language socialization and identity transmission suggest that the minority–majority cultural cleavage is relatively weak in Transmigration villages. This may be due in part to thefact that a newly salient Indonesian identity and neutral national language help mitigate the costs ofinteracting with outsiders. In those villages with a roughly equal mix of Inner and Outer Islanders, theability to inculcate children into a national identity and to coordinate interactions outside the home usinga third-party language may help sustain high levels of diversity while limiting intergroup tensions.
8 Discussion
We used a large-scale population resettlement program in Indonesia to identify the impact of diversityon nation building. Our findings suggest that the program caused a large increase in local diversity,which led to a change in preferences for intermarriage and the use of the national language at home.Exploiting rich policy-induced variation in diversity across nearly 900 newly established communities,we show how key socialization decisions change as relative group sizes vary. Mixing leads to a weakerattachment to own-group identity and greater adoption of the national identity. The availability of aneutral national language helps to bridge intergroup cleavages amidst the sharp demographic changesassociated with this episode of mass immigration, even as majority groups moved into minority regions.
Our findings provide some of the first evidence that the Transmigration program—once the world’slargest resettlement scheme—had positive impacts on interethnic relations. In addition to greater mixingin the marriage market and use of the national language, exposure to the program also led to increased
38Interestingly, maternal identity transmission tends to be much more linear (see Appendix Figure A.11). Pooling across thetwo genders (i.e., either parent Inner Island ethnic) yields a cubic shape that is similar to the paternal-only result.
39It is worth noting that the occupational sorting of minorities is not a driver of our ATT findings on intermarriage and Indone-sian use at home in Transmigration villages. Recall that those results are robust to the inclusion of occupation fixed effects,and the patterns are similar when we split the sample by occupations.
40For example, Outer Islands minorities in Transmigration villages can act as intermediaries in facilitating the sale of inputsand outputs to agricultural settlers from the Inner Islands. Although Outer Islanders may have an absolute advantage in bothtrading and farming, their comparative advantage lies in the former, and with that advantage come considerable economicreturns that may make them more willing to pay the social or cultural costs of being a minority.
23

tolerance for other ethnic groups both as neighbors and as leaders. While our findings seemingly contra-dict longstanding views of the program among activists and social scientists, the results are consistentwith a recent reappraisal of the program by Barter and Cote (2015) who argue that the state-sponsoredTransmigration communities were not associated with the salient conflicts between Inner and Outer Is-landers that erupted in the late 1990s. Their extensive fieldwork and revisionist account complementour results and provide a strong counterpoint to claims that the program was a quintessential exampleof how state-sponsored migration can stoke “sons of the soil” conflict.
Beyond Indonesia, the greater interethnic integration that we identify is important given that recentwork by Ashraf and Galor (2013) and Alesina et al. (2016a) documents potential economic benefits ofdiversity that may go unrealized if sociocultural concerns preclude efforts to foster greater diversity(Borjas, 2016). Indeed, our findings suggest that the link between (longstanding) ethnic diversity andconflict (see Esteban et al., 2012) may be amenable to policy. Our findings underscore the importance ofa shared national identity to unite diverse groups and a common national language that can coordinateand connect multiple groups. Important avenues for future research include studies of other aspectsof nation building policies. Should governments promote the use of a national language used by themajority group or a national language that is more neutral? Also, what are the implications for otheroutcomes such as voting, civic capital, and public good provision?
From a policy perspective, the changes in marriage and language use that we observe have impor-tant implications for nation building given the social spillovers across generations. It is precisely thesort of intergenerational multipliers that we saw in the IFLS results in Section 4.2 that can help sustainhigh levels of local diversity over time. Although small, these mixed communities may in turn mat-ter for aggregate policy outcomes in light of recent work linking ethnic segregation to adverse politicaland economic outcomes even after accounting for differences in diversity at higher levels of aggrega-tion. Moreover, even though the early settlers in Transmigration communities constituted a relativelysmall share of Indonesia’s population, it is possible that their impacts on subsequent social and culturaldevelopment in these formerly frontier areas were quite sizable in the long-run.41
Resettlement programs are already found in many countries, and they are growing in importanceglobally as climate change, infrastructure development, and conflict continue to displace millions (seeBazzi et al., 2016, for a discussion). Our findings may offer guidance on the potential conditions in whichethnic diversity, as influenced by resettlement programs, can be harnessed for improved social outcomes.Important directions for future research include further investigation on the role of spatial segregationof settlers, the relative sizes of migrants and natives, the role of language in accelerating integration, andthe importance of ethnic (in)equality in access to resources.
41Zelinsky (1973) formalizes this possibility in his “doctrine of first effective settlement,” which asserts that “Whenever anempty territory undergoes settlement [. . .] the specific characteristics of the first group able to effect a viable, self-perpetuatingsociety are of crucial significance for the later social and cultural geography of the area, no matter how tiny the initial bandof settlers may have been.” This notion of persistence is consistent with a growing body of economic research on culture(see Alesina and Giuliano, 2015; Bisin and Verdier, 2011) and, specifically, recent work on the formation of unique features ofAmerican culture in its frontier areas historically (Bazzi et al., 2017).
24

References
Abramitzky, R., L. P. Boustan, and K. Eriksson, “Cultural Assimilation during the Age of Mass Migra-tion,” Working Paper, 2015.
Advani, A. and B. Reich, “Melting pot or salad bowl: The formation of heterogeneous communities,”Technical Report, Institute for Fiscal Studies 2015.
Alesina, A. and B. Reich, “Nation Building,” Unpublished Manuscript, 2015.
and E. LaFerrara, “Ethnic Diversity and Economic Performance,” Journal of Economic Literature,September 2005, 43 (3), 762–800.
and E. Zhuravskaya, “Segregation and the Quality of Government in a Cross-Section of Countries,”American Economic Review, 2011, 101, 1872–1911.
and P. Giuliano, “Culture and Institutions,” Journal of Economic Literature, 2015, 53 (4), 898–944.
, J. Harnoss, and H. Rapoport, “Birthplace Diversity and Economic Prosperity,” Journal of EconomicGrowth, 2016, 21 (2), 101–138.
, S. Michalopoulos, and E. Papaioannou, “Ethnic Inequality,” Journal of Political Economy, 2016, 124(2), 428–488.
Algan, Y., C. Hemet, and D. D. Laitin, “The social effects of ethnic diversity at the local level: A naturalexperiment with exogenous residential allocation,” Journal of Political Economy, forthcoming.
Alisjahbana, S. T., Indonesian language and literature: Two essays, Yale University, Southeast Asia Studies,1962.
Allport, G. W., “The nature of prejudice,” 1954.
Altonji, Joseph G., Todd E. Elder, and Christopher R. Taber, “Selection on Observed and UnobservedVariables: Assessing the Effectiveness of Catholic Schools,” Journal of Political Economy, 2005, 113 (1),151–184.
Ananta, A., E. N. Arifin, and L. Suryadinata, Indonesian electoral behaviour: a statistical perspective numberno. 2. In ‘Indonesia’s population series.’, Singapore: Institute of Southeast Asian Studies, 2004.
, , M. S. Hasbullah, N. B. Handayani, and A. Pramono, “Changing ethnic composition: Indonesia,2000-2010,” in “XXVII IUSSP International Population Conference” 2013, pp. 26–31.
Anderson, T. W. and H. Rubin, “Estimation of the parameters of a single equation in a complete systemof stochastic equations,” The Annals of Mathematical Statistics, 1949, 20 (1), 46–63.
Ashraf, Q. and O. Galor, “The “Out of Africa” Hypothesis, Human Genetic Diversity, and ComparativeEconomic Development,” The American Economic Review, 2013, 103 (1), 1–46.
Aspinall, E., “Place and Displacement in the Aceh Conflict,” in Eva-Lotta E. Hedman, ed., Conflict, vio-lence, and displacement in indonesia, number no. 45. In ‘Studies on Southeast Asia.’, Ithaca, N.Y: South-east Asia Program, Cornell University, 2008.
Babcock, T., “Transmigration as a regional development strategy,” in C. MacAndrews, ed., Central Gov-ernment and Local Development in Indonesia, Oxford: Oxford University Press, 1986.
Bandiera, O., M. Mohnen, I. Rasul, and M. Viarengo, “Nation-Building Through Compulsory School-ing During the Age of Mass Migration,” Unpublished Manuscript, 2015.
Barter, S. J. and I. Cote, “Strife of the soil? Unsettling transmigrant conflicts in Indonesia,” Journal ofSoutheast Asian Studies, 2015, 46 (1), 60–85.
Bazzi, S., A. Gaduh, A. Rothenberg, and M. Wong, “Skill Transferability, Migration, and Development:Evidence from Population Resettlement in Indonesia,” American Economic Review, 2016, 106 (9), 2658–
25

2698.
and M. Gudgeon, “Local Government Proliferation, Diversity, and Conflict,” Unpublished Manuscript,2016.
, M. Fiszbein, and M. Gebresilasse, “Cultural Persistence: The History and Legacy of the AmericanFrontier,” Unpublished Manuscript, 2017.
Bazzi, Samuel and Christopher Blattman, “Economic Shocks and Conflict: Evidence from CommodityPrices,” American Economic Journal: Macroeconomics, 2014, 6, 1–38.
Beeby, C. E., Assessment of Indonesian education: a guide in planning number no. 59. In ‘Education researchseries.’, Wellington: New Zealand Council for Educational Research, 1979.
Bell, M. and E. Charles-Edwards, “Cross-national comparisons of internal migration: An update ofglobal patterns and trends,” 2013.
Bell, W., “A probability model for the measurement of ecological segregation,” Social Forces, 1954, 32 (1),357–364.
Bertrand, Jacques, Nationalism and ethnic conflict in Indonesia, Cambridge, UK; New York: CambridgeUniversity Press, 2004.
Bisin, A. and T. Verdier, “The Economics of Cultural Transmission and Socialization,” in Jess Benhabib,Alberto Bisin, and Matthew O. Jackson, eds., Handbook of Social Economics, Volume 1, Part A, Elsevier,2011, pp. 339–416.
, E. Patacchini, T. Verdier, and Y. Zenou, “Are Muslim Immigrants Different In Terms of CulturalIntegration?,” Journal of the European Economic Association, 2008, 6 (2-3), 445–456.
, , , and , “Formation and persistence of oppositional identities,” European Economic Review,2011, 55 (8), 1046–1071.
Blouin, A. and S. Mukand, “Erasing Ethnicity? Nation Building, (Mis)Trust and the Salience of Identityin Rwanda,” Unpublished Manuscript, 2016.
Borjas, G., We Wanted Workers: Unraveling the Immigration Narrative, W.W. Norton & Company, 2016.
Charras, M. and M. Pain, Spontaneous settlements in Indonesia: agricultural pioneers in Southern Sumatra,Jakarta and Bondy, France: Departemen Transmigrasi ; Institut francais de recherche scientifique pourle developpement en cooperation : Centre national de la recherche scientifique, 1993.
Clauss, W., H.-D. Evers, and S. Gerke, “The Formation of A Peasant Society: Javanese Transmigrants inEast Kalimantan,” Indonesia, 1988, (46), 79–90.
Conley, T. G., “GMM Estimation with Cross Sectional Dependence,” Journal of Econometrics, 1999, 92,1–45.
Cutler, D. M., E. L. Glaeser, and J. L. Vigdor, “When are ghettos bad? Lessons from immigrant segrega-tion in the United States,” Journal of Urban Economics, 2008, 63, 759–774.
Dahlberg, M., K. Edmark, and H. Lundqvist, “Ethnic Diversity and Preferences for Redistribution,”Journal of Political Economy, 2012, 120 (1), 41–76.
Desmet, K., J. Gomes, and I. Ortuno-Ortın, “The geography of linguistic diversity and the provision ofpublic goods,” Unpublished Manuscript, 2016.
Duflo, E., “Schooling and Labor Market Consequences of School Construction in Indonesia: Evidencefrom an Unusual Policy Experiment,” American Economic Review, 2001, 91 (4), 795–813.
Easterly, W. and R. Levine, “Africa’s Growth Tragedy: Policies and Ethnic Divisions,” Quarterly Journalof Economics, 1997, 112 (4), 1203–1250.
26

Edin, P.A., P. Fredriksson, and O. Aslund, “Ethnic Enclaves and the Economic Success of Immigrants–Evidence from a Natural Experiment,” Quarterly Journal of Economics, 2003, 118 (1), 329–357.
Esteban, J., L. Mayoral, and D. Ray, “Ethnicity and Conflict: An Empirical Study,” American EconomicReview, 2012, 102 (4), 1210–1342.
Fan, J. and I. Gijbels, Local polynomial modelling and its applications: monographs on statistics and appliedprobability 66, Vol. 66, CRC Press, 1996.
Fearon, J. D., “Ethnic and Cultural Diversity by Country,” Journal of Economic Growth, 2003, 8 (2), 195–222.
and D. D. Laitin, “Sons of the soil, migrants, and civil war,” World Development, 2011, 39, 199–211.
Feith, H., The decline of constitutional democracy in Indonesia, 1st equinox ed ed., Jakarta: Equinox Pub,1962/2007.
Frey, W. H., “Diversity spreads out: Metropolitan shifts in Hispanic, Asian, and Black populations since2000,” Living Cities Census Series, 2006, pp. 1–28.
Friend, T., Indonesian Destinies, Harvard University Press, 2009.
Glennerster, R., E. Miguel, and A. Rothenberg, “Collective action in diverse Sierra Leone communi-ties,” The Economic Journal, 2013, 123 (568), 285–316.
Gordon, M. M., Assimilation in American life: The role of race, religion, and national origins, New York:Oxford University Press, 1964.
Hansen, L. P., “Large Sample Properties of Generalized Method of Moments Estimators,” Econometrica,1982, 50 (4), 1029–1054.
Hanson, G. and C. McIntosh, “Is the Mediterranean the New Rio Grande? US and EU ImmigrationPressures in the Long Run,” The Journal of Economic Perspectives, 2016, 30 (4), 57–81.
Hardjono, J., “The Indonesian Transmigration Program in Historical Perspective,” International Migra-tion, 1988, 26 (4), 427–439.
Hardle, W. and E. Mammen, “Comparing nonparametric versus parametric regression fits,” Annals ofStatistics, 1993, 21 (4), 1926–1947.
Henderson, D. J. and C. F. Parmeter, Applied Nonparametric Econometrics, Cambridge University Press,2015.
Hoey, Brian A., “Nationalism in Indonesia: Building Imagined and Intentional Communities ThroughTransmigration,” Ethnology, 2003, 42 (2), 109–126.
Hoshour, C. A., “Resettlement and the Politicization of Ethnicity in Indonesia,” Bijdragen tot de Taal-Land-en Volkenkunde, 1997, (4de Afl), 557–576.
Jia, R. and T. Persson, “Individual vs. Social Motives in Identity Choice: Theory and Evidence fromChina,” 2015.
Kebschull, D., Transmigration in Indonesia: An Empirical Analysis of Motivation, Expectations and Experi-ences, Hamburg, Germany: Transaction Publishers, 1986.
Kleibergen, F. and R. Paap, “Generalized reduced rank tests using the singular value decomposition,”Journal of Econometrics, 2006, 133 (1), 97–126.
Kline, P. M., “Oaxaca-Blinder as a Reweighting Estimator,” American Economic Review: Papers & Proceed-ings, 2011, 101 (3), 532–537.
and E. Moretti, “Local Economic Development, Agglomeration Economies and the Big Push: 100Years of Evidence from the Tennessee Valley Authority,” Quarterly Journal of Economics, 2014, 129,
27

275–331.
Laitin, D. and R. Ramachandran, “Linguistic Diversity, Official Language Choice and Nation Building:Theory and Evidence,” Unpublished Manuscript, 2015.
Lazear, E., “Culture and Language,” Journal of Political Economy, 1999, 107, s95–s126.
Levang, P., “Tanah sabrang (la terre d’en face) la transmigration en indonesie: permanence d’une poli-tique agraire contrainte.” PhD dissertation, Ensa Montpellier 1995.
Lewis, M. P., G. F. Simons, and C. D. Fennig, “Ethnologue: Languages of the world, 16th edition,” SILInternational, 2009.
Lind, J. T. and H. Mehlum, “With or without U? the Appropriate Test for a U-Shaped Relationship,”Oxford Bulletin of Economics and Statistics, 2010, 72 (1), 109–118.
Lleras-Muney, A. and A. Shertzer, “Did the Americanization Movement Succeed? An Evaluation of theEffect of English-Only and Compulsory Schooling Laws on Immigrants,” American Economic Journal:Economic Policy, 2015, 7 (3), 258–290.
Lochner, L. and E. Moretti, “Estimating and testing models with many treatment levels and limitedinstruments,” Review of Economics and Statistics, 2015, 97 (2), 387–397.
MacAndrews, C., “Transmigration in Indonesia: Prospects and Problems,” Asian Survey, 1978, 18, 458–472.
Mangunrai, H., “Evaluation of the development of transmigration in South Sulawesi: a study on the in-tegration between the transmigrants and natives in the transmigration area of Luwu South Sulawesi,”SEAPRAP Research Reports, 1977, (27).
Martinez-Bravo, M., “The Local Political Economy Effects of School Construction in Indonesia,” Ameri-can Economic Journal: Applied Economics, 2017, 9 (2), 256–289.
Michalopoulos, S., “The Origins of Ethnolinguistic Diversity,” American Economic Review, 2012, 102,1508–1539.
Miguel, E., “Tribe or Nation?: Nation Building and Public Goods in Kenya versus Tanzania,” WorldPolitics, 2004, 56 (3), 327–362.
Mulder, N., Inside Indonesian society: cultural change in Java, Amsterdam: Pepin Press, 1996.
Nababan, P. W. J., “Language in Education: The Case of Indonesia,” International Review of Education/ Internationale Zeitschrift fur Erziehungswissenschaft / Revue Internationale de l’Education, 1991, 37 (1),115–131.
Nix, E. and N. Qian, “The Fluidity of Race: ‘Passing’ in the United States, 1880-1940,” 2015. NBERWorking Paper No. 20828.
Okunogbe, O., “Does Exposure to Other Ethnic Groups Promote National Integration? Evidence fromNigeria,” Unpublished Manuscript, 2015.
Oster, Emily, “Unobservable selection and coefficient stability: Theory and validation,” Journal of Busi-ness and Economic Statistics, forthcoming.
Paauw, S., “One land, one nation, one language: An analysis of Indonesia’s national language policy,”University of Rochester Working Papers in the Language Sciences, 2009, 5 (1), 2–16.
Putnam, R. D., “E pluribus unum: Diversity and community in the twenty-first century the 2006 JohanSkytte Prize Lecture,” Scandinavian Political Studies, 2007, 30 (2), 137–174.
Ray, D. and J. Esteban, “Conflict and Development,” Annual Review of Economics, 2017, 9 (1).
Reid, A., “Political “tradition” in Indonesia: the one and the many,” Asian Studies Review, 1998, 22 (1),
28
23–38.
Ricklefs, M. C., A history of modern Indonesia since c. 1200, 4th ed ed., Stanford, Calif: Stanford UniversityPress, 2008.
Rigg, J., Southeast Asia (Routledge Revivals): A Region in Transition, Routledge, 2013.
Robinson, P. M., “Root-N-consistent Semiparametric Regression,” Econometrica, 1988, 56 (4), 931–954.
Sanderson, E. and F. Windmeijer, “A weak instrument F-test in linear IV models with multiple endoge-nous variables,” Journal of Econometrics, 2016, 190 (2), 212–221.
Schelling, T. C., “Dynamic models of segregation,” Journal of Mathematical Sociology, 1971, 1 (2), 143–186.
Sneddon, J.N., The Indonesian Language: Its History and Role in Modern Society, University of New SouthWales Press, 2003.
Su, L. and A. Ullah, “Local polynomial estimation of nonparametric simultaneous equations models,”Journal of Econometrics, 2008, 144 (1), 193–218.
Suryadinata, L., “Government Policy and National Integration in Indonesia,” Asian Journal of Social Sci-ence, January 1988, 16 (1), 111–131.
Thornton, D. L., “Javanization of Indonesian politics,” 1972.
Weiner, M., Sons of the soil: Migration and ethnic conflict in India, Princeton University Press Princeton,1978.
Wong, M., “Estimating ethnic preferences using ethnic housing quotas in Singapore,” The Review ofEconomic Studies, 2013, 80 (3), 1178–1214.
World Bank, Indonesia: The Transmigration Program in Perspective 1988.
Wright, S., Language policy and language planning: from nationalism to globalisation, 2nd edition ed., Bas-ingstoke: Palgrave Macmillan, 2016.
Zelinsky, W., The Cultural Geography of the United States, Pearson Education, Limited, 1973.
29

Figures
Figure 1: Transmigration Flows and Oil Prices
oil price
transmigrants
Study Period
0
100
200
300
400
tran
smig
rant
s pl
aced
(00
0s)
0
50
100
150
200
wor
ld o
il pr
ice
(200
0=10
0)
1965 1970 1975 1980 1985 1990 1995
Notes: Authors’ calculations from Transmigration Census data. The oil price index is from Bazzi and Blattman (2014). Thedark gray vertical lines correspond to our study period. This figure is also reported in Bazzi et al. (2016).
30

Figure 2: Map of Transmigration and Control Villages
Notes: Each colored location on the map corresponds to a Transmigration village or a control (Recommended Development) village. The white areas outlined in greyare neither Transmigration nor control villages.
31

Figure 3: Transmigration and a Persistent Continuum of Diverse Communities
0
1
2
3
4
5
kern
el d
ensit
y
0 .2 .4 .6 .8 1ethnic fractionalization
Transmigration VillageControl Village (RDA)All Villages >30 km from Transmigration Village
Notes: This figure plots the kernel density of ethnic fractionalization in 2000 for Transmigration villages, control villages,and all villages greater than 30 kilometers from the boundaries of Transmigration villages. For all three densities, weemploy an Epanechnikov kernels and rule-of-thumb bandwidth.
32
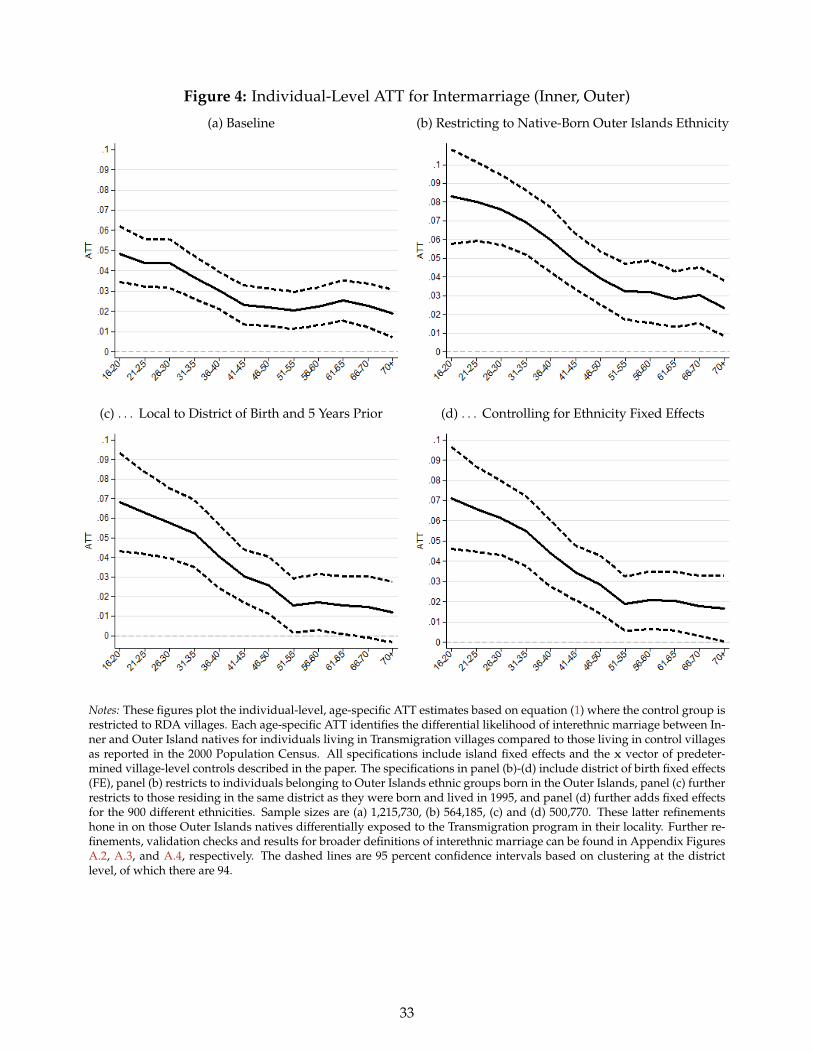
Figure 4: Individual-Level ATT for Intermarriage (Inner, Outer)
(a) Baseline (b) Restricting to Native-Born Outer Islands Ethnicity
(c) . . . Local to District of Birth and 5 Years Prior (d) . . . Controlling for Ethnicity Fixed Effects
Notes: These figures plot the individual-level, age-specific ATT estimates based on equation (1) where the control group isrestricted to RDA villages. Each age-specific ATT identifies the differential likelihood of interethnic marriage between In-ner and Outer Island natives for individuals living in Transmigration villages compared to those living in control villagesas reported in the 2000 Population Census. All specifications include island fixed effects and the x vector of predeter-mined village-level controls described in the paper. The specifications in panel (b)-(d) include district of birth fixed effects(FE), panel (b) restricts to individuals belonging to Outer Islands ethnic groups born in the Outer Islands, panel (c) furtherrestricts to those residing in the same district as they were born and lived in 1995, and panel (d) further adds fixed effectsfor the 900 different ethnicities. Sample sizes are (a) 1,215,730, (b) 564,185, (c) and (d) 500,770. These latter refinementshone in on those Outer Islands natives differentially exposed to the Transmigration program in their locality. Further re-finements, validation checks and results for broader definitions of interethnic marriage can be found in Appendix FiguresA.2, A.3, and A.4, respectively. The dashed lines are 95 percent confidence intervals based on clustering at the districtlevel, of which there are 94.
33

Figure 5: Ethnic Diversity and Indonesian Language Use at Home
Notes: This figure reports a semiparametric estimate and 95 percent confidence interval for the impact of ethnic diversity(Inner Island ethnic share) on the likelihood of reporting the national language as the primary language used at homein 2006 where the sample includes all individuals within 10 km of Transmigration villages including those villages. Theindividual-level estimates are based on the Robinson (1988) partially linear model that conditions on the x vector of pre-determined village-level controls and uses an Epanechnikov kernel and Fan and Gijbels (1996) rule-of-thumb bandwidth.
Figure 6: Transmission of Paternal Ethnic Identity Nonlinear w.r.t. Own-Group Size
Notes: This figure reports village-level semiparametric estimates and 95 percent confidence interval for the impact of ethnicdiversity (Inner Island ethnic share) on the share of children with reported Inner Island identities among all children livingin households the father claiming an Inner Island ethnicity and the mother an Outer Island ethnicity. The Inner Islandethnic share on the x-axis excludes children over which we define this dependent variable. We find similarly upwardsloping albeit more linear graphs for those mixed marriages in which the mother belongs to an Inner Island ethnic group(see Appendix Figure A.11). The estimates are based on the semiparametric OLS procedure detailed in the notes to Figure5. Instrumental variables estimates can be found in Appendix Figure A.11.
34

Figure 7: Ethnic Diversity and Minority Occupational Choice
Notes: These figures report village-level semiparametric estimates of the impact of ethnic diversity (Inner Island ethnicshare) on the share of the given ethnic group’s working population employed in trading and services occupations asreported in the 2000 Population Census. The left graph is based on all individuals belonging to Inner Island ethnicities,and the right graph is based on those belong to Outer Islands ethnicities. The estimates are based on the semiparametricOLS procedure detailed in the notes to Figure 5. Instrumental variables estimates can be found in Appendix Figure A.12.
35

Tables
Table 1: Intergenerational Effects of Socialization through Marriage and Language(1) (2) (3)
Dependent Variable in 2014:
(a) Indonesian Use at Home (µ = 0.369)parents intermarried 0.070 0.053
(0.021)*** (0.021)**daily Indonesian use at home as a child 0.156 0.151
(0.022)*** (0.022)***Number of Individuals 8,668 8,623 8,623
(b) Maintain Same Ethnicity (µ = 0.886)parents intermarried -0.181 -0.177
(0.030)*** (0.030)***daily Indonesian use at home as a child -0.062 -0.045
(0.019)*** (0.019)**Number of Individuals 6,626 6,594 6,594
(c) In Interethnic Marriage (µ = 0.103)parents intermarried 0.064 0.056
(0.040) (0.040)daily Indonesian use at home as a child 0.063 0.057
(0.028)** (0.027)**Number of Individuals 4,403 4,385 4,385
(d) Mistrust Other Ethnic Groups(z-score: µ = 0, σ = 1)
parents intermarried -0.176 -0.160(0.053)*** (0.055)***
daily Indonesian use at home as a child -0.148 -0.131(0.054)*** (0.054)**
Number of Individuals 8,280 8,236 8,236
Age, Gender, Education Fixed Effects Yes Yes YesVillage Fixed Effects Yes Yes Yes
Notes: Each panel reports estimates of the correlation between parental intermarriage, daily Indonesian language use athome as a child and the given dependent variable for a sample of individuals in the 2014 round of the Indonesia Family LifeSurvey who no longer live in the same household as they did in 1997. The dependent variables (with means µ) includein panel (a) an indicator for whether the individual used the Indonesian language at home on a regular basis in 2014,(b) an indicator for whether the individual switched his/her reported ethnicity between 1997 and 2014, (c) an indicatorfor whether a married individual is in an interethnic marriage in 2014, (d) an index normalized to have mean zero andstandard deviation one based on ordered response on a 4 point scale to the question “Do you trust people from otherethnic groups less than you trust your people from own group?”. Note that the language use at home variable is distinctfrom the Susenas measure used elsewhere in the paper, which requires that household heads only list a single, primarylanguage at home as opposed to listing all languages used at home. The sample is restricted to all individuals greater than15 years old who live in a different household in 2014 compared to 1997. All specifications include the fixed effects listedat the bottom of the table where the age FE are for each individual age. Standard errors are clustered at the village levelof which there are around 1,300 across panels. */**/*** denotes significance at the 10/5/1 percent level.
36

Table 2: Baseline Village Characteristics by Treatment and Control StatusTransmigration Non- RDA (t-stat)
Treated (T) Treated (NT) Control (C) Statistical Difference
Adjustedmean (sd) mean (sd) mean (sd) µT − µNT µT − µC µT − µC
log village area, Ha 7.53 (1.0) 6.99 (1.5) 8.24 (1.3) 5.32*** -4.13*** -0.21% w/ slope between 0-2% 37.63 (28.3) 30.19 (30.6) 16.96 (17.7) 2.69*** 5.88*** 0.92% w/ slope between 2-8% 48.25 (25.4) 39.27 (24.7) 48.21 (21.7) 3.89*** 0.01 -0.12% w/ slope between 8-30% 9.87 (16.5) 20.32 (22.6) 24.73 (19.4) -6.35*** -5.35*** 0.56Vector Ruggedness Measure 0.31 (0.1) 0.28 (0.2) 0.31 (0.1) 2.81*** 0.21 -0.58log altitude, m2 3.29 (2.9) 3.77 (2.7) 4.83 (2.2) -1.91* -5.08*** 1.54Organic Carbon (%) 4.77 (6.2) 3.53 (4.7) 3.06 (5.2) 2.69*** 2.77*** -0.33Topsoil Sodicity (ESP) % 1.57 (0.4) 1.50 (0.5) 1.63 (0.5) 1.72* -0.86 1.81*Topsoil pH (-log(H+)) 5.07 (0.4) 5.33 (0.7) 5.35 (0.6) -5.22*** -2.26** 0.56Coarse texture soils (%) 0.10 (0.2) 0.06 (0.2) 0.09 (0.2) 3.44*** 0.30 -1.12Medium texture soils (%) 0.70 (0.2) 0.71 (0.2) 0.65 (0.2) -0.49 1.98* -0.85Very poor or poor drainage (%) 0.39 (0.4) 0.30 (0.3) 0.20 (0.3) 3.15*** 5.50*** 0.87Imperfect drainage soils (%) 0.06 (0.2) 0.12 (0.3) 0.21 (0.3) -2.73*** -3.24*** -0.86Avg. rainfall, 1948-1978 225.26 (35.1) 215.29 (41.4) 237.66 (35.8) 2.39** -1.70* 0.31Avg. temp (Celcius), 1948-1978 26.26 (1.7) 25.36 (2.7) 25.75 (1.8) 4.74*** 1.77* 0.15Minimum Log Distance to Villages on Java or Bali 6.69 (0.5) 6.91 (0.6) 6.91 (0.3) -2.66*** -1.97* -0.73Log Distance to Nearest Major Road 0.08 (0.1) 0.07 (0.1) 0.10 (0.1) 1.48 -1.09 -0.29Log Distance to Nearest Coast 10.56 (1.1) 9.96 (1.5) 10.84 (0.9) 4.32*** -1.65 1.07Log Distance to Nearest River 8.09 (0.8) 7.95 (1.1) 8.22 (0.8) 2.06** -1.54 0.45Log Distance to Subdistrict Capital 2.43 (1.5) 1.73 (1.6) 1.97 (1.8) 7.54*** 3.35*** 1.18Log Distance to District Capital 4.12 (1.0) 3.46 (1.4) 4.10 (1.1) 7.33*** 0.13 2.40**linguistic similarity with Java/Bali languages 0.58 (0.1) 0.60 (0.1) 0.60 (0.1) -2.36** -1.61 -1.09
Notes: This table reports the sample means (standard deviations, sd) for the predetermined village-level characteristics that comprise our main covariate vector x,which planners used to inform site selection. We consider three groups of villages: Transmigration villages settled in the period 1979–1988 or treated sites (T), non-Transmigration villages or non-treated sites (NT), and Recommended Development Areas (RDA) or control sites (C) that were suggested as resettlement areas but neverreceived the program due to sudden budgetary cutbacks. Note that C villages are a subset of NT villages. See the Online Appendix of Bazzi et al. (2016) for details onvariable construction and definitions. The t-statistics reported in the latter three columns are recovered from the coefficient on the treatment variable in a regression ofthe given characteristic on the treatment indicator. The final column reweights the control observations by their inverse probability of being a Transmigration villagerecovered from a first step estimate of the propensity score (see Appendix Table A.2). Standard errors are clustered at the district level. */**/*** denotes significance atthe 10/5/1 percent level.
37

Table 3: Demographic Impacts of the Transmigration Program
ATT Estimates Control Group(1) (2) (3) Mean, Cols. 2-3
log population 0.355 0.195 0.068 7.2(0.082)*** (0.114)* (0.088)
Java/Bali-born population share 0.321 0.338 0.335 0.021(0.017)*** (0.019)*** (0.019)***
Inner Island ethnic share 0.484 0.514 0.540 0.061(0.027)*** (0.032)*** (0.038)***
ethnic residential isolation index (inner, outer) -0.114 -0.171 -0.184 0.340(0.012)*** (0.027)*** (0.037)***
ethnic fractionalization 0.154 0.186 0.126 0.238(0.023)*** (0.031)*** (0.031)***
number of ethnic groups 5.176 3.744 2.637 20.1(2.030)** (2.052)* (2.352)
religious fractionalization 0.003 -0.032 0.011 0.186(0.014) (0.023) (0.022)
Treatment/Control Only No Yes YesGeographic Controls No Yes YesBlinder-Oaxaca Reweighting No No Yes
Notes: */**/*** denotes significance at the 10/5/1 percent level. Each cell reports the coefficient from a regression of thegiven dependent variable listed in the first column on an indicator for whether the village is a Transmigration settlement.Column 1 comprises all Outer Islands villages (with non-missing data). Column 2 restricts to our quasi-experimental de-sign including only Transmigration and control/RDA sites and conditions on the predetermined village-level characteris-tics that determined site selection. Column 3 is a control function specification based on a Blinder-Oaxaca decompositionakin to a reweighting approach as derived in Kline (2011). All specifications include island fixed effects. Regressions in-clude as many as 31,185 villages in column 1, and 832 treated villages and 668 controls in columns 2 and 3. Standard errorsare clustered by district, of which there are 94. The final column contains the mean of the control villages in columns 2and 3.
38

Table 4: Intermarriage Impacts of the Transmigration Program
ATT Estimates Control Group(1) (2) (3) Mean, Cols. 2-3
marriage rate 0.025 0.006 0.019 0.829(0.010)** (0.012) (0.013)
intermarriage rate (inner, outer) 0.036 0.059 0.050 0.023(0.006)*** (0.005)*** (0.006)***
adjusted intermarriage rate (inner, outer) 0.136 0.135 0.177 0.253(0.031)*** (0.033)*** (0.035)***
Treatment/Control Only No Yes YesGeographic Controls No Yes YesBlinder-Oaxaca Reweighting No No Yes
Notes: */**/*** denotes significance at the 10/5/1 percent level. Each cell reports the coefficient from a regression of thegiven dependent variable listed in the first column on an indicator for whether the village is a Transmigration settlement.Column 1 comprises all Outer Islands villages (with non-missing data). Column 2 restricts to our quasi-experimental de-sign including only Transmigration and control/RDA sites and conditions on the predetermined village-level characteris-tics that determined site selection. Column 3 is a control function specification based on a Blinder-Oaxaca decompositionakin to a reweighting approach as derived in Kline (2011). All specifications include island fixed effects. Regressions in-clude as many as 31,185 villages in column 1, and 832 treated villages and 668 controls in columns 2 and 3. Standard errorsare clustered by district, of which there are 94. The final column contains the mean of the control villages in columns 2 and3. The “intermarriage rate” measure captures the share of marriages that are between Inner and Outer Island ethnicities.The marriage rates are restricted to those younger cohorts for whom the marriage likely took place after the initial waveof resettlement in that area (see Section 4.2 for details). See Figure 4 for individual-level, age-specific estimates of the ATT.The “adjusted intermarriage rate” divides the actual intermarriage rate by the average intermarriage rate based on 10,000simulated random matches in the village marriage market. This serves to adjust the rate of interethnic marriage by theopportunity for such marriages to take place, which is naturally higher in Transmigration villages given the large effectson diversity reported in Table 3. As discussed in the paper, we find similar insights when including (polynomials of) thismeasure of random intermarriage rates on the right-hand-side as a “bad control.”
39

Table 5: Effects of the Transmigration Program on National Language Use at HomeDep. Var.: P(Daily . . . Language Use)
Indonesian Inner Island Outer Island(1) (2) (3)
1. Baseline ATT 0.250 -0.002 -0.248(0.126)** (0.068) (0.162)
Number of Individuals 2,878 2,878 2,878Control Group Mean 0.122 0.073 0.805
2. Conditional on age, gender, education 0.256 -0.005 -0.252(0.118)** (0.070) (0.159)
3. Individuals aged ≤ 40 0.249 0.011 -0.260(0.125)** (0.070) (0.155)*
4. Conditional on age, gender, education, occupation 0.245 -0.002 -0.243(0.127)* (0.068) (0.162)
5. Conditional on log household expenditures/capita 0.250 0.000 -0.250(0.127)** (0.068) (0.164)
6. Conditional on Malay indigenous language 0.248 -0.003 -0.244(0.131)* (0.070) (0.165)
7. Conditional on indigenous language distance to Malay 0.243 -0.011 -0.231(0.123)** (0.071) (0.158)
8. Conditional on quadratic Inner Island ethnic share 0.006 -0.088 0.082(0.136) (0.083) (0.155)
Notes: Each cell corresponds to a separate individual-level, linear probability regression for the ATT of living in a villagewithin 10 km of a Transmigration site (including those sites). The control group includes all individuals within 10 km of acontrol/RDA site. There are 134 villages in the treated areas, and 47 villages in the control areas. The dependent variables,which are mutually exhaustive, are indicators for whether or not the individual household head reports in column (1)the national language Bahasa Indonesia, (2) an Inner Island language, or (3) an Outer Island language as the primary dailylanguage. All regressions are based on the Blinder-Oaxaca decomposition approach of Kline (2011). The data come fromthe 2006 Susenas household survey. Row (2) controls for household head gender, age, age squared, and an exhaustive setof indicators for education level; (3) restricts to individuals less than 40 years old; (4) augments the row 3 specificationwith an exhaustive set of indicators for occupation; (5) controls for log household expenditures per capita; (6) includes anindicator for whether the villages lies within the ethnolinguistic homeland of the Malay (the root language of Indonesian);(7) controls for distance of the given ethnolinguistic homeland to Malay using the metric suggested in Fearon (2003) anddeveloped in the Indonesian data based on the procedures detailed in the Online Appendix of Bazzi et al. (2016); and (8)controls for the Inner Island ethnic share and its square. Standard errors are clustered by district, of which there are 63.*/**/*** denotes significant at the 10/5/1 percent significance levels.
40
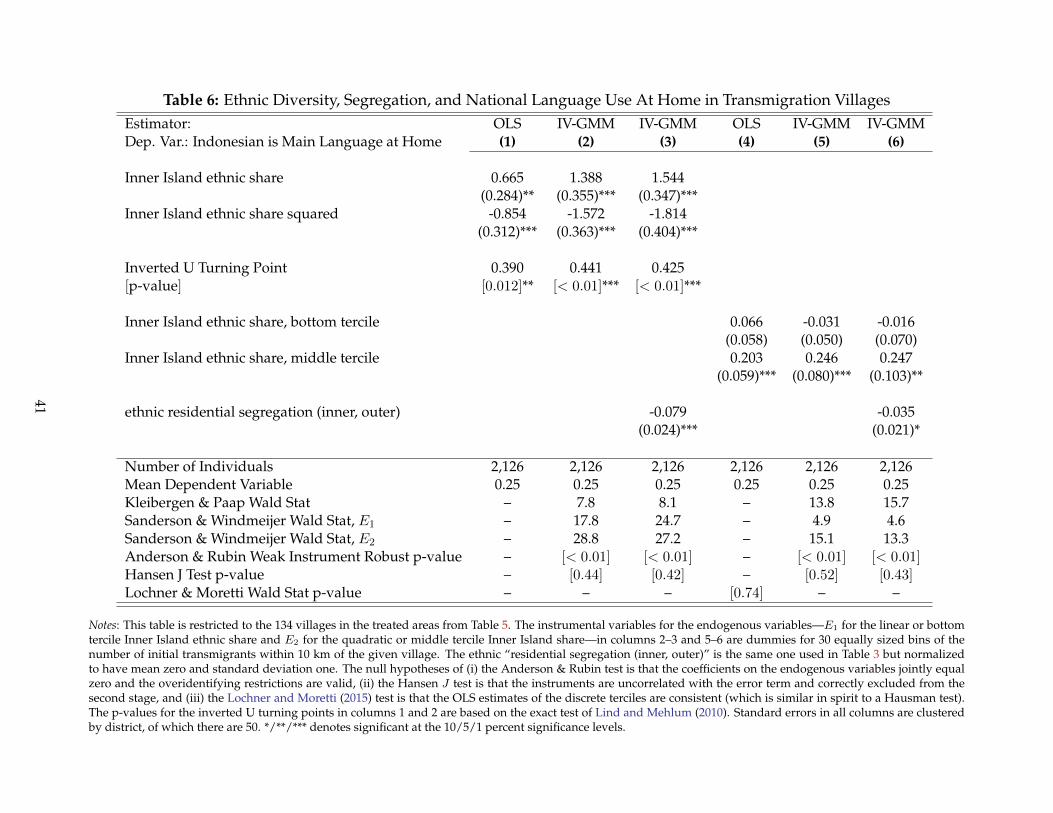
Table 6: Ethnic Diversity, Segregation, and National Language Use At Home in Transmigration VillagesEstimator: OLS IV-GMM IV-GMM OLS IV-GMM IV-GMMDep. Var.: Indonesian is Main Language at Home (1) (2) (3) (4) (5) (6)
Inner Island ethnic share 0.665 1.388 1.544(0.284)** (0.355)*** (0.347)***
Inner Island ethnic share squared -0.854 -1.572 -1.814(0.312)*** (0.363)*** (0.404)***
Inverted U Turning Point 0.390 0.441 0.425[p-value] [0.012]** [< 0.01]*** [< 0.01]***
Inner Island ethnic share, bottom tercile 0.066 -0.031 -0.016(0.058) (0.050) (0.070)
Inner Island ethnic share, middle tercile 0.203 0.246 0.247(0.059)*** (0.080)*** (0.103)**
ethnic residential segregation (inner, outer) -0.079 -0.035(0.024)*** (0.021)*
Number of Individuals 2,126 2,126 2,126 2,126 2,126 2,126Mean Dependent Variable 0.25 0.25 0.25 0.25 0.25 0.25Kleibergen & Paap Wald Stat – 7.8 8.1 – 13.8 15.7Sanderson & Windmeijer Wald Stat, E1 – 17.8 24.7 – 4.9 4.6Sanderson & Windmeijer Wald Stat, E2 – 28.8 27.2 – 15.1 13.3Anderson & Rubin Weak Instrument Robust p-value – [< 0.01] [< 0.01] – [< 0.01] [< 0.01]Hansen J Test p-value – [0.44] [0.42] – [0.52] [0.43]Lochner & Moretti Wald Stat p-value – – – [0.74] – –
Notes: This table is restricted to the 134 villages in the treated areas from Table 5. The instrumental variables for the endogenous variables—E1 for the linear or bottomtercile Inner Island ethnic share and E2 for the quadratic or middle tercile Inner Island share—in columns 2–3 and 5–6 are dummies for 30 equally sized bins of thenumber of initial transmigrants within 10 km of the given village. The ethnic “residential segregation (inner, outer)” is the same one used in Table 3 but normalizedto have mean zero and standard deviation one. The null hypotheses of (i) the Anderson & Rubin test is that the coefficients on the endogenous variables jointly equalzero and the overidentifying restrictions are valid, (ii) the Hansen J test is that the instruments are uncorrelated with the error term and correctly excluded from thesecond stage, and (iii) the Lochner and Moretti (2015) test is that the OLS estimates of the discrete terciles are consistent (which is similar in spirit to a Hausman test).The p-values for the inverted U turning points in columns 1 and 2 are based on the exact test of Lind and Mehlum (2010). Standard errors in all columns are clusteredby district, of which there are 50. */**/*** denotes significant at the 10/5/1 percent significance levels.
41

Appendix
Contents
Appendix 42
A Further Empirical Results 43A.1 Probing Instrument Validity . . . . . . . . . . . . . . . . . . . . . . . . . . . . . . . . . . . . 43A.2 Robustness Checks on Intermarriage Results . . . . . . . . . . . . . . . . . . . . . . . . . . 43A.3 Further Results on National Language Use at Home . . . . . . . . . . . . . . . . . . . . . . 44Figures . . . . . . . . . . . . . . . . . . . . . . . . . . . . . . . . . . . . . . . . . . . . . . . . . . . 45Tables . . . . . . . . . . . . . . . . . . . . . . . . . . . . . . . . . . . . . . . . . . . . . . . . . . . . 56
List of Figures
A.1 Estimated Propensity Scores . . . . . . . . . . . . . . . . . . . . . . . . . . . . . . . . . . . 45A.2 Additional Individual-Level ATT for Intermarriage (Inner, Outer) . . . . . . . . . . . . . . 46A.3 Null ATT for Both Spouses Born in Java/Bali . . . . . . . . . . . . . . . . . . . . . . . . . . 47A.4 Individual-Level ATT for Intermarriage Between Any Ethnic Groups . . . . . . . . . . . . 47A.5 Long-Run Diversity and Initial Transmigrants (First Stage) . . . . . . . . . . . . . . . . . . 48A.6 Probing the Validity of the Initial Transmigrants Instrument . . . . . . . . . . . . . . . . . 49A.7 Spillovers from the Transmigration Program . . . . . . . . . . . . . . . . . . . . . . . . . . 50A.8 Overall Ethnic Fractionalization and Indonesian Language Use . . . . . . . . . . . . . . . 51A.9 Ethnic Diversity and Indonesian Language Use . . . . . . . . . . . . . . . . . . . . . . . . . 52A.10 Ethnic Diversity and Minority vs. Majority Language Use . . . . . . . . . . . . . . . . . . 53A.11 Diversity Thresholds in the Intergenerational Transmission of Identity . . . . . . . . . . . 54A.12 Ethnic Diversity and Minority Occupational Choice (Instrumental Variables) . . . . . . . 55
List of Tables
A.1 Summary Statistics . . . . . . . . . . . . . . . . . . . . . . . . . . . . . . . . . . . . . . . . . 56A.2 Propensity Score: Determinants of Site Selection . . . . . . . . . . . . . . . . . . . . . . . . 57A.3 Log Initial Transmigrants and Predetermined Development Proxies . . . . . . . . . . . . . 58A.4 Robustness Checks on Intermarriage Impacts of the Transmigration Program . . . . . . . 59A.5 Ethnic Diversity, Segregation, and National Language Use At Home in Transmigration
Villages . . . . . . . . . . . . . . . . . . . . . . . . . . . . . . . . . . . . . . . . . . . . . . . . 60A.6 Overall Ethnic Diversity and National Language Use At Home in Transmigration Villages 61A.7 Transmigration and Interethnic Preferences over the Long-Run . . . . . . . . . . . . . . . 61
42

A Further Empirical Results
We present here several additional results mentioned in the paper.
A.1 Probing Instrument Validity
This section describes results mentioned in Section 5.3 supporting the excludability of the initial numberof transmigrants as an instrument for ethnic diversity in 2000. First, as seen in Appendix Figure A.6, theinstrument does not predict other measures of population diversity such as origin district concentrationand religious fractionalization, skill levels, or occupational mixes among the initial transmigrants. Thissuggests that larger settler groups were not mechanically more likely to have greater diversity alongother dimensions besides ethnicity. Second, the instrument is uncorrelated with other predeterminedproxies for political and economic development not captured in the x vector used for site selection (seeAppendix Table A.3). These proxies include measures of potential agricultural yields, malaria suitabil-ity in 1978, the district-level share of votes going to the Golkar party of President Suharto in the 1977legislative elections, and a host of district-level characteristics of the population residing within theseareas (but not in the immediate settlements) as of 1978, including information on wealth, infrastructureaccess, schooling, and sector of work. Third, the number of initial transmigrants is uncorrelated with thesimilarity between languages native to Java/Bali and the indigenous language in the given area of theOuter Islands (see Appendix Figure A.6).
A.2 Robustness Checks on Intermarriage Results
We show here that the main village-level results on intermarriage rates in Table 4 survive several im-portant robustness checks. First, in Appendix Table A.4, Panel (A) includes province fixed effects, (B)controls for predetermined natural advantages and population characteristics not used by the plannersto select sites but potentially correlated with long-run outcomes (i.e., all variables used in AppendixTable A.3), (C) includes fixed effects for the indigenous ethnolinguistic group in each village, and (D) in-cludes a control for the number of INPRES primary schools per student at the district level in the 1970sas used in Duflo (2001) as well as a set of contemporaneous controls for public goods observed in 2003used by Martinez-Bravo (2017).1 The latter public goods controls are potentially endogenous but nev-ertheless instructive as the large intermarriage effects are robust to their inclusion. More generally, thestability of the ATT across panels suggests that other place-based unobservables potentially correlatedwith the Transmigration program are not driving the intermarriage effects.
The apparent lack of selection-on-unobservables is consistent with more formal tests of coefficientstability using using the Oster (forthcoming) procedure.2 Specifically, we compute measures of δ =(
θc(θu−θc)
)×(R2
c−R2u
β×R2c
)for the intermarriage and adjusted intermarriage outcomes where θu is the ATT in
baseline regression from Table 4 and θc is the ATT with additional covariates in Appendix Table A.4, R2u
andR2c are the correspondingR2 measures, and β is a scaling parameter that we set equal to 0.3 following
1The public goods include the number of schools, different types of health clinics, doctors, midwives, and basic transport andsanitation infrastructure.
2This procedure builds on Altonji et al. (2005) by accounting for the possibility that the additional covariates beyond the baselinedo not add much explanatory power to the regressions.
43

common practice, but insights are similar for larger values. Oster (forthcoming) argues that measures of|δ| > 2 are consistent with quite limited selection-on-unobservables. Looking across specifications, wegenerally find δ > 10 for intermarriage and for adjusted intermarriage, which is reassuring given thatthe R2 moves quite a bit with the different sets of controls.3
Second, as we show in Appendix Figure A.7, the impacts of the Transmigration program on intermar-riage also spill over to neighboring villages outside the immediate settlement boundaries. In particular,we estimate a version of our village-level ATT equation in which we set Transmigrationj = 1 for allvillages that are within five kilometer discs (0–5, 5–10, . . . ) from the centroid of Transmigration villages,which are excluded, and Transmigrationj = 0 for all villages that are within the given distance fromthe centroid of the control villages, which are also included. The graphs point to significant populationsof Inner Island immigrants and their descendants up to 30 kilometers beyond the Transmigration vil-lage boundaries. However, most of the results on interethnic integration in Table 4 are more local to theTransmigration villages. For example, as we move beyond 10 kilometers, the increase in intermarriagerates and reduction in ethnic residential segregation go to zero. These spillover effects can be explainedby several forces including, among others, the expansion of the original settlement area as the youngergeneration of transmigrants started new families. Regardless of the causes, these multiplier effects areimportant from a policy perspective in that they suggest resettlement programs can have meaningfulsocial impacts beyond the population within the immediate settlement areas.
A.3 Further Results on National Language Use at Home
We observe the lowest levels of daily Indonesian use at home in those areas where either Inner or OuterIslanders constitute a dominant majority. Panel (a) in Appendix Figure A.9 shows that in these villages,the majority group language is much more likely to be the primary daily language than Indonesian.There is a strong positive relationship between the Inner Island ethnic share and the share of the pop-ulation speaking Inner Island languages and a strong negative relationship for Outer Island languages.These sharp, nearly linear relationships explain the inverted U relationship for national language useand are driven in part by minority individuals being more likely to adopt majority group languages orIndonesian (see Appendix Figure A.10).
Panel (b) in Appendix Figure A.9 presents semiparametric IV estimates corresponding to the flexibleparametric results in columns 1 and 4 of Table 6. Based on the control function estimator in Su andUllah (2008), we augment equation (3) with the residual from a semiparametric first stage regression ofdiversityj on x and the instrument. Following Henderson and Parmeter (2015, p.p. 271–278), we adopta local cubic polynomial first stage estimator and a local linear second stage estimator. The instrument isa strong predictor of the Inner Island ethnic share in 2000 (see Appendix Figure A.5 for this first stage).Together, these IV results look qualitatively very similar to the baseline estimates based on the simplerRobinson (1988) OLS-based estimator.
3Concretely, we take the estimated θ and R2 from column 2 of Tables 4 and A.4 and find that δ = 16.9, null, 12.7, 36.6(δ = −287.8, 34.2, −52.1, 1.4) across panels A, B, C, and D for intermarriage (adjusted intermarriage) where the null valueis due to the fact that θ is identical despite the change in R2. Note that we use the column 2 estimates as the Kline (2011)estimate in column 3 does not admit a conventional R2, but the point estimates of the ATT are similar in column 2.
44

Figures
Figure A.1: Estimated Propensity Scores
Notes: This figure, also in Bazzi et al. (2016), plots the distribution of estimated probabilities of site selection based on theestimates in Table A.2.
45

Figure A.2: Additional Individual-Level ATT for Intermarriage (Inner, Outer)
(a) Local Outer Islands Native Men (b) Local Outer Islands Native Women
(c) Local Outer Islands Native High Education (d) Local Outer Islands Native Low Education
(e) Local Outer Islands Native Trader Occupation (f) Local Outer Islands Native Non-Trader Occupation
Notes: This figure uses the same individual-level, age-specific ATT specification as panel (d) in Figure 4 with the additionalrestrictions noted in the panel titles to capture potential differences, which prove limited, across gender, education andoccupations.
46

Figure A.3: Null ATT for Both Spouses Born in Java/Bali
Notes: This figure uses the same individual-level, age-specific ATT specification as panel (b) in Figure 4 to rule out potentialidentification concerns by showing that the ATT is zero in the case where both spouses are born in Java/Bali.
Figure A.4: Individual-Level ATT for Intermarriage Between Any Ethnic Groups
(a) Baseline (b) Restricting to Native-Born Outer Islands Ethnicity
(c) . . . Local to District of Birth and 5 Years Prior (d) . . . Controlling for Ethnicity Fixed Effects
Notes: This figure replicates the sequence of results in Figure 4 but defining the dependent variable as interethnic marriagebetween any groups rather than restricting to the Inner–Outer breakdown.
47

Figure A.5: Long-Run Diversity and Initial Transmigrants (First Stage)
parametric estimate:
0.083 (0.023)***
.3
.4
.5
.6
.7
.8
sem
ipar
. E(In
ner I
slan
d et
hnic
sha
re |
X)
0
.5
1
1.5
dens
ity
6 6.5 7 7.5 8log total initial transmigrants
Notes: This figure reports regressions of the Inner Island ethnic share in 2000 (based on the Population Census) conditionalon the log of the transmigrant population from Java/Bali placed in that village in the initial year of settlement (in 1979–1988). The semiparametric regression is based on the Robinson (1988) partially linear model, and it employs a local cubicpolynomial regression that conditions on island fixed effects and the vector x of predetermined site selection variables, anEpanechnikov kernel, Fan and Gijbels (1996) rule-of-thumb bandwidth, and trimming of the top and bottom percentile.This is similar to the specification used in the first stage of the semiparametric instrumental variables results presentedbelow. The parametric linear estimate adopts the same set of controls with standard errors based on the Conley (1999)approach that allows unobservables to be correlated across all villages within 150 kilometers of each other.
48

Figure A.6: Probing the Validity of the Initial Transmigrants Instrument
Notes: This figure reports semiparametric and parametric regressions of several measures of diversity and other characteristics of thepopulation—listed in the y axis on the graphs—observed in Transmigration settlements conditional on the log of the transmigrant pop-ulation from Java/Bali placed in that village in the initial year of settlement (in 1979–1988). We plot histograms of the latter in thebackground for reference. The linguistic similarity and origin district Herfindahl indices are from Bazzi et al. (2016). These graphs serveto rule out first order concerns that the instrument for the Inner Island ethnic share (see Figure A.5) is correlated with other measuresof diversity and population characteristics associated with the initial immigrant influx. The semiparametric regression is based on theRobinson (1988) partially linear model, and it employs a local linear regression that conditions on island fixed effects and the vector x ofpredetermined site selection variables, an Epanechnikov kernel and Fan and Gijbels (1996) rule-of-thumb bandwidth. This is similar tothe specification used in the first stage of the semiparametric instrumental variables results presented below. The parametric linear esti-mate adopts the same set of controls with standard errors based on the Conley (1999) approach that allows unobservables to be correlatedacross all villages within 150 kilometers of each other.
49
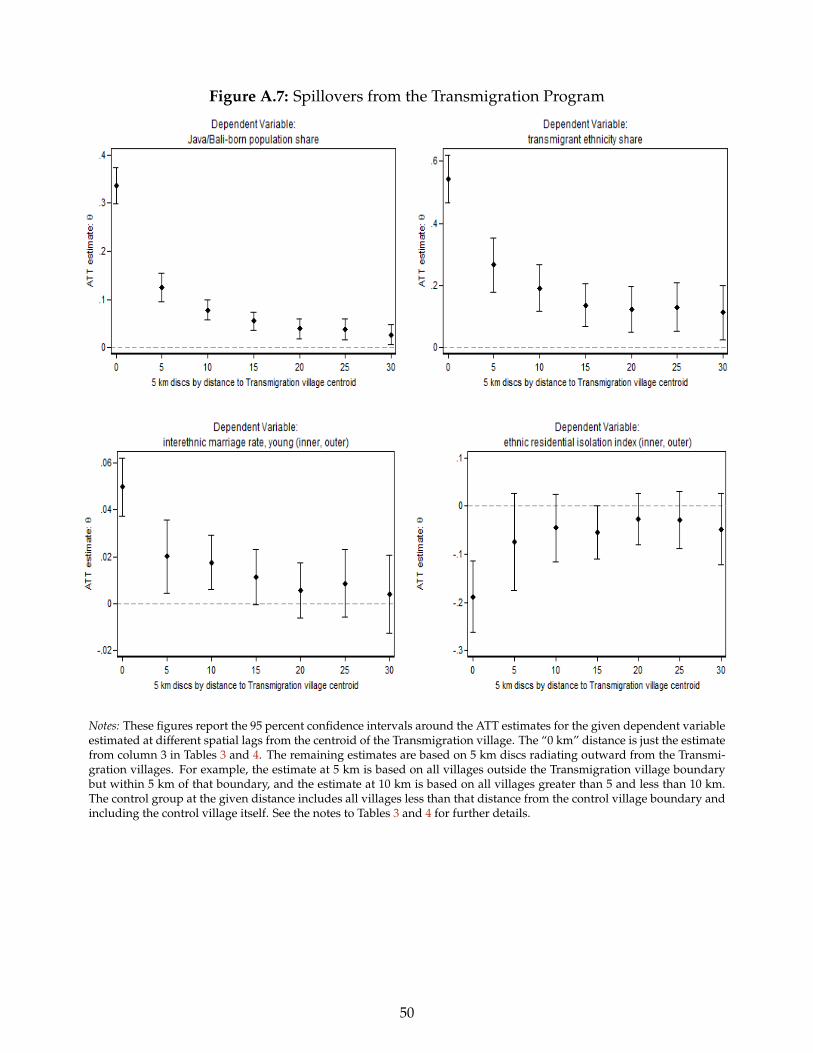
Figure A.7: Spillovers from the Transmigration Program
Notes: These figures report the 95 percent confidence intervals around the ATT estimates for the given dependent variableestimated at different spatial lags from the centroid of the Transmigration village. The “0 km” distance is just the estimatefrom column 3 in Tables 3 and 4. The remaining estimates are based on 5 km discs radiating outward from the Transmi-gration villages. For example, the estimate at 5 km is based on all villages outside the Transmigration village boundarybut within 5 km of that boundary, and the estimate at 10 km is based on all villages greater than 5 and less than 10 km.The control group at the given distance includes all villages less than that distance from the control village boundary andincluding the control village itself. See the notes to Tables 3 and 4 for further details.
50

Figure A.8: Overall Ethnic Fractionalization and Indonesian Language Use
Notes: This figure reports a semiparametric (Robinson, 1988) estimate of the impact of ethnic fractionalization across allethnic groups on the likelihood of national language use at home for all individuals residing within 10 km of Transmigra-tion villages. The estimate is based on the same specification as Figure 5. See the notes to that figure for further details.
51

Figure A.9: Ethnic Diversity and Indonesian Language Use
(a) Semiparametric OLS (Robinson, 1988)
(b) Semiparametric IV (Su and Ullah, 2008)
Notes: These figures report semiparametric estimates of the impact of ethnic diversity (Inner Island ethnic share) on thelikelihood of reporting the given language (national, Inner Island, Outer Island) as the primary daily one used in thehousehold for all individuals residing within 10 km of Transmigration villages including those villages. The inverted U inFigure panel (a) is reproduced from Figure 5 in the paper. The estimates are based on the Robinson (1988) partially linearmodel that conditions on our usual x vector of control variables and uses an Epanechnikov kernel and Fan and Gijbels(1996) rule-of-thumb bandwidth. The individual data on language use are from the 2006 Susenas household survey. Theestimates in panel (b) are based on the Su and Ullah (2008) control function estimator in which we follow the approachsuggested in Henderson and Parmeter (2015) and first run a third degree local polynomial regression based on the firststage in Figure A.5, recover the semiparametric residuals from that regression, and then estimate a second stage locallinear regression conditional on those generated residuals. Note that the confidence intervals do not yet account for thegenerated regressor. In ongoing work, we improve inference by implementing a bootstrap procedure and also reduce biasin the pointwise estimates by implementing a bandwidth optimized for each stage using cross-validation.
52

Figure A.10: Ethnic Diversity and Minority vs. Majority Language Use
(a) Inner Island Ethnic Groups
(b) Outer Island Ethnic Groups
Notes: These figures report semiparametric estimates of the impact of ethnic diversity (Inner Island ethnic share) on thelikelihood of reporting the given language (national, Inner Island, Outer Island) as the primary daily one used in thehousehold for individuals residing within 10 km of Transmigration villages including those villages. Panel (a) is estimatedover all individuals belonging to Inner Island ethnic groups, and Panel (b) is estimated over all those belonging to OuterIsland ethnic groups. The estimates are based on the Robinson (1988) partially linear model that conditions on our usualx vector of control variables and uses an Epanechnikov kernel and Fan and Gijbels (1996) rule-of-thumb bandwidth. Theindividual data on language use are from the 2006 Susenas household survey. IV results based on the Su and Ullah (2008)estimator look similar.
53

Figure A.11: Diversity Thresholds in the Intergenerational Transmission of Identity
(a) Semiparametric OLS (Robinson, 1988)
(b) Semiparametric IV (Su and Ullah, 2008)
Notes: These figures report village-level semiparametric estimates of the impact of ethnic diversity (Inner Island ethnicshare) on the share of children with reported Inner Island (transmigrant) identities among all children living in householdswith one parent hailing from Inner Island ethnicities and the other from Outer Island ethnicities. The left graphs are basedon all children born to mixed marriages, and the right graphs are based on children born to mixed marriages in which thefather belongs to an Inner Island ethnic group and the mother belongs to an Outer Island ethnic group. The left figure inpanel (a) is reproduced from Figure 6. The estimates are based on the semiparametric OLS and IV procedures detailed inthe notes to Figure A.9.
54

Figure A.12: Ethnic Diversity and Minority Occupational Choice (Instrumental Variables)
Notes: These figures report village-level semiparametric estimates of the impact of ethnic diversity (Inner Island ethnicshare) on the share of the given ethnic group’s working population employed in trading and services occupations asreported in the 2000 Population Census. The left graphs are based on all individuals belonging to Inner Island ethnicities,and the right graphs are based on those belong to Outer Islands ethnicities. The estimates are based on the semiparametricIV procedure detailed in the notes to Figure A.9. Note that the confidence intervals do not yet account for the generatedregressor. In ongoing work, we improve inference by implementing a bootstrap procedure and also reduce bias in thepointwise estimates by implementing a bandwidth optimized for each stage using cross-validation.
55

Tables
Table A.1: Summary Statistics
Std.Mean Deviation
(a) Demographics and Residence
total population 1,961 (1,478)Inner Island-born population share 0.22 (0.23)Inner Island ethnic share 0.40 (0.39)overall ethnic fractionalization 0.34 (0.24)number of ethnic groups 22 (19.4)Muslim population share 0.78 (0.35)religious fractionalization 0.15 (0.19)ethnic residential isolation index (inner, outer) 0.22 (0.25)
(b) Marriage among Young Cohort
marriage rate 0.84 (0.15)intermarriage rate (inner, outer), young cohort 0.06 (0.07)adjusted intermarriage rate (inner, outer), young cohort 0.34 (0.42)
Notes: Panels (a) and (b) report summary statistics for the 832 Transmigration villages and 668 control villages in our base-line estimating equations for demographic and marriage outcomes. These results are based on the universal PopulationCensus from 2000.
56
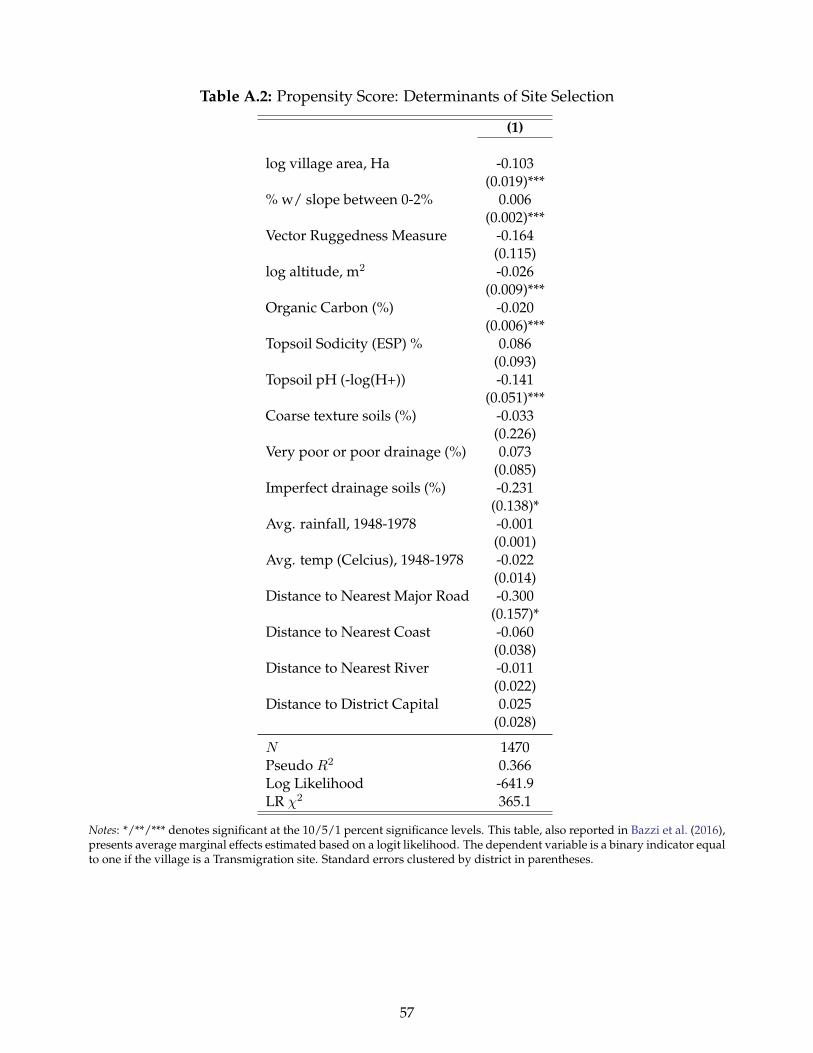
Table A.2: Propensity Score: Determinants of Site Selection
(1)
log village area, Ha -0.103(0.019)***
% w/ slope between 0-2% 0.006(0.002)***
Vector Ruggedness Measure -0.164(0.115)
log altitude, m2 -0.026(0.009)***
Organic Carbon (%) -0.020(0.006)***
Topsoil Sodicity (ESP) % 0.086(0.093)
Topsoil pH (-log(H+)) -0.141(0.051)***
Coarse texture soils (%) -0.033(0.226)
Very poor or poor drainage (%) 0.073(0.085)
Imperfect drainage soils (%) -0.231(0.138)*
Avg. rainfall, 1948-1978 -0.001(0.001)
Avg. temp (Celcius), 1948-1978 -0.022(0.014)
Distance to Nearest Major Road -0.300(0.157)*
Distance to Nearest Coast -0.060(0.038)
Distance to Nearest River -0.011(0.022)
Distance to District Capital 0.025(0.028)
N 1470Pseudo R2 0.366Log Likelihood -641.9LR χ2 365.1
Notes: */**/*** denotes significant at the 10/5/1 percent significance levels. This table, also reported in Bazzi et al. (2016),presents average marginal effects estimated based on a logit likelihood. The dependent variable is a binary indicator equalto one if the village is a Transmigration site. Standard errors clustered by district in parentheses.
57

Table A.3: Log Initial Transmigrants and Predetermined Development Proxies
Dependent Variable
wetland rice potential yield (ton/Ha) 0.004 0.004(0.012) (0.010)
dryland rice potential yield (ton/Ha) 0.002 0.002(0.007) (0.006)
cocoa potential yield (ton/Ha) -0.002 -0.002(0.010) (0.009)
coffee potential yield (ton/Ha) -0.002 -0.003(0.008) (0.007)
palmoil potential yield (ton/Ha) 0.033 0.036(0.018)* (0.021)*
cassava potential yield (ton/Ha) 0.020 0.027(0.022) (0.018)
maize potential yield (ton/Ha) 0.028 0.036(0.022) (0.020)*
Golkar vote share, 1977 -0.003 -0.002(0.009) (0.008)
malaria index, 1978 -0.049 -0.039(0.140) (0.157)
own electricity (% district pop.) 0.005 -0.003(0.010) (0.008)
own piped water (% district pop.) 0.011 0.005(0.005)** (0.003)
own sewer (% district pop.) 0.001 0.001(0.006) (0.004)
use modern fuel source (% district pop.) -0.000 -0.000(0.000) (0.000)
own modern roofing (% district pop.) 0.006 0.001(0.009) (0.012)
own radio (% district pop.) -0.001 0.001(0.007) (0.006)
own TV (% district pop.) 0.008 0.004(0.008) (0.005)
speak Indonesian at home (% district pop.) -0.003 -0.005(0.005) (0.004)
literate (% district pop.) 0.009 0.008(0.005)* (0.005)
average years of schooling in district 0.064 0.043(0.046) (0.040)
agricultural sector (% district pop.) -0.013 -0.010(0.011) (0.007)
mining sector (% district pop.) -0.000 0.000(0.001) (0.001)
manufacturing sector (% district pop.) 0.002 0.002(0.003) (0.002)
trading sector (% district pop.) 0.003 0.002(0.003) (0.002)
services sector (% district pop.) 0.007 0.006(0.005) (0.004)
wage worker (% district pop.) 0.006 0.004(0.006) (0.004)
Site Selection Variable Controls (x) Yes YesYear of Settlement Fixed Effects No Yes
Notes: */**/*** denotes significance at the 10/5/1 percent level. Each cell corresponds to a regression of the given variablein the row on log of transmigrants placed in the year of settlement, island fixed effects, and the predetermined village-level control variables described in the text. Potential yields are obtained from FAO-GAEZ. The Golkar vote share is theshare of the population in the given district that voted President Suharto’s Golkar party in the 1977 legislative elections.The malaria suitability index is based on work by Gordon McCord, who generously provided us with the data. Thevariables beginning with “own electricity” are (i) based on data from the 1980 Population Census (available on IPUMSInternational), (ii) measured at the district level based on 1980 district boundaries, (iii) computed using the samplingweights needed to recover district-level population summary statistics, and (iv) restricted to the population in each districtthat did not arrive as immigrants in 1979 or earlier in 1980 (i.e., the still living population residing in the district in 1978).Standard errors in parentheses are clustered at the (1980) district level for the Census variables and allow for unrestrictedspatial correlation between all villages within 150 kilometers of each other (Conley, 1999) for the potential yield variables.
58
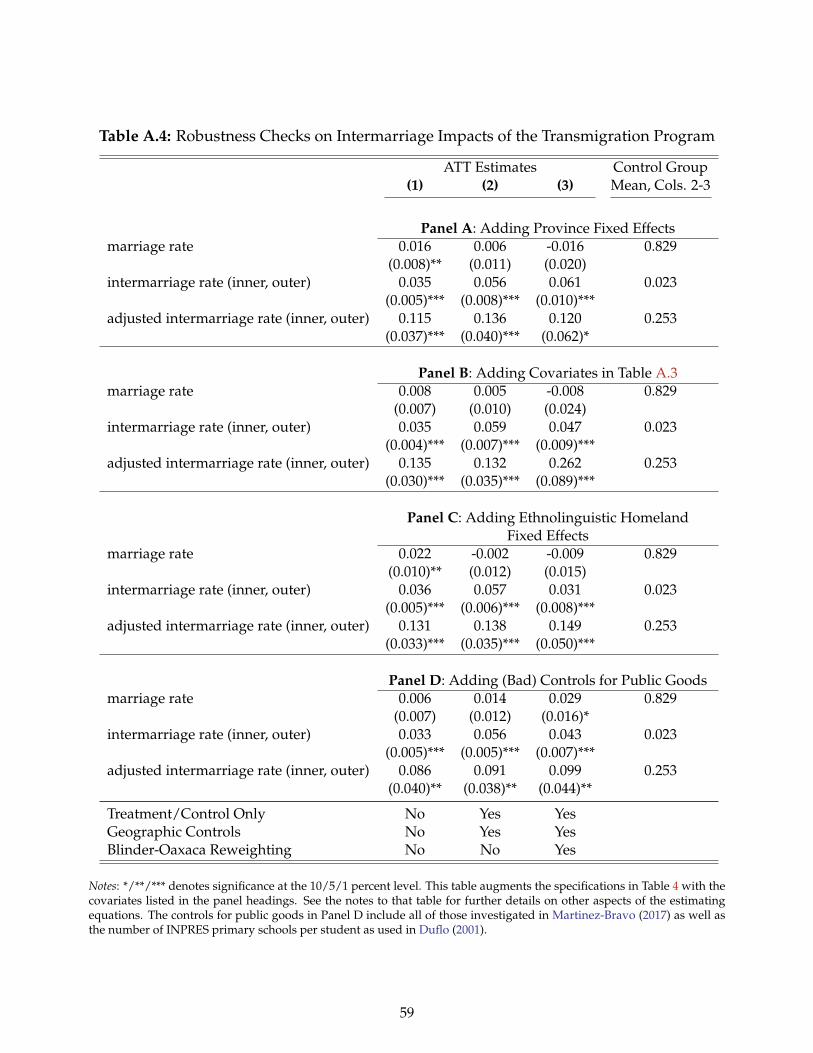
Table A.4: Robustness Checks on Intermarriage Impacts of the Transmigration Program
ATT Estimates Control Group(1) (2) (3) Mean, Cols. 2-3
Panel A: Adding Province Fixed Effectsmarriage rate 0.016 0.006 -0.016 0.829
(0.008)** (0.011) (0.020)intermarriage rate (inner, outer) 0.035 0.056 0.061 0.023
(0.005)*** (0.008)*** (0.010)***adjusted intermarriage rate (inner, outer) 0.115 0.136 0.120 0.253
(0.037)*** (0.040)*** (0.062)*
Panel B: Adding Covariates in Table A.3marriage rate 0.008 0.005 -0.008 0.829
(0.007) (0.010) (0.024)intermarriage rate (inner, outer) 0.035 0.059 0.047 0.023
(0.004)*** (0.007)*** (0.009)***adjusted intermarriage rate (inner, outer) 0.135 0.132 0.262 0.253
(0.030)*** (0.035)*** (0.089)***
Panel C: Adding Ethnolinguistic HomelandFixed Effects
marriage rate 0.022 -0.002 -0.009 0.829(0.010)** (0.012) (0.015)
intermarriage rate (inner, outer) 0.036 0.057 0.031 0.023(0.005)*** (0.006)*** (0.008)***
adjusted intermarriage rate (inner, outer) 0.131 0.138 0.149 0.253(0.033)*** (0.035)*** (0.050)***
Panel D: Adding (Bad) Controls for Public Goodsmarriage rate 0.006 0.014 0.029 0.829
(0.007) (0.012) (0.016)*intermarriage rate (inner, outer) 0.033 0.056 0.043 0.023
(0.005)*** (0.005)*** (0.007)***adjusted intermarriage rate (inner, outer) 0.086 0.091 0.099 0.253
(0.040)** (0.038)** (0.044)**
Treatment/Control Only No Yes YesGeographic Controls No Yes YesBlinder-Oaxaca Reweighting No No Yes
Notes: */**/*** denotes significance at the 10/5/1 percent level. This table augments the specifications in Table 4 with thecovariates listed in the panel headings. See the notes to that table for further details on other aspects of the estimatingequations. The controls for public goods in Panel D include all of those investigated in Martinez-Bravo (2017) as well asthe number of INPRES primary schools per student as used in Duflo (2001).
59

Table A.5: Ethnic Diversity, Segregation, and National Language Use At Home in Transmigration Villages
Conditional on Fixed Effects for the Indigenous Ethnolinguistic HomelandEstimator: OLS IV-GMM IV-GMM OLS IV-GMM IV-GMMDep. Var.: Indonesian is Main Language at Home (1) (2) (3) (4) (5) (6)
Inner Island ethnic share 0.674 1.376 1.082(0.373)* (0.201)*** (0.247)***
Inner Island ethnic share squared -0.944 -1.783 -1.548(0.423)** (0.208)*** (0.271)***
Inverted U Turning Point 0.357 0.386 0.367[p-value] [0.038]** [< 0.01]*** [< 0.01]***
Inner Island ethnic share, bottom tercile 0.112 0.156 0.172(0.058)* (0.073)** (0.067)**
Inner Island ethnic share, middle tercile 0.239 0.346 0.325(0.068)*** (0.062)*** (0.053)***
ethnic residential segregation (inner, outer) -0.096 -0.066(0.013)*** (0.010)***
Number of Individuals 2,126 2,126 2,126 2,126 2,126 2,126Mean Dependent Variable 0.25 0.25 0.25 0.25 0.25 0.25Kleibergen & Paap Wald Stat – 10.3 8.8 – 4.4 4.8Sanderson & Windmeijer Wald Stat, E1 – 60.3 86.9 – 7.3 7.7Sanderson & Windmeijer Wald Stat, E2 – 32.7 42.7 – 7.1 6.9Anderson & Rubin Weak Instrument Robust p-value – [< 0.01] [< 0.01] – [< 0.01] [< 0.01]Hansen J Test p-value – [0.25] [0.21] – [0.14] [0.30]Lochner & Moretti Wald Stat p-value – – – [0.25] – –
Notes: This table estimates the same set of specifications as in Table 6 but includes 53 dummy variables for the indigenous ethnolinguistic homeland (from Ethnologue)prevailing in the given village. Standard errors in all columns are clustered by district, of which there are 50. */**/*** denotes significant at the 10/5/1 percentsignificance levels.
60

Table A.6: Overall Ethnic Diversity and National Language Use At Home in TransmigrationVillages
Estimator: OLS IV-GMMDep. Var.: Indonesian is Main Language at Home (1) (2)
overall ethnic fractionalization 0.462 0.445(0.105)*** (0.057)***
Number of Individuals 2,126 2,126Kleibergen & Paap Wald Stat – 11.5Anderson & Rubin Weak Instrument Robust p-value – [< 0.01]Hansen J Test p-value – [0.40]
Notes: This table is restricted to the 134 villages in the treated areas from Table 5. The instrumental variables in column 2includes the ethnic fractionalization among native Java/Bali ethnic groups as well as dummies for 30 equally sized bins ofthe number initial transmigrants within 10 km of the given village. The null hypotheses of (i) the Anderson & Rubin testis that the coefficients on the endogenous variables jointly equal zero and the overidentifying restrictions are valid, and(ii) the Hansen J test is that the instruments are uncorrelated with the error term and correctly excluded from the secondstage. Standard errors in all columns are clustered by district, of which there are 50. */**/*** denotes significant at the10/5/1 percent significance levels.
Table A.7: Transmigration and Interethnic Preferences over the Long-RunNormalized Index of . . .
EthnicTolerance
NativeLeadership
(1) (2)
ATT: Transmigration village 0.138 -0.350(0.067)** (0.079)***
Number of Individuals 4,396 4,651
Notes: This table reports estimates of the treatment effects of living within 10 km of a Transmigration site (including thosesites) using Susenas 2012 household module. These estimates are based on the 325 treated villages and 132 control villagesin the dataset. The column 1 outcome is based on the question “Do you enjoy the activities of people of a different ethnicityin your village?”; column 2 is based on the question “Do you believe that district leaders must be a native?”. All responsesare on a four point scale, and we normalize the outcomes to have mean zero and standard deviation one. All regressionsare based on a specification analogous to column 2 in Table 3. Standard errors clustered by district are in parentheses.*/**/*** denotes significant at the 10/5/1 percent significance levels.
61