Embed Size (px)
Citation preview

Approved by the World Agricultural Outlook Board
United States Department of Agriculture
Foreign Agricultural Service
Circular Series WAP 1-20
January 2020
Brazil Soybeans: Brazil Expected to be World’s Leading Soybean Producer Despite Planting Delays Caused by Drought
Brazil’s 2019/20 soybean production is estimated at a record 123 million metric tons (mmt), unchanged from last month and up 6 million tons or 5 percent from last year. Area is estimated at a record 36.9 million hectares, unchanged from last month and up 1 million hectares or 3 percent from last year. Yield is estimated at 3.33 tons per hectare, unchanged from last month, but up 2 percent from last year and up 4 percent from the 5-year average. If weather cooperates this growing season, Brazil is expected to overtake the United States as the world’s leading soybean producer.
World Agricultural Production

Brazil’s soybean planting season is from September 16 through December 31 for most states. Most farmers tend to sow immediately after the onset of rains and after the vazio sanitário, which ends on September 16. The vazio sanitário is the mandatory sanitary period where no soybeans or soybean debris can be in the fields. Farmers who irrigate can sow soybeans earlier as long as emergence is after September 16, while other farmers must wait for the onset of rains. Rains typically arrive in mid-September for the largest soybean producing state, Mato Grosso (~33 mmt), and for second largest state producer, Paraná (~19 mmt). The latest states to plant soybeans include: Rio Grande do Sul (~18 mmt) and northeastern states of Maranhão, Tocantins, Piauí, and Bahia, or collectively known as the Matopiba region (~14 mmt).
Planting progress for 2019 was behind the average national pace and some crops are still being planted in early January. The largest planted area delays occurred in Mato Grosso do Sul and Paraná, where most of the crop was planted in late October and November. Irregular rains in November and December caused many Matopiba farmers to replant their soybeans while other farmers will switch to corn with a longer planting window extending into January and February. Crops in Rio Grande do Sul suffered from hot temperatures (>100oF) and extended dry spells in December which reportedly caused poor plant germination, low plant populations, reseeding, and extended soybean planting into early January. Early-planted crops also experienced water stress as these crops entered flowering and pod-filling stages in December. (For more information, please contact [email protected].)
Foreign Agricultural Service/USDA 2 January 2020Global Market Analysis

Russia Sunflowerseed: Yield Shatters Previous Record
Russia sunflowerseed production for 2019/20 is estimated at 15.3 million metric tons (mmt), up 6 percent from last month and 20 percent from last year. Total area is estimated at 8.4 million hectares, down 1 percent from last month and 6 percent from last year. Yield is estimated at 1.82 tons per hectare, up 7 percent from last month and 14 percent from last year. The month-to-month increase in yield is due to preliminary data from the Russian statistical agency, Rosstat.
Most of the country’s sunflowerseed was produced in three regions for 2019/20: the Volga District (accounting for 37 percent of production), the Southern District (accounting for 29 percent of production), and the Central District (accounting for 26 percent of production). High profitability for sunflowers has caused a steady rise in area since the turn of the century. Investment in hybrid seed varieties has led to increasing yields since 2010. USDA crop production estimates for Russia exclude estimated output from Crimea. (For more information, please contact [email protected].)
Foreign Agricultural Service/USDA 3 January 2020Global Market Analysis

Malaysia Palm Oil: Estimated Production Reduced Due to Below Average 2019 Rainfall
USDA estimates Malaysia 2019/20 palm oil production at 20.5 million metric tons (mmt), down 2 percent from last month and down 1 percent from last year. Harvested area is estimated at 5.35 million hectares, unchanged from last month, but up 1 percent from last year. Yield is estimated at 3.83 tons per hectare, down 3 percent from last month and down 2 percent from last year.
After above-average rainfall in 2017 and 2018, seasonal rains during 2019 under performed, negatively impacting current palm oil production. Latest reports from the Malaysia Palm Oil Board (MPOB) indicate cumulative crude palm oil (CPO) production for October and November at 3.33 mmt, down 13 percent from last year and the lowest cumulative total for October and November since 2008. On average,
Foreign Agricultural Service/USDA 4 January 2020Global Market Analysis

October and November represent the highest CPO output in the market year followed by August and September. USDA’s market year for Malaysia palm oil is October through September. (For additional information, please contact [email protected]).
Argentina Sunflowerseed: Area Decreased due to Early Dryness
USDA estimates Argentina sunflower production for 2019/20 at 3.2 million metric tons, down 3 percent from last month and down 16 percent from last year. Area is estimated at 1.6 million hectares, down 3 percent from last month and down 15 percent from last year. Yield is estimated at 2.00 tons per hectare, unchanged from last month, but down 2 percent from last year. Planting was slow at the start of the season due to dry conditions. Dry fields in parts of the provinces of Buenos Aires, Cordoba, and in the western sunflower regions slowed or stopped planting progress before rains finally came at the end of December. (For more information, please contact [email protected].)
Brazil Corn: Record Area and Production
Brazil’s 2019/20 corn production is estimated at a record 101 million metric tons (mmt), unchanged from last month and last year. Area is estimated at a record 18.1 million hectares, unchanged from last month and up 0.6 million hectares or 3 percent from last year. Yield is estimated at 5.58 tons per hectare, unchanged from last month, down 3 percent from last year and up 8 percent from the 5-year average.
Foreign Agricultural Service/USDA 5 January 2020Global Market Analysis

Brazil’s first-season (summer or main) corn production has been decreasing since 2007 while second-season (safrinha) corn production has grown and currently comprises approximately three-quarters of Brazil’s total corn production. The largest state producers of first-season corn are Rio Grande do Sul (~6 mmt), Minas Gerias (~4.8 mmt) and Paraná (~3.0 mmt); and largest producers of safrinha corn are the states of Mato Grosso (~31 mmt), Paraná (~12.8 mmt), Mato Grosso do Sul (~9.7 mmt) and Goias (~8.6 mmt).
The first-season corn area is forecast by CONAB (Companhia Nacional de Abastecimento or the National Food Supply Company), an agency of the Ministry of Agriculture in Brazil, at 4.2 mha and second-season corn area at 12.9 mha, or nearly the same as last year’s corn area. However, most analysts expect second-season corn area will be 4 percent higher compared to last year due to strong corn prices. Planting of the second-season crop will begin in January and second-season corn planters typically follow immediately behind soybean harvesters.
Most Center-South summer corn growing regions experienced favorable weather, but Rio Grande do Sul experienced long dry spells in December when approximately 50 to 75 percent of the crop was in critical pollination and grain-filling stages. However, any reductions in first-season corn output from unfavorable weather is expected to be offset by an increase in corn area for the second-season crop. (For more information, please contact [email protected]).
Foreign Agricultural Service/USDA 6 January 2020Global Market Analysis

Bangladesh Corn: Record Production
USDA estimates Bangladesh 2019/20 corn production at 4.0 million metric tons, up 14 percent from 2018 because of farmers switching to higher-yielding corn seed varieties and favorable weather. Yield is expected to reach record levels at 8.00 tons per hectare, up nearly 3 percent from 2018. Although the Fall Armyworm (Spodoptera frugiperda) is present in Bangladesh, the government of Bangladesh is taking steps in monitoring and managing any infestation. The area is estimated at 500,000 hectares, up 11 percent from 2018. Farmers are expanding corn acreage to meet the growing demand in the feed and aquaculture industry.
Corn is now the second largest cereal crop after rice. It is grown in Jessore, Bandarban, Rangamati, and Rajshahi districts on small plots during the boro season (November through March). (For more information, please contact [email protected].)
Russia Corn: Preliminary Rosstat Data Indicates Higher Area
Russia corn production for 2019/20 is estimated at 14.5 million metric tons (mmt), up 4 percent from last month and 27 percent from last year. Total area is estimated at 2.55 million hectares, up 4 percent from last month and 8 percent from last year. Yield is estimated at 5.69 tons per hectare, up less than 1 percent from last month and 18 percent from last year. The month-to-month increase in area is based on preliminary data from the Russian statistical agency, Rosstat.
Foreign Agricultural Service/USDA 7 January 2020Global Market Analysis
Most of the country’s corn was produced in three regions during the current season: the Central District (accounting for 40 percent of production), the Northwest District (accounting for 20 percent of production), and the Southern District (accounting for 10 percent of production). Typically, the preliminary production data reported by Rosstat increases from the preliminary estimate to the final estimate in March. The difference between preliminary and final reported corn production is usually reflected in harvested area rather than yield. (For more information, please contact [email protected].)
Australia Cotton: Production Forecast Down 69 Percent from Last Year
USDA forecasts 2019/20 Australia cotton production at 0.675 million 480-pound bales, down 175,000 bales (21 percent) from last month and 1.53 million (69 percent) from last year. Harvested area, essentially all irrigated, is estimated at 60,000 hectares, down 25 percent from last month, and 84 percent from last year. Below normal precipitation during the past six months and a lack of soil moisture for dryland sowing operations resulted in the 84 percent decrease in cotton area. Additionally, irrigation water availability has been severely depleted.
Foreign Agricultural Service/USDA 8 January 2020Global Market Analysis

Dryland planting tends to vary with the seasonal weather forecast and prices at sowing. Irrigated cotton yields are substantially higher than dryland yields, and the difference widens in low-rainfall years. Yield is forecast for 2019/20 Australia cotton at 2,449 kilograms per hectare, 33 percent above the 5-year average. On average, about 90 percent of Australia’s total cotton comes from irrigated areas, however, it is forecast that irrigated production will comprise nearly 99 percent of the total crop. Sorghum and cotton are the two dominant summer crops in eastern Australia. Cotton sowing began in October and harvest begins in April. (For more information, please contact [email protected].)
Foreign Agricultural Service/USDA 9 January 2020Global Market Analysis

Mali Cotton: Record Area but Delayed Rains Lowered Planting Intentions
Mali’s cotton production for 2019/20 is estimated at 1.35 million 480-pound bales, down 0.14 million bales or 9 percent from last month but up 0.08 million bales or 6 percent from last year. Harvested area is estimated at a record 735,000 thousand hectares, down 40,000 hectares or 5 percent from last month but up 10,000 hectares or 1 percent from last year. Yield is forecast at 400 kilograms per hectare, up 5 percent from last year but 2 percent below the 5-year average. Mali’s cotton is sown from May to July and harvest is from late October to December.
High fixed farm gate prices influenced farmers to plant more cotton area than last year, but late rains and drought caused farmers to plant less than their planting intentions. According to sources, late rains delayed planting and caused farmers to re-seed about 230,000 hectares, while the delayed rains also motivated other farmers to plant more drought resistant crops such as sorghum and millet. After the drought during the planting season, rains were average to above-average during the growing season and final yields are expected to be near-average. Satellite-derived Normalized Difference Vegetation Index (NDVI) observations for all major cotton producing regions indicate near-average vegetation conditions from July through September. (For more information, please contact [email protected].)
Australia Wheat: Production Revised Lower
USDA estimates Australia 2019/20 wheat production at 15.6 million metric tons (mmt), down 0.5 mmt (3 percent) from last month, and down 1.7 mmt (10 percent) from last year. Harvested area is expected to total 10.1 million hectares, unchanged from last month, and less than 1 percent below last year. Yield is forecast at 1.54 tons per hectare, 24 percent below the 5-year average.
Foreign Agricultural Service/USDA 10 January 2020Global Market Analysis

Following a good start to the growing season, Australia’s wheat prospects steadily declined throughout the season. Timely rainfall in May promoted sowing operations in most cropping regions of Western Australia, South Australia, Victoria, and southern New South Wales (NSW). In contrast, the eastern states of Queensland (QLD) and northern NSW received below-normal precipitation for the entire season, resulting in significantly lower yields. Most of the reduction occurred in NSW where a significant amount of wheat was cut for hay or grazed-off in early spring.
Harvest results indicate wheat yields are lower than previous expectations, reflecting below-average rainfall and soil moisture conditions during the critical flowering and grainfill stages. Satellite-derived Percent of Average Seasonal Greenness (PASG) vegetation indices show poor vegetation conditions for all areas of the wheat zone except for western Victoria, corroborating the severe drought in QLD and NSW. Dry conditions have accelerated crop development and harvesting was completed in late December. (For more information, please contact [email protected].)
Foreign Agricultural Service/USDA 11 January 2020Global Market Analysis
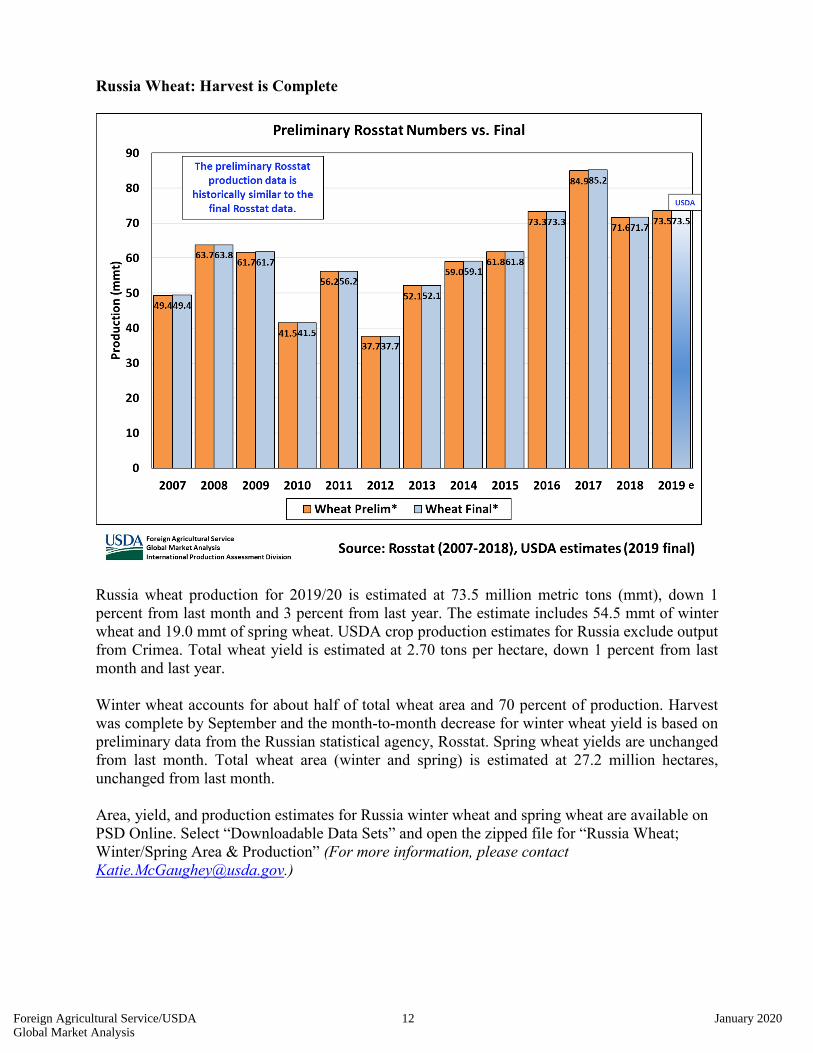
Russia Wheat: Harvest is Complete
Russia wheat production for 2019/20 is estimated at 73.5 million metric tons (mmt), down 1 percent from last month and 3 percent from last year. The estimate includes 54.5 mmt of winter wheat and 19.0 mmt of spring wheat. USDA crop production estimates for Russia exclude output from Crimea. Total wheat yield is estimated at 2.70 tons per hectare, down 1 percent from last month and last year.
Winter wheat accounts for about half of total wheat area and 70 percent of production. Harvest was complete by September and the month-to-month decrease for winter wheat yield is based on preliminary data from the Russian statistical agency, Rosstat. Spring wheat yields are unchanged from last month. Total wheat area (winter and spring) is estimated at 27.2 million hectares, unchanged from last month.
Area, yield, and production estimates for Russia winter wheat and spring wheat are available on PSD Online. Select “Downloadable Data Sets” and open the zipped file for “Russia Wheat; Winter/Spring Area & Production” (For more information, please contact [email protected].)
Foreign Agricultural Service/USDA 12 January 2020Global Market Analysis

Thailand Rice: Estimated Production Decreases Due to Area Reductions in Dry-Season Rice
USDA estimates Thailand 2019/20 rice production at 18.5 million metric tons milled basis, down 10 percent from last month and down 9 percent last year. Area harvested is estimated at 10.0 million hectares, down 8 percent from both last month and last year. Yield is estimated at 2.80 million tons per hectare, down 2 percent from both last month and last year.
Thailand rice is cultivated in three seasons: wet season (main) May to January, late-wet season November to April, and a dry-season (dryland) November to July. Favorable weather during the main rice season benefited crop development in the major rice producing regions, most notably in the North East region. Insufficient precipitation in the North region during the month of July, however, led to near record-low water levels in the region’s top two reservoirs, Bhumibol and Sirikit. These reservoirs provide approximately 80 percent of the irrigation water supply for the dryland rice crop (predominantly irrigated) in the lower North and Central Plains regions. According to Thailand’s Royal Irrigation Department, as of December 30, 2019, Bhumibol and Sirikit reservoir levels are down 39 percent and 35 percent, respectively, from last year. As a result, limited water supplies have caused the Thailand government to enforce water restrictions and urged some farmers (province specific) to not plant dryland rice. Rice production for the dry season represents 25 percent of total production. (For more information please contact [email protected])
Foreign Agricultural Service/USDA 13 January 2020Global Market Analysis

World Agricultural Production U.S. Department of Agriculture
Foreign Agricultural Service / Office of Global Analysis International Production Assessment Division (IPAD)
Ag Box 1051, Room 4630, South Building Washington, DC 20250-1051
https://ipad.fas.usda.gov/ Telephone: (202) 720-1662 Fax: (202) 720-1158
This report uses information from the Foreign Agricultural Service’s (FAS) global network of agricultural attachés and counselors, official statistics of foreign governments and other foreign source materials, and the analysis of economic data and satellite imagery. Estimates of foreign area, yield, and production are from the International Production Assessment Division, FAS, and are reviewed by USDA’s Inter-Agency Commodity Estimates Committee. Estimates of U.S. area, yield, and production are from USDA’s National Agricultural Statistics Service. Numbers within the report may not add to totals because of rounding. This report reflects official USDA estimates released in the World Agricultural Supply and Demand Estimates (WASDE-584), January 10, 2020. Printed copies are available from the National Technical Information Service. Download an order form at http://www.ntis.gov/products/specialty/usda/fas_a-g.asp, or call NTIS at 1-800-363-2068. The FAS International Production Assessment Division prepared this report. The next issue of World Agricultural Production will be released after 12:00 p.m. Eastern Time, February 11, 2020.
Conversion Table
Metric tons to bushels
Wheat, soybeans = MT * 36.7437 Corn, sorghum, rye = MT * 39.36825 Barley = MT * 45.929625 Oats = MT * 68.894438
Metric tons to 480-lb bales
Cotton = MT * 4.592917
Metric tons to hundredweight
Rice = MT * 22.04622
Area & weight
1 hectare = 2.471044 acres 1 kilogram = 2.204622 pounds
Foreign Agricultural Service/USDA 14 January 2020Global Market Analysis

For further information, contact: U.S. Department of Agriculture Foreign Agricultural Service
Office of Global Analysis International Production Assessment Division
Ag Box 1051, Room 4630, South Building Washington, DC 20250-1051
Telephone: (202) 720-1662 Fax: (202) 720-1158
GENERAL INFORMATION Director Ronald Frantz 202-720-4056 [email protected] Deputy Director Robert Tetrault 202-720-1071 [email protected] Administrative Assistant Dionndra Williams 202-720-1662 [email protected] USDA Remote Sensing Advisor Vacant Sr. Analyst/Technical Lead Curt Reynolds, Ph.D. 202-690-0134 [email protected] Sr. Analyst/ Satellite Imagery Dath Mita, Ph.D. 202-720-7339 [email protected] Archives Manager/Technical Lead Sr. Analyst/ Global Special Jim Crutchfield 202-690-0135 [email protected] Projects Manager/Technical Lead Sr. Analyst/Technical Lead Vacant GIS Mapping/Imagery Analyst Lisa Colson 202-720-6652 [email protected] WAP Coordinators Ifeoma Collins 202-720-0240 [email protected] Aaron Mulhollen 202-690-0131 [email protected] COUNTRY- AND REGION-SPECIFIC INFORMATION South America, Argentina, Venezuela, Denise McWilliams, Ph.D.202-720-0107 [email protected] and Colombia Western and Central Europe, Bryan Purcell 202-690-0138 [email protected] and North Africa Russia, Ukraine, Kazakhstan, Moldova, Katie McGaughey 202-720-9210 [email protected] and Belarus South Asia, Sri Lanka Arnella Trent 202-720-0881 [email protected] Bangladesh, India, and Nepal East Asia, China, and Japan Dath Mita, Ph.D. 202-720-7339 [email protected] Sub-Saharan Africa, Curt Reynolds, Ph.D. 202-690-0134 [email protected] Nigeria and South Africa S.E. Asia, Indonesia, Thailand, Malaysia, Justin Jenkins 202-720-0419 [email protected] Cambodia and Vietnam Central America, Mexico, Ifeoma Collins 202-720-0240 [email protected] and Western United States Australia, New Zealand, Pakistan Jim Crutchfield 202-690-0135 [email protected] Papua New Guinea and South Pacific Islands Middle East, Central Asia, Afghanistan Vacant Iraq, Iran, and Syria Canada, Caribbean, Aaron Mulhollen 202-690-0131 [email protected] Eastern United States Brazil Vacant
Foreign Agricultural Service/USDA 15 January 2020Global Market Analysis

The Foreign Agricultural Service (FAS) updates its production, supply and distribution (PSD) database for cotton, oilseeds, and grains at 12:00 p.m. on the day the World Agricultural Supply and Demand Estimates
(WASDE) report is released. This circular is released by 12:15 p.m.
FAS Reports and Databases:
Current World Market and Trade and World Agricultural Production Reports: http://apps.fas.usda.gov/psdonline/psdDataPublications.aspx
Archives World Market and Trade and World Agricultural Production Reports: http://usda.mannlib.cornell.edu/MannUsda/viewTaxonomy.do?taxonomyID=7
Production, Supply and Distribution Database (PSD Online): http://apps.fas.usda.gov/psdonline/psdHome.aspx
EU Countries Area & Production Estimates http://apps.fas.usda.gov/psdonline/psdDownload.aspx
Global Agricultural Trade System (U.S. Exports and Imports): http://apps.fas.usda.gov/gats/default.aspx
Export Sales Report: http://apps.fas.usda.gov/esrquery/
Global Agricultural Information Network (Agricultural Attaché Reports): http://gain.fas.usda.gov/Pages/Default.aspx
Other USDA Reports: World Agricultural Supply and Demand Estimates (WASDE):
http://www.usda.gov/oce/commodity/wasde/ Economic Research Service: http://www.ers.usda.gov/topics/crops
National Agricultural Statistics Service: http://www.nass.usda.gov/Publications/
Foreign Agricultural Service/USDA 16 January 2020Global Market Analysis

Million Metric Tons
Table 01 World Crop Production Summary
World
-
Total
Foreign
North
America
North
America
North
America
Former
Soviet
Former
Soviet
Europea
n
Asia
(WAP)
Asia
(WAP)
Asia
(WAP)
Asia
(WAP)
Asia
(WAP)
South
America
South
America
Selected
Other
Selected
Other
Selected
Other
All
Others
none
-
none
-
United
States
Mexico
-
Canada
-
Russia
-
Ukraine
-
none
-
China
-
India
-
Indo-
nesia
Paki-
stan
Thai-
land
Argen-
tina
Brazil
-
South
Africa
Turkey
-
none
-
Aus-
tralia
Commodity
---Million metric tons---
Wheat
2017/18 243.821.01.520.94.318.50.026.60.098.5134.3nr27.085.23.530.447.4715.5762.9
2018/19 prel. 228.719.01.917.35.419.50.025.10.099.9131.4nr25.171.73.032.251.3680.1731.4
2019/20 proj.
Dec 251.619.01.616.15.319.00.025.60.0102.2133.6nr29.074.53.332.452.3713.2765.4
Jan 252.219.01.615.65.219.00.025.60.0102.2133.6nr29.073.53.332.452.3712.1764.4
Coarse Grains
2017/18 343.512.313.612.285.139.35.16.211.946.9265.7nr34.141.733.226.2384.4977.01,361.4
2018/19 prel. 346.513.312.410.9104.359.25.76.612.043.0264.5nr44.535.033.426.2377.91,017.51,395.4
2019/20 proj.
Dec 354.414.514.510.2104.357.65.36.612.746.0269.2nr46.040.430.628.6360.81,040.91,401.7
Jan 355.014.514.510.0104.357.65.36.612.746.0268.2nr46.040.830.628.6361.21,040.61,401.8
Rice, Milled
2017/18 151.50.50.00.58.20.920.67.537.0112.8148.9nr0.00.60.20.05.7489.1494.8
2018/19 prel. 153.30.60.00.07.10.820.37.336.7116.4148.5nr0.00.70.20.07.1492.1499.2
2019/20 proj.
Dec 156.60.60.00.07.10.820.57.536.5115.0146.7nr0.00.70.20.06.0492.4498.4
Jan 157.00.60.00.07.10.818.57.536.5115.0146.7nr0.00.70.20.05.9490.8496.7
Total Grains
2017/18 738.833.815.133.697.558.725.640.348.9258.2548.9nr61.1127.536.956.6437.42,181.62,619.0
2018/19 prel. 728.532.914.328.3116.979.526.039.048.7259.3544.4nr69.6107.436.658.4436.32,189.62,626.0
2019/20 proj.
Dec 762.734.116.126.3116.877.425.839.749.2263.1549.6nr75.1115.634.160.9419.02,246.52,665.5
Jan 764.334.116.125.6116.777.423.839.749.2263.1548.5nr75.1115.034.160.9419.32,243.52,662.9
Oilseeds
2017/18 91.13.22.65.4125.842.51.04.013.835.459.6nr19.815.51.329.1131.5450.0581.4
2018/19 prel. 90.43.52.02.9121.861.01.03.814.135.560.0nr22.318.71.327.7130.7465.9596.6
2019/20 proj.
Dec 85.93.32.42.4127.958.01.13.214.436.462.6nr22.520.91.125.1107.6467.1574.6
Jan 85.73.22.42.3127.957.91.13.114.436.462.6nr22.521.71.125.1107.4467.2574.6
Cotton
2017/18 16.14.00.24.89.20.80.08.20.029.027.51.50.00.01.60.020.9102.9123.8
2018/19 prel. 15.43.70.22.212.51.10.07.60.025.827.81.70.00.01.70.018.499.8118.1
2019/20 proj.
Dec 16.23.60.20.912.51.00.06.20.029.527.32.00.00.01.60.020.2100.9121.1
Jan 16.23.40.20.712.51.00.06.10.029.527.32.00.00.01.60.020.1100.4120.5
1/ Includes wheat, coarse grains, and rice (milled) shown above.
Foreign Agricultural Service/USDA 17 January 2020Global Market Analysis

Table 02 Wheat Area, Yield, and Production
From last month From last year
MMTPercent
Yield
(Metric tons per hectare)
Jan 2017/18 MMT
Country / Region
Area
(Million hectares)
Production
(Million metric tons)
Change in Production
2017/18
Prel.
2018/19 Dec Dec
Prel.
2018/19 Jan
Prel.
2018/19 Dec Jan Percent
2019/20 Proj.2019/20 Proj. 2019/20 Proj.
2017/18
218.61World 4.5032.94-0.13-1.02764.39215.48 217.22 217.19 3.49 3.39 3.52 3.52 762.88 731.45 765.41
15.20United States 1.860.950.000.0052.2616.03 15.04 15.04 3.12 3.20 3.47 3.47 47.38 51.31 52.26
203.42Total Foreign 4.7031.99-0.14-1.02712.13199.45 202.18 202.16 3.52 3.41 3.53 3.52 715.50 680.14 713.15
none
26.16European Union - 28 12.5217.140.330.50154.0025.58 26.08 26.07 5.78 5.35 5.89 5.91 151.13 136.86 153.50
24.51China 1.642.160.000.00133.5924.27 23.73 23.73 5.48 5.42 5.63 5.63 134.33 131.43 133.59
South Asia
30.79 India 2.322.320.000.00102.1929.65 29.85 29.85 3.20 3.37 3.42 3.42 98.51 99.87 102.19
9.05 Pakistan 1.990.500.000.0025.608.80 8.80 8.80 2.94 2.85 2.91 2.91 26.60 25.10 25.60
2.10 Afghanistan 38.891.400.000.005.002.00 2.30 2.30 2.03 1.80 2.17 2.17 4.28 3.60 5.00
0.77 Nepal 0.000.000.000.001.790.76 0.76 0.76 2.31 2.35 2.35 2.35 1.78 1.79 1.79
Former Soviet Union - 12
27.37 Russia 2.531.82-1.34-1.0073.5026.34 27.20 27.20 3.11 2.72 2.74 2.70 85.17 71.69 74.50
14.67 Russia Winter 3.872.03-1.80-1.0054.5014.91 15.30 15.30 4.17 3.52 3.63 3.56 61.15 52.47 55.50
12.71 Russia Spring -1.12-0.220.000.0019.0011.44 11.90 11.90 1.89 1.68 1.60 1.60 24.01 19.22 19.00
6.64 Ukraine 15.743.940.000.0029.006.72 7.05 7.05 4.06 3.73 4.11 4.11 26.98 25.06 29.00
11.91 Kazakhstan -17.54-2.450.000.0011.5011.35 11.25 11.25 1.24 1.23 1.02 1.02 14.80 13.95 11.50
1.45 Uzbekistan 13.330.800.000.006.801.40 1.40 1.40 4.80 4.29 4.86 4.86 6.94 6.00 6.80
0.72 Belarus 58.401.060.000.002.880.66 0.75 0.75 3.65 2.75 3.83 3.83 2.62 1.82 2.88
8.98Canada 0.460.150.000.0032.359.88 9.66 9.66 3.38 3.26 3.35 3.35 30.38 32.20 32.35
South America
5.80 Argentina -2.56-0.500.000.0019.006.05 6.37 6.37 3.19 3.22 2.98 2.98 18.50 19.50 19.00
1.92 Brazil -4.20-0.23-1.89-0.105.202.04 2.05 2.04 2.23 2.66 2.59 2.55 4.26 5.43 5.30
0.19 Uruguay 4.400.030.000.000.760.20 0.23 0.23 2.37 3.68 3.30 3.30 0.44 0.73 0.76
10.92Australia -9.82-1.70-3.11-0.5015.6010.16 10.10 10.10 1.92 1.70 1.59 1.54 20.94 17.30 16.10
Africa
1.32 Egypt 3.790.320.000.008.771.32 1.37 1.37 6.40 6.40 6.40 6.40 8.45 8.45 8.77
3.32 Morocco -40.05-2.940.000.004.402.85 2.75 2.75 2.14 2.58 1.60 1.60 7.09 7.34 4.40
1.72 Ethiopia 0.000.000.000.004.801.84 1.85 1.85 2.81 2.61 2.59 2.59 4.83 4.80 4.80
1.60 Algeria 1.520.060.000.004.002.07 2.10 2.10 1.50 1.90 1.90 1.90 2.40 3.94 4.00
Middle East
7.80 Turkey 0.000.000.000.0019.007.62 7.20 7.20 2.69 2.50 2.64 2.64 21.00 19.00 19.00
6.70 Iran 15.862.300.000.0016.806.70 6.70 6.70 2.09 2.16 2.51 2.51 14.00 14.50 16.80
2.20 Iraq 60.001.800.000.004.801.70 2.40 2.40 1.82 1.76 2.00 2.00 4.00 3.00 4.80
1.10 Syria 140.002.800.000.004.801.10 1.60 1.60 2.00 1.82 3.00 3.00 2.20 2.00 4.80
0.67Mexico 10.000.300.000.003.300.54 0.61 0.61 5.24 5.56 5.41 5.41 3.49 3.00 3.30
0.54Serbia -13.33-0.400.000.002.600.65 0.58 0.58 4.26 4.63 4.48 4.48 2.30 3.00 2.60
7.18Others 6.961.310.400.0820.117.20 7.44 7.44 2.52 2.61 2.69 2.70 18.08 18.80 20.03
World and Selected Countries and Regions
Foreign Agricultural Service/USDA 18 January 2020Global Market Analysis

Table 03 Total Coarse Grain Area, Yield, and Production
From last month From last year
MMTPercent
Yield
(Metric tons per hectare)
Jan 2017/18 MMT
Country / Region
Area
(Million hectares)
Production
(Million metric tons)
Change in Production
2017/18
Prel.
2018/19 Dec Dec
Prel.
2018/19 Jan
Prel.
2018/19 Dec Jan Percent
2019/20 Proj.2019/20 Proj. 2019/20 Proj.
2017/18
327.80World 0.466.450.010.111,401.80327.63 331.99 331.90 4.15 4.26 4.22 4.22 1,361.36 1,395.36 1,401.70
36.76United States -4.42-16.720.100.37361.1936.20 36.36 36.21 10.46 10.44 9.92 9.98 384.39 377.91 360.82
291.04Total Foreign 2.2823.16-0.02-0.261,040.61291.43 295.64 295.69 3.36 3.49 3.52 3.52 976.97 1,017.45 1,040.87
none
44.57China 1.393.68-0.39-1.05268.2044.48 43.93 43.72 5.96 5.95 6.13 6.14 265.72 264.51 269.25
28.97European Union 7.5211.130.030.04159.0429.22 29.77 29.88 5.25 5.06 5.34 5.32 152.12 147.91 159.00
South America
17.83 Brazil 0.010.020.000.00104.3518.72 19.33 19.33 4.77 5.57 5.40 5.40 85.06 104.33 104.35
7.10 Argentina -2.71-1.600.000.0057.628.22 8.05 8.05 5.54 7.20 7.16 7.16 39.32 59.22 57.62
Former Soviet Union - 12
14.59 Russia 16.495.770.980.4040.7714.03 14.43 14.53 2.86 2.50 2.80 2.81 41.72 35.00 40.38
7.59 Ukraine 3.451.540.000.0046.047.58 8.01 8.01 4.49 5.87 5.75 5.75 34.07 44.50 46.04
2.49 Kazakhstan -0.80-0.040.000.005.192.97 3.41 3.41 1.79 1.76 1.52 1.52 4.45 5.23 5.19
1.00 Belarus 22.540.560.000.003.050.97 0.85 0.85 3.30 2.56 3.59 3.59 3.29 2.49 3.05
Africa
14.57 Nigeria -0.10-0.020.000.0019.9014.30 14.40 14.40 1.29 1.39 1.38 1.38 18.86 19.92 19.90
2.79 South Africa 17.232.140.000.0014.532.81 3.12 3.12 4.86 4.41 4.65 4.65 13.55 12.39 14.53
5.32 Tanzania 1.230.090.000.007.355.35 5.35 5.35 1.47 1.36 1.37 1.37 7.83 7.26 7.35
3.85 Burkina -6.62-0.320.000.004.503.85 3.85 3.85 0.97 1.25 1.17 1.17 3.73 4.82 4.50
5.55 Ethiopia 1.800.300.000.0017.005.65 5.65 5.65 3.01 2.96 3.01 3.01 16.68 16.70 17.00
1.02 Egypt -5.22-0.400.000.007.261.07 1.02 1.02 7.09 7.14 7.09 7.09 7.26 7.66 7.26
4.78 Mali -17.09-1.190.000.005.754.50 4.50 4.50 1.36 1.54 1.28 1.28 6.51 6.94 5.75
24.28India 6.932.980.000.0045.9522.22 23.66 23.66 1.93 1.93 1.94 1.94 46.94 42.97 45.95
Southeast Asia
3.65 Indonesia 5.830.700.000.0012.703.70 3.90 3.90 3.26 3.24 3.26 3.26 11.90 12.00 12.70
2.60 Philippines 6.470.490.000.008.102.48 2.55 2.55 3.10 3.07 3.18 3.18 8.08 7.61 8.10
1.04 Vietnam 6.360.290.000.004.850.95 1.00 1.00 4.72 4.80 4.85 4.85 4.91 4.56 4.85
1.15 Thailand -7.08-0.400.000.005.251.33 1.22 1.22 4.38 4.26 4.31 4.31 5.05 5.65 5.25
9.07Mexico -8.38-2.800.000.0030.608.95 8.56 8.56 3.66 3.73 3.57 3.57 33.19 33.40 30.60
4.74Canada 9.012.360.000.0028.565.00 5.51 5.51 5.54 5.24 5.19 5.19 26.24 26.19 28.56
5.59Australia -8.90-0.97-1.97-0.209.965.03 5.01 5.01 2.18 2.17 2.03 1.99 12.19 10.93 10.16
Middle East
4.15 Turkey 9.061.200.000.0014.454.34 4.53 4.53 2.96 3.05 3.19 3.19 12.27 13.25 14.45
1.78 Iran 24.881.000.000.005.021.73 1.91 1.91 2.43 2.32 2.63 2.63 4.34 4.02 5.02
70.96Others -2.83-3.340.490.56114.6471.98 72.14 72.20 1.57 1.64 1.58 1.59 111.69 117.97 114.08
World and Selected Countries and Regions; Coarse Grain includes: Barley, Corn, Millet, Mixed Grains, Oats, Rye and Sorghum
Foreign Agricultural Service/USDA 19 January 2020Global Market Analysis

Table 04 Corn Area, Yield, and Production
From last month From last year
MMTPercent
Yield
(Metric tons per hectare)
Jan 2017/18 MMT
Country / Region
Area
(Million hectares)
Production
(Million metric tons)
Change in Production
2017/18
Prel.
2018/19 Dec Dec
Prel.
2018/19 Jan
Prel.
2018/19 Dec Jan Percent
2019/20 Proj.2019/20 Proj. 2019/20 Proj.
2017/18
192.12World -1.04-11.630.202.221,110.84191.67 192.05 192.17 5.62 5.86 5.77 5.78 1,079.91 1,122.46 1,108.62
33.48United States -4.52-16.480.220.78347.7832.89 33.11 32.98 11.08 11.07 10.48 10.55 371.10 364.26 347.01
158.64Total Foreign 0.644.860.191.44763.05158.78 158.94 159.20 4.47 4.78 4.79 4.79 708.82 758.20 761.61
none
42.40China 1.343.440.000.00260.7742.13 41.28 41.28 6.11 6.11 6.32 6.32 259.07 257.33 260.77
South America
16.60 Brazil 0.000.000.000.00101.0017.50 18.10 18.10 4.94 5.77 5.58 5.58 82.00 101.00 101.00
5.20 Argentina -1.96-1.000.000.0050.006.10 6.10 6.10 6.15 8.36 8.20 8.20 32.00 51.00 50.00
0.46 Bolivia -6.67-0.070.000.000.980.40 0.35 0.35 2.73 2.65 2.80 2.80 1.26 1.05 0.98
8.26European Union 1.220.780.680.4465.008.27 8.59 8.70 7.51 7.77 7.51 7.47 62.02 64.22 64.56
Africa
2.63 South Africa 18.642.200.000.0014.002.60 2.90 2.90 4.97 4.54 4.83 4.83 13.10 11.80 14.00
6.54 Nigeria 0.000.000.000.0011.006.50 6.50 6.50 1.59 1.69 1.69 1.69 10.42 11.00 11.00
2.23 Ethiopia 0.600.050.000.008.402.30 2.30 2.30 3.77 3.63 3.65 3.65 8.40 8.35 8.40
0.80 Egypt -5.88-0.400.000.006.400.85 0.80 0.80 8.00 8.00 8.00 8.00 6.40 6.80 6.40
4.20 Tanzania -1.16-0.070.000.006.204.20 4.20 4.20 1.59 1.49 1.48 1.48 6.68 6.27 6.20
1.73 Malawi 21.780.610.000.003.401.70 1.70 1.70 2.01 1.64 2.00 2.00 3.46 2.79 3.40
1.43 Zambia -16.33-0.390.000.002.001.09 0.84 0.84 2.52 2.21 2.38 2.38 3.61 2.40 2.00
2.09 Kenya -15.00-0.600.000.003.402.20 2.00 2.00 1.52 1.82 1.70 1.70 3.19 4.00 3.40
1.19 Uganda -0.88-0.030.000.002.801.19 1.15 1.15 2.54 2.37 2.43 2.43 3.02 2.83 2.80
1.88 Zimbabwe -54.32-0.920.000.000.781.72 1.62 1.62 1.15 0.99 0.48 0.48 2.16 1.70 0.78
Former Soviet Union - 12
4.43 Ukraine -0.85-0.310.000.0035.504.57 4.90 4.90 5.44 7.84 7.24 7.24 24.12 35.81 35.50
2.69 Russia 27.033.093.570.5014.502.37 2.45 2.55 4.90 4.81 5.71 5.69 13.20 11.42 14.00
South Asia
9.38 India 6.501.770.000.0029.009.20 9.50 9.50 3.07 2.96 3.05 3.05 28.75 27.23 29.00
1.23 Pakistan 0.000.000.000.006.101.32 1.33 1.33 4.63 4.62 4.59 4.59 5.70 6.10 6.10
0.90 Nepal 0.000.000.000.002.550.90 0.90 0.90 2.84 2.83 2.83 2.83 2.56 2.55 2.55
Southeast Asia
3.65 Indonesia 5.830.700.000.0012.703.70 3.90 3.90 3.26 3.24 3.26 3.26 11.90 12.00 12.70
2.60 Philippines 6.470.490.000.008.102.48 2.55 2.55 3.10 3.07 3.18 3.18 8.08 7.61 8.10
1.04 Vietnam 6.360.290.000.004.850.95 1.00 1.00 4.72 4.80 4.85 4.85 4.91 4.56 4.85
1.13 Thailand -7.14-0.400.000.005.201.30 1.19 1.19 4.44 4.31 4.37 4.37 5.00 5.60 5.20
7.32Mexico -9.42-2.600.000.0025.007.20 6.80 6.80 3.77 3.83 3.68 3.68 27.57 27.60 25.00
1.41Canada -3.49-0.490.000.0013.401.43 1.45 1.45 10.02 9.70 9.24 9.24 14.10 13.89 13.40
0.53Turkey 5.260.300.000.006.000.53 0.52 0.52 10.00 10.75 11.54 11.54 5.30 5.70 6.00
24.70Others -2.42-1.590.790.5064.0224.09 24.01 24.06 2.46 2.72 2.65 2.66 60.85 65.61 63.52
World and Selected Countries and Regions
Foreign Agricultural Service/USDA 20 January 2020Global Market Analysis

Table 05 Barley Area, Yield, and Production
From last month From last year
MMTPercent
Yield
(Metric tons per hectare)
Jan 2017/18 MMT
Country / Region
Area
(Million hectares)
Production
(Million metric tons)
Change in Production
2017/18
Prel.
2018/19 Dec Dec
Prel.
2018/19 Jan
Prel.
2018/19 Dec Jan Percent
2019/20 Proj.2019/20 Proj. 2019/20 Proj.
2017/18
47.37World 12.5117.35-0.48-0.75156.0548.06 51.85 51.64 3.02 2.89 3.02 3.02 143.10 138.70 156.80
0.79United States 10.440.350.000.003.690.80 0.88 0.88 3.93 4.17 4.18 4.18 3.12 3.34 3.69
46.57Total Foreign 12.5617.00-0.49-0.75152.3647.26 50.97 50.76 3.01 2.86 3.00 3.00 139.98 135.35 153.11
none
12.10European Union 12.266.850.800.5062.7512.31 12.38 12.38 4.85 4.54 5.03 5.07 58.65 55.90 62.25
Former Soviet Union - 12
7.71 Russia 19.503.260.000.0020.007.78 8.40 8.40 2.62 2.15 2.38 2.38 20.21 16.74 20.00
2.65 Ukraine 24.931.900.000.009.502.57 2.70 2.70 3.28 2.96 3.52 3.52 8.70 7.60 9.50
2.07 Kazakhstan -1.79-0.070.000.003.902.52 2.95 2.95 1.60 1.58 1.32 1.32 3.31 3.97 3.90
0.45 Belarus 48.310.460.000.001.400.43 0.40 0.40 3.14 2.20 3.50 3.50 1.42 0.94 1.40
0.32 Azerbaijan 0.000.000.000.000.870.32 0.32 0.32 2.48 2.72 2.72 2.72 0.79 0.87 0.87
2.11Canada 24.112.020.000.0010.402.40 2.70 2.70 3.73 3.50 3.85 3.85 7.89 8.38 10.40
4.12Australia -1.32-0.11-2.38-0.208.203.72 3.95 3.95 2.24 2.23 2.13 2.08 9.25 8.31 8.40
Middle East
3.40 Turkey 12.860.900.000.007.903.60 3.80 3.80 1.88 1.94 2.08 2.08 6.40 7.00 7.90
1.60 Iran 28.570.800.000.003.601.55 1.70 1.70 1.94 1.81 2.12 2.12 3.10 2.80 3.60
0.78 Iraq 105.130.820.000.001.600.60 1.20 1.20 1.26 1.30 1.33 1.33 0.98 0.78 1.60
0.80 Syria 400.001.600.000.002.000.80 1.50 1.50 0.97 0.50 1.33 1.33 0.78 0.40 2.00
Africa
0.96 Ethiopia 4.550.100.000.002.301.00 1.00 1.00 2.13 2.20 2.30 2.30 2.03 2.20 2.30
1.89 Morocco -65.64-1.910.000.001.001.60 1.45 1.45 1.30 1.82 0.69 0.69 2.47 2.91 1.00
0.76 Algeria 5.130.100.000.002.051.03 1.03 1.03 1.27 1.90 2.00 2.00 0.97 1.95 2.05
0.39 Tunisia 109.680.340.000.000.650.31 0.40 0.40 1.02 0.99 1.63 1.63 0.40 0.31 0.65
0.09 South Africa -13.51-0.060.000.000.370.12 0.13 0.13 3.37 3.55 2.77 2.77 0.31 0.42 0.37
South America
0.94 Argentina -7.11-0.360.000.004.701.20 1.20 1.20 4.00 4.22 3.92 3.92 3.74 5.06 4.70
0.14 Uruguay 9.570.060.000.000.630.15 0.17 0.17 2.67 3.83 3.82 3.82 0.39 0.58 0.63
0.11 Brazil 17.800.060.000.000.420.11 0.12 0.12 2.61 3.16 3.56 3.56 0.28 0.35 0.42
0.66India -1.74-0.030.000.001.750.66 0.66 0.66 2.66 2.69 2.64 2.64 1.75 1.78 1.75
0.33China -5.96-0.06-53.85-1.050.900.26 0.47 0.26 3.29 3.64 4.15 3.46 1.09 0.96 1.95
0.36Mexico 1.410.010.000.001.010.35 0.36 0.36 2.81 2.82 2.81 2.81 1.01 1.00 1.01
0.07Afghanistan 338.600.190.000.000.250.06 0.18 0.18 1.40 0.95 1.39 1.39 0.10 0.06 0.25
1.76Others 3.130.130.000.004.221.82 1.81 1.81 2.27 2.25 2.33 2.33 4.00 4.09 4.22
World and Selected Countries and Regions
Foreign Agricultural Service/USDA 21 January 2020Global Market Analysis

Table 06 Oats Area, Yield, and Production
From last month From last year
MMTPercent
Yield
(Metric tons per hectare)
Jan 2017/18 MMT
Country / Region
Area
(Million hectares)
Production
(Million metric tons)
Change in Production
2017/18
Prel.
2018/19 Dec Dec
Prel.
2018/19 Jan
Prel.
2018/19 Dec Jan Percent
2019/20 Proj.2019/20 Proj. 2019/20 Proj.
2017/18
9.86World 3.420.750.690.1622.679.72 9.26 9.27 2.40 2.26 2.43 2.44 23.70 21.92 22.51
0.33United States -5.40-0.040.000.000.770.35 0.33 0.33 2.22 2.33 2.31 2.31 0.72 0.82 0.77
9.54Total Foreign 3.760.790.710.1621.909.37 8.93 8.94 2.41 2.25 2.43 2.45 22.98 21.10 21.74
none
2.67European Union 2.660.210.000.007.922.71 2.55 2.55 3.02 2.84 3.10 3.10 8.06 7.72 7.92
Former Soviet Union - 12
2.78 Russia -6.68-0.322.330.104.402.73 2.40 2.40 1.96 1.73 1.79 1.83 5.45 4.72 4.30
0.21 Ukraine 1.650.010.000.000.430.20 0.18 0.18 2.31 2.14 2.39 2.39 0.48 0.42 0.43
0.15 Belarus 31.580.110.000.000.450.15 0.15 0.15 3.33 2.26 3.00 3.00 0.50 0.34 0.45
0.21 Kazakhstan 1.190.000.000.000.340.24 0.24 0.24 1.34 1.43 1.45 1.45 0.29 0.34 0.34
1.05Canada 21.070.720.000.004.161.01 1.16 1.16 3.55 3.42 3.59 3.59 3.73 3.44 4.16
South America
0.22 Argentina -40.56-0.230.000.000.340.24 0.13 0.13 2.24 2.40 2.54 2.54 0.49 0.57 0.34
0.34 Brazil 3.770.030.000.000.830.38 0.38 0.38 1.86 2.11 2.17 2.17 0.63 0.80 0.83
0.11 Chile 14.290.0614.290.060.440.08 0.07 0.08 5.31 5.13 5.50 5.50 0.57 0.39 0.39
0.02 Uruguay -50.94-0.030.000.000.030.03 0.01 0.01 1.68 2.04 1.86 1.86 0.03 0.05 0.03
Oceania
0.87 Australia 5.290.050.000.000.940.68 0.68 0.68 1.40 1.31 1.39 1.39 1.23 0.89 0.94
0.01 New Zealand 32.000.010.000.000.030.01 0.01 0.01 5.83 5.00 5.50 5.50 0.04 0.03 0.03
0.48China 8.700.050.000.000.630.50 0.53 0.53 1.16 1.15 1.19 1.19 0.55 0.58 0.63
Africa
0.09 Algeria 0.000.000.000.000.110.09 0.09 0.09 1.29 1.29 1.29 1.29 0.11 0.11 0.11
0.03 Morocco -36.51-0.020.000.000.040.05 0.05 0.05 1.17 1.40 0.89 0.89 0.04 0.06 0.04
0.02 South Africa 21.210.010.000.000.040.02 0.03 0.03 1.53 1.65 1.60 1.60 0.02 0.03 0.04
Other Europe
0.07 Norway 108.330.160.000.000.300.07 0.07 0.07 4.16 2.09 4.29 4.29 0.28 0.14 0.30
0.03 Serbia 0.000.000.000.000.070.03 0.03 0.03 2.17 2.17 2.17 2.17 0.07 0.07 0.07
0.02 Albania 11.110.000.000.000.030.01 0.01 0.01 2.27 2.08 2.14 2.14 0.03 0.03 0.03
0.01 Bosnia and Herzegovina 7.690.000.000.000.040.01 0.01 0.01 2.73 2.79 3.00 3.00 0.03 0.04 0.04
0.11Turkey 0.000.000.000.000.230.10 0.10 0.10 2.21 2.30 2.30 2.30 0.25 0.23 0.23
0.04Mexico -12.62-0.010.000.000.090.05 0.05 0.05 1.64 2.06 1.80 1.80 0.07 0.10 0.09
0.01Others -13.330.000.000.000.030.02 0.01 0.01 1.79 2.00 1.86 1.86 0.03 0.03 0.03
World and Selected Countries and Regions
Foreign Agricultural Service/USDA 22 January 2020Global Market Analysis

Table 07 Rye Area, Yield, and Production
From last month From last year
MMTPercent
Yield
(Metric tons per hectare)
Jan 2017/18 MMT
Country / Region
Area
(Million hectares)
Production
(Million metric tons)
Change in Production
2017/18
Prel.
2018/19 Dec Dec
Prel.
2018/19 Jan
Prel.
2018/19 Dec Jan Percent
2019/20 Proj.2019/20 Proj. 2019/20 Proj.
2017/18
4.02World 15.341.53-1.45-0.1711.533.74 3.69 3.69 3.06 2.68 3.17 3.13 12.31 10.00 11.70
0.12United States 26.170.060.000.000.270.11 0.13 0.13 2.15 1.95 2.16 2.16 0.26 0.21 0.27
3.90Total Foreign 15.111.48-1.49-0.1711.263.63 3.56 3.56 3.09 2.70 3.21 3.16 12.05 9.78 11.43
none
1.93European Union 28.121.750.000.007.951.92 2.07 2.07 3.83 3.23 3.84 3.84 7.41 6.21 7.95
Former Soviet Union - 12
1.17 Russia -25.29-0.48-10.63-0.171.430.96 0.83 0.83 2.17 2.00 1.94 1.73 2.54 1.91 1.60
0.26 Belarus 29.220.150.000.000.650.25 0.20 0.20 2.62 2.00 3.25 3.25 0.67 0.50 0.65
0.17 Ukraine -14.14-0.060.000.000.340.15 0.11 0.11 2.97 2.66 3.09 3.09 0.51 0.40 0.34
0.03 Kazakhstan 8.700.000.000.000.030.02 0.02 0.02 1.26 1.05 1.25 1.25 0.04 0.02 0.03
0.10Turkey 0.000.000.000.000.320.11 0.11 0.11 3.17 2.91 2.91 2.91 0.32 0.32 0.32
0.10Canada 39.830.090.000.000.330.08 0.10 0.10 3.39 2.99 3.30 3.30 0.34 0.24 0.33
South America
0.00 Chile 0.000.000.000.000.010.00 0.00 0.00 5.00 5.00 5.00 5.00 0.01 0.01 0.01
0.05 Argentina -13.79-0.010.000.000.080.05 0.04 0.04 1.91 1.78 2.14 2.14 0.09 0.09 0.08
Other Europe
0.00 Bosnia and Herzegovina 27.270.000.000.000.010.00 0.00 0.00 3.67 2.75 3.50 3.50 0.01 0.01 0.01
0.00 Switzerland 0.000.000.000.000.010.00 0.00 0.00 5.50 5.50 5.50 5.50 0.01 0.01 0.01
0.00 Serbia 0.000.000.000.000.010.00 0.00 0.00 2.50 2.50 2.50 2.50 0.01 0.01 0.01
0.04Australia 0.000.000.000.000.030.04 0.04 0.04 0.75 0.68 0.68 0.68 0.03 0.03 0.03
0.04Others 121.880.040.000.000.070.03 0.04 0.04 1.84 1.00 1.87 1.87 0.07 0.03 0.07
World and Selected Countries and Regions
Foreign Agricultural Service/USDA 23 January 2020Global Market Analysis

Table 08 Sorghum Area, Yield, and Production
From last month From last year
MMTPercent
Yield
(Metric tons per hectare)
Jan 2017/18 MMT
Country / Region
Area
(Million hectares)
Production
(Million metric tons)
Change in Production
2017/18
Prel.
2018/19 Dec Dec
Prel.
2018/19 Jan
Prel.
2018/19 Dec Jan Percent
2019/20 Proj.2019/20 Proj. 2019/20 Proj.
2017/18
39.55World -3.88-2.32-0.71-0.4157.4940.12 40.82 40.81 1.47 1.49 1.42 1.41 58.28 59.81 57.90
2.04United States -6.45-0.60-4.52-0.418.672.05 1.91 1.89 4.50 4.53 4.76 4.58 9.19 9.27 9.08
37.51Total Foreign -3.41-1.730.000.0048.8238.07 38.92 38.92 1.31 1.33 1.25 1.25 49.09 50.54 48.82
none
Africa
5.82 Nigeria 1.470.100.000.006.905.80 5.90 5.90 1.19 1.17 1.17 1.17 6.94 6.80 6.90
1.90 Ethiopia 0.970.050.000.005.201.90 1.90 1.90 2.72 2.71 2.74 2.74 5.17 5.15 5.20
5.41 Sudan -19.24-0.950.000.004.007.00 7.00 7.00 0.69 0.71 0.57 0.57 3.74 4.95 4.00
1.67 Burkina -6.74-0.130.000.001.801.80 1.80 1.80 0.82 1.07 1.00 1.00 1.37 1.93 1.80
1.39 Mali -11.56-0.170.000.001.301.50 1.50 1.50 1.03 0.98 0.87 0.87 1.42 1.47 1.30
3.82 Niger -9.52-0.200.000.001.903.70 3.70 3.70 0.51 0.57 0.51 0.51 1.95 2.10 1.90
0.85 Cameroon 0.000.000.000.001.200.85 0.85 0.85 1.59 1.41 1.41 1.41 1.35 1.20 1.20
0.78 Tanzania 19.050.130.000.000.800.80 0.80 0.80 0.96 0.84 1.00 1.00 0.76 0.67 0.80
0.14 Egypt 0.000.000.000.000.750.14 0.14 0.14 5.36 5.36 5.36 5.36 0.75 0.75 0.75
0.42 Uganda -7.54-0.030.000.000.380.42 0.41 0.41 0.75 0.98 0.93 0.93 0.32 0.41 0.38
0.25 Ghana -11.39-0.040.000.000.280.25 0.25 0.25 1.11 1.26 1.12 1.12 0.28 0.32 0.28
0.21 Mozambique 10.170.030.000.000.330.25 0.30 0.30 1.19 1.18 1.08 1.08 0.25 0.30 0.33
0.03 South Africa -11.11-0.020.000.000.120.05 0.05 0.05 3.97 2.70 2.67 2.67 0.12 0.14 0.12
1.35Mexico -4.26-0.200.000.004.501.35 1.35 1.35 3.37 3.48 3.33 3.33 4.55 4.70 4.50
South America
0.70 Argentina 0.000.000.000.002.500.63 0.58 0.58 4.29 3.97 4.35 4.35 3.00 2.50 2.50
0.78 Brazil -3.54-0.080.000.002.100.73 0.73 0.73 2.73 2.97 2.88 2.88 2.14 2.18 2.10
South Asia
5.02 India 19.680.740.000.004.504.01 5.00 5.00 0.96 0.94 0.90 0.90 4.80 3.76 4.50
0.26 Pakistan 0.000.000.000.000.140.24 0.24 0.24 0.60 0.59 0.58 0.58 0.15 0.14 0.14
0.51China 4.350.150.000.003.600.72 0.75 0.75 4.87 4.79 4.80 4.80 2.47 3.45 3.60
0.46Australia -68.70-0.880.000.000.400.50 0.25 0.25 2.72 2.58 1.60 1.60 1.26 1.28 0.40
0.12European Union 11.260.080.000.000.820.14 0.16 0.16 5.32 5.46 5.22 5.22 0.66 0.74 0.82
5.61Others -5.63-0.320.000.005.305.30 5.27 5.27 1.01 1.06 1.01 1.01 5.66 5.62 5.30
World and Selected Countries and Regions
Foreign Agricultural Service/USDA 24 January 2020Global Market Analysis

World and Selected Countries and Regions
Table 09 Rice Area, Yield, and Production
From last month From last year
MMTPercent
Yield
(Metric tons per hectare)
Jan 2017/18 MMT
Country / Region
Area
(Million hectares)
Production
(Million metric tons)
Change in Production
2017/18
Prel.
2018/19 Dec Dec
Prel.
2018/19 Jan
Prel.
2018/19 Dec Jan Percent
2019/20 Proj.2019/20 Proj. 2019/20 Proj.
2017/18
162.96World -0.50-2.50-0.35-1.73496.67162.67 162.19 161.29 4.53 4.58 4.59 4.60 494.80 499.16 498.40
0.96United States -17.49-1.24-1.73-0.105.861.18 1.00 1.00 8.41 8.62 8.51 8.38 5.66 7.11 5.97
162.00Total Foreign -0.25-1.25-0.33-1.63490.80161.49 161.19 160.29 4.51 4.55 4.57 4.58 489.14 492.05 492.43
none
East Asia
30.75 China -1.19-1.760.000.00146.7330.19 29.69 29.69 6.92 7.03 7.06 7.06 148.87 148.49 146.73
1.56 Japan 1.870.140.000.007.801.55 1.55 1.55 6.87 6.79 6.93 6.93 7.79 7.66 7.80
0.76 Korea, South -3.21-0.120.000.003.740.74 0.73 0.73 7.01 6.99 6.84 6.84 3.97 3.87 3.74
0.48 Korea, North 0.000.000.000.001.360.50 0.50 0.50 5.09 4.18 4.18 4.18 1.57 1.36 1.36
South Asia
43.77 India -1.22-1.420.000.00115.0043.80 43.50 43.50 3.86 3.99 3.97 3.97 112.76 116.42 115.00
11.27 Bangladesh 2.700.940.990.3535.8511.77 11.83 11.83 4.35 4.45 4.50 4.55 32.65 34.91 35.50
2.80 Pakistan 2.740.200.000.007.502.88 2.90 2.90 4.02 3.80 3.88 3.88 7.50 7.30 7.50
1.49 Nepal -5.36-0.200.000.003.531.50 1.50 1.50 3.34 3.73 3.53 3.53 3.31 3.73 3.53
0.77 Sri Lanka -2.27-0.070.000.003.060.98 1.00 1.00 4.30 4.72 4.50 4.50 2.25 3.13 3.06
Southeast Asia
12.25 Indonesia -0.54-0.200.000.0036.5012.10 12.00 12.00 4.76 4.78 4.79 4.79 37.00 36.70 36.50
7.65 Vietnam 1.920.530.000.0028.307.62 7.67 7.67 5.79 5.83 5.91 5.91 27.66 27.77 28.30
10.76 Thailand -9.05-1.84-9.76-2.0018.5010.83 10.90 10.00 2.90 2.85 2.85 2.80 20.58 20.34 20.50
7.10 Burma 0.950.130.000.0013.307.10 7.10 7.10 2.90 2.90 2.93 2.93 13.20 13.18 13.30
4.84 Philippines 2.280.270.000.0012.004.74 4.70 4.70 4.01 3.93 4.05 4.05 12.24 11.73 12.00
3.18 Cambodia 0.980.060.000.005.693.19 3.19 3.19 2.86 2.89 2.92 2.92 5.55 5.63 5.69
0.96 Laos 22.020.370.000.002.050.86 0.99 0.99 3.29 3.12 3.30 3.30 2.00 1.68 2.05
0.70 Malaysia 0.000.000.000.001.830.70 0.70 0.70 4.03 4.01 4.01 4.01 1.82 1.83 1.83
South America
1.97 Brazil 0.000.000.000.007.141.70 1.68 1.68 6.12 6.18 6.25 6.25 8.20 7.14 7.14
0.42 Peru 0.000.000.000.002.150.44 0.42 0.42 7.20 7.16 7.51 7.51 2.10 2.15 2.15
Africa
0.76 Egypt 53.571.500.000.004.300.46 0.76 0.76 8.18 8.78 8.20 8.20 4.30 2.80 4.30
1.43 Madagascar 5.000.130.000.002.691.50 1.50 1.50 2.18 2.67 2.80 2.80 1.98 2.56 2.69
3.60 Nigeria 2.340.110.000.004.903.60 3.60 3.60 2.08 2.11 2.16 2.16 4.73 4.79 4.90
0.43European Union 2.400.050.000.002.000.41 0.42 0.42 6.78 6.81 6.86 6.86 2.03 1.96 2.00
0.57Iran 0.000.000.000.001.990.58 0.58 0.58 5.33 5.25 5.25 5.25 2.01 1.99 1.99
11.74Others -0.26-0.060.100.0222.8911.77 11.80 11.80 2.99 2.97 2.95 2.95 23.07 22.95 22.87
Yield is on a rough basis, before the milling process. Production is on a milled basis, after the milling process.
Foreign Agricultural Service/USDA 25 January 2020Global Market Analysis

World and Selected Countries and Regions
Table 10 Total Oilseed Area, Yield, and Production
From last month From last year
MMTPercent
Yield
(Metric tons per hectare)
Jan 2017/18 MMT
Country / Region
Area
(Million hectares)
Production
(Million metric tons)
Change in Production
2017/18
Prel.
2018/19 Dec Dec
Prel.
2018/19 Jan
Prel.
2018/19 Dec Jan Percent
2019/20 Proj.2019/20 Proj. 2019/20 Proj.
2017/18
--World Total -3.69-22.000.000.01574.63-- -- -- -- -- -- -- 581.45 596.64 574.62
--Total Foreign 0.281.290.030.16467.21-- -- -- -- -- -- -- 449.97 465.92 467.05
--Oilseed, Copra -2.84-0.170.000.005.81-- -- -- -- -- -- -- 5.94 5.98 5.81
--Oilseed, Palm Kernel 1.900.37-1.00-0.2019.82-- -- -- -- -- -- -- 18.76 19.45 20.02
none
247.19Major OilSeeds -3.89-22.200.040.21549.00248.75 244.91 244.02 2.25 2.30 2.24 2.25 556.76 571.21 548.80
42.80United States -17.82-23.29-0.14-0.15107.4241.42 37.57 36.98 3.07 3.16 2.86 2.90 131.48 130.72 107.57
none
204.39Foreign Oilseeds 0.251.090.080.36441.58207.33 207.34 207.04 2.08 2.12 2.13 2.13 425.28 440.49 441.22
61.50South America 1.933.81-0.08-0.16201.5163.41 64.97 64.90 2.99 3.12 3.10 3.10 183.62 197.71 201.67
36.56 Brazil 5.036.120.000.00127.7637.73 38.76 38.76 3.44 3.22 3.30 3.30 125.68 121.64 127.76
18.70 Argentina -5.14-3.14-0.17-0.1057.8619.20 19.85 19.80 2.27 3.18 2.92 2.92 42.52 61.00 57.96
3.51 Paraguay 14.971.340.000.0010.313.78 3.67 3.67 3.03 2.37 2.81 2.81 10.65 8.97 10.31
1.42 Bolivia 3.960.110.000.002.891.52 1.52 1.52 2.06 1.83 1.90 1.90 2.94 2.78 2.89
1.15 Uruguay -21.18-0.620.000.002.301.02 1.01 1.01 1.23 2.86 2.28 2.28 1.41 2.92 2.30
24.08China 4.472.680.000.0062.6324.01 25.20 25.20 2.48 2.50 2.49 2.49 59.60 59.95 62.63
38.34South Asia 0.460.18-0.11-0.0439.1339.51 39.81 39.81 1.02 0.99 0.98 0.98 39.02 38.95 39.17
34.87 India 2.360.820.000.0035.5936.40 36.48 36.48 0.99 0.96 0.98 0.98 34.64 34.78 35.59
3.11 Pakistan -17.00-0.64-1.39-0.043.122.75 2.98 2.98 1.27 1.37 1.06 1.05 3.96 3.75 3.16
12.41European Union -8.50-2.780.000.0029.9812.39 11.18 11.18 2.85 2.64 2.68 2.68 35.34 32.76 29.98
24.37Former Soviet Union - 12 7.263.321.660.8049.0625.48 25.78 25.68 1.66 1.80 1.87 1.91 40.45 45.73 48.26
10.66 Russia 15.882.973.830.8021.7012.18 12.90 12.80 1.45 1.54 1.62 1.70 15.48 18.73 20.90
9.57 Ukraine 0.850.190.000.0022.509.23 9.03 9.03 2.07 2.42 2.49 2.49 19.81 22.31 22.50
1.25 Uzbekistan 6.940.090.000.001.371.10 1.05 1.05 1.21 1.17 1.31 1.31 1.51 1.28 1.37
12.23Canada -9.41-2.600.000.0025.0611.69 10.63 10.63 2.38 2.37 2.36 2.36 29.10 27.67 25.06
21.35Africa -9.46-2.16-0.06-0.0120.6922.14 21.58 21.52 0.99 1.03 0.96 0.96 21.23 22.86 20.71
4.09 Nigeria -15.70-0.880.000.004.704.09 4.07 4.07 1.31 1.36 1.16 1.16 5.34 5.58 4.70
1.48 South Africa 20.120.400.000.002.371.31 1.51 1.51 1.73 1.51 1.57 1.57 2.55 1.97 2.37
1.35 Tanzania -0.86-0.010.000.001.281.50 1.50 1.50 0.89 0.86 0.85 0.85 1.20 1.29 1.28
3.32Southeast Asia -5.51-0.260.000.004.393.34 3.15 3.15 1.42 1.39 1.39 1.39 4.71 4.64 4.39
1.00 Indonesia -2.91-0.050.000.001.500.98 0.95 0.95 1.61 1.57 1.58 1.58 1.62 1.55 1.50
1.98 Burma -8.81-0.210.000.002.212.02 1.88 1.88 1.22 1.20 1.18 1.18 2.42 2.43 2.21
3.76Australia -21.90-0.64-6.47-0.162.282.33 1.99 1.91 1.44 1.25 1.23 1.19 5.43 2.92 2.44
1.25Turkey -8.14-0.28-1.99-0.073.201.33 1.38 1.38 2.53 2.63 2.36 2.32 3.17 3.49 3.27
1.77Others -4.42-0.17-0.110.003.651.73 1.67 1.67 2.04 2.21 2.18 2.18 3.62 3.82 3.66
World Total and Total Foreign: (Major Oilseeds plus copra and palm kernel) Major Oilseeds: (soybeans, sunflowerseeds, peanuts(inshell), cottonseed and
rapeseed)
Foreign Agricultural Service/USDA 26 January 2020Global Market Analysis

Table 11 Soybean Area, Yield, and Production
From last month From last year
MMTPercent
Yield
(Metric tons per hectare)
Jan 2017/18 MMT
Country / Region
Area
(Million hectares)
Production
(Million metric tons)
Change in Production
2017/18
Prel.
2018/19 Dec Dec
Prel.
2018/19 Jan
Prel.
2018/19 Dec Jan Percent
2019/20 Proj.2019/20 Proj. 2019/20 Proj.
2017/18
124.48World -5.74-20.570.070.23337.70125.49 122.98 122.73 2.75 2.85 2.74 2.75 341.99 358.28 337.48
36.24United States -19.64-23.670.230.2396.8435.45 30.61 30.36 3.31 3.40 3.16 3.19 120.07 120.52 96.62
88.24Total Foreign 1.303.100.000.00240.8690.05 92.37 92.37 2.52 2.64 2.61 2.61 221.93 237.76 240.86
none
South America
35.15 Brazil 5.136.000.000.00123.0035.90 36.90 36.90 3.47 3.26 3.33 3.33 122.00 117.00 123.00
16.30 Argentina -4.16-2.300.000.0053.0016.60 17.50 17.50 2.32 3.33 3.03 3.03 37.80 55.30 53.00
3.38 Paraguay 15.251.350.000.0010.203.70 3.60 3.60 3.10 2.39 2.83 2.83 10.48 8.85 10.20
1.32 Bolivia 3.700.100.000.002.801.40 1.40 1.40 2.14 1.93 2.00 2.00 2.82 2.70 2.80
1.10 Uruguay -22.21-0.630.000.002.200.97 0.95 0.95 1.21 2.93 2.32 2.32 1.33 2.83 2.20
East Asia
8.25 China 13.362.130.000.0018.108.41 9.30 9.30 1.85 1.90 1.95 1.95 15.28 15.97 18.10
0.05 Korea, South 3.370.000.000.000.090.05 0.05 0.05 1.87 1.75 1.80 1.80 0.09 0.09 0.09
0.15 Korea, North 0.000.000.000.000.230.15 0.15 0.15 1.49 1.50 1.50 1.50 0.22 0.23 0.23
0.15 Japan 18.780.040.000.000.250.15 0.15 0.15 1.66 1.45 1.69 1.69 0.25 0.21 0.25
10.40India -17.66-1.930.000.009.0011.33 11.25 11.25 0.80 0.96 0.80 0.80 8.35 10.93 9.00
2.94Canada -17.43-1.270.000.006.002.54 2.30 2.30 2.63 2.86 2.61 2.61 7.72 7.27 6.00
Former Soviet Union - 12
2.57 Russia 6.780.270.000.004.302.74 2.90 2.90 1.41 1.47 1.48 1.48 3.62 4.03 4.30
1.98 Ukraine -17.06-0.760.000.003.701.73 1.55 1.55 1.97 2.58 2.39 2.39 3.89 4.46 3.70
0.93European Union -2.40-0.060.000.002.600.93 0.91 0.91 2.74 2.88 2.86 2.86 2.54 2.66 2.60
Southeast Asia
0.42 Indonesia -1.92-0.010.000.000.510.41 0.40 0.40 1.29 1.27 1.28 1.28 0.54 0.52 0.51
0.06 Vietnam -6.17-0.010.000.000.080.05 0.05 0.05 1.50 1.53 1.52 1.52 0.09 0.08 0.08
0.04 Thailand -5.450.000.000.000.050.04 0.03 0.03 1.57 1.57 1.53 1.53 0.06 0.06 0.05
0.14 Burma 0.000.000.000.000.160.15 0.15 0.15 1.04 1.07 1.07 1.07 0.15 0.16 0.16
0.20Serbia -4.00-0.030.000.000.600.22 0.22 0.22 2.30 2.84 2.73 2.73 0.46 0.63 0.60
0.26Mexico -29.85-0.100.000.000.240.19 0.15 0.15 1.65 1.75 1.57 1.57 0.43 0.34 0.24
Africa
0.79 South Africa 23.930.280.000.001.450.73 0.80 0.80 1.96 1.60 1.81 1.81 1.54 1.17 1.45
1.00 Nigeria 4.360.050.000.001.101.00 1.00 1.00 0.99 1.05 1.10 1.10 0.99 1.05 1.10
0.23 Zambia -7.26-0.020.000.000.280.19 0.20 0.20 1.56 1.58 1.43 1.43 0.35 0.30 0.28
0.05 Uganda 0.000.000.000.000.030.05 0.05 0.05 0.60 0.60 0.60 0.60 0.03 0.03 0.03
Middle East
0.08 Iran 6.250.010.000.000.170.07 0.07 0.07 2.41 2.29 2.43 2.43 0.20 0.16 0.17
0.02 Turkey 10.530.010.000.000.110.03 0.03 0.03 3.75 3.80 3.89 3.89 0.09 0.10 0.11
0.31Others -4.29-0.030.000.000.620.33 0.32 0.32 1.95 1.98 1.97 1.97 0.61 0.65 0.62
World and Selected Countries and Regions
Foreign Agricultural Service/USDA 27 January 2020Global Market Analysis

Table 12 Cottonseed Area, Yield, and Production
From last month From last year
MMTPercent
Yield
(Metric tons per hectare)
Jan 2017/18 MMT
Country / Region
Area
(Million hectares)
Production
(Million metric tons)
Change in Production
2017/18
Prel.
2018/19 Dec Dec
Prel.
2018/19 Jan
Prel.
2018/19 Dec Jan Percent
2019/20 Proj.2019/20 Proj. 2019/20 Proj.
2017/18
33.10World 1.920.83-0.47-0.2144.0932.89 34.20 33.83 1.36 1.32 1.30 1.30 45.15 43.26 44.30
4.49United States 10.690.55-0.53-0.035.654.13 5.06 4.78 1.30 1.24 1.12 1.18 5.83 5.11 5.68
28.61Total Foreign 0.750.29-0.46-0.1838.4428.76 29.14 29.05 1.37 1.33 1.33 1.32 39.33 38.15 38.62
none
South Asia
12.60 India 14.341.570.000.0012.5212.60 13.00 13.00 0.98 0.87 0.96 0.96 12.31 10.95 12.52
2.70 Pakistan -19.74-0.65-1.64-0.042.642.30 2.50 2.50 1.32 1.43 1.07 1.06 3.55 3.29 2.69
3.40China -1.80-0.200.000.0010.683.50 3.45 3.45 3.18 3.11 3.10 3.10 10.80 10.88 10.68
Former Soviet Union - 12
1.25 Uzbekistan 6.940.090.000.001.371.10 1.05 1.05 1.21 1.17 1.31 1.31 1.51 1.28 1.37
0.55 Turkmenistan 9.830.040.000.000.390.55 0.55 0.55 0.96 0.65 0.72 0.72 0.53 0.36 0.39
0.19 Tajikistan 4.940.010.000.000.170.18 0.18 0.18 0.97 0.90 0.94 0.94 0.18 0.16 0.17
0.13 Kazakhstan 4.440.010.000.000.140.13 0.12 0.12 0.94 1.05 1.21 1.21 0.12 0.14 0.14
South America
1.18 Brazil -0.20-0.010.000.004.091.62 1.62 1.62 2.57 2.53 2.52 2.52 3.02 4.10 4.09
0.32 Argentina -10.63-0.040.000.000.370.38 0.36 0.36 0.87 1.09 1.03 1.03 0.28 0.41 0.37
Middle East
0.47 Turkey -17.78-0.24-5.53-0.071.110.52 0.56 0.56 2.77 2.60 2.10 1.98 1.30 1.35 1.18
0.03 Syria 1.690.000.000.000.060.03 0.03 0.03 2.17 2.36 2.40 2.40 0.07 0.06 0.06
0.09 Iran 0.000.000.000.000.090.08 0.08 0.08 0.96 1.16 1.16 1.16 0.08 0.09 0.09
0.53Australia -69.44-0.46-20.78-0.050.200.38 0.08 0.06 2.72 1.74 3.19 3.37 1.44 0.66 0.26
0.30European Union 14.000.080.000.000.630.31 0.35 0.35 1.65 1.76 1.81 1.81 0.49 0.55 0.63
Africa
0.85 Burkina 17.450.045.340.010.280.63 0.60 0.58 0.39 0.37 0.44 0.48 0.33 0.24 0.26
0.71 Mali 6.410.02-9.48-0.040.380.73 0.78 0.74 0.56 0.50 0.54 0.52 0.40 0.36 0.42
0.23 Cameroon 7.330.020.000.000.320.25 0.26 0.26 1.11 1.20 1.24 1.24 0.25 0.30 0.32
0.33 Cote d'Ivoire 8.100.025.120.010.270.39 0.43 0.43 0.66 0.63 0.60 0.63 0.22 0.25 0.25
0.53 Benin 3.460.020.000.000.480.65 0.68 0.68 0.71 0.71 0.71 0.71 0.38 0.46 0.48
0.35 Tanzania -5.91-0.010.000.000.180.50 0.50 0.50 0.29 0.37 0.35 0.35 0.10 0.19 0.18
0.09 Egypt -30.26-0.050.000.000.110.14 0.10 0.10 1.00 1.08 1.06 1.06 0.09 0.15 0.11
0.27 Nigeria 0.000.000.000.000.100.27 0.27 0.27 0.38 0.38 0.38 0.38 0.10 0.10 0.10
0.08 Uganda 3.810.000.000.000.110.08 0.08 0.08 1.91 1.40 1.45 1.45 0.15 0.11 0.11
0.20 Zimbabwe -5.260.000.000.000.070.20 0.20 0.20 0.52 0.38 0.36 0.36 0.10 0.08 0.07
0.18 Sudan 20.780.050.000.000.310.18 0.20 0.20 1.35 1.42 1.54 1.54 0.24 0.26 0.31
0.21Mexico -10.12-0.06-0.740.000.530.24 0.23 0.23 2.52 2.44 2.39 2.37 0.53 0.59 0.54
0.25Burma -2.03-0.010.000.000.290.24 0.24 0.24 1.24 1.23 1.20 1.20 0.31 0.30 0.29
0.63Others 8.730.040.000.000.550.59 0.68 0.68 0.72 0.85 0.81 0.81 0.45 0.50 0.55
World and Selected Countries and Regions
Foreign Agricultural Service/USDA 28 January 2020Global Market Analysis

Table 13 Peanut Area, Yield, and Production
From last month From last year
MMTPercent
Yield
(Metric tons per hectare)
Jan 2017/18 MMT
Country / Region
Area
(Million hectares)
Production
(Million metric tons)
Change in Production
2017/18
Prel.
2018/19 Dec Dec
Prel.
2018/19 Jan
Prel.
2018/19 Dec Jan Percent
2019/20 Proj.2019/20 Proj. 2019/20 Proj.
2017/18
27.14World -2.79-1.31-0.16-0.0745.4427.84 26.51 26.51 1.72 1.68 1.72 1.71 46.78 46.75 45.52
0.72United States 0.000.00-2.62-0.072.490.56 0.56 0.56 4.49 4.48 4.57 4.43 3.23 2.49 2.56
26.42Total Foreign -2.95-1.31-0.01-0.0142.9527.29 25.95 25.95 1.65 1.62 1.66 1.66 43.55 44.26 42.96
none
4.61China 0.960.170.000.0017.504.62 4.60 4.60 3.71 3.75 3.80 3.80 17.09 17.33 17.50
Africa
2.82 Nigeria -20.85-0.920.000.003.502.82 2.80 2.80 1.51 1.57 1.25 1.25 4.25 4.42 3.50
2.22 Sudan -37.59-1.080.000.001.803.07 2.30 2.30 0.74 0.94 0.78 0.78 1.65 2.88 1.80
1.25 Senegal -24.14-0.350.000.001.101.25 1.20 1.20 1.13 1.16 0.92 0.92 1.41 1.45 1.10
0.43 Cameroon 0.000.000.000.000.600.43 0.43 0.43 1.40 1.40 1.40 1.40 0.60 0.60 0.60
0.34 Ghana -15.38-0.080.000.000.440.34 0.34 0.34 1.28 1.55 1.31 1.31 0.43 0.52 0.44
0.77 Chad -4.49-0.040.000.000.850.77 0.77 0.77 1.13 1.16 1.10 1.10 0.87 0.89 0.85
0.39 Malawi 0.000.000.000.000.330.37 0.37 0.37 0.99 0.88 0.88 0.88 0.39 0.33 0.33
0.50 Congo (Kinshasa) 0.000.000.000.000.420.50 0.50 0.50 0.85 0.85 0.85 0.85 0.42 0.42 0.42
0.92 Niger -15.54-0.090.000.000.500.93 0.90 0.90 0.50 0.64 0.56 0.56 0.46 0.59 0.50
0.39 Mali -13.44-0.070.000.000.430.38 0.43 0.43 0.78 1.31 1.00 1.00 0.30 0.49 0.43
0.43 Uganda 0.000.000.000.000.300.43 0.43 0.43 0.71 0.71 0.71 0.71 0.30 0.30 0.30
0.56 Burkina 36.360.120.000.000.450.56 0.56 0.56 0.60 0.59 0.80 0.80 0.33 0.33 0.45
0.67 Guinea -2.60-0.020.000.000.750.68 0.68 0.68 1.04 1.13 1.10 1.10 0.70 0.77 0.75
0.06 Egypt 0.000.000.000.000.210.06 0.06 0.06 3.20 3.20 3.20 3.20 0.21 0.21 0.21
0.10 Central African Republic 0.000.000.000.000.150.10 0.10 0.10 1.50 1.50 1.50 1.50 0.15 0.15 0.15
0.06 South Africa 200.000.050.000.000.080.02 0.05 0.05 1.36 1.25 1.50 1.50 0.08 0.03 0.08
0.40 Mozambique 0.000.000.000.000.130.38 0.38 0.38 0.23 0.34 0.34 0.34 0.09 0.13 0.13
0.15 Cote d'Ivoire 0.000.000.000.000.210.15 0.15 0.15 1.39 1.45 1.45 1.45 0.20 0.21 0.21
0.16 Benin -22.57-0.050.000.000.180.19 0.19 0.19 0.88 1.19 0.92 0.92 0.14 0.23 0.18
South Asia
4.89 India 31.361.480.000.006.204.99 4.70 4.70 1.36 0.95 1.32 1.32 6.65 4.72 6.20
0.09 Pakistan 1.110.000.000.000.090.10 0.09 0.09 0.97 0.95 0.98 0.98 0.09 0.09 0.09
Southeast Asia
0.58 Indonesia -3.41-0.040.000.000.990.57 0.55 0.55 1.85 1.80 1.80 1.80 1.08 1.03 0.99
0.99 Burma -13.14-0.210.000.001.381.03 0.89 0.89 1.59 1.53 1.55 1.55 1.57 1.58 1.38
0.19 Vietnam 2.400.010.000.000.470.19 0.19 0.19 2.37 2.41 2.47 2.47 0.45 0.46 0.47
0.02 Thailand 0.000.000.000.000.040.02 0.02 0.02 1.67 1.67 1.67 1.67 0.04 0.04 0.04
South America
0.38 Argentina -11.56-0.160.000.001.260.33 0.32 0.32 2.27 4.35 3.92 3.92 0.87 1.42 1.26
0.14 Brazil 26.440.120.000.000.550.15 0.16 0.16 3.71 2.96 3.55 3.55 0.52 0.44 0.55
0.06Mexico 5.150.010.000.000.100.06 0.06 0.06 1.70 1.70 1.73 1.73 0.10 0.10 0.10
1.88Others -6.71-0.14-0.25-0.011.971.83 1.75 1.75 1.13 1.15 1.13 1.13 2.13 2.12 1.98
World and Selected Countries and Regions
Foreign Agricultural Service/USDA 29 January 2020Global Market Analysis

Table 14 Sunflowerseed Area, Yield, and Production
From last month From last year
MMTPercent
Yield
(Metric tons per hectare)
Jan 2017/18 MMT
Country / Region
Area
(Million hectares)
Production
(Million metric tons)
Change in Production
2017/18
Prel.
2018/19 Dec Dec
Prel.
2018/19 Jan
Prel.
2018/19 Dec Jan Percent
2019/20 Proj.2019/20 Proj. 2019/20 Proj.
2017/18
25.92World 6.903.491.050.5654.0425.94 26.64 26.47 1.85 1.95 2.01 2.04 47.85 50.55 53.48
0.54United States -7.74-0.07-13.70-0.140.880.49 0.53 0.50 1.80 1.94 1.93 1.75 0.97 0.96 1.02
25.38Total Foreign 7.183.561.330.7053.1625.44 26.12 25.97 1.85 1.95 2.01 2.05 46.88 49.60 52.46
none
Former Soviet Union - 12
7.15 Russia 20.382.595.520.8015.307.94 8.50 8.40 1.45 1.60 1.71 1.82 10.36 12.71 14.50
6.80 Ukraine 3.330.500.000.0015.506.50 6.20 6.20 2.01 2.31 2.50 2.50 13.70 15.00 15.50
0.88 Kazakhstan -5.66-0.050.000.000.800.85 0.80 0.80 1.02 1.00 1.00 1.00 0.90 0.85 0.80
4.39European Union 2.490.240.000.009.754.12 4.35 4.35 2.30 2.31 2.24 2.24 10.13 9.51 9.75
South America
1.68 Argentina -16.34-0.63-3.03-0.103.201.88 1.65 1.60 2.11 2.04 2.00 2.00 3.54 3.83 3.30
0.05 Uruguay 11.110.010.000.000.100.06 0.06 0.06 1.56 1.61 1.67 1.67 0.08 0.09 0.10
0.11 Bolivia 12.500.010.000.000.090.12 0.12 0.12 1.11 0.70 0.75 0.75 0.12 0.08 0.09
0.10 Brazil 8.110.010.000.000.120.07 0.08 0.08 1.48 1.71 1.50 1.50 0.14 0.11 0.12
0.04 Paraguay -5.560.000.000.000.050.03 0.03 0.03 1.59 1.69 1.70 1.70 0.07 0.05 0.05
1.17China 30.310.760.000.003.250.92 1.25 1.25 2.69 2.71 2.60 2.60 3.15 2.49 3.25
South Asia
0.28 India -1.160.000.000.000.170.28 0.23 0.23 0.81 0.61 0.76 0.76 0.23 0.17 0.17
0.08 Pakistan 0.690.000.000.000.150.12 0.14 0.14 1.13 1.20 1.04 1.04 0.09 0.14 0.15
Middle East
0.70 Turkey -2.78-0.050.000.001.750.72 0.73 0.73 2.21 2.52 2.40 2.40 1.55 1.80 1.75
0.04 Iran 0.000.000.000.000.040.04 0.04 0.04 1.08 1.08 1.08 1.08 0.04 0.04 0.04
0.01 Israel 0.000.000.000.000.020.01 0.01 0.01 1.60 1.60 1.60 1.60 0.02 0.02 0.02
Africa
0.01 Egypt 0.000.000.000.000.020.01 0.01 0.01 2.38 2.38 2.38 2.38 0.02 0.02 0.02
0.02 Morocco -7.410.000.000.000.030.02 0.02 0.02 1.26 1.29 1.25 1.25 0.02 0.03 0.03
0.60 South Africa 10.290.070.000.000.750.52 0.61 0.61 1.43 1.32 1.23 1.23 0.86 0.68 0.75
0.60Burma 0.000.000.000.000.390.60 0.60 0.60 0.65 0.65 0.65 0.65 0.39 0.39 0.39
0.03Canada 10.530.010.000.000.060.03 0.03 0.03 2.23 2.11 2.17 2.17 0.06 0.06 0.06
0.01Australia 8.700.000.000.000.030.02 0.02 0.02 1.86 1.21 1.25 1.25 0.03 0.02 0.03
0.63Others 6.660.100.000.001.600.61 0.64 0.64 2.21 2.48 2.49 2.49 1.38 1.50 1.60
World and Selected Countries and Regions
Foreign Agricultural Service/USDA 30 January 2020Global Market Analysis

Table 15 Rapeseed Area, Yield, and Production
From last month From last year
MMTPercent
Yield
(Metric tons per hectare)
Jan 2017/18 MMT
Country / Region
Area
(Million hectares)
Production
(Million metric tons)
Change in Production
2017/18
Prel.
2018/19 Dec Dec
Prel.
2018/19 Jan
Prel.
2018/19 Dec Jan Percent
2019/20 Proj.2019/20 Proj. 2019/20 Proj.
2017/18
36.55World -6.42-4.65-0.44-0.3067.7236.59 34.58 34.48 2.05 1.98 1.97 1.96 74.99 72.37 68.02
0.81United States -5.54-0.09-8.27-0.141.550.79 0.81 0.78 1.71 2.09 2.08 2.00 1.39 1.64 1.69
35.74Total Foreign -6.44-4.55-0.24-0.1666.1735.80 33.77 33.70 2.06 1.98 1.96 1.96 73.60 70.73 66.33
none
6.80European Union -15.14-3.030.000.0017.007.03 5.58 5.58 3.26 2.85 3.05 3.05 22.18 20.03 17.00
9.27Canada -6.60-1.340.000.0019.009.12 8.30 8.30 2.30 2.23 2.29 2.29 21.33 20.34 19.00
6.65China -1.36-0.180.000.0013.106.55 6.60 6.60 2.00 2.03 1.98 1.98 13.27 13.28 13.10
South Asia
6.70 India -3.75-0.300.000.007.707.20 7.30 7.30 1.06 1.11 1.05 1.05 7.10 8.00 7.70
0.24 Pakistan 4.440.010.000.000.240.23 0.24 0.24 0.96 0.98 0.98 0.98 0.23 0.23 0.24
0.25 Bangladesh 0.000.000.000.000.230.25 0.25 0.25 0.92 0.92 0.92 0.92 0.23 0.23 0.23
Former Soviet Union - 12
0.95 Russia 5.580.110.000.002.101.50 1.50 1.50 1.58 1.33 1.40 1.40 1.50 1.99 2.10
0.79 Ukraine 15.790.450.000.003.301.00 1.28 1.28 2.80 2.85 2.58 2.58 2.22 2.85 3.30
0.33 Belarus 7.460.030.000.000.490.35 0.30 0.30 1.81 1.31 1.63 1.63 0.60 0.46 0.49
0.25 Kazakhstan -18.78-0.070.000.000.320.37 0.28 0.28 1.11 1.08 1.14 1.14 0.28 0.39 0.32
3.17Australia -8.26-0.18-4.76-0.102.001.89 1.85 1.80 1.23 1.15 1.14 1.11 3.89 2.18 2.10
South America
0.06 Chile -7.03-0.01-25.22-0.060.170.05 0.06 0.04 3.89 3.85 4.11 4.10 0.22 0.19 0.23
0.08 Paraguay -6.670.000.000.000.060.04 0.03 0.03 1.25 1.50 1.87 1.87 0.10 0.06 0.06
0.02Switzerland 0.000.000.000.000.070.02 0.02 0.02 3.14 3.14 3.14 3.14 0.07 0.07 0.07
0.03Ethiopia 18.180.010.000.000.070.04 0.04 0.04 1.82 1.57 1.86 1.86 0.05 0.06 0.07
0.15Others -10.93-0.040.000.000.330.17 0.15 0.15 2.17 2.16 2.23 2.23 0.33 0.38 0.33
World and Selected Countries and Regions
Foreign Agricultural Service/USDA 31 January 2020Global Market Analysis

Table 16 Copra, Palm Kernel, and Palm Oil Production
Country / Region
Production
(Million metric tons)
2017/18
Prel.
2018/19
2019/20 Proj.
Dec Jan MMT Percent MMT Percent
Change in Production
From last month From last year
Oilseed, Copra
0.00 0.00 -0.13 -4.94 Philippines 2.60 2.502.502.63
0.00 0.00 -0.04 -2.44 Indonesia 1.65 1.601.601.64
0.00 0.00 0.00 0.00 India 0.75 0.750.750.75
0.00 0.00 0.00 0.00 Vietnam 0.28 0.290.290.29
0.00 0.00 0.00 0.00 Mexico 0.21 0.220.220.22
0.00 0.00 0.00 0.00 Papua New Guinea 0.10 0.100.100.10
0.00 0.00 0.00 0.00 Thailand 0.07 0.070.070.07
0.00 0.00 0.00 0.00 Sri Lanka 0.07 0.070.070.07
0.00 0.00 0.00 0.00 Solomon Islands 0.03 0.030.030.03
0.00 0.00 0.00 0.00 Cote d'Ivoire 0.03 0.030.030.03
0.00 0.00 -0.17 -2.84 World 5.94 5.815.815.98
Oilseed, Palm Kernel
0.00 0.00 0.40 3.67 Indonesia 10.50 11.3011.3010.90
-0.20 -3.77 -0.05 -0.97 Malaysia 4.92 5.105.305.15
0.00 0.00 0.02 2.30 Thailand 0.82 0.890.890.87
0.00 0.00 0.00 0.00 Nigeria 0.73 0.730.730.73
0.00 0.00 0.03 9.09 Colombia 0.33 0.360.360.33
0.00 0.00 0.00 0.00 Guatemala 0.17 0.170.170.17
0.00 0.00 -0.03 -18.75 Papua New Guinea 0.16 0.130.130.16
0.00 0.00 0.00 0.00 Honduras 0.14 0.140.140.14
0.00 0.00 0.00 0.00 Brazil 0.13 0.140.140.14
0.00 0.00 0.00 0.00 Cote d'Ivoire 0.12 0.120.120.12
-0.20 -1.00 0.37 1.90 World 18.76 19.8220.0219.45
Oil, Palm
0.00 0.00 1.50 3.61 Indonesia 39.50 43.0043.0041.50
-0.50 -2.38 -0.30 -1.44 Malaysia 19.68 20.5021.0020.80
0.00 0.00 0.10 3.45 Thailand 2.78 3.003.002.90
0.00 0.00 0.06 3.70 Colombia 1.63 1.681.681.63
0.00 0.00 0.00 0.00 Nigeria 1.03 1.021.021.02
0.00 0.00 0.00 0.00 Guatemala 0.85 0.850.850.85
0.00 0.00 -0.14 -21.54 Papua New Guinea 0.65 0.510.510.65
0.00 0.00 0.05 8.62 Ecuador 0.57 0.630.630.58
0.00 0.00 0.00 0.00 Honduras 0.58 0.580.580.58
0.00 0.00 0.02 3.85 Brazil 0.50 0.540.540.53
-0.50 -0.66 1.29 1.75 World 70.63 75.1975.6973.90
World and Selected Countries and Regions
Foreign Agricultural Service/USDA 32 January 2020Global Market Analysis

Table 17 Cotton Area, Yield, and Production
From last month From last year
MBalesPercent
Yield
(Kilograms per hectare)
Jan 2017/18 MBales
Country / Region
Area
(Million hectares)
Production
(Million 480 lb. bales)
Change in Production
2017/18
Prel.
2018/19 Dec Dec
Prel.
2018/19 Jan
Prel.
2018/19 Dec Jan Percent
2019/20 Proj.2019/20 Proj. 2019/20 Proj.
2017/18
33.73World 1.982.34-0.52-0.63120.4833.54 34.87 34.50 799 767 756 760 123.78 118.14 121.11
4.49United States 9.451.74-0.51-0.1020.104.13 5.06 4.78 1,014 968 869 916 20.92 18.37 20.21
29.23Total Foreign 0.600.60-0.52-0.53100.3829.41 29.81 29.72 766 739 737 735 102.86 99.77 100.90
none
South Asia
12.60 India 14.343.700.000.0029.5012.60 13.00 13.00 501 446 494 494 29.00 25.80 29.50
2.70 Pakistan -19.74-1.50-1.61-0.106.102.30 2.50 2.50 661 719 540 531 8.20 7.60 6.20
3.40China -1.80-0.500.000.0027.253.50 3.45 3.45 1,761 1,726 1,720 1,720 27.50 27.75 27.25
South America
1.18 Brazil -0.16-0.020.000.0012.501.62 1.62 1.62 1,708 1,683 1,680 1,680 9.22 12.52 12.50
0.32 Argentina -10.71-0.120.000.001.000.38 0.36 0.36 558 642 605 605 0.82 1.12 1.00
0.01 Paraguay 0.000.000.000.000.020.01 0.01 0.01 416 416 416 416 0.02 0.02 0.02
Africa
0.85 Burkina 17.650.155.260.051.000.63 0.60 0.58 307 294 345 379 1.20 0.85 0.95
0.71 Mali 6.300.08-9.40-0.141.350.73 0.78 0.74 432 381 419 400 1.40 1.27 1.49
0.33 Cote d'Ivoire 8.110.085.260.051.000.39 0.43 0.43 536 514 487 512 0.81 0.93 0.95
0.53 Benin 3.570.050.000.001.450.65 0.68 0.68 468 469 468 468 1.14 1.40 1.45
0.09 Egypt -30.00-0.150.000.000.350.14 0.10 0.10 718 772 762 762 0.30 0.50 0.35
0.23 Cameroon 7.500.050.000.000.650.25 0.26 0.26 484 523 540 540 0.50 0.60 0.65
0.35 Tanzania -5.88-0.030.000.000.400.50 0.50 0.50 143 185 174 174 0.23 0.43 0.40
0.27 Nigeria 0.000.000.000.000.240.27 0.27 0.27 190 190 190 190 0.24 0.24 0.24
0.20 Zimbabwe -5.00-0.010.000.000.190.20 0.20 0.20 294 218 207 207 0.27 0.20 0.19
0.06 Ethiopia 2.880.010.000.000.250.08 0.08 0.08 639 687 680 680 0.18 0.24 0.25
Former Soviet Union - 12
1.25 Uzbekistan 6.870.230.000.003.501.10 1.05 1.05 672 648 726 726 3.86 3.28 3.50
0.55 Turkmenistan 9.890.090.000.001.000.55 0.55 0.55 535 364 399 399 1.34 0.91 1.00
0.19 Tajikistan 6.020.030.000.000.440.18 0.18 0.18 671 502 532 532 0.57 0.42 0.44
0.13 Kazakhstan 4.350.020.000.000.360.13 0.12 0.12 523 587 670 670 0.30 0.35 0.36
Middle East
0.47 Turkey -8.11-0.30-5.56-0.203.400.52 0.56 0.56 1,853 1,549 1,400 1,322 4.00 3.70 3.60
0.03 Syria 0.000.000.000.000.140.03 0.03 0.03 1,161 1,219 1,219 1,219 0.16 0.14 0.14
0.09 Iran 0.000.000.000.000.280.08 0.08 0.08 640 748 748 748 0.25 0.28 0.28
0.53Australia -69.32-1.53-20.59-0.180.680.38 0.08 0.06 1,972 1,261 2,313 2,449 4.80 2.20 0.85
0.21Mexico -9.51-0.17-0.63-0.011.570.24 0.23 0.23 1,617 1,555 1,529 1,519 1.56 1.74 1.58
0.25Burma 0.000.000.000.000.700.24 0.24 0.24 634 635 635 635 0.73 0.70 0.70
1.74Others 9.870.460.000.005.081.72 1.88 1.88 535 584 588 588 4.28 4.62 5.08
World and Selected Countries and Regions
Foreign Agricultural Service/USDA 33 January 2020Global Market Analysis

TABLE 18
The table below presents a record of the January projection and the final Estimate. Using world wheat production as an example, the "root mean square error" means that chances are 2 out of 3 that the current forecast will not be above or below the final estimate by more than 0.7 percent. Chances are 9 out of 10 (90% confidence level) that the difference will not exceed 1.1 percent. The average difference between the January projection and the final estimate is 3 million tons, ranging from 0 million to 8.3 million tons. The January projection has been below the estimate 27 times and above 9 times.
RELIABILITY OF PRODUCTION PROJECTIONS 1/
COMMODITY AND REGION
Root mean square error
90 percent confidence
interval
Difference between forecast and final estimate
Average Smallest Largest
Years Below final
Above final
Percent ---Million metric tons---
WHEAT
World 0.7 1.2 3.1 0.0 8.3 28 9
U.S. 0.1 0.3 0.1 0.0 0.3 15 11
Foreign 0.8 1.3 3.1 0.1 8.3 27 10
COARSE GRAINS 2/
World 1.4 2.3 11.7 0.0 37.7 27 10
U.S. 0.4 0.7 0.3 0.0 4.6 17 7
Foreign 1.9 3.3 11.6 0.0 37.6 26 11
RICE (Milled)
World 1.7 2.8 4.9 0.0 13.9 31 5
U.S. 1.7 2.8 0.1 0.0 0.3 13 7
Foreign 1.7 2.8 4.9 0.1 13.9 32 5
SOYBEANS
World 3.4 5.8 5.1 0.0 22.4 21 16
U.S. 1.4 2.4 0.6 0.0 2.5 16 16
Foreign 5.8 9.9 5.2 0.2 22.6 21 16
COTTON ---Million 480-lb. bales---
World 2.6 4.4 2.0 0.0 5.4 24 12
U.S. 1.0 1.7 0.1 0.0 0.3 14 22
Foreign 3.1 5.3 2.0 0.0 5.7 26 10
UNITED STATES -------Million bushels-------
CORN 0.4 0.7 10 0 148 4 2
SORGHUM 1.0 1.8 2 0 53 1 3
BARLEY 0.7 1.3 1 0 11 16 4
OATS 0.3 0.6 0 0 2 4 4
1/ Marketing years 1981/82 through 2018/19. Final for grains, soybeans and cotton is defined as the first November estimates following the marketing year for 1981/82 through 2017/18, and for 2018/19 last month’s estimate. 2/ Includes corn, sorghum, barley, oats, rye, millet, and mixed grain
January 2020 Global Market Analysis, FAS, USDA
Foreign Agricultural Service/USDA 34 January 2020Global Market Analysis