Embed Size (px)
Citation preview

United StatesDepartment ofAgriculture
Forest Service
SouthernResearch Station
Research PaperSRS–46
Assessing the Potential for Biomass Energy Development in South Carolina
Roger C. Conner, Tim O. Adams, and Tony G. Johnson

The Authors:
Roger C. Conner, Research Forester, U.S. Forest Service, Southern Research Station, Knoxville, TN 37919; Tim O. Adams, Resource Development Division Director, South Carolina Forestry Commission, Columbia, SC 29212; and Tony G. Johnson, Resource Analyst, U.S. Forest Service, Southern Research Station, Knoxville, TN 37919.
October 2009
Southern Research Station200 W.T. Weaver Blvd.Asheville, NC 28804
Cover photo: Harvesting operation in Chester County, South Carolina. (photo by Mike Howell)

Assessing the Potential for Biomass Energy Development in
South Carolina
Roger C. Conner, Tim O. Adams, and Tony G. Johnson


iii
Introduction . . . . . . . . . . . . . . . . . . . . . . . . . . . . . . . . . . . . . . . . . . . . . . . . . . . . . . . . . . . . . . . . . . . . . . . . . . . . . . . . . . . . . . . 1
Methods . . . . . . . . . . . . . . . . . . . . . . . . . . . . . . . . . . . . . . . . . . . . . . . . . . . . . . . . . . . . . . . . . . . . . . . . . . . . . . . . . . . . . . . . . . 1 Identifying Potential Sources for Biomass . . . . . . . . . . . . . . . . . . . . . . . . . . . . . . . . . . . . . . . . . . . . . . . . . . . . . . . . . . . . . . 2 Biomass From Unutilized Logging Residue and Residual Inventory . . . . . . . . . . . . . . . . . . . . . . . . . . . . . . . . . . . . . . . . . . 2 Commercial Thinning: Potential Biomass in Poletimber Trees . . . . . . . . . . . . . . . . . . . . . . . . . . . . . . . . . . . . . . . . . . . . . . 3 Potential Biomass in Small-Diameter Trees: Overstocked Sapling-Seedling Stands . . . . . . . . . . . . . . . . . . . . . . . . . . . . . . 4 Biomass From Mill Residue . . . . . . . . . . . . . . . . . . . . . . . . . . . . . . . . . . . . . . . . . . . . . . . . . . . . . . . . . . . . . . . . . . . . . . . . . 4 Biomass From Urban Wood Waste. . . . . . . . . . . . . . . . . . . . . . . . . . . . . . . . . . . . . . . . . . . . . . . . . . . . . . . . . . . . . . . . . . . . 4 Biomass Producer Surveys: Determining Biomass Production Over a Range of Prices . . . . . . . . . . . . . . . . . . . . . . . . . . . 5
Results . . . . . . . . . . . . . . . . . . . . . . . . . . . . . . . . . . . . . . . . . . . . . . . . . . . . . . . . . . . . . . . . . . . . . . . . . . . . . . . . . . . . . . . . . . . 5 Logging Residue and Residual Inventory: Unutilized Biomass on Harvested Acres . . . . . . . . . . . . . . . . . . . . . . . . . . . . . . 5 Potential Biomass From Commercial Thinning . . . . . . . . . . . . . . . . . . . . . . . . . . . . . . . . . . . . . . . . . . . . . . . . . . . . . . . . . . 7 Overstocked Stands: Potential Biomass From Precommercial Thinnings . . . . . . . . . . . . . . . . . . . . . . . . . . . . . . . . . . . . . . 9 Mill Residue: Nearly All is Utilized for Other Products. . . . . . . . . . . . . . . . . . . . . . . . . . . . . . . . . . . . . . . . . . . . . . . . . . . . 9 Reallocation of Mill Residues by Price Points . . . . . . . . . . . . . . . . . . . . . . . . . . . . . . . . . . . . . . . . . . . . . . . . . . . . . . . . . . .12 Urban Wood Waste: A Potential Primary Contributor to Bioenergy . . . . . . . . . . . . . . . . . . . . . . . . . . . . . . . . . . . . . . . . . .13 Estimating Recoverable Logging Residue: Timber Producer Survey Results . . . . . . . . . . . . . . . . . . . . . . . . . . . . . . . . . . .14 Summary: Total Biomass Potential at Price Points . . . . . . . . . . . . . . . . . . . . . . . . . . . . . . . . . . . . . . . . . . . . . . . . . . . . . . . .17
Discussion. . . . . . . . . . . . . . . . . . . . . . . . . . . . . . . . . . . . . . . . . . . . . . . . . . . . . . . . . . . . . . . . . . . . . . . . . . . . . . . . . . . . . . . . .17
Conclusions . . . . . . . . . . . . . . . . . . . . . . . . . . . . . . . . . . . . . . . . . . . . . . . . . . . . . . . . . . . . . . . . . . . . . . . . . . . . . . . . . . . . . . .19
Literature Cited. . . . . . . . . . . . . . . . . . . . . . . . . . . . . . . . . . . . . . . . . . . . . . . . . . . . . . . . . . . . . . . . . . . . . . . . . . . . . . . . . . . .19
Contents
Page


Abstract
An assessment of the potential for developing a sustainable biomass energy industry in South Carolina was conducted. Biomass as defined by Forest Inventory and Analysis is the aboveground dry weight of wood in the bole and limbs of live trees ≥ 1-inch diameter at breast height, and excludes tree foliage, seedlings, and understory vegetation. Several possible sources of biomass were analyzed: unutilized logging residue and standing residual inventory trees on acres with tree harvesting; commercial thinning; precommercial thinning on overstocked natural sapling-seedling stands; mill residue; and urban wood waste. A range of prices from $20 to $30 per ton was established by surveys sent to South Carolina’s timber producers. Prices reflect 2008 market conditions. The estimates of potential biomass distributed across these price points rose from 4.8 million tons to a total of 16.5 million tons annually. Nearly 7.7 million tons are currently being utilized. New facilities that use wood to produce energy could capitalize on the 8.8 million annual tons of unutilized biomass and operate without overly impacting existing forest industries or increasing harvest levels above 2006 estimates.
Keywords: Biofuel, biomass markets, FIA, forest landowner, green tons, hardwood poletimber, haul distance, softwood poletimber, timberland.
Introduction
Recent price increases in fossil fuels have renewed interest in finding and utilizing renewable sources of raw material to generate energy. In South Carolina, woody biomass as feedstock for biofuel is one source that has been used to produce heat, steam, and electricity on a moderate scale for well over a century. Increasing the role of biomass in energy production can be largely accomplished by more efficient use of existing sources.
Sources for biomass vary, but typically include unutilized wood residue from both tree harvesting and mill operations, volume from standing forest inventory including nonmerchantable trees, and woody material from urban waste. We identify and discuss these sources and provide estimates of biomass potentially available to develop and sustainably supply a bioenergy industry in South Carolina without increasing harvest rates above current levels.
Harvesting and transporting biomass in the form of logging residue and nonmerchantable trees is a costly undertaking for the State’s loggers. We determine a range of prices per delivered ton that would enable loggers to profitably harvest, process, and transport this material. We then provide estimates of the additional biomass that loggers could potentially supply with increasing price per ton.
The objectives of this study were to:
• identify potential sources of unutilized woody biomass in South Carolina and estimate the amount in tons potentially available each year
• determine the range of prices per ton needed by loggers to invest in equipment necessary to begin harvesting biomass in logging residue and residual inventory
Methods
Biomass as defined and reported by Forest Inventory and Analysis (FIA) is the aboveground dry weight of wood in the bole and limbs of live trees ≥ 1-inch diameter at breast height (d.b.h.). FIA’s estimates exclude tree foliage, seedlings, and understory vegetation (Conner and others 2004). FIA’s biomass estimates are derived from equations developed by Clark and Saucier (1990) and Saucier and Clark (1985). For live trees, the dry weight estimates of biomass are doubled to convert to green weight. For harvested trees, cubic-foot removal volumes (including logging residue) are converted to green tons using 69.5 pounds per cubic foot for softwoods and 75.3 pounds per cubic foot for hardwoods. These conversions are derived from the relationship between the biomass in the merchantable portion of the tree (1-foot stump to a 4-inch diameter outside bark top) and the cubic-foot volume in that portion. Green weight is the wood and bark per cubic foot of volume immediately after felling. Severed trees with limbs intact lose moisture content rapidly. Therefore, the pounds per cubic foot and thus tons per acre of logging residue can drop significantly in a short amount of time.
Assessing the Potential for Biomass Energy Development in South Carolina Roger C. Conner, Tim O. Adams, and Tony G. Johnson

2
Identifying Potential Sources for Biomass
This study updates a similar effort conducted in 2001 by the Strom Thurmond Institute at Clemson University and funded by the South Carolina Forestry Commission (SCFC). The findings from that study are provided in an internal report (referred to as the Harris report) available from SCFC.
For this study, we considered the following as possible sources:
• unutilized logging residue and standing residual inven-tory trees on acres with tree harvesting
• potential biomass from commercial thinning
• potential biomass in small-diameter trees (< 5.0 inches d.b.h.) on overstocked natural sapling-seedling stands (precommercial thinning)
• biomass from mill residue
• biomass from urban wood waste
A range of prices per ton of biomass was established from responses to surveys conducted by the SCFC. We then esti-mated the amount of biomass that would potentially become available from each source with changes in price per ton. Unless otherwise indicated, all estimates are in green tons.
Biomass From Unutilized Logging Residue and Residual Inventory
Estimates of biomass in logging residue and standing residu-als are from timberland acres where tree cutting of any kind has occurred. Cutting activity ranged from final harvests where > 50 percent of the tree stocking is removed, to timber stand improvement where small-diameter trees are removed from immature stands to improve future stocking. Definitions of the different types of tree harvesting identified by FIA are available in Conner and others (2004).
Logging residue is a component of FIA’s estimates of total timber removals. FIA defines timber removals as the cubic-foot volume in trees ≥ 5 inches d.b.h. harvested for prod-ucts; whole trees or portions of trees left behind as logging residue; and trees removed due to land clearing or other changes in land use. For this study, we also include logging residue in nonmerchantable trees (< 5 inches d.b.h.) killed during the harvesting operation.
Estimates of average total removals, annual roundwood product output, logging residue, and other removals are reported here in green tons for the inventory period from 2001 through 2005. Equivalent cubic-foot timber removals are available in the 2006 analytical report for South Carolina (Conner and others 2009).
Potential biomass from logging residue. (photo by Tony Johnson)

3
FIA calculates the merchantable portion (bole) of logging residue as the volume from a 1-foot stump to a 4-inch top of whole trees cut and not utilized. Underutilization factors derived from felled-tree utilization studies are applied to this volume for the remainder of the merchantable portion of logging residue (Bentley and Johnson 2008). Factors derived from standing inventory data and utilization studies are applied to the merchantable portion of logging residue to calculate the nongrowing-stock portion in tops, limbs, and stumps.
Empirical evidence suggests that a 60-percent recovery rate of logging residue (volume recovered to roadside for chipping and transportation to mills) is realistic for harvest-ing operations using conventional equipment (Perlack and others 2005). We adjusted our estimates of available logging residue to reflect this plausible rate of recovery.
Biomass in residual inventory is the volume (in weight) of standing trees left after tree harvesting activity. On final harvest acres, we estimated the biomass in all-live (includes rough and rotten) standing residual trees ≥ 1.0-inch d.b.h. from the 2006 inventory data (Conner and others 2009). On all other acres with evidence of tree cutting, we provide estimates of the biomass in rough and rotten trees ≥ 1.0 inches d.b.h. remaining in the standing inventory. Trees left in streamside management zones were not included in our estimates of biomass.
Commercial Thinning: Potential Biomass in Poletimber Trees
Commercial thinning typically removes trees of poletimber size (5.0–8.9 inches d.b.h. for softwoods and 5.0–10.9 inches for hardwoods) and the volume—primarily soft-wood—is traditionally considered pulpwood supply. The Harris report assumed that one-half of the net annual growth in poletimber growing-stock trees would be available for biofuel.
Taking a more conservative approach for this study, com-mercial thinning would be included as a potential source for biofuel if (1) all-live poletimber volume had increased significantly based on estimates from the 2001 and 2006 inventories, and (2) our analysis indicated that this increase could be sustained in the future. Meeting both requirements signified that there was an accessible and sustainable supply of volume for potential use as biofuel. If both requirements were met, then we follow a similar approach as the Harris report and assume that one-half the net annual growth in all-live poletimber trees would contribute to the estimates of potential biomass supply. Note that this is biomass that is yet to be harvested and should not be confused with acres that already have been commercially thinned (and the biomass included in our estimates of unutilized logging residue).
Thinning operation in 25-year old loblolly pine plantation. (photo by Tony Johnson)
4
Potential Biomass in Small-Diameter Trees: Overstocked Sapling-Seedling Stands
Using the 2006 inventory data, we identified acres of natural overstocked sapling-seedling stands with no evidence of tree cutting. These stands are > 100 percent stocked with the majority of the stocking in trees from 1.0 to 4.9 inches d.b.h. Small trees are difficult and costly for loggers to efficiently handle with current technology. The harvesting of biomass from precommercial thinnings is tempered by these high costs, and by the current lack of markets for small-diameter material. Given these constraints, we wanted our estimate of available biomass from precommercial thinnings to be con-servative. To accomplish this, we assumed that only 1/10th of the overstocked sapling-seedling acres would be treated in a given year, and the thinning would remove 75 percent of the biomass in live trees 1.0–5.0 inches d.b.h.
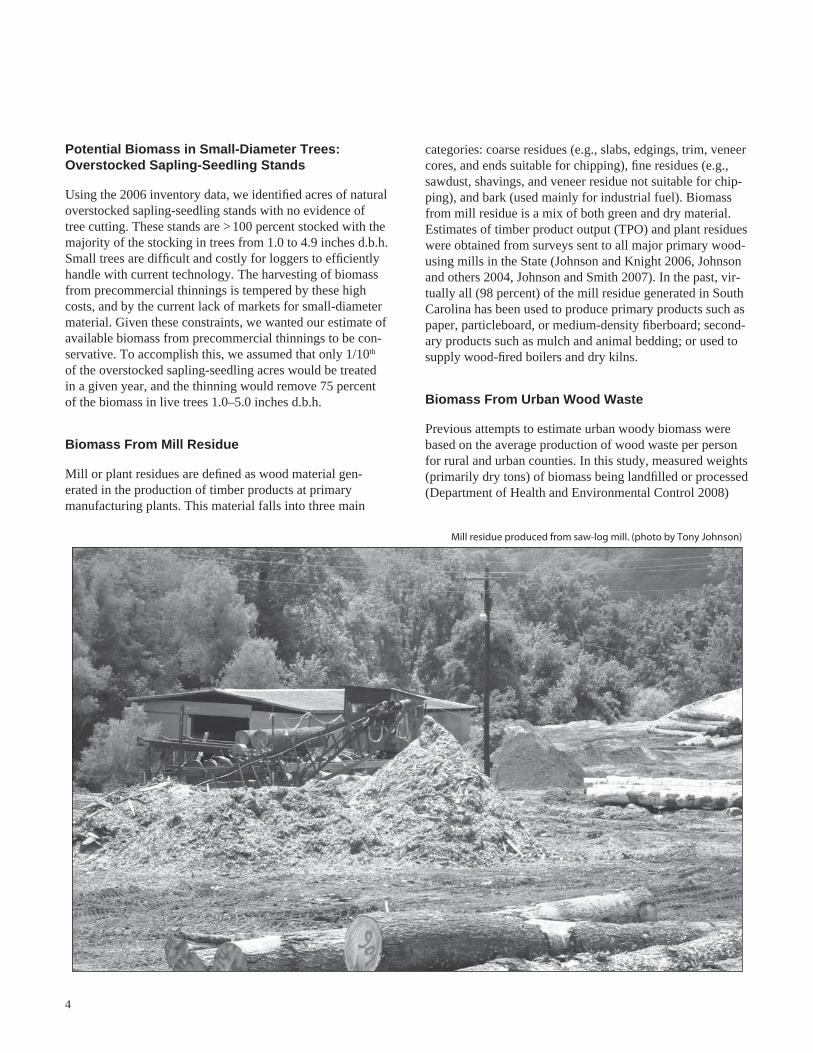
Biomass From Mill Residue
Mill or plant residues are defined as wood material gen-erated in the production of timber products at primary manufacturing plants. This material falls into three main
categories: coarse residues (e.g., slabs, edgings, trim, veneer cores, and ends suitable for chipping), fine residues (e.g., sawdust, shavings, and veneer residue not suitable for chip-ping), and bark (used mainly for industrial fuel). Biomass from mill residue is a mix of both green and dry material. Estimates of timber product output (TPO) and plant residues were obtained from surveys sent to all major primary wood-using mills in the State (Johnson and Knight 2006, Johnson and others 2004, Johnson and Smith 2007). In the past, vir-tually all (98 percent) of the mill residue generated in South Carolina has been used to produce primary products such as paper, particleboard, or medium-density fiberboard; second-ary products such as mulch and animal bedding; or used to supply wood-fired boilers and dry kilns.
Biomass From Urban Wood Waste
Previous attempts to estimate urban woody biomass were based on the average production of wood waste per person for rural and urban counties. In this study, measured weights (primarily dry tons) of biomass being landfilled or processed (Department of Health and Environmental Control 2008)
Mill residue produced from saw-log mill. (photo by Tony Johnson)

5
were used to quantify urban wood waste. Urban wood is a diverse category that includes five distinct sources of biomass: recycled wood and paper, wood grinding/compost-ing operations, construction and demolition (C&D) landfills, land clearing debris (LCD) landfills, and incinerators. With the exception of LCD, weight estimates for biomass in urban wood waste are dry tons.
Biomass Producer Surveys: Determining Biomass Production Over a Range of Prices
A timber producer survey and a mill residue survey were conducted by SCFC in October 2008 to estimate the avail-ability of several forms of biomass over a range of prices. A copy of the survey questions is available upon request from SCFC.
The timber producer survey, sent to the 148 members of the South Carolina Timber Producers Association, described the types of biomass being assessed: logging residues (tops, limbs, and bark) and small-diameter and cull trees left standing after logging. These types of biomass are being underutilized presently.
Conventional equipment needed for most mechanized logging operations includes a feller-buncher, one or more grapple skidders, a delimber, and a loader. The survey stressed the need for additional specialized equipment, such as chippers, grinders, and chip vans to recover the material—additions that require a significant investment by the timber producer.
Producers already recovering biomass from logging opera-tions were asked to provide specific information about their annual production level, their average delivered price per ton, their average hauling distance, and the region of the State where they operate.
Timber producers not currently recovering biomass during their logging operations were asked to estimate the price per ton where they would invest in the needed equipment to harvest logging residues or standing residuals, assuming a 30-mile haul distance. These timber producers were also asked to identify their region of operation and estimate the weekly production level in tons of biomass they potentially could recover.
A mill residue survey was distributed to South Carolina’s solid wood product mills. The survey requested information about the potential quantity of residues, the current price per ton received by the producing mill, and the average distance the biomass is hauled to current users. The types of mill
residue covered in the survey included sawdust, shavings, bark, chips, and other coarse residues for both softwood and hardwood mills. Volume estimates for each type are from TPO data. The specific price requested was the price per ton (dry or green weight) paid for each commodity at the producing mill, not including freight charges. A weighted average sales price for each type of mill residue was calculated by dividing the total value (quantity X price) by the total volume sold. The weighted average sales price was assumed to be the point where the estimated volume of each mill residue would become available for biofuel. As with other biomass sources, the per ton prices for mill residue reflect 2008 market conditions and do not account for effects of competitive supply and demand conditions that could arise between current industry and new energy users.
Results
Logging Residue and Residual Inventory: Unutilized Biomass on Harvested Acres
Biomass in logging residue and standing residual inventory represent missed opportunities loggers could take advantage of should biomass markets develop. This material can be harvested as part of the original logging operation, eliminating the need for a costly second site visit.
Table 1 provides a summary of the tree harvest activity that occurred on South Carolina’s timberland acres annually between 2001 and 2006, and estimates of the biomass in standing residual inventory after cutting. Final harvest was the predominant cutting activity occurring on 167,900 acres
Table 1—Timberland acres with tree harvesting and the biomass in standing residual inventory trees after harvest, South Carolina, 2001 to 2006
Tree harvest activity AcresBiomass in residual
inventory treesa
thousand green tons per acre
green tons per year
Final harvest 167.9 10.9 1,831,585Partial harvest 66.5 9.6 638,659Seed-tree/shelterwood 10.1 4.5 45,903Commercial thinning 155.6 7.5 1,166,863Timber stand improvement 12.3 4.3 52,915
Total 412.4 3,735,925
a For final harvest acres standing residual inventory includes the biomass in trees ≥ 1.0-inch d.b.h. For all other tree harvesting standing residual inventory includes only rough and rotten trees ≥ 1.0-inch d.b.h.

6
annually, while commercial thinning occurred on 155,600 acres each year. Total timberland area with evidence of tree cutting averaged roughly 412,400 acres annually.
Total biomass in standing residual inventory on all acres with tree cutting averaged >3.7 million tons annually. On final harvest acres—which includes clearcutting—loggers left an average of 1.8 million tons of biomass per year in residual inventory (all standing inventory trees ≥ 1.0 inch d.b.h.). This equates to 10.9 tons per acre of unutilized biomass on final harvest sites each year that could potentially supply a bioenergy industry. Estimates of residual biomass for all other cutting includes only rough and rotten trees ≥ 1.0 inches d.b.h. Biomass in rough and rotten trees on these acres averaged 1.9 million tons, or 7.8 tons per acre, per year.
The volume attributed to South Carolina’s TPO and logging residues are generated from the cutting that occurred on the 412,400 acres. Table 2 shows the estimate of logging residue as a component of timber removals. Biomass in logging residue averaged 7.8 million tons annually from 2001 to 2005. Nearly 5.3 million tons were from softwoods while 2.5 million tons were from hardwood species. Averaged over all acres with evidence of cutting, nearly 19 tons of biomass per acre were left as logging residue, material potentially recoverable for biofuel.
Table 2—Annual timber removals by class, species group, and source, South Carolina, 2001 to 2005
Removals classand species group
Allsources
SourceAll live
removalsOther
sourcesa
green tons
Roundwood productsSoftwood 18,636,115 18,049,425 586,690Hardwood 4,993,773 4,682,169 311,604
Total 23,629,888 22,731,594 898,294
Logging residuesb
Softwood 5,306,869 1,497,913 3,808,956Hardwood 2,494,400 1,383,660 1,110,740
Total 7,801,269 2,881,573 4,919,696
Other removalsc
Softwood 1,585,877 1,178,665 407,212Hardwood 2,678,848 2,133,570 545,278
Total 4,264,725 3,312,235 952,490
Total removalsSoftwood 25,528,861 20,726,003 4,802,858Hardwood 10,167,021 8,199,399 1,967,622
Total 35,695,882 28,925,402 6,770,480
a Includes stumps, tops, and limbs.b The unused portion of trees cut or destroyed during logging operations. c The volume of trees removed from the inventory by cultural operations, resulting in the removal of the trees from timberland.
Pine saw-log operation in Newberry County, South Carolina. (photo by Nathan Smith)

7
Based on current FIA estimates, biomass from standing residuals and logging residue combined totaled 26.8 tons per acre on acres with tree harvesting activity. These are currently unutilized, sustainable sources of biomass material that could help develop and supply a bioenergy industry in the State without increasing current harvesting rates.
Potential Biomass From Commercial Thinning
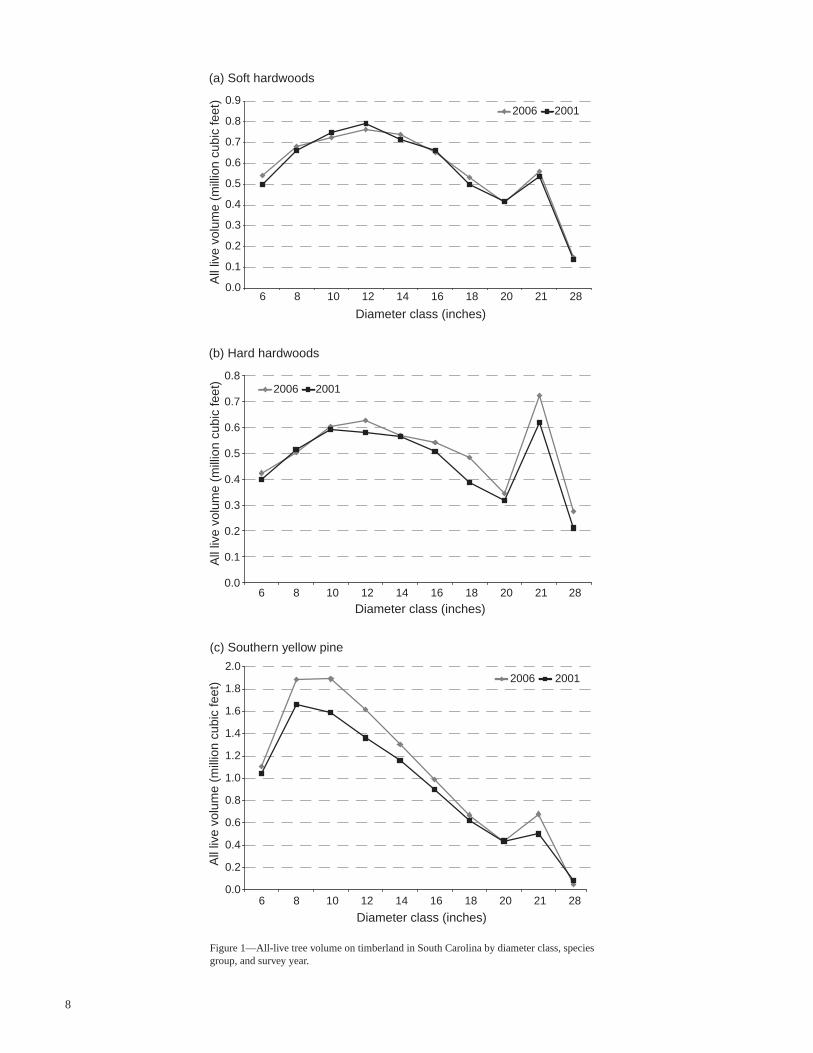
Recall that for this study, commercial thinning would be included as a potential source for biofuel if (1) poletimber volume had increased significantly over time, and (2) that the increase could be maintained in the future. To determine whether these requirements were met, we analyzed the distribution of volume by diameter class for soft hardwood, hard hardwood, and southern yellow pine species groups for the 2001 and 2006 FIA surveys (fig. 1). The southern yellow pine volume includes other softwoods which contribute little to estimates of total pine volume in South Carolina.
From 2001 to 2006, volume in the poletimber diameter classes (the 6-inch and 8-inch classes) for both hardwood species groups remained relatively unchanged (fig. 1a and b). Based on FIA estimates, there is currently no excess
volume of hardwood poletimber to contribute to biomass supply. The minor changes in volume indicate that growth and removals of hardwood poletimber are generally in balance. To assume that one-half of the volume and net growth of hardwood poletimber could be harvested for biomass might risk overcutting in those diameter classes and negatively effecting future volume trends. Therefore, we excluded commercial thinning of hardwoods from consideration as potential feedstock for bioenergy at this time.
Southern yellow pine poletimber presents a much different case to consider. Since 2001, southern yellow pine poletimber volume has increased substantially (fig. 1c), adding to the softwood volume that has been accumulating for decades. This increased poletimber volume met one requirement for consideration as a potential source for biomass. Additional analysis, however, suggests that the increase may be short lived.
The rate of planting in South Carolina—more specifically the rate of planting loblolly pine—has trended downward since the late 1990s, and has dropped substantially since 2001 (fig. 2). As a result, there are far fewer acres of young southern yellow pine stands (0–15 years old) available
Feller buncher thinning in a 25-year old loblolly pine plantation. (photo by Tony Johnson)
8
Figure 1—All-live tree volume on timberland in South Carolina by diameter class, species group, and survey year.
(b) Hard hardwoods
0.0
0.1
0.2
0.3
0.4
0.5
0.6
0.7
0.8
6 8 10 12 14 16 18 20 21 28
Diameter class (inches)
All
live
volu
me
(mill
ion
cubi
c fe
et)
2006 2001
(c) Southern yellow pine
0.0
0.2
0.4
0.6
0.8
1.0
1.2
1.4
1.6
1.8
2.0
6 8 10 12 14 16 18 20 21 28
Diameter class (inches)
All
live
volu
me
(mill
ion
cubi
c fe
et) 2006 2001
(a) Soft hardwoods
0.0
0.1
0.2
0.3
0.4
0.5
0.6
0.7
0.8
0.9
6 8 10 12 14 16 18 20 21 28
Diameter class (inches)
All
live
volu
me
(mill
ion
cubi
c fe
et)
2006 2001

9
to replace older stands now ready for harvest (fig. 3). The current high level of softwood poletimber volume will diminish as these trees grow from the pulpwood diameter classes to higher value products. Although commercial thinning of softwood poletimber is currently an option, there is reason to doubt that this biomass source would continue to be available at such high levels in the long term.
Based on our analysis, neither softwood or hardwood poletimber should currently be considered as a potential source as feedstock for bioenergy development. However, the criteria used to arrive at this decision should be reassessed as new inventory data are made available. Our approach considers only the biological constraints determining the supply of biomass from commercial thinnings. Increases in the price per ton for bioenergy fuel will greatly influence how South Carolina’s poletimber resource is utilized. The effect of price on the utilization of poletimber was considered outside the scope of this study.
Overstocked Stands: Potential Biomass From Precommercial Thinnings
There are almost 425,900 acres of natural sapling-seedling stands with no evidence of cutting in South Carolina that offer a potential source for biomass (table 3). These overstocked timberland acres support nearly 7.2 million green tons of biomass in small-diameter trees (1.0–4.9 inches d.b.h.). Just over 4.7 million tons would come from thinning acres of hardwood forest types. Assuming markets are available, a precommercial thinning on 10 percent of the total acres annually, removing 75 percent of the biomass in small trees, could provide about 540,000 tons annually to supply South Carolina’s bioenergy industry.
Mill Residue: Nearly All is Utilized for Other Products
Estimates from the 2007 forest industry survey (Johnson and Adams 2009) indicate that nearly 6.2 million tons of wood and bark residue were generated from primary
0
20
40
60
80
100
120
140
160
180
1981 1984 1987 1990 1993 1996 1999 2002 2005 2008
Year
See
dlin
gs p
lant
ed (
mill
ions
)Cost shareNoncost share
Figure 2—Number of seedlings planted in South Carolina, 1981 to 2008.

10
0.0
0.2
0.4
0.6
0.8
1.0
1.2
Age class (years)
Acr
es (
mill
ions
)
0 to
5
11 to
15
21 to
25
31 to
35
81 to
85
91 to
95
100+
41 to
45
51 to
55
61 to
65
71 to
75
Figure 3—Distribution of southern yellow pine forest land by age class, South Carolina, 2007.
Topping pine trees on a pine logging operation in upstate South Carolina. (photo by Nathan Smith)

11
Table 4—Primary mill residue by roundwood type, species group, and residue type, South Carolina, 2007
Roundwood type and species group
Alltypes
Residue type
Bark Coarse Sawdust Shavingsgreen tons
Saw logsSoftwood 3,580,514 553,019 1,554,385 920,326 552,784Hardwood 279,525 55,731 120,306 102,351 1,137
Total 3,860,039 608,750 1,674,691 1,022,677 553,921
Veneer logsSoftwood 589,248 95,815 232,300 261,133 0Hardwood 117,846 19,143 49,233 49,470 0
Total 707,094 114,958 281,533 310,603 0
PulpwoodSoftwood 697,655 697,655 0 0 0Hardwood 313,961 313,961 0 0 0
Total 1,011,616 1,011,616 0 0 0
Other industriala
Softwood 585,382 475,523 107,304 2,555 0Hardwood 0 0 0 0 0
Total 585,382 475,523 107,304 2,555 0
TotalSoftwood 5,452,799 1,822,012 1,893,989 1,184,014 552,784Hardwood 711,332 388,835 169,539 151,821 1,137
Total 6,164,131 2,210,847 2,063,528 1,335,835 553,921
a Includes poles, pilings, posts, and all other industrial products.
processors in South Carolina (table 4). The bulk of this residue, 5.5 million tons, comes from processing softwoods. Sawmills and veneer mills combined generated 4.6 million tons. Bark (2.2 million tons) and coarse residues (2.1 million tons) together comprised 69 percent of the mill residue produced. The State’s primary processing mills generate a substantial amount of residue, but virtually all of this mate-rial is currently used to manufacture primary and secondary products, or used as energy sources to fire boilers and kilns.
Table 5 shows the disposal and use of South Carolina’s mill residue for 2007. More than 3.3 million tons were used for industrial fuel either at pulpmills for boiler fuel or at sawmills for dry kiln operations. Bark and sawdust, at 1.9 and 1.2 million tons, respectively, accounted for 95 percent of mill residue utilized for fuel. Nearly 88 percent of bark residue produced was utilized for fuel, with the remainder going for mulch or miscellaneous products. The bulk of coarse residue produced, 1.8 million tons, was utilized for pulp or fiber products.
Table 3—Biomass in trees < 5.0 inches diameter at breast height (d.b.h.) in overstocked natural sapling-seedling timberland stands with no tree harvest activity, South Carolina, 2006
Forest-type group
Overstocked naturalsapling-seedlingtimberland acres,
no cutting
Biomass in trees < 5.0
inches d.b.h.thousand acres green tons
Natural longleaf-slash 11.0 46,241Natural loblolly-shortleaf 106.1 2,435,985Natural oak-pine 73.2 700,693Oak-hickory 183.0 2,651,072Oak-gum-cypress 45.6 1,043,029Elm-ash-cottonwood 6.9 316,995
Total 425.9 7,194,014

12
Reallocation of Mill Residues by Price Points
Mill residues are currently 98 percent utilized, but their disposal and utilization could change as bioenergy markets develop. With increasing demand and rising fuel prices, biomass already being used for fuel could be reallocated to new markets in closer proximity to the producing mill. Increased prices would also make bioenergy markets more competitive for the biomass that currently goes to mulch
and fiber products. Additional research on the sales price of biomass to existing markets is needed to better assess potential reallocation of mill residues.
Results from the mill survey provided the price point at which mill residue could potentially be used as feedstock for biofuels. Nineteen mill surveys were returned and ranged from 1 to 10 mills reporting for each of the mill residue types. The price and hauling distances are shown in table 6.
Table 5—Disposal of residue at primary wood-using plants by product, species group, and type of residue, South Carolina, 2007
Product andspecies group
Alltypes
Residue type
Bark Coarse Sawdust Shavings green tons
Fiber products Softwood 1,641,314 0 1,641,314 0 0Hardwood 147,753 0 147,753 0 0
Total 1,789,067 0 1,789,067 0 0
ParticleboardSoftwood 389,573 0 45,835 14,862 328,876Hardwood 0 0 0 0 0
Total 389,573 0 45,835 14,862 328,876
Sawn productsSoftwood 58,910 0 58,910 0 0Hardwood 0 0 0 0 0
Total 58,910 0 58,910 0 0
Industrial fuelSoftwood 2,856,535 1,591,300 74,031 1,101,587 89,617Hardwood 481,384 346,952 15,592 117,713 1,127
Total 3,337,919 1,938,252 89,623 1,219,300 90,744
MiscellaneousSoftwood 505,360 230,523 73,324 67,222 134,291Hardwood 73,270 41,424 6,159 25,677 10
Total 578,630 271,947 79,483 92,899 134,301
Not usedSoftwood 1,107 189 575 343 0Hardwood 8,925 459 35 8,431 0
Total 10,032 648 610 8,774 0
All productsSoftwood 5,452,799 1,822,012 1,893,989 1,184,014 552,784Hardwood 711,332 388,835 169,539 151,821 1,137
Total 6,164,131 2,210,847 2,063,528 1,335,835 553,921

13
Table 6—Annual production of biomass, delivered price per green ton, and average distance hauled for existing biomass producers, South Carolina, 2008
Species group and residue type
Mills reporting
Average pricea
Average distance hauled
Price point to include biomass
number dollars per ton
miles dollars
SoftwoodSawdust 6 23.75 27 20 to 28b
Shavings 9 49.85 35 NABark 10 14.30 24 20 Chips 7 27.00 30 28 Other coarse residues 1 18.00 30 20
HardwoodSawdust 2 12.92 26 20 Shavings NA NA NA 20 Bark 2 10.66 20 20 Chips 2 20.07 57 20 Other coarse residues 2 13.49 45 20
NA = not available.a Average price is price per ton delivered to producing mill.b Apportion 20 percent of the biomass in sawdust per $2 price increase.
Table 7—Annual production of urban wood waste in South Carolina, fiscal year 2007a
Biomass source Facilities Biomass Utilizednumber tonsb percent
Recycled wood and paper NA 994,028 100Wood grinding/
composting operations 93 579,985 90Construction/
demolition landfills 150 351,195 0Land clearing debris landfills 40 133,461 0Incinerators 7 21,997 0
Total 2,080,666 73
NA = not available.a Department of Health and Environmental Control (2008).b Includes both green and dry tons.
Based on the results of the survey, most types of mill residue could become available at a delivered price of $20 per ton. The exceptions include softwood shavings which generally are utilized for higher-valued animal bedding, softwood chips which would become available at $28 to as much as $30 per ton, and softwood sawdust which would become available over a price range of $20 to $28 per ton.
Urban Wood Waste: A Potential Primary Contributor to Bioenergy
Urban wood waste is a diverse category of biomass that likely will be a primary contributor to the expansion of biomass energy facilities in South Carolina. It is perhaps the most readily available source of biomass. The average landfill tipping fee is $42 per ton, so the avoidance of land filling costs makes urban wood waste a low-cost option for bioenergy projects. How to best collect and utilize this material, however, is an issue that could benefit from additional research. Therefore, our estimates of available biomass from urban wood waste are conservative.
From July 2006 to June 2007 (FY07), 17.2 million tons of total solid waste (TSW) were generated by South Carolina’s population of 4.3 million people (Department of Health and
Environmental Control 2008). This estimate includes both green and dry tons. The South Carolina Solid Waste Policy and Management Act of 1991 and its amendment in 2000 regulate the management of solid waste and set recycling goals that have increased the availability of urban wood for bioenergy projects. Currently, just over 50 percent of TSW is recycled and kept out of landfills.
In FY07, just over 994,000 tons of wood and paper—the largest source of urban biomass—were recycled (table 7). This category includes 726,876 tons of paper, along with 241,679 tons of yard trimmings, and 25,473 tons of wood packaging materials. The bulk of this material has low moisture content and therefore a higher Btu value than some other sources of biomass. Demand for this material varies with overall economic conditions.
In South Carolina, there are 93 fixed-site wood grinding/composting operations. These facilities are sometimes colocated with C&D landfills, but can be stand-alone facilities. In FY07, nearly 580,000 tons of biomass were processed primarily for boiler fuel, mulch and compost. Ninety percent of this material was utilized with the remainder going to landfills.
A total of 3.6 million tons of C&D debris was generated in FY07. The 150 C&D landfills are broadly classified into four categories based on the material they receive. The 40 LCD landfills are the only landfills used solely for the disposal of trees, stumps, wood chips, and yard trash. In FY07, the LCD landfills received 133,461 tons of woody
14
biomass. In 1998, Wiltsee (1998) reported that 18–20 percent of all C&D debris was wood. With South Carolina’s success in recycling previously landfilled materials, it is judged that 10 percent of the C&D debris is useable (not treated or painted) woody material that could be utilized for bioenergy. This amounts to 351,195 tons of woody biomass going into C&D landfills, in addition to the 133,461 tons going into LCD landfills.
Seven incinerating facilities are located in South Carolina that process 21,997 tons of LCD. This volume could be a potential source for bioenergy production.
In FY07, a total of 2.1 million tons of urban wood waste was generated in South Carolina. This material ranges in moisture content from kiln-dried lumber to green land clearing debris. Seventy-three percent of the urban wood is currently being utilized for boiler fuel, mulch, compost, or recycled paper content. Increased competition for urban wood could result in reallocation of the material currently utilized. A reduction in the urban biomass going to existing industry operators would necessitate substitution from other sources.
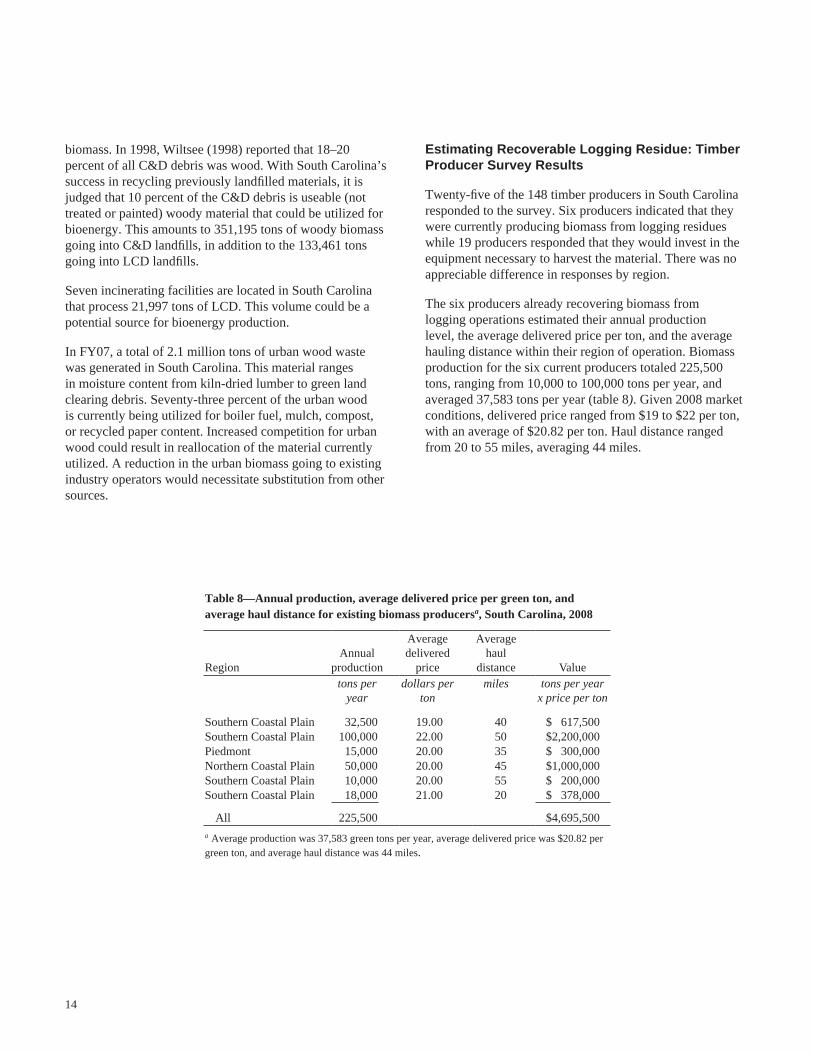
Estimating Recoverable Logging Residue: Timber Producer Survey Results
Twenty-five of the 148 timber producers in South Carolina responded to the survey. Six producers indicated that they were currently producing biomass from logging residues while 19 producers responded that they would invest in the equipment necessary to harvest the material. There was no appreciable difference in responses by region.
The six producers already recovering biomass from logging operations estimated their annual production level, the average delivered price per ton, and the average hauling distance within their region of operation. Biomass production for the six current producers totaled 225,500 tons, ranging from 10,000 to 100,000 tons per year, and averaged 37,583 tons per year (table 8). Given 2008 market conditions, delivered price ranged from $19 to $22 per ton, with an average of $20.82 per ton. Haul distance ranged from 20 to 55 miles, averaging 44 miles.
Table 8—Annual production, average delivered price per green ton, and average haul distance for existing biomass producersa, South Carolina, 2008
RegionAnnual
production
Average delivered
price
Average haul
distance Value tons per
yeardollars per
tonmiles tons per year
x price per ton
Southern Coastal Plain 32,500 19.00 40 $ 617,500Southern Coastal Plain 100,000 22.00 50 $2,200,000Piedmont 15,000 20.00 35 $ 300,000Northern Coastal Plain 50,000 20.00 45 $1,000,000Southern Coastal Plain 10,000 20.00 55 $ 200,000Southern Coastal Plain 18,000 21.00 20 $ 378,000
All 225,500 $4,695,500a Average production was 37,583 green tons per year, average delivered price was $20.82 per green ton, and average haul distance was 44 miles.

15
The 19 timber producers not currently recovering biomass were asked to determine what their price per ton might be to recover the cost of investing in the equipment necessary to harvest logging residues, assuming a 30-mile haul distance. They were also asked to estimate the weekly production of biomass material they could potentially recover. Their esti-mates reflect their operating costs and production capacity as of 2008.
The estimated annual production capacity of biomass for the 19 potential biomass producers totaled 652,426 tons (table 9), or an estimated average production of 34,338 tons of biomass per year. Their estimated delivered price for a 30-mile haul averaged $27.50 per ton. When weighted by production level, their estimated delivered price declined slightly to $26.29 per ton.
We assumed that the 25 existing and potential biomass producers who responded to the survey represented all timber producers in the State. Responses were combined to determine total potential biomass production (877,926 tons) and to establish a range of delivered price points per ton of biomass, based on 2008 conditions. As the price per ton increased, we assumed that more of South Carolina’s loggers statewide would begin harvesting an increasing percentage of biomass in logging residue. The price points ranged from $20 to $30 per ton:
Table 9—Estimated annual production and target delivered price per green ton for potential biomass producersa, South Carolina, 2008
Region
Estimated annual
production
Target delivered
price Valuetons per
yeardollars per ton
tons per yearx price per ton
Piedmont 52,000 26.00 $ 1,352,000Piedmont 45,500 28.00 $ 1,274,000Piedmont 6,500 30.00 $ 195,000Piedmont 52,000 25.00 $ 1,300,000Southern Coastal Plain 26,000 26.00 $ 676,000Southern Coastal Plain 78,000 24.00 $ 1,872,000Piedmont 7,800 28.00 $ 218,400Piedmont 32,894 28.00 $ 921,032Piedmont 18,200 26.00 $ 473,200Southern Coastal Plain 78,000 28.00 $ 2,184,000Southern Coastal Plain 15,600 22.50 $ 351,000Piedmont 26,000 25.00 $ 650,000Southern Coastal Plain 26,000 22.00 $ 572,000Piedmont 6,500 50.00 $ 325,000Piedmont 18,200 30.00 $ 546,000Piedmont 32,894 27.00 $ 888,138Piedmont 26,000 26.00 $ 676,000Southern Coastal Plain 34,338 25.00 $ 858,450Southern Coastal Plain 70,000 26.00 $ 1,820,000
Total 652,426 $17,152,220a Average estimated production of biomass was 34,338 green tons per year and average delivered price for a 30-mile haul was $27.50 per green ton.
Delivered price point (dollars per ton for 30-mile haul distance) $20 $22 $24 $26 $28 $30
Cumulative percent of logging residues recovered 12% 30% 39% 74% 96% 100%
At $20 per ton, South Carolina’s existing biomass produc-ers could recover a combined 125,500 tons of the available biomass in logging residue (table 8). This equates to 12 percent of the total available, which we assumed would rep-resent the percentage collected if all 148 timber producers in the State harvested logging residue. The price for biomass would have to rise to $22 per ton before a potential producer could afford to harvest the material (table 9). At that price per ton, existing and potential producers combined could harvest a cumulative 30 percent of the biomass in unutilized logging residue. Nearly three-fourths would be recovered at $26 per ton. At $30 per ton, it is assumed that all biomass producers in the State would be involved, resulting in a 100-percent recovery of available biomass.
Obviously, a 100-percent recovery rate is unlikely, if not impossible. Other studies suggest that a 60-percent recovery rate is plausible (Perlack and others 2005). Using 60 percent as the maximum rate of recovery, we applied the price points and cumulative percentages recovered to the estimates of logging residue from tree cutting activity (shown in table 2) to estimate the proportion potentially recoverable.

16
Table 10 shows the distribution of recoverable logging residue by price point at the State level for softwood and hardwood biomass combined. The estimates in table 10 do not include stump volume that, for this study, was con-sidered unrecoverable. Based on expert opinion, we also adjusted the logging residue from nonmerchantable trees (< 5.0 inches d.b.h.) killed during the logging to include only 20 percent as recoverable biomass (Lupold 2008).
With those adjustments, we estimate that, at $20 per ton, South Carolina’s loggers could recover just over
Table 10—Biomass of recoverable logging residue by potential price per green ton, recovery rate, and green tons per acre, South Carolina, 2001 to 2005
Potentialprice per tona
Size class of harvested
trees
Recoverable logging residue in harvested treesb
Merchantablec
Non-merchantabled Total
Tons per acre
inches green tons
$20 > 5 208,533 321,594 530,127 1.3< 5 0 74,014 74,014 0.2
All trees 208,533 395,608 604,141 1.5
$22 > 5 469,201 723,587 1,192,788 2.9< 5 0 166,531 166,531 0.4
All trees 469,201 890,118 1,359,319 3.3
$24 > 5 625,601 964,783 1,590,384 3.9< 5 0 222,042 222,042 0.5
All trees 625,601 1,186,825 1,812,426 4.4
$26 > 5 1,173,003 1,808,969 2,981,972 7.2< 5 0 416,327 416,327 1.0
All trees 1,173,003 2,225,296 3,398,299 8.2
$28 > 5 1,642,310 2,201,121 3,843,431 9.3< 5 0 536,599 536,599 1.3
All trees 1,642,310 2,737,720 4,380,030 10.7
$30 > 5 1,564,010 2,411,952 3,975,962 9.6(60% recovery rate) < 5 0 555,105 555,105 1.3
All trees 1,564,010 2,967,057 4,531,067 11.0
a Potential price per green ton determined from statewide logger survey.b Distribution of logging residue by potential price per green ton assumes a maximum of 60 percent of total residue produced is recoverable.c For harvested trees ≥ 5.0 inches diameter at breast height (d.b.h.), the volume in the bole from a 1-foot stump to a 4-inch top.d For harvested trees ≥ 5.0 inches d.b.h., it is the volume in the portion of the tree above a 4-inch top, and the volume in limbs to a 1-inch end diameter. Also includes total volume (from 1-foot stump to 1-inch top diameter) of trees < 5.0 inches d.b.h.
604,000 tons of biomass per year, including > 74,000 tons in the small-diameter trees. At each $2-increment in the price per ton established by the timber producer survey, more biomass would become available to supply a bioenergy industry. At $30 per ton, the proposed 60-percent maximum recovery rate would be reached and > 4.5 million tons of biomass would potentially be recovered from the 412,400 acres of timberland with tree harvest activity. At that price per ton, all potential biomass producers in the State would be able to invest in the needed equipment to harvest the previously unutilized logging residue.

17
Summary: Total Biomass Potential at Price Points
Table 11 summarizes the total biomass potential from all sources identified in this study. The price points and cumula-tive percent recovery rates established by the logger survey were again used to apportion the total potential biomass by increasing price per ton. Individual estimated values have been rounded to the nearest thousand tons. Table colors identify whether the biomass is currently utilized (black), partially utilized (light gray), or unutilized (medium gray).
At $20 per ton, biomass from all sources could provide > 4.8 million tons to supply a biofuels industry in South Carolina. Increasing the price per ton to the $30 maximum could result in a total of 16.5 million tons of biomass each year, assuming all of the biomass would be available for bioenergy production. As of 2008, just over 8.8 million tons were unutilized, including 540,000 tons from precommercial thinning. However, the technology and experience needed to efficiently and economically harvest this small-diameter (precommercial) material and logging residue currently are lacking.
Results from the mill survey established that virtually all mill residue currently produced is utilized for other pur-poses. However, assuming competition for this material would arise from the development of a bioenergy industry, mill residue alone would supply the most biomass across the range of prices. At $20 per ton, nearly 2.6 million tons of mill residue could be diverted to use as biofuel. That rises to > 5.6 million tons at $28 per ton.
Table 11—Potential biomass in South Carolina, by source and cost
SourceCost per ton (dollars)
20 22 24 26 28 30tons
UnutilizedLogging residuea 600,000 1,360,000 1,800,000 3,400,000 4,380,000 4,530,000Standing residuals 448,000 1,121,000 1,457,000 2,765,000 3,587,000 3,736,000Precommercial thinning 0 0 0 0 0 540,000
Total 1,048,000 2,481,000 3,257,000 6,165,000 7,967,000 8,806,000
UtilizedMill residue 2,571,000 2,931,000 3,291,000 3,651,000 5,610,000 5,610,000Urban wooda 1,252,000 1,418,000 1,584,000 1,749,000 1,915,000 2,081,000
Total 3,823,000 4,349,000 4,875,000 5,400,000 7,525,000 7,691,000
Total 4,871,000 6,830,000 8,132,000 11,565,000 15,492,000 16,497,000
Numbers in shaded areas: black = currently utilized; light gray = partially utilized; and medium gray = not utilized.a Includes both green and dry tons.
At $26 per ton, volume from logging residue and stand-ing residuals combined (< 6.2 million tons) would surpass mill residue (> 3.6 million tons) as potential feedstock for biofuel. At this price and higher, the two sources together account for more than one-half of the potential biomass produced in the State. Biomass from urban wood waste could add almost 2.1 million tons at the $30 price per ton.
Discussion
Interest in woody biomass for energy production rises and falls with the changes in fossil fuel costs. Energy costs are once more on the rise creating an environment where investing in biomass for energy feedstock is again a finan-cially viable alternative. The biofuels producers are vital to expanding the bioenergy industry in South Carolina. Industry expansion may hinge on efforts by the Federal gov-ernment and private industry to encourage capacity building.
Successful development depends on many factors, not the least of which is an available and sustainable supply of raw material. Results from this study indicate that a substantial amount of wood fiber in South Carolina, primarily in the form of logging residue and standing residuals, is currently underutilized. This untapped volume of biomass could support development of a biofuels industry without an increase in harvesting.

18
Logging residue is not utilized for a variety of reasons but for the most part it is simply material that has not “paid its way” out of the woods. Markets for unused logging residue and for harvesting small-diameter trees (< 5.0 inches d.b.h.) from plantation thinnings, for example, largely have been lacking (Straka and others 2004). Growing interest in bio-fuels, including biomass gasification to ethanol, may create needed markets (Scott and Tiarks 2008, Straka and others 2004). New markets and improved technology would make recovering small-diameter logging residue and harvesting standing residuals financially viable for loggers. This, in turn, could create an additional source of income for forest landowners, and would reduce their site preparation costs.
Millions of dollars are being invested for research and development to produce energy from these sources more efficiently. Biomass can be chipped and burned for fuel, or processed into other biofuels products. Wood pellet manu-facturing is somewhat new to the South, but it is a $250 million industry nationwide. A few Southern States are now producing pellets, or have announced plans to build wood
pellet plants (Timber Mart-South 2007). As of 2007, there were 24 pellet fuel manufacturers in the South, including 5 in Arkansas, 4 in Georgia, 3 in Kentucky, and 3 in Virginia (Southern Bioenergy Roadmap 2009).
There are several ways to gauge the impact that biomass can have on electrical production. In terms of total retail sales, renewable biomass has the potential to supply 12–14 percent (depending on assumptions) of the electricity sold to all users in South Carolina. The top five electricity produc-ers in South Carolina produce 64.0 million megawatt hours of electricity annually (Energy Information Administration 2009). Renewable biomass could account for 18 percent of their current production.
A very important measure of capacity to the electric utility industry is the generating capacity for the hottest day of the summer when electricity demands are highest. Renewable biomass could increase the peak summer generation capacity by 6.2 percent and help prevent brownouts.
Unutilized hardwood logging residue. (photo by Tony Johnson)

19
Conclusions
The objectives of this study were to provide estimates of unutilized biomass and determine the price per ton needed by South Carolina’s timber producers to make collection of the material financially viable. These critical pieces of information provide the basis for assessing the potential for developing a biofuels industry in the State. Our results show that, over the estimated range of price per ton, the estimates of biomass produced from all sources considered in this study would support and sustain a biofuels industry of increasing scale in South Carolina. Considering only the 8.8 million annual tons of biomass currently unutilized, new facilities that use wood to produce energy could operate in the State without overly impacting existing forest industries or increasing harvest levels above current rates.
Obviously, the situation is dynamic, and there are other factors outside the scope of this study that should be con-sidered. For example, draft legislation under consideration by Congress would establish a Renewable Energy Standard requiring that a percentage of the electricity generated in the U.S. to come from renewable fuels, including biomass (Wilent 2009). Proposed definitions of what qualifies as renewable sources could restrict the availability of logging residue as feedstock for bioenergy production. The full extent of the impacts from the proposed legislation is as yet unknown. However, we believe that the biomass sources considered in this study should readily qualify as renewable.
Literature Cited
Bentley, J.W.; Johnson, T.G. 2008. South Carolina harvest and utilization study, 2006. Resour. Bull. SRS–140. Asheville, NC: U.S. Department of Agriculture Forest Service, Southern Research Station. 24 p.
Clark, A., III; Saucier, J.R. 1990. Tables for estimating total tree weights, stem weights, and volumes of planted and natural southern pines in the Southeast. Georgia For. Res. Pap. 79. Georgia Forestry Commission, Research Division. 23 p.
Conner, R.C.; Adams, T.; Butler, B. [and others]. 2004. The State of South Carolina’s forests, 2001. Resour. Bull. SRS–96. Asheville, NC: U.S. Department of Agriculture Forest Service, Southern Research Station. 67 p.
Conner, R.C.; Adams, T.O.; Johnson, T.G.; Oswalt, S.N. 2009. South Carolina’s forests, 2006. Resour. Bull. SRS–158. Asheville, NC: U.S. Department of Agriculture Forest Service, Southern Research Station. 57 p.
Department of Health and Environmental Control. 2008. South Carolina Solid Waste Management Annual Report for Fiscal Year 2007. Division of Mining and Solid Waste Management. Columbia, SC. 100 p.
Energy Information Administration. 2009. South Carolina Electricity Profile. 2007 Edition. DOE/EIA-0348(01)/2.
Johnson, T.G.; Adams, T.O. 2009. South Carolina’s timber industry—an assessment of timber product output and use, 2007. Resour. Bull. SRS–150. Asheville, NC: U.S. Department of Agriculture Forest Service, Southern Research Station. 28 p.
Johnson, T.G.; Harper, R.A.; Bozzo, M.J. 2004. South Carolina’s timber industry—an assessment of timber product output and use, 2001. Resour. Bull. SRS–89. Asheville, NC: U.S. Department of Agriculture Forest Service, Southern Research Station. 33 p.
Johnson, T.G.; Knight, M. 2006. South Carolina’s timber industry—an assessment of timber product output and use, 2003. Resour. Bull. SRS–106. Asheville, NC: U.S. Department of Agriculture Forest Service, Southern Research Station. 39 p.
Johnson, T.G.; Smith, N. 2007. South Carolina’s timber industry—an assessment of timber product output and use, 2005. Resour. Bull. SRS–121. Asheville, NC: U.S. Department of Agriculture Forest Service, Southern Research Station. 28 p.
Lupold, H.M. (Mac). 2008. [Personal communication]. Oct. 3. Columbia, SC: Lupold Consulting, Inc.
Perlack, R.D.; Wright, L.L.; Turhollow, A. [and others]. 2005. Biomass as feedstock for a bioenergy and bioproducts industry: the technical feasi-bility of a billion-ton annual supply. Washington, DC: U.S. Department of Energy and U.S. Department of Agriculture Forest Service. ORNL/TM-2005/66. 73 p.
Saucier, J.R.; Clark, A., III. 1985. Tables for estimating total tree and product weight and volume of major southern tree species and species groups. Washington, DC: Southwide Energy Committee, American Pulpwood Association. 59 p.
Scott, D.A; Tiarks, A. 2008. Dual-cropping loblolly pine for biomass energy and conventional wood products. Southern Journal of Applied Forestry. 32(1): 33-37.
Southern Bioenergy Roadmap. 2009. Southeast Agriculture & Forestry Energy Resources Alliance. Research Triangle Park, NC. 127 p.
Straka, T.J.; Irwin, H.T.; Adams, T.O. 2004. Small-diameter timber: problem or opportunity? Carolina Forestry Journal. July: 4-5.
Timber Mart-South. 2007. Energy wood & bio-fuel: pellet production expanding in the South. Market News Quarterly, 1st Quarter 2007: 22-25.
Wilent, S. 2009. Draft bill excludes biomass from Federal land, old-growth: Congress considers cap-and-trade, carbon offsets, renewable energy. Society of American Foresters. The Forestry Source. May: 14 (5): 1, 4.
Wiltsee, G. 1998. Urban wood waste resource assessment. Golden, CO. National Renewable Energy Laboratory. NREL/SR-570-25918. p. 1. Golden, CO.


Conner, Roger C.; Adams, Tim O.; Johnson, Tony G. 2009. Assessing the potential for biomass energy development in South Carolina. Res. Pap. SRS–46. Asheville, NC: U.S. Department of Agriculture Forest Service, Southern Research Station. 19 p.
An assessment of the potential for developing a sustainable biomass energy industry in South Carolina was conducted. Biomass as defined by Forest Inventory and Analysis is the aboveground dry weight of wood in the bole and limbs of live trees ≥1-inch diameter at breast height, and excludes tree foliage, seedlings, and understory vegetation. Several possible sources of biomass were analyzed: unutilized logging residue and standing residual inventory trees on acres with tree harvesting; commercial thinning; precommercial thinning on overstocked natural sapling-seedling stands; mill residue; and urban wood waste. A range of prices from $20 to $30 per ton was established by surveys sent to South Carolina’s timber producers. Prices reflect 2008 market conditions. The estimates of potential biomass distributed across these price points rose from 4.8 million tons to a total of 16.5 million tons annually. Nearly 7.7 million tons are currently being utilized. New facilities that use wood to produce energy could capitalize on the 8.8 million annual tons of unutilized biomass and operate without overly impacting existing forest industries or increasing harvest levels above 2006 estimates.
Keywords: Biofuel, biomass markets, FIA, forest landowner, green tons, hardwood poletimber, haul distance, softwood poletimber, timberland.

The Forest Service, U.S. Department of Agriculture (USDA), is dedicated to the principle of multiple use management of the Nation’s forest resources for sustained yields of wood, water, forage, wildlife, and recreation. Through forestry research,
cooperation with the States and private forest owners, and management of the National Forests and National Grasslands, it strives—as directed by Congress—to provide increasingly greater service to a growing Nation.
The USDA prohibits discrimination in all its programs and activities on the basis of race, color, national origin, age, disability, and where applicable, sex, marital status, familial status, parental status, religion, sexual orientation, genetic information, political beliefs, reprisal, or because all or part of an individual’s income is derived from any public assistance program. (Not all prohibited bases apply to all programs.) Persons with disabilities who require alternative means for communication of program information (Braille, large print, audiotape, etc.) should contact USDA’s TARGET Center at (202) 720-2600 (voice and TDD).
To file a complaint of discrimination, write to USDA, Director, Office of Civil Rights, 1400 Independence Avenue, SW, Washington, DC 20250–9410 or call (800) 795-3272 (voice) or (202) 720-6382 (TDD). USDA is an equal opportunity provider and employer.