Embed Size (px)
Citation preview

CRS Report for CongressPrepared for Members and Committees of Congress
United Nations Regular Budget Contributions: Members Compared, 1990-2010
Marjorie Ann Browne Specialist in International Relations
Luisa Blanchfield Specialist in International Relations
January 15, 2013
Congressional Research Service
7-5700 www.crs.gov
RL30605

United Nations Regular Budget Contributions: Members Compared, 1990-2010
Congressional Research Service
Summary The United States is the single largest contributor to the United Nations (U.N.) regular budget. As such, Members of the 113th Congress will likely continue to demonstrate an interest in the United States’ assessment level, the cost of the U.S. assessment each year, how U.S. contributions to the regular budget compare to those of other countries, and how assessment levels have changed over time.
This report provides the assessment level, actual payment, and total outstanding contributions for the United States and other selected U.N. member states from 1990 to 2010—the last year for which data are publicly available. In 2010, the United States was assessed to pay 22% (or $532,435,102) of the regular budget. The next largest contributors were Japan (12.53%), Germany (8.018%), the United Kingdom (6.604%), and France (6.112%).
This report is updated annually, or as the U.N. document upon which the data are based is published.
United Nations Regular Budget Contributions: Members Compared, 1990-2010
Congressional Research Service
Contents Background ...................................................................................................................................... 1 Explanation of Tables ...................................................................................................................... 1
Tables Table 1. United Nations Regular Budget Contributions, Calendar Year 1990 ................................. 3 Table 2. United Nations Regular Budget Contributions, Calendar Year 1991 ................................. 4 Table 3. United Nations Regular Budget Contributions, Calendar Year 1992 ................................. 5 Table 4. United Nations Regular Budget Contributions, Calendar Year 1993 ................................. 6 Table 5. United Nations Regular Budget Contributions, Calendar Year 1994 ................................. 7 Table 6. United Nations Regular Budget Contributions, Calendar Year 1995 ................................. 8 Table 7. United Nations Regular Budget Contributions, Calendar Year 1996 ................................. 9 Table 8. United Nations Regular Budget Contributions, Calendar Year 1997 ............................... 10 Table 9. United Nations Regular Budget Contributions, Calendar Year 1998 ............................... 11 Table 10. United Nations Regular Budget Contributions, Calendar Year 1999 ............................. 12 Table 11. United Nations Regular Budget Contributions, Calendar Year 2000 ............................. 13 Table 12. United Nations Regular Budget Contributions, Calendar Year 2001 ............................. 14 Table 13. United Nations Regular Budget Contributions, Calendar Year 2002 ............................. 15 Table 14. United Nations Regular Budget Contributions, Calendar Year 2003 ............................. 16 Table 15. United Nations Regular Budget Contributions, Calendar Year 2004 ............................. 17 Table 16. United Nations Regular Budget Contributions, Calendar Year 2005 ............................. 18 Table 17. United Nations Regular Budget Contributions, Calendar Year 2006 ............................. 19 Table 18. United Nations Regular Budget Contributions, Calendar Year 2007 ............................. 20 Table 19. United Nations Regular Budget Contributions, Calendar Year 2008 ............................. 21 Table 20. United Nations Regular Budget Contributions, Calendar Year 2009 ............................. 22 Table 21. United Nations Regular Budget Contributions, Calendar Year 2010 ............................. 23
Contacts Author Contact Information........................................................................................................... 24

United Nations Regular Budget Contributions: Members Compared, 1990-2010
Congressional Research Service 1
Background Members of Congress have demonstrated an ongoing interest in annual U.S. contributions to the United Nations (U.N.) regular budget, which funds core activities for U.N. organs such as the General Assembly and Security Council,1 staffing and administration at U.N. headquarters, international conferences, human rights promotion, and U.N. special political missions, among other things. Over the years, Congress has focused on
• the overall cost of the U.S. assessment to the regular budget per year, as well as any outstanding contributions;
• how the United States assessment compares to the assessments of other U.N. member states; and
• how the United States’ payment of its assessed contributions over time compares with other U.N. member states.
In 2010—the last calendar year for which data are publicly available—the United States was the single largest contributor to the regular budget, paying $532,435,102, or 22%, in assessed contributions.2 The next largest contributors were Japan (12.530%), Germany (8.018%), the United Kingdom (6.604%), and France (6.123%). Seventeen countries, including the United States, were assessed at over 1%, representing about 83% of the total regular budget. Ten countries were assessed between 0.5% and 1%, accounting for about 7% of the budget. The rest of the U.N. membership (167 countries) accounted for about 8% of the regular budget.
This report highlights, for each of the past 20 years, payments and the total outstanding contributions of the top contributors to the U.N. regular budget—including the United States. For additional information on U.S. funding of the U.N. system, see CRS Report RL33611, United Nations System Funding: Congressional Issues, by Marjorie Ann Browne.
Explanation of Tables The enclosed tables list the assessment level, actual payment, and contributions outstanding of key contributors to the U.N. regular budget from calendar years 1990 through 2010. Most countries pay their assessment in full during the calendar year. Other countries, however, (including Argentina, Brazil, Ukraine, USSR/Russian Federation, and the United States) have on occasion failed to pay the entire assessment and maintained unpaid or outstanding contribution balances. Consequently, the annual payments listed may not always match the assessment for any given year.
1 Article 7 of the U.N. Charter defines the principal organs of the United Nations as the General Assembly, Security Council, Economic and Social Council, Trusteeship Council, the International Court of Justice, and the Secretariat. 2 Prior to January 1, 2001, the assessment level for the United States was 25%. Starting January 1, 2001, the United States was assessed to pay 22% of the U.N. regular budget. This change, adopted by the General Assembly, was in response to U.S. efforts to satisfy the conditions set by Congress for release of funds appropriated for U.S. payment of its arrearages to the U.N. regular budget and U.N. peacekeeping accounts. Detailed information on this congressional action can be found under the heading, “The Helms-Biden Agreement and Payment of Arrears” in CRS Report RL33611, United Nations System Funding: Congressional Issues, by Marjorie Ann Browne.
United Nations Regular Budget Contributions: Members Compared, 1990-2010
Congressional Research Service 2
Each table is divided into four columns, described below.
• Countries—Contributing countries are grouped into key categories: (1) the “United States”; (2) “Other Major Contributors,” which are countries assessed at more than 1%; (3) “Middle Contributors,” a new category created in 2004 that provides data on nations that are assessed at 0.5% and over but less than 1%;3 and (4) “Rest of Membership,” which lists overall contributions from the remaining member states.
• Assessment—The percentage of the U.N. regular budget at which a country is assessed.
• Payment—Country payments to the U.N. regular budget that have been received and duly recorded as of December 31 of each calendar year (assessed contributions received after that date are reported in the next statement on the status of contributions).
• Contributions Outstanding—Total outstanding contributions represent money owed by a country as of December 31 of that year. It includes both current year and prior year contributions outstanding.
Four of the five permanent U.N. Security Council members are identified in each table, and information on the fifth permanent Council member, China, is provided in a footnote. China is included among the major contributors starting in 2001, when its assessment level first exceeded 1%.
3 This group includes three countries that formerly were assessed at 1% or over.
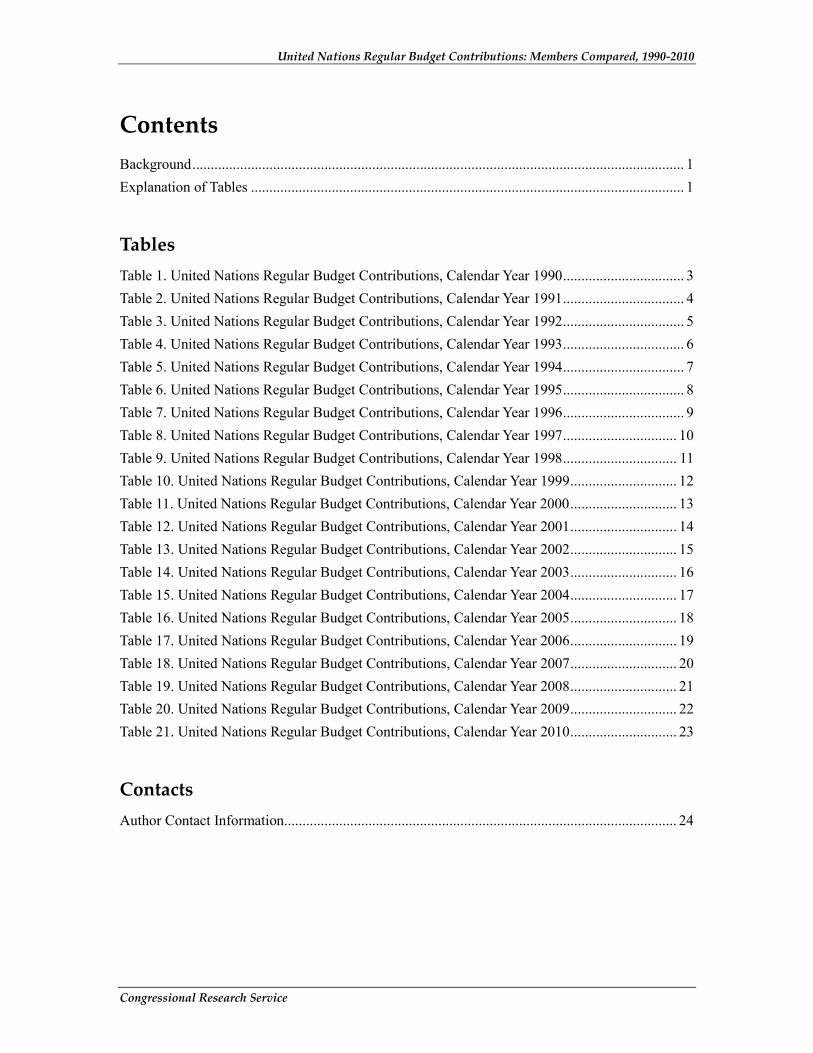
Determining Scale of AssessmentsArticle 17 of the U.N. Charter specifies that the U.N. General Assembly will determine the basis for payment of the expenses of the organization and the Assembly has decided that these expenses will be assessed “broadly according to capacity to pay.” An 18-member expert Committee on Contributions meets annually to review the scale of assessments. Every third year, the committee reevaluates the scale in preparation for a General Assembly decision approving the scale for the following three-year period. On December 24, 2009, the 64th session of the General Assembly adopted a revised scale for the years 2010-2012. While the U.S. assessment remained at 22%, the assessment levels increased or decreased for at least 138 countries.
To determine the scale of assessments, the Committee on Contributions uses estimates of each member state’s gross national product (GNP) and a number of adjustments, including data for external debt and for low per capita incomes. The General Assembly has directed that percentage shares range from a minimum of 0.001% to a maximum of 22%, and a maximum of 0.01% for those nations designated as “least developed countries.” According to the United Nations, the 22% ceiling for the largest contributor benefits the United States, “whose share of total membership GNP is approximately 27 percent.”
United Nations Regular Budget Contributions: Members Compared, 1990-2010
Congressional Research Service 3
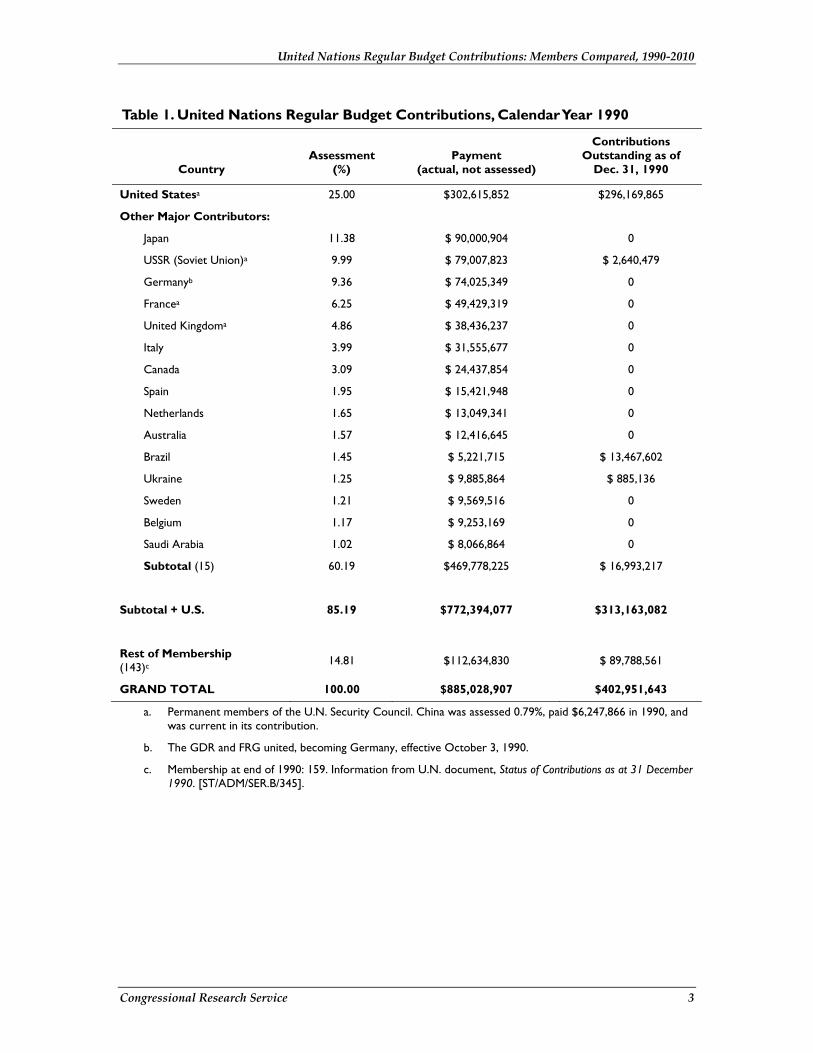
Table 1. United Nations Regular Budget Contributions, Calendar Year 1990
Country Assessment
(%) Payment
(actual, not assessed)
Contributions Outstanding as of
Dec. 31, 1990
United Statesa 25.00 $302,615,852 $296,169,865
Other Major Contributors:
Japan 11.38 $ 90,000,904 0
USSR (Soviet Union)a 9.99 $ 79,007,823 $ 2,640,479
Germanyb 9.36 $ 74,025,349 0
Francea 6.25 $ 49,429,319 0
United Kingdoma 4.86 $ 38,436,237 0
Italy 3.99 $ 31,555,677 0
Canada 3.09 $ 24,437,854 0
Spain 1.95 $ 15,421,948 0
Netherlands 1.65 $ 13,049,341 0
Australia 1.57 $ 12,416,645 0
Brazil 1.45 $ 5,221,715 $ 13,467,602
Ukraine 1.25 $ 9,885,864 $ 885,136
Sweden 1.21 $ 9,569,516 0
Belgium 1.17 $ 9,253,169 0
Saudi Arabia 1.02 $ 8,066,864 0
Subtotal (15) 60.19 $469,778,225 $ 16,993,217
Subtotal + U.S. 85.19 $772,394,077 $313,163,082
Rest of Membership (143)c 14.81 $112,634,830 $ 89,788,561
GRAND TOTAL 100.00 $885,028,907 $402,951,643
a. Permanent members of the U.N. Security Council. China was assessed 0.79%, paid $6,247,866 in 1990, and was current in its contribution.
b. The GDR and FRG united, becoming Germany, effective October 3, 1990.
c. Membership at end of 1990: 159. Information from U.N. document, Status of Contributions as at 31 December 1990. [ST/ADM/SER.B/345].

United Nations Regular Budget Contributions: Members Compared, 1990-2010
Congressional Research Service 4
Table 2. United Nations Regular Budget Contributions, Calendar Year 1991
Country Assessment
(%) Payment
(actual, not assessed)
Contributions Outstanding as of
Dec. 31, 1991
United Statesa 25.00 $301,326,450 $266,407,875
Other Major Contributors:
Japan 11.38 $104,844,802 0
USSR (Soviet Union)a 9.99 $ 48,659,792 $ 46,019,313
Germany 9.36 $ 86,234,389 0
Francea 6.25 $ 57,581,723 0
United Kingdoma 4.86 $ 44,775,548 0
Italy 3.99 $ 36,760,172 0
Canada 3.09 $ 28,514,721 0
Spain 1.95 $ 17,965,497 0
Netherlands 1.65 $ 15,201,575 0
Australia 1.57 $ 14,464,529 0
Brazil 1.45 $ 9,002,601 $ 17,823,960
Ukraine 1.25 $ 6,643,308 $ 5,758,172
Sweden 1.21 $ 11,147,821 0
Belgium 1.17 $ 10,779,298 0
Saudi Arabia 1.02 $ 9,397,337 0
Subtotal (15) 60.19 $501,973,113 $ 69,601,445
Subtotal + U.S. 85.19 $803,299,563 $336,009,320
Rest of Membership (150)b 14.82 $122,983,510 $103,374,625
GRAND TOTAL 100.01 $926,283,073 $439,383,945
a. Permanent members of the U.N. Security Council. China was assessed 0.79%, paid $7,278,329 in 1991, and was current in its contribution.
b. Membership at end of 1991: 166. Information from U.N. Document, Status of Contributions as at 31 December 1991. [ST/ADM/SER.B/362]

United Nations Regular Budget Contributions: Members Compared, 1990-2010
Congressional Research Service 5
Table 3. United Nations Regular Budget Contributions, Calendar Year 1992
Country Assessment
(%) Payment
(actual, not assessed)
Contributions Outstanding as of
Dec. 31, 1992
United Statesa 25.00 $325,495,230 $239,531,646
Other Major Contributors:
Japan 12.45 $122,609,322 0
Russian Fed.a 9.41 $ 28,580,000 $110,110,295
Germany 8.93 $ 87,943,875 0
Francea 6.00 $ 59,088,830 0
United Kingdoma 5.02 $ 49,437,654 0
Italy 4.29 $ 42,248,513 0
Canada 3.11 $ 30,662,414 0
Spain 1.98 $ 19,499,313 0
Brazil 1.59 $ 4,465,801 $ 29,016,698
Australia 1.51 $ 14,870,688 0
Netherlands 1.50 $ 14,772,207 0
Ukraine 1.18 $ 70,000 $ 17,308,974
Sweden 1.11 $ 10,931,433 0
Belgium 1.06 $ 10,439,026 0
Subtotal (14) 59.14 $495,619,076 $156,435,967
Subtotal + U.S. 84.14 $821,114,306 $395,967,613
Rest of Membership (161)b 15.88 $155,133,570 $104,640,052
GRAND TOTAL 100.02 $976,247,876 $500,607,665
a. Permanent members of the U.N. Security Council. China was assessed 0.77%, paid $7,583,066 in 1992, and was current in its contribution.
b. Membership at end of 1992: 164. Three new members—Estonia, Latvia, and Lithuania—were assessed the following year for 1992 and thus not included in this listing. Information is from United Nations document, Status of Contributions as at 31 December 1992. [ST/ADM/SER.B/395].

United Nations Regular Budget Contributions: Members Compared, 1990-2010
Congressional Research Service 6
Table 4. United Nations Regular Budget Contributions, Calendar Year 1993
Country Assessment (%) Payment
(actual, not assessed)
Contributions Outstanding as of
Dec. 31, 1993
United Statesa 25.00 $289,062,441 $260,392,163
Other Major Contributors:
Japan 12.45 $127,053,643 0
Germany 8.93 $ 91,131,650 0
Russian Fed.a 6.71 $121,006,035 $ 43,459,468
Francea 6.00 $ 61,230,672 0
United Kingdoma 5.02 $ 51,229,662 0
Italy 4.29 $ 43,779,930 0
Canada 3.11 $ 31,743,607 0
Spain 1.98 $ 20,206,121 0
Ukraine 1.87 $ 7,090,299 $ 29,302,234
Brazil 1.59 $ 32,833,789 $ 12,409,037
Australia 1.51 $ 15,409,719 0
Netherlands 1.50 $ 15,307,668 0
Sweden 1.11 $ 11,327,675 0
Belgium 1.06 $ 10,817,419 0
Subtotal (14) 57.13 $640,167,889 $ 85,170,739
Subtotal + U.S. 82.13 $929,230,330 $345,562,902
Rest of Membership (169)b 17.35 $147,777,694 $132,440,466
GRAND TOTAL 99.48b $1,077,008,024 $478,003,368
a. Permanent members of the U.N. Security Council. China was assessed 0.77%, paid $7,857,936 in 1993, and was current in its contribution.
b. Membership at end of 1993: 184. Information is from United Nations document, Status of Contributions as at 31 December 1993. [ST/ADM/SER.B/424]. Assessment total fell, on December 31, from 100.03% to 99.48%, due to dissolution of the Czech and Slovak Federal Republic, effective December 31, 1993.

United Nations Regular Budget Contributions: Members Compared, 1990-2010
Congressional Research Service 7
Table 5. United Nations Regular Budget Contributions, Calendar Year 1994
Country Assessment
(%) Payment
(actual, not assessed)
Contributions Outstanding as of
Dec. 31, 1994
United Statesa 25.00 $310,800,851 $247,851,724
Other Major Contributors:
Japan 12.45 $126,652,158 0
Germany 8.93 $ 90,843,676 0
Russian Fed.a 6.71 $111,259,468 $ 459,918
Francea 6.00 $ 61,037,185 0
United Kingdoma 5.02 $ 51,067,778 0
Italy 4.29 $ 43,641,587 0
Canada 3.11 $ 31,637,608 0
Spain 1.98 $ 20,142,271 0
Ukraine 1.87 $ 6,920,000 $ 41,405,490
Brazil 1.59 $ 12,409,037 $ 16,174,854
Australia 1.51 $ 15,361,025 0
Netherlands 1.50 $ 15,259,297 0
Sweden 1.11 $ 11,291,880 0
Belgium 1.06 $ 10,783,237 0
Subtotal (14) 57.13 $608,306,207 $ 58,040,262
Subtotal + U.S. 82.13 $919,107,058 $305,891,986
Rest of Membership (170)b 17.93 $150,827,011 $174,063,001
GRAND TOTAL 100.06 $1,069,934,069 $479,954,987
a. Permanent members of the U.N. Security Council. China was assessed 0.77%, paid $7,833,106 in 1994, and was current in its contribution.
b. Membership at end of 1994: 185. Information is from United Nations document, Status of Contributions as at 31 December 1994. [ST/ADM/SER.B/458].

United Nations Regular Budget Contributions: Members Compared, 1990-2010
Congressional Research Service 8
Table 6. United Nations Regular Budget Contributions, Calendar Year 1995
Country Assessment
(%) Payment
(actual, not assessed)
Contributions Outstanding as of
Dec. 31, 1995
United Statesa 25.00 $150,130,049 $414,423,874
Other Major Contributors:
Japan 13.95 $152,442,506 0
Germany 8.94 $ 97,694,337 0
Francea 6.32 $ 69,063,558 0
Russian Fed.a 5.68 $ 62,529,698 0
United Kingdoma 5.27 $ 57,589,390 0
Italy 4.79 $ 52,344,057 0
Canada 3.07 $ 33,548,279 0
Spain 2.24 $ 24,478,223 0
Brazil 1.62 $ 33,877,855 0
Netherlands 1.58 $ 17,265,889 0
Ukraine 1.48 $ 16,480,300 $ 41,098,302
Australia 1.46 $ 15,954,555 0
Sweden 1.22 $ 13,331,889 0
Belgium 0.99 $ 10,818,500 0
Subtotal (14) 58.61 $657,419,036 $ 41,098,302
Subtotal + U.S. 83.61 $807,549,085 $455,522,176
Rest of Membership (170)b 16.39 $244,807,611 $108,515,395
GRAND TOTAL 100.00 $1,052,356,696 $564,037,571
a. Permanent members of the U.N. Security Council. China was assessed 0.72%, paid $7,868,000 in 1995, and was current in its contribution.
b. Membership at end of 1995: 185. Information is from United Nations document, Status of Contributions as at 31 December 1995. [ST/ADM/SER.B/484].

United Nations Regular Budget Contributions: Members Compared, 1990-2010
Congressional Research Service 9
Table 7. United Nations Regular Budget Contributions, Calendar Year 1996
Country Assessment
(%) Payment
(actual, not assessed)
Contributions Outstanding as of
Dec. 31, 1996
United Statesa 25.00 $359,040,601 $376,775,346
Other Major Contributors:
Japan 15.4350 $167,886,832 0
Germany 9.0425 $ 98,355,470 0
Francea 6.4075 $ 69,694,517 0
United Kingdoma 5.3150 $ 57,811,371 0
Italy 5.1975 $ 56,533,321 0
Russian Fed.a 4.4500 $ 48,402,747 0
Canada 3.1025 $ 33,745,960 0
Spain 2.3625 $ 25,696,964 0
Brazil 1.6200 $ 11,620,775 $ 6,000,000
Netherlands 1.5875 $ 17,267,272 0
Australia 1.4800 $ 16,097,993 0
Sweden 1.2275 $ 13,351,545 0
Ukraine 1.1400 $ 19,730,000 $ 33,768,107
Belgium 1.0075 $ 10,958,599 0
Subtotal (14) 59.3750 $496,153,366 $ 39,768,107
Subtotal + U.S. 84.3750 $855,193,967 $416,543,453
Rest of Membership (170)b 15.6350 $335,413,332 $ 94,177,098
GRAND TOTAL 100.01 $1,190,607,299 $510,720,551
a. Permanent members of the U.N. Security Council. China was assessed 0.7350%, paid $7,994,611 in 1996, and was current in its contribution.
b. Membership at end of 1996: 185. Information is from United Nations document, Status of Contributions as at 31 December 1996. [ST/ADM/SER.B/505].

United Nations Regular Budget Contributions: Members Compared, 1990-2010
Congressional Research Service 10
Table 8. United Nations Regular Budget Contributions, Calendar Year 1997
Country Assessment
(%) Payment
(actual, not assessed)
Contributions Outstanding as of
Dec. 31, 1997
United Statesa 25.00 $315,585,677 $373,239,953
Other Major Contributors:
Japan 15.65 $166,684,838 0
Germany 9.06 $ 96,496,142 0
Francea 6.42 $ 68,378,061 0
United Kingdoma 5.32 $ 56,662,194 0
Italy 5.25 $ 55,916,639 0
Russian Federationa 4.27 $ 45,478,867 0
Canada 3.11 $ 33,123,952 0
Spain 2.38 $ 25,348,876 0
Brazil 1.62 $ 6,550,336 $ 16,703,941
Netherlands 1.59 $ 16,934,753 0
Australia 1.48 $ 15,763,167 0
Sweden 1.23 $ 13,100,469 0
Ukraine 1.09 $ 27,715,573 $ 17,661,894
Belgium 1.01 $ 10,757,297 0
Subtotal (14) 59.48 $638,911,164 $ 34,365,835
Subtotal + U.S. 84.48 $954,496,841 $407,605,788
Rest of Membership (170)b 15.53 $193,602,698 $ 65,985,875
GRAND TOTAL 100.01 $1,148,099,539 $473,591,663
a. Permanent members of the U.N. Security Council. China was assessed 0.74%, paid $7,881,584 in 1997, and was current in its contribution.
b. Membership at end of 1997: 185. Information is from United Nations document, Status of Contributions as at 31 December 1997. [ST/ADM/SER.B/521].

United Nations Regular Budget Contributions: Members Compared, 1990-2010
Congressional Research Service 11
Table 9. United Nations Regular Budget Contributions, Calendar Year 1998
Country Assessment
(%) Payment
(actual, not assessed)
Contributions Outstanding as of
Dec. 31, 1998
United Statesa 25.00 $355,262,548 $315,704,661
Other Major Contributors:
Japan 17.981 $189,093,100 0
Germany 9.630 $101,271,707 0
Francea 6.494 $ 68,292,675 0
Italy 5.394 $ 56,724,775 0
United Kingdoma 5.076 $ 53,380,600 0
Russian Federationa 2.873 $ 30,213,251 0
Canada 2.825 $ 29,708,471 0
Spain 2.571 $ 27,037,337 0
Netherlands 1.619 $ 17,025,845 0
Brazil 1.514 $ 1,906,000 $ 30,719,578
Australia 1.471 $ 15,469,437 0
Sweden 1.099 $ 11,557,384 0
Belgium 1.096 $ 11,525,835 0
Subtotal (13) 59.643 $613,206,417 $ 30,719,578
Subtotal + U.S. 84.643 $968,468,965 $346,424,239
Rest of Membership (171)b
15.357 $174,571,813 $ 70,594,933
GRAND TOTAL 100.000 $1,143,040,778 $417,019,172
a. Permanent members of the U.N. Security Council. China was assessed 0.901%, paid $9,475,161 in 1998, and was current in its contribution.
b. Membership at end of 1998: 185. Information is from United Nations document, Status of Contributions as at 31 December 1998. [ST/ADM/SER.B/536].

United Nations Regular Budget Contributions: Members Compared, 1990-2010
Congressional Research Service 12
Table 10. United Nations Regular Budget Contributions, Calendar Year 1999
Country Assessment
(%) Payment
(actual, not assessed)
Contributions Outstanding as of
Dec. 31, 1999
United Statesa 25.00 $452,203,605 $167,896,611
Other Major Contributors:
Japan 19.984 $207,651,846 0
Germany 9.808 $101,913,996 0
Francea 6.540 $ 67,956,519 0
Italy 5.432 $ 56,443,396 0
United Kingdoma 5.090 $ 52,889,706 0
Canada 2.754 $ 28,616,552 0
Spain 2.589 $ 26,902,053 0
Netherlands 1.631 $ 16,947,566 0
Russian Federationa 1.487 $ 15,451,275 0
Australia 1.482 $ 15,399,321 0
Brazil 1.470 $ 20,768,594 $ 25,225,615
Belgium 1.103 $ 11,461,168 0
Sweden 1.084 $ 11,263,741 0
Argentina 1.024 $ 8,364,497 $ 10,640,287
Subtotal (14) 61.48 $642,030,230 $ 35,865,902
Subtotal + U.S. 86.48 $1,094,233,835 $203,762,513
Rest of Membership (173)b
13.52 $162,284,820 $ 40,471,912
GRAND TOTAL 100.000 $1,256,518,655 $244,234,425
a. Permanent members of the U.N. Security Council. China was assessed 0.973%, paid $10,110,351 in 1999, and was current in its contribution.
b. Membership at end of 1999: 188. Information is from United Nations document, Status of Contributions as at 31 December 1999. [ST/ADM/SER.B/554].
United Nations Regular Budget Contributions: Members Compared, 1990-2010
Congressional Research Service 13
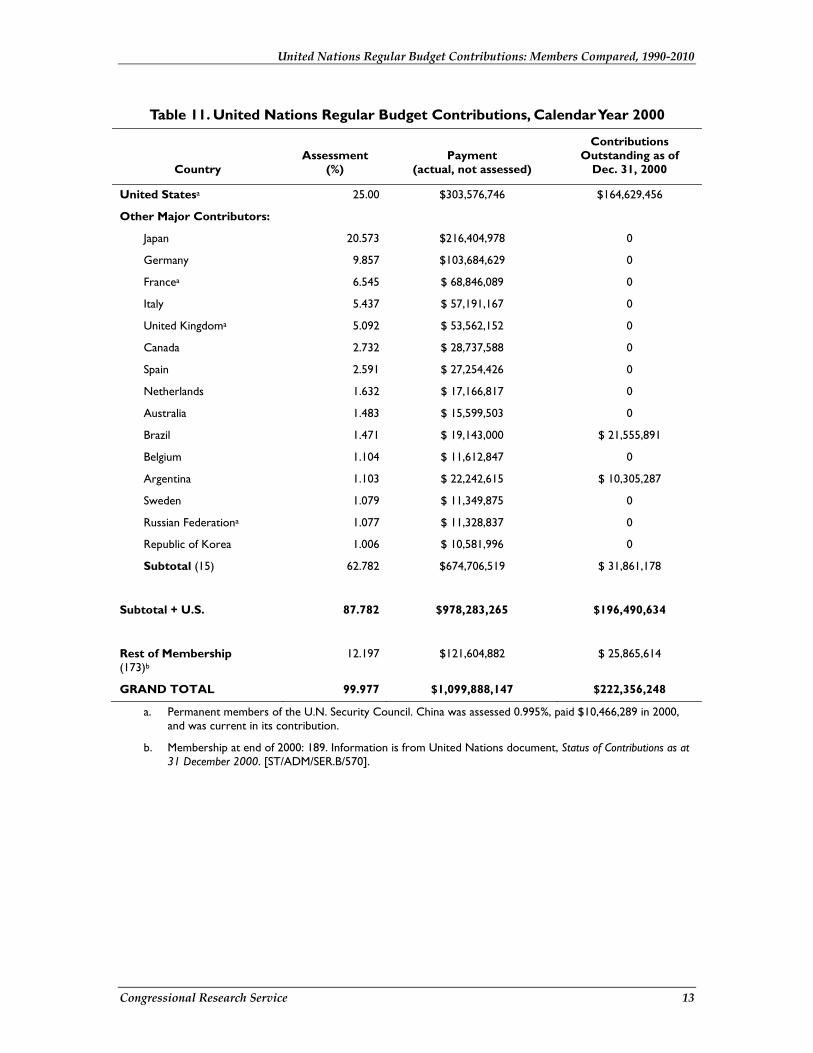
Table 11. United Nations Regular Budget Contributions, Calendar Year 2000
Country Assessment
(%) Payment
(actual, not assessed)
Contributions Outstanding as of
Dec. 31, 2000
United Statesa 25.00 $303,576,746 $164,629,456
Other Major Contributors:
Japan 20.573 $216,404,978 0
Germany 9.857 $103,684,629 0
Francea 6.545 $ 68,846,089 0
Italy 5.437 $ 57,191,167 0
United Kingdoma 5.092 $ 53,562,152 0
Canada 2.732 $ 28,737,588 0
Spain 2.591 $ 27,254,426 0
Netherlands 1.632 $ 17,166,817 0
Australia 1.483 $ 15,599,503 0
Brazil 1.471 $ 19,143,000 $ 21,555,891
Belgium 1.104 $ 11,612,847 0
Argentina 1.103 $ 22,242,615 $ 10,305,287
Sweden 1.079 $ 11,349,875 0
Russian Federationa 1.077 $ 11,328,837 0
Republic of Korea 1.006 $ 10,581,996 0
Subtotal (15) 62.782 $674,706,519 $ 31,861,178
Subtotal + U.S. 87.782 $978,283,265 $196,490,634
Rest of Membership (173)b
12.197 $121,604,882 $ 25,865,614
GRAND TOTAL 99.977 $1,099,888,147 $222,356,248 a. Permanent members of the U.N. Security Council. China was assessed 0.995%, paid $10,466,289 in 2000,
and was current in its contribution.
b. Membership at end of 2000: 189. Information is from United Nations document, Status of Contributions as at 31 December 2000. [ST/ADM/SER.B/570].

United Nations Regular Budget Contributions: Members Compared, 1990-2010
Congressional Research Service 14
Table 12. United Nations Regular Budget Contributions, Calendar Year 2001
Country Assessment
(%) Payment
(actual, not assessed)
Contributions Outstanding as of
Dec. 31, 2001
United Statesa 22.00 $328,206,625 $165,423,794
Other Major Contributors:
Japan 19.629 $203,019,591 0
Germany 9.825 $ 98,179,401 0
Francea 6.503 $ 64,985,093 0
United Kingdoma 5.568 $ 55,641,372 0
Italy 5.094 $ 50,911,592 0
Canada 2.573 $ 26,612,126 0
Spain 2.534 $ 25,326,511 0
Brazil 2.231 $ 18,431,344 $ 20,728,059
Netherlands 1.748 $ 17,460,781 0
Republic of Korea 1.728 $ 13,631,862 0
Australia 1.636 $ 16,589,914 0
Chinaa 1.541 $ 15,328,088 0
Russian Federationa 1.200 $ 12,411,407 0
Argentina 1.156 $ 5,742,730 $ 17,695,835
Belgium 1.136 $ 11,358,507 0
Mexico 1.093 $ 10,859,982 0
Sweden 1.033 $ 10,329,394 0
Subtotal (17) 66.228 $656,819,695 $ 38,423,894
Subtotal + U.S. 88.228 $985,026,320 $203,847,688
Rest of Membership (171)b
11.772 $ 71,493,537 $ 35,700,109
GRAND TOTAL 100.000 $1,056,519,857 $239,547,797
a. Membership at end of 2001: 189. Information is from United Nations document, Status of Contributions as at 31 December 2001. [ST/ADM/SER.B/585].
b. Permanent members of the U.N. Security Council. In 2001, the United States paid an additional 3% ($31,028,518) which was then credited by the United Nations against the assessed contributions of the 91 states whose assessment levels had been increased in response to the U.S. reduction to 22%. The additional U.S. payment was made possible by a gift to the State Department from the [Ted] Turner Foundation.

United Nations Regular Budget Contributions: Members Compared, 1990-2010
Congressional Research Service 15
Table 13. United Nations Regular Budget Contributions, Calendar Year 2002
Country Assessment
(%) Payment
(actual, not assessed)
Contributions Outstanding as of
Dec. 31, 2002
United Statesa 22.00 $258,168,464 $190,331,651
Other Major Contributors:
Japan 19.669 $218,412,768 0
Germany 9.845 $ 109,322,981 0
Francea 6.516 $ 72,356,378 0
United Kingdoma 5.579 $ 61,951,540 0
Italy 5.104 $ 56,676,942 0
Canada 2.579 $ 28,638,290 0
Spain 2.539 $ 28,194,114 0
Brazil 2.093 $ 7,029,601 $ 36,940,002
Republic of Korea 1.866 $ 20,720,841 0
Netherlands 1.751 $ 19,443,834 0
Australia 1.640 $ 18,211,243 0
Chinaa 1.545 $ 17,156,324 0
Russian Federationa 1.200 $ 13,325,300 0
Argentina 1.159 $ 662,311 $ 29,903,543
Belgium 1.138 $ 12,636,826 0
Mexico 1.095 $ 12,159,337 0
Sweden 1.035 $ 11,493,071 0
Subtotal (17) 66.353 $708,391,701 $ 66,843,545
Subtotal + U.S. 88.353 $966,560,165 $257,175,196
Rest of Membership (173)b
11.647 $ 117,497,776 $ 47,607,025
GRAND TOTAL 100.000 $1,084,057,941 $304,782,221
a. Permanent members of the U.N. Security Council.
b. Membership at end of 2002: 191. Information is from United Nations document, Status of Contributions as at 31 December 2002. [ST/ADM/SER.B/600].

United Nations Regular Budget Contributions: Members Compared, 1990-2010
Congressional Research Service 16
Table 14. United Nations Regular Budget Contributions, Calendar Year 2003
Country Assessment
(%) Payment
(actual, not assessed)
Contributions Outstanding as of
Dec. 31, 2003
United Statesa 22.00000 $263,845,890 $267,960,871
Other Major Contributors:
Japan 19.51575 $244,424,847 0
Germany 9.76900 $131,893,753 0
Francea 6.46600 $ 87,299,111 0
United Kingdoma 5.53600 $ 74,742,944 0
Italy 5.06475 $ 68,380,478 0
Canada 2.55800 $ 34,536,208 0
Spain 2.51875 $ 34,006,285 0
Brazil 2.39000 $ 15,336,937 $ 53,871,063
Republic of Korea 1.85100 $ 24,990,822 0
Netherlands 1.73800 $ 23,465,180 0
Australia 1.62700 $ 21,966,540 0
Chinaa 1.53200 $ 20,683,922 0
Switzerland 1.27400 $ 17,200,598 0
Russian Federationa 1.20000 $ 16,201,505 0
Belgium 1.12900 $ 15,242,916 0
Mexico 1.08600 $ 10,402,795 $ 4,259,567
Sweden 1.02675 $ 13,862,413 0
Subtotal (17) 66.28200 $854,637,254 $ 58,130,630
Subtotal + U.S. 88.282 $1,118,483,144 $326,091,501
Rest of Membership (173)b
12.805 $ 153,826,541 $115,655,305
GRAND TOTAL 101.087 $1,272,309,685 $441,746,806
a. Permanent members of the U.N. Security Council.
b. Membership at end of 2003: 191. Information is from United Nations document, Status of Contributions as at 31 December 2003. [ST/ADM/SER.B/619].

United Nations Regular Budget Contributions: Members Compared, 1990-2010
Congressional Research Service 17
Table 15. United Nations Regular Budget Contributions, Calendar Year 2004
Country Assessment
(%) Payment
(actual, not assessed)
Contributions Outstanding as of
Dec. 31, 2004 United Statesa 22.000 $390,293,007 $240,520,860 Other Major Contributors (1% and over):
Japan 19.468 $298,629,134 0 Germany 8.662 $124,389,166 0 United Kingdoma 6.127 $ 87,985,732 0 Francea 6.030 $ 86,592,781 0 Italy 4.885 $ 70,150,205 0 Canada 2.813 $ 40,395,605 0 Spain 2.520 $ 36,188,028 0 Chinaa 2.053 $ 29,481,755 0 Mexico 1.883 $ 31,300,066 0 Republic of Korea 1.796 $ 25,791,150 0 Netherlands 1.690 $ 24,268,955 0 Australia 1.592 $ 22,861,643 0 Brazil 1.523 $ 28,355,676 $ 47,386,167 Switzerland 1.197 $ 17,189,314 0 Russian Federationa 1.100 $ 15,796,362 0 Belgium 1.069 $ 15,351,191 0 Subtotal (16) 64.408 $954,726,763 $ 47,386,167
Middle Contributors (bet. 0.5% and up to 1%):
Swedenb 0.998 $ 14,331,608 0 Argentinab 0.956 $ 38,838,952 $ 15,932,676 Austria 0.859 $ 12,335,522 0 Denmark 0.718 $ 10,310,716 0 Saudi Arabiab 0.713 $ 5,574,400 $ 4,664,515 Norway 0.679 $ 9,750,663 0 Finland 0.533 $ 7,654,056 0 Greece 0.530 $ 7,610,975 0 Subtotal (8) 5.986 $106,406,892 $ 20,597,191
Rest of Membership (166)c 7.606 $ 116,110,780 $ 59,939,319 GRAND TOTAL 100.000 $1,567,537,442 $368,443,537
a. Permanent members of the U.N. Security Council.
b. Indicates that these countries have been in the Major Contributors list: Sweden, between 1989 and 2003; Argentina, between 1999 and 2002; and Saudi Arabia, between 1989 and 1991.
c. Membership at end of 2004: 191. Information is from United Nations document, Status of Contributions as at 31 December 2004. [ST/ADM/SER.B/642].

United Nations Regular Budget Contributions: Members Compared, 1990-2010
Congressional Research Service 18
Table 16. United Nations Regular Budget Contributions, Calendar Year 2005
Country Assessment
(%) Payment
(actual, not assessed)
Contributions Outstanding as of
Dec. 31, 2005 United Statesa 22.00 $428,280,567 $251,851,905 Other Major Contributors (1% and over):
Japan 19.468 $346,434,802 0 Germany 8.662 $154,141,065 0 United Kingdoma 6.127 $109,030,513 0 Francea 6.030 $107,304,389 0 Italy 4.885 $86,929,012 0 Canada 2.813 $50,057,586 0 Spain 2.520 $44,843,626 0 Chinaa 2.053 $36,533,318 0 Mexico 1.883 $33,508,154 0 Republic of Korea 1.796 $31,959,981 0 Netherlands 1.690 $30,073,701 0 Australia 1.592 $28,329,783 0 Brazil 1.523 $42,760,683 $31,727,405 Switzerland 1.197 $21,300,722 0 Russian Federationa 1.100 $19,574,599 0 Belgium 1.069 $19,022,951 0 Subtotal (16) 64.408 $1,161,804,885 $31,727,405
Middle Contributors (bet. 0.5% and up to 1%):
Swedenb 0.998 $17,759,499 0 Argentinab 0.956 $10,741,262 $22,203,520 Austria 0.859 $15,258,982 0 Denmark 0.718 $12,776,875 0 Saudi Arabiab 0.713 $17,352,414 0 Norway 0.679 $12,082,866 0 Finland 0.533 $9,484,783 0 Greece 0.530 $9,431,397 0 Subtotal (8) 5.986 $104,915,078 $22,203,520
Rest of Membership (166)c 7.606 $156,508,189 $38,815,511 GRAND TOTAL 100.000 $1,851,508,719 $344,598,341
a. Permanent members of the U.N. Security Council.
b. Indicates that these countries have been in the Major Contributors list: Sweden, between 1989 and 2003; Argentina, between 1999 and 2002; and Saudi Arabia, between 1989 and 1991.
c. Membership at end of 2005: 191. Information is from United Nations document, Status of Contributions as at 31 December 2005. [ST/ADM/SER.B/673].

United Nations Regular Budget Contributions: Members Compared, 1990-2010
Congressional Research Service 19
Table 17. United Nations Regular Budget Contributions, Calendar Year 2006
Country Assessment
(%) Payment
(actual, not assessed)
Contributions Outstanding as of
Dec. 31, 2006 United Statesa 22.00 $383,908,137 $291,408,623 Other Major Contributors (1% and over):
Japan 19.468 $332,240,528 0 Germany 8.662 $147,825,532 0 United Kingdoma 6.127 $104,563,268 0 Francea 6.030 $102,907,868 0 Italy 4.885 $83,367,319 0 Canada 2.813 $48,006,605 0 Spain 2.520 $43,006,274 0 Chinaa 2.053 $35,036,460 0 Mexico 1.883 $32,135,243 0 Republic of Korea 1.796 $30,650,503 0 Netherlands 1.690 $28,841,508 0 Australia 1.592 $27,169,043 0 Brazil 1.523 $35,149,385 $22,569,510 Switzerland 1.197 $20,427,980 0 Russian Federationa 1.100 $18,772,580 0 Belgium 1.069 $18,243,534 0 Subtotal (16) 64.408 $1,108,343,630 $22,569,510
Middle Contributors (bet. 0.5% and up to1%):
Swedenb 0.998 $17,031,850 0 Argentinab 0.956 $10,079,285 $24,439,313 Austria 0.859 $14,659,678 0 Denmark 0.718 $12,253,375 0 Saudi Arabiab 0.713 $12,168,045 0 Norway 0.679 $11,587,801 0 Finland 0.533 $9,096,168 0 Greece 0.530 $9,044,971 0 Subtotal (8) 5.986 $95,921,173 $24,439,313
Rest of Membership (167)c 7.606 $138,610,705 $34,299,995 GRAND TOTAL 100.000 $1,726,783,645 $372,717,441
a. Permanent members of the U.N. Security Council.
b. Indicates that these countries have been in the Major Contributors list: Sweden, between 1989 and 2003; Argentina, between 1999 and 2002; and Saudi Arabia, between 1989 and 1991.
c. Membership at end of 2006: 192. Information is from U.N. document, Status of Contributions as at 31 December 2006. [ST/ADM/SER.B/708].

United Nations Regular Budget Contributions: Members Compared, 1990-2010
Congressional Research Service 20
Table 18. United Nations Regular Budget Contributions, Calendar Year 2007
Country Assessment
(%) Payment
(actual, not assessed)
Contributions Outstanding as of
Dec. 31, 2007 United Statesa 22.00 $391,901,857 $392,673,605 Other Major Contributors (1% and over):
Japan 16.624 $332,605,470 0 Germany 8.577 $171,604,735 0 United Kingdoma 6.642 $132,890,130 0 Francea 6.301 $126,067,557 0 Italy 5.079 $101,618,334 0 Canada 2.977 $59,562,469 0 Spain 2.968 $59,382,401 0 Chinaa 2.667 $53,360,129 0 Mexico 2.257 $45,157,034 0 Republic of Korea 2.173 $43,476,401 0 Netherlands 1.873 $37,474,136 0 Australia 1.787 $35,753,487 0 Switzerland 1.216 $24,329,177 0 Russian Federationa 1.200 $24,009,056 0 Belgium 1.102 $22,048,317 0 Sweden 1.071 $21,428,083 0 Subtotal (16) 64.514 $1,290,766,916 0
Middle Contributors (bet. 0.5% and up to 1%):
Austria 0.887 $17,746,694 0 Brazilb 0.876 $40,096,122 0 Norway 0.782 $15,645,902 0 Saudi Arabiab 0.748 $14,965,645 0 Denmark 0.739 $14,785,577 0 Greece 0.596 $11,924,498 0 Finland 0.564 $11,284,256 0 Portugal 0.527 $10,543,977 0 Poland 0.501 $10,023,781 0 Subtotal (9) 6.22 $147,016,452 0
Rest of Membership (166)c 7.270 $157,142,989 $47,043,588 GRAND TOTAL 100.000 $1,986,828,214 $439,717,163
a. Permanent members of the U.N. Security Council.
b. Indicates that these countries have been in the Major Contributors list: Brazil, between 1989 and 2006, and Saudi Arabia, between 1989 and 1991. Argentina was on the list between 1999 and 2002.
c. Membership at end of 2007: 192. Information is from U.N. document, Status of Contributions as at 31 December 2007. [ST/ADM/SER.B/727].

United Nations Regular Budget Contributions: Members Compared, 1990-2010
Congressional Research Service 21
Table 19. United Nations Regular Budget Contributions, Calendar Year 2008
Country Assessment
(%) Payment
(actual, not assessed)
Contributions Outstanding as of
Dec. 31, 2008 United Statesa 22.00 $451,527,359 $394,484,638 Other Major Contributors (1% and over):
Japan 16.624 $304,055,694 0 Germany 8.577 $156,874,741 0 United Kingdoma 6.642 $121,483,273 0 Francea 6.301 $115,246,326 0 Italy 5.079 $92,895,745 0 Canada 2.977 $54,449,820 0 Spain 2.968 $54,285,208 0 Chinaa 2.667 $48,779,869 0 Mexico 2.257 $41,280,901 0 Republic of Korea 2.173 $39,744,527 0 Netherlands 1.873 $34,257,478 0 Australia 1.787 $32,684,524 0 Switzerland 1.216 $22,240,840 0 Russian Federationa 1.200 $21,948,198 0 Belgium 1.102 $20,155,761 0 Sweden 1.071 $19,588,766 0 Subtotal (16) 64.514 $1,179,971,671 0
Middle Contributors (between 0.5% and up to 1%):
Austria 0.887 $16,223,376 0 Brazilb 0.876 $16,022,188 0 Norway 0.782 $14,302,908 0 Saudi Arabiab 0.748 $13,681,043 0 Denmark 0.739 $13,516,432 0 Greece 0.596 $10,900,938 0 Finland 0.564 $10,315,653 0 Portugal 0.527 $9,638,916 0 Poland 0.501 $9,163,373 0 Subtotal (9) 6.22 $113,764,827 0
Rest of Membership (166)c 7.270 $146,000,935 $22,704,553 GRAND TOTAL 100.000 $1,891,264,792 $417,189,191
a. Permanent members of the U.N. Security Council.
b. Indicates that these countries have been in the Major Contributors list: Brazil, between 1989 and 2006, and Saudi Arabia, between 1989 and 1991. Argentina was on the list between 1999 and 2002.
c. Membership at end of 2008: 192. Information is from U.N. document, Status of Contributions as at 31 December 2008. [ST/ADM/SER.B/761]
United Nations Regular Budget Contributions: Members Compared, 1990-2010
Congressional Research Service 22
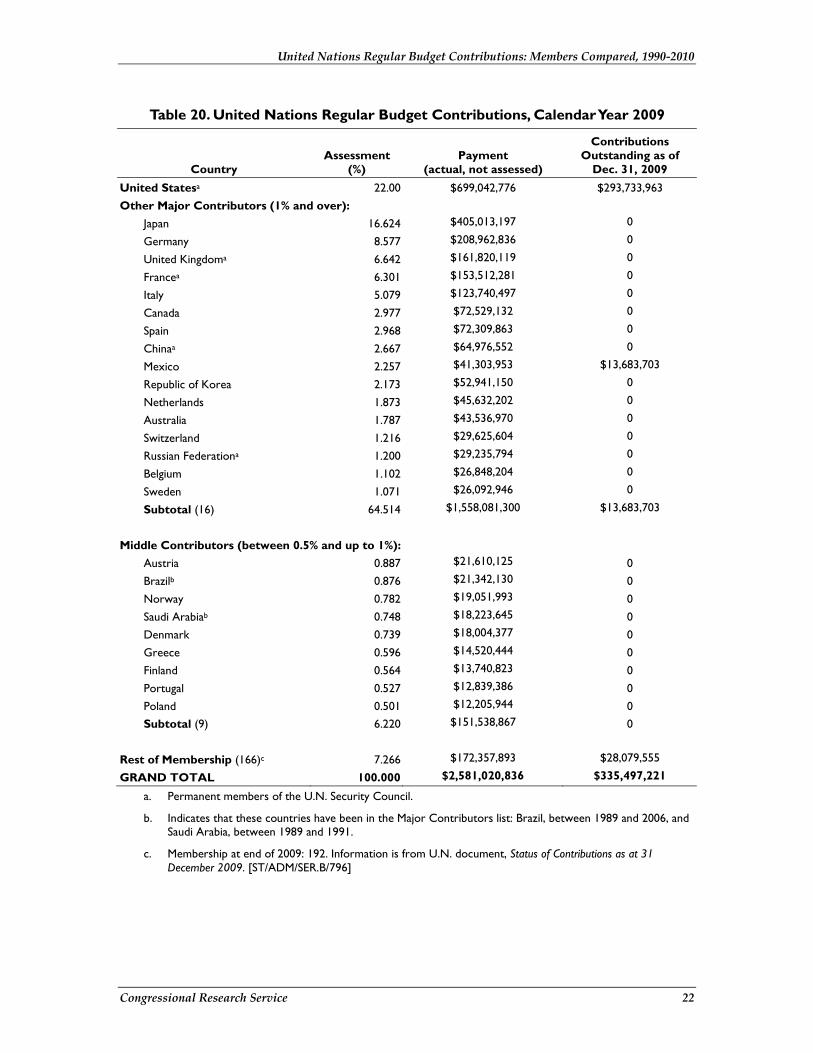
Table 20. United Nations Regular Budget Contributions, Calendar Year 2009
Country Assessment
(%) Payment
(actual, not assessed)
Contributions Outstanding as of
Dec. 31, 2009 United Statesa 22.00 $699,042,776 $293,733,963 Other Major Contributors (1% and over):
Japan 16.624 $405,013,197 0
Germany 8.577 $208,962,836 0
United Kingdoma 6.642 $161,820,119 0
Francea 6.301 $153,512,281 0
Italy 5.079 $123,740,497 0
Canada 2.977 $72,529,132 0
Spain 2.968 $72,309,863 0
Chinaa 2.667 $64,976,552 0
Mexico 2.257 $41,303,953 $13,683,703
Republic of Korea 2.173 $52,941,150 0
Netherlands 1.873 $45,632,202 0
Australia 1.787 $43,536,970 0
Switzerland 1.216 $29,625,604 0
Russian Federationa 1.200 $29,235,794 0
Belgium 1.102 $26,848,204 0
Sweden 1.071 $26,092,946 0
Subtotal (16) 64.514 $1,558,081,300 $13,683,703
Middle Contributors (between 0.5% and up to 1%):
Austria 0.887 $21,610,125 0 Brazilb 0.876 $21,342,130 0 Norway 0.782 $19,051,993 0 Saudi Arabiab 0.748 $18,223,645 0 Denmark 0.739 $18,004,377 0 Greece 0.596 $14,520,444 0 Finland 0.564 $13,740,823 0 Portugal 0.527 $12,839,386 0 Poland 0.501 $12,205,944 0 Subtotal (9) 6.220 $151,538,867 0
Rest of Membership (166)c 7.266 $172,357,893 $28,079,555
GRAND TOTAL 100.000 $2,581,020,836 $335,497,221
a. Permanent members of the U.N. Security Council.
b. Indicates that these countries have been in the Major Contributors list: Brazil, between 1989 and 2006, and Saudi Arabia, between 1989 and 1991.
c. Membership at end of 2009: 192. Information is from U.N. document, Status of Contributions as at 31 December 2009. [ST/ADM/SER.B/796]

United Nations Regular Budget Contributions: Members Compared, 1990-2010
Congressional Research Service 23
Table 21. United Nations Regular Budget Contributions, Calendar Year 2010
Country Assessment
(%) Payment
(actual, not assessed)
Contributions Outstanding as of
Dec. 31, 2010 United Statesa 22.00 $532,453,102 $278,414,368 Other Major Contributors (1% and over):
Japan 12.530 $264,959,467 0
Germany 8.018 $169,548,684 0
United Kingdoma 6.604 $139,648,230 0
Francea 6.123 $129,477,001 0
Italy 4.999 $105,708,890 0
Canada 3.207 $67,815,245 0
Chinaa 3.189 $67,434,617 0
Spain 3.177 $67,180,865 0
Mexico 2.359 $13,981,825 $49,521,870
Republic of Korea 2.260 $47,789,976 0
Australia 1.933 $40,875,231 0
Netherlands 1.855 $39,225,843 0
Brazil 1.611 $34,066,217 0
Russian Federationa 1.602 $33,875,903 0
Switzerland 1.130 $23,894,987 0
Belgium 1.075 $22,731,958 0
Sweden 1.064 $22,499,352 0
Subtotal (17) 62.736 $1,290,714,291 $49,521,870
Middle Contributors (between 0.5% and up to 1%):
Norway .871 $18,418,172 0
Austria .851 $17,995,252 0
Saudi Arabiab .803 $17,551,186 0
Poland .828 $17,508,894 0
Denmark .736 $15,563,461 0
Greece .691 $14,611,890 0
Turkey .617 $13,047,086 0
Finland .566 $11,968,640 0
India .534 $11,291,968 0
Portugal .511 $10,805,610 0
Subtotal (10) 8.256 $148,762,159 $0
Rest of Membership (165)c 7.270 $146,000,935 $22,704,553
GRAND TOTAL 100.000 $1,891,264,792 $417,189,191
a. Permanent members of the U.N. Security Council.
b. Indicates that a country has been on the Major Contributors list. Saudi Arabia was a major contributor between 1989 and 1991.
c. Membership at end of 2010: 192. Information is from U.N. document, Status of Contributions as at 31 December 2010. [ST/ADM/SER.B/828]

United Nations Regular Budget Contributions: Members Compared, 1990-2010
Congressional Research Service 24
Author Contact Information Marjorie Ann Browne Specialist in International Relations [email protected], 7-7695
Luisa Blanchfield Specialist in International Relations [email protected], 7-0856


![CONTRIBUTIONS FOR INTERNATIONAL … United Nations peacekeeping mission unless,] at least 15 days in advance of voting for ... contributions for International Peacekeeping Activities](https://img.dokumen.tips/doc/110x75/5b1d2ba97f8b9ac6348b576c/contributions-for-international-united-nations-peacekeeping-mission-unless-at.jpg)