Embed Size (px)
Citation preview

Review of the Transport and Logistics System of the
Republic of Belarus
UNITED NATIONS ECONOMIC COMMISSION FOR EUROPE
UNITED NATIONS

E C O N O M I C C O M M I S S I O N F O R E U R O P E
1
E C O N O M I C C O M M I S S I O N F O R E U R O P E
ECE/TRANS/233
UNITED NATIONS
REVIEW OF THE TRANSPORT AND LOGISTICS SYSTEM OF THE REPUBLIC OF BELARUS
New York and Geneva, 2013

Review of the t ranspor t and logis t ics sys tem of the Republ ic of Belarus
2
ECE/TRANS/233
NOTESymbols of United Nations documents are composed of capital letters combined with figures.
Mention of such a symbol indicates a reference to a United Nations document.
The designations employed and the presentation of the material in this publication do not imply the expression of any opinion whatsoever on the part of the secretariat of the United Nations concerning the legal aspects, status of any country, territory, city or area, or of its authorities, nor do they concern the delimitation of their frontiers or boundaries. The maps and country reports are only for information purposes. Related data was sent by the countries concerned and the respective content is their complete responsibility. In the few cases that countries did not provide data, the secretariat provided data from available sources. The UN Group of Experts on Geographical Names (UNGEGN) under the Department of Economic and Social Affairs (DESA) in the United Nations Secretariat (http://unstats.un.org/unsd/geoinfo/UNGEGN/default.html) deals with names on the basis of Member State driven initiatives.
Acknowledgements: Special thanks to the Government of Belarus, in particular, Ministry of Foreign Affairs, Ministry of Economy, Ministry of Trade, Ministry of Transport and Communications as well as the experts of the School of Business and Management of Technology of the Belarus State University in Minsk for their excellent cooperation with the Economic Commission for Europe in carrying out this project in a timely and efficient manner. This exemplary case of demand driven and focused project is a testimony to the capacity of ECE to respond to its Governments’ demand.

E C O N O M I C C O M M I S S I O N F O R E U R O P E
3
United Nations Economic Commission for EuropeThe United Nations Economic Commission for Europe (UNECE) is one of the five United
Nations regional commissions administered by the Economic and Social Council (ECOSOC).
It was established in 1947 with the mandate to help rebuild post‐war Europe, develop economic activity and strengthen economic relations among European countries, and between
Europe and the rest of the world. During the Cold War, UNECE served as a unique forum for economic dialogue and cooperation between East and West. Despite the complexity of this period, significant achievements were made, with consensus reached on numerous harmonization and standardization agreements.
In the post-Cold War era, UNECE acquired not only many new Member States, but also new functions. Since the early 1990s the organization has focused on analyses of the transition process, using its harmonization experience to facilitate the integration of Central and Eastern European countries into the global markets.
UNECE is the forum where the countries of Western, Central and Eastern Europe, Central Asia and North America, 56 countries in all, come together to forge the tools of their economic cooperation. That cooperation concerns economics, statistics, environment, transport, trade, sustainable energy, timber and habitat. The Commission offers a regional framework for the elaboration and harmonization of conventions, norms and standards. The Commission’s experts provide technical assistance to the countries of South‐East Europe and the Commonwealth of Independent States. This assistance takes the form of advisory services, training seminars and workshops where countries can share their experiences and best practices.
Review of the t ranspor t and logis t ics sys tem of the Republ ic of Belarus
4
UNECE TRANSPORTThe UNECE Transport Division facilitates the international movement of persons and
goods by inland transport modes. It aims to improve competitiveness, safety, energy efficiency and security in the transport sector. At the same time it focuses on reducing the adverse effects of transport activities on the environment and contributing effectively to sustainable development. It is the
• Centre for multilateral transport standards and agreements in Europe and beyond, e.g. regulations for dangerous goods transport and road vehicle construction at the global level
• Gateway for technical assistance and exchange of best practices• Promoter of multi‐country investment planning• Substantive partner for transport and trade facilitation initiatives• Historic centre for transport statistics.
For more than six decades, the UNECE Inland Transport Committee (ITC) has provided a platform for intergovernmental cooperation to facilitate and develop international transport while improving its safety and environmental performance. The main results of this persevering and critical work are reflected in more than 50 international agreements and conventions which provide an international legal framework and technical regulations for the development of international road, rail, inland water and intermodal transport, as well as dangerous goods transport and vehicle construction. Considering the perspectives of the transport services providers and their regulators, UNECE offers a balanced approach to and treatment of facilitation and security issues alike.

E C O N O M I C C O M M I S S I O N F O R E U R O P E
5
Table of contents
LIST OF FIGURES ................................................................................................ 7LIST OF TABLES .................................................................................................. 10ANNEXES.......................................................................................................... 11LIST OF ACRONYMS .......................................................................................... 13EXECUTIVE SUMMARY ........................................................................................ 141. Evaluation of the results of economic integration of the Republic
of Belarus with foreign countries .................................................. 161.1 Results of the economic integration with the Russian Federation and the
Eurasian Economic Community (EurAsEC) ..................................................... 161.2 Expansion of trade with the European Union ................................................. 181.3 Influence of the economic integration of Belarus with foreign countries on the
growing demand for freight transport ........................................................... 212. Review of the current situation of international road freight
carriers in the Republic of Belarus ................................................. 232.1 Characteristics of the vehicle fleet ................................................................ 232.2 Main results of the activities of international road carriers ............................... 282.3 Geography of activity of international road carriers ....................................... 332.4 Characteristics of the main cost items in international road transport ................ 333. Review of the transport infrastructure and logistic systems of the
Republic of Belarus ....................................................................... 353.1 Roads in the Republic of Belarus and their conditions ..................................... 353.2 Conditions of rail transport infrastructure in the Republic of Belarus .................. 393.3 Trans-European transport corridors, major transit routes on the territory of the
Republic of Belarus and prospects for their development ................................. 413.4 Railway Corridors ...................................................................................... 533.5 OSJD transport routes ................................................................................. 553.6 Assessment of the effectiveness of infrastructure development roads and railways .................................................................................... 593.7 Inland water transport ................................................................................ 603.8 Analysis of ancillary logistics services .......................................................... 614. Economic evaluation of main ports used for import and export
from Belarus ................................................................................ 634.1 Problems, connected with the landlockedness of Belarus ................................. 634.2 Efficiency analysis of the main ports that are used for Belarusian export and
import ...................................................................................................... 645. Review of conditions of logistics system
of the Republic of Belarus ............................................................. 695.1 Characteristics of the logistic centres of Belarus and their location ................... 695.2 Proposals for optimization of logistic centres in Belarus .................................. 766. Review of the legislation in the field of international
road haulage ............................................................................... 796.1 Review of the competitiveness in the transport sector in Belarus ....................... 796.2 Analysis of the current legal framework in international freight transport ........... 826.3 Proposals for the harmonization of the legal framework in international freight
transport ................................................................................................... 84
Review of the t ranspor t and logis t ics sys tem of the Republ ic of Belarus
6
7. Analysis of transit traffic in the Republic of Belarus and the neighbouring countries ................................................................. 87
7.1 Transit traffic in Ukraine .............................................................................. 877.1.1 General description ................................................................................... 877.1.2 Road transport .......................................................................................... 897.1.3 Railway transport ....................................................................................... 907.1.4 Maritime and inland navigation transport ..................................................... 927.2 Transit traffic in Latvia ................................................................................. 967.2.1 General description ................................................................................... 967.2.2 Railway transport ....................................................................................... 977.2.3 Road transport and motorways .................................................................... 987.2.4 Sea ports .................................................................................................. 997.3 Transit traffic in Lithuania ............................................................................ 1017.3.1 General description ................................................................................... 1017.3.2 Road transport .......................................................................................... 1027.3.3 Railway transport ....................................................................................... 1027.3.4 Maritime and inland navigation transport ..................................................... 1047.4 Transit traffic in Belarus............................................................................... 1087.4.1 Railway transport ....................................................................................... 1087.4.2 Road transport .......................................................................................... 1118. Proposals for development of transport and logistics systems in
the Republic of Belarus ................................................................. 1159. Conclusions .................................................................................. 11910. Literature ..................................................................................... 125ANNEXES .............................................................................................. 126Annex 1 ............................................................................................................ 126Annex 2 ............................................................................................................ 128Annex 3 ............................................................................................................ 129Annex 4 ............................................................................................................ 129Annex 5 ............................................................................................................ 133Annex 6 ............................................................................................................ 135Annex 7 ............................................................................................................ 136

E C O N O M I C C O M M I S S I O N F O R E U R O P E
7
List of Figures
1 Export, import and foreign trade of the Republic of Belarus with the countries of EurAsEC ............................................................................................... 15
2 Growth rate of the foreign trade turnover of the Republic of Belarus with the EurAsEC, CIS countries and the Russian Federation compared with 2008 ......... 15
3 Structure of merchandise exports from the Republic of Belarus to the countries of the Eurasian Economic Community (in 2012) ............................................ 16
4 Structure of imports from the countries of the Eurasian Economic Community to the Republic of Belarus (2012) .................................................................... 16
5 Export, import and foreign trade turnover of the Republic of Belarus with the EU ............................................................................................... 17
6 Structure of export from the Republic of Belarus to the EU countries (2012) ....... 197 Import of goods to the Republic of Belarus from the EU countries (2012) .......... 198 No title ..................................................................................................... 209 Dynamics of freight by modes of transport in the Republic of Belarus ................ 2110 Dynamics of the number of motor vehicles registered and actually used
for international road transportation of goods under the TIR procedure ........... 2311 Structure of the vehicle fleet by the form of organization of business
entities (2012) ........................................................................................... 2312 The structure of the vehicle fleet by region (2012) .......................................... 2413 Age structure of the vehicle fleet (2012) ....................................................... 2414 Vehicle fleet by region and by operation life (2012) ...................................... 2515 Structure of the vehicle fleet by emission standards (2012) .............................. 2516 Structure of the vehicle fleet by the type of ownership (2012) .......................... 2617 Structure of road tractors by the car brands (for the year 2012) ...................... 2618 Structure of semitrailers by brands (2012)..................................................... 2619 Structure of trailers by brand (2012) ............................................................ 2720 Structure of the trucks by brand (2012) ........................................................ 2721 Dynamics of the purchase of new vehicles .................................................... 2722 Dynamics of the purchase of new semitrailers and trailers ............................... 2823 Change of age structure of the vehicle fleet ................................................... 2824 Volume of international transport of goods by road, in tons ............................. 2825 Dynamics of the international transport of goods by road in comparison with
the total volume of international transport by all modes of transport ................. 2926 Dynamics of the international transport of goods by road in comparison with
the total volume of transport of goods by road .............................................. 2927 Structure of the international transport by all modes in the Republic of Belarus ... 3028 Export of transport services of the Republic of Belarus (million US$) ................. 3029 Dynamics of export of transportation services in the Republic of Belarus
(per cent) .................................................................................................. 3030 Structure of transportation services in export from the Republic of Belarus ......... 3131 Imports of transport services in the Republic of Belarus (million US$) ................ 3132 Dynamics of import of transport services in the Republic of Belarus (per cent) .... 3233 Structure of imports of transport services in the Republic of Belarus .................. 3234 The balance of trade in transport services of the Republic of Belarus
(million US$) ............................................................................................. 3235 Cost structure for international road transport of goods ................................... 3536 Road map of the Republic of Belarus ............................................................ 37

Review of the t ranspor t and logis t ics sys tem of the Republ ic of Belarus
8
37 International Transport Corridor “TRACECA” ................................................. 4238 Volume of cargo transport by all modes along the TRACECA corridor
(million tonnes) .......................................................................................... 4440 Cargo transit transportations via Belarus ....................................................... 4541 Scheme of transport routes EurAsEC ............................................................. 4642 Share of Belarus, Russia, Kazakhstan and Ukraine in total length of routes
passing through their territories .................................................................... 4743 Projects on road routes of Pan-European Transport Corridor II “East - West” ...... 4844 Pan-European Transport Corridor route IX “North - South” Source: Federal
State Unitary Enterprise “NTSKTP” ............................................................... 4945 Projects on road route EurAsEC number 2 .................................................... 5046 Projects on road route EurAsEC number 3 .................................................... 5147 Projects on road route EurAsEC N°4 ........................................................... 5248 Trans-Asian railway transport corridor «North – South» ................................. 5349 Scheme of OSJD transport corridor number 1 ............................................... 5650 Scheme of OSJD transport corridor number 9 ................................................ 5751 Share of the length of railway routes of Russia, Belarus, Kazakhstan
and Ukraine .............................................................................................. 5952 The structure of Belarusian export flows (2012) ............................................. 6653 Structure of export flow of cargo-generating item ........................................... 6854 Change in the volume of cargo in the transport market ................................... 7955 Change in turnover in the transport market ................................................... 8056 Dynamics of changes in the average monthly volume of road and rail freight
transport ................................................................................................... 8057 Dynamics of changes in the average monthly volume of road and rail freight
turnover .................................................................................................... 8158 Structure of the market of transport services (2012) ........................................ 8159 Total transit volume through Ukraine (2012) .................................................. 8860 Total transit volume through Ukraine by country of origin (2012) ..................... 8861 Total transit volume through Ukraine according to main goods groups (2012) ... 8862 Total volume of transit through Ukraine by road transport according to main
goods groups (2012) ................................................................................. 8963 Total volume of road transit through Ukraine by main countries of origin
(2012) ..................................................................................................... 8964 Railway freight traffic volume in Ukraine ....................................................... 9065 Share of transit freight traffic in the total railway transport in Ukraine, per cent .. 9066 Total volume of railway transit through Ukraine by country of origin (2012) ...... 9167 Total transit through Ukraine by maritime transport (main groups of s goods in
2012) ...................................................................................................... 9268 Total volume of sea transit through Ukraine by country of origin (2012) ............ 9369 Cargo processing volume handled in Ukrainian sea ports by country of origin
(2012) ..................................................................................................... 9370 Volume of cargo handled in Ukrainian sea ports by type of cargo (2012) ........ 9471 Volume of cargo handled in Ukrainian river ports by destination (2012) ........... 9572 Volume of cargo in transit handled in Ukrainian river ports according to type
of cargo (2012) ........................................................................................ 9673 Transport map of Latvia .............................................................................. 9774 Map of motorways, category E roads .......................................................... 98

E C O N O M I C C O M M I S S I O N F O R E U R O P E
9
75 Direction of international transport by rail in Lithuania by country of origin/destination (2012) ........................................................................... 103
76 Distribution of total volume of transit transport by rail through Lithuania ............ 10377 Cargo handled in Klaipeda seaport and Butinge terminal ............................... 10578 Volume of transit and Lithuanian goods handled in Klaipeda port .................... 10679 Transit cargo handled in Klaipeda port by origin/destination/ ........................ 10780 Volume of processed containers in the ports of the Eastern coast
of the Baltic Sea ........................................................................................ 10781 Volume of transit traffic through Belarus by rail .............................................. 10882 Transit traffic of Belarusian Railways (2009) .................................................. 10883 Transit of cargo through Belarusian Railway (2012) ....................................... 10984 Number of containers carried by Belarusian Railway ..................................... 11085 Number of transit trips by road made by foreign trucks through the territory of
the Republic of Belarus ............................................................................... 11186 Transit transport by foreign trucks through the territory of the Republic of
Belarus by country of carriers’ registration. (2012) ........................................ 11287 Volume of road freight transit through Belarus ............................................... 11288 Transit transport of goods by road through the territory of the Republic of
Belarus and through the territory of neighboring countries .............................. 113
Review of the t ranspor t and logis t ics sys tem of the Republ ic of Belarus
10
List of Tables
Table 1 Freight turnover by mode of transport (million tkm.) ................................. 21Table 2 Length of roads of the Republic of Belarus by regions .............................. 37Table 3.1 Structure of the categories of public roads by regions .............................. 38Table 3.2 Characteristics of the road infrastructure of the Republic of Belarus ..........
(January, 2012) .................................................................................. 38Table 3.3 Characteristics of railway transport of the Republic of Belarus
(January, 2012) .................................................................................. 40Table 6 Length of the routes on the territory of the Customs Union and Ukraine ...... 58Table 7 Key indicators of the water transport ..................................................... 61Table 8 The Network of petrol stations in the Republic of Belarus .......................... 61Table 9 Location of petrol stations in the Republic of Belarus ................................ 62Table 10 Construction of filling stations in the Republic of Belarus
(period 2013 - 2015) .......................................................................... 63Table 11 Number of objects for roadside ancillary services located on public roads . 63Table 12 Volume of foreign trade of Republic of Belarus (UD$ million) .................... 66Table 13 Exports of major products .................................................................... 67Table 14 Calculation of the index Ief, km ............................................................. 69Table 16 Locations for establishment of the logistic centers, by regions .................... 71Table 15 The Characteristics of the logistics centers of the Republic of Belarus ......... 73Table 17 Total volume of transit traffic by different modes through Ukraine
(000 tonnes) ....................................................................................... 87Table 19 Volume of cargo processed in Latvian ports (thousand tons) ...................... 99Table 18 Volume of transport and freight turnover by road transport in Latvia .......... 100Table 20 Sea transportation in Lithuania, thousand tons ........................................ 104Table 21 Cargo handled in Klaipeda seaport and Butinge terminal in 2012
(by type) ............................................................................................ 105

E C O N O M I C C O M M I S S I O N F O R E U R O P E
11
Annexes
Annex 1
Table 1.1 Export, import and foreign trade turnover of the Republic of Belarus with . the countries of the Eurasian Economic Community ($US, million) .............. 126
Table 1.2 Export, import and foreign trade turnover of the Republic of Belarus with . the Russian Federation ($US, million) ..................................................... 126
Table 1.3 Export, import and foreign trade turnover of the Republic of Belarus with . the CIS countries ($US, million) ............................................................. 126
Table 1.4 Volume of export of the Republic of Belarus to the CIS countries and the countries of the Eurasian Economic Community ($US, million) .............. 126
Table 1.5 Volume of import of goods into the Republic of Belarus from the CIS countries and the EurAsEC ($US, million) ................................................ 127
Annex 2
Table 2.1 Export, import and foreign trade turnover of the Republic of Belarus with . the European Union ($US, million) ......................................................... 128
Table 2.2 Export, import and foreign trade turnover of the Republic of Belarus with . the European Union ($US, million) ......................................................... 128
Table 2.3 Imports from the EU countries to the Republic of Belarus ($US, million) ...................................................................................... 128
Annex 3
Table 3.1 Throughput of the Republic of Belarus by mode of transport (million tkm) 129
Annex 4
Table 4.1 Number of motor vehicles registered and actually used for international ... road transportation of goods under the TIR ............................................. 129
Table 4.2 Structure of the vehicle fleet by the form of organization of business entities ............................................................................................... 130
Table 4.3 Structure of the vehicle fleet by region .................................................... 130Table 4.4 The age structure of the vehicle fleet....................................................... 130Table 4.5 Vehicle fleet by region and by operation life ........................................... 131Table 4.6 Vehicle fleet by emission standards ........................................................ 131Table 4.7 Structure of the vehicle fleet by ownership of vehicles ............................... 131Table 4.8 Changing age structure of the vehicle fleet ............................................. 132
Annex 5
Table 5.1 Cargo transportation by modes of transport, thousands of tons ................. 133Table 5.2 Export of transport services of the Republic of Belarus, million $US ............ 133Table 5.3 Imports of transport services in the Republic of Belarus, million dollars ....... 134Table 5.4 The balance of trade in transport services of the Republic of Belarus,
million dollars ..................................................................................... 134
Annex 6
MAPS OF MAIN BELARUSIAN EXPORTS TO PORTS ............................................... 135
Annex 7
SCHEME OF LOCATION OF LOGISTIC CENTERS IN BELARUS ................................ 136

Review of the t ranspor t and logis t ics sys tem of the Republ ic of Belarus
12
E C O N O M I C C O M M I S S I O N F O R E U R O P E
13
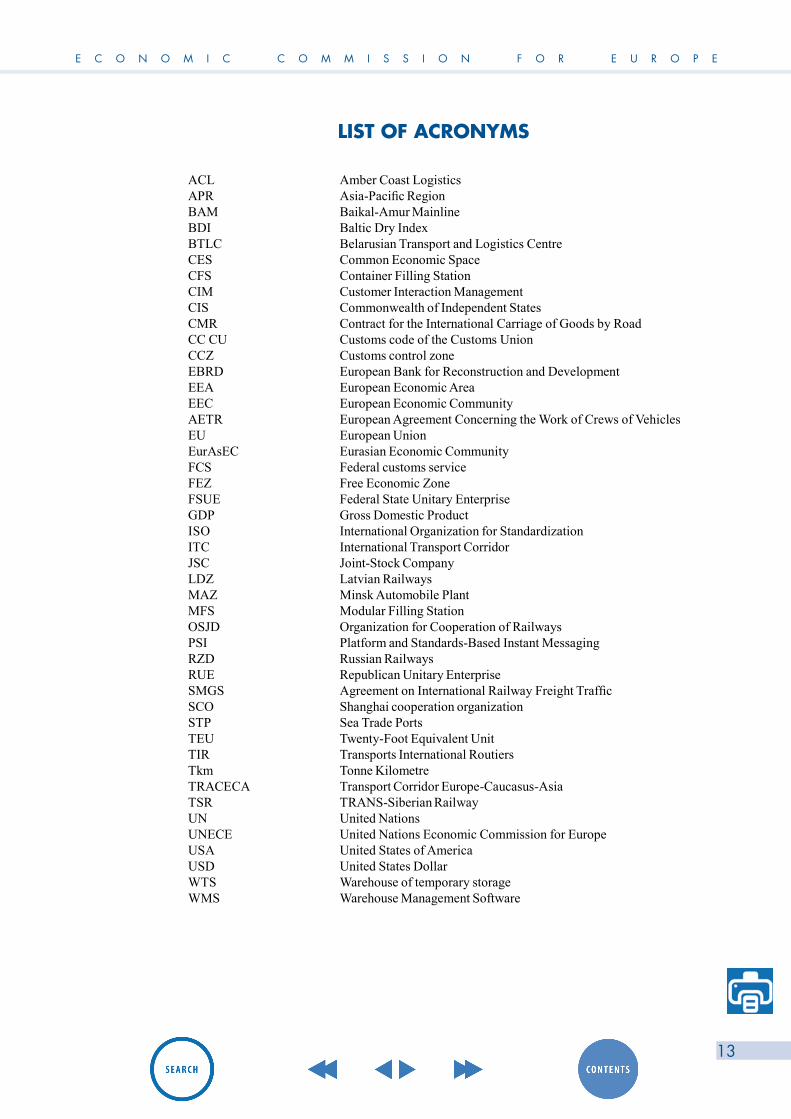
LIST OF ACRONYMS
ACL Amber Coast Logistics APR Asia-PacificRegion BAM Baikal-Amur Mainline BDI Baltic Dry Index BTLC Belarusian Transport and Logistics Centre CES Common Economic Space CFS Container Filling Station CIM Customer Interaction Management CIS Commonwealth of Independent States CMR Contract for the International Carriage of Goods by Road CC CU Customs code of the Customs Union CCZ Customs control zone EBRD European Bank for Reconstruction and Development EEA European Economic Area EEC European Economic Community AETR European Agreement Concerning the Work of Crews of Vehicles EU European Union EurAsEC Eurasian Economic Community FCS Federal customs service FEZ Free Economic Zone FSUE Federal State Unitary Enterprise GDP Gross Domestic Product ISO International Organization for Standardization ITC International Transport Corridor JSC Joint-Stock Company LDZ Latvian Railways МАZ MinskAutomobilePlant MFS Modular Filling Station OSJD Organization for Cooperation of Railways PSI Platform and Standards-Based Instant Messaging RZD Russian Railways RUE Republican Unitary Enterprise SMGS AgreementonInternationalRailwayFreightTraffic SCO Shanghai cooperation organization STP Sea Trade Ports TEU Twenty-Foot Equivalent Unit TIR Transports International Routiers Tkm Tonne Kilometre TRACECA Transport Corridor Europe-Caucasus-Asia TSR TRANS-Siberian Railway UN United Nations UNECE United Nations Economic Commission for Europe USA United States of America USD United States Dollar WTS Warehouse of temporary storage WMS Warehouse Management Software
Review of the t ranspor t and logis t ics sys tem of the Republ ic of Belarus
14
EXECUTIVE SUMMARYThe current state of development of the world economy is characterized by sharp competition
for spheres of influence in major commodity markets. Economic globalization leads to a rapid growth of trade flows between Europe and Asia. The growing economies of China, Japan as well as developed European countries are consuming more and more raw materials and resources. In the meantime, they produce modern high-tech mechanical engineering products for which developing economies of China, Russia, Kazakhstan, Belarus, Ukraine and other former Soviet Republics have huge needs. We can observe rapid growth of foreign trade between the above mentioned countries, and hence the growth of trade flows. At the same time, the dynamic development of integration processes taking place within the Customs Union of Belarus, Russia and Kazakhstan, are increasing the possibilities of the Republic of Belarus to develop logistics and freight transit in the European and Asian direction.
The location of the Republic of Belarus in the center of the European continent allows it to become a connecting link between Europe and Asia and to provide smooth cargo flows via major transport corridors that pass through its territory. This is well understood in the country and the conditions for the transit of goods through its territory are constantly improving. The Government carries out permanent systemic work on increasing transit freight flows through Belarus, promoting the growth of commodity exchange between the EU and Asian countries.
The abolition of transport and other agreed controls on domestic inter-state borders of the Customs Union member countries since 2011 has increased the appeal of transit through Belarus. This in its turn increased the speed of vehicles in transit. The result of implementing this measure is that the number of transit trips of trucks that belong to foreign carriers has increased by more than 21 percent.
The concept of the development of a transport space adopted by the Eurasian Economic Community provides the conditions for creating supply chains and logistics terminals in the territory from Almaty to Brest. The strategy of the creation and development of the EurAsEC logistics centers is based on the provisions of the Agreement among the EurAsEC member states on the formation of the EurAsEC Transport Union and the Concept of the common EurAsEC transport space. The strategy covers the period until 2020. It aims to unite the practical efforts of community members for the joint implementation of the EurAsEC objectives in transport sector.
An effective scheme of logistics centers and logistic services need to be developed according to the requirements of modern business, so that the logistics sector in Belarus works in an efficient way. It is also essential to establish cooperation with key players in the logistics market of Western countries as well as with partners in the Common Economic Space and Ukraine. Moreover, it is quite important to master new multimodal freight schemes and develop the appropriate infrastructure for all participants in the logistic system. Only an overall solution of these questions will guarantee a stable and efficient operation of the country’s logistics sector.
In 2007, the World Bank ranked Belarus at 74th place out of 142 countries. Again, in 2012, Belarus was ranked at 91st place out of 155 countries. In general, the level of logistics development in Belarus is lower than in Latvia, Lithuania, Kazakhstan, but is slightly higher than in Russia, which ranks at 95th place. The leadership of the country is determined to implement policies that would allow Belarus to rise to between 50th and 60th place in the ranking.
In order to address objectives of the project, research in this study covered:• Evaluation of the results of the economic integration of the Republic of Belarus with the
Russian Federation and the Euro-Asian community;

E C O N O M I C C O M M I S S I O N F O R E U R O P E
15
• Analysis of the current state of international road freight carriers of Belarus and its transport infrastructure;
• Evaluation of the main ports that are used for Belarus exports and imports;• Evaluation of the status of the logistics system of the Republic of Belarus;• Analysis of the legal framework in the field of international road haulage;• Determination of transit cargo traffic in the Republic of Belarus and neighboring countries
Based on findings and results of this analysis, some recommendations will be provided regarding further development of the logistics sector in Belarus and its integration into the European logistics system.

Review of the t ranspor t and logis t ics sys tem of the Republ ic of Belarus
16
1. Evaluation of the results of economic integration of the Republic of Belarus with foreign countries
1.1 Results of the economic integration with the Russian Federation and the Eurasian Economic Community (EurAsEC)
Evaluation of the economic integration of Belarus with foreign countries is considered from the point of view of the expansion of mutual trade. Dynamics of foreign trade turnover of the Republic of Belarus with the EurAsEC is presented in Figures 1 and 2. (Annex 1, tables 1.1 – 1.5). After the recession 2008-2009, provoked by the global economic crisis, there has been a constant growth of foreign trade. From 2009 to 2012 the trade turnover between Belarus and the Eurasian Economic Community countries rose from 23.9 US$ billion to 44.8 US$ billion, i.e. by 87.4 per cent. High growth rates are due to the rapid post-crisis recovery of trade volumes to previous levels, and the results of the integration of the Republic of Belarus with the Russian Federation and the countries of the Eurasian Economic Community. The main trade partner of the Republic of Belarus in the EurAsEC is still Russian Federation.
Figure 1: Export, import and foreign trade of the Republic of Belarus with the countries of EurAsEC
60
80
100
120
140
2007 2008 2009 2010 2011 2012 2013
%
0
10
20
30
40
50
2007 2008 2009 2010 2011 2012 2013
Bln.
dol
lars
Export Import Foreign trade turnover
Years
Years EurAsEC CIS Russian Federation
Figure 2: Growth rate of the foreign trade turnover of the Republic of Belarus with the EurAsEC, CIS countries and the Russian Federation compared with 2008
60
80
100
120
140
2007 2008 2009 2010 2011 2012 2013
%
0
10
20
30
40
50
2007 2008 2009 2010 2011 2012 2013
Bln.
dol
lars
Export Import Foreign trade turnover
Years
Years EurAsEC CIS Russian Federation

E C O N O M I C C O M M I S S I O N F O R E U R O P E
17
The structure of exports from the Republic of Belarus to the countries of the Eurasian Economic Community in 2012 (Figure 3) shows that most of its volume is directed towards the Russian Federation - 94.2 per cent, whereas to Kazakhstan - only 4.7 per cent and Tajikistan and Kyrgyzstan - less than 1per cent.
Figure 3: Structure of merchandise exports from the Republic of Belarus to the countries of the Eurasian Economic Community (in 2012)
2
1 Source : Eurasian Economic Commission: http://www.eurasiancommission.org
Major product groups exported by Belarus to the Russian Federation are ground transport (about 20 per cent), dairy and meat products - 16.3 per cent, and machinery and equipment - 16.1 per cent. The structure of exports to the Republic of Kazakhstan is similar: ground transport - 22.3 per cent, machinery and equipment -19.9 per cent, dairy and meat products - 13.5 per cent.
In 2012 compared with 2011, export of goods from the Republic of Belarus to the Republic of Kazakhstan increased by 19.6 per cent, to the Russian Federation by 12.2 per cent. Most significant was the increase in the export of chemical products to Kazakhstan and the Russian Federation (18.1per cent and 18.5 per cent, respectively); machinery, equipment and vehicles to the Republic of Kazakhstan – 36.7 per cent, and food products to the Russian Federation 22 per cent1 .
The overwhelming volume of imports from the EurAsEC countries to the Republic of Belarus in 2012 comes from the Russian Federation (99.5 per cent). Other countries share is less than 1 per cent (Figure 4).
Figure 4: Structure of imports from the countries of the Eurasian Economic Community to the Republic of Belarus (2012)
The major share of imports from the Russian Federation comprise mineral fuels – 61.5 per cent, ferrous metals and their products – 8.4 per cent, and machinery and equipment – 7.6 percent. Ferrous metals and products made of them (36.8 per cent), cereals (12.5 per cent), and ground transport (6.7 per cent) dominate in import of the Republic of Belarus from Kazakhstan. Volume of import from Russia grew by 8.1per cent (including machinery, equipment and vehicles - 27.4 per cent and mineral products - 4.7 per cent). Import to Belarus from Kazakhstan decreased by 13.0 per cent.1 Source : Eurasian Economic Commission: http://www.eurasiancommission.org

Review of the t ranspor t and logis t ics sys tem of the Republ ic of Belarus
18
Establishment of the Common Economic Space of Russia, Belarus and Kazakhstan improved the business climate. In addition, measures undertaken from 2008 to 2013 to facilitate doing business in Belarus have resulted in its ascending from 110th to 58th rank in the World Bank Doing Business Report. Notable improvement is also recorded in all EurAsEC member countries. Thus, integration processes were an important stimulus for the increase of the overall competitiveness.
Creation of the Customs Union and Common Economic Space has received positive reviews from the international financial institutions. Formation of the Customs Union and Common Economic Space and the creation of supranational competencies were identified as first examples of the successful integration of the former Soviet Union in the report of the European Bank of Reconstruction and Development2.
1.2 Expansion of trade with the European UnionDynamics of exports, imports and foreign trade turnover of the Republic of Belarus with the
EU is presented in Figure 5 (Annex 2, tables 2.1, 2.2, and 2.3). From 2010 to 2012 trade turnover between Belarus and the EU grew from US$ 15.1billion to US$ 27.1 billion, or nearly 80.0 per cent. Compared with 2008 (the beginning of the global economic crisis), the growth was somewhat lower (19.4 per cent).
Figure 5: Export, import and foreign trade turnover of the Republic of Belarus with the EU
Structure of exports of goods from the Republic of Belarus to the EU countries is shown in Figure 6.
2 Transition Report 2012-integratipon across borders-EBRD:.ebrd.co do nloads research transition tr 2.pdf]
05
101520
2530
2007 2008 2009 2010 2011 2012 2013
Years
Import Foreign trade turnover
$US
billi
on
Export
Lithuania 6.7% The Netherlands
42.9%
Poland 5.4%
Estonia 2.8%
Other EU countries 5.5%
Latvia 18.6%
Germany 9.9%
Italy 3.8%
The UK 3.2%
Belgium 1.3%

E C O N O M I C C O M M I S S I O N F O R E U R O P E
19
Figure 6: Structure of export from the Republic of Belarus to the EU countries (2012)
The main part of export from the Republic of Belarus to the EU goes to the Netherlands – 42.9 per cent, and Latvia – 18.6 per cent. In 2011, the main export to the Netherlands was oil products (88.9 per cent). Mineral oils and solvents and complex organic diluents were the main export to Latvia (87.3 per cent of the total exports). A major item of export to Germany was crude oil, including gas condensate (70.4 per cent). In general, a wide range of goods were exported from the Republic of Belarus to the EU countries.
Import of goods from the EU countries is shown in Figure 7.
Figure 7: Import of goods to the Republic of Belarus from the EU countries (2012)
05
101520
2530
2007 2008 2009 2010 2011 2012 2013
Years
Import Foreign trade turnover
$US
billi
on
Export
Lithuania 6.7% The Netherlands
42.9%
Poland 5.4%
Estonia 2.8%
Other EU countries 5.5%
Latvia 18.6%
Germany 9.9%
Italy 3.8%
The UK 3.2%
Belgium 1.3%
5
Other EU countries 18.7%
Lithuania 3.9% The Netherlands
4.7%
Belgium 3.6%
The United Kingdom
3.8%
Spain 3.1%
Germany 28.8%
Italy 10.1%
The Czech Republic 4.6%
France 4.6%
Poland 14.2%
Germany accounts for 28.8 per cent, Poland 14.2 per cent, and Italy 10.1 per cent in the total volume of imports from the European Union.
Direction of export to the EU countries is shown in Figure 8.

Review of the t ranspor t and logis t ics sys tem of the Republ ic of Belarus
20
Figure 8
6

E C O N O M I C C O M M I S S I O N F O R E U R O P E
21
1.3 Influence of the economic integration of Belarus with foreign countries on the growing demand for freight transport
The increase in trade volume and turnover leads to an increase in freight volumes transported between the Republic of Belarus and the countries of the Eurasian Economic Community as well as the European Union. The volume of transit through the territory of Belarus is also growing.
According to experts of the Integration Committee of the Eurasian Economic Community, the volume of cargo between the EurAsEC countries will increase to 490 million tonnes by 2020. Despite a projected slowdown in the growth of traffic between the Member States of the customs union, the average annual growth is projected to reach more than 15.0 per cent.
Table 3.1 of the annex 3 presents the transport turnover of the Republic of Belarus by mode of transport. As the table shows, the bulk of turnover (both general and in international traffic) is carried by railway transport.
(72.9 per cent of total turnover) (table 1).
2000 2005 2008 2009 2010 2011
All modes of transport(excluding pipelines) 36 495 53 059 62 925 56 387 62 401 67 728
railway transport 31 425 43 559 48 994 42 742 46 224 49 405
international shipping 23 425 33 339 35 053 28 743 31 667 36 191
transit 12 016 17 339 19 726 16 433 18 499 19 875
road transport 5 026 9 351 13 742 13 512 16 023 18 153
inland water transport 26 90 132 83 110 143
Air transport: 18 59 57 50 44 27
international shipping 18 59 57 50 44 27
Table 1: Freight turnover by mode of transport (million tkm.)
Sources: http://belstat.gov.by; Transport and Communications of the Republic of Belarus. Statistical Compendium (2012)
Dynamics of freight turnover of the Republic of Belarus by the modes of transport, including cargo on international routes, is shown in Figure 9.
Figure 9: Dynamics of freight by modes of transport in the Republic of Belarus
40.0
60.0
80.0
100.0
120.0
140.0
2007 2008 2009 2010 2011 2012
%
Total railway transport International railway transport Total road transport International air transport
Volumes of rail traffic in 2011 have recovered to the levels of 2008 (0.8 per cent for the total cargo turnover, and 3.2 per cent for a turnover of goods in international traffic).
Review of the t ranspor t and logis t ics sys tem of the Republ ic of Belarus
22
Road transport has been rising at the highest rate - volume of road transport increased by 32.1 per cent (compared to 2008). Thus, the increase in the total cargo turnover in the Republic of Belarus, including cargo turnover in international traffic, is mainly due to the growth of road transport.
The growing cargo flows in trade with the countries of the Eurasian Economic Community and the EU, as well as an increase in transit traffic in the east-west direction across the territory of the Republic of Belarus will require modernization and capacity expansion of the transport infrastructure in the near future, especially rail and road links and logistics centres.
According to experts, in 2020 the aggregate amount of transit through the territory of the Member States of the Eurasian Economic Community is expected to increase to 316 million tonnes (the level of transit potential of 85 per cent). This assumes an increase in transit through the territory of third countries in the EEC from 2 million tonnes to 16 million tonnes, which is an eightfold increase.3.
A significant factor in the growth of the economies of the Common Economic Space is their geopolitical location and the continued globalization of world economic relations. The Republic of Belarus and the other EEA countries are situated between two world powerful economic centres - the European Union with a combined GDP of about US$ 17 trillion and South-East Asia, with a combined GDP of almost US$ 13 trillion (in 2011).
Foreign trade between the EU and China reached US$ 567.21 billion, with the prospect of growing to US$ 1 trillion in 2020. However, the real situation is that the world’s cargo flows from Europe to the Asia-Pacific region are practically by-passing the territory of the European Economic Area (EEA). For comparison, in 2011 revenues of foreign sea freight operators bypassing the EEA amounted to 23 billion US$, and the total revenue from transit through EEA is only US$ 0.2 billion.
3 Grits G. Transportation prospects of Belarus in the EEC: http://www.baif.by/stati/transportnye-perspektivy- respubliki-belarus-v-ramkah-ees

E C O N O M I C C O M M I S S I O N F O R E U R O P E
23
2. Review of the current situation of international road freight carriers in the Republic of Belarus
2.1 Characteristics of the vehicle fleetAt the beginning of 2013 the vehicle fleet that was registered for international road
transportation under the TIR system was 11 696 units. However in reality, only 9 138 units were used.
Dynamics of the number of motor vehicles registered and actually used for international road transport of goods under the TIR procedure is presented in Figure 10.
Figure 10: Dynamics of the number of motor vehicles registered and actually used for international road transportation of goods under the TIR procedure
6
7
8
9
10
11
12
13
2005 2006 2007 2008 2009 2010 2011 2012 on
01.09.2013
thousa
nd u
nits
registered actually used
Joint ventures20.4%
Individual entrepreneurs
0.3%
Unitary enterprise29.3%
Ltd. and the ALC36.4%
JSC9.0%
State-owned enterprises
0.2%
Foreign enterprises3.9%
Other (cooperatives,
peasant farms, etc.)0.5%
Structure of the vehicle fleet by the form of organization of business entities for the year 2012 is presented in Figure 11 (Annex 4, table 4.1).
Figure 11: Structure of the vehicle fleet by the form of organization of business entities (2012)
6
7
8
9
10
11
12
13
2005 2006 2007 2008 2009 2010 2011 2012 on
01.09.2013
thousa
nd u
nits
registered actually used
Joint ventures20.4%
Individual entrepreneurs
0.3%
Unitary enterprise29.3%
Ltd. and the ALC36.4%
JSC9.0%
State-owned enterprises
0.2%
Foreign enterprises3.9%
Other (cooperatives,
peasant farms, etc.)0.5%

Review of the t ranspor t and logis t ics sys tem of the Republ ic of Belarus
24
Limited liability companies and additional liability companies are leaders in the number and percentage of vehicles – 4 521 units or 37.4 per cent. They are followed by the unitary enterprises with 3 427 units or 29.3 per cent, and by the joint ventures with 2 381 units or 20.4 per cent.
The structure of the vehicle fleet by region for the year 2012 is presented in Figure 12 (Annex 4, table 4.3).
Figure 12: The structure of the vehicle fleet by region (2012)
Gomel region3.9%
Vitebsk region5.2%
Brest region20.3%
Minsk and Minsk region51.2%
Grodno region15.5%
Mogilev region3.9%
7 years and older27.5%
up to 3 years37.2%
from 3 to 7 years35.3%
Main regions by the number of registered motor vehicles are Minsk and Minsk region with 5 992 units or 51.2 per cent; Brest region with 2 375 units or 20.3 per cent; Grodno region with 1 813 units or 15.5 per cent.
Analysis of the age configuration of the vehicle fleet for the year 2012 shows that the share of new vehicles with an operational life of “up to 3 years” was 37.2 per cent, “from 3 to 7 years” – 35.3 per cent, and “7 years and older” – 27.5 per cent (Figure 13) (Annex 4, table 4.4).
Figure 13: Age structure of the vehicle fleet (2012)
Gomel region3.9%
Vitebsk region5.2%
Brest region20.3%
Minsk and Minsk region51.2%
Grodno region15.5%
Mogilev region3.9%
7 years and older27.5%
up to 3 years37.2%
from 3 to 7 years35.3%
Maximum number of new vehicles with an operational life of ”up to 3 years” is registered in the city of Minsk and Minsk region – 2 353 units, in Brest region – 947 units, and Grodno region – 433 units (Figure 14) (Annex 4, table 4.5).
E C O N O M I C C O M M I S S I O N F O R E U R O P E
25
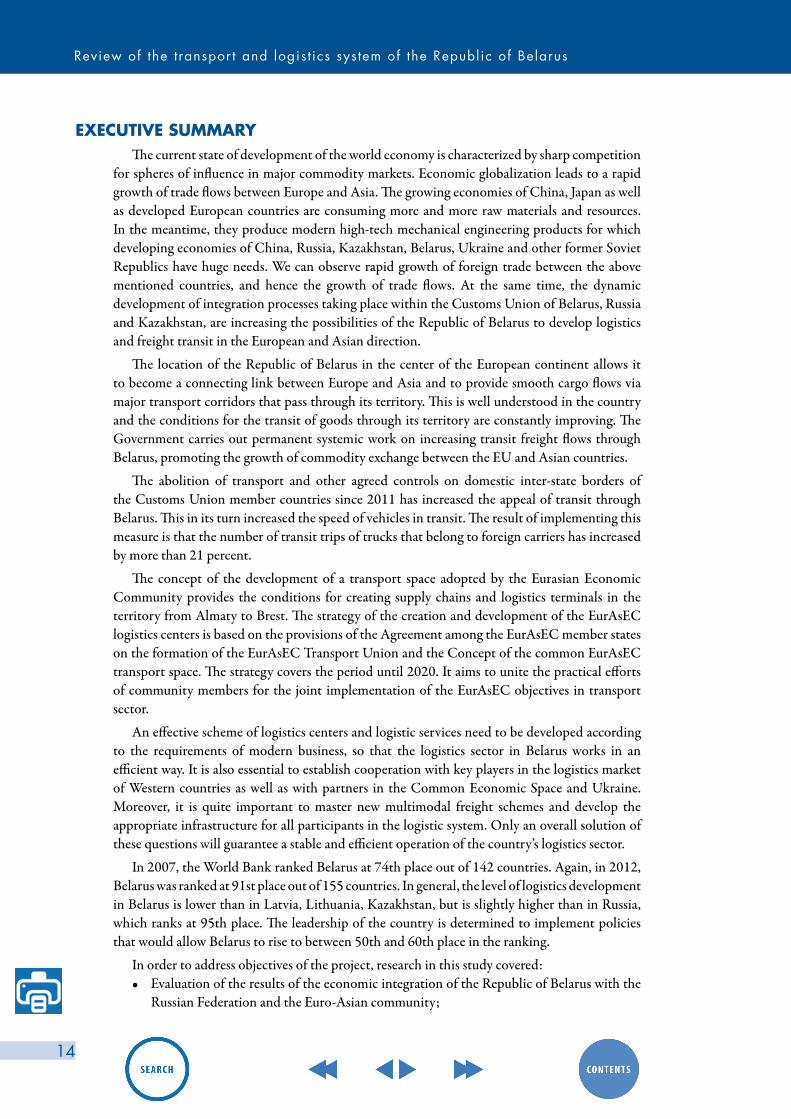
Figure 14: Vehicle fleet by region and by operation life (2012)
0
500
1 000
1 500
2 000
2 500
Minsk andMinsk region
Grodno region Brest region Vitebsk region Gomel region Mogilev region
units
up to 3 years from 3 to 7 years 7 years and older
EURO 45.6%
EURO 546.1%
EURO 318.0%
EURO 23.3%
Other27.1%
The maximum share of new cars is in the Vitebsk region – 43.0 per cent, in Minsk and Minsk region – 39.0 per cent and in the Gomel region – 39.0 per cent.
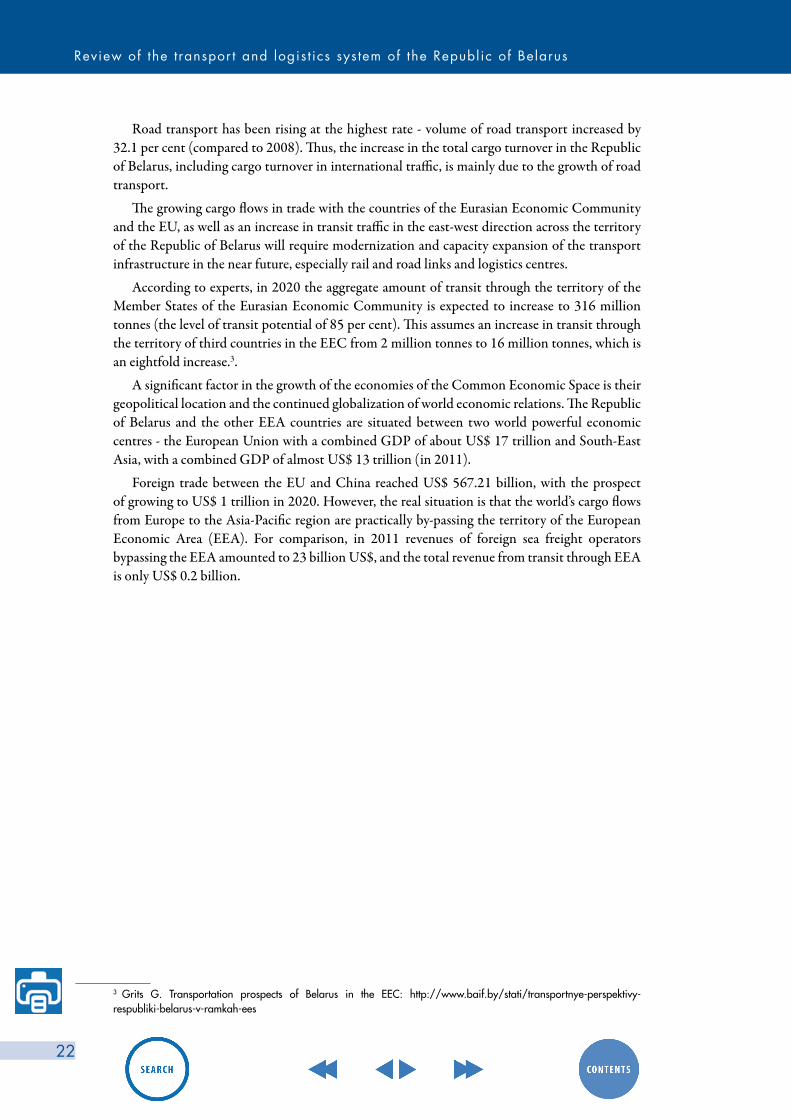
Review of the structure of the vehicle fleet by emission standards for the year 2012 shows that the highest share of vehicles has the most advanced emission standard - Euro-5 (46.1 per cent) (Figure 15) (Annex 4, table 4.6).
Figure 15: Structure of the vehicle fleet by emission standards (2012)
0
500
1 000
1 500
2 000
2 500
Minsk andMinsk region
Grodno region Brest region Vitebsk region Gomel region Mogilev region
units
up to 3 years from 3 to 7 years 7 years and older
EURO 45.6%
EURO 546.1%
EURO 318.0%
EURO 23.3%
Other27.1%
The largest share of vehicles that meet the environmental requirements of Euro-3, Euro-4 and Euro-5 standards is registered in Minsk and Minsk region (40.4 per cent), the smallest is in the Mogilev region (2.6 per cent), and the Gomel region (3.0 per cent) of the total vehicle fleet of the country.
Structure of the vehicle fleet by the type of ownership for the year 2012 shows that the proportion of owned vehicles was 71.5 per cent (8 357 units), and leased vehicles – 28.5 per cent (3 339 units) (Figure 16) (Annex 4, table 4.7).

Review of the t ranspor t and logis t ics sys tem of the Republ ic of Belarus
26
Figure 16: Structure of the vehicle fleet by the type of ownership (2012)
leased vehicles28.5%
own vehicles71.5%
VOLVO17.5%
SCANIA18.4%
IVECO4.8%
MB12.3%
RENAULT7.7%
MAZ6.4%
MAN10.6%
Other0.2%
MAZ-MAN1.7%
DAF20,5%
MAZ 9.9%
ROLFO 0.7%
KOGEL 23.9%
VANHOOL 0.4%
KRONA 13.2%
SCHMITZ 35.6% SCHWARZMÜLLER
3.2%
FRUEHAUF 0.4%
PACTON 0.4%
Other 12.2%
leased vehicles28.5%
own vehicles71.5%
VOLVO17.5%
SCANIA18.4%
IVECO4.8%
MB12.3%
RENAULT7.7%
MAZ6.4%
MAN10.6%
Other0.2%
MAZ-MAN1.7%
DAF20,5%
MAZ 9.9%
ROLFO 0.7%
KOGEL 23.9%
VANHOOL 0.4%
KRONA 13.2%
SCHMITZ 35.6% SCHWARZMÜLLER
3.2%
FRUEHAUF 0.4%
PACTON 0.4%
Other 12.2%
leased vehicles28.5%
own vehicles71.5%
VOLVO17.5%
SCANIA18.4%
IVECO4.8%
MB12.3%
RENAULT7.7%
MAZ6.4%
MAN10.6%
Other0.2%
MAZ-MAN1.7%
DAF20,5%
MAZ 9.9%
ROLFO 0.7%
KOGEL 23.9%
VANHOOL 0.4%
KRONA 13.2%
SCHMITZ 35.6% SCHWARZMÜLLER
3.2%
FRUEHAUF 0.4%
PACTON 0.4%
Other 12.2%
Among the road tractors operating in international freight, 6.5 per cent are domestically produced MAZ and 1.6 per cent MAZ-MAN. Among foreign brands, the most represented are DAF (20.7 per cent), SCANIA 18.3 per cent), and VOLVO (17.5 per cent) (Figure 17).
Figure 17: Structure of road tractors by the car brands (for the year 2012)
The majority of the semitrailers are of foreign make, in particular the semitrailers of SCHMITZ (35.6 per cent) and KOGEL (23.8 per cent). Semitrailers of domestic brand МАZ represent 9.9 per cent of the total number (Figure 18).
Figure 18: Structure of semitrailers by brands (2012)
E C O N O M I C C O M M I S S I O N F O R E U R O P E
27
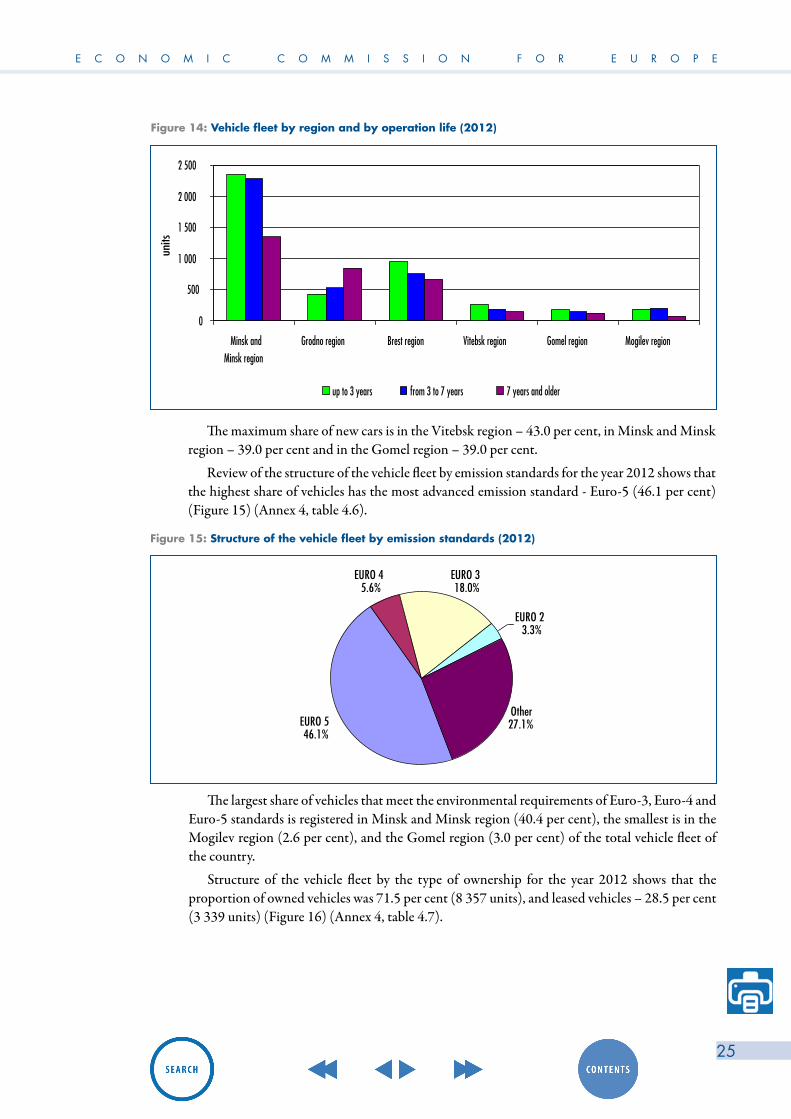
Structure of trailers by brand for the year 2012 is presented in figure 19.
Figure 19: Structure of trailers by brand (2012)
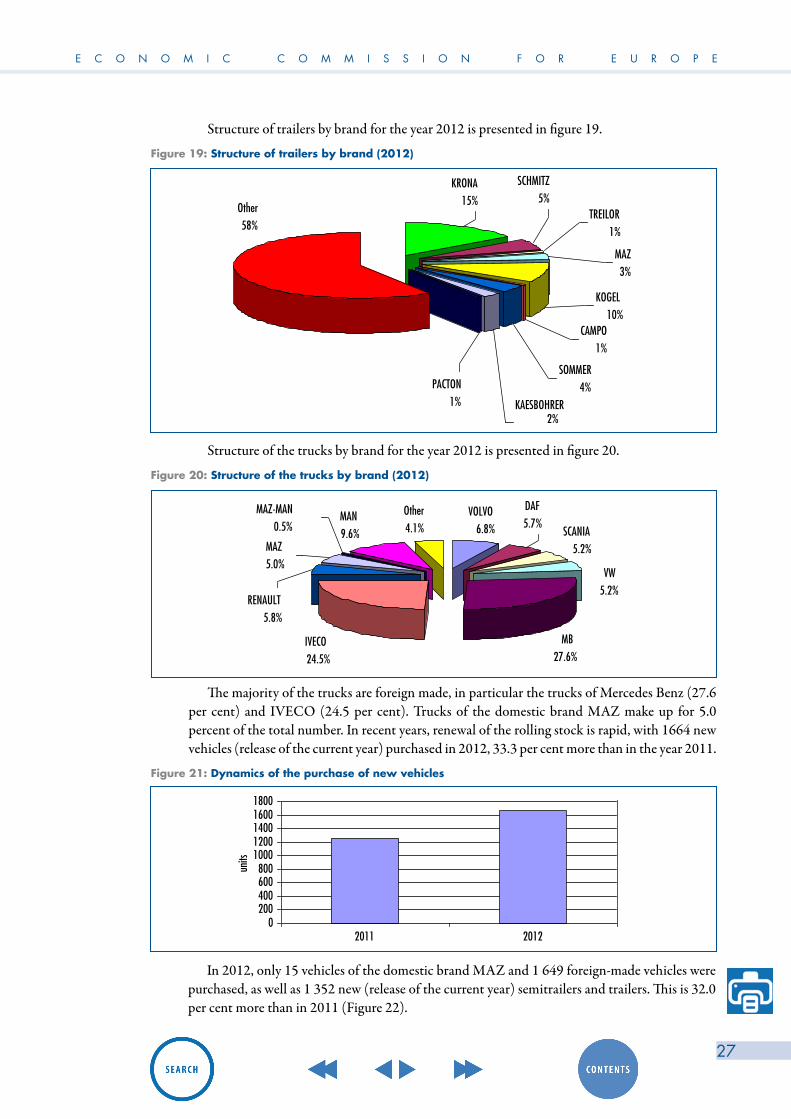
The majority of the trucks are foreign made, in particular the trucks of Mercedes Benz (27.6 per cent) and IVECO (24.5 per cent). Trucks of the domestic brand МАZ make up for 5.0 percent of the total number. In recent years, renewal of the rolling stock is rapid, with 1664 new vehicles (release of the current year) purchased in 2012, 33.3 per cent more than in the year 2011.
Figure 21: Dynamics of the purchase of new vehicles
Structure of the trucks by brand for the year 2012 is presented in figure 20.
Figure 20: Structure of the trucks by brand (2012)
CAMPO1%
SOMMER4%
KAESBOHRER2%
PACTON1%
KOGEL10%
Other58%
MAZ3%
SCHMITZ5%
TREILOR1%
KRONA15%
VOLVO6.8% SCANIA
5.2%
MB27.6%
IVECO24.5%
MAN9.6%
Other4.1%
DAF5.7%
VW5.2%
MAZ5.0%
MAZ-MAN0.5%
RENAULT5.8%
0200400600800
10001200140016001800
2011 2012
units
CAMPO1%
SOMMER4%
KAESBOHRER2%
PACTON1%
KOGEL10%
Other58%
MAZ3%
SCHMITZ5%
TREILOR1%
KRONA15%
VOLVO6.8% SCANIA
5.2%
MB27.6%
IVECO24.5%
MAN9.6%
Other4.1%
DAF5.7%
VW5.2%
MAZ5.0%
MAZ-MAN0.5%
RENAULT5.8%
0200400600800
10001200140016001800
2011 2012
units
CAMPO1%
SOMMER4%
KAESBOHRER2%
PACTON1%
KOGEL10%
Other58%
MAZ3%
SCHMITZ5%
TREILOR1%
KRONA15%
VOLVO6.8% SCANIA
5.2%
MB27.6%
IVECO24.5%
MAN9.6%
Other4.1%
DAF5.7%
VW5.2%
MAZ5.0%
MAZ-MAN0.5%
RENAULT5.8%
0200400600800
10001200140016001800
2011 2012
units
In 2012, only 15 vehicles of the domestic brand MAZ and 1 649 foreign-made vehicles were
purchased, as well as 1 352 new (release of the current year) semitrailers and trailers. This is 32.0 per cent more than in 2011 (Figure 22).

Review of the t ranspor t and logis t ics sys tem of the Republ ic of Belarus
28
Figure 22: Dynamics of the purchase of new semitrailers and trailers
The changing age structure of the vehicle fleet is presented in Figure 23.
Figure 23: Change of age structure of the vehicle fleet
Over the last years there has been a reduction in the share of old vehicles (7 years and older) by the gradual acquisition of new ones. In 2012, the share of vehicles by age structure of the fleet improved and was approximately proportional among the three categories.
2.2 Main results of the activities of international road carriersDynamics of international transport of goods by road in tons is presented in Figures 24-26
(Annex 5, table 5.1).
Figure 24: Volume of international transport of goods by road, in tons
0
200
400
600
800
1000
1200
1400
1600
2011 2012
units
0%
20%
40%
60%
80%
100%
2000 2001 2002 2003 2004 2005 2006 2007 2008 2009 2010 2011 2012
up to 3 years from 3 to 7 years 7 years and older
6000
6500
7000
7500
8000
8500
9000
9500
2009 2010 2011 2012 2013
thou
sand
s of
tons
0
200
400
600
800
1000
1200
1400
1600
2011 2012
units
0%
20%
40%
60%
80%
100%
2000 2001 2002 2003 2004 2005 2006 2007 2008 2009 2010 2011 2012
up to 3 years from 3 to 7 years 7 years and older
6000
6500
7000
7500
8000
8500
9000
9500
2009 2010 2011 2012 2013
thou
sand
s of
tons
0
200
400
600
800
1000
1200
1400
1600
2011 2012
units
0%
20%
40%
60%
80%
100%
2000 2001 2002 2003 2004 2005 2006 2007 2008 2009 2010 2011 2012
up to 3 years from 3 to 7 years 7 years and older
6000
6500
7000
7500
8000
8500
9000
9500
2009 2010 2011 2012 2013
thou
sand
s of
tons

E C O N O M I C C O M M I S S I O N F O R E U R O P E
29
Figure 25: Dynamics of the international transport of goods by road in comparison with the total volume of international transport by all modes of transport
90
100
110
120
130
140
2009 2010 2011 2012 2013
Gro
wth
rat
e,%
road international all modes international
90
100
110
120
130
140
2009 2010 2011 2012 2013
Gro
wth
rat
e,%
road total road international
90
100
110
120
130
140
2009 2010 2011 2012 2013
Gro
wth
rat
e,%
road international all modes international
90
100
110
120
130
140
2009 2010 2011 2012 2013
Gro
wth
rat
e,%
road total road international
Figure 26: Dynamics of the international transport of goods by road in comparison with the total volume of transport of goods by road
The volume of international road transport of goods by Belarusian cargo carriers increased over the past years and in 2012 amounted to 9 159 thousand tonnes. It was 1 558 thousand tons or 20.5 per cent more than in 2011 and 35.4 per cent more than in 2010.
The dynamics of the international transport of goods by road by comparison to the total volume of international traffic by all modes of transport is shown in figure 25. In 2011, the international road transport of goods grew at a faster pace than the total volume of international transport of goods by all modes of transport. In 2012, while the total volume by all modes of transport decreased, the volume of road transport continued to grow.
Dynamics of the international transport of goods by road in comparison with the total volume (international and national) of the transport of goods by road is shown in figure 26. In 2012 compared to 2011 there was a decrease in the total volume of road transport, while the volume of international road transport continued to grow.
The structure of the international traffic by all modes of transport of the Republic of Belarus is shown in Figure 27. The figure shows that the share of transport in tones carried by road transport (3.6 per cent) is low as compared to rail transport (42.4 per cent). In 2010, the share of road transport was 2.8 per cent.

Review of the t ranspor t and logis t ics sys tem of the Republ ic of Belarus
30
Figure 27: Structure of the international transport by all modes in the Republic of Belarus
pipeline54.0%
railway 42.4%
road 3.6% air
0.0%
0500
1000150020002500300035004000
2008 2009 2010 2011 2012 2013
milli
on d
olla
rs
all modes Road transport
0
50
100
150
200
250
2008 2009 2010 2011 2012 2013
Grow
th ra
te, %
all modes Road transport
pipeline54.0%
railway 42.4%
road 3.6% air
0.0%
0500
1000150020002500300035004000
2008 2009 2010 2011 2012 2013
milli
on d
olla
rs
all modes Road transport
0
50
100
150
200
250
2008 2009 2010 2011 2012 2013
Grow
th ra
te, %
all modes Road transport
pipeline54.0%
railway 42.4%
road 3.6% air
0.0%
0500
1000150020002500300035004000
2008 2009 2010 2011 2012 2013
milli
on d
olla
rs
all modes Road transport
0
50
100
150
200
250
2008 2009 2010 2011 2012 2013
Grow
th ra
te, %
all modes Road transport
Analysis of traffic shows that the development of the sector of international road transport is developing rapidly. Although road transport represents a small share of the total international traffic of the Republic of Belarus, this share has significantly increased in recent years. Despite the overall decrease in the volume of international traffic in 2012, the volume of international road transport continued to grow.
Data on export of transport services of the Republic of Belarus is presented in figures 28-29 (Annex 5, table 5.2).
Volume of export of road transport services has grown steadily in recent years and in 2012 it amounted to US$ 1,068.1million. Although the growth rate of exports of services by all modes of transport has slowed, the rate of exports of road transport services of continued to grow and in 2012 in comparison to 2011 it showed increase of 36.8 per cent.
Figure 28: Export of transport services of the Republic of Belarus (million US$)
Figure 29: Dynamics of export of transportation services in the Republic of Belarus (per cent)
E C O N O M I C C O M M I S S I O N F O R E U R O P E
31
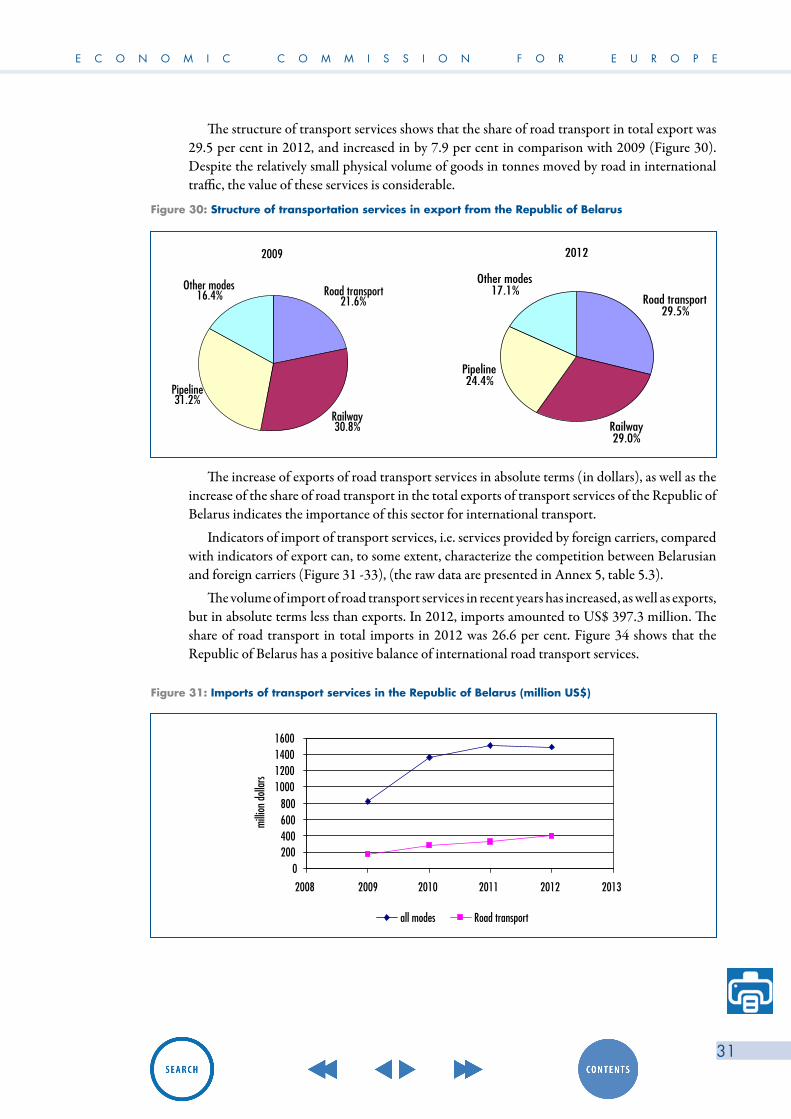
The structure of transport services shows that the share of road transport in total export was 29.5 per cent in 2012, and increased in by 7.9 per cent in comparison with 2009 (Figure 30). Despite the relatively small physical volume of goods in tonnes moved by road in international traffic, the value of these services is considerable.
Figure 30: Structure of transportation services in export from the Republic of Belarus
0 200 400 600 800
1000 1200 1400 1600
2008 2009 2010 2011 2012 2013
all modes Road transport
millio
n do
llars
2009
Road transport21.6%
Railway 30.8%
Other modes16.4%
Pipeline31.2%
2012
Road transport29.5%
Railway 29.0%
Other modes17.1%
Pipeline24.4%
0 200 400 600 800
1000 1200 1400 1600
2008 2009 2010 2011 2012 2013
all modes Road transport
millio
n do
llars
2009
Road transport21.6%
Railway 30.8%
Other modes16.4%
Pipeline31.2%
2012
Road transport29.5%
Railway 29.0%
Other modes17.1%
Pipeline24.4%
The increase of exports of road transport services in absolute terms (in dollars), as well as the increase of the share of road transport in the total exports of transport services of the Republic of Belarus indicates the importance of this sector for international transport.
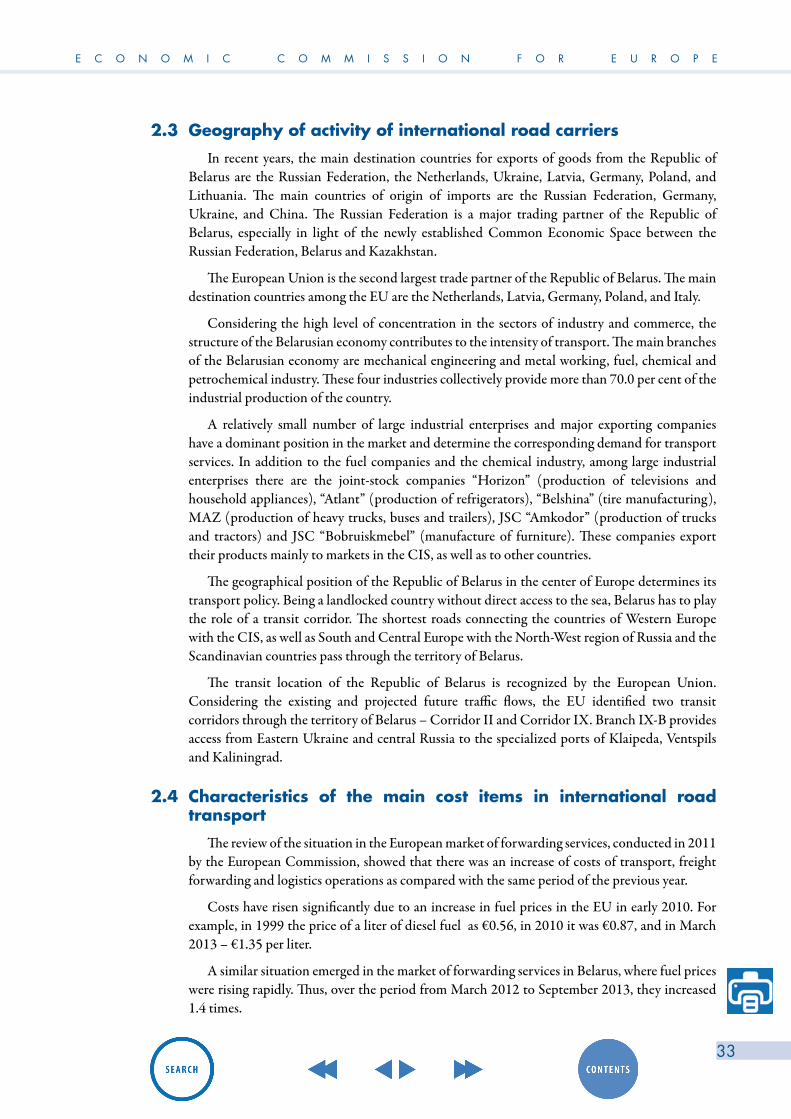
Indicators of import of transport services, i.e. services provided by foreign carriers, compared with indicators of export can, to some extent, characterize the competition between Belarusian and foreign carriers (Figure 31 -33), (the raw data are presented in Annex 5, table 5.3).
The volume of import of road transport services in recent years has increased, as well as exports, but in absolute terms less than exports. In 2012, imports amounted to US$ 397.3 million. The share of road transport in total imports in 2012 was 26.6 per cent. Figure 34 shows that the Republic of Belarus has a positive balance of international road transport services.
Figure 31: Imports of transport services in the Republic of Belarus (million US$)

Review of the t ranspor t and logis t ics sys tem of the Republ ic of Belarus
32
Figure 32: Dynamics of import of transport services in the Republic of Belarus (per cent)
Figure 33: Structure of imports of transport services in the Republic of Belarus
Figure 34: The balance of trade in transport services of the Republic of Belarus (million US$)
18
0
50
100
150
200
250
2008 2009 2010 2011 2012 2013
Grow
th ra
te, %
all modes Road transport
0
500
1000
1500
2000
2500
2008 2009 2010 2011 2012 2013
all modes Road transport
2009
Road transport21.3%
Railway 38.4%
Other modes13.3%
Maritime27.0%
2012
Road transport26.6%
Railway 31.3%
Other modes10.5%
Maritime31.6%
E C O N O M I C C O M M I S S I O N F O R E U R O P E
33
2.3 Geography of activity of international road carriers
In recent years, the main destination countries for exports of goods from the Republic of Belarus are the Russian Federation, the Netherlands, Ukraine, Latvia, Germany, Poland, and Lithuania. The main countries of origin of imports are the Russian Federation, Germany, Ukraine, and China. The Russian Federation is a major trading partner of the Republic of Belarus, especially in light of the newly established Common Economic Space between the Russian Federation, Belarus and Kazakhstan.
The European Union is the second largest trade partner of the Republic of Belarus. The main destination countries among the EU are the Netherlands, Latvia, Germany, Poland, and Italy.
Considering the high level of concentration in the sectors of industry and commerce, the structure of the Belarusian economy contributes to the intensity of transport. The main branches of the Belarusian economy are mechanical engineering and metal working, fuel, chemical and petrochemical industry. These four industries collectively provide more than 70.0 per cent of the industrial production of the country.
A relatively small number of large industrial enterprises and major exporting companies have a dominant position in the market and determine the corresponding demand for transport services. In addition to the fuel companies and the chemical industry, among large industrial enterprises there are the joint-stock companies “Horizon” (production of televisions and household appliances), “Atlant” (production of refrigerators), “Belshina” (tire manufacturing), MAZ (production of heavy trucks, buses and trailers), JSC “Amkodor” (production of trucks and tractors) and JSC “Bobruiskmebel” (manufacture of furniture). These companies export their products mainly to markets in the CIS, as well as to other countries.
The geographical position of the Republic of Belarus in the center of Europe determines its transport policy. Being a landlocked country without direct access to the sea, Belarus has to play the role of a transit corridor. The shortest roads connecting the countries of Western Europe with the CIS, as well as South and Central Europe with the North-West region of Russia and the Scandinavian countries pass through the territory of Belarus.
The transit location of the Republic of Belarus is recognized by the European Union. Considering the existing and projected future traffic flows, the EU identified two transit corridors through the territory of Belarus – Corridor II and Corridor IX. Branch IХ-В provides access from Eastern Ukraine and central Russia to the specialized ports of Klaipeda, Ventspils and Kaliningrad.
2.4 Characteristics of the main cost items in international road transport
The review of the situation in the European market of forwarding services, conducted in 2011 by the European Commission, showed that there was an increase of costs of transport, freight forwarding and logistics operations as compared with the same period of the previous year.
Costs have risen significantly due to an increase in fuel prices in the EU in early 2010. For example, in 1999 the price of a liter of diesel fuel as €0.56, in 2010 it was €0.87, and in March 2013 – €1.35 per liter.
A similar situation emerged in the market of forwarding services in Belarus, where fuel prices were rising rapidly. Thus, over the period from March 2012 to September 2013, they increased 1.4 times.
Review of the t ranspor t and logis t ics sys tem of the Republ ic of Belarus
34
Most of the transport companies note the rising costs of salaries and insurance, as compared with the same period of the previous year. Together with the increased costs of auto parts, tire prices increased as well. Costs associated with obtaining a permit to travel and costs of special escort of trucks has also increased. A number of enterprises had an increase in the costs of forwarding activities due to the need to make provision for various ancillary services, typical of companies specializing in international traffic, which are required to ensure high-quality performance in accordance with quality certificates. To ensure these requirements, additional costs are needed. At the same time, certain clients try to reduce freight costs by imposing additional requirements for transport. The increase in costs is also associated with extended idle time waiting for loading/unloading, especially for the transport of food products, at the central warehouses and large commercial stations.
In the transport market of theEU, Belarusian carriers and freight forwarders are often faced with the increasing requirements of clients for the already agreed transport of freight. These requirements are usually related to the improvement of the quality of freight forwarding services and to the provision of additional services:
– Observance of the exact timing for loading and unloading of the vehicle regardless of the capabilities of the carrier and the circumstances prevailing during the passage of the external borders of the Customs Union;
– Compliance with the EU customs procedures for the transport of goods under customs control; carriers and freight forwarders from countries outside the EU are facing technical difficulties with their implementation;
– Requests to load the cargo on a particular transport vehicle, which is optimal and convenient for the client in order to reduce the time and cost, but is unacceptable or difficult for execution or for cargo transport on the route;
– Involvement of the vehicle crew at the loading and unloading, as well as the requirement of the customer for presence of the freight forwarder and performance of certain work during loading/unloading and delivery of the cargo to the consignee;
– Requirement for the carrier’s special transport mechanisms and tools for loading and unloading;
– Transport of goods without accurate information about the place of discharge. As a rule, to complete the procedure of transport of goods under customs control, the address of the customs office or of the freight forwarder should be indicated. The customs office or the freight forwarder subsequently provides instructions for the place of discharge. The additional transport costs and idle time of the vehicle under unloading are not taken into account by the customer;
– Loading/unloading in several places, in spite of the considerable distance between them. Additional costs of the carrier in this case are considered by the customer as aggregate, and are included in the cost of previously agreed freight.
The average cost structure for international road transport of goods by carriers from Belarus according to the data of the State Statistical Office is shown in Figure 35.

E C O N O M I C C O M M I S S I O N F O R E U R O P E
35
Figure 35: Cost structure for international road transport of goods
lease payments4.2%
land-tax0.1%
other10.2%
repairs and maintenance of
automobile vehicles8.5%
amortization of �xed assets and of
intangible assets10.9%
employee compensation expenses for
business trips abroad14.3%
taxes and contributions of funds
to pay4.0%
wages 11.4%
fuel 36.4%
The largest share in the cost of international freight transport is fuel, amounting to 36.4 per cent. The next are such items as employee compensation expenses – 14.3 per cent (including drivers – 13.9 per cent of total costs) and wages 11.4 per cent (including the drivers – 6.7 per cent). Remuneration of fixed assets and of intangible assets represents 10.9 per cent (including vehicles – 10.4 per cent). Repairs and maintenance of vehicles are 8.5 per cent.
The steady growth could be observed in almost all cost items, associated with road transport, and international road transport in particular. However, the growth of tariffs is not proportional to the increase in costs. This ultimately leads to lower profitability of such shipments.
3. Review of the transport infrastructure and logistic systems of the Republic of Belarus
Transport as a system consists of two subsystems: public and non-public transport. Public transport includes rail, water (sea, river), road, air and pipeline transports. Public transport services the needs of the economy and the population for transport of goods and passengers. Non-public transport is carried for own account by all kind of vehicles in plants, enterprises, etc.
Transport infrastructure includes transport networks (roads, railways, air passages, canals, pipelines, bridges, tunnels, waterways, etc.), as well as transport hubs and terminals, which make possible the transshipment of cargo or passenger transfer from one mode of transport to another (airports, railway stations, bus stops and ports).
This review will focus on roads, railways, and waterways as well as logistics services facilities.
3.1 Roads in the Republic of Belarus and their conditionsThe road infrastructure of Belarus represents an optimal extensive network of motorways
that ensure a continuous year-round communication with almost all populated areas.

Review of the t ranspor t and logis t ics sys tem of the Republ ic of Belarus
36
According to the relevant law of the Republic of Belarus “On highways and road activities” from December 2, 994 № 3434 –XII, roads are divided into public and non-public roads. Public roads are roads that can be used by any person according to the requirements established by the legislation of the Republic of Belarus. Non-public highways are roads can be used in the manner specified by the owners according to the requirements established by the legislation of the Republic of Belarus4.
Public roads are public property of the Republic of Belarus and, depending on their functional purpose they are divided into national and local roads. National roads are roads that are included in the network of international roads (European transport system), as well as roads that provide a transport network between:
– Minsk and regional administrative centers, the National Airport “Minsk”;
– Regional administrative centers;
– Regional administrative center and airports outside the city and the administrative center of the district;
– Administrative centers of districts;
– Regional administrative center and cities located in that region;
– Railway stations (located not in the cities), checkpoints across the state border of the Republic of Belarus, as well as other objects of national importance with the national roads.
Local roads are roads that provide a transport network between:
– Administrative centers of village councils, cities within the district, resorts, city and industrial communities, rural communities and administrative center of the district in which they are located, as well as among these localities and with the nearest railway stations, airports, river ports and marinas outside the city limits;
– Places of public interest (tourism, sports centers, hospitals, schools, residences, historical sites, monuments of nature and culture, etc.) and regional administrative centers and districts in which these places are located, as well as the nearest railway stations, airports, river ports, marinas and national roads;
– Administrative centers of each village councils, rural population centers and public roads;
– Individual housing developments, located in the country side, and farming associations with public roads.
Non-public roads are roads designed for internal use by utilities services and services providing oversight along the canals, pipelines, power lines, and other communications, as well as service roads for power stations and other buildings.
Special categories of non-public roads are roads that are the responsibility of the Ministry of Defense, the Ministry of Internal Affairs and the State Border Committee of Belarus. These roads are not subject to the Law of the Republic of Belarus “On high ays and road activities” fro Dece ber 2, 994 № 3434 -XII.
On 1 January 2013 the length of the motorway network was 86 491 kilometres. National roads play the main role and consist of 15 636 kilometres, on which more than 70.0 per cent of all cargo is transported. Local roads make up 70 855 kilometres, departmental (agricultural, industrial, forest, etc.) are about 200 kilometres long (table 2).
4 (http://kodeksy- by.com)
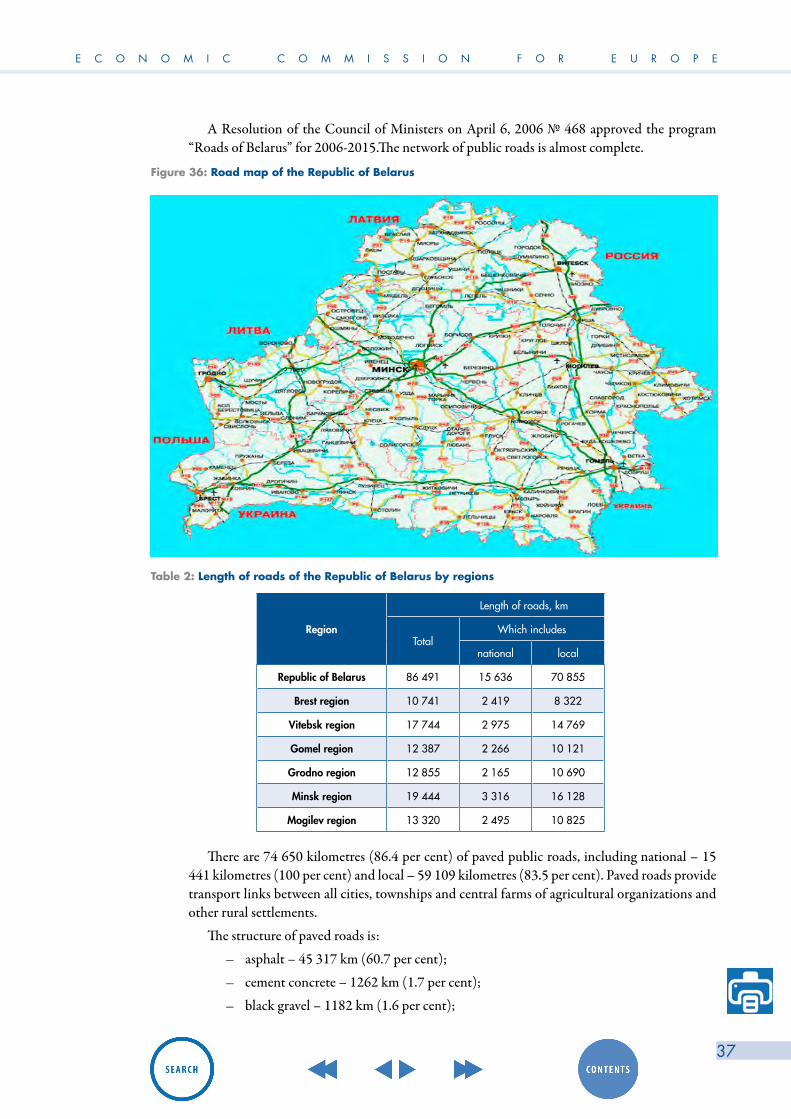
E C O N O M I C C O M M I S S I O N F O R E U R O P E
37
A Resolution of the Council of Ministers on April 6, 2006 № 468 approved the program “Roads of Belarus” for 2006-2015.The network of public roads is almost complete.
Figure 36: Road map of the Republic of Belarus
Table 2: Length of roads of the Republic of Belarus by regions
Region
Length of roads, km
TotalWhich includes
national local
Republic of Belarus 86 491 15 636 70 855
Brest region 10 741 2 419 8 322
Vitebsk region 17 744 2 975 14 769
Gomel region 12 387 2 266 10 121
Grodno region 12 855 2 165 10 690
Minsk region 19 444 3 316 16 128
Mogilev region 13 320 2 495 10 825
There are 74 650 kilometres (86.4 per cent) of paved public roads, including national – 15 441 kilometres (100 per cent) and local – 59 109 kilometres (83.5 per cent). Paved roads provide transport links between all cities, townships and central farms of agricultural organizations and other rural settlements.
The structure of paved roads is:
– asphalt – 45 317 km (60.7 per cent);
– cement concrete – 1262 km (1.7 per cent);
– black gravel – 1182 km (1.6 per cent);
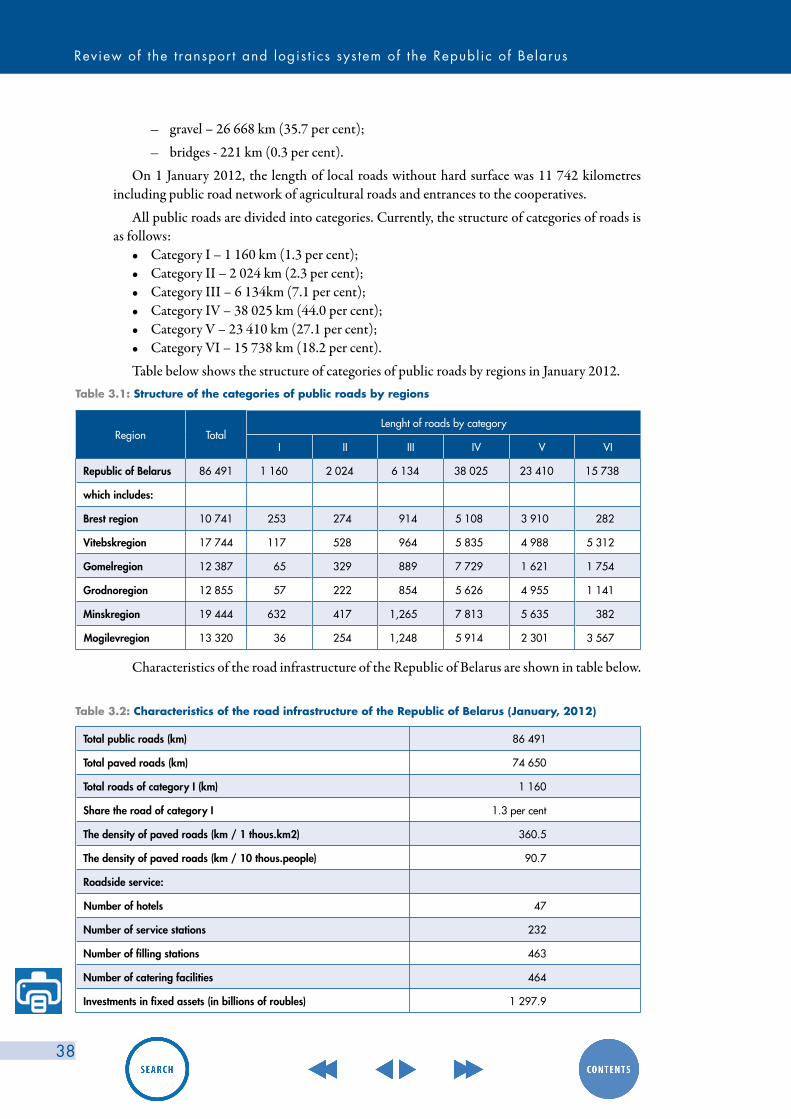
Review of the t ranspor t and logis t ics sys tem of the Republ ic of Belarus
38
– gravel – 26 668 km (35.7 per cent);
– bridges - 221 km (0.3 per cent).
On 1 January 2012, the length of local roads without hard surface was 11 742 kilometres including public road network of agricultural roads and entrances to the cooperatives.
All public roads are divided into categories. Currently, the structure of categories of roads is as follows:
• Category I – 1 160 km (1.3 per cent);• Category II – 2 024 km (2.3 per cent); • Category III – 6 134km (7.1 per cent); • Category IV – 38 025 km (44.0 per cent);• Category V – 23 410 km (27.1 per cent);• Category VI – 15 738 km (18.2 per cent).
Table below shows the structure of categories of public roads by regions in January 2012.
Region TotalLenght of roads by category
I II III IV V VI
Republic of Belarus 86 491 1 160 2 024 6 134 38 025 23 410 15 738
which includes:
Brest region 10 741 253 274 914 5 108 3 910 282
Vitebskregion 17 744 117 528 964 5 835 4 988 5 312
Gomelregion 12 387 65 329 889 7 729 1 621 1 754
Grodnoregion 12 855 57 222 854 5 626 4 955 1 141
Minskregion 19 444 632 417 1,265 7 813 5 635 382
Mogilevregion 13 320 36 254 1,248 5 914 2 301 3 567
Total public roads (km) 86 491
Total paved roads (km) 74 650
Total roads of category I (km) 1 160
Share the road of category I 1.3 per cent
The density of paved roads (km / 1 thous.km2) 360.5
The density of paved roads (km / 10 thous.people) 90.7
Roadside service:
Number of hotels 47
Number of service stations 232
Number of filling stations 463
Number of catering facilities 464
Investments in fixed assets (in billions of roubles) 1 297.9
Table 3.1: Structure of the categories of public roads by regions
Characteristics of the road infrastructure of the Republic of Belarus are shown in table below.
Table 3.2: Characteristics of the road infrastructure of the Republic of Belarus (January, 2012)
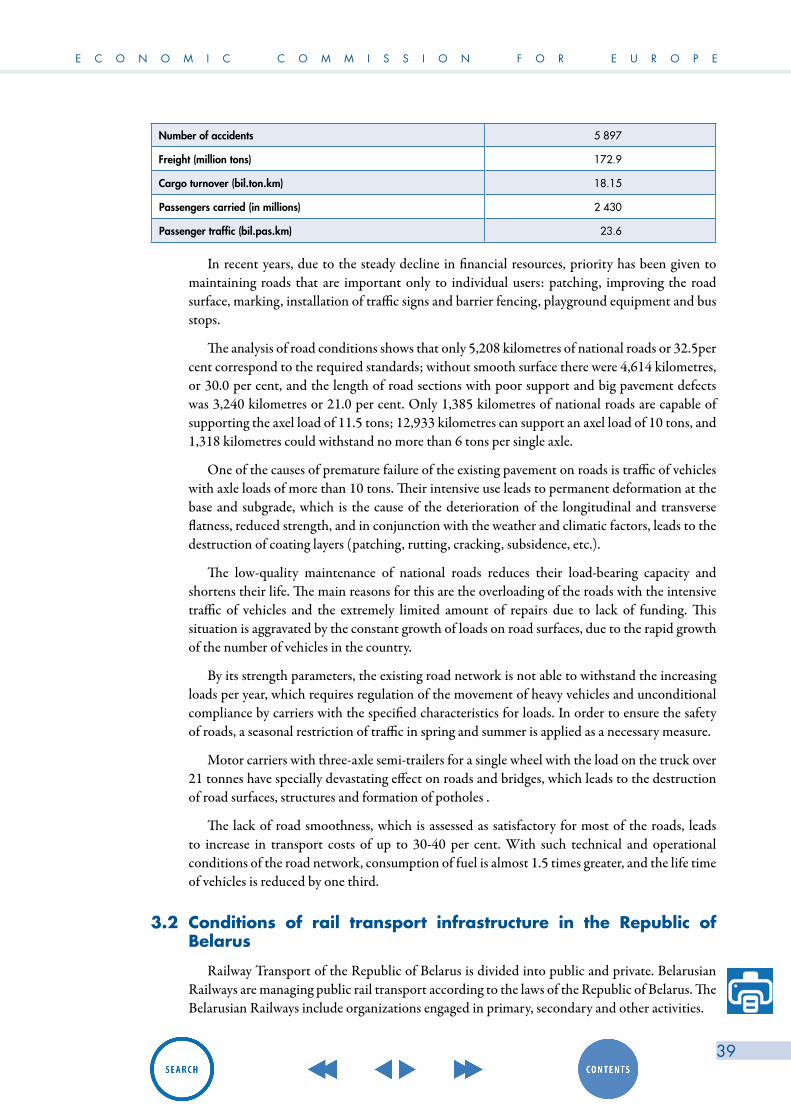
E C O N O M I C C O M M I S S I O N F O R E U R O P E
39
In recent years, due to the steady decline in financial resources, priority has been given to maintaining roads that are important only to individual users: patching, improving the road surface, marking, installation of traffic signs and barrier fencing, playground equipment and bus stops.
The analysis of road conditions shows that only 5,208 kilometres of national roads or 32.5per cent correspond to the required standards; without smooth surface there were 4,614 kilometres, or 30.0 per cent, and the length of road sections with poor support and big pavement defects was 3,240 kilometres or 21.0 per cent. Only 1,385 kilometres of national roads are capable of supporting the axel load of 11.5 tons; 12,933 kilometres can support an axel load of 10 tons, and 1,318 kilometres could withstand no more than 6 tons per single axle.
One of the causes of premature failure of the existing pavement on roads is traffic of vehicles with axle loads of more than 10 tons. Their intensive use leads to permanent deformation at the base and subgrade, which is the cause of the deterioration of the longitudinal and transverse flatness, reduced strength, and in conjunction with the weather and climatic factors, leads to the destruction of coating layers (patching, rutting, cracking, subsidence, etc.).
The low-quality maintenance of national roads reduces their load-bearing capacity and shortens their life. The main reasons for this are the overloading of the roads with the intensive traffic of vehicles and the extremely limited amount of repairs due to lack of funding. This situation is aggravated by the constant growth of loads on road surfaces, due to the rapid growth of the number of vehicles in the country.
By its strength parameters, the existing road network is not able to withstand the increasing loads per year, which requires regulation of the movement of heavy vehicles and unconditional compliance by carriers with the specified characteristics for loads. In order to ensure the safety of roads, a seasonal restriction of traffic in spring and summer is applied as a necessary measure.
Motor carriers with three-axle semi-trailers for a single wheel with the load on the truck over 21 tonnes have specially devastating effect on roads and bridges, which leads to the destruction of road surfaces, structures and formation of potholes .
The lack of road smoothness, which is assessed as satisfactory for most of the roads, leads to increase in transport costs of up to 30-40 per cent. With such technical and operational conditions of the road network, consumption of fuel is almost 1.5 times greater, and the life time of vehicles is reduced by one third.
3.2 Conditions of rail transport infrastructure in the Republic of Belarus
Railway Transport of the Republic of Belarus is divided into public and private. Belarusian Railways are managing public rail transport according to the laws of the Republic of Belarus. The Belarusian Railways include organizations engaged in primary, secondary and other activities.
Number of accidents 5 897
Freight (million tons) 172.9
Cargo turnover (bil.ton.km) 18.15
Passengers carried (in millions) 2 430
Passenger traffic (bil.pas.km) 23.6
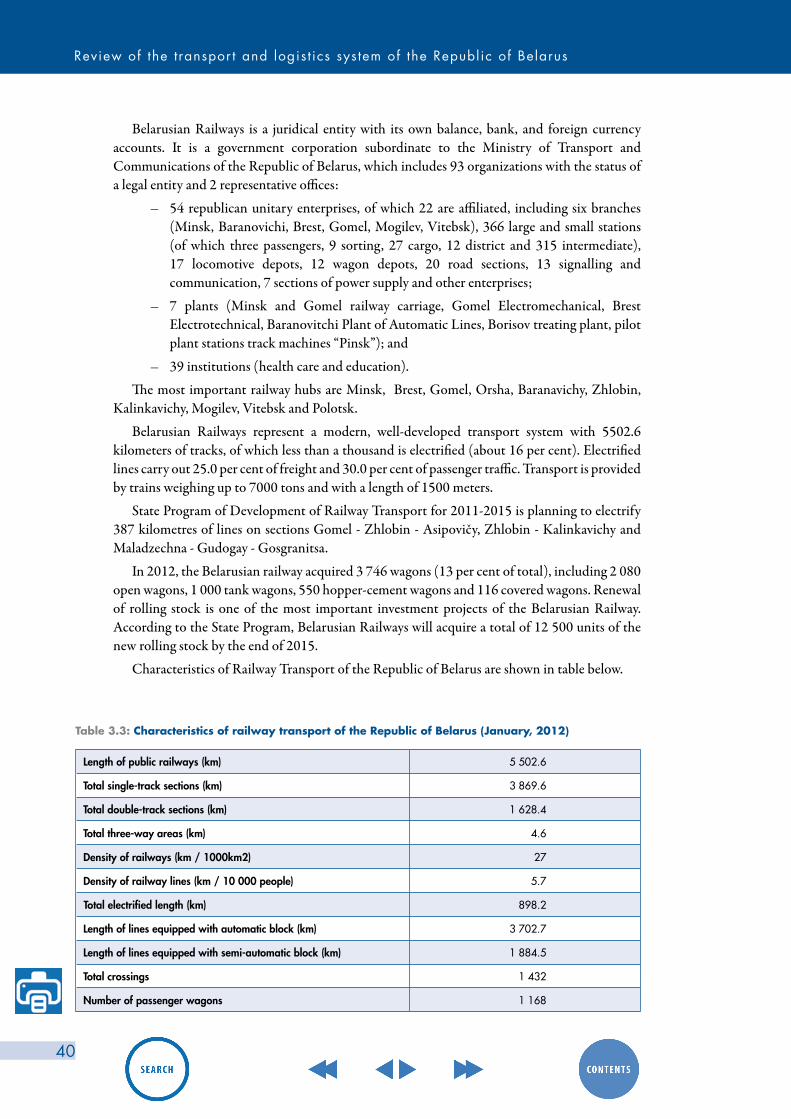
Review of the t ranspor t and logis t ics sys tem of the Republ ic of Belarus
40
Belarusian Railways is a juridical entity with its own balance, bank, and foreign currency accounts. It is a government corporation subordinate to the Ministry of Transport and Communications of the Republic of Belarus, which includes 93 organizations with the status of a legal entity and 2 representative offices:
– 54 republican unitary enterprises, of which 22 are affiliated, including six branches (Minsk, Baranovichi, Brest, Gomel, Mogilev, Vitebsk), 366 large and small stations (of which three passengers, 9 sorting, 27 cargo, 12 district and 315 intermediate), 17 locomotive depots, 12 wagon depots, 20 road sections, 13 signalling and communication, 7 sections of power supply and other enterprises;
– 7 plants (Minsk and Gomel railway carriage, Gomel Electromechanical, Brest Electrotechnical, Baranovitchi Plant of Automatic Lines, Borisov treating plant, pilot plant stations track machines “Pinsk”); and
– 39 institutions (health care and education).
The most important railway hubs are Minsk, Brest, Gomel, Orsha, Baranavichy, Zhlobin, Kalinkavichy, Mogilev, Vitebsk and Polotsk.
Belarusian Railways represent a modern, well-developed transport system with 5502.6 kilometers of tracks, of which less than a thousand is electrified (about 16 per cent). Electrified lines carry out 25.0 per cent of freight and 30.0 per cent of passenger traffic. Transport is provided by trains weighing up to 7000 tons and with a length of 1500 meters.
State Program of Development of Railway Transport for 2011-2015 is planning to electrify 387 kilometres of lines on sections Gomel - Zhlobin - Asipovičy, Zhlobin - Kalinkavichy and Maladzechna - Gudogay - Gosgranitsa.
In 2012, the Belarusian railway acquired 3 746 wagons (13 per cent of total), including 2 080 open wagons, 1 000 tank wagons, 550 hopper-cement wagons and 116 covered wagons. Renewal of rolling stock is one of the most important investment projects of the Belarusian Railway. According to the State Program, Belarusian Railways will acquire a total of 12 500 units of the new rolling stock by the end of 2015.
Characteristics of Railway Transport of the Republic of Belarus are shown in table below.
Length of public railways (km) 5 502.6
Total single-track sections (km) 3 869.6
Total double-track sections (km) 1 628.4
Total three-way areas (km) 4.6
Density of railways (km / 1000km2) 27
Density of railway lines (km / 10 000 people) 5.7
Total electrified length (km) 898.2
Length of lines equipped with automatic block (km) 3 702.7
Length of lines equipped with semi-automatic block (km) 1 884.5
Total crossings 1 432
Number of passenger wagons 1 168
Table 3.3: Characteristics of railway transport of the Republic of Belarus (January, 2012)
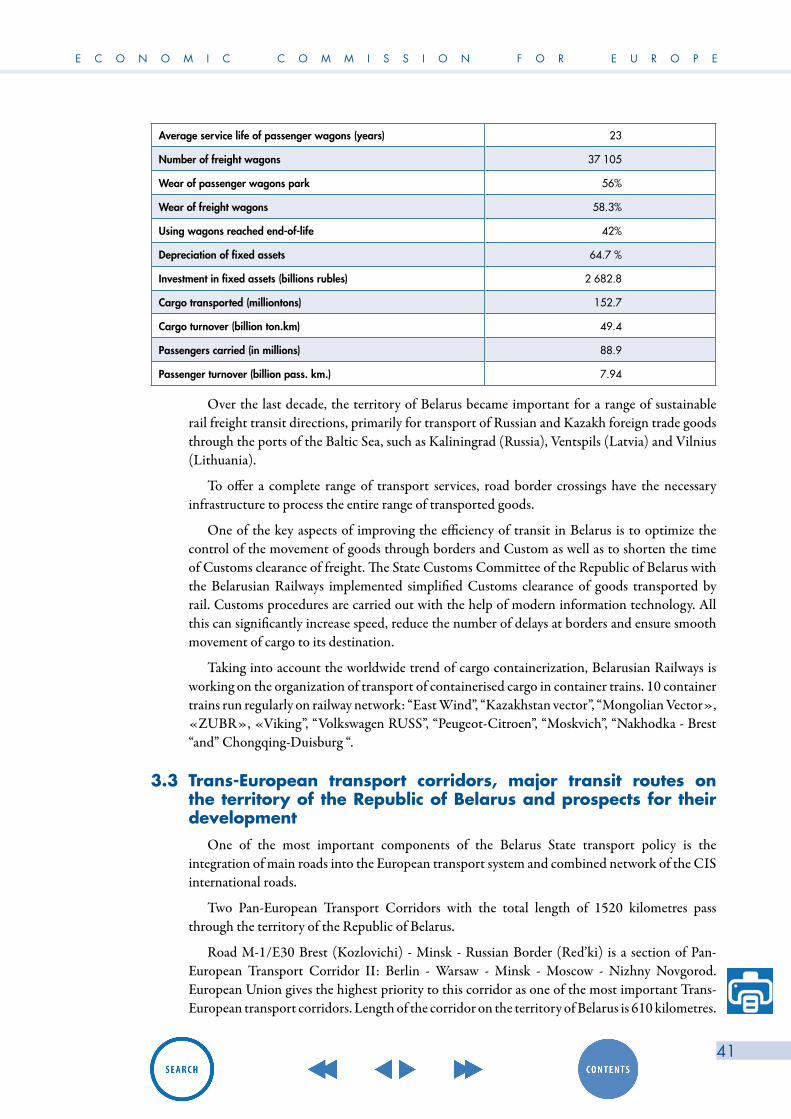
E C O N O M I C C O M M I S S I O N F O R E U R O P E
41
Over the last decade, the territory of Belarus became important for a range of sustainable rail freight transit directions, primarily for transport of Russian and Kazakh foreign trade goods through the ports of the Baltic Sea, such as Kaliningrad (Russia), Ventspils (Latvia) and Vilnius (Lithuania).
To offer a complete range of transport services, road border crossings have the necessary infrastructure to process the entire range of transported goods.
One of the key aspects of improving the efficiency of transit in Belarus is to optimize the control of the movement of goods through borders and Custom as well as to shorten the time of Customs clearance of freight. The State Customs Committee of the Republic of Belarus with the Belarusian Railways implemented simplified Customs clearance of goods transported by rail. Customs procedures are carried out with the help of modern information technology. All this can significantly increase speed, reduce the number of delays at borders and ensure smooth movement of cargo to its destination.
Taking into account the worldwide trend of cargo containerization, Belarusian Railways is working on the organization of transport of containerised cargo in container trains. 10 container trains run regularly on railway network: “East Wind”, “Kazakhstan vector”, “Mongolian Vector», «ZUBR», «Viking”, “Volkswagen RUSS”, “Peugeot-Citroen”, “Moskvich”, “Nakhodka - Brest “and” Chongqing-Duisburg “.
3.3 Trans-European transport corridors, major transit routes on the territory of the Republic of Belarus and prospects for their development
One of the most important components of the Belarus State transport policy is the integration of main roads into the European transport system and combined network of the CIS international roads.
Two Pan-European Transport Corridors with the total length of 1520 kilometres pass through the territory of the Republic of Belarus.
Road M-1/E30 Brest (Kozlovichi) - Minsk - Russian Border (Red’ki) is a section of Pan-European Transport Corridor II: Berlin - Warsaw - Minsk - Moscow - Nizhny Novgorod. European Union gives the highest priority to this corridor as one of the most important Trans-European transport corridors. Length of the corridor on the territory of Belarus is 610 kilometres.
Average service life of passenger wagons (years) 23
Number of freight wagons 37 105
Wear of passenger wagons park 56%
Wear of freight wagons 58.3%
Using wagons reached end-of-life 42%
Depreciation of fixed assets 64.7 %
Investment in fixed assets (billions rubles) 2 682.8
Cargo transported (milliontons) 152.7
Cargo turnover (billion ton.km) 49.4
Passengers carried (in millions) 88.9
Passenger turnover (billion pass. km.) 7.94
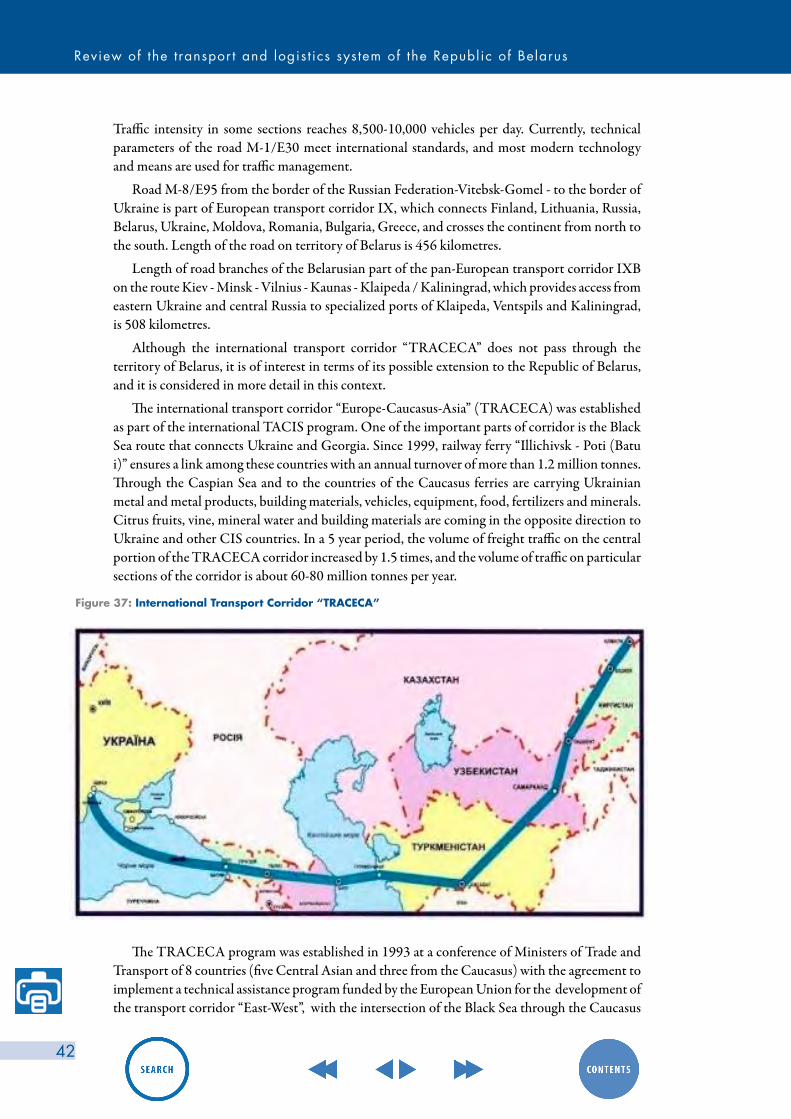
Review of the t ranspor t and logis t ics sys tem of the Republ ic of Belarus
42
Traffic intensity in some sections reaches 8,500-10,000 vehicles per day. Currently, technical parameters of the road M-1/E30 meet international standards, and most modern technology and means are used for traffic management.
Road M-8/E95 from the border of the Russian Federation-Vitebsk-Gomel - to the border of Ukraine is part of European transport corridor IX, which connects Finland, Lithuania, Russia, Belarus, Ukraine, Moldova, Romania, Bulgaria, Greece, and crosses the continent from north to the south. Length of the road on territory of Belarus is 456 kilometres.
Length of road branches of the Belarusian part of the pan-European transport corridor IXB on the route Kiev - Minsk - Vilnius - Kaunas - Klaipeda / Kaliningrad, which provides access from eastern Ukraine and central Russia to specialized ports of Klaipeda, Ventspils and Kaliningrad, is 508 kilometres.
Although the international transport corridor “TRACECA” does not pass through the territory of Belarus, it is of interest in terms of its possible extension to the Republic of Belarus, and it is considered in more detail in this context.
The international transport corridor “Europe-Caucasus-Asia” (TRACECA) was established as part of the international TACIS program. One of the important parts of corridor is the Black Sea route that connects Ukraine and Georgia. Since 1999, railway ferry “Illichivsk - Poti (Batu i)” ensures a link among these countries with an annual turnover of more than 1.2 million tonnes. Through the Caspian Sea and to the countries of the Caucasus ferries are carrying Ukrainian metal and metal products, building materials, vehicles, equipment, food, fertilizers and minerals. Citrus fruits, vine, mineral water and building materials are coming in the opposite direction to Ukraine and other CIS countries. In a 5 year period, the volume of freight traffic on the central portion of the TRACECA corridor increased by 1.5 times, and the volume of traffic on particular sections of the corridor is about 60-80 million tonnes per year.
Figure 37: International Transport Corridor “TRACECA”
The TRACECA program was established in 1993 at a conference of Ministers of Trade and Transport of 8 countries (five Central Asian and three from the Caucasus) with the agreement to implement a technical assistance program funded by the European Union for the development of the transport corridor “East-West”, with the intersection of the Black Sea through the Caucasus
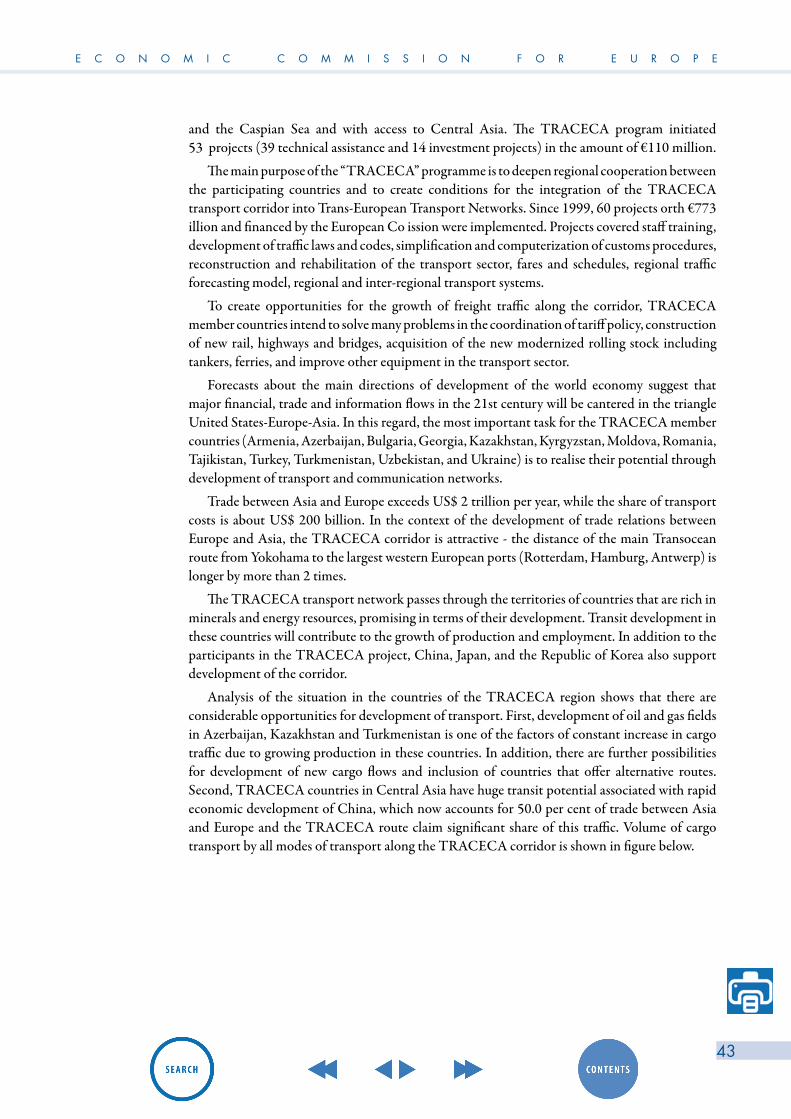
E C O N O M I C C O M M I S S I O N F O R E U R O P E
43
and the Caspian Sea and with access to Central Asia. The TRACECA program initiated 53 projects (39 technical assistance and 14 investment projects) in the amount of €110 million.
The main purpose of the “TRACECA” programme is to deepen regional cooperation between the participating countries and to create conditions for the integration of the TRACECA transport corridor into Trans-European Transport Networks. Since 1999, 60 projects orth €773 illion and financed by the European Co ission were implemented. Projects covered staff training, development of traffic laws and codes, simplification and computerization of customs procedures, reconstruction and rehabilitation of the transport sector, fares and schedules, regional traffic forecasting model, regional and inter-regional transport systems.
To create opportunities for the growth of freight traffic along the corridor, TRACECA member countries intend to solve many problems in the coordination of tariff policy, construction of new rail, highways and bridges, acquisition of the new modernized rolling stock including tankers, ferries, and improve other equipment in the transport sector.
Forecasts about the main directions of development of the world economy suggest that major financial, trade and information flows in the 21st century will be cantered in the triangle United States-Europe-Asia. In this regard, the most important task for the TRACECA member countries (Armenia, Azerbaijan, Bulgaria, Georgia, Kazakhstan, Kyrgyzstan, Moldova, Romania, Tajikistan, Turkey, Turkmenistan, Uzbekistan, and Ukraine) is to realise their potential through development of transport and communication networks.
Trade between Asia and Europe exceeds US$ 2 trillion per year, while the share of transport costs is about US$ 200 billion. In the context of the development of trade relations between Europe and Asia, the TRACECA corridor is attractive - the distance of the main Transocean route from Yokohama to the largest western European ports (Rotterdam, Hamburg, Antwerp) is longer by more than 2 times.
The TRACECA transport network passes through the territories of countries that are rich in minerals and energy resources, promising in terms of their development. Transit development in these countries will contribute to the growth of production and employment. In addition to the participants in the TRACECA project, China, Japan, and the Republic of Korea also support development of the corridor.
Analysis of the situation in the countries of the TRACECA region shows that there are considerable opportunities for development of transport. First, development of oil and gas fields in Azerbaijan, Kazakhstan and Turkmenistan is one of the factors of constant increase in cargo traffic due to growing production in these countries. In addition, there are further possibilities for development of new cargo flows and inclusion of countries that offer alternative routes. Second, TRACECA countries in Central Asia have huge transit potential associated with rapid economic development of China, which now accounts for 50.0 per cent of trade between Asia and Europe and the TRACECA route claim significant share of this traffic. Volume of cargo transport by all modes of transport along the TRACECA corridor is shown in figure below.
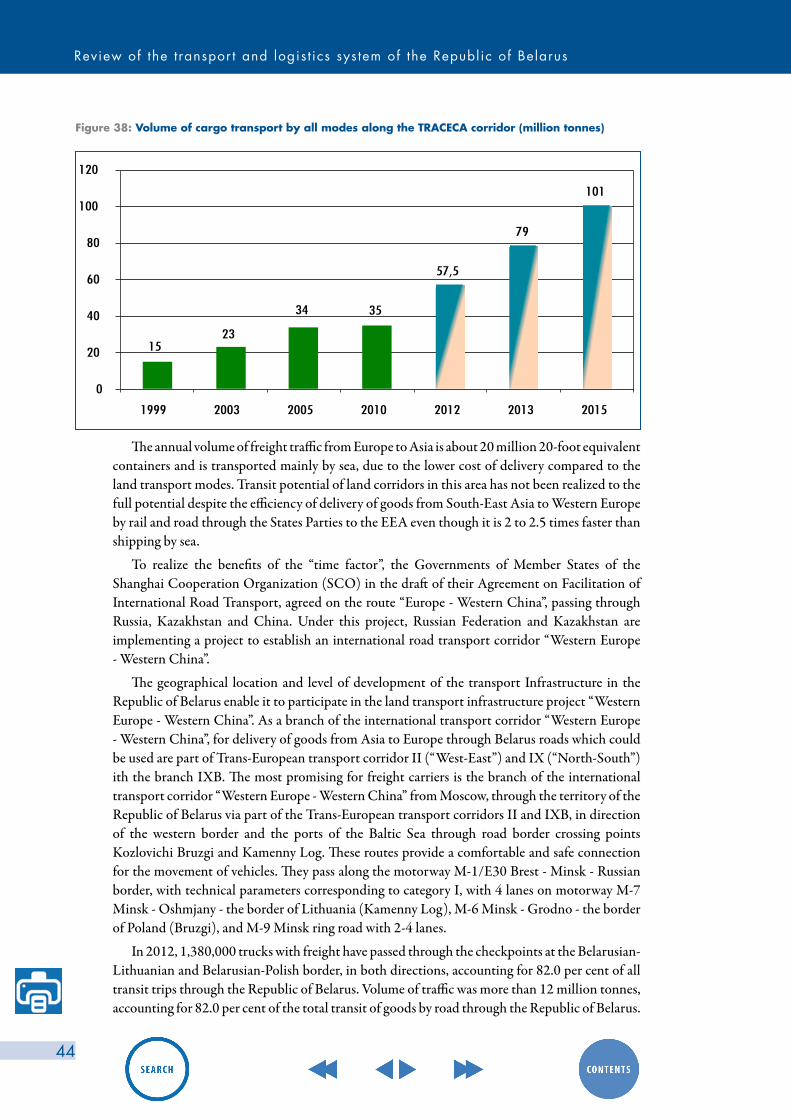
Review of the t ranspor t and logis t ics sys tem of the Republ ic of Belarus
44
Figure 38: Volume of cargo transport by all modes along the TRACECA corridor (million tonnes)
1523
34 35
57,5
79
101
0
20
40
60
80
100
120
1999 2003 2005 2010 2012 2013 2015
The annual volume of freight traffic from Europe to Asia is about 20 million 20-foot equivalent containers and is transported mainly by sea, due to the lower cost of delivery compared to the land transport modes. Transit potential of land corridors in this area has not been realized to the full potential despite the efficiency of delivery of goods from South-East Asia to Western Europe by rail and road through the States Parties to the EEA even though it is 2 to 2.5 times faster than shipping by sea.
To realize the benefits of the “time factor”, the Governments of Member States of the Shanghai Cooperation Organization (SCO) in the draft of their Agreement on Facilitation of International Road Transport, agreed on the route “Europe - Western China”, passing through Russia, Kazakhstan and China. Under this project, Russian Federation and Kazakhstan are implementing a project to establish an international road transport corridor “Western Europe - Western China”.
The geographical location and level of development of the transport Infrastructure in the Republic of Belarus enable it to participate in the land transport infrastructure project “Western Europe - Western China”. As a branch of the international transport corridor “Western Europe - Western China”, for delivery of goods from Asia to Europe through Belarus roads which could be used are part of Trans-European transport corridor II (“West-East”) and IX (“North-South”) ith the branch IXB. The most promising for freight carriers is the branch of the international transport corridor “Western Europe - Western China” from Moscow, through the territory of the Republic of Belarus via part of the Trans-European transport corridors II and IXB, in direction of the western border and the ports of the Baltic Sea through road border crossing points Kozlovichi Bruzgi and Kamenny Log. These routes provide a comfortable and safe connection for the movement of vehicles. They pass along the motorway M-1/E30 Brest - Minsk - Russian border, with technical parameters corresponding to category I, with 4 lanes on motorway M-7 Minsk - Oshmjany - the border of Lithuania (Kamenny Log), M-6 Minsk - Grodno - the border of Poland (Bruzgi), and M-9 Minsk ring road with 2-4 lanes.
In 2012, 1,380,000 trucks with freight have passed through the checkpoints at the Belarusian-Lithuanian and Belarusian-Polish border, in both directions, accounting for 82.0 per cent of all transit trips through the Republic of Belarus. Volume of traffic was more than 12 million tonnes, accounting for 82.0 per cent of the total transit of goods by road through the Republic of Belarus.
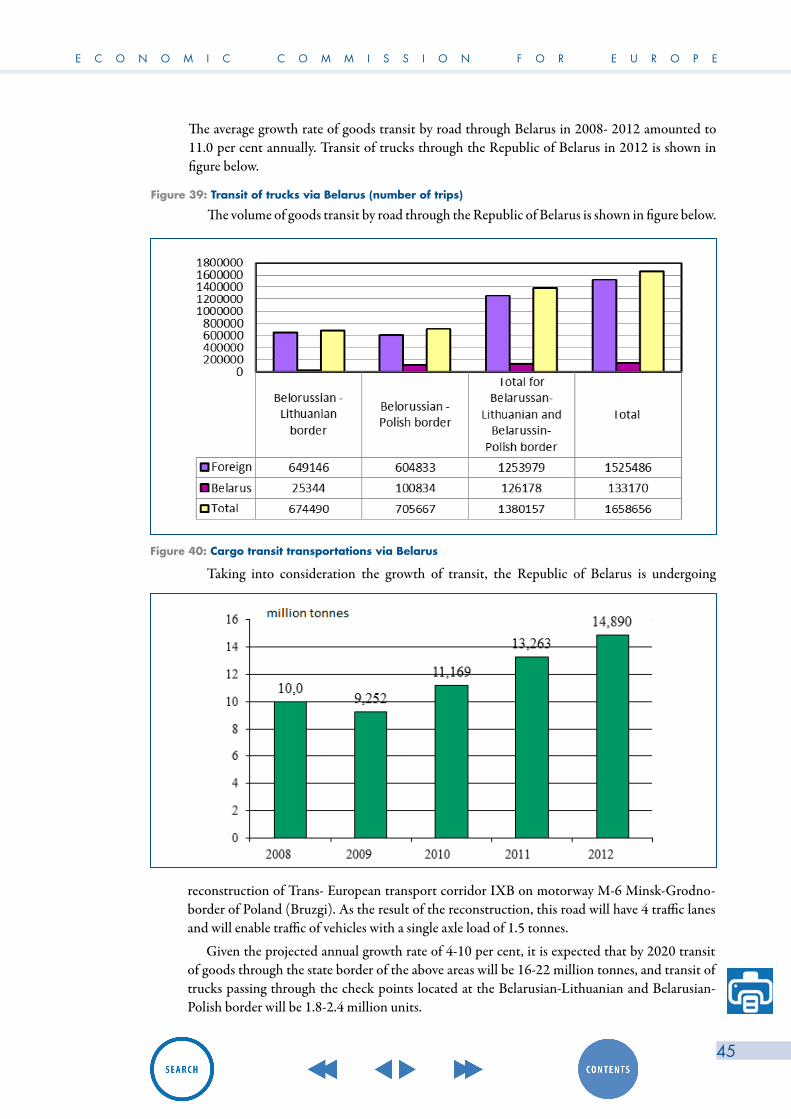
E C O N O M I C C O M M I S S I O N F O R E U R O P E
45
The average growth rate of goods transit by road through Belarus in 2008- 2012 amounted to 11.0 per cent annually. Transit of trucks through the Republic of Belarus in 2012 is shown in figure below.
Figure 39: Transit of trucks via Belarus (number of trips)
The volume of goods transit by road through the Republic of Belarus is shown in figure below.
Figure 40: Cargo transit transportations via Belarus
Taking into consideration the growth of transit, the Republic of Belarus is undergoing
reconstruction of Trans- European transport corridor IXB on motorway M-6 Minsk-Grodno-border of Poland (Bruzgi). As the result of the reconstruction, this road will have 4 traffic lanes and will enable traffic of vehicles with a single axle load of 1.5 tonnes.
Given the projected annual growth rate of 4-10 per cent, it is expected that by 2020 transit of goods through the state border of the above areas will be 16-22 million tonnes, and transit of trucks passing through the check points located at the Belarusian-Lithuanian and Belarusian-Polish border will be 1.8-2.4 million units.

Review of the t ranspor t and logis t ics sys tem of the Republ ic of Belarus
46
With additional transit cargo from Kazakhstan and China through road checkpoints on the Belarusian- Lithuanian and Belarusian-Polish borders, the growth rate in 2020 will be 15-20 per cent per year, and transit of cargo is expected to reach 27-32 million tonnes carried in 3-3.5 million transiting units.
12 international CIS roads routes also cross the territory of the Republic of Belarus with the total length of 3,607 kilometers, (23.0 per cent of the total length of all national roads).
In recent years, much work has been done on the identification and analysis of road and rail routes passing through the territory of EurAsEC member States, which traditionally provide a significant amount of traffic between countries and transit of passengers and cargo. The most important routes are included in the list approved by the EurAsEC Interstate Council in 2007. The scheme of transportation routes of the EurAsEC countries is shown in figure bellow.
Figure 41: Scheme of transport routes EurAsEC
According to the EurAsEC list, there are five major road directions that coincide with major international motorways of the European (E) and Asian (AH) road network, five railway routes, coinciding with the Eurasian corridors of the Organization for Cooperation of Railways (OSJD), and two mixed (multi-modal) routes “North - South” - Pan-European transport corridor IX and the “East - West” - Pan-European transport corridor II.
Road routes include:
The route of Pan-European Transport Corridor II “East - West “;
The route of Pan-European Transport Corridor IX “North - South”;
EEC route number 1;
EEC route number 2;
EEC route number 3;
EEC route number 4;
EEC route number 5.
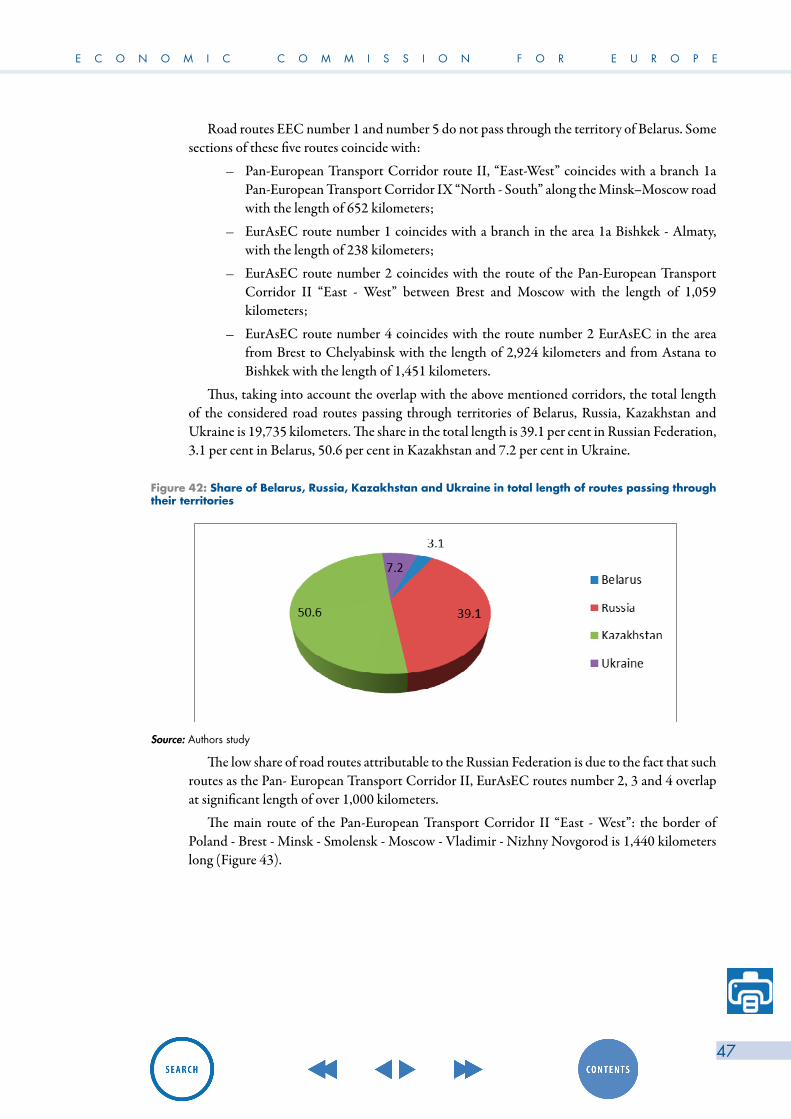
E C O N O M I C C O M M I S S I O N F O R E U R O P E
47
Road routes EEC number 1 and number 5 do not pass through the territory of Belarus. Some sections of these five routes coincide with:
– Pan-European Transport Corridor route II, “East-West” coincides with a branch 1a Pan-European Transport Corridor IX “North - South” along the Minsk–Moscow road with the length of 652 kilometers;
– EurAsEC route number 1 coincides with a branch in the area 1a Bishkek - Almaty, with the length of 238 kilometers;
– EurAsEC route number 2 coincides with the route of the Pan-European Transport Corridor II “East - West” between Brest and Moscow with the length of 1,059 kilometers;
– EurAsEC route number 4 coincides with the route number 2 EurAsEC in the area from Brest to Chelyabinsk with the length of 2,924 kilometers and from Astana to Bishkek with the length of 1,451 kilometers.
Thus, taking into account the overlap with the above mentioned corridors, the total length of the considered road routes passing through territories of Belarus, Russia, Kazakhstan and Ukraine is 19,735 kilometers. The share in the total length is 39.1 per cent in Russian Federation, 3.1 per cent in Belarus, 50.6 per cent in Kazakhstan and 7.2 per cent in Ukraine.
Figure 42: Share of Belarus, Russia, Kazakhstan and Ukraine in total length of routes passing through their territories
Source: Authors study
The low share of road routes attributable to the Russian Federation is due to the fact that such routes as the Pan- European Transport Corridor II, EurAsEC routes number 2, 3 and 4 overlap at significant length of over 1,000 kilometers.
The main route of the Pan-European Transport Corridor II “East - West”: the border of Poland - Brest - Minsk - Smolensk - Moscow - Vladimir - Nizhny Novgorod is 1,440 kilometers long (Figure 43).

Review of the t ranspor t and logis t ics sys tem of the Republ ic of Belarus
48
Figure 43: Projects on road routes of Pan-European Transport Corridor II “East - West”
Source: Federal State Unitary Enterprise “NTSKTP”
The corridor is designed to promote mutual trade between the countries of the European Union, the Republic of Belarus and the Russian Federation, transit of goods through their territory as well as of other states - members of the Customs Union and third countries.
Key road infrastructure development projects that are expected to be implemented by 2020 on the Pan- European Transport Corridor II are shown in Figure 43. Total costs are about US$ 7 billion. The largest construction project is the highway Moscow - Smolensk - the border of Belarus and the new Central Ring Road in Moscow region.
Projects in the Republic of Belarus include: construction of interchanges at different levels, barriers, reconstruction of bridges and overpasses, and construction of pedestrian crossings to different levels by 2015.
The main route of the Pan-European Transport Corridor IX “North - South” starts at the border with Finland (Torfyanovka) and then continues to St. Petersburg - Novgorod - Tver - Moscow - Kashira - Tambov - Boris Gleb - Volgograd - Kazakhstan border (Kotyaevka), with a length of 2,167 km (Figure 44).
Main branches are:a. Minsk - Russian Border (Krasnoye) - Moscow (652 kilometers);b. Border of the Russian Federation (Kotyaevka) - Atyrau - Dossor - Beineu – Aktau (1,174
kilometers);c. Border of the Russian Federation (Kotyaevka) - Atyrau - Dossor - Beineu - Akzhigit.
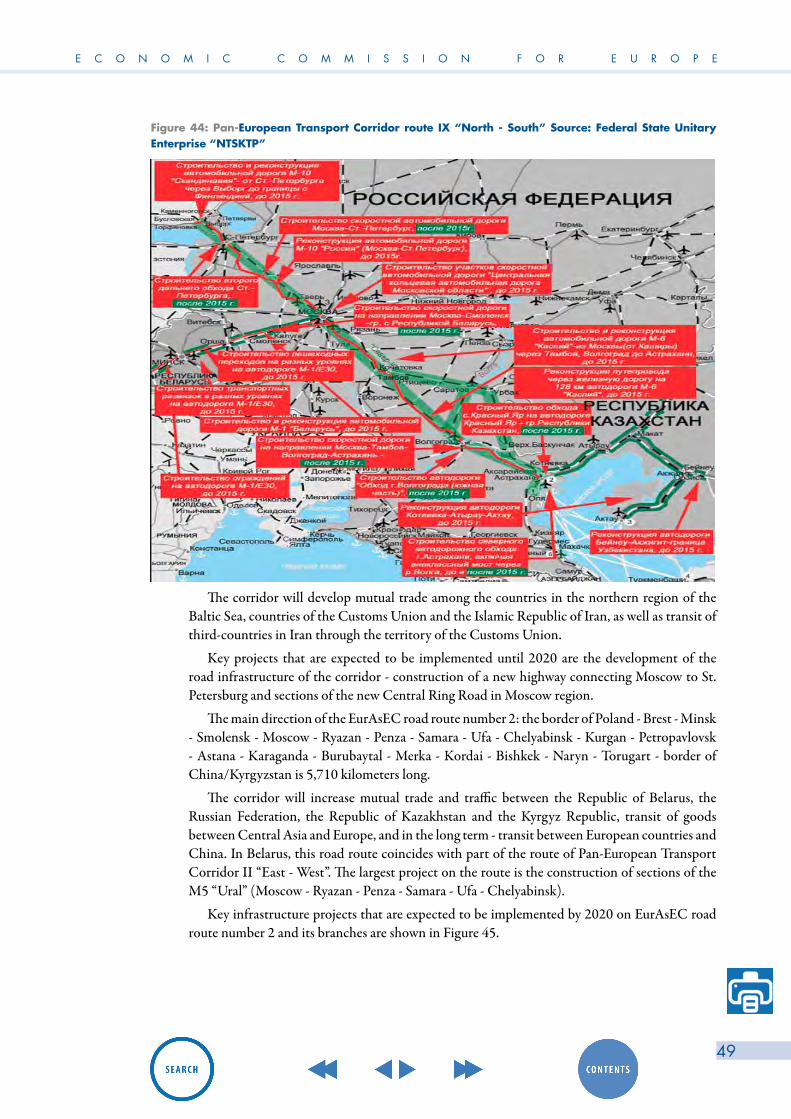
E C O N O M I C C O M M I S S I O N F O R E U R O P E
49
Figure 44: Pan-European Transport Corridor route IX “North - South” Source: Federal State Unitary Enterprise “NTSKTP”
The corridor will develop mutual trade among the countries in the northern region of the
Baltic Sea, countries of the Customs Union and the Islamic Republic of Iran, as well as transit of third-countries in Iran through the territory of the Customs Union.
Key projects that are expected to be implemented until 2020 are the development of the road infrastructure of the corridor - construction of a new highway connecting Moscow to St. Petersburg and sections of the new Central Ring Road in Moscow region.
The main direction of the EurAsEC road route number 2: the border of Poland - Brest - Minsk - Smolensk - Moscow - Ryazan - Penza - Samara - Ufa - Chelyabinsk - Kurgan - Petropavlovsk - Astana - Karaganda - Burubaytal - Merka - Kordai - Bishkek - Naryn - Torugart - border of China/Kyrgyzstan is 5,710 kilometers long.
The corridor will increase mutual trade and traffic between the Republic of Belarus, the Russian Federation, the Republic of Kazakhstan and the Kyrgyz Republic, transit of goods between Central Asia and Europe, and in the long term - transit between European countries and China. In Belarus, this road route coincides with part of the route of Pan-European Transport Corridor II “East - West”. The largest project on the route is the construction of sections of the M5 “Ural” (Moscow - Ryazan - Penza - Samara - Ufa - Chelyabinsk).
Key infrastructure projects that are expected to be implemented by 2020 on EurAsEC road route number 2 and its branches are shown in Figure 45.

Review of the t ranspor t and logis t ics sys tem of the Republ ic of Belarus
50
Figure 45: Projects on road route EurAsEC number 2
Source: Federal State Unitary Enterprise “NTSKTP”
The main direction of the EurAsEC road route number 3: the border of Poland - Brest - Minsk - Smolensk - Moscow - Ryazan - Penza - Samara - Uralsk - Aktobe - Kyzylorda - Shymkent - Taraz - Talas - Osh - Irkeshtam - the border of China is 4,715 kilometres long.
Main branches are:
– 3a. Osh - Sary -Tash - Keramik - Dzhirgatal - Dushanbe - Tursunzoda - Saryasiya -Termez - Afghan border (729 kilometres);
– 3b. Osh - Sary -Tash - Murghab - Kulma Pass - Irkeshtam - border of China (262 kilometres).
The corridor is designed to increase mutual trade and traffic between Central Asia and Europe and - in the long term - transit between European countries, Afghanistan and China through the territory of the EurAsEC member countries. In Belarus this road route also coincides with part of the route of the Pan-European Transport Corridor II “East - West”. The most ambitious project on this route is construction of sections of the motorway Western Europe - Western China in Kazakhstan (Figure 46).
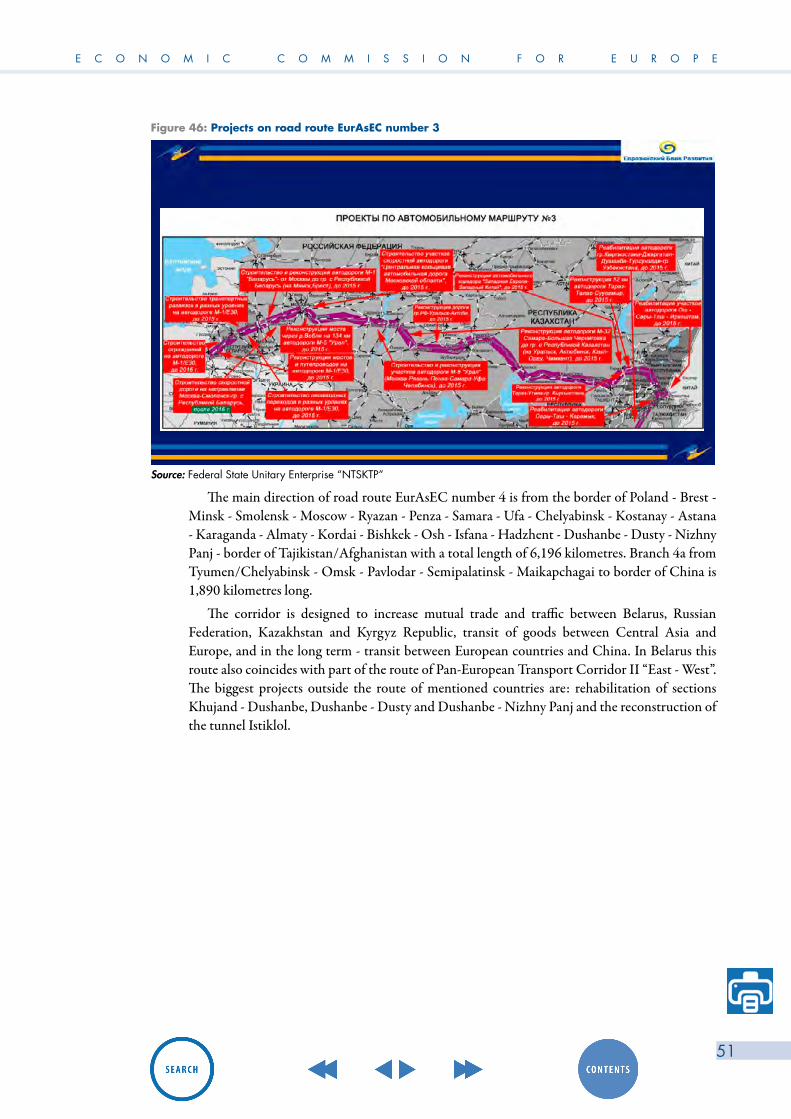
E C O N O M I C C O M M I S S I O N F O R E U R O P E
51
Figure 46: Projects on road route EurAsEC number 3
Source: Federal State Unitary Enterprise “NTSKTP”
The main direction of road route EurAsEC number 4 is from the border of Poland - Brest - Minsk - Smolensk - Moscow - Ryazan - Penza - Samara - Ufa - Chelyabinsk - Kostanay - Astana - Karaganda - Almaty - Kordai - Bishkek - Osh - Isfana - Hadzhent - Dushanbe - Dusty - Nizhny Panj - border of Tajikistan/Afghanistan with a total length of 6,196 kilometres. Branch 4a from Tyumen/Chelyabinsk - Omsk - Pavlodar - Semipalatinsk - Maikapchagai to border of China is 1,890 kilometres long.
The corridor is designed to increase mutual trade and traffic between Belarus, Russian Federation, Kazakhstan and Kyrgyz Republic, transit of goods between Central Asia and Europe, and in the long term - transit between European countries and China. In Belarus this route also coincides with part of the route of Pan-European Transport Corridor II “East - West”. The biggest projects outside the route of mentioned countries are: rehabilitation of sections Khujand - Dushanbe, Dushanbe - Dusty and Dushanbe - Nizhny Panj and the reconstruction of the tunnel Istiklol.

Review of the t ranspor t and logis t ics sys tem of the Republ ic of Belarus
52
Source: Federal State Unitary Enterprise “NTSKTP”
The program “Roads of Belarus” for 2006-2015, approved by the Government, provides for the implementation of measures aimed at further development of transit potential of the country’s road network and increasing its attractiveness to foreign users.
Of particular importance is the development of roads on the routes of the Trans-European transport corridors. In 2008, work on capital and current repair was undertaken on 683 km of roads included in these important international routes. Bearing capacity of road surfaces was increased to the European standard of 11.5 tons per single axle on 278 kilometres of roads along the routes.
In the future, implementation of large-scale projects is envisaged to provide further incremental development of roads on transport corridors and major international routes crossing the territory of Belarus. Reconstruction and repair of many sections of the road M-8/E95: border of Russia (Ezerische) - Vitebsk - Gomel - the border of Ukraine (New Guta) has been also envisaged.
In 2013, it was planned to complete the reconstruction of 53 kilometres section of road on the branch of the transport corridor IXB on the site Puhovichi - Bobruisk. Furthermore, it has been planned to reconstruct areas Zhlobin - Gomel (work to be completed in 2014) and Bobruisk - Zhlobin (to be completed in 2015) with a total length of 162 kilometres. As the result of this infrastructure projects, all the roads on the international transport corridors will be able to allow the passage of vehicles with the requirements of the EU 96/53/SE with a single axle load of 11.5 tons.
Given the steady increase of traffic on the roads M-3 Minsk - Vitebsk, M-6/E-28 Minsk - Grodno, Minsk M- 7/E-28 - Oshmjany - Lithuanian border, reconstruction and modernization of some sections of these roads are required. It has been planned to execute reconstruction of motorways M-3 Minsk - Vitebsk, M-6/E-28 Minsk - Grodno, and M-7/E-28 Minsk - Oshmjany - Lithuanian border with the overall length of 268 kilometres with the category I parameters with bypasses, as well as other projects to ensure local transport and pedestrian links. Roads M- 3 Minsk - Vitebsk and M-6/E-28 Minsk – Grodno will also be modernized in total length of 133 kilometres which will correspond to the category II parameters with extended curb and performance measures for the road safety.
Figure 47: Projects on road route EurAsEC N°4
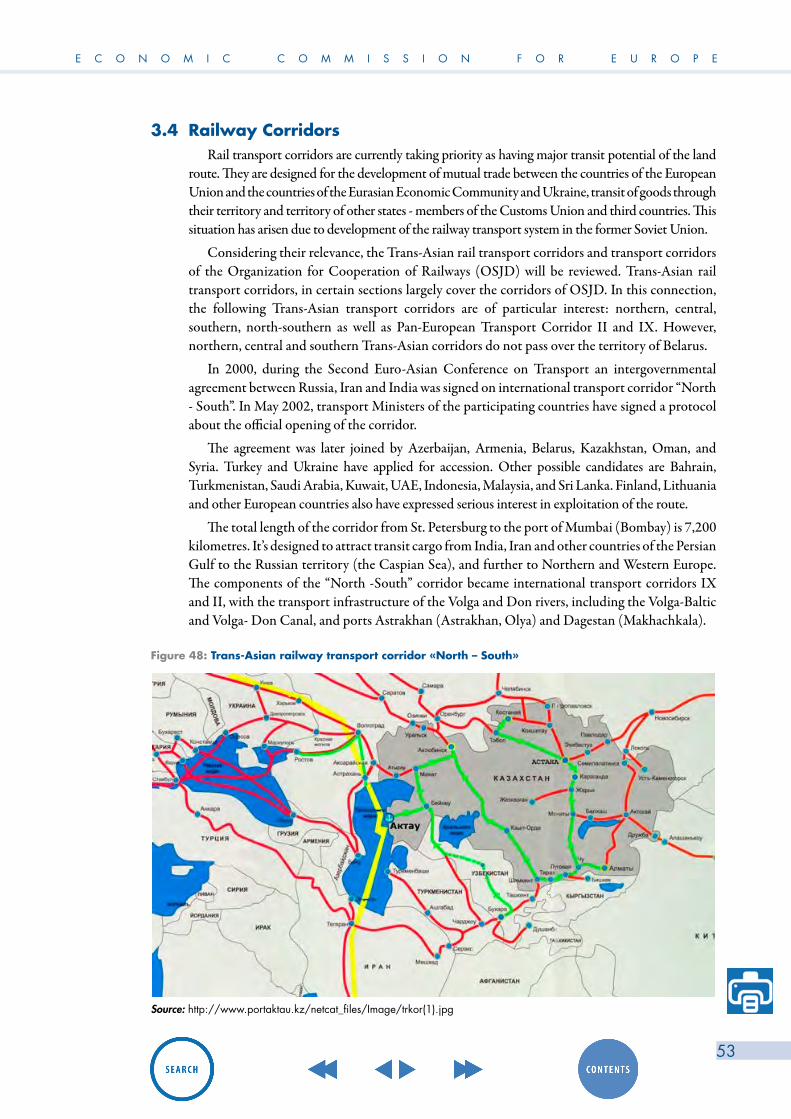
E C O N O M I C C O M M I S S I O N F O R E U R O P E
53
3.4 Railway CorridorsRail transport corridors are currently taking priority as having major transit potential of the land
route. They are designed for the development of mutual trade between the countries of the European Union and the countries of the Eurasian Economic Community and Ukraine, transit of goods through their territory and territory of other states - members of the Customs Union and third countries. This situation has arisen due to development of the railway transport system in the former Soviet Union.
Considering their relevance, the Trans-Asian rail transport corridors and transport corridors of the Organization for Cooperation of Railways (OSJD) will be reviewed. Trans-Asian rail transport corridors, in certain sections largely cover the corridors of OSJD. In this connection, the following Trans-Asian transport corridors are of particular interest: northern, central, southern, north-southern as well as Pan-European Transport Corridor II and IX. However, northern, central and southern Trans-Asian corridors do not pass over the territory of Belarus.
In 2000, during the Second Euro-Asian Conference on Transport an intergovernmental agreement between Russia, Iran and India was signed on international transport corridor “North - South”. In May 2002, transport Ministers of the participating countries have signed a protocol about the official opening of the corridor.
The agreement was later joined by Azerbaijan, Armenia, Belarus, Kazakhstan, Oman, and Syria. Turkey and Ukraine have applied for accession. Other possible candidates are Bahrain, Turkmenistan, Saudi Arabia, Kuwait, UAE, Indonesia, Malaysia, and Sri Lanka. Finland, Lithuania and other European countries also have expressed serious interest in exploitation of the route.
The total length of the corridor from St. Petersburg to the port of Mumbai (Bombay) is 7,200 kilometres. It’s designed to attract transit cargo from India, Iran and other countries of the Persian Gulf to the Russian territory (the Caspian Sea), and further to Northern and Western Europe. The components of the “North -South” corridor became international transport corridors IX and II, with the transport infrastructure of the Volga and Don rivers, including the Volga-Baltic and Volga- Don Canal, and ports Astrakhan (Astrakhan, Olya) and Dagestan (Makhachkala).
Figure 48: Trans-Asian railway transport corridor «North – South»
Source: http://www.portaktau.kz/netcat_files/Image/trkor(1).jpg

Review of the t ranspor t and logis t ics sys tem of the Republ ic of Belarus
54
The «North-South» route is based on the powerful and extensive transport network of Russia, Iran, Kazakhstan and other countries. Most parts of the corridor “North - South” are operated by Russian Railways, accounting to 33- 53 per cent of the total length of the corridor, depending on route. The pivotal direction for the Russian side is: Buslovskaya - St. Petersburg - Moscow - Ryazan - Kochetovka - Rtishchevo - Saratov - Volgograd – Astrakhan, with the total length of 2,513 kilometres.
The goals for creation of the international transport corridor “North - South” are:
– To improve the efficiency of transport links to carry out passengers and goods transport in north –south direction;
– To promote access to the international market of rail, road, sea, river and air transport of states-parties of agreement;
– To facilitate increasing volume of international passengers and goods transport;
– To ensure the security of vehicles, safety of goods and environmental protection according to international standards;
– To harmonize transport policies and legal regulation in the sphere of transport;
– To establish non-discriminatory access conditions for transport providers by various modes of transport within the corridor.
The main advantage of “North - South” corridor over the other routes (in particular, the sea route via the Suez Canal) is that it reduces transport distance by two or more times. In this case, containers transport costs from Germany and Finland to India will be significantly lower than the costs of transportation by sea route.
Different itineraries for goods transport by the “North - South” corridor are possible using different modes of transport:
– Trans-Caspian: through the ports of Astrakhan, Olya, and Makhachkala. The railways deliver cargo to ports and take on export freight from the ports;
– On the eastern branch of the corridor, a direct rail traffic through Kazakhstan, Uzbekistan and Turkmenistan, with access to the railway network of Iran’s border crossing Valley - Sarahs;
– On the western branch of the corridor, the direction of Astrakhan - Makhachkala - Samura, over the territory of Azerbaijan with access to Iran through Astara border station. Through, or from the territory of Azerbaijan and Armenia to Samura, with access to Iran through the border station of Julfa.
According to experts, the market for freight traffic on “North - South” corridor is estimated at 25-26 million tonnes by 2015.
At this stage, major traffic along the “North -South” corridor is in the direction from south to north for the transport of goods from India to Russia. Transit traffic from north to south along the corridor in India is virtually absent, and in Russia it’s accu ulating a significant a ount of e pty containers of Indian co panies, ainly due to lack of reverse flow of goods from Russia towards India.
Pan-European transport corridor II
The 1,830 kilometres long Pan-European transport corridor II, which runs from Berlin via Warsaw, Minsk, and Moscow to Nizhny Novgorod, is of particular interest. This corridor is essential not only for Russia and Belarus, but also for other members of the EurAsEC, providing transit from the Asia-Pacific region, as well as for the import and export of goods to Western Europe. Using this corridor, Kazakh and Russian transporters move cargo in directions China -

E C O N O M I C C O M M I S S I O N F O R E U R O P E
55
Western Europe, transporting Chinese, Japanese, Korean, Malaysian, Indonesian, Singaporean, Thai, and goods from other countries. For many years transport corridor Moscow - Yekaterinburg - Omsk - Novosibirsk - Irkutsk has been developed in this direction with access to the ports of Nakhodka and Busan, as well as Zabaikalsk, Grodekovo and Naushky in China. The opportunity to significantly reduce transport distances between China and Kazakhstan became possible with the opening of the railway border crossing Alashankou-Druzhba in 1992. Thus, the distance from the port of Lianyungang (China) to Moscow through the Druzhba station is 670 kilometres shorter than by station Naushky and 860 km shorter than via Hong Kong. In addition, this route also carries traffic of traditionally exported goods of those countries - cotton and oil from Kyrgyzstan, Tajikistan, Turkmenistan and Uzbekistan to Moscow and then on the Second Crete corridor to Europe.
Pan-European transport corridor IX
Pan-European corridor IX passes through Finland, Lithuania, Belarus, Russia, Ukraine, Moldova, Romania, Bulgaria and Greece. It is the longest of all Pan-European corridors with a length of about 3 400 kilometres.The main route is Helsinki - Buslovskaya - St. Petersburg - Moscow - Suzemka - Kiev - Lyubashevka - Chisinau - Bucharest - Sofia – Alexandroupolis. Major sub-alignment is St. Petersburg-Moscow- Kiev with branch A- Klaipeda-Vilnius- Minsk-Gomel; branch B-Kaliningrad-Vilnius-Minsk– Gomel and branch C - Ljubashevka-Rozdilna-Odessa.
In conjunction with the Pan-European transport corridor II, corridor IX has a huge potential in providing transport links between Europe and Asia. The northern part of the corridor IX, Helsinki - St. Petersburg - Moscow and Kaliningrad - Minsk - Kiev - Moscow provide an outlet to European countries towards Far East and the Asia- Pacific region, Central Asia, the Caucasus, Iran and other countries of the Persian Gulf, as well as Pakistan and India. The main emphasis is on the development and strengthening of route Moskow - Bryansk - Suzemka which provides a link to the railways of Ukraine.
3.5 OSJD transport routesVarious studies show that the share of international transport in total freight traffic by rail in
Russian Federation is about 90.0 per cent, in Kazakhstan up to 72.0 per cent, Belarus 87.0 per cent, and in Ukraine about 70.0 per cent. Most freight in the direction Europe-Asia is carried by corridors of the Organization for Cooperation of Railways (OSJD).
OSJD is an international organization established in 1956, at the meeting of Ministers of rail transport. Its main objectives are to develop international cargo and passenger rail transport, create a common rail transport space in the Eurasian region, improve the competitiveness of transcontinental railroad lines, as well as to promote technological progress and scientific and technical cooperation in the field of railway transport.
As an intergovernmental organization, OSJD involves in its activities 27 countries: Albania, Azerbaijan, Belarus, Bulgaria, Hungary, Vietnam, Georgia, Iran, Kazakhstan, China, North Korea, Cuba, Kyrgyzstan, Latvia, Lithuania, Moldova, Mongolia, Poland, Romania, Russia, Slovakia, Tajikistan, Turkmenistan, Uzbekistan, Ukraine, Czech Republic and Estonia. German, French, Greek, Finnish, and Serbian Railways participate as observers.
Transport of goods and passengers is carried along thirteen OSJD corridors, and only two of these pass through the territory of the Republic of Belarus: № 1 and № 9.
OSJD corridor number 1 - the longest corridor in the world – stretches across the territory of Poland, Latvia, Lithuania, Estonia, Belarus, Russia, Kazakhstan, Uzbekistan, China, Mongolia,

Review of the t ranspor t and logis t ics sys tem of the Republ ic of Belarus
56
and North Korea. Its length with all branches reaches 24,800 kilometres. Corridor serves participating countries in mutual exchange, as well as for transport to third countries. The length of the corridor on the territory of Belarus is 608 km.
Figure 49: Scheme of OSJD transport corridor number 1
Source: hppt://osjd.org
OSJD corridor 1 coincides with the Trans-Siberian corridor on the territory of the Russian Federation. For decades this rail “highway” has been the main artery of the Russian railways, linking European part of the Russian Federation with the industrial regions of Siberia, the Urals and the Far East. Construction of 9 288 kilometres long railway was completed in 1903, and the whole network was electrified by 2002. Trans-Siberian railway line is associated with the Chinese, North Korean, and Mongolian railways. In the Central Eurasian region it is connected with the railways of Central Asia through Kazakhstan, in the European part, with Western Europe via Belarus. Technical capabilities now allow Trans-Siberian Railways (TSR) to carry up to 250 000 - 300 000 TEU in international transit. In the future, the volume of transit traffic could be increased up to 1 million TEU per year taking into account the complete modernization of railway and the use of Baikal-Amur Mainline (BAM). Until 2015, Joint Stock Company “Russian Railways” will invest about US$ 1.5 billion to further modernize Trans-Siberian corridor by optimizing its throughput capacity for special container trains.
Technical capacity allows TSR to carry volume of about 100 million tons of cargo per year, including international transit of 200 000 TEU containers from Asia Pacific, Europe and Central Asia. Currently, TSR runs 15 container trains. The travel time of trains on specific routes ranges from 12.5 days from station Nahodka towards East to Brest, to Buslovskaya station from 9.5 to11.5 days, to Berlin 14.5 days, border crossings station Chop in 13.5 days, Lokot 8 days, Naushky 5 days, Avtovo 9.5 days, while from station Zabaykalsk to Moscow it takes 12 days, and to Smolensk 13 days.
The speed of fast container trains on the Trans-Siberian Railway is about 1 200 kilometers per day. In order to reduce the transit time spent by containers in ports and at border crossings, simplified customs procedures have been introduced, reducing the time spent in stations from 3 to 5 days to several hours only. The simplified procedure for customs clearance and control of goods in transit in containers positively affects time for delivery of containers going to third countries in all directions.
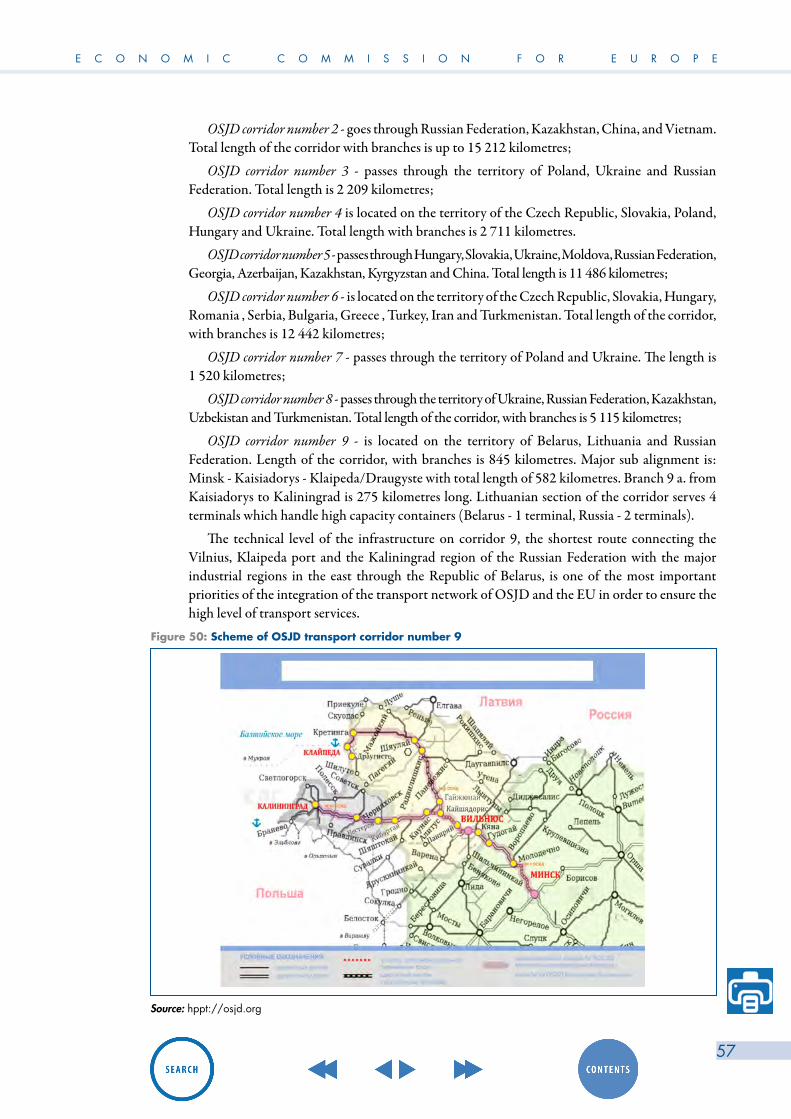
E C O N O M I C C O M M I S S I O N F O R E U R O P E
57
OSJD corridor number 2 - goes through Russian Federation, Kazakhstan, China, and Vietnam. Total length of the corridor with branches is up to 15 212 kilometres;
OSJD corridor number 3 - passes through the territory of Poland, Ukraine and Russian Federation. Total length is 2 209 kilometres;
OSJD corridor number 4 is located on the territory of the Czech Republic, Slovakia, Poland, Hungary and Ukraine. Total length with branches is 2 711 kilometres.
OSJD corridor number 5 - passes through Hungary, Slovakia, Ukraine, Moldova, Russian Federation, Georgia, Azerbaijan, Kazakhstan, Kyrgyzstan and China. Total length is 11 486 kilometres;
OSJD corridor number 6 - is located on the territory of the Czech Republic, Slovakia, Hungary, Romania , Serbia, Bulgaria, Greece , Turkey, Iran and Turkmenistan. Total length of the corridor, with branches is 12 442 kilometres;
OSJD corridor number 7 - passes through the territory of Poland and Ukraine. The length is 1 520 kilometres;
OSJD corridor number 8 - passes through the territory of Ukraine, Russian Federation, Kazakhstan, Uzbekistan and Turkmenistan. Total length of the corridor, with branches is 5 115 kilometres;
OSJD corridor number 9 - is located on the territory of Belarus, Lithuania and Russian Federation. Length of the corridor, with branches is 845 kilometres. Major sub alignment is: Minsk - Kaisiadorys - Klaipeda/Draugyste with total length of 582 kilometres. Branch 9 a. from Kaisiadorys to Kaliningrad is 275 kilometres long. Lithuanian section of the corridor serves 4 terminals which handle high capacity containers (Belarus - 1 terminal, Russia - 2 terminals).
The technical level of the infrastructure on corridor 9, the shortest route connecting the Vilnius, Klaipeda port and the Kaliningrad region of the Russian Federation with the major industrial regions in the east through the Republic of Belarus, is one of the most important priorities of the integration of the transport network of OSJD and the EU in order to ensure the high level of transport services.
Figure 50: Scheme of OSJD transport corridor number 9
Source: hppt://osjd.org
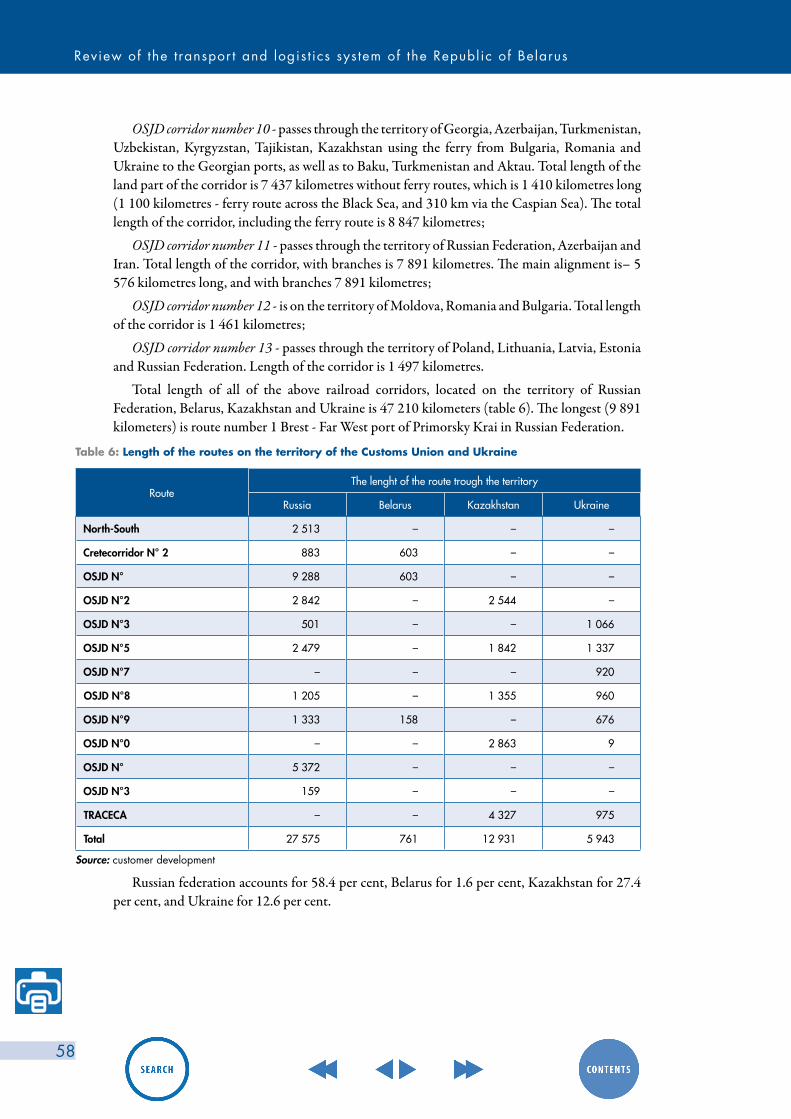
Review of the t ranspor t and logis t ics sys tem of the Republ ic of Belarus
58
OSJD corridor number 10 - passes through the territory of Georgia, Azerbaijan, Turkmenistan, Uzbekistan, Kyrgyzstan, Tajikistan, Kazakhstan using the ferry from Bulgaria, Romania and Ukraine to the Georgian ports, as well as to Baku, Turkmenistan and Aktau. Total length of the land part of the corridor is 7 437 kilometres without ferry routes, which is 1 410 kilometres long (1 100 kilometres - ferry route across the Black Sea, and 310 km via the Caspian Sea). The total length of the corridor, including the ferry route is 8 847 kilometres;
OSJD corridor number 11 - passes through the territory of Russian Federation, Azerbaijan and Iran. Total length of the corridor, with branches is 7 891 kilometres. The main alignment is– 5 576 kilometres long, and with branches 7 891 kilometres;
OSJD corridor number 12 - is on the territory of Moldova, Romania and Bulgaria. Total length of the corridor is 1 461 kilometres;
OSJD corridor number 13 - passes through the territory of Poland, Lithuania, Latvia, Estonia and Russian Federation. Length of the corridor is 1 497 kilometres.
Total length of all of the above railroad corridors, located on the territory of Russian Federation, Belarus, Kazakhstan and Ukraine is 47 210 kilometers (table 6). The longest (9 891 kilometers) is route number 1 Brest - Far West port of Primorsky Krai in Russian Federation.
Table 6: Length of the routes on the territory of the Customs Union and Ukraine
RouteThe lenght of the route trough the territory
Russia Belarus Kazakhstan Ukraine
North-South 2 513 – – –
Cretecorridor N° 2 883 603 – –
OSJD N° 9 288 603 – –
OSJD N°2 2 842 – 2 544 –
OSJD N°3 501 – – 1 066
OSJD N°5 2 479 – 1 842 1 337
OSJD N°7 – – – 920
OSJD N°8 1 205 – 1 355 960
OSJD N°9 1 333 158 – 676
OSJD N°0 – – 2 863 9
OSJD N° 5 372 – – –
OSJD N°3 159 – – –
TRACECA – – 4 327 975
Total 27 575 761 12 931 5 943
Source: customer development
Russian federation accounts for 58.4 per cent, Belarus for 1.6 per cent, Kazakhstan for 27.4 per cent, and Ukraine for 12.6 per cent.
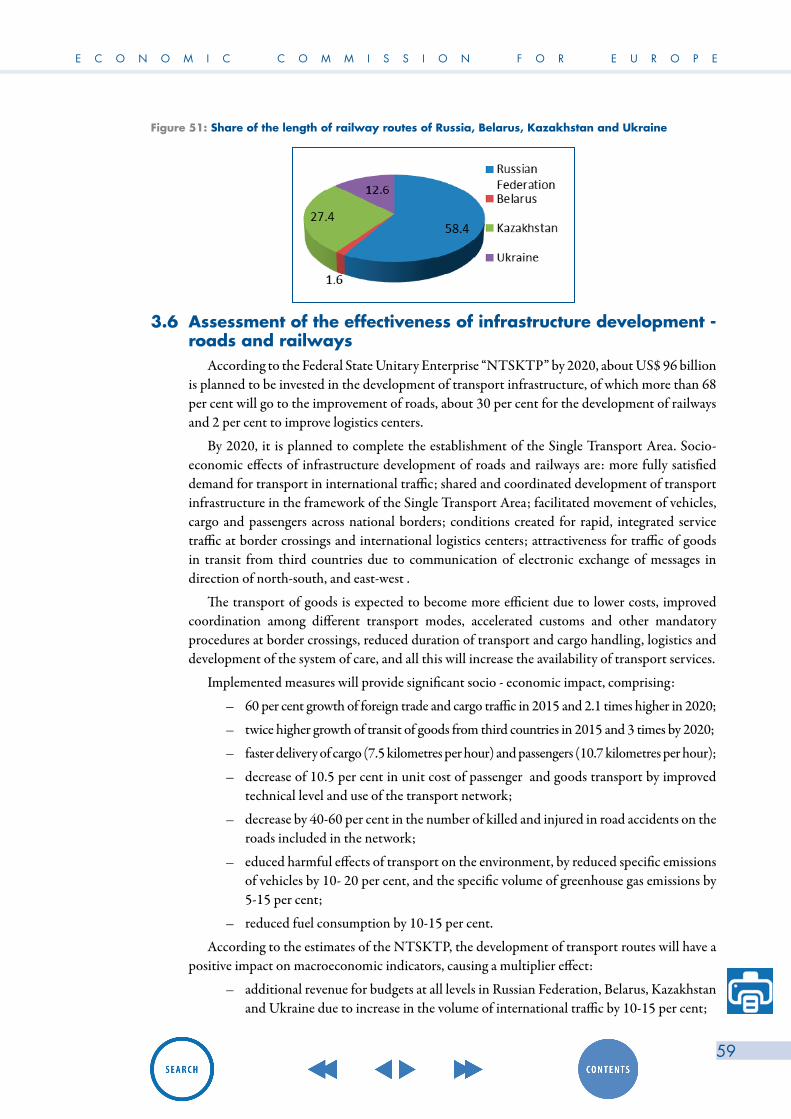
E C O N O M I C C O M M I S S I O N F O R E U R O P E
59
Figure 51: Share of the length of railway routes of Russia, Belarus, Kazakhstan and Ukraine
3.6 Assessment of the effectiveness of infrastructure development - roads and railways
According to the Federal State Unitary Enterprise “NTSKTP” by 2020, about US$ 96 billion is planned to be invested in the development of transport infrastructure, of which more than 68 per cent will go to the improvement of roads, about 30 per cent for the development of railways and 2 per cent to improve logistics centers.
By 2020, it is planned to complete the establishment of the Single Transport Area. Socio- economic effects of infrastructure development of roads and railways are: more fully satisfied demand for transport in international traffic; shared and coordinated development of transport infrastructure in the framework of the Single Transport Area; facilitated movement of vehicles, cargo and passengers across national borders; conditions created for rapid, integrated service traffic at border crossings and international logistics centers; attractiveness for traffic of goods in transit from third countries due to communication of electronic exchange of messages in direction of north-south, and east-west .
The transport of goods is expected to become more efficient due to lower costs, improved coordination among different transport modes, accelerated customs and other mandatory procedures at border crossings, reduced duration of transport and cargo handling, logistics and development of the system of care, and all this will increase the availability of transport services.
Implemented measures will provide significant socio - economic impact, comprising:
– 60 per cent growth of foreign trade and cargo traffic in 2015 and 2.1 times higher in 2020;
– twice higher growth of transit of goods from third countries in 2015 and 3 times by 2020;
– faster delivery of cargo (7.5 kilometres per hour) and passengers (10.7 kilometres per hour);
– decrease of 10.5 per cent in unit cost of passenger and goods transport by improved technical level and use of the transport network;
– decrease by 40-60 per cent in the number of killed and injured in road accidents on the roads included in the network;
– educed harmful effects of transport on the environment, by reduced specific emissions of vehicles by 10- 20 per cent, and the specific volume of greenhouse gas emissions by 5-15 per cent;
– reduced fuel consumption by 10-15 per cent.
According to the estimates of the NTSKTP, the development of transport routes will have a positive impact on macroeconomic indicators, causing a multiplier effect:
– additional revenue for budgets at all levels in Russian Federation, Belarus, Kazakhstan and Ukraine due to increase in the volume of international traffic by 10-15 per cent;
Review of the t ranspor t and logis t ics sys tem of the Republ ic of Belarus
60
– employment in transport, logistics and related sectors of the economy will increase by 2.4 per cent;
– production in industry and agriculture and the service sector will increase by 5 – 7 per cent;
– transport component in the price of exports and imports will decline by 10-14 per cent depending on the type of cargo, the country and the mode of transport;
– increased volume of cross-border trade by 10-15 per cent. .
In general, the development of the road and railway infrastructure included in the list of transport routes, can be considered as a contribution to removal of trade barriers and will encourage economic integration of the States in the Common Economic Space.
3.7 Inland water transportInland waterway transport comprises the transport of goods along the rivers of the Republic
of Belarus and the international traffic on the Dnepr River in the Black Sea ports, design, construction and repair of vessels of classes “R” and “O”, maintenance of waterways, extraction of non-mineral building materials.
Main cargo carried by the Belarusian river fleet, are sand and sand- gravel, crushed stone and gravel, timber, potash, granulated slag, as well as oversized and heavy cargo.
Transportation and transshipment involves 10 ports located in the cities of Brest, Pinsk, Mikashevichy, Mozyr, Rechica, Gomel, Mogilev, Bobruisk, Vitebsk, and Grodno. Ports Mozyr, Gomel and Bobruisk have railway sidings. Total turnover of the ports is 15 million tonnes.
The main legislation governing the technical, legal, organizational, and operational aspects of inland navigation transport is the Code of Inland Water Transport of the Republic of Belarus (2002).
Inland waterways of Belarus, including the Dnieper- Bug Canal, are part of the main international waterway E- 40 from Gdansk through Pinsk to Kherson. As part of the waterway of the Dnieper -Vistula -Oder, in the long term they can serve the purposes of international trade between the East and the West.
For the organization of navigation in this area, authorities are considering the issue of restoration of waterways between river Muhovets and river Visla that will lead to the intense flow of goods from the ports of the Black Sea along the Dnieper and Pripyat, as well as Dnieper- Bug Canal with further access to the Vistula-Oder waterway system and the Baltic Sea. The Dnieper- Bug Canal is currently under reconstruction.
The Republic of Belarus, as a landlocked country, has no direct access to the sea. Therefore, delivery of export cargo by sea is via the sea ports of the Baltic States, Ukraine and the Russian Federation. Belarusian freight forwarding companies engaged in the carriage of goods by sea work with leased and chartered vessels.
The total traffic of Belarusian export of goods through the ports in 2011 amounted to about 16.7 million tonnes.
Office of Maritime and River Transport registers ships in the State Register, and issues national identity cards to seaman in accordance with the Merchant Shipping Code of the Republic of Belarus.
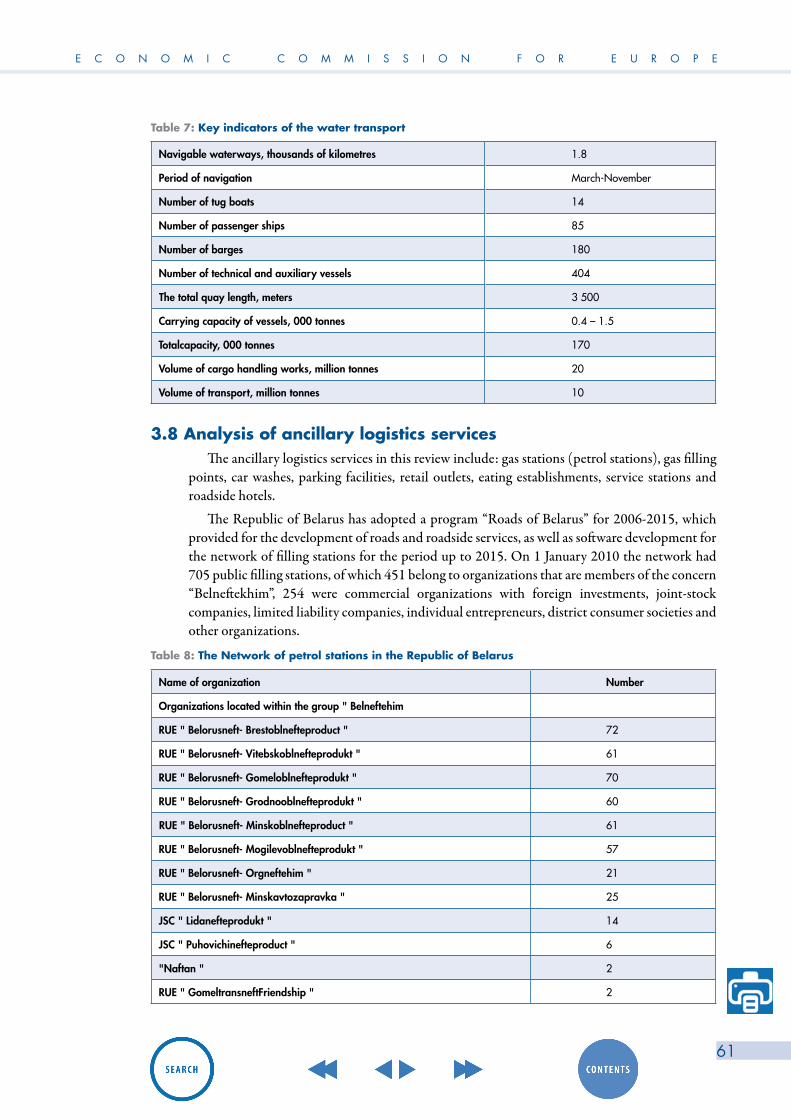
E C O N O M I C C O M M I S S I O N F O R E U R O P E
61
Table 7: Key indicators of the water transport
Navigable waterways, thousands of kilometres 1.8
Period of navigation March-November
Number of tug boats 14
Number of passenger ships 85
Number of barges 180
Number of technical and auxiliary vessels 404
The total quay length, meters 3 500
Carrying capacity of vessels, 000 tonnes 0.4 – 1.5
Totalcapacity, 000 tonnes 170
Volume of cargo handling works, million tonnes 20
Volume of transport, million tonnes 10
3.8 Analysis of ancillary logistics servicesThe ancillary logistics services in this review include: gas stations (petrol stations), gas filling
points, car washes, parking facilities, retail outlets, eating establishments, service stations and roadside hotels.
The Republic of Belarus has adopted a program “Roads of Belarus” for 2006-2015, which provided for the development of roads and roadside services, as well as software development for the network of filling stations for the period up to 2015. On 1 January 2010 the network had 705 public filling stations, of which 451 belong to organizations that are members of the concern “Belneftekhim”, 254 were commercial organizations with foreign investments, joint-stock companies, limited liability companies, individual entrepreneurs, district consumer societies and other organizations.
Table 8: The Network of petrol stations in the Republic of Belarus
Name of organization Number
Organizations located within the group " Belneftehim
RUE " Belorusneft- Brestoblnefteproduct " 72
RUE " Belorusneft- Vitebskoblnefteprodukt " 61
RUE " Belorusneft- Gomeloblnefteprodukt " 70
RUE " Belorusneft- Grodnooblnefteprodukt " 60
RUE " Belorusneft- Minskoblnefteproduct " 61
RUE " Belorusneft- Mogilevoblnefteprodukt " 57
RUE " Belorusneft- Orgneftehim " 21
RUE " Belorusneft- Minskavtozapravka " 25
JSC " Lidanefteprodukt " 14
JSC " Puhovichinefteproduct " 6
"Naftan " 2
RUE " GomeltransneftFriendship " 2
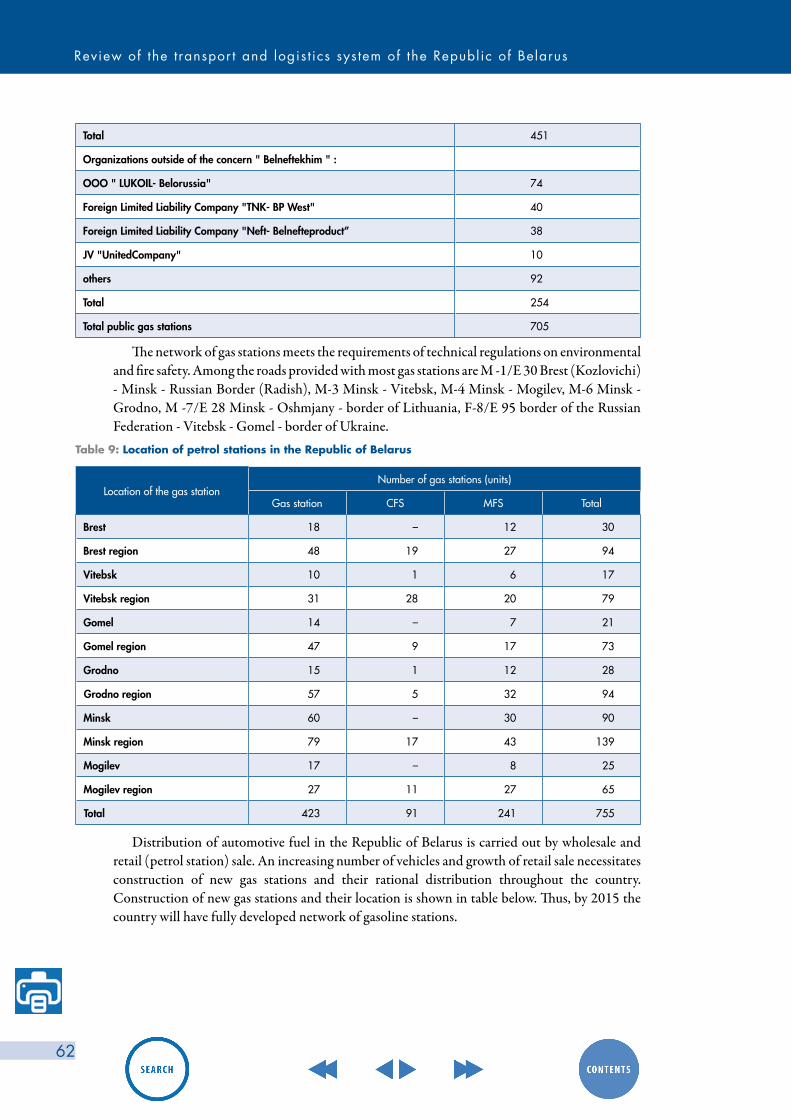
Review of the t ranspor t and logis t ics sys tem of the Republ ic of Belarus
62
The network of gas stations meets the requirements of technical regulations on environmental and fire safety. Among the roads provided with most gas stations are M -1/E 30 Brest (Kozlovichi) - Minsk - Russian Border (Radish), M-3 Minsk - Vitebsk, M-4 Minsk - Mogilev, M-6 Minsk - Grodno, M -7/E 28 Minsk - Oshmjany - border of Lithuania, F-8/E 95 border of the Russian Federation - Vitebsk - Gomel - border of Ukraine.
Total 451
Organizations outside of the concern " Belneftekhim " :
OOO " LUKOIL- Belorussia" 74
Foreign Limited Liability Company "TNK- BP West" 40
Foreign Limited Liability Company "Neft- Belnefteproduct” 38
JV "UnitedCompany" 10
others 92
Total 254
Total public gas stations 705
Table 9: Location of petrol stations in the Republic of Belarus
Location of the gas stationNumber of gas stations (units)
Gas station CFS MFS Total
Brest 18 – 12 30
Brest region 48 19 27 94
Vitebsk 10 1 6 17
Vitebsk region 31 28 20 79
Gomel 14 – 7 21
Gomel region 47 9 17 73
Grodno 15 1 12 28
Grodno region 57 5 32 94
Minsk 60 – 30 90
Minsk region 79 17 43 139
Mogilev 17 – 8 25
Mogilev region 27 11 27 65
Total 423 91 241 755
Distribution of automotive fuel in the Republic of Belarus is carried out by wholesale and retail (petrol station) sale. An increasing number of vehicles and growth of retail sale necessitates construction of new gas stations and their rational distribution throughout the country. Construction of new gas stations and their location is shown in table below. Thus, by 2015 the country will have fully developed network of gasoline stations.
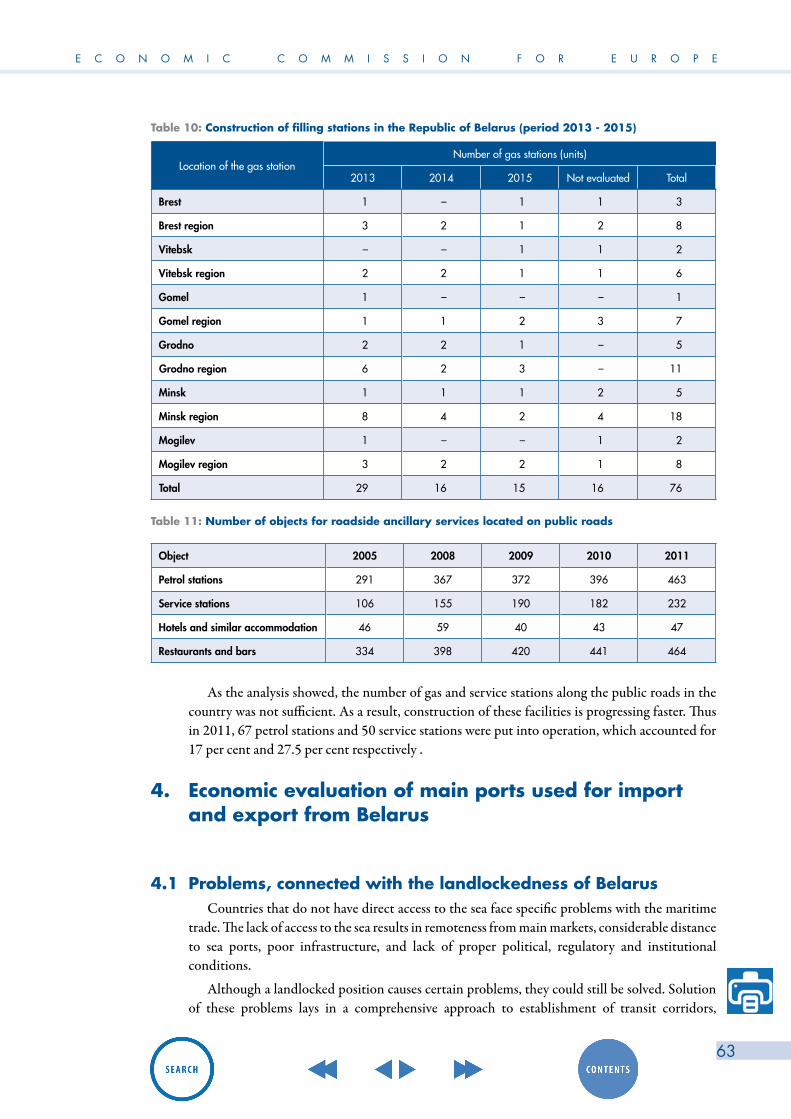
E C O N O M I C C O M M I S S I O N F O R E U R O P E
63
Table 10: Construction of filling stations in the Republic of Belarus (period 2013 - 2015)
Location of the gas stationNumber of gas stations (units)
2013 2014 2015 Not evaluated Total
Brest 1 – 1 1 3
Brest region 3 2 1 2 8
Vitebsk – – 1 1 2
Vitebsk region 2 2 1 1 6
Gomel 1 – – – 1
Gomel region 1 1 2 3 7
Grodno 2 2 1 – 5
Grodno region 6 2 3 – 11
Minsk 1 1 1 2 5
Minsk region 8 4 2 4 18
Mogilev 1 – – 1 2
Mogilev region 3 2 2 1 8
Total 29 16 15 16 76
Table 11: Number of objects for roadside ancillary services located on public roads
Object 2005 2008 2009 2010 2011
Petrol stations 291 367 372 396 463
Service stations 106 155 190 182 232
Hotels and similar accommodation 46 59 40 43 47
Restaurants and bars 334 398 420 441 464
As the analysis showed, the number of gas and service stations along the public roads in the country was not sufficient. As a result, construction of these facilities is progressing faster. Thus in 2011, 67 petrol stations and 50 service stations were put into operation, which accounted for 17 per cent and 27.5 per cent respectively .
4. Economic evaluation of main ports used for import and export from Belarus
4.1 Problems, connected with the landlockedness of BelarusCountries that do not have direct access to the sea face specific problems with the maritime
trade. The lack of access to the sea results in remoteness from main markets, considerable distance to sea ports, poor infrastructure, and lack of proper political, regulatory and institutional conditions.
Although a landlocked position causes certain problems, they could still be solved. Solution of these problems lays in a comprehensive approach to establishment of transit corridors,

Review of the t ranspor t and logis t ics sys tem of the Republ ic of Belarus
64
development of regional integration, reorganization of regulatory and legal framework, fundamental and administrative reforms, specific mechanisms for international protection, as well as in analysis of foreign trade structure for each landlocked country, and its consistency from the point of view of transportation challenges.
The following factors are main problems which result from the lack of access to the sea:
Geographical location - High transport costs, caused by imperfect infrastructure and various fees, charges and procedures required in transit country increase the cost of the goods delivery, thus adding pressure to build up significant stocks of goods. This, in its turn, puts the biggest obstacle to the entry of Belarus commodities to the world markets on equal terms, and leads to the loss of its competitiveness. Development of necessary infrastructure will solve this problem: road and railroad traffic and services and river ports will greatly ease the question of geographical distance, implying a rather high level of cooperation with the country of transit.
Infrastructure weaknesses - Cost increase due to Belarus’s landlocked location associated with limited capacity to handle flow of goods, low containerization, insufficient development of cargo handling equipment, and, at the same time, lack of infrastructure in the countries with sea ports. Development of joint investment projects with foreign states in order to improve existing infrastructure will solve this problem.
Necessity to cross borders - The necessity to cross borders considerably increases total amount of costs and formalities that foreign traders have to pay. Researches shows, that costs of one-time border crossing correspond to transport costs for 4 000 kilometres of sea shipping. There are basic rules how this problem could be solved: by simplification of custom procedures; by harmonization of documents circulation and exchange; by adoption of electric processing of documents and creation of favourable institutional conditions; by shifting commodity flows over to maritime infrastructure facilities of Customs Union countries.
Remoteness of main markets - Availability of main markets placed not far from borders, owing to low transport costs, could moderate consequences of the lack of access to the sea. Export of high value-added goods is necessitated by the lack of access to the sea. In this case, transport costs have much smaller share in the total costs and the lack of access to the sea ceases to be very important. Main recommendations to address these problems are: shift to the production of goods with high value-added, and use logistics approach in delivery of raw materials to remote regions.
Export structure - Current strategy of economic development of Belarus includes elements of labor-intensive export production. At the same time, significant proportion of price of manufactured goods is made up of imported raw materials and components, which increase transportation costs and reduce profits. In this particular case, transport costs act as an indirect tax on export earnings. Their increase significantly affects Export Development Strategy of the country. This problem could be solved by reorientation of exports to development of information technologies that can provide a greater opportunity to boost export of services such as software development, data transcription, or telematics. This will require certain technical background, but will create new opportunities for overcoming the difficulties caused by the distance.
4.2 Efficiency analysis of the main ports that are used for Belarusian export and import
Currently, export and import of Belarusian cargo is carried out through the port facilities of Lithuania, Latvia, Estonia, Ukraine and the Russian Federation. Processed volumes and the dynamics of flow of cargo are the main indicators of infrastructure facilities in the ports of
E C O N O M I C C O M M I S S I O N F O R E U R O P E
65
these countries. For the purpose of this review, statistics were collected on the work of the major regions that serve the export and import flows of the Republic of Belarus.
Baltic ports
The cargo turnover of the Baltic States ports fell by 3 per cent in the period January-July 2013 in comparison with the same period in 2012, and it amounted to 93.45 million tonnes. However, Latvian ports transshipped 45.4 per cent of all cargo during seven months of 2013, Lithuanian ports 27 per cent and Estonian ports 27.6 per cent.
The cargo turnover in Latvian ports amounted to 42.45 million tonnes (-8.2 per cent compared to January-July 2012), the turnover of the Lithuanian ports and the Estonia ports totalled 25.24 million tonnes (+4.2 per cent) and 25.76 million tonnes (-0.4 per cent) respectively. By the volume of transshipment, Riga port was in the lead with 20.27 million tonnes (-4.4 per cent). The second highest turnover was in Klaipeda port with 19.95 million tonnes (+0.1 per cent), the third was Ventspils port with 18.55 million tonnes (-4.4 per cent), followed by Tallinn port with 17.22 million tonnes (-4.1 per cent). In 2012, the Baltic ports handled 162.3 million tonnes of cargo, 46.3 per cent were handled at Latvian ports, 27.0 per cent at Lithuanian, and 26.7 per cent at Estonian ports.
Ukrainian seaports and terminals
Port enterprises of all forms of ownership, operating on the Ukrainian coast, handled 81.9 million tonnes of cargo in January-July 2013 which is 6.8 per cent less than in the same period in 2012. The largest decline was recorded in transit (-19.6 per cent). The reduction in export transshipment was 5.2 per cent to 51.4 million tons. At the same time, import of cargo increased by 8.6 per cent and exceeded 10.6 million tonnes. However, such increase is largely due to a low base of previous year, related to the public policy orientation to discourage imports. Accordingly, compared with the same period of 2011, there is still a lag (-0.9 per cent). Cabotage of freight in the coastal region showed the highest growth and increased by 1.6 times to 1.29 million tonnes.
Goods turnover in ports of the Russian Federation
Goods turnover in seaports of Russia in January-July 2013 increased by 4.5 per cent in comparison with the same period of 2012 and amounted to 334.9 million tonnes.
The volume of transshipment of dry cargoes was 142.1 million tonnes (-1.0 per cent), including: coal (57.8 million tonnes (+16.0 per cent)); freights in containers (25.5 million tonnes (+3.3 per cent); and mineral fertilizers (7.2 million tonnes (+13.7 per cent). The volume of ferrous materials was reduced to 13.2 million tonnes (-17.3 per cent), ore to 4.3 million tonnes (-3.8 per cent), timber to 2.6 million tonnes (-29.6 per cent), grain to 5.4 million tonnes (more than twice). The volume of transshipment of bulk cargoes was 192.8 million tonnes (+9.0 per cent), including crude oil (120.5 million tonnes (+8.2 per cent). The total of 262.6 million tonns of exported cargo were transferred which is 3.6 per cent more than in the same period of 2012, imported cargo 27.4 million tonnes (+7.9 per cent), transit cargo 26.7 million tonnes (+3.3 per cent), and cabotage 18.1 million tonnes (+16.3 per cent).
Dynamics of export and import flows of the Republic of Belarus
The structure of industry shows a high degree of openness of economy of the Republic of Belarus and its focus on foreign markets. More than 50.0 per cent of goods made in the country are exported.
In the last decade the dynamics of foreign trade of the Republic of Belarus has been characterized by a steady increase in volumes of commodity turnover and services. It was the result of high rates of economic growth, increase in technological and transit potential, participation
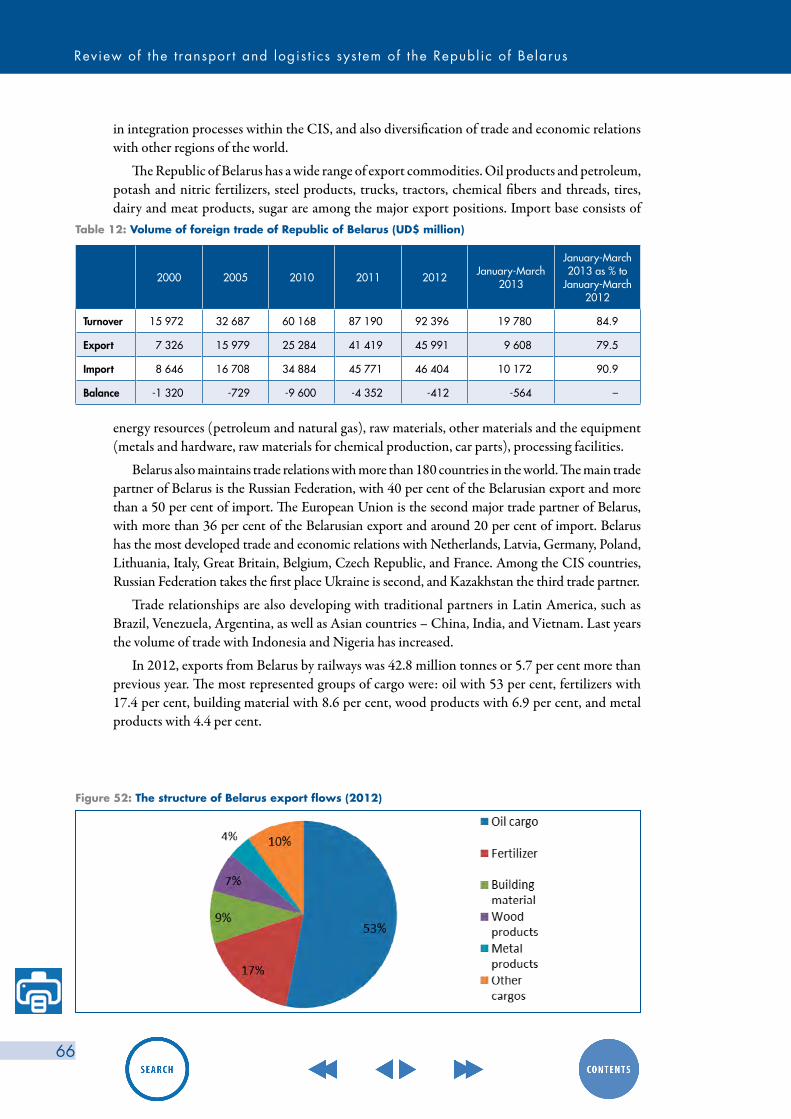
Review of the t ranspor t and logis t ics sys tem of the Republ ic of Belarus
66
in integration processes within the CIS, and also diversification of trade and economic relations with other regions of the world.
The Republic of Belarus has a wide range of export commodities. Oil products and petroleum, potash and nitric fertilizers, steel products, trucks, tractors, chemical fibers and threads, tires, dairy and meat products, sugar are among the major export positions. Import base consists of
Table 12: Volume of foreign trade of Republic of Belarus (UD$ million)
2000 2005 2010 2011 2012 January-March 2013
January-March 2013 as % to
January-March 2012
Turnover 15 972 32 687 60 168 87 190 92 396 19 780 84.9
Export 7 326 15 979 25 284 41 419 45 991 9 608 79.5
Import 8 646 16 708 34 884 45 771 46 404 10 172 90.9
Balance -1 320 -729 -9 600 -4 352 -412 -564 –
energy resources (petroleum and natural gas), raw materials, other materials and the equipment (metals and hardware, raw materials for chemical production, car parts), processing facilities.
Belarus also maintains trade relations with more than 180 countries in the world. The main trade partner of Belarus is the Russian Federation, with 40 per cent of the Belarusian export and more than a 50 per cent of import. The European Union is the second major trade partner of Belarus, with more than 36 per cent of the Belarusian export and around 20 per cent of import. Belarus has the most developed trade and economic relations with Netherlands, Latvia, Germany, Poland, Lithuania, Italy, Great Britain, Belgium, Czech Republic, and France. Among the CIS countries, Russian Federation takes the first place Ukraine is second, and Kazakhstan the third trade partner.
Trade relationships are also developing with traditional partners in Latin America, such as Brazil, Venezuela, Argentina, as well as Asian countries – China, India, and Vietnam. Last years the volume of trade with Indonesia and Nigeria has increased.
In 2012, exports from Belarus by railways was 42.8 million tonnes or 5.7 per cent more than previous year. The most represented groups of cargo were: oil with 53 per cent, fertilizers with 17.4 per cent, building material with 8.6 per cent, wood products with 6.9 per cent, and metal products with 4.4 per cent.
Figure 52: The structure of Belarus export flows (2012)

E C O N O M I C C O M M I S S I O N F O R E U R O P E
67
In 2011, the deliveries of Belarusian export products by railways to ports were 23.2 million tonnes or 2.2 per cent more than in the previous year, including 9.4 million tonnes or 11.8 per cent more to Latvia; 9.8 million tonnes or - per cent to Lithuania; 2.6 million tonnes or 39.8 per cent to Estonia, and 1.4 million tonnes or – 27.2per cent to Ukraine and Russia.
It should be mentioned, that one of the most decisive factors for choosing particular port is the traffic distance, the shortest being between Latvia and Lithuania, as well as advantageous rail tariffs on Latvian and Lithuanian railways. Thus, delivery distance of cargo from Belarusian state potash producer PC «Belaruskali» from station Kali III to the port of Klaipeda is 703 kilometres, and to the port of Ust-Luga is 1,100 kilometres.
In March 2013, an analysis of the traffic of Belarusian export cargo to the Baltic ports showed the following result:
1. Oil products of «NAFTAN» to the port of Ust-Luga, compared to:
– Ventspils was US$ 22.56 per tonne higher
– Klaipeda was US$ 18.83 per tonne higher
– Tallinn was US$ 6.81 per tonne higher2. Oil products of «Masyrski petroleum refinery» to the port of Ust-Luga, compared to:
– Klaipeda was US$ 23.71 per tonne higher
– Ventspils was US$ 16.49 per tonne higher
– The cane Bay is $ 5. 69 per tonne higher;
– Tallinn was US$ 2. 26 per tonne lower;3. Potash fertilizers of the “PA Belaruskaliy” to Ust-Luga port compared to:
– Klaipėda was US$ 20.15 per tonne higher;
– Žovtnevuû (Ukraine) was US$ 4.96 per tonne higher;4. Ferrous metals of the “Byelorussian Steel Works” to Ust-Luga port compared to:
– Klaipėda was US$ 17.14 higher;
– Ventspils was US$ 6.69 per tonne higher;
– Odesa was US$ 15.91. per tonne higher.
Maps showing directions of cargo export to ports are shown in Annex 6. Export of major products is presented in table below.
Table 13: Exports of major products
Cargo-generating point, type ofcargo
Total export,thousand ton
Including through ports
Riga Klaipeda Ventspils Odesa/Reni port Tallinn
Salihorsk, potash fertilizers 6 415 – 5 711 – 277 –
Mazyr, petroleum products 7 577 160 1 975 700 908 73
Navapolatsk, petroleum products 6 286 1 160 210 2 070 – 1 265
Zlobin, metal products 1 841 – 330 – 744 –

Review of the t ranspor t and logis t ics sys tem of the Republ ic of Belarus
68
Figure 53: Structure of export flow of cargo-generating item
Thus, to insure competitiveness of Belarusian exports through Russian ports in the Baltic Sea, it is necessary to reduce the general tariff by 35-40 per cent. In order to obtain the maximum reduction within the price range for a corridor through Russia, the Belorussian Railways are obliged to reduce tariffs for the main cargo from 55.0 to 85.0 per cent in order to level the costs of transport to Ust–Luga with those through the ports of Baltic countries. This is substantially below the lowest cost limit. The loss of the Belorussian Railway will be about US$ 20 million per million tons of cargo if the cargo is redirected to the Russian ports.
At the same time, redirecting the cargo would cause the increase of the delivery time from 4.5 to 11 days, and more than double the turnover time of wagons, and as a result would require an additional purchase of 3 500 wagons to ensure the existing export traffic volumes of Belarusian cargoes. Thus, on the basis of the above analysis, we can make the following conclusions:
– The main ports for export and import are: Riga, Klaipeda, Odesa, Ust- Luga , Tallinn and Kaliningrad;
– The main cargo generating points in terms of export are: Salihorsk, Mazyr, Navapolack and Zlobin (potassium fertilizers, oil products, ferrous metals);
To evaluate the effectiveness of the choice of particular port, it is proposed to use the indicator that reflects dependence of the distance from the volume of transportation (Ief ):
• Рi,j – distance from the point i to the port j, kilometres;• Di – share of the cargo of the i-item to the total volume of cargo;• n, m - total number of loadings and ports;• i,j - number of departure and destination ports.
The result of the index calculation for export cargo flows are presented in table 14. According to the results, the item is selected for which the value of Ief is minimal (marked yellow in table below). Providing that the cost of transportation by land for each element is same, the development of the cooperation with the port of Riga seems to be the most promising.
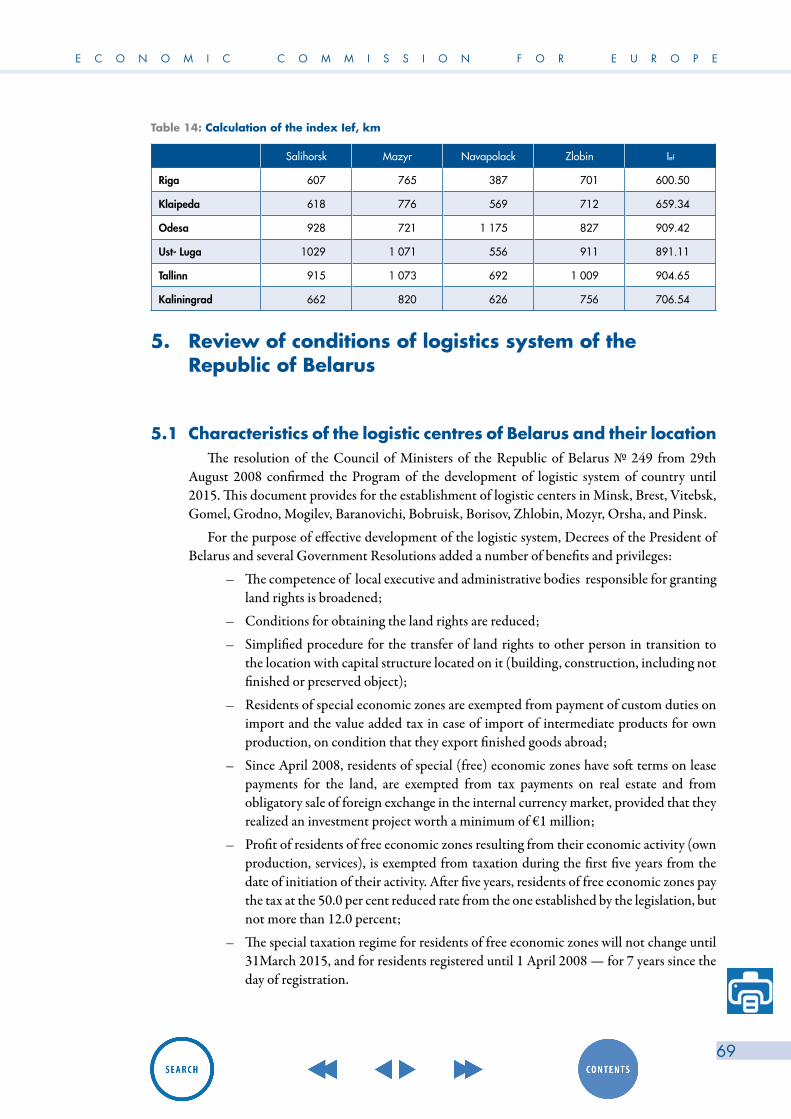
E C O N O M I C C O M M I S S I O N F O R E U R O P E
69
Table 14: Calculation of the index Ief, km
Salihorsk Mazyr Navapolack Zlobin Ief
Riga 607 765 387 701 600.50
Klaipeda 618 776 569 712 659.34
Odesa 928 721 1 175 827 909.42
Ust- Luga 1029 1 071 556 911 891.11
Tallinn 915 1 073 692 1 009 904.65
Kaliningrad 662 820 626 756 706.54
5. Review of conditions of logistics system of the Republic of Belarus
5.1 Characteristics of the logistic centres of Belarus and their locationThe resolution of the Council of Ministers of the Republic of Belarus № 249 from 29th
August 2008 confirmed the Program of the development of logistic system of country until 2015. This document provides for the establishment of logistic centers in Minsk, Brest, Vitebsk, Gomel, Grodno, Mogilev, Baranovichi, Bobruisk, Borisov, Zhlobin, Mozyr, Orsha, and Pinsk.
For the purpose of effective development of the logistic system, Decrees of the President of Belarus and several Government Resolutions added a number of benefits and privileges:
– The competence of local executive and administrative bodies responsible for granting land rights is broadened;
– Conditions for obtaining the land rights are reduced;
– Simplified procedure for the transfer of land rights to other person in transition to the location with capital structure located on it (building, construction, including not finished or preserved object);
– Residents of special economic zones are exempted from payment of custom duties on import and the value added tax in case of import of intermediate products for own production, on condition that they export finished goods abroad;
– Since April 2008, residents of special (free) economic zones have soft terms on lease payments for the land, are exempted from tax payments on real estate and from obligatory sale of foreign exchange in the internal currency market, provided that they realized an investment project worth a minimum of €1 million;
– Profit of residents of free economic zones resulting from their economic activity (own production, services), is exempted from taxation during the first five years from the date of initiation of their activity. After five years, residents of free economic zones pay the tax at the 50.0 per cent reduced rate from the one established by the legislation, but not more than 12.0 percent;
– The special taxation regime for residents of free economic zones will not change until 31March 2015, and for residents registered until 1 April 2008 — for 7 years since the day of registration.
Review of the t ranspor t and logis t ics sys tem of the Republ ic of Belarus
70
– As mechanisms for interaction with the private investors, the following directions were developed:
– Co-funding of especially important transport infrastructure projects by the state and the private investors;
– Co-financing of a transport infrastructure by consignors or users of transport services.
To create additional favourable conditions for investment activity, the Presidential Decree № 10 adopted in August 2009 contains preferences for investors who plan to invest in existing logistic centers, and in the construction of new transport and logistics centers. In particular, according to the Decree the investor, after the conclusion of the investment agreement and its registration in the State register has the right to:
– Construct of facilities provided by the investment project, in parallel with the design, examination and approval in due course of the design and documentation for e ach of the stages of construction with the simultaneous design of subsequent phases of the construction ;
– Acquisition (without tender) of the right to lease the land of required size for the construction of the facility envisaged by the investment project, with the registration of the necessary documents for allotment of the land at the same time with the completion of the construction. The amount of the rent for the land at the date of the lease agreement cannot be increased during the life of the investm ent project.
Investors also are exempted from:
– Transfers of a payment to the republican budget for the right of the conclusion of the contract on lease of the land;
– Compensations for losses of agricultural and (or) forestry production caused by the seizure of land for investment projects, as well as compensation payments related to the transfer and clearing of green space on the lands of settlements;
– Payment of import custom duties and value added tax (other than the payment of value added tax on goods imported into the territory of Belarus from Russian Federation) the importation into the customs territory of Belarus of equipment and spare parts for the objects associated with the implementation of the investment project;
– Payment of the fee for issuing working permits to foreign citizens and persons without the citizenship, to attract investors for the investment project, permits for work in Belarus, and these foreign citizens and persons without citizenship from paying the state fee for the issuance of a temporary residence permit in Belarus.
There are 13 logistic centers in Belarus: «Belmagistralavtotrans» JSC, «Brest-Beltamozhservice», «Minsk- Beltamozhservice», «Gomel-Beltamozhservice», JV «Brestvneshtrans» LLC, «BLT-Logistiс», Logistic Center«Dvadcat chetyre» LTD, Trade-Logistics Center «Ozertso-Logistic» JSC, «BelVingesLogistic», BTLC State Enterprise, «Shate-M Plus», «Minsk-Kristall» RUE, «Korolev Stan» JSC. By the end of 2013, three more are planned to be put in operation: «InterStroiPortalPlus», «Prilesie» and «Orsha Aircraft Repair Plant» JSC. Three logistic centers have transport function: «Belmagistralavtotrans», «Brestvneshtrans» and «BLT-Logistiс».
The list of services provided by various logistic centers in Belarus is about the same. They offer transportation, customs formalities, temporary placement and storage of inventory, transformation of material flows, and provision of logistic services in a service system.
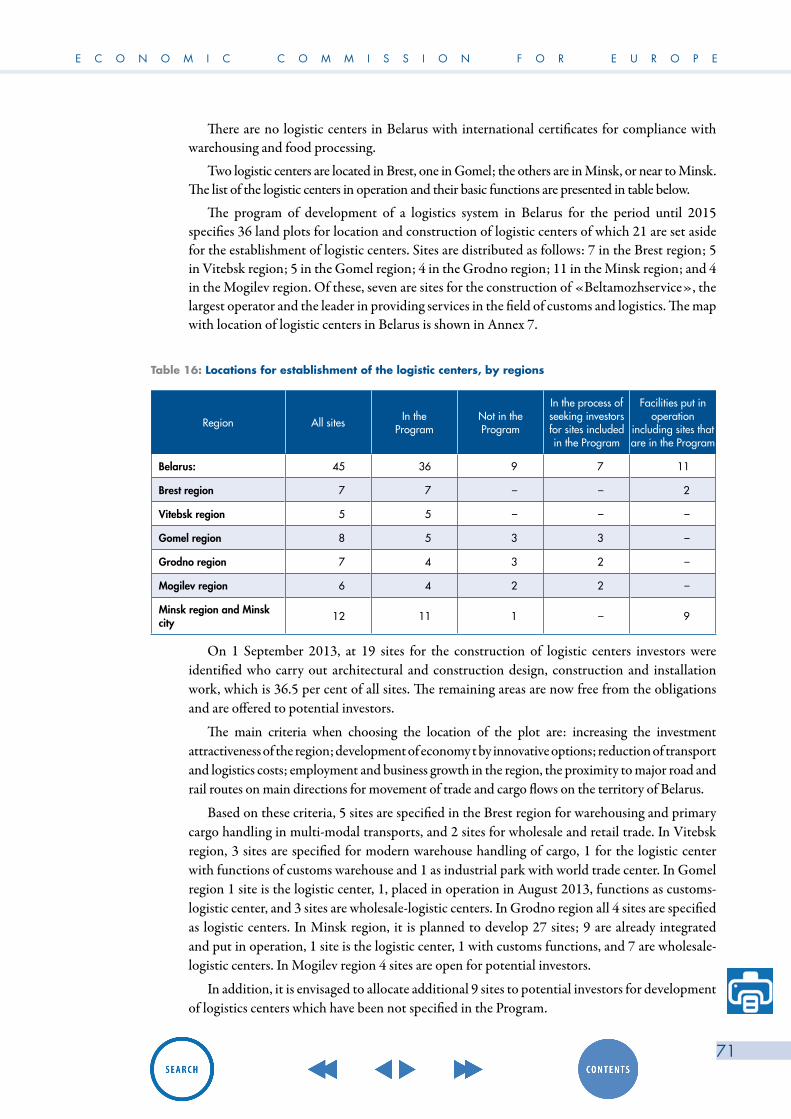
E C O N O M I C C O M M I S S I O N F O R E U R O P E
71
There are no logistic centers in Belarus with international certificates for compliance with warehousing and food processing.
Two logistic centers are located in Brest, one in Gomel; the others are in Minsk, or near to Minsk. The list of the logistic centers in operation and their basic functions are presented in table below.
The program of development of a logistics system in Belarus for the period until 2015 specifies 36 land plots for location and construction of logistic centers of which 21 are set aside for the establishment of logistic centers. Sites are distributed as follows: 7 in the Brest region; 5 in Vitebsk region; 5 in the Gomel region; 4 in the Grodno region; 11 in the Minsk region; and 4 in the Mogilev region. Of these, seven are sites for the construction of «Beltamozhservice», the largest operator and the leader in providing services in the field of customs and logistics. The map with location of logistic centers in Belarus is shown in Annex 7.
Table 16: Locations for establishment of the logistic centers, by regions
Region All sites In theProgram
Not in theProgram
In the process ofseeking investors for sites included in the Program
Facilities put inoperation
including sites that are in the Program
Belarus: 45 36 9 7 11
Brest region 7 7 – – 2
Vitebsk region 5 5 – – –
Gomel region 8 5 3 3 –
Grodno region 7 4 3 2 –
Mogilev region 6 4 2 2 –
Minsk region and Minsk city 12 11 1 – 9
On 1 September 2013, at 19 sites for the construction of logistic centers investors were identified who carry out architectural and construction design, construction and installation work, which is 36.5 per cent of all sites. The remaining areas are now free from the obligations and are offered to potential investors.
The main criteria when choosing the location of the plot are: increasing the investment attractiveness of the region; development of economy t by innovative options; reduction of transport and logistics costs; employment and business growth in the region, the proximity to major road and rail routes on main directions for movement of trade and cargo flows on the territory of Belarus.
Based on these criteria, 5 sites are specified in the Brest region for warehousing and primary cargo handling in multi-modal transports, and 2 sites for wholesale and retail trade. In Vitebsk region, 3 sites are specified for modern warehouse handling of cargo, 1 for the logistic center with functions of customs warehouse and 1 as industrial park with world trade center. In Gomel region 1 site is the logistic center, 1, placed in operation in August 2013, functions as customs-logistic center, and 3 sites are wholesale-logistic centers. In Grodno region all 4 sites are specified as logistic centers. In Minsk region, it is planned to develop 27 sites; 9 are already integrated and put in operation, 1 site is the logistic center, 1 with customs functions, and 7 are wholesale-logistic centers. In Mogilev region 4 sites are open for potential investors.
In addition, it is envisaged to allocate additional 9 sites to potential investors for development of logistics centers which have been not specified in the Program.
Review of the t ranspor t and logis t ics sys tem of the Republ ic of Belarus
72
It is estimated that the total volume of work of the logistic centers of general use could reach 25-30 million tonnes of cargo per year.
Establishment of the logistic centers in Belarus is carried out in the following directions:
– Through modernization and refurbishment of the existing industrial or warehouse property in the modern logistic centers.
– The main part of warehouses operating in territory of Belarus at the level of equipment and a technical condition relating to storage type «С» and «D».
– The Program identified the prospects of development of modern warehouse complexes of type «A» and «B» which will be working on logistics of trade flow technologies. There are 8 947 available warehouses in Belarus that belong to trade organizations located in special premises, with total floor surface of 2 594 thousand square meters. At the moment, 8 758 warehouses or 97.9 per cent are actually used. Almost half (46.0 per cent) of the warehouse space is available in Minsk.
– Creation of the logistic centers “fro scratch”, with a selection of a land lot and further construction of the whole complex.
Regional executive bodies made decisions on their withdrawal from carrying out auctions for the right to enter into lease agreement. At the conclusion of the investment agreement on the basis of the Presidential Decree № 0 fro 8/6/2009, the land lot is rented without auction. Construction and placement of logistic centers is provided in regional centers and in other cities in the immediate vicinity of Trans-European transport corridors № 2 and № 9 and roads of national importance passing through territory of the Republic.

E C O N O M I C C O M M I S S I O N F O R E U R O P E
7373
Table 15: The Characteristics of the logistics centers of the Republic of Belarus
Name of the logistics center
Belm
agis
trala
vtot
rans
JS
C
Min
sk
Belta
moz
hser
vice
RU
EBr
est
Belta
moz
hser
vice
RU
EG
omel
Be
ltam
ozhs
ervi
ce
RUE
JV B
restv
nesh
trans
LL
C
«BLT
-logi
stic»
Logi
stic
Cen
ter
«Dva
dcat
che
tyre
» LT
DTr
ade-
Logi
stics
C
ente
r “O
zerts
o-Lo
gisti
c” J
SCLo
gisti
c ce
nter
«Bel
Vin
gesL
ogis
tic»
BTLC
Sta
te E
nter
pris
e
«Sha
te M
Plu
s»
«Min
sk-K
rista
ll» R
UE
The
trade
and
lo
gisti
cs c
ente
r «K
orol
ev S
tan»
General cargo terminal yes yes yes yes yes yes yes yes yes yes yes yes
Storage hotel yes yes yes yes yes yes yes
Container terminal yes yes
Refrigerated terminal yes yes
Combi terminal yes yes yes
Cranes yes yes yes yes
Services center yes yes yes yes yes yes yes yes yes yes
Computer and commnunication yes yes yes yes yes yes yes yes yes yes yes yes yes
center yes yes yes yes yes yes yes yes
Transport research and trainning yes yes yes yes yes yes yes yes
Hazardous goods storrage yes yes yes yes yes yes yes
Customs yes yes yes yes yes yes yes
Post yes yes yes yes
Veterinary authorities yes yes yes yes yes yes yes
Weights and meassures yes yes yes yes yes yes yes yes
Bank yes yes yes yes yes
Trailer rental yes yes
Garage yes yes yes yes yes yes yes yes yes yes yes yes yes
local road (1 lane) yes yes yes yes yes yes
National road/motorway (2-4 lanes) M9 M1/
E30, M9M
E30M5/E271
ME30 M1/M4 M6 M9 M6 P23, M9 M4/
M9/M5 M9 M9
Review of the t ranspor t and logis t ics sys tem of the Republ ic of Belarus
74
«Belmagistralautotrans» JSC - logistic center is located in industrial cluster of Koljadichi, Minsk. In 2009 it became the first center in Republic which has received the certificate of conformity to requirements ISO 9001-2009system of quality management.
Currently, the center offers the following services:
– Cargo terminal which includes covered warehouse for temporary storage by the area of 3 100 square meters, customs terminal of 450 square meters, a free storage space of 400 square meters, and an open secured storage for oversized cargo of 1 500 square meters;
– Parking for trucks, including 39 000 square meters for storage of cars under customs supervision;
– The customs clearance «Koljadichi-auto»;
– Custom agents;
– Freight forwarding companies;
– Banking center of OJSC «Belvnesheconombank»;
– Office of the insurance company «TASK»;
– Service station for car repair and repair of trailers - «Volvo»;
– Coffee shop “Highway”.
Logistic Center «Dvadcat chetyre» LTD, built in 2010 is the distribution centre for the retail network
«NTS». It is located 9 kilometres from the Minsk Ring Road along the Minsk-Grodno motorway. Availability of a railway network allows organization of technologically most advanced and profitable logistic process. The company provides all types of services from delivery of goods to warehousing before their shipment to destination. The automated warehouse management system (WMS) allows managing effectively a logistic chain at each stage. Handling of cargoes in real time, availability of individual bar codes for each goods, the automated workstations and mobile computer terminals exclude the possibility of failure or errors in the storage, loading and shipment of goods.
«Beltamozhservice» RUE is the largest operator in the market of logistics services of Belarus. Departmental logistic system of «Beltamozhservice» has three levels and consists of the main logistic centre (level of the Republic), the regional logistic centers (by zone on the basis of branches) and territorial (based on operating customs terminals). Currently, «Beltamozhservice» RUE within the framework of the Program works to create a network of the logistic centres. The main objective is to create a multi-level efficient system of logistic centres which will offer a full range of services in the field of customs, forwarding, ware housing and logistics information.
«Trading-logistic center Ozertso-logistiс» JSC is located 3 kilometres from Minsk Ring Road. The main areas of activity are storage and handling of goods in safeguarded warehouses, transport through the territory of Belarus, wholesale and retail trade, receipt of import and export goods and their storage in temporary and bonded warehouses, and customs clearance of cargo. Warehouse area is of classes B and C with the surface of 36 120 square meters with racks of 3, 4 and 8 levels. The storage of bulk goods and containers in the adjacent space to warehouses is possible. The logistic center has 4 refrigerated warehouses. There is a railway line and road leading to the logistics center.
JV «Brestvneshtrans» LLC logistic center in Brest is a modern complex of warehouses located on 20 hectares several kilometers from the Belarus-Polish border and 1 kilometer from a motorway Kozlovichi – Moscow. Center performs loading and unloading, sorting, bundling

E C O N O M I C C O M M I S S I O N F O R E U R O P E
75
and storage of cargo arriving in freight containers and trucks. Total floor space of a warehouse for temporary storage and bonded warehouses is more than 70 000 square Meters. Center is also equipped with 7.5 kilometres of European and wide gauge tracks, custom clearance point, and service of experts of the surveyor organizations.
«BTLC» State Enterprise - the official freight forwarder and the logistic operator of the Belarus Railways, organizes cargo transport by the fast container trains “Viking”, “Bison”, «the Mongolian vector», “Marco Polo Express” and others. Important role in providing services has container terminal «Koljadichi» and cargo station
«Stepjanka»; Cargo station “Stepjanka” offers custo s arehouse designed for a phase release of cargo to free circulation on the territory of Belarus. There is a covered warehouse, a warehouse for temporary storage, an open heavy platform, container area for 3 and 5 ton containers, and an elevated ramp for bulk goods. Terminal «Koljadichi» consists of the container platform and heavy platform, and covered hangar warehouse. Container area has 14 290 square meters, and 29 triple platforms. The elevating mechanisms used at station are: gantry cranes equipped with automatic spreader-type captures with load-carrying capacity from 20 to 32 tons with possibility of stockpiling loaded 20 and 40 foot containers in 3 tiers.
«BLT-logistic» is the pioneer on the national warehouse market that works from 2007. The company offers services of secure storage and handling of cargo in the logistic terminal located 8 kilometres from Minsk near the crossing of high ays М (Brest-Mosco ) and М4 (Minsk-Mogilev/Gomel). There is an «A» class warehouse for food and non-food products with high-rack storages. The surface area of storage facilities is 23 000 square meters, and of administrative area 2 481 square meters. There is an automated management system PSI-WMS operating in the warehouse. The company provides different types of work with cargo – unloading, loading, order picking and individually in boxes and, packing and assembly kits, providing the client with daily reports on storage and handling of goods. Cargo insurance is also possible for transport on Belarus trucks with carrying capacity up to 4 tonnes and up to 30 m3. .
Logistic center «BelVingesLogistic» is located in Volozhinsky district of the Minsk region 25 kilometres from Minsk near to Vilnius — Minsk motorway - the international transport corridor IХ-B. The surface area of the centre is 10 hectares. There are two storage facilities with the total floor space of 29 000 square meters, including 2.8 thousand square meters of office premises.
«Shate M Plus» is one of the largest wholesale centres auto spare parts on the Belarus market and a reliable link between world manufacturers of auto spare parts, dealers and buyers. The basic business activities are: wholesale, small wholesale and retail trade of auto spare parts. For its activities the company has logistic centre located in immediate proximity from the second international transport corridor. There is a warehouse with the total floor space of 18 000 square meters, service station and shop for auto parts.
«Minsk-Kristall» RUE - the automated warehouse for alcoholic beverages of factory «Kristall» has the area of more than 7 000 square meters. All of the goods of the manufacturer arrive to the warehouse, and then they are carried to retail network all over the Belarus and abroad.
The trade and logistics center «Korolev Stan» is located 9 kilometres from Minsk and occupies more than hectares, with a warehouse and administrative complex. The warehouse complex is three storage warehouse terminals with the total floor space of 6 200 square metres, two of which are designed for storage of cargo under a contract of custody. The automated management system of all processes in the logistic center is implemented in safe custody warehouses, as well as the complete cycle of circulation of goods and accompanying documents: the reception of goods for storage; stowage of cargo at storage places; preparation of order to

Review of the t ranspor t and logis t ics sys tem of the Republ ic of Belarus
76
transfer it to consumer; clearance of transport documents; internal transfer of goods to optimize storage; bookkeeping and reliable product inventory; keeping records on the movement of goods in a safe custody warehouse.
Logistic center «Prilesie» is located on a site of 100 hectares at the crossing of roads Berlin-Moscow and Minsk-Mogilev, near to the Minsk Ring Road and the National airport Minsk-2. The concept of this center was developed in cooperation with leading German specialists to provide a full range of logistics services. The center provides warehouses, the inter-modal terminal, the trade and industrial zones, administrative offices, as well as roadside service businesses - hotels, the restaurants and service stations.
«Orsha Aircraft Repair Plant» JSC is transport and logistics complex under construction with possibility to use the existing airfield class “B” (the length of a strip is 3000 meters), a railway line and two international transport corridors II and IX, passing in immediate proximity of transport and logistics center Orsha. The project involves the construction of the center of warehouses, the business center, car park, hotel, restaurants. The existing infrastructure already allows transport and logistics activities with use of the three transport modes – air, railway and road.
Trading-logistic center «InterStroiPortalPlus» will be put into operation by the end of 2013 on land with total area of 43 hectares, located 3 km from Minsk, near to a national road Р1 (a south-west to Brest). The first phase involves construction of 4 warehouse blocks. The implementation of the next stages of construction in the area requires further construction of storage facilities, as well as the shopping center. Warehouses are provided with all the necessary communications.
Analysis of the logistic centers of Belarus led to the following conclusions:1. Owners of logistic centers focused on early recovery of investments and are not interested
in expanding a range of services needed to attract large producers.2. At the design stage of the logistic center, presence of driveways and engineering
constructions is not fully taken into account.3. Operating logistic centers do not use principles of networking in their operations which
does not allow proper and full management of supply chains.4. Many logistic centers are designed to serve their own distribution network.
5.2 Proposals for optimization of logistic centres in BelarusLogistics development in Belarus should be considered as a part of the integration processes
taking place in the context of the creation of the Customs Union and Common Economic Space of Eurasian Economic Community. For this purpose it is necessary to implement innovative projects on creation of international logistic centers of EurAsEC.
As an international logistic center of EurAsEC located on the territory of Belarus, it is important to use the logistic center to be created on territory of a free economic zone «Minsk», bordering the national airport«Minsk». Realization of this project will be implemented in stages until 2019-2020. Sources of financing are both investors and obtained loans. Expected investments are €288 million.
In addition, it is planned to implement two investment projects to build international logistic centers located in other large nodes on transport routes of EurAsEC.
The first project, is a logistics center located in the city of Brest near the road М-1/Е 30, at 9 kilometers from the border with Poland and the Brest airport. Its advantage is availability of own rail access tracks with a 1435 mm gauge. The potential processing capacity of the center is not less than 2.5 million tonnes per year. It will be necessary to invest US$ 15 million for this project to

E C O N O M I C C O M M I S S I O N F O R E U R O P E
77
be realized. According to preliminary estimates, the project will increase revenues from logistics activities and export of transport services by more than $US 10 million per year.
The second project is the industrial logistics park based on «Orsha aircraft repair plant» with international trade center. The center is located 13 kilometers from Orsha, and 20 kilometers from motorwayМ-1/Е 30. The distance to the Russian Federation border is about 50 kilometers. For the realization of this project, it will be necessary to invest $US 13.6 million. If the project is realized, only transit transport of cargoes by air with transfer through the logistic center in volume of 100 thousand tons per year, may generate income of about $US 50 million. The project should be implemented until 2013.
It is necessary to differentiate between logistics centers planned for servicing national from those servicing the international cargo flows, associated with the export and import of Belarus goods and transit. This plan should highlight both territorial and regional transport and logistics centers and their features.
Territorial logistics centers are intended to serve transport and handling of cargo at the location of customers and freight forwarding services, with the main activities being:
– Preparation of cargo for transport;
– Loading/unloading, consolidation, splitting, storage, transfer, fastening, protecting and load securing;
– Organization of cargo transport by different modes of transport;
– Processing of all the necessary documents for transport of cargo;
– Cargo insurance;
– Support to the consignee regarding cargo and other services in provision of safety of goods.
Functions of the regional transport and logistics centers are determined in accordance with the agreements concluded with other transport logistic centers (territorial, regional and in other states) and participants in transport activity.
The analysis shows that the largest amount of export and import cargo flows originates and is terminated in the cities of Baranovichi, Bobruisk, Borisov, Zhlobin, Mozyr, Orsha, and Pinsk. In these cities, together with the Ministry of transport and communications of Belarus, it is necessary to create the territorial logistic centers of general use. Formed in these cities, freight export shipments will be consolidated with a transit cargo flow of other regional logistic centers.
The convenience of placing logistic centers of general use in provincial cities of the Republic justified by the most developed transport nodes, industrial and trading centres, places of origin of mass demand for integrated freight forwarding services. Important feature of creation of the regional logistic centers in regional cities is the fact that almost all of them are located in close vicinity of the international transport corridors.
To improve the organization of foreign trade and transit flows it is necessary to ensure positioning of regional logistic centers of general using, first of all, in special economic zones «Minsk», «Brest», «Vitebsk», «Gomel-Raton», «Grodnoinvest», and «Mogilev». Given that not all free economic zones have significant free areas (60–100 hectares) for the construction of the logistic centers for general use with the ability to use railways and air transport for multi-modal transports of cargo, it remains to prepare and submit necessary proposals for a change of borders of free economic zones taking into account planned construction of the logistic centers of general use.
Analysis of the existing locations of the logistics centers planned in the Program showed that the introduction of any adjustments is not required at present.
Review of the t ranspor t and logis t ics sys tem of the Republ ic of Belarus
78
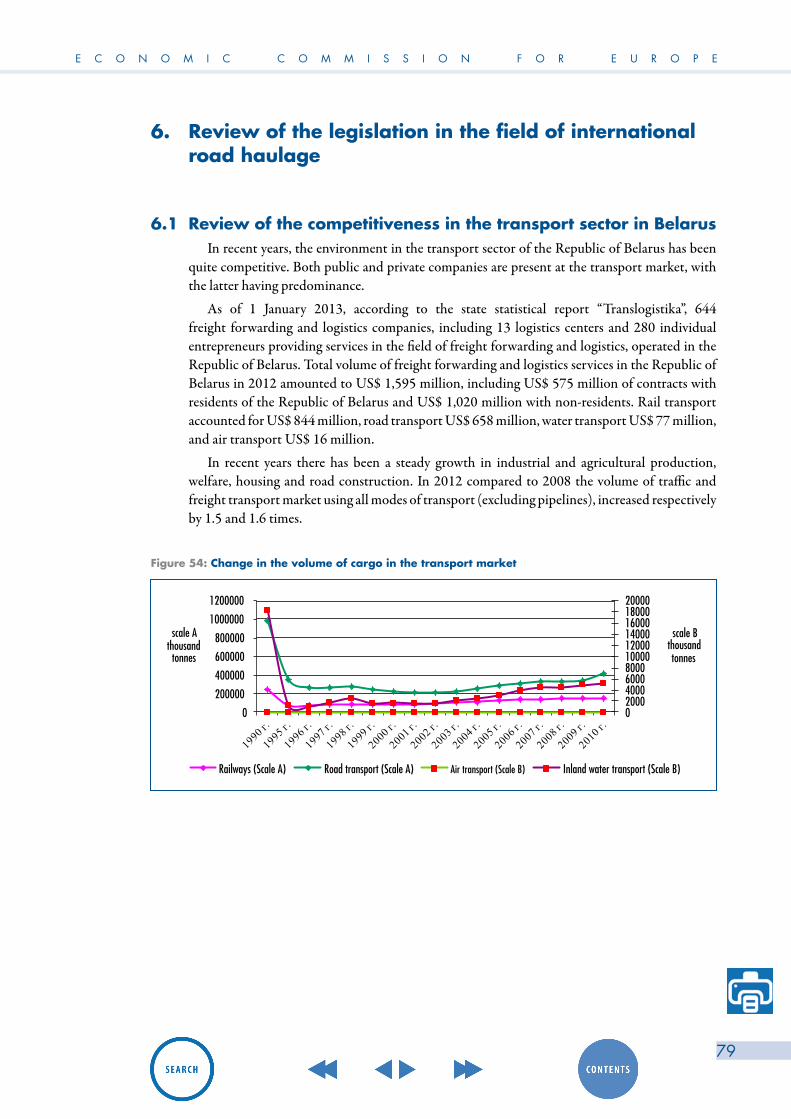
E C O N O M I C C O M M I S S I O N F O R E U R O P E
79
6. Review of the legislation in the field of international road haulage
6.1 Review of the competitiveness in the transport sector in BelarusIn recent years, the environment in the transport sector of the Republic of Belarus has been
quite competitive. Both public and private companies are present at the transport market, with the latter having predominance.
As of 1 January 2013, according to the state statistical report “Translogistika”, 644 freight forwarding and logistics companies, including 13 logistics centers and 280 individual entrepreneurs providing services in the field of freight forwarding and logistics, operated in the Republic of Belarus. Total volume of freight forwarding and logistics services in the Republic of Belarus in 2012 amounted to US$ 1,595 million, including US$ 575 million of contracts with residents of the Republic of Belarus and US$ 1,020 million with non-residents. Rail transport accounted for US$ 844 million, road transport US$ 658 million, water transport US$ 77 million, and air transport US$ 16 million.
In recent years there has been a steady growth in industrial and agricultural production, welfare, housing and road construction. In 2012 compared to 2008 the volume of traffic and freight transport market using all modes of transport (excluding pipelines), increased respectively by 1.5 and 1.6 times.
Figure 54: Change in the volume of cargo in the transport market
58
02000400060008000100001200014000160001800020000
0
200000
400000
600000
800000
1000000
1200000
scale Bthousand tonnes
scale Athousand
tonnes
Railways (Scale A) Road transport (Scale A) Air transport (Scale B) Inland water transport (Scale B)

Review of the t ranspor t and logis t ics sys tem of the Republ ic of Belarus
80
Figure 55: Change in turnover in the transport market
59
0
200
400
600
800
1000
1200
1400
1600
1800
2000
0
10000
20000
30000
40000
50000
60000
70000
80000
scale B
Railways (Scale A) Road transport (Scale A)Inland Water transport (Scale B)Air transport (Scale B)
10,9
11,2
13,3 14,1 13,9
12,2 12,3
11,2 11,6
12,7 12,8
11,2
6,0
7,0
8,0
9,0
10,0
11,0
12,0
13,0
14,0
15,0
2008 2009 2010 2011 2012 Jan -May 2013
Road Transport Railways
Aver
age m
onth
ly fre
ight v
olume
mil.
tonn
es
million tkmscale A
million tkm
Over the last 5 years there has been a significant change in the structure of transport by different modes. The share between road and rail freight transportation has changed in favor of the latter. For the period January- May 2013 it was 1:1.09 on the volume of traffic, and 1:0.453 in freight turnover.
Figure 56: Dynamics of changes in the average monthly volume of road and rail freight transport
59
0
200
400
600
800
1000
1200
1400
1600
1800
2000
0
10000
20000
30000
40000
50000
60000
70000
80000
scale B
Railways (Scale A) Road transport (Scale A)Inland Water transport (Scale B)Air transport (Scale B)
10,9
11,2
13,3 14,1 13,9
12,2 12,3
11,2 11,6
12,7 12,8
11,2
6,0
7,0
8,0
9,0
10,0
11,0
12,0
13,0
14,0
15,0
2008 2009 2010 2011 2012 Jan -May 2013
Road Transport Railways
Aver
age m
onth
ly fre
ight v
olume
mil.
tonn
es
million tkmscale A
million tkm

E C O N O M I C C O M M I S S I O N F O R E U R O P E
81
Figure 57: Dynamics of changes in the average monthly volume of road and rail freight turnover
1145,2
1128,6 1250,6
1387,2
1613,1 1575,9
4 080,8
3 561,9
3 848,6 4 093,3 4 053,4
3 478,0
6.0
506.0
1006.0
1506.0
2006.0
2506.0
3006.0
3506.0
4006.0
4506.0
2008 2009 2010 2011 2012 Jan – May
2013
Road Transport Railway Av
erag
e mon
thly
freigh
t tur
nove
r mil.t
km
Dynamics of carriage of goods by road transport has significantly greater volatility compared to rail (coefficient of variation, respectively, 0.192 and 0.082), so that road transport has a much greater need for logistics and financial mechanisms to optimize the transport work.
The volume of the transport services in 2012 amounted to 305.8 million tonnes, national traffic 238.5 million tonnes, or 78.0 per cent of total volume of goods carried by Belarusian carriers.
Figure 58: Structure of the market of transport services (2012)
1145,2
1128,6 1250,6
1387,2
1613,1 1575,9
4 080,8
3 561,9
3 848,6 4 093,3 4 053,4
3 478,0
6.0
506.0
1006.0
1506.0
2006.0
2506.0
3006.0
3506.0
4006.0
4506.0
2008 2009 2010 2011 2012 Jan – May
2013
Road Transport Railway
Aver
age m
onth
ly fre
ight t
urno
ver m
il.tkm
Rail transport is the most competitive mode in the transport of goods through the Republic of Belarus.
Of the 12 operating logistics centers in Belarus, only two have the technological ability to use a combination of different modes of transport. At the same time, these centers have water and air routes. From three logistics centers, commissioned in 2013 (“InterStroiPortalPlus”, “Prilesye”, “Orsha Aircraft Repair Plant”), one has road connections, and the other two road, rail and air links. The competitiveness of transport logistics system can be evaluated by Baltic Dry Index (BDI).
In accordance with the criterion of economic activity in the transport sector for the period from January 2008 to June 2013, and in accordance with the statistical data of the Ministry of Statistics, the coefficients of realized possibilities for freight transportation to/from the logistics centres was calculated. The largest volume of goods processed through logistics centres for road transport (estimated 120 thousand tonnes, 75.0 per cent) and rail (40 thousand tons), was in the logistics centre “Brestvneshtrans” which in 2012 processed over 600 railcars. Therefore, this mode of transport has a larger capacity and emphasis should be given to its development, providing logistics centres with railway sidings.
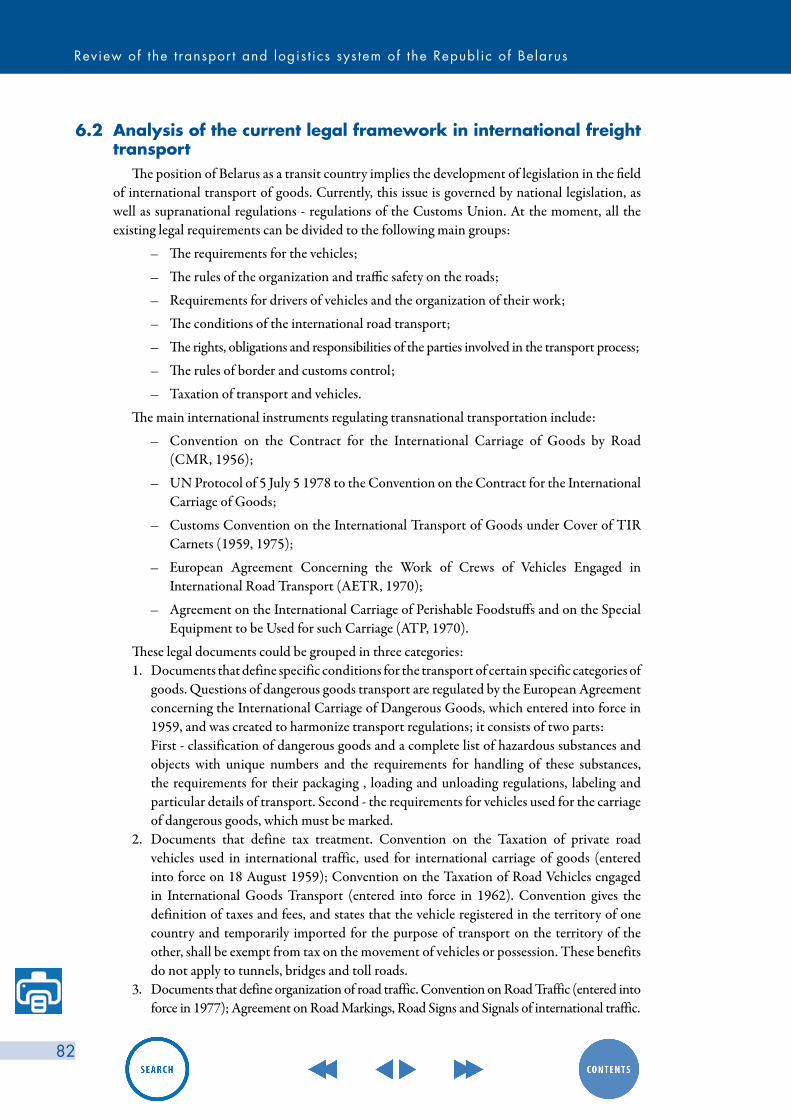
Review of the t ranspor t and logis t ics sys tem of the Republ ic of Belarus
82
6.2 Analysis of the current legal framework in international freight transport
The position of Belarus as a transit country implies the development of legislation in the field of international transport of goods. Currently, this issue is governed by national legislation, as well as supranational regulations - regulations of the Customs Union. At the moment, all the existing legal requirements can be divided to the following main groups:
– The requirements for the vehicles;
– The rules of the organization and traffic safety on the roads;
– Requirements for drivers of vehicles and the organization of their work;
– The conditions of the international road transport;
– The rights, obligations and responsibilities of the parties involved in the transport process;
– The rules of border and customs control;
– Taxation of transport and vehicles.
The main international instruments regulating transnational transportation include:
– Convention on the Contract for the International Carriage of Goods by Road (CMR, 1956);
– UN Protocol of 5 July 5 1978 to the Convention on the Contract for the International Carriage of Goods;
– Customs Convention on the International Transport of Goods under Cover of TIR Carnets (1959, 1975);
– European Agreement Concerning the Work of Crews of Vehicles Engaged in International Road Transport (AETR, 1970);
– Agreement on the International Carriage of Perishable Foodstuffs and on the Special Equipment to be Used for such Carriage (ATP, 1970).
These legal documents could be grouped in three categories:1. Documents that define specific conditions for the transport of certain specific categories of
goods. Questions of dangerous goods transport are regulated by the European Agreement concerning the International Carriage of Dangerous Goods, which entered into force in 1959, and was created to harmonize transport regulations; it consists of two parts:
First - classification of dangerous goods and a complete list of hazardous substances and objects with unique numbers and the requirements for handling of these substances, the requirements for their packaging , loading and unloading regulations, labeling and particular details of transport. Second - the requirements for vehicles used for the carriage of dangerous goods, which must be marked.
2. Documents that define tax treatment. Convention on the Taxation of private road vehicles used in international traffic, used for international carriage of goods (entered into force on 18 August 1959); Convention on the Taxation of Road Vehicles engaged in International Goods Transport (entered into force in 1962). Convention gives the definition of taxes and fees, and states that the vehicle registered in the territory of one country and temporarily imported for the purpose of transport on the territory of the other, shall be exempt from tax on the movement of vehicles or possession. These benefits do not apply to tunnels, bridges and toll roads.
3. Documents that define organization of road traffic. Convention on Road Traffic (entered into force in 1977); Agreement on Road Markings, Road Signs and Signals of international traffic.

E C O N O M I C C O M M I S S I O N F O R E U R O P E
83
In Belarus, the acceptance of the basic regulations governing the procedures and conditions of contracts for the carriage of goods was implemented in mid-90s. In subsequent years, the amount of regulatory requirements in the field of transport has increased. In addition, in recent years, Belarus acceded to a number of international agreements in the field of transport, which also had a positive impact on the development of national legislation in this area.
The legislative framework of Belarus in the field of transport is defined by normative legal acts of different levels. The key rules of civil legislation, defining relations on the basis of movement (transport) of cargo, passengers and luggage are governed by the relevant provisions of the Civil Code. The legal relationship between the carrier and a customer, related to transport operations are based on the contract of carriage. Thus, given the specificity of the transport sector, the free will of the parties when determining the conditions of the contract of carriage may be limited in cases expressly provided for by the Civil Code and other legislative acts. This is due to the special significance of transport, the need for a balanced social policy, security requirements, etc. In the Civil Code of the Republic of Belarus transportation of goods, passengers and luggage is devoted to separate chapters, the legal norms which determine the general conditions relating to the contract of carriage.
The bases of the legal regulation of relations connected with the provision of freight forwarding services are also enshrined in the Civil Code in a separate chapter. It defines the form and the subject of freight forwarding contract, provides for the right of freight forwarder’s obligation to others, and imposing an obligation to a third party does not relieve forwarde from responsibility to the client for execution of the contract.
Framework regulation of transport activities in Belarus have been enshrined in the Law of the Republic of Belarus of 5 May 1998 “Law on basic transport activities” and the Law of the Republic of Belarus of 13 June 2006 “On the forwarding activity.”
Together with the laws that determine the regulatory framework in the field of transport, legislation also governs relations within the individual modes of transport.
In railway transport, the following legislative acts are put into effect: the Law “On Railway Transport” of 6 January 1999, the decision of the Council of Ministers of 2 August 999 № 96 “On approval of the Charter of the railway transport”, etc. Analysis of the Law “On Railway Transport” shows that while recognizing market relations, the Law preserves the state property in the field of railway transport.
In waterway transport Belarus adopted and is applying the Code of Inland Water Transport of 24 June 2002, the Merchant Shipping Code of the Republic of Belarus of 15 November 1999, and the Water Code of the Republic of Belarus of 15 July 15 1998. The rules of these Codes establish economic and organizational basis for navigation on waterways, and uniformly address the issue of ownership of inland waterways as the property of the state. On the inland waterways, legal and natural persons can only have in their possessions man-made structures not covered by objects which are the exclusive property of the state.
The analysis of the legislation of the Republic of Belarus on international cargo transportation demonstrates its focus on development of both public and private sectors and restriction of monopoly in this area as a priority, strengthening the security of transport, non-discrimination and the establishment of equal conditions for the actors in implementation of this activity, to ensure the effective state control in this area. In Belarus, the legislation broadly relates to international transportation. There exist all the fundamental pieces of legislation in key areas. However, there are a number of significant issues that require harmonization of Belarusian and European legislation in the field of international transportation.

Review of the t ranspor t and logis t ics sys tem of the Republ ic of Belarus
84
6.3 Proposals for the harmonization of the legal framework in international freight transport
Harmonization of the legislation in international freight transport is one of the most important conditions for the development of transport infrastructure in Belarus and the Eurasian Economic Community as a whole. Harmonization should be seen in the context of the Eurasian Economic Community, as decisions of the Republic of Belarus in this area are largely due to the policy of inter-state coordination.
In recent years, all over the world, specific integration processes are taking place. The most significant progress in this direction has been made by the European Union, the Customs Union and the Eurasian Economic Community.
The European Union is actively developing single internal market, including the area of the “four freedoms” - the movement of goods, services, investment and people.
The Eurasian Economic Community is no exception to the general process of economic integration. The main objective of economic integration of the member states of the Eurasian Economic Community is the use of historically accumulated potential and existing benefits of division of labor to fully realize the interests of member countries of the Community.
The main objectives declared by the Eurasian Economic Community are:
– Formation of the free trade area (customs-free zone), based on the international standards of inter-state relations in the economic sphere;
– Establishment of an effective mechanism for the implementation of the decisions and arrangements of the Community;
– Increase the responsibility of Member States for the implementation of their commitments;
– Gradual removal of barriers in mutual trade, ensuring fair competition on the national markets.
All this directly relates to the sphere of international transport. An efficient transport system is the key to the successful development of trade and tourism. The opposite is also true, that transport can act in a number of cases as a significant barrier to trade.
The fact is that the present situation in the field of transport in the EEC and in Belarus, in particular, is far from ideal. Statistics show that the share of transport costs in the price of goods within the Community reaches 15-20 per cent, while in the European Union its share does not exceed 7-8 per cent., and the distances are not the only reason.
For the conversion of the Eurasian Economic Community in an effective regional economic integration, it is necessary to take steps towards the harmonization of legislative and regulatory activities of Member States, access to markets and the elimination of existing barriers in passenger and cargo traffic.
There are the following systemic problems that have a serious deterring effect on the development of freight traffic in the EEC and Belarus in particular:
a. Lack of harmonization of the basic legislation in road transport. The Member States statutes, codes and laws adopted in the field of transport are different
from one country to another. . In a number of member states and in a number of critical issues, the existent legislation and regulations are often based on old, Soviet legislation, and does not meet the modern legal requirements. On many today extremely relevant aspects there is no regulation, such as for example, payment for use of infrastructure, or for

E C O N O M I C C O M M I S S I O N F O R E U R O P E
85
transportation of dangerous goods. It is obvious that all member states of the Community are interested in creating a new legislative and regulatory framework on a uniform basis. It is in the interests of both trade and carriers.
b. Loosely unified technical and technological standards in transport of passengers and cargo. As is known, the work on harmonization of standards and technical regulations is carried
out on the basis of international norms through adherence to international agreements and conventions, the ratification and the bringing into compliance with the national legislative and regulatory framework. Analysis of the fundamental multilateral instruments in the field of road transport in EurAsEC member states has shown that none of the agreements applies fully throughout the Community. The level of application and adaptation of European standards is also relatively low. Of the total number of UNECE agreements and conventions affecting the road transport and border crossing procedures (40 legal instruments), 11 has not been signed by any of the member states of the EurAsEC. All EurAsEC member states joined only one multilateral instrument – the Customs Convention on the International Transport of Goods under the Cover of TIR Carnet (1975).
c. Bilateral agreements concluded between individual countries involve different levels of preferences in respect of taxes, road tolls, transit, and provide for, in some cases, the authorization of transport, including through harmonization of the contingent of issued permits. Diverse legal regimes created by the bilateral agreements are contrary to the spirit and letter of the EurAsEC to create a free trade area, and the general economic space, including transport.
d. Various barriers of technical, administrative, fiscal and cross-border nature. It should be noted that in recent years there have been significant advances in this direction.
For example, in June 2004, Declaration on combating unfair competition in road transport, developed in Belarus was adopted by the Ministers of Transport of CIS countries. It is necessary to develop a mechanism for implementation of the provisions of the Declaration which involves the removal of administrative barriers to road transport. EurAsEC countries are invited to participate actively in the development of these mechanisms.
In view of the above, it is recommended to implement the following plan of work on the harmonization of legislative and regulatory activities in the field of road transport:
1. To analyze and systematize the fundamental operating regulations in the member states of the EEC, identify systemic inconsistencies and develop proposals to address them. Then, develop a legislative acts (e.g. on toll roads, for the transport of dangerous goods, on concessions in the road sector, etc.) based on model legislation drafted and adopted by the Inter-Parliamentary Assembly of the EurAsEC.
2. Harmonize technical regulations and standards in transport. This is the most important element of a coherent integration of the Eurasian Economic Community in the European and global transport system. The first real step has already been made at the level of the CIS - an agreement on the introduction of a single Vehicle Weight Certificate for vehicles operating in the territory of the CIS member states and, accordingly, the Eurasian Economic Community. An important aspect is the introduction of mutual recognition of diplomas, certificates and other documents issued by member states and the EurAsEC officially certified qualifications for operators of freight and passenger transport services.
3. Ensure the effective system of international road links between the EurAsECmember states through the elimination of administrative barriers. For this, it is necessary to remove barriers imposed by transit fees, road and other tolls on free roads, the permit system in the implementation of the bilateral transport within the CIS countries, delivery of heavy,

Review of the t ranspor t and logis t ics sys tem of the Republ ic of Belarus
86
oversized and dangerous cargo that do not suit domestic and foreign operators in view of many bureaucratic formalities, creating conditions for corruption. Contradictory interpretations of the many existing rules and regulations make it difficult to interpret them and to initiate appeal procedures. As a result, rate and volume of cargo delivery is declining, which in turn leads to direct financial losses. There are several possible mechanisms for the implementation of these tasks – such as a review of all existing bilateral agreements, introduction of relevant amendments and additions. However, the most effective is the development and adoption of a EurAsEC multilateral agreement on international road transport, which would standardize modes of transport between the member states.
4. Increased coordination of EurAsEC member states in international organizations, including accession to international agreements and conventions. It is, first of all, the United Nations and the International Transport Forume (ex-European Conference of Ministers of Transport). Thus, the harmonization of the Belarusian legislation with the regulations in force in the European Union and the countries of the Eurasian Economic Community has become an urgent task, which depends on the prospects for the development of international freight transport to Europe and Asia.

E C O N O M I C C O M M I S S I O N F O R E U R O P E
87
7. Analysis of transit traffic in the Republic of Belarus and the neighbouring countries
7.1 Transit traffic in Ukraine
7.1.1 General description
Ukraine plays a special role in the European transit system, due to developed system of transport network and ice-free ports. The length of the public railway network is 21,654.7 kilometres, and of the public road network is 169 501 kilometres.
Three international transport corridors through the territory of Ukraine are:
– International transport corridor III, Brussels-Aachen-Cologne-Dresden-Wrocła -Katowice-Kraków- Lviv-Kiev;
– International transport corridor V, Trieste–Budapest–Bratislava–Uzhgorod–Lviv;
– International transport corridor IX, Helsinki–St. Petersburg–Vitebsk–Kiev (Moscow) – Odessa (Kishinev)–Plovdiv– Bucharest–Alexandroupolis.
The technological capacity of transport infrastructure of the Ukrainian railways allows it to carry more than 1 billion tonnes of cargo annually and to process more than 160 million tonnes of cargo in the ports. A large part of this capacity is focused on transit. Ukraine has the highest transit index in Europe, equal to 3.75. However, the present transit potential is used only up to 35 per cent.
The total volume of transit traffic through Ukraine by different vehicles in 2012 declined by17.4 per cent compared to the level in 2011. This is caused by the fall in volume s of transit cargo in all modes of transport. Road transport transit volume was down by 3.2 per cent, railway transit by 15.9 per cent, and maritime transit by 58.1per cent. Inland navigation vessels transported 7.58 million tonnes of transit cargo in 2012 while in 2010- 2011 there have not been such deliveries at all.
Table 17: Total volume of transit traffic by different modes through Ukraine (000 tonnes)
Type oftransport 2010 2010/2009
% 2011 2011/2010 % 2012 2012/2011
%2012/2009
%
All modes, including: 152 353.78 45.2 151 242.98 99.3 124 893.91 82.6 37.1
Railway 44 511.77 69.8 48 669.54 109.3 409 40.14 84.1 64.2
Auto 4 649.12 137.0 5 011.20 107.8 4 850.03 96.8 142.9
Sea 3 660.41 189.0 3 912.07 106.9 1 637.72 41.9 84.5
River – – – – 7.58 – 631.7
The main origin of transit goods through Ukraine are CIS countries (Russian Federation, Belarus, Kazakhstan and Moldova) with the share of over 95 per cent of the total transit volume
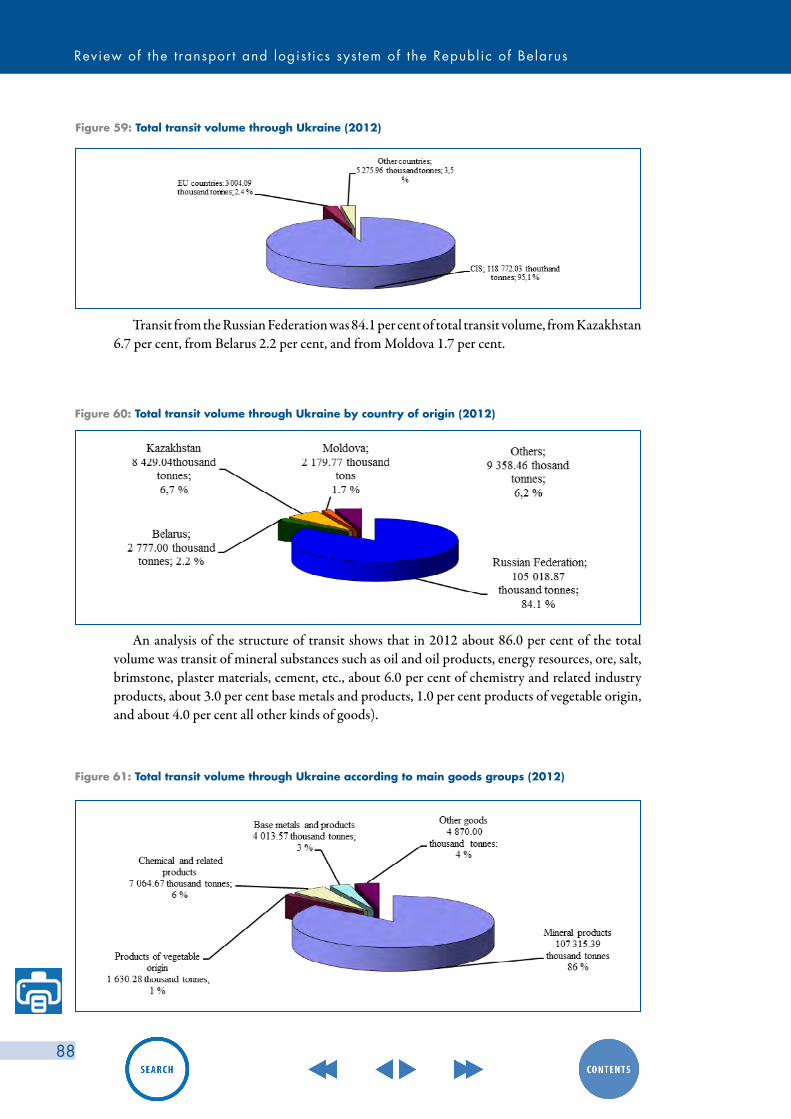
Review of the t ranspor t and logis t ics sys tem of the Republ ic of Belarus
88
Figure 59: Total transit volume through Ukraine (2012)
Transit from the Russian Federation was 84.1 per cent of total transit volume, from Kazakhstan 6.7 per cent, from Belarus 2.2 per cent, and from Moldova 1.7 per cent.
Figure 60: Total transit volume through Ukraine by country of origin (2012)
An analysis of the structure of transit shows that in 2012 about 86.0 per cent of the total volume was transit of mineral substances such as oil and oil products, energy resources, ore, salt, brimstone, plaster materials, cement, etc., about 6.0 per cent of chemistry and related industry products, about 3.0 per cent base metals and products, 1.0 per cent products of vegetable origin, and about 4.0 per cent all other kinds of goods).
Figure 61: Total transit volume through Ukraine according to main goods groups (2012)

E C O N O M I C C O M M I S S I O N F O R E U R O P E
89
7.1.2 Road transport
The total of 4 850 thousand tonnes of goods were carried through Ukraine by trucks in 2012, that is 3.2 per cent less than in 2011. The share of different goods in the total volume is shown in figure below.
Figure 62: Total volume of transit through Ukraine by road transport according to main goods groups (2012)
In 2012, more than 3.3 million foreign trucks moved transit cargo through Ukraine, 5.1 per cent less than in 2011. Most transit delivery tracks entered through the following border crossings between Ukraine and Russian Federation (49.8 per cent); 21.5 per cent between Ukraine and Moldova; 15.5 per cent between Ukraine and Belarus and 6.3 per cent between Ukraine and Poland.
According to these data, the largest specific weight in the total freight traffic volume by road has the transit from: the Russian Federation (18.5 per cent), Moldova (12.8 per cent), Turkey (10.7 per cent), Italy (7.3 per cent), Bulgaria (5.2 per cent), Serbia (5.0 per cent), and Poland (4.2 per cent). Total share of transit from these countries reached 63.7 per cent.
Figure 63: Total volume of road transit through Ukraine by main countries of origin (2012)

Review of the t ranspor t and logis t ics sys tem of the Republ ic of Belarus
90
7.1.3 Railway transport
Concerning the volume of railway freight traffic, Ukrainian railroads take the 4th place on Eurasian continent, second only to the railroads of China, the Russian Federation, and India and the 6th place in the world. Technological capacity of the Ukrainian railway transport infrastructure allows it to carry more than 1 billion tonnes of goods annually. However, this potential is realized by only 50.0 per cent.
The total transit volume and railway transit freight traffic is shown in figures below (yellow-green – total transport volume, light blue –transit transport volume).
Figure 64: Railway freight traffic volume in Ukraine
Figure 65: Share of transit freight traffic in the total railway transport in Ukraine, per cent
Mineral substances such as oil and oil products, energy resources, ore and coal have the largest share with74.8 per cent, followed by chemical and related products (mostly fertilizers) with 11.3 per cent, and metals and related products with about 8.7 per cent. Total transport of these cargo groups takes up 95.3 per cent of the total railway transit freight traffic through Ukraine in 2012.
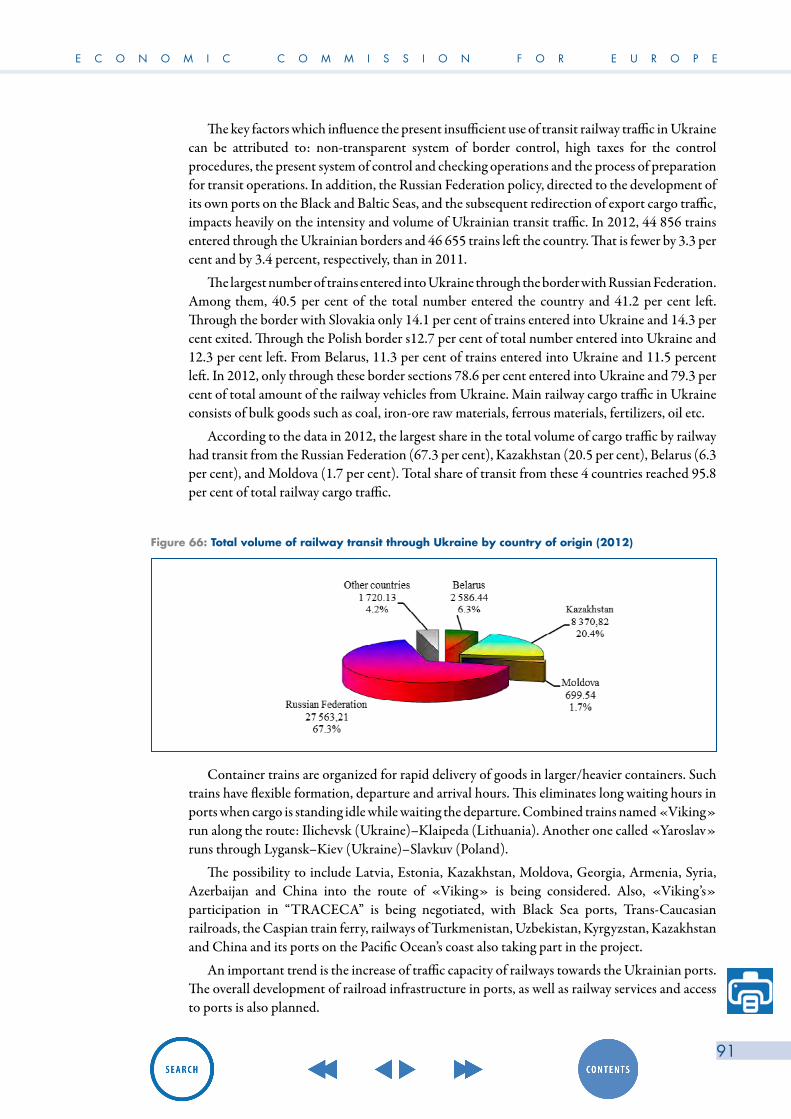
E C O N O M I C C O M M I S S I O N F O R E U R O P E
91
The key factors which influence the present insufficient use of transit railway traffic in Ukraine can be attributed to: non-transparent system of border control, high taxes for the control procedures, the present system of control and checking operations and the process of preparation for transit operations. In addition, the Russian Federation policy, directed to the development of its own ports on the Black and Baltic Seas, and the subsequent redirection of export cargo traffic, impacts heavily on the intensity and volume of Ukrainian transit traffic. In 2012, 44 856 trains entered through the Ukrainian borders and 46 655 trains left the country. That is fewer by 3.3 per cent and by 3.4 percent, respectively, than in 2011.
The largest number of trains entered into Ukraine through the border with Russian Federation. Among them, 40.5 per cent of the total number entered the country and 41.2 per cent left. Through the border with Slovakia only 14.1 per cent of trains entered into Ukraine and 14.3 per cent exited. Through the Polish border s12.7 per cent of total number entered into Ukraine and 12.3 per cent left. From Belarus, 11.3 per cent of trains entered into Ukraine and 11.5 percent left. In 2012, only through these border sections 78.6 per cent entered into Ukraine and 79.3 per cent of total amount of the railway vehicles from Ukraine. Main railway cargo traffic in Ukraine consists of bulk goods such as coal, iron-ore raw materials, ferrous materials, fertilizers, oil etc.
According to the data in 2012, the largest share in the total volume of cargo traffic by railway had transit from the Russian Federation (67.3 per cent), Kazakhstan (20.5 per cent), Belarus (6.3 per cent), and Moldova (1.7 per cent). Total share of transit from these 4 countries reached 95.8 per cent of total railway cargo traffic.
Figure 66: Total volume of railway transit through Ukraine by country of origin (2012)
Container trains are organized for rapid delivery of goods in larger/heavier containers. Such trains have flexible formation, departure and arrival hours. This eliminates long waiting hours in ports when cargo is standing idle while waiting the departure. Combined trains named «Viking» run along the route: Ilichevsk (Ukraine)–Klaipeda (Lithuania). Another one called «Yaroslav» runs through Lygansk–Kiev (Ukraine)–Slavkuv (Poland).
The possibility to include Latvia, Estonia, Kazakhstan, Moldova, Georgia, Armenia, Syria, Azerbaijan and China into the route of «Viking» is being considered. Also, «Viking’s» participation in “TRACECA” is being negotiated, with Black Sea ports, Trans-Caucasian railroads, the Caspian train ferry, railways of Turkmenistan, Uzbekistan, Kyrgyzstan, Kazakhstan and China and its ports on the Pacific Ocean’s coast also taking part in the project.
An important trend is the increase of traffic capacity of railways towards the Ukrainian ports. The overall development of railroad infrastructure in ports, as well as railway services and access to ports is also planned.
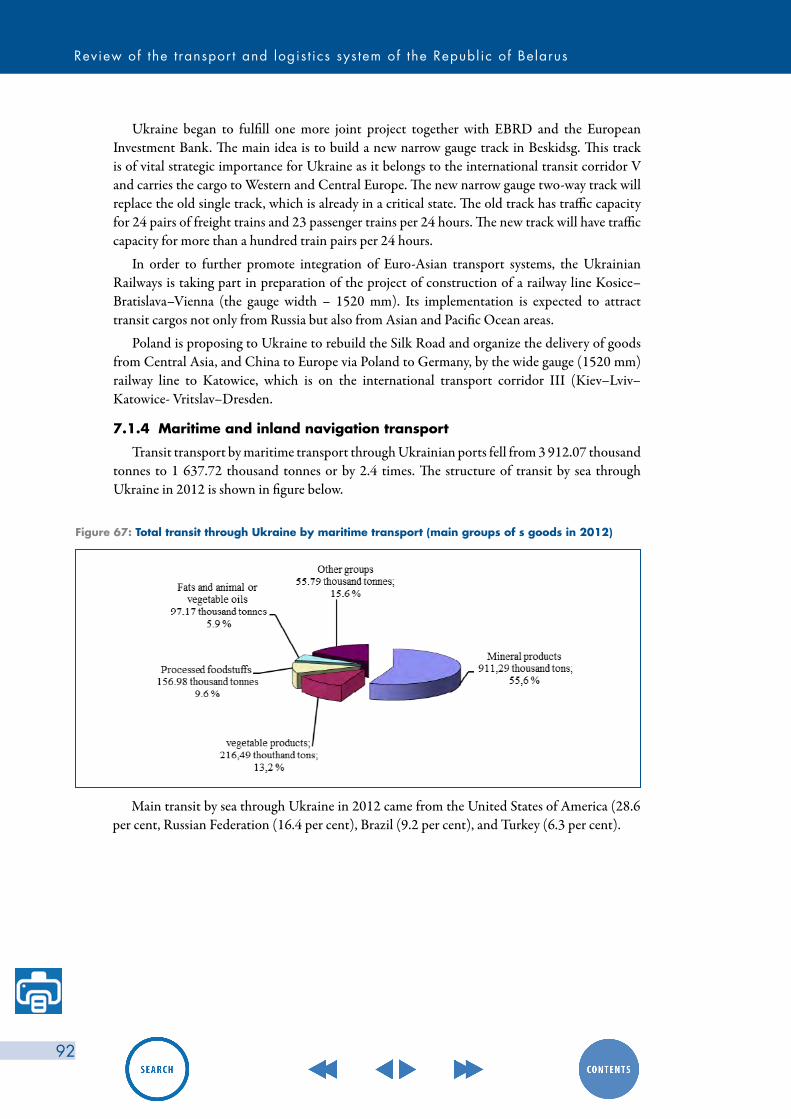
Review of the t ranspor t and logis t ics sys tem of the Republ ic of Belarus
92
Ukraine began to fulfill one more joint project together with EBRD and the European Investment Bank. The main idea is to build a new narrow gauge track in Beskidsg. This track is of vital strategic importance for Ukraine as it belongs to the international transit corridor V and carries the cargo to Western and Central Europe. The new narrow gauge two-way track will replace the old single track, which is already in a critical state. The old track has traffic capacity for 24 pairs of freight trains and 23 passenger trains per 24 hours. The new track will have traffic capacity for more than a hundred train pairs per 24 hours.
In order to further promote integration of Euro-Asian transport systems, the Ukrainian Railways is taking part in preparation of the project of construction of a railway line Kosice–Bratislava–Vienna (the gauge width – 1520 mm). Its implementation is expected to attract transit cargos not only from Russia but also from Asian and Pacific Ocean areas.
Poland is proposing to Ukraine to rebuild the Silk Road and organize the delivery of goods from Central Asia, and China to Europe via Poland to Germany, by the wide gauge (1520 mm) railway line to Katowice, which is on the international transport corridor III (Kiev–Lviv–Katowice- Vritslav–Dresden.
7.1.4 Maritime and inland navigation transport
Transit transport by maritime transport through Ukrainian ports fell from 3 912.07 thousand tonnes to 1 637.72 thousand tonnes or by 2.4 times. The structure of transit by sea through Ukraine in 2012 is shown in figure below.
Figure 67: Total transit through Ukraine by maritime transport (main groups of s goods in 2012)
Main transit by sea through Ukraine in 2012 came from the United States of America (28.6 per cent, Russian Federation (16.4 per cent), Brazil (9.2 per cent), and Turkey (6.3 per cent).

E C O N O M I C C O M M I S S I O N F O R E U R O P E
93
Figure 68: Total volume of sea transit through Ukraine by country of origin (2012)
Ukraine has significant potential for processing exported, imported, and transit goods sent by maritime transport. It has the following working sea/river trade ports: Belgorod-Dniester, Dnieper-Bug, Mariupol, Berdyansk, Reniyski, Odessa, Skadowsk, Evpatoriya, Herson, Kerch, Sevastopol, Nikolaev, Oktabrsk, Ilichevsk, Yuzhnyi and Izmail. The most economically important ports for Ukraine are Odessa, Ilichevsk and Yuzhnyi, which are situated in the North-West part of the Black Sea. Together they carry out 70 per cent of total sea-borne freight turnover of all Ukrainian sea ports. Odessa and Ilichevsk sea trade ports (STP) have the largest container terminal in Ukraine. Technical capacity of Odessa STP allows it to process more than 14 million tonnes of dry cargo and 14 million tonnes of oil products annually. The current total capacity of the Ukrainian ports is 180 million tonnes per year.
The majority of goods, processed in the Ukrainian ports are delivered by international sea fleets. 148 554 million tonnes or 96.5 per cent of the goods from total processed cargo volume were delivered by international ships in 2012. During the same period the Ukrainian sea ships delivered sent 5 316 million tonnes or 3.5 per cent of the goods. The transit of cargo in 2012 was calculated by analogy. International sea fleets delivered 37 815 million tonnes or 97.6 per cent of goods, while Ukrainian fleet delivered 944.8 million tonnes or 2.4 per cent of goods.
According to these data, in 2012 the largest share in the total cargo processing volume handled in Ukrainian sea ports consisted of goods sent from 6 countries: Russian Federation (58 per cent), Kazakhstan (22 per cent), Belarus (3 per cent), Moldova (2 per cent), China (1 per cent), and Turkey (1 per cent).
Figure 69: Cargo processing volume handled in Ukrainian sea ports by country of origin (2012)
More than a half of the freight (58.8 per cent) was directed to: Turkey (18.9 per cent), China (12.8 per cent), Italy (9.3 per cent), the United States (5.8 per cent), the Netherlands (3.4 per cent), Russian Federation(3.1 per cent), Malta (2.8 per cent), and Japan (2.7 per cent).

Review of the t ranspor t and logis t ics sys tem of the Republ ic of Belarus
94
In 2012, most of transit cargo was bulk goods - 16 684 million tonnes or 48.1 per cent of the total volume of transit freight. Coal with5 913 million tonnes or 17.1 per cent and ore with 5 042 million tonnes or 14.5 per cent were the major products. Bulk cargo made up 48.1 per cent, liquid cargo 37.9 per cent, unitized cargo per cent, and containerized cargo 2.5 per cent..
Figure 70: Volume of cargo handled in Ukrainian sea ports by type of cargo (2012)
In 2012, the tendency to reduce processing volumes of transit cargo handled in Ukrainian sea ports continued. It is largely due to the decline of competitiveness of Ukrainian ports in this transport market segment, compared with the ports of the Russian Federation, Bulgaria, Rumania and the Baltic region. However, until 2015, when completion of construction of the port Zheleznyi Rog in the Russian Federation is expected, the bulk terminals of Ukraine can count on keeping their transit cargo traffic through the Black Sea region. Ice-free and deep-water ports of Ukraine still have advantage over the Russian ports in attracting bulk cargos, especially iron- ore.
To consolidate the existing competitive advantage, Ukraine is building its sea trade ports infrastructure. In the port Yuzhnyi, a berth with the capacity of 1.2 million tonnes annually is being built with own funds. Even more promising project is the construction of a universal complex for handling bulk cargo, with processing capacity of 8.5 million tonnes annually in the terminal of «Avlita» a stevedore company in Sevastopol. The main advantage of the project is the large approaching depth able to take ocean-going bulk carriers of 140 thousand tonnes displacement and up to 175 thousand tons in future. Such port facilities with large depth, better equipment, and higher standards of work) will be able in the future to compete with Russian ports in the Black Sea.
To implement plans for the development and modernization of the infrastructure of the Ukrainian sea trade ports, it is important to create favorable conditions to attract private investments. To this end, the appropriate legislative framework has been created. In June 2012, the President of Ukraine signed the law on “sea ports of Ukraine” (Sea Port Law). According to this Law, the state organization (Sea Ports Administration of Ukraine) mission is to ensure the content and use of the facilities of port infrastructure in the public domain (especially hydraulic structures), and will not carry economic or commercial activity as well as transshipment. In addition, it has the following functions:
– To render services to the ships, while they enter the port, maneuver and moor;
– To organize and maintain safety of navigation;
– To organize and coordinate rescue operations, as well as work on the recovery of assets, sank in the waters of the port;

E C O N O M I C C O M M I S S I O N F O R E U R O P E
95
– To assist to victims of shipwrecks;
– To coordinate its activity with those of the services of the harbour, pilotage, marine terminals owners and port operators in the event of accidents and other emergency situations;
– To maintain the declared depths, etc.
The Port Law empowers the Sea Ports Administration to levy port duties and monitor their use. Stevedore companies, both state and private (port operators in the Port Law) will carry out services with the cargo. Thus, the restructuring provided for by the Sea Port Law will separate administrative (control and supervision of safety of navigation) from economic or commercial tasks (handling, storage of goods etc.). This, in turn, will ensure that strategic port infrastructure installations remain the state property and organize more effectively the administration of ports with private investors (stevedoring companies), for example, through the use of the concession, as a tool to attract investment in the port industry.
Processing of exported, imported and transit cargo is carried out not only in the sea ports, but also in the inland navigation ports. The volume of cargo processed in river ports and berths in 2012 was 6 675 million tonnes or 4.2 per cent of the total volume of cargo processed in sea and river ports. The volume processing in river ports and berths increased by 0,4 per cent in 2012, compared to 2011. In 2012, the river ports of Ukraine moved 5 839 million tonnes or 87.5 per cent of the total volume of cargo handled in river ports and berths of other enterprises. Respectively, terminals of other businesses moved 0.836 million tonnes or 2.5 per cent of the total volume of cargo.
According to these data, in 2012, the largest share in the total cargo processed in Ukrainian river ports was local cargo (4 906 million tonnes or 73.5 per cent), followed by export cargo (1 412 million tonnes or 21.15 per cent), import cargo (355 million tonnes or 5.32 per cent) and transit cargo (0.002 million tonnes or 0.03 per cent).
Figure 71: Volume of cargo handled in Ukrainian river ports by destination (2012)
Bulk cargo 1.3 thousand tonnes
68.4 %
containerized goods 0.2 thousand tonnes
10.5 %
unitized cargo 0.4 thousand tonnes
21.1 %
Mostly bulk cargo (4 949 million tonnes, or 84.76 per cent of the total) had been processed in river ports. In 2012 it was mostly building material (sand) with 3 936 million tonnes or 67.42 per cent of total cargo in river ports. In addition 0.887 million tonnes or 15.2 % of unitized cargo as well as a small amount of containerized cargo (0.002 million tonnes or 0.02 per cent was processed in river ports. The largest share in total transit handled in Ukrainian river ports had the bulk cargo (1.3 thousand tonnes or 68.4 per cent), followed by unitized cargo (21.1 per cent) and containerized goods (10.5 per cent).
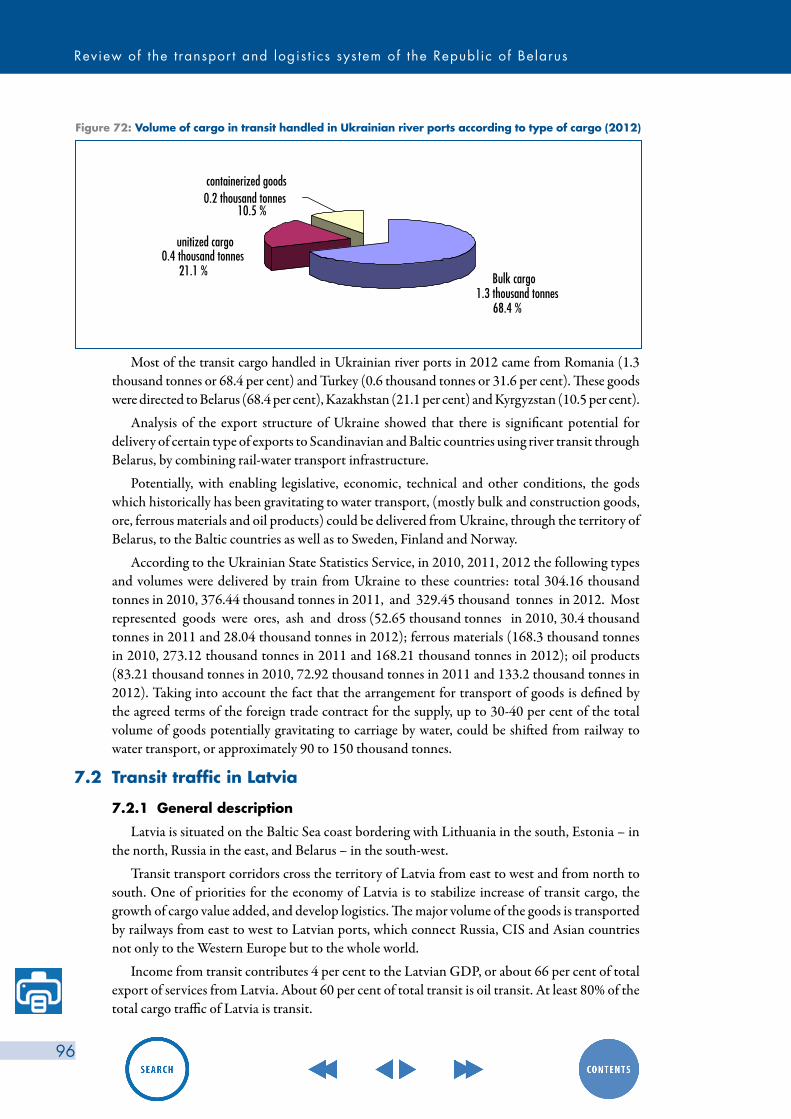
Review of the t ranspor t and logis t ics sys tem of the Republ ic of Belarus
96
Figure 72: Volume of cargo in transit handled in Ukrainian river ports according to type of cargo (2012)
Bulk cargo 1.3 thousand tonnes
68.4 %
containerized goods 0.2 thousand tonnes
10.5 %
unitized cargo 0.4 thousand tonnes
21.1 %
Most of the transit cargo handled in Ukrainian river ports in 2012 came from Romania (1.3 thousand tonnes or 68.4 per cent) and Turkey (0.6 thousand tonnes or 31.6 per cent). These goods were directed to Belarus (68.4 per cent), Kazakhstan (21.1 per cent) and Kyrgyzstan (10.5 per cent).
Analysis of the export structure of Ukraine showed that there is significant potential for delivery of certain type of exports to Scandinavian and Baltic countries using river transit through Belarus, by combining rail-water transport infrastructure.
Potentially, with enabling legislative, economic, technical and other conditions, the gods which historically has been gravitating to water transport, (mostly bulk and construction goods, ore, ferrous materials and oil products) could be delivered from Ukraine, through the territory of Belarus, to the Baltic countries as well as to Sweden, Finland and Norway.
According to the Ukrainian State Statistics Service, in 2010, 2011, 2012 the following types and volumes were delivered by train from Ukraine to these countries: total 304.16 thousand tonnes in 2010, 376.44 thousand tonnes in 2011, and 329.45 thousand tonnes in 2012. Most represented goods were ores, ash and dross (52.65 thousand tonnes in 2010, 30.4 thousand tonnes in 2011 and 28.04 thousand tonnes in 2012); ferrous materials (168.3 thousand tonnes in 2010, 273.12 thousand tonnes in 2011 and 168.21 thousand tonnes in 2012); oil products (83.21 thousand tonnes in 2010, 72.92 thousand tonnes in 2011 and 133.2 thousand tonnes in 2012). Taking into account the fact that the arrangement for transport of goods is defined by the agreed terms of the foreign trade contract for the supply, up to 30-40 per cent of the total volume of goods potentially gravitating to carriage by water, could be shifted from railway to water transport, or approximately 90 to 150 thousand tonnes.
7.2 Transit traffic in Latvia
7.2.1 General description
Latvia is situated on the Baltic Sea coast bordering with Lithuania in the south, Estonia – in the north, Russia in the east, and Belarus – in the south-west.
Transit transport corridors cross the territory of Latvia from east to west and from north to south. One of priorities for the economy of Latvia is to stabilize increase of transit cargo, the growth of cargo value added, and develop logistics. The major volume of the goods is transported by railways from east to west to Latvian ports, which connect Russia, CIS and Asian countries not only to the Western Europe but to the whole world.
Income from transit contributes 4 per cent to the Latvian GDP, or about 66 per cent of total export of services from Latvia. About 60 per cent of total transit is oil transit. At least 80% of the total cargo traffic of Latvia is transit.

E C O N O M I C C O M M I S S I O N F O R E U R O P E
97
Transit cargo makes up for about 85 per cent of railway cargo traffic. In addition, Latvia has a possibility to transit oil and oil products through pipelines. The great part of international transit is also carried by road transport. Latvian transit infrastructure includes ten sea ports, developed motorway and railway systems, airports, two oil pipelines and one main pipeline for delivering oil products. About 40 million tonnes of goods are carried through Latvia from West to East.
Figure 73: Transport map of Latvia
7.2.2 Railway transport
Latvian railways (LDZ) include five independent entities. The Latvian railway traffic capacity reaches 62.0 million tonnes of cargo annually. Service length of the railway lines is 2 202 kilometres. LDZ is a leading railway provider of cargo traffic servicesin Baltic countries. Railway transit structure in 2012 can be described as follows: oil and its products (39.8 per cent), black coal (27.5 per cent), ore and mineral fertilizers (4.8 per cent), chemical products (16.6 per cent), ferrous materials (3.5 per cent), agricultural products, fish and fish products per cent), foodstuffs (2.6 per cent), and other cargo (17.0 per cent).
Geographical analysis of railway cargo traffic in 2012 showed that most part (67.5 per cent) is Russian cargo, followed by 21.3 per cent Belarusian, and 3.7 per cent Lithuanian. The share of the international cargo traffic in the total railway freight traffic was 97.6 per cent and national 2.4 per cent. Most of cargo goes through Latvia as a transit to the sea ports. In 2012, the volume of freight transit was more than 49 million tonnes, more by1.3 million tonnes compared to 2011. This was mainly due to the increase of the Russian export traffic via Latvian sea ports. The largest part of sea traffic (about 53.4 per cent) is performed in Riga port, about 41.8 per cent in Ventspils and 4.8 per cent in Liepaya port. Inland transit in 2012 was 4.6 million Tonnes, that is, 22.5 per cent higher than in 2010 but, 4.5 per cent lower than in 2011. The following factors affected the growth of transit traffic:
– Branching of the railway network, connecting Riga, Ventspils and Liepaya ports to the transfer points, Russia, CIS countries and other regions;
– Rail tracks with 1 520 mm width, equal to the Russian Federation and CIS countries;
– Developed network of access tracks and wharfs, which allows transshipment of cargo straight from the railcars to ships;
– Modern transshipment technologies, which accelerate loading and unloading of cargo;
– Automated traffic control system, which facilitates control of the delivery process;
– Flexible tariff policy.
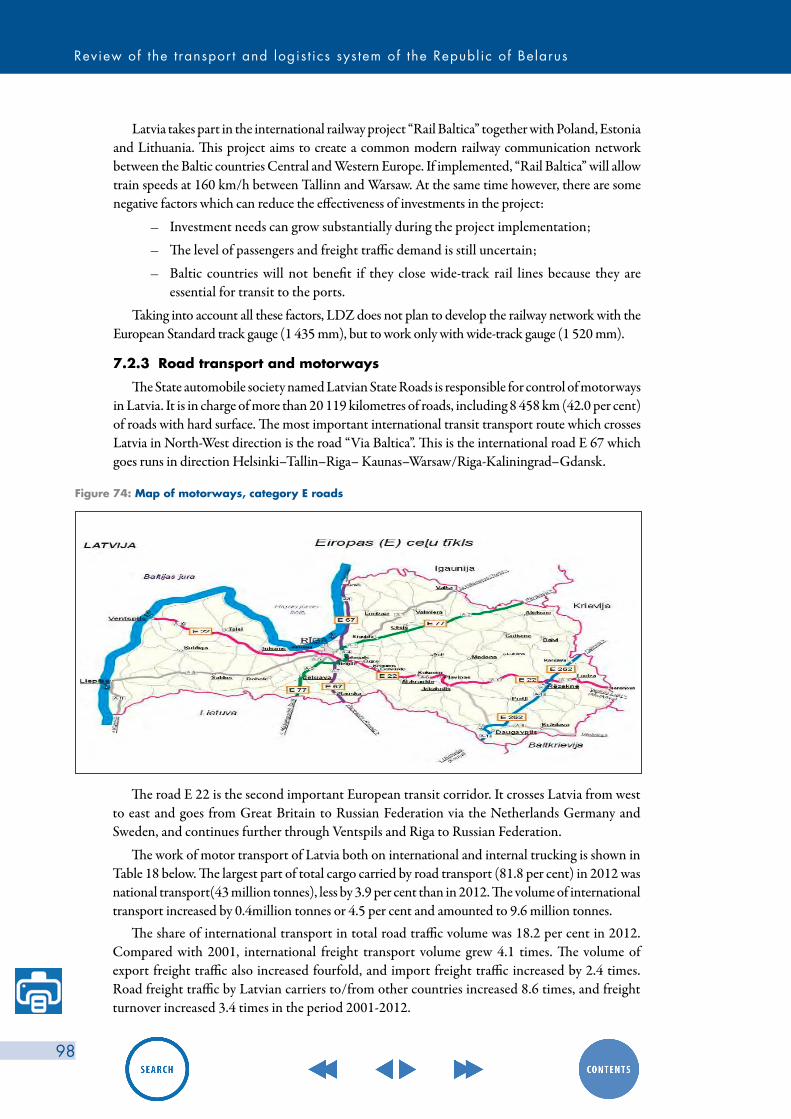
Review of the t ranspor t and logis t ics sys tem of the Republ ic of Belarus
98
Latvia takes part in the international railway project “Rail Baltica” together with Poland, Estonia and Lithuania. This project aims to create a common modern railway communication network between the Baltic countries Central and Western Europe. If implemented, “Rail Baltica” will allow train speeds at 160 km/h between Tallinn and Warsaw. At the same time however, there are some negative factors which can reduce the effectiveness of investments in the project:
– Investment needs can grow substantially during the project implementation;
– The level of passengers and freight traffic demand is still uncertain;
– Baltic countries will not benefit if they close wide-track rail lines because they are essential for transit to the ports.
Taking into account all these factors, LDZ does not plan to develop the railway network with the European Standard track gauge (1 435 mm), but to work only with wide-track gauge (1 520 mm).
7.2.3 Road transport and motorways
The State automobile society named Latvian State Roads is responsible for control of motorways in Latvia. It is in charge of more than 20 119 kilometres of roads, including 8 458 km (42.0 per cent) of roads with hard surface. The most important international transit transport route which crosses Latvia in North-West direction is the road “Via Baltica”. This is the international road E 67 which goes runs in direction Helsinki–Tallin–Riga– Kaunas–Warsaw/Riga-Kaliningrad–Gdansk.
The road E 22 is the second important European transit corridor. It crosses Latvia from west to east and goes from Great Britain to Russian Federation via the Netherlands Germany and Sweden, and continues further through Ventspils and Riga to Russian Federation.
The work of motor transport of Latvia both on international and internal trucking is shown in Table 18 below. The largest part of total cargo carried by road transport (81.8 per cent) in 2012 was national transport(43 million tonnes), less by 3.9 per cent than in 2012. The volume of international transport increased by 0.4million tonnes or 4.5 per cent and amounted to 9.6 million tonnes.
The share of international transport in total road traffic volume was 18.2 per cent in 2012. Compared with 2001, international freight transport volume grew 4.1 times. The volume of export freight traffic also increased fourfold, and import freight traffic increased by 2.4 times. Road freight traffic by Latvian carriers to/from other countries increased 8.6 times, and freight turnover increased 3.4 times in the period 2001-2012.
Figure 74: Map of motorways, category E roads
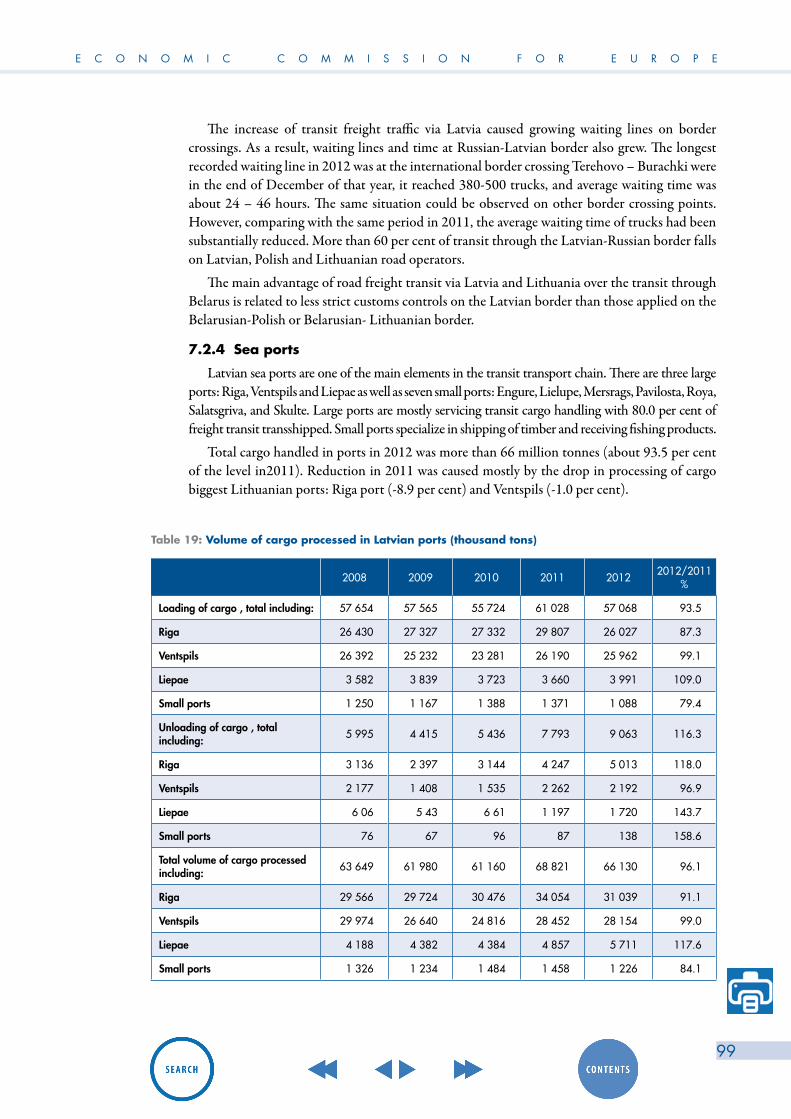
E C O N O M I C C O M M I S S I O N F O R E U R O P E
99
The increase of transit freight traffic via Latvia caused growing waiting lines on border crossings. As a result, waiting lines and time at Russian-Latvian border also grew. The longest recorded waiting line in 2012 was at the international border crossing Terehovo – Burachki were in the end of December of that year, it reached 380-500 trucks, and average waiting time was about 24 – 46 hours. The same situation could be observed on other border crossing points. However, comparing with the same period in 2011, the average waiting time of trucks had been substantially reduced. More than 60 per cent of transit through the Latvian-Russian border falls on Latvian, Polish and Lithuanian road operators.
The main advantage of road freight transit via Latvia and Lithuania over the transit through Belarus is related to less strict customs controls on the Latvian border than those applied on the Belarusian-Polish or Belarusian- Lithuanian border.
7.2.4 Sea ports
Latvian sea ports are one of the main elements in the transit transport chain. There are three large ports: Riga, Ventspils and Liepae as well as seven small ports: Engure, Lielupe, Mersrags, Pavilosta, Roya, Salatsgriva, and Skulte. Large ports are mostly servicing transit cargo handling with 80.0 per cent of freight transit transshipped. Small ports specialize in shipping of timber and receiving fishing products.
Total cargo handled in ports in 2012 was more than 66 million tonnes (about 93.5 per cent of the level in2011). Reduction in 2011 was caused mostly by the drop in processing of cargo biggest Lithuanian ports: Riga port (-8.9 per cent) and Ventspils (-1.0 per cent).
2008 2009 2010 2011 2012 2012/2011 %
Loading of cargo , total including: 57 654 57 565 55 724 61 028 57 068 93.5
Riga 26 430 27 327 27 332 29 807 26 027 87.3
Ventspils 26 392 25 232 23 281 26 190 25 962 99.1
Liepae 3 582 3 839 3 723 3 660 3 991 109.0
Small ports 1 250 1 167 1 388 1 371 1 088 79.4
Unloading of cargo , total including: 5 995 4 415 5 436 7 793 9 063 116.3
Riga 3 136 2 397 3 144 4 247 5 013 118.0
Ventspils 2 177 1 408 1 535 2 262 2 192 96.9
Liepae 6 06 5 43 6 61 1 197 1 720 143.7
Small ports 76 67 96 87 138 158.6
Total volume of cargo processed including: 63 649 61 980 61 160 68 821 66 130 96.1
Riga 29 566 29 724 30 476 34 054 31 039 91.1
Ventspils 29 974 26 640 24 816 28 452 28 154 99.0
Liepae 4 188 4 382 4 384 4 857 5 711 117.6
Small ports 1 326 1 234 1 484 1 458 1 226 84.1
Table 19: Volume of cargo processed in Latvian ports (thousand tons)

Review of the t ranspor t and logis t ics sys tem of the Republ ic of Belarus
100
YEA
R20
12/2
011
%20
0220
0320
0420
0520
0620
0720
0820
0920
1020
1120
12
Tota
l roa
d tr
ansp
ort
36 9
0641
816
44 2
4751
525
54 1
8759
900
54 4
5937
820
46 8
0953
936
52 6
2197
.6
6 16
06
763
7 30
98
547
10 9
3613
142
12 3
448
115
10 5
9012
131
12 1
7810
0.3
Nat
iona
l tra
nspo
rt34
297
38 6
6540
656
46 6
3347
544
51 5
0046
298
31 5
9539
209
44 7
8743
057
96.1
1 93
02
324
2 33
02
767
2 72
92
959
2 53
72
149
2 56
12
646
2 61
698
.9
Inte
rnat
iona
l tra
nspo
rt2
609
3 15
13
591
4 89
26
643
8 40
08
161
6 22
57
600
9 14
99
564
104.
5
4 23
04
439
4 97
95
780
8 20
710
183
9 80
75
966
8 02
99
485
9 56
210
0.8
Expo
rt1
193
1 48
91
744
2 07
23
172
3 60
03
379
2 58
73
231
4 12
54
134
100.
2
1 82
91
950
2 31
22
300
3 52
43
983
3 60
32
346
3 00
74
012
4 03
610
0.6
Impo
rt91
91
172
1 28
61
760
2 04
12
900
2 35
61
517
1 46
31
807
2 23
512
3.7
1 31
01
406
1 48
11
622
2 05
32
648
2 20
91
372
1 61
71
922
2 38
612
4.1
Oth
er in
/out
49
749
056
11
060
1 43
01
900
2 42
62
121
2 90
63
217
3 19
599
.3
1 09
11
083
1 18
61
858
2 63
03
552
3 99
52
248
3 40
53
551
3 14
088
.4
For
own
acco
unt
21 4
9320
962
21 4
1122
249
20 4
5420
100
16 6
4514
019
16 0
5618
264
15 8
2086
.6
1 16
11
260
1 14
31
232
1 15
71
081
905
998
879
964
983
102.
0
For
hire
or
rew
ard
15 4
1320
854
22 8
3629
276
33 7
3339
800
37 8
1423
801
30 7
5335
672
36 8
0110
3.2
4 99
95
503
6 16
67
315
9 77
912
061
11 4
397
117
9 71
111
167
11 1
9510
0.3
Table
18:
Volu
me
of
transp
ort
and f
reig
ht
turn
ove
r by r
oad t
ransp
ort
in L
atv
ia
* the
firs
t lin
e is t
rans
port
volu
me (
thou
sand
tons
), th
e sec
ond
line -
frei
ght t
urno
ver,
billi
on tk
m

E C O N O M I C C O M M I S S I O N F O R E U R O P E
101
Most of the total cargo handled in Latvian ports is outbound. From 2008 to 2012 the share of outbound cargo dropped by 4.3 per cent. This trend was caused by the growth of containerized freight. Large part of such freight has been cargo for the international NATO forces in Afghanistan.
The cargo is sent regularly during the whole year, seasonal fluctuations are insignificant. Riga and Ventspils are largest Latvian ports; in 2012 about 89.5 per cent of total cargo was handled here.
Ventspils has 12 terminals, which processed more than 28 million tons in 2012. It was 1.0 per cent less than in 2011. Volumes of outbound cargo dropped by 0.9 per cent and inbound by 3.1 per cent. This reduction was caused by the drop in volume of potash fertilizers, with a share of 5.8 per cent in total cargo processed in Ventspils. It was by 4.1per cent lower than in 2011.
The freight turnover capacity in Riga was 45 million tonnes per year. Main cargo types, processed here are container freight, black coal, timber, mineral fertilizers, and oil products. In 2012, compared with 2011 the volume of processed cargo dropped by 8.9 per cent and reached 31 million tonnes. At the same time, only the volume of the outbound cargo dropped by 12.7 per cent due to lower deliveries of black coal, oil products, fertilizers and timber. The volume of inbound cargo increased by 18.8 per cent, but the rate of growth was lower in 2012 compared with 2011(by 16.3 per cent).
The volume of cargo handled in the Liepaya port was 4.9 million tonnes in 2012. That was an increase of 10.8 per cent over 2011. Volumes of outbound cargo increased by 9.0 per cent, and inbound by 43.7 per cent. Volume of cargo processed in small ports in 2011 was 1.458 million tonnes, 1.8 per cent more than in 2011.
According to the projects of Latvian Ministry of Communications, the volume of cargo processed in sea ports will double by 2020. Ventspils will process 58 million tonnes of cargo by 2020. As a result of planned modernization, it is expected that Riga port will increase the volume of processed cargo from 30.48 million tonnes (in 2009) to 46 million tonnes (by 2020) or 1.5 times. And Liepaya port is expected to increase the volume by 4.3 times in the same period.
Transit through Latvia is potentially attractive because Riga and Ventspils ports work as free economic zones, and Liepaya port is the part of Liepaya special economic zone. The residents have different benefits and advantages and large undeveloped area can be used in the free ports and free economic zones of Latvia.
7.3 Transit traffic in Lithuania
7.3.1 General description
In the north, Lithuania shares boarder with Latvia (588 kilometres), in the east and south with Belarus (653 kilometres), in the southwest with Poland (104 kilometres), and in the southwest with the Russian Federation (Kaliningrad Region) (248 kilometres). Lithuania has a developed road network, which generally meets the requirements of the EU. The length of roads of national importance is 21 313 kilometres, including 1 724 kilometres of main roads (with 1 485 kilometres of E-roads), 4 864 kilometres of regional roads (including 4 697 kilometres with asphalt-concrete surface) and 14 724 kilometres of district roads (including 5 199 kilometres with asphalt- concrete surface).
Main modes of transport for the carriage of goods in Lithuania are road, rail, pipeline and maritime transport. In 2012, their share was 99.13 per cent in total volume of transport and 99.99 per cent in total cargo turnover by all means of transport. Inland navigation and air transport have insignificant volumes - approximately 0.9 per cent of the total volume of transport and 0.01per cent of total cargo turnover by all means of transport.

Review of the t ranspor t and logis t ics sys tem of the Republ ic of Belarus
102
7.3.2 Road transport
In 2012, road transport in Lithuania carried 48 427.6 thousand tonnes of cargo (which was 5.2 per cent more than in 2011). The cargo turnover reached 23 449 tonne-kilometres (9.0 per cent more than in 2011). In domestic traffic 30 295.5 thousand tonnes were transported, which is 65.8 per cent of total transport, whereas 15 679.6 thousand tonnes were transported in international transport (34.2 per cent). Cargo turnover in domestic road transport was 10.4 per cent while in international traffic it reached 89.6 per cent of total cargo turnover.
Road transport through Lithuania is carried out on three routes:1. From European countries to Russia through Lithuania and Latvia and back. Most of the
through transport by road is transported via this route. Due to the absence of customs control at the border between Lithuania and Latvia this transit freight traffic is monitored and taken into account by the Latvian customs service at international checkpoints Terehovo - Burachki and Grebnevo - Ubylinka, located on the Latvian - Russian border.
2. From Klaipeda sea port to Russia through Latvia and Lithuania and back. Transit goods are delivered to Russia from Klaipeda via this route through Latvian checkpoints Terehovo-Burachki and Grebnevo - Ubylinka which is the same as in the first route. The volume of transport via this route is taken into account at checkpoints on the Latvian - Russian border (the analysis is given in the section on Latvia).
3. From Klaipeda port and ports of Kaliningrad Region through Belarus to Russia, Ukraine, and other countries and back. This route is not an alternative to through traffic going within the pan-European transport corridor II through Belarus in East-West direction.
Development of transit via the first and the second route reduced transport through Belarus, whereas via the third rout leads to increase. This alternative should be considered in development of Belarusian transport infrastructure.
The cargo transit through Kaliningrad is an important part of transit of Russian goods by road and rail through Lithuania to Kaliningrad Region and back. All the goods, imported and exported outside of Lithuania pass the procedure of border, customs, veterinary and phytosanitary control.
7.3.3 Railway transport
Railway transport in Lithuania is ranked first by volume of transit and the second by turnover. Rail transport carried 49.38 million tonnes in 2012 and 14 171.64 million tonne kilometres. 14.89 million tonnes were transported in domestic transport (30.2 per cent of the total volume) and 3 611.78 million tonne kilometres (25.5 per cent of total cargo turnover).
Therefore, international cargo transport is the main activity of the Lithuanian Railways. The structure of international rail transport includes 17.03 million tonnes of import (49.4 per cent), 5.29 million tonnes of export (15.3 per cent), and 12.16 million tonnes in transit (35.3 per cent). In comparison with 2008, the total volume has declined by 32.8 per cent. Respectively, the share of transit in international transport has decreased from 45.7 per cent in 2008 to 35.3 per cent 2012.
Direction of cargo transport of the Lithuanian Railways is shown in the chart below. The main part of cargo transport in international traffic is made of Russian and Belarusian goods (respectively 42.2 per cent and 36.2 per cent). The share of other countries, Poland, Ukraine, Latvia, Kazakhstan, Estonia etc. is 21.6 per cent.

E C O N O M I C C O M M I S S I O N F O R E U R O P E
103
Figure 75: Direction of international transport by rail in Lithuania by country of origin/destination (2012)
Most of international transport (74.8 per cent in 2008 and 75.2 per cent in 2012) goes through Lithuania by road with transshipment in sea ports.
Figure 76: Distribution of total volume of transit transport by rail through Lithuania
According to the Ministry of transport and communications of Lithuania, total amount of transit transport by rail (including transit goods transported via sea ports of Lithuania) has dropped from 29.62 million tonnes in 2008 to 25.94 million tonnes in 2012 or by 12.4 per cent.
In 2012, in comparison with 2011, the total amount of transit by rail (considering transit goods, transported via sea ports of Lithuania) has decreased from 28.78 million tonnes in 2011 to 25.94 million tonnes in 2012 or by 9.0 per cent, mainly due to 10.0 per cent decline in transport of cargo bound for seaports of Lithuania and by 10.7 per cent decrease in transport of cargo bound to Kaliningrad Region.
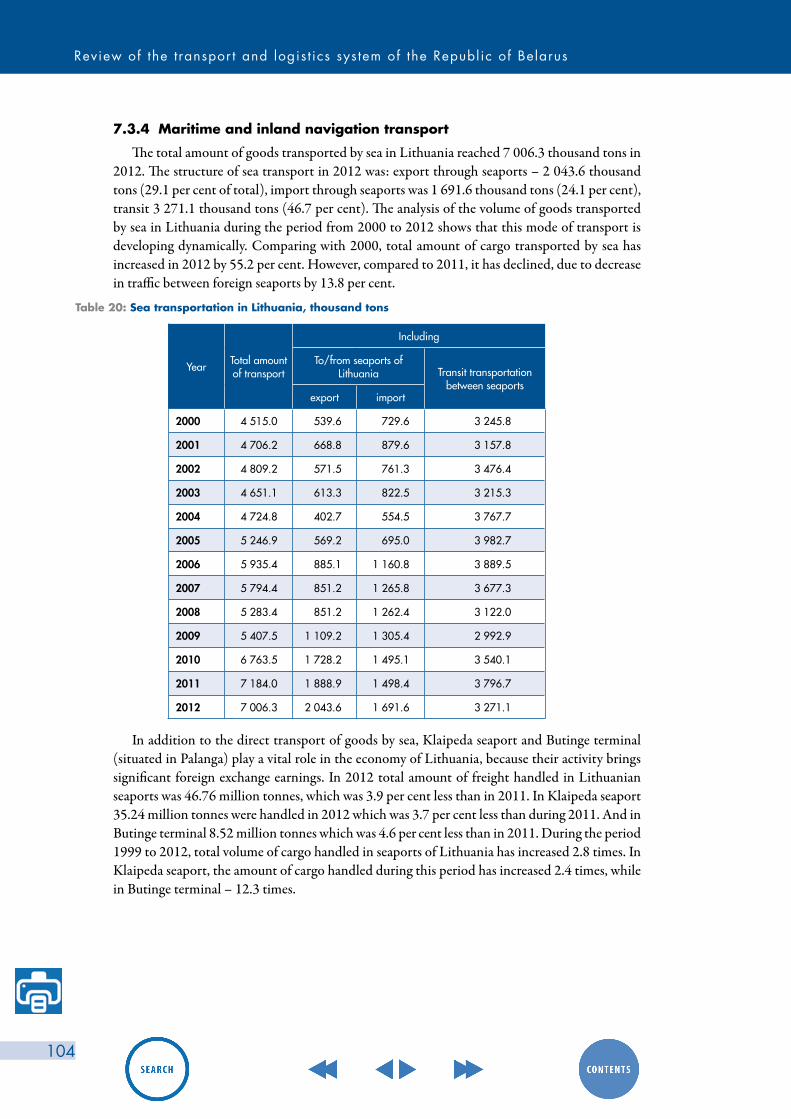
Review of the t ranspor t and logis t ics sys tem of the Republ ic of Belarus
104
7.3.4 Maritime and inland navigation transport
The total amount of goods transported by sea in Lithuania reached 7 006.3 thousand tons in 2012. The structure of sea transport in 2012 was: export through seaports – 2 043.6 thousand tons (29.1 per cent of total), import through seaports was 1 691.6 thousand tons (24.1 per cent), transit 3 271.1 thousand tons (46.7 per cent). The analysis of the volume of goods transported by sea in Lithuania during the period from 2000 to 2012 shows that this mode of transport is developing dynamically. Comparing with 2000, total amount of cargo transported by sea has increased in 2012 by 55.2 per cent. However, compared to 2011, it has declined, due to decrease in traffic between foreign seaports by 13.8 per cent.
Table 20: Sea transportation in Lithuania, thousand tons
Year Total amount of transport
Including
To/from seaports of Lithuania Transit transportation
between seaportsexport import
2000 4 515.0 539.6 729.6 3 245.8
2001 4 706.2 668.8 879.6 3 157.8
2002 4 809.2 571.5 761.3 3 476.4
2003 4 651.1 613.3 822.5 3 215.3
2004 4 724.8 402.7 554.5 3 767.7
2005 5 246.9 569.2 695.0 3 982.7
2006 5 935.4 885.1 1 160.8 3 889.5
2007 5 794.4 851.2 1 265.8 3 677.3
2008 5 283.4 851.2 1 262.4 3 122.0
2009 5 407.5 1 109.2 1 305.4 2 992.9
2010 6 763.5 1 728.2 1 495.1 3 540.1
2011 7 184.0 1 888.9 1 498.4 3 796.7
2012 7 006.3 2 043.6 1 691.6 3 271.1
In addition to the direct transport of goods by sea, Klaipeda seaport and Butinge terminal (situated in Palanga) play a vital role in the economy of Lithuania, because their activity brings significant foreign exchange earnings. In 2012 total amount of freight handled in Lithuanian seaports was 46.76 million tonnes, which was 3.9 per cent less than in 2011. In Klaipeda seaport 35.24 million tonnes were handled in 2012 which was 3.7 per cent less than during 2011. And in Butinge terminal 8.52 million tonnes which was 4.6 per cent less than in 2011. During the period 1999 to 2012, total volume of cargo handled in seaports of Lithuania has increased 2.8 times. In Klaipeda seaport, the amount of cargo handled during this period has increased 2.4 times, while in Butinge terminal – 12.3 times.
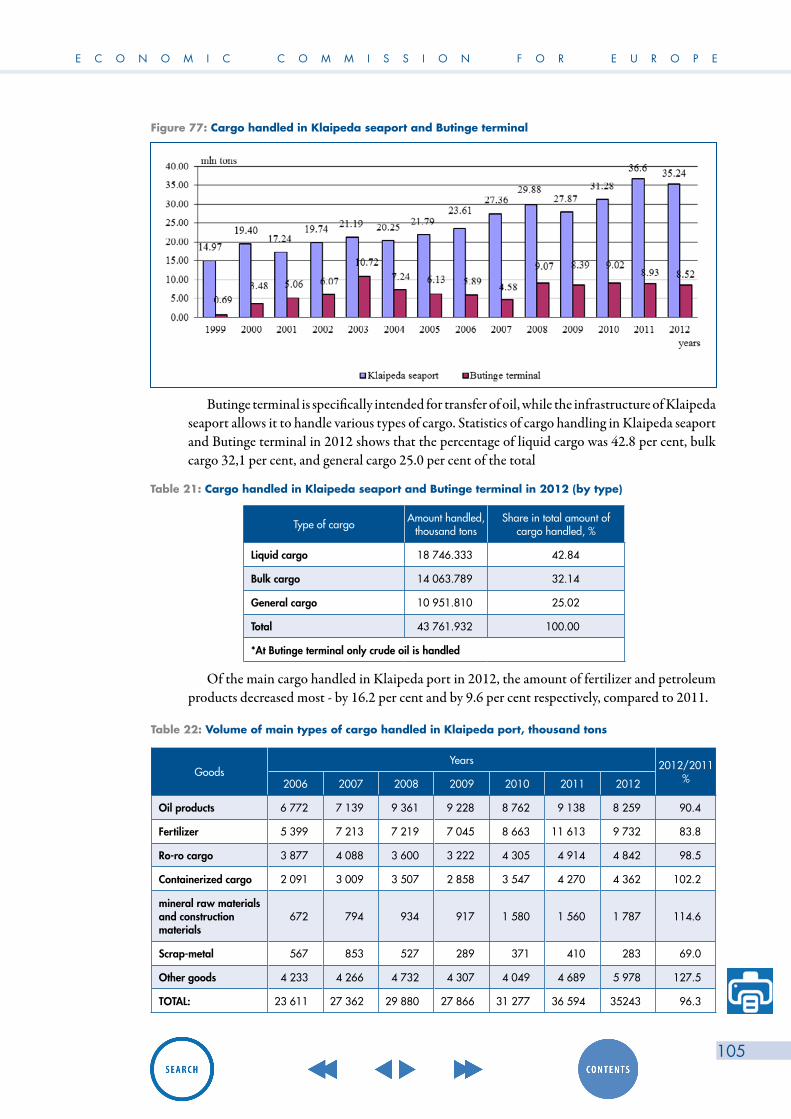
E C O N O M I C C O M M I S S I O N F O R E U R O P E
105
Figure 77: Cargo handled in Klaipeda seaport and Butinge terminal
Type of cargo Amount handled, thousand tons
Share in total amount of cargo handled, %
Liquid cargo 18 746.333 42.84
Bulk cargo 14 063.789 32.14
General cargo 10 951.810 25.02
Total 43 761.932 100.00
*At Butinge terminal only crude oil is handled
GoodsYears 2012/2011
%2006 2007 2008 2009 2010 2011 2012
Oil products 6 772 7 139 9 361 9 228 8 762 9 138 8 259 90.4
Fertilizer 5 399 7 213 7 219 7 045 8 663 11 613 9 732 83.8
Ro-ro cargo 3 877 4 088 3 600 3 222 4 305 4 914 4 842 98.5
Containerized cargo 2 091 3 009 3 507 2 858 3 547 4 270 4 362 102.2
mineral raw materials and construction materials
672 794 934 917 1 580 1 560 1 787 114.6
Scrap-metal 567 853 527 289 371 410 283 69.0
Other goods 4 233 4 266 4 732 4 307 4 049 4 689 5 978 127.5
TOTAL: 23 611 27 362 29 880 27 866 31 277 36 594 35243 96.3
Butinge terminal is specifically intended for transfer of oil, while the infrastructure of Klaipeda seaport allows it to handle various types of cargo. Statistics of cargo handling in Klaipeda seaport and Butinge terminal in 2012 shows that the percentage of liquid cargo was 42.8 per cent, bulk cargo 32,1 per cent, and general cargo 25.0 per cent of the total
Table 21: Cargo handled in Klaipeda seaport and Butinge terminal in 2012 (by type)
Of the main cargo handled in Klaipeda port in 2012, the amount of fertilizer and petroleum products decreased most - by 16.2 per cent and by 9.6 per cent respectively, compared to 2011.
Table 22: Volume of main types of cargo handled in Klaipeda port, thousand tons

Review of the t ranspor t and logis t ics sys tem of the Republ ic of Belarus
106
In 2012, Klaipeda port handled 20.4 million tonnes of Lithuanian foreign trade goods, that is 58.5 per cent of total amount of cargo handled, as well as 14.6 million tonnes of transit cargo, which is 41.5 per cent of total amount of cargo handled at the port.
Table 23: Cargo handled in Klaipeda port in 2012 by origin/destination
Direction of traffic Amount of freight traffic, million tonnes Share in total freight traffic
Lithuania 20.6 58.5
Transit including: 14.6 41.5
Belarus 10.8 30.7
The Russian Federation 2.8 8.0
Other countries 1.0 2.8
Total 35.2 100.0
From 2001, the volume of Lithuanian foreign trade goods handled in Klaipeda port has exceeded the volume of transit goods (Figure 78)
Figure 78: Volume of transit and Lithuanian goods handled in Klaipeda port
Such distribution of cargo traffic is caused mainly by the development of modern logistic infrastructure in Lithuania alongside with the establishment of the appropriate legal and regulatory framework, which makes possible re-invoicing in export-import trade, which mean decrease or increase in the cost of goods. Reduction of customs value of goods under customs clearance makes it possible in future to import goods on the invoices, which are significantly lower than the price of the goods in the present invoices of a foreign seller. Increased costs (and thus increase in customs costs) is aimed at accumulating more profit in foreign company at the initial stage of the operating cycle, and consequently reducing tax burden in the calculation of income tax of the importing company. As the result of this procedure, during the period from 1994 to 2012 the volume of Lithuanian foreign trade goods handled in Klaipeda port has increased six times (from 3.4 million tonnes in 1994 to 20.6 million tonnes in 2012), whereas the volume of transit goods, has increased only by 45.9 per cent (from 11.1 million tonnes in 1994 to 14.6 million tonnes in 2012).
Compared to 2011, transit traffic through Lithuania in 2012 declined by 9.9 per cent. This was due to decrease in transit traffic to/from Belarus by 6.1 per cent and to/from the Russian Federation
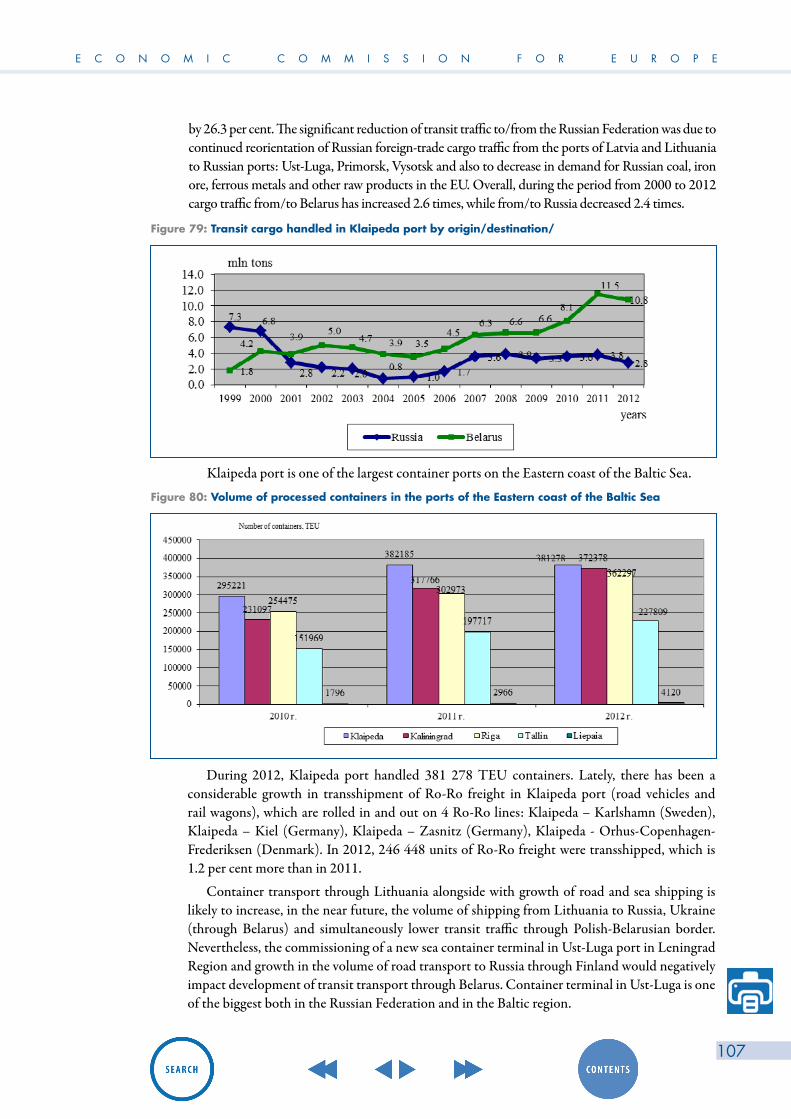
E C O N O M I C C O M M I S S I O N F O R E U R O P E
107
by 26.3 per cent. The significant reduction of transit traffic to/from the Russian Federation was due to continued reorientation of Russian foreign-trade cargo traffic from the ports of Latvia and Lithuania to Russian ports: Ust-Luga, Primorsk, Vysotsk and also to decrease in demand for Russian coal, iron ore, ferrous metals and other raw products in the EU. Overall, during the period from 2000 to 2012 cargo traffic from/to Belarus has increased 2.6 times, while from/to Russia decreased 2.4 times.
Figure 79: Transit cargo handled in Klaipeda port by origin/destination/
Klaipeda port is one of the largest container ports on the Eastern coast of the Baltic Sea.
Figure 80: Volume of processed containers in the ports of the Eastern coast of the Baltic Sea
During 2012, Klaipeda port handled 381 278 TEU containers. Lately, there has been a considerable growth in transshipment of Ro-Ro freight in Klaipeda port (road vehicles and rail wagons), which are rolled in and out on 4 Ro-Ro lines: Klaipeda – Karlshamn (Sweden), Klaipeda – Kiel (Germany), Klaipeda – Zasnitz (Germany), Klaipeda - Orhus-Copenhagen-Frederiksen (Denmark). In 2012, 246 448 units of Ro-Ro freight were transshipped, which is 1.2 per cent more than in 2011.
Container transport through Lithuania alongside with growth of road and sea shipping is likely to increase, in the near future, the volume of shipping from Lithuania to Russia, Ukraine (through Belarus) and simultaneously lower transit traffic through Polish-Belarusian border. Nevertheless, the commissioning of a new sea container terminal in Ust-Luga port in Leningrad Region and growth in the volume of road transport to Russia through Finland would negatively impact development of transit transport through Belarus. Container terminal in Ust-Luga is one of the biggest both in the Russian Federation and in the Baltic region.
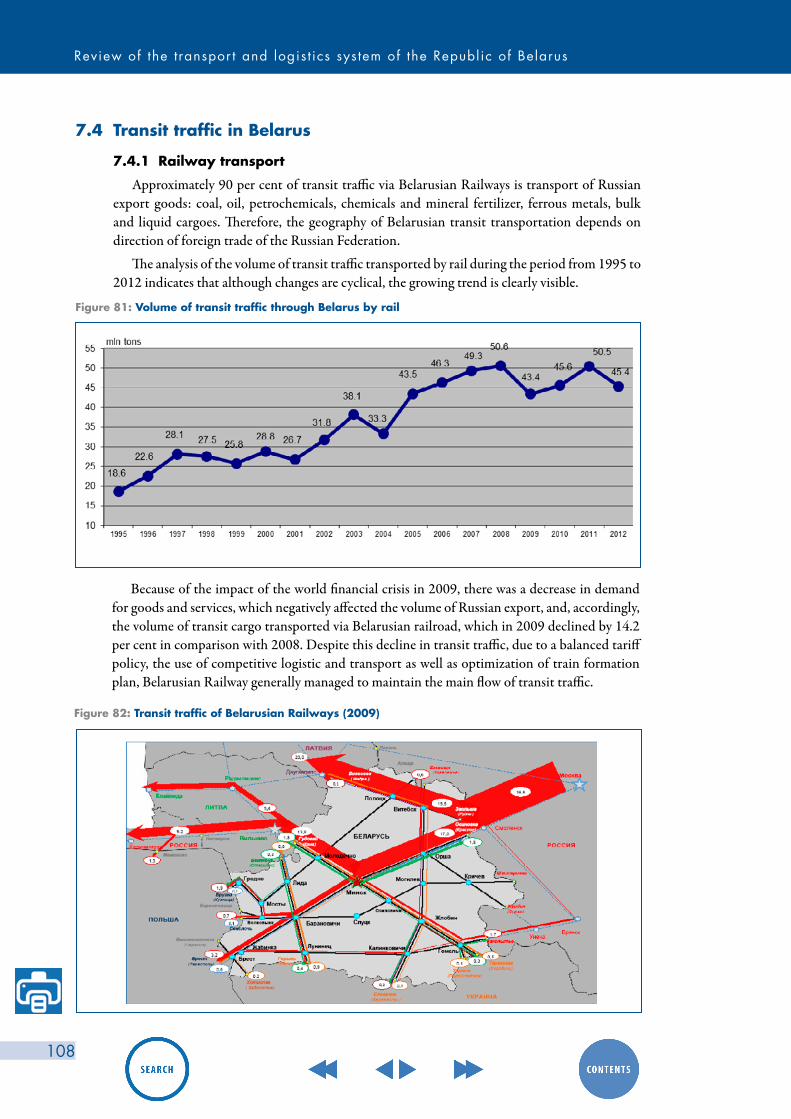
Review of the t ranspor t and logis t ics sys tem of the Republ ic of Belarus
108
7.4 Transit traffic in Belarus
7.4.1 Railway transport
Approximately 90 per cent of transit traffic via Belarusian Railways is transport of Russian export goods: coal, oil, petrochemicals, chemicals and mineral fertilizer, ferrous metals, bulk and liquid cargoes. Therefore, the geography of Belarusian transit transportation depends on direction of foreign trade of the Russian Federation.
The analysis of the volume of transit traffic transported by rail during the period from 1995 to 2012 indicates that although changes are cyclical, the growing trend is clearly visible.
Figure 81: Volume of transit traffic through Belarus by rail
Because of the impact of the world financial crisis in 2009, there was a decrease in demand for goods and services, which negatively affected the volume of Russian export, and, accordingly, the volume of transit cargo transported via Belarusian railroad, which in 2009 declined by 14.2 per cent in comparison with 2008. Despite this decline in transit traffic, due to a balanced tariff policy, the use of competitive logistic and transport as well as optimization of train formation plan, Belarusian Railway generally managed to maintain the main flow of transit traffic.
Figure 82: Transit traffic of Belarusian Railways (2009)

E C O N O M I C C O M M I S S I O N F O R E U R O P E
109
In 2011, the growth in the volume of transit cargo transported by the Belarusian Railway continued. The amount of transit traffic has increased from 45.6 million tonnes to 50.5 million tonnes or by 10.7 per cent. In the same year, the amount of transit traffic bound for Latvia was 21.5 million tonnes (increase of 32.2 percent compared to 2010), where the amount of transported coal was 18.9 million tonnes (increase of 29.0 per cent compared to 2010), oil cargo 844 thousand tons (10.4 per cent increase compared to 2010), iron ore 693 thousand tons (7.5 times more than in 2010).
The volume of transit traffic bound for Kaliningrad Region in 2011 was 12.0 million tonnes ( drop by 7 per cent compared to 2010). The main goods were oil and petrochemicals with 5.5 million tonnes, coal 2.4 million tonnes, and ferrous metals with 1.3 million tonnes.
The amount of transit traffic bound for Lithuania in 2011 was 7.4 million tonnes (increase of 1.3 per cent compared to 2010). The growth of 760 thousand tons was due to increase in transport of iron ore.
In the “East-West-East” direction in 2011 the volume of transit traffic amounted to 9.7 million tonnes (4.8 per cent more than in 2010). In 2012, the volume of transit traffic was 45.4 million tonnes which is 11.1 per cent less than in 2011. Since the main transit traffic arrives at the Belarusian Railway from Russia, the main cause of its decline is a reduction in the movement of transit cargo to Smolensk direction of the Moscow Railway by 20 per cent, compared to 2011. The main causes of decline in throughput on Smolensk direction of the Moscow Railway in 2012 were increased summer works on tracks, excess rolling stock of JSC “RJD” (the fleet of railcars exceeded by 20-25 per cent) on the network, shortage of locomotive traction and decline of the quality of dispatching. Apart from aforementioned organizational and technical factors, other reasons for reductions of the volume of transit traffic in 2012 were: reorientation of Russian foreign trade from Latvian and Lithuanian ports to the ports situated in Leningrad Region: Ust-Luga, Primorsk, Vysotsk; and decline in demand for coal, iron ore, ferrous metals and other raw materials exported from Russia to the EU. Influenced by abovementioned factors, the decline in transit cargo traffic includes: decrease in transport of coal by 3.1 million tonnes (in the direction of Poland by 2.5 million tonnes, and in the direction of Kaliningrad Region by 0.9 million tonnes; decrease in transport of petrochemicals by 0.9 million tonnes (in direction of Latvia by 0.5 million tonnes, Lithuania 0.4 million tonnes, and Kaliningrad Region by 0.3 million tonnes; fertilizers by 0.5 million tonnes (in direction of Lithuania by 0.4 million tonnes; ferrous metals by 0.2 million tonnes; and iron ore by 0.5 million tonnes, .
Figure 83: Transit of cargo through Belarusian Railway (2012)
To solve organizational and technical problems encountered in the Smolensk direction of Moscow Railways during the summer work on tracks, instead of the route Osinovka – Bigosovo,

Review of the t ranspor t and logis t ics sys tem of the Republ ic of Belarus
110
transit transport was organized on the new routes through the border stations Ezerische and Zakopyte towards Bigosovo station (bypassing the sections on which track works were organized). Despite the increase in the distance, the total cost of transport on the new routes remained unchanged. This was due to the fact that the Belarusian Railways set special tariffs for transit switched to new routes, to keep the same overall costs of transportation on major new routes for the shippers. As a result, , in 2012 the volume of traffic on the routes Ezerische - Bigosovo and Zakopyte - Bigosovo was 2.6 million tonnes, or 2.6 times more than in 2011.
By establishing attractive tariffs for the delivery of goods, Belarusian Railway managed to partially compensate decline in shipments from Russia by increasing transit volumes from Lithuania (12 percent more than in 2011), Estonia (42 per cent more than in 2011), Kazakhstan (10 per cent more than in 2011), Poland (39 per cent more than in 2011), Germany (15 per cent more than in 2011), and the Czech Republic (8 per cent more than in 2011). However, considering the dominant role of Russian export of goods in transit through Belarusian territory, even a significant increase in traffic from other countries could not completely offset the decline in the volume of cargo transit from Russia. It should be noted that transport from the Russian Federation towards the ports of the Baltic Countries and Poland is carried out by the “leftover principle” - after securing the full capacity utilization of their own ports.
Considering that the Belarusian Railways is the most important link to the Kaliningrad region and other regions of the Russian Federation, for the Republic of Belarus the most promising is the development of transit traffic in the Kaliningrad direction. Prospects for stabilizing cargo traffic in this area are associated with the plans of the Russian Federation for the construction of the new deep-water port on the North Cape situated in Balga Peninsula in the Kaliningrad region in 2012 - 2013. It is planned that the total volume of cargo handled at the port Balga will be the largest in the Baltic region and will amount to 131.5 million tonnes, 30 per cent more than the total volume of cargo handled in all ports of Latvia and Lithuania.
Taking into account the increased competition with the railway administrations of neighboring countries, in order to maintain existing and attract new transit freight, it is necessary to pursue a balanced tariffs policy, offer competitive transport and logistics solutions for switching transit traffic from alternative routes, and undertake measures to improve the organization of transportation with fast container trains.
In 2012, container trains transported more than 261 thousand TEUs containers, 16.6 per cent more than in 2011. Moreover, freight in containers is mostly transported with registration of a single transport document (CIM/SMGS consignment note). Thanks to the improvement of the organization of transport in the period from 2007 to 2012, the volume of containers transported by container trains has increased 4.4 times.
Figure 84: Number of containers carried by Belarusian Railway
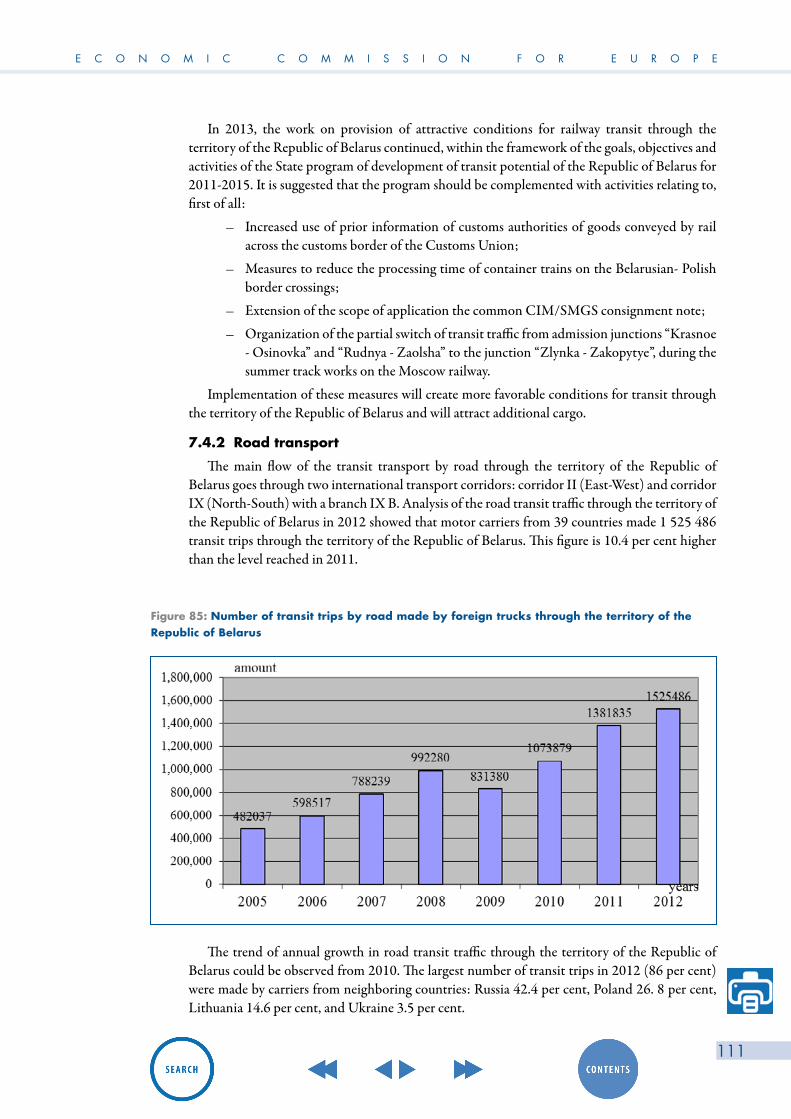
E C O N O M I C C O M M I S S I O N F O R E U R O P E
111
In 2013, the work on provision of attractive conditions for railway transit through the territory of the Republic of Belarus continued, within the framework of the goals, objectives and activities of the State program of development of transit potential of the Republic of Belarus for 2011-2015. It is suggested that the program should be complemented with activities relating to, first of all:
– Increased use of prior information of customs authorities of goods conveyed by rail across the customs border of the Customs Union;
– Measures to reduce the processing time of container trains on the Belarusian- Polish border crossings;
– Extension of the scope of application the common CIM/SMGS consignment note;
– Organization of the partial switch of transit traffic from admission junctions “Krasnoe - Osinovka” and “Rudnya - Zaolsha” to the junction “Zlynka - Zakopytye”, during the summer track works on the Moscow railway.
Implementation of these measures will create more favorable conditions for transit through the territory of the Republic of Belarus and will attract additional cargo.
7.4.2 Road transport
The main flow of the transit transport by road through the territory of the Republic of Belarus goes through two international transport corridors: corridor II (East-West) and corridor IX (North-South) with a branch IX B. Analysis of the road transit traffic through the territory of the Republic of Belarus in 2012 showed that motor carriers from 39 countries made 1 525 486 transit trips through the territory of the Republic of Belarus. This figure is 10.4 per cent higher than the level reached in 2011.
Figure 85: Number of transit trips by road made by foreign trucks through the territory of theRepublic of Belarus
The trend of annual growth in road transit traffic through the territory of the Republic of Belarus could be observed from 2010. The largest number of transit trips in 2012 (86 per cent) were made by carriers from neighboring countries: Russia 42.4 per cent, Poland 26. 8 per cent, Lithuania 14.6 per cent, and Ukraine 3.5 per cent.

Review of the t ranspor t and logis t ics sys tem of the Republ ic of Belarus
112
Figure 86: Transit transport by foreign trucks through the territory of the Republic of Belarus by country of carriers’ registration. (2012)
A similar pattern of transport was observed in previous years. According to customs statistics total transit of goods by road through the territory of the Republic of Belarus in 2012 was 14.9 million tonnes; this was 12.4 per cent higher than in 2011, 33.3 per cent higher than in 2010, 60.9 per cent higher than in 2009 and 48.9 per cent higher than in 2008.
Figure 87: Volume of road freight transit through Belarus
Most of the goods in road transit (14.1 million tonnes, or 94.7 per cent in 2012, 12.5 million tonnes or 94.8 per cent in 2011, 10.5 million tonnes or 94 per cent in 2010) passes in direction West-East–West. These are mainly goods which are transported to and from the Russian Federation. At the same time, the total volume of transit through Lithuania and Latvia (bypassing Belarus) in 2012 amounted to only 2.8 million tonnes, which is 5 times less than through the territory of the Republic of Belarus. Total volume of transit through the territory of Ukraine in 2012 amounted to 4.8 million tonnes, which is 3 times less than through the territory of the Republic of Belarus.
Between 5–7 per cent of the total transit by road (0.783 million tonnes, or 5.3 per cent in 2012, 0.7 million tonnes, or 5.2 per cent in 2011, 0.7 million tonnes, or 6.0 per cent in 2010 and 0.6 million tonnes, or 6.8 per cent in 2009) flows annually in direction North - South through the territory of the Republic of Belarus. These are mainly goods which are transported to and from Ukraine, Russian Federation (North- West Federal District) and the Baltic countries.

E C O N O M I C C O M M I S S I O N F O R E U R O P E
113
Figure 88: Transit transport of goods by road through the territory of the Republic of Belarus and through the territory of neighboring countries
90
20
11
20
12
0.78
3 mi
ll.t
1068
0
10.6
80 m
ill.t
14.1
06 m
ill.t
2.83
4 mi
ll.t
1.41
1 mi
ll.t
3.43
9 mi
ll.t
4.85
0 mi
ll.t
106
3.42
6 mi
ll.t
0.42
2 mi
ll.t
0.36
1 mi
ll.t
1.45
8 mi
ll.t
3.55
3 mi
ll.t
0.31
7mi
ll.t
5.01
1 mi
ll.t
0.
688
mill.t
2.29
1 mi
ll.t
9.77
5 mi
ll.t
.
0.37
1 mi
ll.t
12.5
75 m
ill.t
2.80
0 mi
ll.t
Tota
l tra
nsit
thro
ugh
the R
epub
lic of
Be
larus
- 13
246
milli
on to
nnes
To
tal t
rans
it th
roug
h th
e Rep
ublic
of
Belar
us -
14 8
89 m
illion
tonn
es
- Tra
nsit
West
- Ea
st
- Tra
nsit
North
- So
uth
-
Trans
it th
roug
h La
tvia a
nd Li
thua
nia
- Tra
nsit
thro
ugh
Ukra
ine

Review of the t ranspor t and logis t ics sys tem of the Republ ic of Belarus
114
The increase in transit traffic by road through the territory of Belarus in 2012 compared to 2011 was largely due to the growth of exports of goods and products from the EU to the Russian Federation. Thus, exports of goods and products from Germany to Russia in 2012, compared to the same period in 2011, increased by 15 per cent. In addition, from April 2011, implementation of controls over the international road transportation at the external borders of the Customs Union contributed to the increase in the volume of transit traffic. Established in June 2012, the compulsory advance information about goods imported into the customs territory of the Customs Union by road, should further contribute to increased attractiveness of transit by road through the territory of the Republic of Belarus. This measure will minimize the risks of breaches of customs legislation, expedite customs control operations and enhance its effectiveness. Continuation of the work on the implementation of plans to develop roadside services on national highways will additionally create more attractive conditions for development of transit road transport.
E C O N O M I C C O M M I S S I O N F O R E U R O P E
115
8. Proposals for development of transport and logistics systems in the Republic of Belarus
In transit traffic, the effectiveness of transport passing through state borders is to a large extent determined by the capacity of border crossing points. Until now, long waiting times for vehicles in customs clearance points have been reducing traffic flows. Reduction of waiting time of vehicles for customs and related controls is one of the major reserves for improvements of transport efficiency. To solve this problem, it is necessary to continue the work on improving customs legislation, the implementation of modern information technologies for customs control, and develop transport infrastructure. To reduce waiting times by improving transport technologies of customs control, the following actions should be implemented:
• Expand the application of the special scanning devices (mobile inspection and scanning systems) and equip with these devices all the customs clearance points that are located on road check points along the state border of the Republic of Belarus till the year 2015. At present, only five customs clearance points on the state border with Poland and Lithuania are equipped with mobile inspection and scanning systems. Application of inspection and scanning systems will allow the opening of cargo space for not more than 0.5 per cent of the vehicles moved in transit;
• Introduce the experience of the Russian Federation, “one stop - one shop.” In June 2011, the Russian Federal Law of 28th December 2010 (amended on 18th July 2011) came in power amending certain legislative acts of the Russian Federation in connection with the transfer of authority for certain types of State control of the Customs authorities of the Russian Federation. . According to this law, the new management technology of border control of persons, vehicles, cargo, goods and animals was introduced in the customs checkpoints. This technology provides for control based on the principle of “one stop - one shop.” According to this principle, all the functions of state border control concerning legal bodies are distributed between two services. Border Guard Service carries out the passport control and all the other types of controls are performed by Customs Service. The performance of transport control, documents check on imported goods that are subjected to veterinary, quarantine, sanitary and phytosanitary controls is transmitted to the Customs officers. However, in case of the doubt in authenticity of documents, violations of the conditions of transport, damage to the packaging, or violations of the integrity of a container, all the documents are transferred to the representatives of the competent supervisory authorities for further review, who will make the final decision on admission of goods across the border. There is also a mandatory list of goods that are subjected to search and verification by bodies of Russian Agency for Health and Consumer Rights and Federal Service for Veterinary and Phytosanitary Surveillance. The introduction of the technology, according to the principle of “one stop - one shop”, has shown that the waiting time of vehicles at border crossing points was halved;
• To provide one hundred percent coverage of automated system of electronic prior notification of goods transported by road. Besides, in 2014 a mandatory system of preliminary information on goods transported by rail across the state border of the Republic of Belarus should be introduced. This will allow reduction of the time spent on waiting for goods to be released at border crossings by about 1.5 times.
The attractiveness of the transit routes through the territory of the Republic of Belarus is largely determined by the level of development of transport infrastructure for the provision
Review of the t ranspor t and logis t ics sys tem of the Republ ic of Belarus
116
of comprehensive services in transit, including transport and logistics services. Currently the processing capacity of Russian transport and logistics centers in Moscow and the Moscow region is almost exhausted. In perspective, they will not be able to process the constantly growing freight traffic in transit from Belarus. In this regard the following measures for the development of entire transport and logistics system must be implemented in the Republic of Belarus:
1. Use the provisions of the Customs Code Article 79 of the Customs Union, in part, the right of a resident of the Republic of Belarus to make customs clearances of cargo destined to the business entities in Russia and Kazakhstan. Therefore, negotiations should continue to abolish the requirements of Russian side to Belarusian carriers for the authorizations of third-countries for the goods in transit processed in the logistics centers of the Republic of Belarus;
2. Amend the Agreement between the Government of the Republic of Belarus and the Government of the Russian Federation “On Principles of Levying Indirect Taxes on Exports And Imports of Goods, Performance of Work, Rendering of Services” from 1st January 2005, As well as the Agreement between the Government of the Republic of Belarus and the Government of the Republic of Kazakhstan “On Principles of Levying Indirect Taxes on Exports And I ports of Goods (Works)” fro the st September 1999. The amendment should be in the part related to the provision concerning the granting of a delay on payment of VAT up to 180 calendar days for residents of the Republic of Belarus, who made customs clearance of cargo, transported to the economic entities in Russia and Kazakhstan;
3. Legislate a special simplified customs clearance procedure in logistics centers;4. To reduce the cost and time for railway cargo transport, separate procedure for customs
clearance and cargo release;5. To simplify document management in the provision of logistics services, use automation
and standardization of transport and relevant documents, and gradually introduce automated control system for transport and logistics centers, in accordance with state programs on informatics, automation and development of transit potential of the Republic of Belarus;
6. Develop effective use of transit capacity through technologies for transport of transit cargo by container trains;
7. Develop the infrastructure of national customs clearance points through accredited forwarding and logistics companies providing customs and information services, and customs representation services.
8. In the frame of Eurasian Economic Community, continue the work on unification of the legislation in the sphere of logistics and freight forwarding, taking into account the interest of local forwarders and logistics providers.
9. Abolish the practice of compulsory convoying of certain transports;10. Eliminate corruption at checkpoints across the state border.
These complicated tasks can be accomplished only in close collaboration, at the Governmental level of the Republic of Belarus with Latvia, Lithuania and Poland. Technical and other standards should be implemented simultaneously in all countries of the EU, to avoid the possibility of freight operators to pass through one of these countries.
Improving customs legislation requires, first of all, measures in the field of regulation of customs support of transportation of goods under the Customs Convention on the International Transport of Goods under Cover of TIR Carnets, 1975, and in the application of the TIR system in the customs territory of the Customs Union. This is due to the fact that the Federal Customs Service (FCS) of Russia issued an internal letter on 04 July 2013 «On International

E C O N O M I C C O M M I S S I O N F O R E U R O P E
117
Transportation under the cover of TIR Carnets”, addressed to the heads of Russian customs authorities. According to the letter, the customs authorities of the Russian Federation will begin from 14 September 2013 to place goods under the customs procedure of transit under the cover of TIR Carnet, only after ensuring compliance with customs transit measures imposed by paragraph 1 of Article 217 of the Customs Code of the Customs Union (CU CC). “
These measures include:
– Ensuring payment of customs duties and taxes on imported goods in accordance with Chapter 12 of the Customs Code of The Customs Union of Belarus, Kazakhstan, and Russia;
– Customs escort;
– Establish a route for transport of goods.
Practically it means that from 14th September 2013 import of goods is allowed by customs authority only if the carrier provides additional security for the payment of customs duties (guarantee, bank guarantee, advance payment of customs duties, etc.). Therefore the issuance of the letter and the actions of FCS of Russia that followed, violate a number of rules of international and national legislation, in particular the provisions of the TIR Convention, 1975, the Customs Code of the Customs Union and other normative legal acts in the field of customs.
Consequently, the following procedure can be installed in transit through the Republic of Belarus:
– Delivery of cargo from Customs, located at the outer border of the Customs Union to the first Russian customs authorities under the TIR or under any other transit guarantee;
– Placement of the vehicle and the cargo in the Zone of Customs Control of Temporary Storage Warehouse;
– Obtaining the necessary guarantees from Russian authorized bodies;
– Delivery of the goods at the customs office inside the Russian Federation.
The time interval includes accommodation in the Zone of Customs Control of Temporary Storage Warehouse (if available) for 12 hours, carrying out all the administrative procedures in 72 hours, which makes total time of 84 hours or more. Therefore, in order to solve this problem, it is required to adopt the agreement “On the use of the Customs Convention on the International Transport of Goods under Cover of TIR Carnets in 1975 at the customs territory of the Customs Union.”
Advantageous geographical location and a high level of development of transport infrastructure create prerequisites for the accession of the Republic of Belarus to the project of building a transcontinental road corridor “Western Europe - Western China” on the route St. Petersburg-Moscow-Nizhny Novgorod-Kazan- Orenburg- Aktobe-Kyzylorda-Shymkent-Almaty-Khorgos-Urumqi-Lanzhou-Zhengzhou-Lianyungang.
This project, implemented in cooperation with the Russian Federation, Kazakhstan and China, will accelerate the delivery of goods from China to Europe by 4.5 times. By 2020, the volume of traffic on this route is forecasted to reach approximately 33 million tonnes per year. Accession of the Republic of Belarus to the transport corridor “Western Europe - Western China” is possible through incorporating in it branches of within 2nd and 9th International transport corridors passing through Belarusin the direction of the western border of the Customs Union and the ports of the Baltic Sea through road checkpoints Kozlovichi and Kamenny Log. Joining these branches to the route will attract road transporters, as the road M-1/E30 Brest-Minsk-Russian border along its entire length corresponds to the standard of category I and has four

Review of the t ranspor t and logis t ics sys tem of the Republ ic of Belarus
118
lanes. The roads in direction of the border crossing Kamenny Log also have 2 - 4 lanes , and provides safe conditions for traffic. In this regard, it is necessary to work out the organizational and legal issues for accession of the Republic of Belarus to the transport corridor “Western Europe - Western China» in the first place, in consultation with the transport authorities of the Member States of the Customs Union.

E C O N O M I C C O M M I S S I O N F O R E U R O P E
119
9. Conclusions
The Republic Belarus is located in the heart of the Europe, which allows it to play a role of connecting link between Europe and Asia and to provide smooth cargo flow by major transport corridors that pass through its territory. However, with the globalization of the world economy, it is necessary to study processes which are taking place in the country in conjunction with the integration processes which includes the Republic of Belarus. They are the Customs Union of Russia, Belarus, Kazakhstan and the Eurasian Economic Community.
The establishment of the Customs Union and the Eurasian Economic Community has had a positive impact on the development of Belarus foreign trade. During the period from 2009 to 2012 the trade turnover between Belarus and the EurAsEC countries has grown from $US 23.9 billion to 44.8 billion, i.e. by 87.4 per cent. Still, the main trade partner of Belarus is the Russian Federation. Analysis of exports structure from the Republic of Belarus to the EurAsEC countries shows that most of its export goes to the Russian Federation - more than 94 per cent, while to Kazakhstan it is about 5 per cent. Tajikistan and Kyrgyzstan participate with less than 1per cent. The situation is similar for the imports: the Russian Federation share in import of is more than 99 per cent, and the rest of the countries - less than 1 per cent.
Exports, imports and foreign trade turnover of the Republic of Belarus with the EU countries are developing at the same pace. For example, from 2010 to 2012 the foreign trade turnover between Belarus and the EU grew from $US 15.1 billion to 27.1 billion, or almost 80 per cent. It should be underline that the exports and imports structure by the European Union countries is more diversified in comparison with the countries of EurAsEC.
The increase in trade turnover leads to an increase in freight transport volumes between Belarus and the countries of EurAsEC as well as those of the European Union. The volume of transit traffic through the territory of the Republic of Belarus is also growing. In this context, main volume of freight turnover is carried by railway transport, both in international and total transport with about 80 per cent of the total freight turnover. However, transport by road is growing more rapidly. In 2012, freight turnover by road increased by 132.1 per cent compared to 2008. Therefore, the growth of cargo flows of the Republic of Belarus with the EurAsEC countries and the EU, as well as an increase in transit in the east- est direction across the Republic’s territory, requires odernization and capacity expansion of the transport infrastructure.
The review of the current situation of the international road freight carriers of Belarus showed that at the beginning of 2013 the vehicles park registered for international transport under the TIR procedure, was 11 696 units, while little more than 9 thousand units were effectively used. In recent years there has been a high growth rate in the number of international carriers. At the same time, their vehicles park is not sufficient. The share of new vehicles with an operation life of “up to 3 years” was 37.2 per cent and “from 3 to 7 years” - 35.3 per cent. In addition, more than 50 per cent of the cars meet environmental requirements of Euro-4 and Euro-5.
The volume of international cargo transport by road in Belarus has been growing in recent years and in 2012 it grew by more than 35 per cent compared to 2010. Considering the geography of international transport it should be noted that in recent years the main countries of destination of exports of goods from the Republic of Belarus are Russia, the Netherlands, Ukraine, Latvia, Germany, Poland, and Lithuania. The main countries of origin of import were Russia, Germany, Ukraine, and China. After Russian Federation, the countries of the European Union are the second largest trade partner of the Republic of Belarus. A steady growth in almost

Review of the t ranspor t and logis t ics sys tem of the Republ ic of Belarus
120
all costs related to road haulage, in particular international, should also be noted. The largest share in the costs of international freight transportation takes fuel with 36.4 per cent. Wages take more than 25 per cent, while depreciation of fixed assets and intangible assets account for 11 per cent. The cost of repair and maintenance of motor vehicles are about 9 per cent.
Belarusian road infrastructure is close to optimal extensive network of roads, which provide a continuous year- round communication with almost all populated areas. Motorways of general purpose in the Republic of Belarus are state property. They are divided into national and local motorways. On 1 January 2013, the length of the motorway network was 86 491 kilometres. Republican roads play the main role with the length of 15 636 kilometres. More than 70 per cent of all goods are transported by them. Length of local roads is 70 855 kilometres and departmental about 200 kilometres. More than 86 per cent of public roads, 100 per cent of republican roads and 83.5 per cent of local roads have hard surface. More than 62 per cent of the solid road surfaces are asphalted and cement-concreted. Most of the roads are roads of category 4-6, almost 90 per cent, and just over 10 per cent of category 1-3.
Belarusian Railways is a public company, which operates under the Ministry of Transport and Communications of the Republic of Belarus. The length of public railways is 5 500 kilometres, with 70 per cent single-track and about 30% double-track sections. Just over 16 per cent of tracks are electrified. During the last decade, a range of sustainable rail directions for freight transit flows have been formed on territory of Belarus, for transport of Russian and Kazakh foreign trade through the ports of the Baltic Sea, Kaliningrad, Ventspils and Klaipeda.
On border crossings, roads have all necessary infrastructures in order to offer a complete range of transport services, capable to process the entire range of transported goods.
One of the key aspects of improving transit efficiency of Belarus is to optimize the control of movement of the goods across the customs border as well as to shorten their customs clearance. That is why the State Customs Committee of the Republic of Belarus in cooperation with the Belarusian Railways has implemented simplified procedure for customs clearance of goods transported by rail. Customs procedures are carried out with the help of modern information technology, which can significantly increase speed, reduce delays at the border, and ensure their smooth movement to final destination.
Considering the global trend of containerization of cargo, Belarusian Railways is working on the organization of cargo transportation in containers, including container block trains. Ten container trains run regularly: “East Wind”, “Kazakhstan vector”, “Mongolian Vector», «ZUBR», «Viking”, “Volkswagen RUSS”, “Peugeot-Citroen”, “Moskvich”, “Find - Brest “and” Chongqing-Duisburg “.
Sections of two Pan-European transport corridors, with total length of 1 520 kilometres pass through the territory of the Republic of Belarus. Motorway M-1/E30 Brest-Minsk- Russian Federation border is a section of pan- European transport corridor number 2 (Berlin-Warsaw-Minsk-Moscow-Nizhny Novgorod). Its length on the territory of Belarus is 610 kilometres. Traffic intensity in some sections reaches 8 500-10 000 vehicles per day. Today technical parameters of the motorway M-1/E30 meet international standards. Motorway M-8/E95 (border of the Russian Federation-Vitebsk-Gomel-border of Ukraine) is a section of European transport corridor number 9, which connects Finland, Lithuania, Russia, Belarus, Ukraine, Moldova, Romania, Bulgaria, and Greece. It crosses Belarusian territory from north to the south. The road has a length of 456 kilometres.
International transport corridor “TRACECA” does not pass over the territory of Belarus, however, it is interesting in terms of its extension to the Republic of Belarus.
E C O N O M I C C O M M I S S I O N F O R E U R O P E
121
In 2012, 1.38 million trucks (in both directions) passed in transit through the checkpoints at the Belarusian- Lithuanian and Belarusian-Polish state borders. This represents 82 per cent of transit trips through the Republic. The volume of traffic was more than 12 million tonnes, which represents 82 per cent of goods transit by road through the Republic of Belarus. The average growth rate of goods transit by road through Belarus was11 per cent per year in the period 2008-2012.
There are also 12 international CIS routes of motorways on the territory of the Republic of Belarus whose total length is 3 607 kilometres. This constitutes 23 per cent of the total length of all national roads. Annually, over 500 000 foreign trucks and more than 1 million cars pass over republican roads in transit. However, railway transport corridors are the priority for development of the transit potential by overland routes.
Two Pan-European Transport Corridors - II and IX pass through the territory of the Republic. Both of them have great potential to provide transport links between Europe and Asia. The northern part of the corridor IX Helsinki-St. Petersburg-Moscow and Kaliningrad-Minsk-Kiev-Moscow provide a passage to European countries in the Far East and the Asia-Pacific region, Central Asia, and the Caucasus, Iran and other countries of the Persian Gulf, as well as Pakistan and India.
On the territory of the Republic of Belarus there are also two OSJD corridors - № and № 9. The studies have shown that the share of international transport in overall cargo turnover by rail is 87 per cent in Belarus, 90 per cent in Russia, 72 per cent in Kazakhstan and about 70 per cent in Ukraine. Most of freight traffic in direction Europe- Asia is carried over OSJD corridors.
By the year 2020, it is planned to complete the construction of the transport routes in the Common Transport space. Social and economic results of infrastructure development of road and rail networks are:
– Full and high quality satisfaction of the transport demand for international transport;
– Joint use and coordinated development of transport infrastructure in the framework of the Common Transport Space;
– Ensuring the free movement of vehicles, passengers and goods and services across national borders;
– Creating conditions for fast and integrated freight services on border crossings and in international logistic centers;
– Integration in international freight transport and transit of third countries between Europe and Asia in direction north–south and east-west.
Inland waterway transport organizations carry out goods transportation along the rivers of the Republic of Belarus and in international traffic on the Dnepr River in the Black Sea ports. Navigable waterways are about 1.8 million kilometres long. The fleet work from March to November.
10 ports are engaged in transport and handling of cargo. They are located in Brest, Pinsk, Mikashevichy, Mozyr, Rechica, Gomel, Mogilev, Bobruisk, Vitebsk, and Grodno. Ports of Mozyr, Gomel and Bobruisk are equipped with railway sidings. Total turnover of the ports is 15 million tonnes.
The review of roadside services has revealed that there is an insufficient number of gas and service stations located along the public roads in the country. As a result, their construction is carried out at a faster pace. Thus, in 2011, 67 gas stations (17 per cent of total number of stations) and 50 service stations (27.5 per cent the total number) were put into operation. In general, the number and quality of roadside services do not meet the required standards.

Review of the t ranspor t and logis t ics sys tem of the Republ ic of Belarus
122
The review of the status of the logistic system of the Republic of Belarus showed that the leadership of the country attaches great importance to the development of this sector of economy, creating additional preferences and benefits for subjects in this field of activity. At the moment, there are 13 logistic centers in Belarus: «Belmagistralavtotrans» JSC, «Brest-Beltamozhservice», «Minsk-Beltamozhservice», «Gomel-Beltamozhservice», JV «Brestvneshtrans» LLC, «BLT-Logistiс», Logistic Center «Dvadcat chetyre» LTD, Trade-Logistics Center «Ozertso-Logistic» JSC, «BelVingesLogistic», BTLC State Enterprise, «Shate-M Plus», «Minsk-Kristall» RUE, «Korolev Stan» JSC. Three more logistic centers, «InterStroiPortalPlus», «Prilesie» and «Orsha Aircraft Repair Plant» JSC are planned to be open by the end of 2013. «Belmagistralavtotrans», «Brestvneshtrans» and «BLT- Logistiс» also have transport function. The list of the services provided by various logistic centers is almost identical. They offer transportation services, customs formalities, temporary warehousing and storage of material inventories; transformations of material flows, and other logistic service.
The program of development of logistic system in Belarus until 2015 specifies 36 locations for building logistic centres, of which 21 have been taken to create logistic centres. Seven sites were allocated in Brest region, 5 in Vitebsk region, 5 in the Gomel region, 4 in the Grodno region, 11 in Minsk region, and 4 in Mogilev region. Of these, seven sites are intended for construction of facilities of «Beltamozhservice» enterprise, which is the largest operator and leader on providing services in the field of customs business and logistics. The analysis of the existing scheme and location of planned logistic centres in the Program has shown that changes or adjustments are not required at present.
The review of the competitive environment in the transport sector in Belarus showed that in recent years quite strong competitive environment in the Republic’s transport sector has emerged. The transport market comprises both public and private companies, with the latter having predominant character. According to the state statistical report of January 2013, there were 644 freight forwarding and logistics companies in the Republic of Belarus. This number includes 12 logistics centres and 280 individual entrepreneurs which provide services in the field of freight forwarding and logistics.
Total volume of freight forwarding and logistic services in the Republic of Belarus was US$ 1 595 million in 2012. It includes US$ 575 million of contracts with the residents of the Republic of Belarus and US$ 1 020 million with non-residents. The share of rail transport was $US 844 million, road transport US$ 658 million, waterway transport US$ 77 million, and air transport $US16 million.
Over the last 5 years there has been a significant change in the structure of traffic among different modes of transport. The share between road and railway freight transport has changed in favour of the latter. Thus in period January-May 2013 it stood at 1:1.09 for the volume of traffic, and 1:0.453 for freight turnover.
The specificity of Belarus as a transit country implies the developed legislation in the field of international transport of goods. Currently, this issue is governed by national legislation, as well as supranational regulations, namely those of the Customs Union. Currently, all the existing legislation can be divided into the following main groups:
– Requirements for vehicles;
– Rules, organization and traffic, and safety of vehicles on the roads;
– Requirements for drivers of vehicles and the organization of their work;
– The conditions of the international road transport;
– The rights, obligations and responsibilities of the parties involved in the transportation process;
E C O N O M I C C O M M I S S I O N F O R E U R O P E
123
– The rules of border and customs control;
– Transport and taxation of vehicles.
The main international instruments regulating international transport include:
– Convention on the Contract for the International Carriage of Goods by Road (CMR, 1956)
– UN Protocol to the Convention on the Contract for the International Carriage of Goods, 5 July, 1978
– Customs Convention on the International Transport of Goods under Cover of TIR Carnets (1959, 1975)
– European Agreement Concerning the Crews Work of Vehicles Engaged in International Road Transport (ECTD, 1970)
– Agreement on the International Carriage of Perishable Foodstuffs and on the Special Equipment to be Used for such Carriage (ATP, 1970).
Analysis of Belarusian legislation on international cargo transport testify its focus on development of both public and private transport sectors and restriction of monopoly in this area as a priority, on strengthening of transport safety, non-discrimination and the establishment of equal conditions for the actors in the implementation of this activity, to ensure effective state control in this area. The legislation in Belarus broadly covers the field of international transport. All the key pieces of legislations exist in all the key areas. However, there are a number of significant issues that requires harmonization of Belarusian and European legislations in the field of international transportation. The following systemic problems have serious negative implications for the development of freight traffic in the EurAsEC and Belarus in particular:
1. The lack of harmonization of the basic legislation in the field of road transport activities. Statutes, codes and laws in road transport are different from each other. In a number of states and in a number of critical issues existent legislation and regulations are sometimes based on old, Soviet style legislation which does not meet the requirements of a modern law. There are no regulations, and on many aspects that are extremely relevant today, such as the payment for use of infrastructure or transportation of dangerous goods.
2. Loosely unified technical standards and norms in transport of passengers and cargo. Out of the total number of UNECE agreements and conventions relevant for road transport and border crossing procedures (40 legal instruments), 11 had not been signed by any of the EurAsEC member states. All EurAsEC member states have acceded to only one multilateral instrument - the Customs Convention on the International Transport of Goods under Cover of TIR Carnets (1975).
3. The lack of an effective permit system in the EurAsEC territory. Bilateral agreements concluded between individual countries involve different levels of preferences with respect of taxes, road tolls, transit, and provide for, in some cases, the authorization system of transport, including through harmonization of issued permits.
4. Various barriers of technical, administrative, fiscal and cross-border nature.
In view of the above, the following plan of work on harmonization of legislative and regulatory activities in the field of road transport should be implemented:
1. To conduct the analysis and systematization of the fundamental current legislation in the member states of the EurAsEC, identify systemic inconsistencies and to develop proposals to address them.

Review of the t ranspor t and logis t ics sys tem of the Republ ic of Belarus
124
2. Harmonize transport technical norms and standards. This is the most important element of a coherent integration of the Eurasian Economic Community in the European and global transport system.
3. Ensure an effective system of international road links between the EurAsEC member states through the elimination of administrative barriers. For this, it is necessary to remove barriers in the field of transit fees, road and other tolls on free roads, the permit system in bilateral transport within the Commonwealth, delivering of heavy, oversized and dangerous goods.
4. Increase coordination of EurAsEC member states in international organizations, including the accession to international agreements and conventions. It is, first of all, the United Nations and the International Transport Forum (ex-European Conference of Ministers of Transport).
Thus, harmonization of the Belarusian legislation with the regulations in force in the European Union and the countries of the Eurasian Economic Community has become an urgent task which depends on the prospects for the development of international freight transport to Europe and Asia.
Critical issue for Republic of Belarus is the development of its transit potential, and it should be studied in close cooperation with neighbouring countries, Ukraine, Latvia and Lithuania. Ukraine plays a special role in the European transit system, due to its developed system of transport networks and ice-free ports. Three international transport corridors pass through the territory of Ukraine. Transport infrastructure and technological capacity of Ukrainian railway allows it to carry more than 1 billion tonnes of goods annually and to process more than 160 million tonnes of cargo in the ports. A large share of this capacity is focused on transit. Ukraine has the highest transit index in Europe however, only 35 per cent of the present transit potential is used.
The transport policy of the Russian Federation, focused on development of its own ports on the Black and Baltic Seas, impacts heavily on the intensity and volume of Ukrainian transit cargo traffic.
Approximately 90 per cent of transit traffic by Belarusian Railways is Russian export goods. Thus, the geography of Belarusian transit transport depends on foreign trade policy of the Russian Federation.
The main flow of transit by road through Republic of Belarus goes through two international transport corridors – corridor II (East-West) and the corridor IX (North-South) with a branch IX B.
The increase in transit traffic by road through the territory of the Republic of Belarus in 2012 compared to 2011 is largely determined by the growth of exports of goods and products from the EU to the Russian Federation.
E C O N O M I C C O M M I S S I O N F O R E U R O P E
125
10. Literature
• Foreign Trade of the Republic of Belarus (2012).• Transport and Communications in the Republic of Belarus, (2012).• Ministry of Statistics of the Republic of Belarus (2013): http://www.belstat.gov.by The
State Customs Committee of Belarus: http://www.gtk.gov.by• Eurasian Economic Commission: http://www.eurasiancommission.org• Grits G. Transportation prospects of Belarus in the EEC: http://www.baif.by/stati/
transportnye-perspektivy- respubliki-belarus-v-ramkah-ees/• Transition Report 2012-integratipon across borders-E: www.ebrd.com/downloads/
research/transition/tr12.pdf

Review of the t ranspor t and logis t ics sys tem of the Republ ic of Belarus
126
ANNEXES
Annex 1
FOREIGN TRADE OF THE REPUBLIC OF BELARUS WITH THE RUSSIAN FEDERA-TION AND THE EURASEC COUNTRIES
Table 1.1: Export, import and foreign trade turnover of the Republic of Belarus with the countries of the Eurasian Economic Community ($US, million)
2008 2009 2010 2011 2012
Export 10 992.4 7 132.2 10 546.0 15 451.6 17 063.1
Import 23 695.4 16 815.5 18 500.2 25 098.2 27 691.7
Foreign trade turnover 34 687.8 23 947.7 29 046.2 40 549.8 44 754.8
Growth rate of foreign trade turnover,% – 69.0 83.7 116.9 129.0
2008 2009 2010 2011 2012
Export 10 551.9 6 718.5 9 953.6 14 508.6 16 079.6
Import 23 507.4 16 726.3 18 080.6 24 930.2 27 550.9
Foreign trade turnover 34 059.3 23 444.8 28 034.2 39 438.8 43 630.5
Growth rate of foreign trade turnover,% – 68.8 82.3 115.8 128.1
2008 2009 2010 2011 2012
Export 14 326.0 9 316.4 13 635.9 20 374.4 23 459.9
Import 25 945.8 18 224.3 20 536.6 28 094.6 30 141.2
Foreign trade turnover 40 271.8 27 540.7 34 172.5 48 469.0 53 601.1
Growth rate of foreign trade turnover,% 100.0 68.4 84.9 120.4 133.1
2008 2009 2010 2011 2012
Azerbaijan 105.4 120.3 140.2 200.2 211.0
Armenia 23.6 23.2 42.1 26.8 38.6
Kazakhstan 365.2 313.4 464.8 674.0 793.9
Kyrgystan 37.9 65.7 85.5 218.2 141.2
Moldova 241.2 169.6 165.2 242.1 253.4
Table 1.2: Export, import and foreign trade turnover of the Republic of Belarus with the Russian Federation ($US, million)
Table 1.3: Export, import and foreign trade turnover of the Republic of Belarus with the CIS countries ($US, million)
Table 1.4: Volume of export of the Republic of Belarus to the CIS countries and the countries of the Eurasian Economic Community ($US, million)

E C O N O M I C C O M M I S S I O N F O R E U R O P E
127
2008 2009 2010 2011 2012
Azerbaijan 6.2 120.3 140.2 200.2 211.0
Armenia 4.6 4.3 42.1 26.8 38.6
Kazakhstan 5.1 6.0 464.8 674.0 793.9
Kyrgystan 5.1 825.8 85.5 218.2 141.2
Moldova 5.6 12.2 165.2 242.1 253.4
Russian Federation 7.4 120.3 140.2 200.2 211.0
Tajikistan 171.8 74.9 405.8 137.0 119.0
Turkmenistan 6.4 3.2 8.3 9.1 12.5
Uzbekistan 92.6 84.6 83.9 77,7 85.1
Ukraine 23 507.4 16 726.3 18 080.6 24 930.2 27 550.9
CIS Total 25 945.8 18 224.3 20 536.6 28 094.6 30 141.2
Growth rate of the CIS% – 70.2 79.2 108.3 116.2
Total EurAsEC 23 695.4 16 815.5 18 500.2 25 098.2 27 691.7
The growth rate of the EurAsEC, % 100.0 71.0 78.1 105.9 116.9
Russian Federation 10 551.9 6 718.5 9 953.6 14 508.6 16 079.6
Tajikistan 37.4 34.6 42,1 50.8 48.4
Turkmenistan 47.4 73.1 87.2 230.1 231.0
Uzbekistan 138.1 106.5 95.1 63.8 94.6
Ukraine 2 777.9 1 691.5 2 560.1 4 159.8 5 568.2
CIS Total 14 326.0 9 316.4 13 635.9 20 374.4 23 459.9
Growth rate of the CIS% – 65.0 95.2 142.2 163.8
Total EurAsEC 10 992.4 7 132.2 10 546.0 15 451.6 17 063.1
The growth rate of the EurAsEC, % 100.0 64.9 95.9 140.6 155.2
[Sources: http://belstat.gov.by; http://www.gtk.gov.by]
[Sources: http://belstat.gov.by; http://www.gtk.gov.by]
Table 1.5: Volume of import of goods into the Republic of Belarus from the CIS countries and the EurAsEC ($US, million)

Review of the t ranspor t and logis t ics sys tem of the Republ ic of Belarus
128
Annex 2
FOREIGN TRADE OF THE REPUBLIC OF BELARUS WITH THE EUROPEAN UNION
Table 2.1: Export, import and foreign trade turnover of the Republic of Belarus with the European Union ($US, million)
Table 2.2: Export, import and foreign trade turnover of the Republic of Belarus with the European Union ($US, million)
2008 2009 2010 2011 2012
Export 14 168.8 9 301.1 7 599.7 15 695.3 17 600.0
Import 8 541.9 6 545.9 7 549.5 8 6868 9 500.0
Foreign trade turnover 22 710.7 15 847.0 15 149.2 24 382.1 27 100.0
[Sources: http://belstat.gov.by; http://www.gtk.gov.by]
Table 2.3: Imports from the EU countries to the Republic of Belarus ($US, million)
2005 2006 2007 2008 2009 2010 2011 2012
Belgium 78.7 95.9 101.4 194.0 87.3 103.8 181.7 226.1
Germany 708.5 752.8 731.1 812.0 987.4 460.8 1 826.4 1 737.1
Italy 159.7 172.9 184.4 322.1 187.2 195.4 552.3 676.7
Latvia 322.6 462.0 990.2 2 141.0 1 655.8 929.5 3 151.3 3 269.7
Lithuania 351,8 432,7 564.5 619.2 362.3 450.5 857.2 1 181.2
Netherlands 2 408.3 3 494.5 4 277.3 5 408.2 3 698.0 2 845.6 6 128.5 7 551.3
Poland 847.3 1 032.8 1 226.2 1 798.4 823.2 885.8 1 124.8 949.7
United Kingdom 1 120.4 1 474.9 1 528.9 1 415.5 803.7 935.2 404.0 556.6
Estonia 106.4 94.5 226.5 329.2 119.8 126.3 578.1 485.9
Other EU countries 1129.2 576.4 666.8 891.0 965.7
EU total 14 168.8 9 301.1 7 599.7 15 695.3 17600.0
[Sources: http://belstat.gov.by; http://www.gtk.gov.by]
2005 2006 2007 2008 2009 2010 2011 2012
Belgium 118.4 165.0 207.0 281.0 224.5 260.7 311.9 344.1
Germany 1 121.1 1 672.0 2 171.4 2 791.7 2 211.1 2 385.3 2 558.2 2 732.1
Spain 63.5 89.4 136.2 196.6 173.4 206.2 231.6 290.9
Italy 393.5 498.3 638.1 871.9 709.0 772.4 968.4 956.3
Lithuania 134.6 170.3 180.1 233.6 195.2 247.8 296.8 371.2
Netherlands 161.3 220.0 250.3 364.0 232.3 316.3 400.5 448.4
Poland 578.9 765.9 819.1 1 154.9 786.6 1 079.8 1 289.2 1 349.2
United Kingdom 144.1 184.8 189.4 270.2 257.1 313.4 356.1 358.2
France 176.1 270.6 345.6 560.9 393.0 384.6 430.1 436.0
Czech Republic 99.4 139.5 197.3 336.0 238.3 317.1 354.1 440.9
Other EU countries 1 481.1 1 125.4 1 265.9 1 489.9 1 772.7
EU total 8 541.9 6 545.9 7 549.5 8 686.8 9 500.0
[Sources: http://belstat.gov.by; http://www.gtk.gov.by]

E C O N O M I C C O M M I S S I O N F O R E U R O P E
129
[Sources: http://belstat.gov.by; Transport and Communications in the Republic of Belarus. Statistical Compendium. Minsk, 2012. - 152 p.]
2000 2005 2008 2009 2010 2011
All modes of transport (excluding pipelines) Including: 36 495 53 059 62 925 56 387 62 401 67 728
Railway transport 31 425 43 559 48 994 42 742 46 224 49 405
International transportations 23 425 33 339 35 053 28 743 31 667 36 191
Transit 12 016 17 339 19 726 16 433 18 499 19 875
Road transport 5 026 9 351 13 742 13 512 16 023 18 153
Inland water transport 26 90 132 83 110 143
Year
Number of motor vehicles
registered for the TIR actually used for transportation under the TIR
2005 8 465 6 686
2006 8 173 6 673
2007 8 533 7 304
2008 9 270 7 912
2009 8 879 6 950
2010 8 943 6 854
2011 10 058 8 108
2012 11 696 9 138
on 01.09.2013 12 083 8 741
Annex 3
VOLUME OF FREIGHT TRAFFIC
Table 3.1: Throughput of the Republic of Belarus by mode of transport (million tkm)
Annex 4
VEHICLE FLEET OF INTERNATIONAL ROAD CARRIERS IN BELARUS
Table 4.1: Number of motor vehicles registered and actually used for international road transporta-tion of goods under the TIR

Review of the t ranspor t and logis t ics sys tem of the Republ ic of Belarus
130
Table 4.2: Structure of the vehicle fleet by the form of organization of business entities
Form of organization2012 on September 2013
number share, % number share, %
Ltd. and the ALC 4 260 36.4 4 521 37.4
Unitary enterprise 3 427 29.3 3 570 29.5
JSC 1 056 9.0 1 053 8.7
State-owned enterprises 18 0.2 19 0.2
Foreign enterprises 461 3.9 434 3.6
Joint ventures 2 381 20.4 2 389 19.8
Individual entrepreneurs 34 0.3 34 0.3
Other 59 0.5 65 0.5
TOTAL 11 696 100 12 085 100
Region2012 on September 2013
number share, % number share, %
Minsk and Minsk region 5 992 51.2 6 177 51.1
Grodno region 1 813 15.5 1 911 15.8
Brest region 2 375 20.3 2 390 19.8
Vitebsk region 603 5.2 628 5.2
Gomel region 458 3.9 528 4.4
Mogilev region 455 3.9 451 3.7
TOTAL 11 696 100 12 085 100
2011 2012 on the 1st of september 2013
number share, % number share, % number share, %
up to 3 years 2 354 23.4 4 356 37.2 4 788 39.6
from 3 to 7 years 4 121 41.0 4 124 35.3 4 151 34.4
7 years and older 3 583 35.6 3 216 27.5 3 146 26.0
TOTAL 10 058 100 11 696 100 12 085 100
Table 4.3: Structure of the vehicle fleet by region
Table 4.4: The age structure of the vehicle fleet

E C O N O M I C C O M M I S S I O N F O R E U R O P E
131
Table 4.5: Vehicle fleet by region and by operation life
Environmental standard2011 2012 on 1September 2013
number share, % number share, % number share, %
EURO 5 3 590 35.7 5 388 46.1 5 925 49.0
EURO 4 637 6.3 658 5.6 693 5.7
EURO 3 2 387 23.7 2 101 18.0 1 931 16.0
EURO 2 471 4.7 382 3.3 322 2.7
Other 2 973 29.6 3 167 27.1 3 214 26.6
TOTAL 10 058 100 11 696 100 12 085 100
Type of ownership2011 2012 on 1September 2013
number share, % number share, % number share, %
leased vehicles 2 673 27 3 339 29 3 242 27
own vehicles 7 385 73 8 357 71 8 843 73
TOTAL 10 058 100 11 696 100 12 085 100
Region
2012 on the 1st of september 2013
up to 3 years from 3 to 7 years
7 years and older up to 3 years from 3 to 7
years7 years and
older
number % number % number % number % number % number %
Minsk and Minsk region 2 353 39 2 288 38 1 351 23 2 613 42 2 249 37 1 315 21
Grodno region 433 24 533 29 847 47 494 26 580 30 837 44
Brest region 947 40 759 32 669 28 1 028 43 731 31 631 26
Vitebsk region 260 43 190 32 153 25 262 42 209 33 157 25
Gomel region 179 39 156 34 123 27 232 44 170 32 126 24
Mogilev region 184 40 198 44 73 16 159 35 212 47 80 18
TOTAL 4 356 37 4 124 35 3 216 28 4 788 40 4 151 34 3 146 26
Table 4.6: Vehicle fleet by emission standards
Table 4.7: Structure of the vehicle fleet by ownership of vehicles

Review of the t ranspor t and logis t ics sys tem of the Republ ic of Belarus
132
Table 4.8: Changing age structure of the vehicle fleet
Year up to 3 years from 3 to 7 years
7 years and older
TOTAL%
2000 2 30 68 100
2001 6 30 64 100
2002 10 31 59 100
2003 12 26 62 100
2004 11 23 66 100
2005 11 17 72 100
2006 12 17 71 100
2007 20 23 57 100
2008 33 20 47 100
2009 30 23 47 100
2010 26 30 44 100
2011 23 41 36 100
2012 37 35 28 100
01.09.2013 39 35 26 100

E C O N O M I C C O M M I S S I O N F O R E U R O P E
133
Annex 5
RESULTS OF THE ACTIVITIES OF INTERNATIONAL ROAD CARRIERS
Mode of transport 1990 2000 2010 2011 2012
All modes 692 311 285 415 455 978 493 300 484 371
including international transportation 240 152 258 440 254 382
growth rate, % including: 100.0 107.6 105.9
pipeline 131 303 142 992 142 791 137 359
railway 245 832 88 000 139 937 152 800 153 673
including international transportation 169 688 60 245 90 376 108 039 107 850
road 428 057 64 436 166 862 190 989 189 302
growth rate, % 100.0 114.5 113.4
including international transportation 6 765 7 601 9159
growth rate, % 100.0 112.4 135.4
inland waterway 18 397 1 672 6 168 6 711 4 023
air 25 4 19 9 14
including international transportation 25 4 19 9 14
units of measurement 2009 2010 2011 2012 2013
1st half
All modes $US million 2 288.7 3 006.9 3 539.3 3 620.7 1 880.0
Growth rate, % % 100.0 131.4 154.6 158.2 –
including freight transportation $US million – – 3 046.7 3 047.9 1614.4
passenger transportation $US million – – 260.1 301.2 160.2
Road transportation $US million 494.8 682.0 780.9 1 068.1 537.7
Growth rate, % % 100.0 137.8 157.8 215.9 108.7
Railway $US million 703.9 821.4 – 1 050.0 562.1
Pipeline $US million 715.0 834.2 – 883.5 458.7
Other $US million 375.0 669.3 2 758.4 619.1 321.5
Table 5.1: Cargo transportation by modes of transport, thousands of tons
Table 5.2: Export of transport services of the Republic of Belarus, million $US
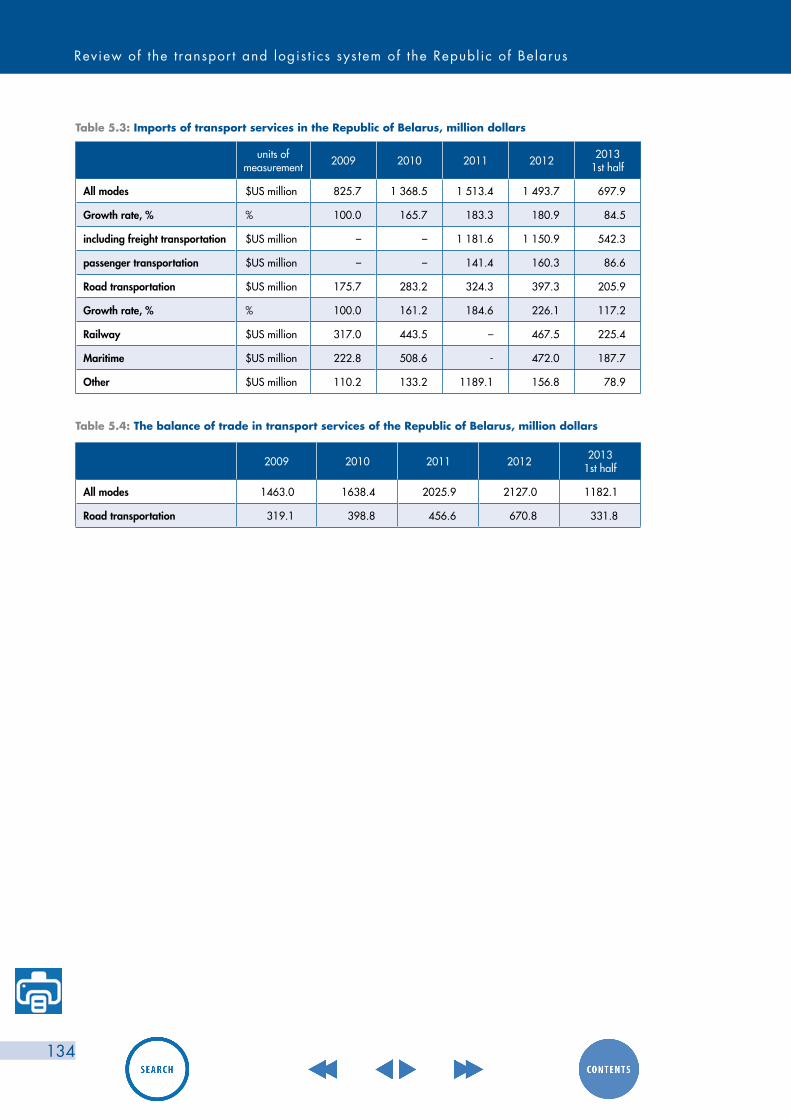
Review of the t ranspor t and logis t ics sys tem of the Republ ic of Belarus
134
Table 5.3: Imports of transport services in the Republic of Belarus, million dollars
units of measurement 2009 2010 2011 2012 2013
1st half
All modes $US million 825.7 1 368.5 1 513.4 1 493.7 697.9
Growth rate, % % 100.0 165.7 183.3 180.9 84.5
including freight transportation $US million – – 1 181.6 1 150.9 542.3
passenger transportation $US million – – 141.4 160.3 86.6
Road transportation $US million 175.7 283.2 324.3 397.3 205.9
Growth rate, % % 100.0 161.2 184.6 226.1 117.2
Railway $US million 317.0 443.5 – 467.5 225.4
Maritime $US million 222.8 508.6 - 472.0 187.7
Other $US million 110.2 133.2 1189.1 156.8 78.9
2009 2010 2011 2012 2013 1st half
All modes 1463.0 1638.4 2025.9 2127.0 1182.1
Road transportation 319.1 398.8 456.6 670.8 331.8
Table 5.4: The balance of trade in transport services of the Republic of Belarus, million dollars
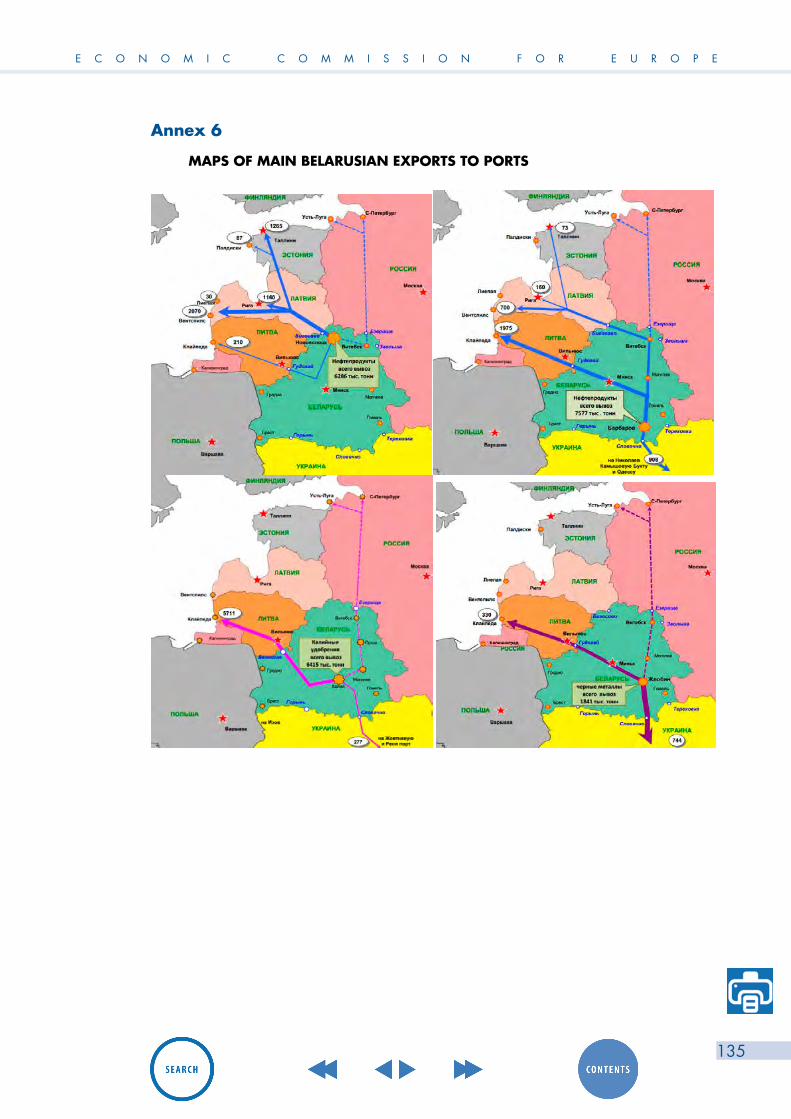
E C O N O M I C C O M M I S S I O N F O R E U R O P E
135
Annex 6
MAPS OF MAIN BELARUSIAN EXPORTS TO PORTS

Review of the t ranspor t and logis t ics sys tem of the Republ ic of Belarus
136
Annex 7
SCHEME OF LOCATION OF LOGISTIC CENTERS IN BELARUS

Revi
ew o
f the
Tra
nspo
rt
and
Logi
stic
s Sy
stem
of t
he
Repu
blic
of B
elar
us
Printed at United Nations, Geneva – GE.13-26776 – April 2014 – 1 – ECE/TRANS/233
Information ServiceUnited Nations Economic Commission for Europe
Palais des NationsCH - 1211 Geneva 10, SwitzerlandTelephone: +41(0)22 917 44 44Fax: +41(0)22 917 05 05E-mail: [email protected]: http://www.unece.org


![UNITED NATIONS ECONOMIC COMMISSION FOR EUROPE · Web viewThe United Nations Economic Commission for Europe ... (UN/ECE/FAL)] заявка на ... in this definition the word “country](https://img.dokumen.tips/doc/110x75/5c20ca4109d3f2da308b959a/united-nations-economic-commission-for-web-viewthe-united-nations-economic-commission.jpg)


