Embed Size (px)
Citation preview

Page 1
United Nations Development Programme
Country: India
PROJECT DOCUMENT Project Title: Market Transformation and Removal of Barriers for Effective Implementation of the State-Level Climate Change Action Plans
UNDAF Outcome(s): Sustainable Development and Inclusive Growth
UNDP Strategic Plan Environment and Sustainable Development Primary Outcome: Sustainable access to energy and improved energy efficiency UNDP Strategic Plan Secondary Outcome: Planning at sub-national levels to help connect national priorities with action on the ground Expected CP Outcome(s): Expanded access to clean energy. Expected CPAP Output: Support for initiatives that increase access to clean energy for productive uses in off-grid, underserved rural regions. Executing Entity/Implementing Partner: Ministry of Environment, Forest and Climate Change, Government of India (MOEFCC) Implementing Entity/Responsible Partners: Ministry of Environment, Forests and Climate Change (MOEFCC), Department of Forest and Environment, Government of Jharkhand; Department of Environment, Government of Manipur, and UNDP Brief Description India launched its National Action Plan on Climate Change (NAPCC) in June 2008. NAPCC represents a multi-pronged, long-term and integrated strategy for achieving key climate change goals for the country: namely, “achieving national growth objectives through a qualitative change in direction that enhances ecological sustainability, leading to further mitigation of greenhouse gas emissions”, and “devising efficient and cost-effective strategies for end-use demand-side management”. The plan identifies eight core “national missions” running through 2017. These eight missions focus on enhancing energy efficiency; increasing the penetration of solar in the total energy mix; developing climate friendly sustainable habitats; a water mission for integrated water resources management; a mission on sustainable agriculture for making it more resilient to climate change; a green India mission for enhancing ecosystem services of forests and for enhancing its carbon sequestration capacity; a mission on Himalayan ecosystem for sustaining and safeguarding the Himalayan glacier and mountain ecosystems; and the last mission is aimed towards developing strategic knowledge base to address the concerns of climate change. The NAPCC encourages planning and coordination at different levels, especially state (sub-national) level. As of March 2015, 22 states and Union Territories of India have completed their State Level Action Plans


Page 3
ACRONYMS AND ABBREVIATIONS
AHEC APR AT&C
Alternate Hydro Energy Centre Annual Project Review Aggregate Technical and Commercial
AWP BEE BPL CAGR CDF CERC
Annual Work Plan Bureau of Energy Efficiency Below Poverty Line Compound Annual Growth Rate Centre for Development Finance Central Electricity Regulatory Commission
CO CO2e
Country Office Carbon dioxide Equivalent
CP Country Programme CPAP CSGS DDG DSM ECBC EESL EEEP
Country Programme Action Plan Central Sector Generating Stations Decentralised Distributed Generation Demand Side Management Energy Conservation Building Code Energy Efficiency Services Limited Energy Efficiency Financing Platform
EOI Expression of Interest EOP ESCO FEED
End of Project Energy Service Company Framework for Energy Efficient Economic Development
FSP Full Scale Proposal FYP GBI
Five Year Plan Generation Based Incentive
GEF Global Environment Facility GHG Green House Gas GOI GSDP IIT IFMR INDC
Government of India Gross State Domestic Product Indian Institute of Technology Institute for Financial Management and Research Intended Nationally Determined Contribution
IREDA JERC JREDA
Indian Renewable Energy Development Agency Jharkhand Electricity Regulatory Commission Jharkhand Renewable Energy Development Agency
JNNSM JNNURM
Jawaharlal Nehru National Solar Mission Jawaharlal Nehru National Urban Renewal Mission
kgoe Kg of Oil equivalent kWth MACC MEPS MOA MOP
Kilo Watt Thermal Marginal Abatement Cost Curve Minimum Energy Performance Standard Ministry of Agriculture Ministry of Power
M&E Monitoring and Evaluation MNRE Ministry of New & Renewable Energy MoEFCC MOHUPA MOP MOUD MANIREDA
Ministry of Environment, Forests and Climate Change Ministry of Housing and Urban Poverty Alleviation Ministry of Power Ministry of Urban Development Manipur Renewable Energy Development Agency
Mt MSDA
Million Tonnes Manipur State Development Agency

Page 4
MTE MTEE
Mid-Term Evaluation Market Transformation for Energy Efficiency
Mtoe Million ton of oil equivalent MW Megawatt NABARD National Bank for Agriculture and Development NAPCC NEP NMEEE NMSH
National Action Plan on Climate Change National Environment Policy National Mission on Enhanced Energy Efficiency National Mission on Sustainable Habitat
NISE NIWE
National Institute of Solar Energy National Institute of Wind Energy
NPC National Project Coordinator NPD NSC NSM NTPC NVVN
National Project Director National Steering Committee National Solar Mission National Thermal Power Company National Vidyut Vyapar Nigam
PAC PAT
Project Advisory Committee Perform, achieve and Trade
PIF Project Identification Form PIR Project Implementation Reports PMU PPA
Project Management unit Power Purchase Agreements
PPG PPP PPP
Project Preparatory Grant Purchasing Power Parity Public Private Partnership
PPR PRGF
Project Progress Reports Partial Risk Guarantee Fund
PSC PV RE REC
Project Steering Committee photovoltaic Renewable Energy Renewable Energy Certificate
RGGVY Rajiv Gandhi Grameen Vidyutikaran Yojana 1 RPO Renewable Purchase Obligation RTA SSSNIRE SECI SEEP
Regional Technical Advisor (UNDP) Sardar Swaran Singh National Institute of Renewable Energy Solar Energy Corporation of India Super-Efficient Equipment Program
SERC State Electricity Regulatory Commission SNA State Nodal Agency tCO2 Ton of carbon dioxide ULB Urban Local Body UNDAF United Nations Development Action Framework UNDP United Nations Development Programme UNFCCC UN Framework Convention on Climate Change USAID US Agency for International Development USD or US$ VCFEE
US Dollar Venture Capital Fund for Energy Efficiency
Note: 1 USD = 60 Indian Rupee (INR)
1 RGGVY is the Government of India’s programme for rural electrification.

Page 5
List of Tables Table 1: Designated Government Agencies for NAPCC Missions .............................................. 12 Table 2: Key Financing Sources for NAPCC and SAPCCs in India ............................................ 13 Table 3: Foreseen Strengths, Challenges & Weaknesses of Key NAPCC Missions ................... 15 Table 4: Status of two states on key development parameters ................................................... 20 Table 5: RE & EE strategies in the Jharkhand Action Plan on Climate Change .......................... 23 Table 6: Projected Climate Changes and Impacts in Manipur ..................................................... 25 Table 7: Key RE & EE programs in all the sectors in MAPCC .................................................... 26 Table 8: Jharkhand RPOs Targets .............................................................................................. 30 Table 9: Summary of the Grid Interactive Rooftop Solar Photovoltaic Power Policy, 2014 ......... 32 Table 10: GHG Abatement Potential of Different Sectors in Jharkhand ...................................... 37 Table 11: GHG Abatement Potential of Different Sectors in Manipur .......................................... 40 Table 12: Projected Renewable Energy Scenarios for Manipur .................................................. 44 Table 13: Projected Renewable Energy Scenarios for Jharkhand .............................................. 45 Table 14: List of potential investment projects along with location details for demonstration phase .................................................................................................................................................... 47 Table 15: MACC Calculations for pilot investments in Jharkhand ............................................... 50 Table 16: MACC Calculations for Investment Projects in Manipur .............................................. 52 Table 17: MACC Calculations for State-wide Mitigation in Jharkhand ........................................ 54 Table 18: MACC Calculations for State Wide Mitigation in Manipur ............................................ 55 Table 19: EE Street Lighting Investment Project at Chas, Jharkhand ......................................... 57 Table 20: Abatement Potential – State Level EE Street Lighting Projects, Jharkhand ................ 57 Table 21: EE Municipal Water Pumping Project (MADA), Jharkhand ......................................... 58 Table 22: Abatement Potential – State Level EE Municipal Water Pumping Projects, Jharkhand .................................................................................................................................................... 58 Table 23: Building Energy Efficiency (Project Building), Ranchi, Jharkhand ............................... 58 Table 24: Abatement Potential – State Level Building Energy Efficiency Projects, Jharkhand ... 59 Table 25: Rooftop Solar PV Project (Project Building) ................................................................ 59 Table 26: Abatement Potential – State Level Rooftop Solar PV Projects .................................... 60 Table 27: Grid Connected Solar Park (Jiribam), Manipur ............................................................ 60 Table 28: EE Pumping City Water Supply, Porompat, Manipur .................................................. 61 Table 29: Abatement Potential – State Level EE Pumping Projects, Manipur ............................ 61 Table 30: Rooftop Solar PV Projects (Multiple Buildings), Manipur ............................................. 62 Table 31: EE Street Lighting Project (Imphal), Manipur .............................................................. 62 Table 32: Abatement Potential – State Level EE Street Lighting Projects, Manipur .................... 63 Table 33: Building Energy Efficiency PWD Building, Imphal, Manipur ........................................ 63 Table 34: Abatement Potential – State Level Building Energy Efficiency Projects, Manipur ....... 64 Table 35: Barrier Analysis ........................................................................................................... 64 Table 36: Key stakeholders involved in the project ..................................................................... 67 Table 39: Project Components, Outcomes and Outputs ............................................................. 74 Table 40: Outputs and Activities Contributing to the Achievement of Outcome 1 ....................... 76 Table 41: Outputs and Activities Contributing to the Achievement of Outcome 2 ....................... 79 Table 42: Outputs and Activities Contributing to the Achievement of Outcome 3 ....................... 83 Table 43: Project results framework ............................................................................................ 91 Table 44: Annual Budget and Work Plan (ABWP) ...................................................................... 96 Table 45: Allocation of MOEFCC's Co-Financing Contribution ................................................. 100 Table 46: Summary of Total Funds ........................................................................................... 100 Table 47: Estimate of direct project services (DPS (US$)) ........................................................ 105 Table 48: M & E work-plan and budget ..................................................................................... 110 Table 49: Emission Reduction from Investment Projects .......................................................... 132 Table 50: Summary details of stakeholders' workshops ............................................................ 133 Table 51: Project Annual Targets .............................................................................................. 141

Page 6
List of Figures Figure 1: India's National Action Plan on Climate Change Missions ........................................... 10 Figure 2: Components of NMEEE ............................................................................................... 11 Figure 3: Financing Mechanisms & Sources of Funds for NAPCC & Other Climate related Activities ...................................................................................................................................... 14 Figure 4: Roadmap followed for the preparation of SAPCC ........................................................ 17 Figure 5: District Map of Jharkhand State ................................................................................... 19 Figure 6: District Map of Manipur ................................................................................................ 20 Figure 7: Power Generation Capacity of Jharkhand state ........................................................... 27 Figure 8: Demand & Availability of Power in Manipur ................................................................. 31 Figure 9: Sectoral MACC for State of Jharkhand ........................................................................ 38 Figure 10: Sectoral MACC for State of Manipur .......................................................................... 41 Figure 11: Manipur Renewable Energy's Scenarios .................................................................... 44 Figure 12: Jharkhand State Renewable Energy's Scenarios ...................................................... 44 Figure 13: Energy Savings Projections- Manipur ........................................................................ 46 Figure 14: Energy Savings Projections- Jharkhand .................................................................... 46 Figure 15: Marginal Abatement Cost Curve for Mitigation Actions in Jharkhand ......................... 51 Figure 16: Marginal Abatement Cost Curve for Mitigation Actions in Manipur ............................ 53 Figure 17: Marginal Abatement Cost Curve for State-wide Mitigation Actions in Manipur .......... 55 Figure 18: Marginal Abatement Cost Curve for State wide Mitigation Actions in Manipur ........... 56 Figure 19: Project Management Structure................................................................................. 103

Page 7
TABLE OF CONTENTS
PART A. SITUATION ANALYSIS .......................................................................................... 8
1. PROJECT CONTEXT – NATIONAL CLIMATE CHANGE POLICY AND IMPLEMENTATION ............ 8 2. SAPCCS AND IMPLEMENTATION OF RENEWABLE ENERGY AND ENERGY EFFICIENCY
MITIGATION OPTIONS FOR CLIMATE CHANGE MITIGATION IN THE TARGETED STATES .................. 18 3. BARRIER ANALYSIS ...................................................................................................... 64 4. KEY STAKEHOLDERS .................................................................................................... 66
PART B. PROJECT STRATEGY ......................................................................................... 69
5. PROJECT RATIONALE, DESIGN PRINCIPLES AND STRATEGIC CONSIDERATIONS . 69 6. POLICY CONFORMITY AND COUNTRY OWNERSHIP ........................................................... 71 7. PROJECT OBJECTIVES, OUTCOMES AND OUTPUTS .......................................................... 74 8. COST-EFFECTIVENESS; GEF INCREMENTAL REASONING ................................................ 87 9. SUSTAINABILITY AND REPLICABILITY .............................................................................. 89 10. PROJECT RESULTS FRAMEWORK .................................................................................. 91 11. TOTAL BUDGET AND WORK PLAN .................................................................................. 96 12. MANAGEMENT ARRANGEMENTS ................................................................................. 102 13. MONITORING FRAMEWORK AND EVALUATION ............................................................... 106 14. LEGAL CONTEXT ........................................................................................................ 111 15. UNDP SOCIAL AND ENVIRONMENTAL STANDARDS ...................................................... 111 16. LIST OF REFERENCES ................................................................................................ 112
PART C. ANNEXES ........................................................................................................... 113
ANNEXURE A: RISK ANALYSIS ........................................................................................... 113 ANNEXURE B: CO-FINANCING LETTERS ............................................................................... 119 ANNEXURE C: TERMS OF REFERENCE ................................................................................ 124 ANNEXURE D: COMPARATIVE TABLE FOR EMISSION REDUCTION CALCULATION .................... 129 ANNEXURE E: EMISSION REDUCTIONS CALCULATION .......................................................... 131 ANNEXURE F: SUMMARY REPORT ON STAKEHOLDERS CONSULTATIONS .............................. 133 ANNEXURE G: COUNTRY OFFICE SUPPORT SERVICE (COSS) AGREEMENT .......................... 138 ANNEXURE H: PROJECT ANNUAL TARGETS ......................................................................... 141 ANNEX I: SOCIAL AND ENVIRONMENTAL SCREENING ........................................................... 145

Page 8
PART A. SITUATION ANALYSIS
1. PROJECT CONTEXT – NATIONAL CLIMATE CHANGE POLICY AND
IMPLEMENTATION
1.1 The Challenge of Climate Change for India
1. Global climate change due to increasing levels of greenhouse gases (GHGs) is one of the most serious environmental challenge drawing international and national level actions. India as the second most populous country in the world and fourth largest energy consumer is no exception to, both the impacts of and need for actions to combat, climate change.
2. India’s emissions were estimated to be of the order of 1,332 million tonnes (Mt) of the carbon dioxide equivalent (CO2e) Green House Gas (GHG) emissions in 2007 as per the Second National Communication to UNFCCC. The emissions indicate an annual growth of 4.2% from the levels in 1994. Majority of India’s GHG emissions come from its energy sector, accounting for nearly 70% of the total emissions in 2007. The energy sector’s emissions itself have grown by nearly 4.8% (CAGR) in 2007 from its 1994 levels,2 the two years of submission of India’s National Communications to UNFCCC. Although India is reportedly the fourth largest emitter of CO2, its per capita CO2 emissions stand to be the lowest when compared to both developed and some of the large developing countries such as China and Brazil.
3. With a billion plus population and large majority of it dependent on climate sensitive sectors for livelihoods, India is extremely vulnerable to the impacts of climate change. Nearly half of India’s land resources are being used for agriculture. With a large agrarian population of nearly 700 million people and a major percentage of land still un-irrigated, India is vulnerable to seasonal as well as inter-annual fluctuations in weather parameters. Nearly 45% of the grain production coming from nearly as much as, 66% of the cultivable land3, is still rainfed in the country. Furthermore, rainfall variability and melting of glaciers have an impact on water availability in many of the snow fed rivers. These among other factors make India particularly vulnerable to potential impacts of climate change having a profound impact on country’s water resources, agriculture, forests, coastal regions, human health etc.
4. India’s energy supply is mostly thermal in nature, with a predominance of coal as a primary energy source (59%), followed by oil (mostly imported). India is the fourth largest energy consumer in the world, accounting for nearly 4.7% of the world’s total energy consumption in 2013. However, India’s per capita energy use which is around, 614 kgoe4/year5 is just a third of the world average and one-eighth of the average per capita energy consumption in OECD countries. However, with the rising population and growing development needs, India’s energy needs are only expected to grow. The Twelfth Five-Year Plan (2012-2017) document predicts an average annual growth rate in energy consumption of 5.7% per year in the Plan period, pointing out, that this is in part a reflection of the need to satisfy unmet energy demands6. The Plan document predicts that domestic energy supply of about 670 Mtoe will be supplemented by energy imports of 937 Mtoe by 2017. Thus, the Indian energy sector is expected to witness an expansion of energy demand, with a persistently high dependence on imported fossil fuels, posing challenges of energy security, high emissions levels also coupled with energy access issues.
5. Thus India faces a formidable challenge of meeting its energy needs while combating climate change. The country needs to follow a multi-pronged strategy to prepare for and respond to various
2 Parliament of India Report No. 25 / RN / Ref. / August/ 2013, last accessed on 15th February 2015 3 CAEP-TERI 2011, Environment and Development: China and India, Joint study by the Chinese Academy for Environmental Planning (CAEP) and The Energy and Resources Institute (TERI), commissioned by CCICED and ICSD. New Delhi: TERI Press 4 Kilogram of oil equivalent (WDI, 2014) 5 http://data.worldbank.org/indicator/EG.USE.PCAP.KG.OE/countries/1W?display=default, last accessed on 10th January 2015 6 GOI 2012, 12th Five Year Plan (2012-2017), Economic Sectors, Planning Commission, Government of India

Page 9
dimensions of energy security problem, energy efficiency and mainstreaming of renewable energy sources into country’s energy mix, for combating climate change.
6. Realizing the daunting challenge of climate change and its implications for the country, India has been actively pursuing both international and national action on combating climate change. At national level, India has instituted and is in the process of implementing rigorous plans, regulations, laws and programmes leading directly or indirectly to tackling climate change.
1.2 Intended Nationally Determined Contributions (INDC) for India
7. Conference of Party of UNFCCC at 19th Session held in Warsaw in November 2013 in Para 2(b) of Decision 1/CP.19 invited all Parties to initiate or intensify domestic preparations for their Intended Nationally Determined Contributions (INDC) and to communicate them well in advance of the 21st Session of the COP (by the first quarter of 2015 by those Parties ready to do so).
8. As a follow up to the above Decision, steps have been taken to finalize India’s INDC on mitigation, adaptation, finance, technology and capacity building. The comprehensive INDC cover all the national missions and other initiatives under National Action Plan on Climate Change as well as State Action Plan on Climate Change. India is in the process of preparing INDC and is expected to submit it by the end of 2015 with main focus on – (a) what India can achieve in terms of emissions reduction using its own domestic resources and (b) where India can reach if finances are available (from industrialised countries) and technologies are available at affordable cost. It is likely that India may consider submitting two INDCs – one without finances and free technology transfers, and one with both finance and technology transfer built in.
9. The contributions will factor in India’s domestic obligations of addressing the basic development needs in terms of achieving minimum standards of living for its entire population. The contributions will take in to account the imperatives for addressing the challenges of poverty eradication, food security and nutrition, universal access to education and health, gender equality and women empowerment, water and sanitation, energy, employment, sustainable cities and human settlement and last but not the least, the means of implementation for enhanced action for achieving among others sustainable development goals.
10. India will give high priority to inclusive growth and notes that pursuit of low carbon development is consistent with growth and inclusion. Energy efficiency in households, buildings, industry and transport will play important role. At the same time low carbon supply technologies, such as solar and wind in the power sector and greater use of public transport and non-motorized transport are critical. Increased sequestration through enlarged green cover through Green India Mission will also help. Reduced local environmental pollution and dependence on imported energy are also identified as benefits of a low carbon strategy.
11. The Expert Group formed by the Planning Commission in 2010 on Low Carbon Strategies for Inclusive Growth recommended that the Government of India should also continue conducting various studies to determine the measures that India should pursue to simultaneously advance the country’s development and climate change objectives. Under the Low Carbon Growth Strategy, India has proposed a reduction in emission intensity of GDP by 25%, over 2005 levels, by 2020.
1.3 The National Action Plan on Climate Change 12. Domestically, as a response to combat the impacts of climate change, the Prime Minister’s Council
on Climate Change released India’s National Action Plan on Climate Change (NAPCC) on 30 June 2008. The NAPCC represents a multi-pronged, long-term and integrated strategy for achieving key climate change goals: namely, “achieving national growth objectives through a qualitative change in direction that enhances ecological sustainability, leading to further mitigation of greenhouse gas emissions”, and “devising efficient and cost-effective strategies for end-use demand-side management”. The core of the NAPCC is formed by eight national missions (Figure 1).

Page 10
Figure 1: India's National Action Plan on Climate Change Missions
13. The NAPCC, along with its eight missions, serves as the first country-wide framework on climate change with the approval and support of the Government of India. The eight missions in turn identify measures that promote development objective of the country while producing co-benefits that address climate change effectively.
14. Of these missions the two most relevant in the context of the GEF SAPCC project are detailed below.
A. The National Mission on Enhanced Energy Efficiency (NMEEE)
15. The NMEEE was launched in June 2008. The NMEEE promotes innovative policy and regulatory
regimes, market-based financing mechanisms and business models to enhance cost-effective efficiency investments in energy-intensive large industries. This accelerates the shift to energy-efficient appliances, and proposes fiscal instruments to promote energy efficiency. Demand-side management, especially in municipalities, is one of the priority areas of intervention. Municipalities account for 10% of the total electricity consumed in cities in India and they spend about 60% of their budget on electricity bills. Several studies conducted in India indicate that it is possible to improve the energy efficiency of municipalities by at least 20-25%. The Bureau of Energy Efficiency (BEE), designated as the legal entity for executing initiatives under NMEEE, has been engaging in public-private partnerships to implement various EE programs.
16. NMEEE has put in place four new initiatives to enhance EE in the country. One of the four initiatives is the Perform, Achieve and Trade (PAT) scheme, which is a national market mechanism where each designated consumer (defined as per EC Act 2001) will be given specific energy consumption (SEC) target to meet over a period of three years. Any additional saving will qualify for issuance of energy saving certificates, which can be traded internally with other designated consumers (short of
NAPCC
National Solar Mission (NSM)
Aims at increasing the share of solar energy in the total energy mix through development of new solar technologies, while
attempting to expand the scope of other renewable and non-fossil options such as nuclear energy, wind energy and
biomass
National Mission on Enhanced Energy
Efficiency (NMEEE)
Comprises of four initiatives, namely, a market based mechanism for trading in certified energy savings in energy-intensive large industries,
accelerating the shift to EE appliances in designated sectors DSM programmes in all sectors by capturing future energy savings, and
developing fiscal instruments to promote EE
National Mission on Sustainable Habitat
(NMSH)
Attempts to promote energy efficiency in buildings, management of solid waste and modal shift to public transport including transport
options based on bio-diesel and hydrogen.
National Water Mission (NWM)
Has, as its objective, the conservation of water, minimizing wastage and ensuring more equitable distribution both across
and within states.
National Mission for Sustaining Himalayan Eco-System (NMSHE)
Aimed at evolving management measures for sustaining and safeguarding the Himalayan glacier and mountain eco-
system.
National Mission for Green India (NMGI)
Fcusses on enhancing eco-system services and carbon sinks through afforestation on degraded forest land in line with the national policy of expanding the forest and tree cover to 33% of the total land area of
the country
National Mission for Sustainable Agriculture
(NMSA)
Would develop strategies to make Indian agriculture more resilient to climate change through development of new varieties of thermal
resistant crops, new credit and insurance mechanisms and improving productivity of rain fed agriculture.
National Mission on Strategic Knowledge for
Climate Change
Is intended to identify the challenges of, and the responses to, climate change through research and technology development and
ensure funding of high quality and focused research into various aspects of climate change.

Page 11
targets) or through exchanges. In the future, the scope of this scheme may be extended to cover prioritized cities, towns and municipalities.
Figure 2: Components of NMEEE 17. In addition to the programs being implemented by Ministry of Power (MoP) and BEE, the NMEEE
spelt out four new initiatives to enhance energy efficiency in the country (Figure 2): (a) A market based mechanism through certification of energy savings that could be traded (Perform Achieve and Trade (PAT) Scheme); (b) Accelerating the shift to energy efficient appliances in designated sectors through innovative measures to make the products more affordable (Market Transformation for Energy Efficiency (MTEE); (c) Creation of mechanisms that would help finance demand side management programmes in all sectors by capturing future energy savings. (Energy Efficiency Financing Platform (EEFP); and d) Developing fiscal instruments to promote energy efficiency name Framework for Energy Efficient Economic Development (FEEED).
18. The size of energy efficiency and low carbon activity market in India is provided in the text box 1 below.
Box 1: Energy Efficiency & Low Carbon Market in India
In 2012, Energy Efficiency is estimated to be a US$ 16 billion opportunity, and the Bureau of Energy Efficiency
forecasts expenditure of $148 billion throughout the next decade. The Indian market for Low Carbon & Environmental Goods & Services over the next decade is valued at US $310
billion (UKTI 2011). World’s fourth largest clean tech opportunity (US, China and Japan) with a 6% share of the global market (EY 2011). The projected market potential for green building material and technologies is estimated to be US $100 billion (Green
Building Association 2012). The water and wastewater market was valued at $4 billion in 2011, and is growing at a rate of 10-12% every year
(TERI). Over 160,000 MT of municipal solid waste is generated daily, driven by rapid urbanization, with 500m people projected
to move from rural communities to cities by 2020. B. The National Solar Mission (NSM) 19. The National Solar Mission aims to deliver 20,000 MW of solar power by 2022. The scale of
financing required to achieve NSM targets is enormous, in the order of US$90 billion. Mobilizing private investments through banks and financial institutions will have a crucial role to play in achieving this target. The Mission encourages both solar photovoltaic (PV) and solar thermal technologies, and promotes solar energy in diverse applications like lighting and cooking. Considering that India lies in the solar belt of the world, the NSM is considered to be India’s response to the challenges of energy security and climate change. The Mission aims to achieve grid parity for solar electricity through research & development, domestic production, large-scale deployment and

Page 12
long term and predictable policy that encourages private sector participation in the solar business. The Ministry of New & Renewable Energy (MNRE) is overlooking/implementing the mission, Indian Renewable Energy Development Agency (IREDA) focuses on renewable energy financing and the National Thermal Power Company (NTPC) and its National Vidyut Vyapar Nigam (NVVN) facilitates Power Purchase Agreements (PPA). The Solar Energy Corporation of India (SECI) has further been set up by MNRE to facilitate smooth implementation of the NSM. For aggressive R&D and manpower development, the National Solar Energy Institute (earlier it was known as Solar Energy Centre) was upgraded and a number of national centres were supported in various institutes of the country.
20. Both NSM and NMEEE will accelerate the implementation of a number of existing Government programmes. Programmes such as the Rural Electrification Programme, Decentralised Distributed Generation (DDG) Programme, the Rajiv Gandhi Grameen Vidyutikaran Yojana (RGGVY) in the case of NSM; and Perform Achieve and Trade Scheme (PAT), and Super-Efficient Equipment Program (SEEP) in the case of NMEEE.
C. National Mission on Sustainable Habitat (NMSH)
21. The NMSH was approved by Government of India in February 2010. The Sustainable Habitat Mission aims to make the habitat (i.e. the living environment of humans) sustainable through enhancement of EE in buildings, effective solid waste management, and modal shift to public transport. The NMSH objectives will be achieved via two initiatives: (i) extending the application of ECBC (at present applicable to only new and large commercial buildings) to retrofitting buildings; and (ii) conducting research and development on bio-chemical conversion, wastewater use, sewage utilization, and waste recycling option.
22. Each of the missions of the NAPCC has been accompanied by implementation plans, with respective ministries assigned as nodal implementation agencies. Table 1 below provides a brief description of the roles of the various government agencies in implementation of NAPCC missions. Table 2 provides the financing sources for NAPCC and SAPCCs, the main actors involved in financing for climate related actions, their role and the kind of agencies they in turn coordinate with for facilitating climate finance.
Table 1: Designated Government Agencies for NAPCC Missions
Nodal Ministry/Agency: Central & State
Key Role
Prime Minister’s Council on Climate Change7
The Council is a high level advisory group set up by the Prime Minister of India, largely to coordinate national action plans for assessment, adaptation and mitigation of climate change. It advises government on pro-active measures that can be taken by India to deal with the challenge of climate change. It also facilitates inter-ministerial coordination and guide policy in relevant areas.
Ministry of Environment & Forests and Climate Change (MoEFCC), GoI
MoEFCC is the nodal agency for planning, promotion, coordination and managing the execution of India’s environmental/forestry policies & programs. Its Climate Change Division is the nodal body for climate change cooperation and global negotiations. The MoEFCC’s National Clean Development Mechanism Authority is responsible for evaluating and approving Clean Development Mechanism projects. While the Climate Change Division is the nodal unit for coordinating the implementation of the NAPCC, the MoEFCC is the implementing agency of the National Mission for a Green India.
Ministry of New & Renewable Energy (MNRE), GoI
MNRE is the key/nodal ministry for all elements of the new and renewable energy in the country. Its role is to facilitate research, design, development, manufacture, and deployment of new and renewable energy systems. The MNRE is the key nodal agency for the implementation of the National Solar Mission, through an autonomous body, that reports directly to the Prime Minister’s Council on Climate Change. This consists of a mission steering group, chaired by the MNRE and composed of representatives from relevant ministries and stakeholders to oversee the overall implementation of the mission.
7 http://pib.nic.in/newsite/PrintRelease.aspx?relid=111090

Page 13
Ministry of Power (MoP), GoI
MoP is the key ministry to implement the National Electricity Policy & National Rural Electrification Policy. It is the nodal ministry for the implementation of the Energy Efficiency Mission through its subsidiary, the Bureau of Energy Efficiency (BEE). Various sectors work in close coordination with the BEE to implement the mission targets, and implementation is monitored by the Prime Minister’s Council on Climate Change on a quarterly basis.
Bureau of Energy Efficiency (BEE)
BEE primary objectives is to improve energy efficiency and reduce the energy intensity of the Indian economy by developing policies that focus on self-regulation and market principles for all sectors of the economy. It is the nodal agency for the implementation of the NMEEE.
Ministry of Agriculture (MoA)
MoA is the nodal agency for the implementation of Sustainable Agriculture Mission
Ministry of Urban Development (MoUD)
MoUD is the nodal agency to implement National Mission for Sustainable Habitat and also overlook key urban program Jawarharlal Nehru National Urban Renewal Mission (JNNURM)
Ministry of Science & Technology & Department of Science & Technology
Ministry of Science & Technology is the nodal agency for the National Mission on Sustainable Himalayan Eco-systems. Also, Department of Science and Technology coordinates several missions under the National Action Plan on Climate Change (NAPCC).
Central Electricity Regulatory Commissions & State Electricity Regulatory Commissions
The Electricity Act of 2003 provides the state electricity regulatory commissions with authority to specify renewable purchase obligations and determine tariffs within the state. The Central Electricity Regulatory Commission is authorized to regulate the tariff of generating companies owned or controlled by the central government and to regulate and promote the development of a market (including trading) in power.
Ministry of Water Resources & Rural Development
Ministry of Water Resources & Rural Development is the key agency to overlook the various Climate Change adaptation program in the country with the help of programs like National Rural Employment Guarantee Act or Integrated Watershed Management Program. Various NAPCC key missions are planned to route through some of these programs like National Green India Mission etc.
Table 2: Key Financing Sources for NAPCC and SAPCCs in India
ACTORS KEY INSTITUTIONS, OR AGENCIES
ROLE IN CLIMATE FINANCE
CO ORDINATION WITH OTHER ACTORS
Ministries, Departments within government
PM Council on Climate Change, NITI Aayog (formerly Planning Commission), NAPCC Nodal Ministries: MoEFCC, MNRE, MoP: BEE, MoWR, MoA, DST, MoF: CCFU & NCEF
MoF and Finance Commission responsible for budgetary support
BEE manages market mechanisms
NCDMA under MoEFCC approves CDM projects
Inter-ministry Multilateral/bilateral agencies DFIs Private CDM actors
Local & Sub-National Entities Development Finance Institutions (DFI)
State Governments & SAPCC NABARD, SIDBI
Operate on the basis of allocations from the central and state budgets
Project-based international funding
NABARD is the NIE for the Adaptation Fund
MoEFCC MoF Multilateral/bilateral
agencies Stakeholder
consultation with civil society, local communities
MoEFCC NGOs, civil society
Public Sector Banks
SBI, Canara Bank, Central Bank of India, PNB, Andhra Bank Government backed NBFCs: IREDA, Power Finance Corp., Power
Financing renewables, energy efficiency Soft loans, co-financing.
With private players/project developers (mostly) IREDA operates under the administrative control of MNRE

Page 14
ACTORS KEY INSTITUTIONS, OR AGENCIES
ROLE IN CLIMATE FINANCE
CO ORDINATION WITH OTHER ACTORS
Private Sector Banks
Trading Corp., etc. ICICI, Axis Bank, HDFC, IDFC, Standard Chartered NBFCs: L&T Infrastructure Finance, Tata Capital
Loans, co-financing, infrastructure financing, project finance for low carbon investment
With private players/project developers (mostly)
International Climate Funds
Global Environment Facility (GEF), Clean Technology Fund (CTF), Special Climate Change Fund (SCCF), Adaptation Fund
Grants, concessional loans, public-private Partnerships.
Project-to-project, focal points in ministries (if any), stakeholder participation
Bilateral agencies GIZ, DFID, USAID, CIDA, IDRC, SDC, SIDA, NORAD etc.
Grants, concessional loans, public-private partnerships
Central and state governments NGOs, civil society
Multilateral agencies
WB, UNDP, IFC, ABD, UNIDO
Grants, concessional loans, public-private partnerships
Central and state governments NGOs, civil society
Source: ODI 2014 23. The domestic resources and mechanisms available for financing the NAPCC “Missions” in India, as
well as other low carbon strategies and environmental policies of the government can be broadly divided into public climate finance and private climate finance (Figure 3).
Source: ODI, 2014
Figure 3: Financing Mechanisms & Sources of Funds for NAPCC & Other Climate related Activities
24. 12th FYP (2012-2017): The 12th FYP strives for faster and more inclusive growth along with a vision
for promoting sustainability. According to the 12 FYP, India will require new energy efficient practices in urban housing and transport to achieve environmental sustainability. This Plan also calls for the use of energy efficient technologies in coal-based electricity generation such as the introduction of super critical and ultra-super critical boilers. The Plan aims to promote EE in industries, farms and offices to limit growing energy demand. Also, highly energy-efficient appliances are to be promoted through labelling and mandatory standards. The 12 FYP identifies the need to develop and adopt transport policies and related technologies for more energy efficient vehicles in India.
25. The Centre for Development Finance (CDF), Institute for Financial Management Research (IFMR), and Department of Humanities and Social Sciences, IIT Madras has conducted an evaluation of NAPCC in July 2012. A summary of strengths, weaknesses and potential challenges for the

Page 15
implementation of key missions like NMEEE, NSM and National Mission on Sustainable Habitat from the study are summarized in Table 3 below.
Table 3: Foreseen Strengths, Challenges & Weaknesses of Key NAPCC Missions
Indicator National Mission on
Enhanced Energy Efficiency (NMEEE)
National Solar Mission (NSM)
National Mission on Sustainable Habitat
(NMSH)
1. Strengths Innovative mechanisms have been introduced, such as Perform, Achieve and Trade (PAT), which set targets for reduction of specific energy consumption of Designated Consumers (large scale industries), and the Super-Efficient Equipment Program (SEEP) under Market Transformation for Energy Efficiency (MTEE);
The promotion of Energy Service Companies (ESCOs) through the provision of dedicated Energy Efficiency Financing Platform (EEFP) is an important element;
A fair amount of progress on PAT has already been achieved, together with the establishment of the Partial Risk Guarantee Fund (PRGF) and Venture Capital Fund for Energy Efficiency ( VCFEE) under the framework of Energy Efficient Economic Development ( FEEED)
The mission has raised the ambition of solar for individual states and the country as a whole;
Renewable Purchase Obligations (RPOs) and use of reverse auction to allocate projects has brought in a fair degree of transparency and accountability to the process;
A substantial amount of work on the mission has already been achieved in Phase – I (bidding on projects, setting up of industry and research advisory councils, commissioning of solar projects).
The mission attempts to understand how future land use changes can take place along a low carbon pathway;
There is good linkages with existing schemes such as Jawaharlal Nehru National Urban Renewable Mission (JNNURM) and city sanitation plan , without creating separate bureaucracies;
2. Potential Challenges
It may be difficult to achieve substantial improvement in energy efficiency in a situation where there are no targets either at the national or state levels;
There is serious lack of capacity in research (both public as well private sector) and difficulty in finance for promoting energy efficiency across various sectors;
Several infrastructural bottlenecks need to be ad-dressed, even as complex technologies are deployed in various industries to achieve significant energy savings & efficiency improvements
Competition from China in the area of solar manufacture will likely be a challenge, particularly due to the lack of an enabling policy within India (e.g., no duties for importing cells and modules, but manufacturing them locally attracts the same);
Research capacity needs to be substantially enhanced to make India a global leader in solar energy;
There needs to be sufficient safeguards to prevent the proliferation of
Protecting the transport and housing needs of the vulnerable and poor will be an increasing challenge given the growing strength of vested interests;
Integrating bus systems and metro projects with urban housing, urban population needs, infrastructure planning and design are complex and path-dependent;
There is insufficient capacity among the officials involved in the implementation of the mission;
Working in conjunction with other projects of the Ministry of Urban Development (MoUD) will be challenging, as

Page 16
spurious suppliers & low quality products
will coordination with various other ministries, especially the Ministry of Power (MoP) and Ministry of Housing and Urban Poverty Alleviation (MoHUPA), both of which are important for achieving the mission goals;
Designing incentives (both fiscal & non-fiscal) and rules for implementation of the mission
3. Weaknesses The energy sector has
been on a low carbon pathway for the past 20-30 years, and this mission brings little novelty to the sector;
The mission’s is too narrowly focussed on end-use energy efficiency in particular sub sector, rather than improving efficiency across the energy system as a whole, including high grid losses, thereby missing the opportunity to be ambitious;
PAT currently targets only large-scale manufacturing industries, while smaller scale industries which may be more polluting are not directly affected by the scheme.
There is not enough emphasis on targeting off-grid potential which could have served the poor and vulnerable, thereby achieving development benefits;
There is failure to incorporate successful schemes of the past, such as solar water heater financing scheme of the Ministry of Non-Conventional & Renewable Energy which led to boom in a sector in Karnataka & Maharashtra in the 1990s;
There is no attention paid to the poor and vulnerable in the two important sections of the document on urban transport and planning;
Demand-side planning should have
Source: Byravan and Rajan, 2013
1.4 The State Action Plan on Climate Change
26. The NAPCC encourages planning and coordination at different levels, especially state (sub-national) level. Thus, it has become imperative for all States in the country to have programmes of action that tune national initiatives to regional and local socioeconomic and ecological conditions. This has assumed the shape of formulation of State Action Plans on Climate Change (SAPCC). It’s a method to decentralize the NAPCC approach to achieve low carbon pathway. There is a need to have greater synergy between national priorities and state-specific strategies, as it requires actions in several sectors that are State subjects and have to be implemented in the States. A common framework of the SAPCC would be to harmonize the state and national plans. The SAPCCs documents current and future development scenarios and likely impact of climate change, and identify vulnerable areas, sectors and communities and associated risks for the respective state. Based on this assessment, each State has come up with its own list of activities to address these issues in specific sectors that are in line with the national climate missions. These sectors include, power, transport, industry, buildings, municipal energy efficiency and forestry sectors. In the preparation of SAPCCs, the required inventory for these sectors is sourced from the national inventory management system (NIMS) that was established as part of the National Communication process; inventory estimation and management are not part of the SAPCC preparation process. The Government of India has provided some financial support to state governments for the implementation of their SAPCCs
Page 17
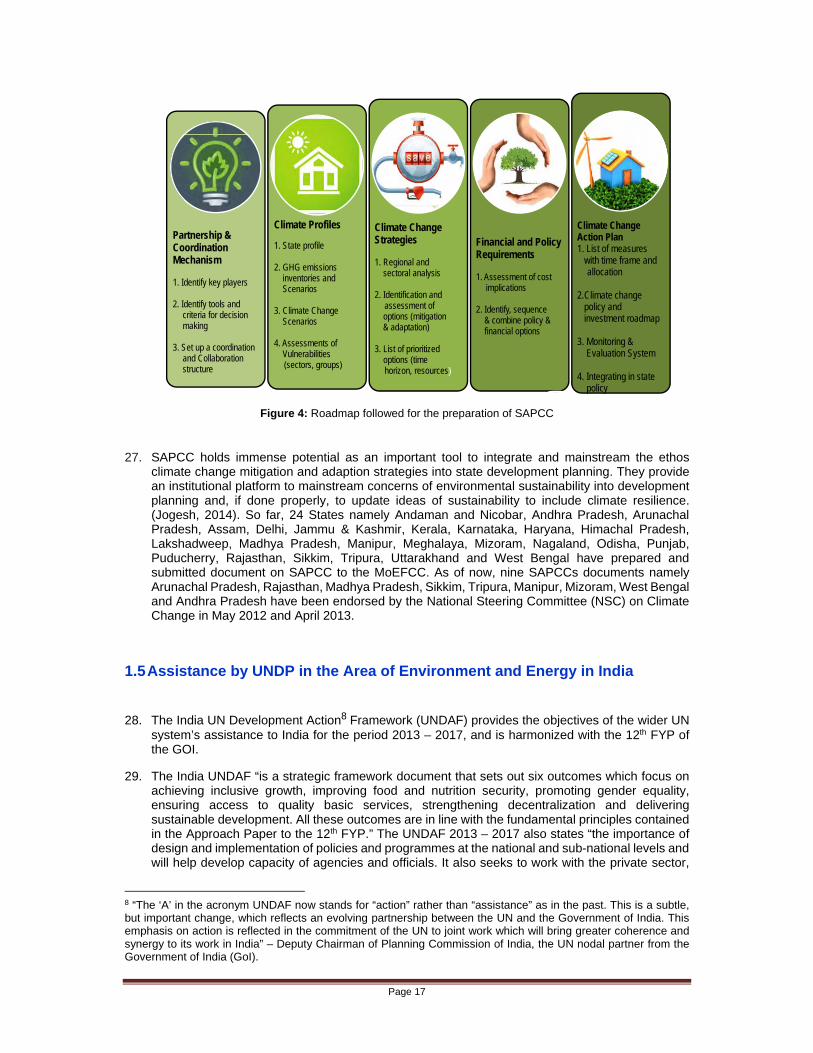
Figure 4: Roadmap followed for the preparation of SAPCC
27. SAPCC holds immense potential as an important tool to integrate and mainstream the ethos climate change mitigation and adaption strategies into state development planning. They provide an institutional platform to mainstream concerns of environmental sustainability into development planning and, if done properly, to update ideas of sustainability to include climate resilience. (Jogesh, 2014). So far, 24 States namely Andaman and Nicobar, Andhra Pradesh, Arunachal Pradesh, Assam, Delhi, Jammu & Kashmir, Kerala, Karnataka, Haryana, Himachal Pradesh, Lakshadweep, Madhya Pradesh, Manipur, Meghalaya, Mizoram, Nagaland, Odisha, Punjab, Puducherry, Rajasthan, Sikkim, Tripura, Uttarakhand and West Bengal have prepared and submitted document on SAPCC to the MoEFCC. As of now, nine SAPCCs documents namely Arunachal Pradesh, Rajasthan, Madhya Pradesh, Sikkim, Tripura, Manipur, Mizoram, West Bengal and Andhra Pradesh have been endorsed by the National Steering Committee (NSC) on Climate Change in May 2012 and April 2013.
1.5 Assistance by UNDP in the Area of Environment and Energy in India
28. The India UN Development Action8 Framework (UNDAF) provides the objectives of the wider UN system’s assistance to India for the period 2013 – 2017, and is harmonized with the 12th FYP of the GOI.
29. The India UNDAF “is a strategic framework document that sets out six outcomes which focus on achieving inclusive growth, improving food and nutrition security, promoting gender equality, ensuring access to quality basic services, strengthening decentralization and delivering sustainable development. All these outcomes are in line with the fundamental principles contained in the Approach Paper to the 12th FYP.” The UNDAF 2013 – 2017 also states “the importance of design and implementation of policies and programmes at the national and sub-national levels and will help develop capacity of agencies and officials. It also seeks to work with the private sector,
8 “The ‘A’ in the acronym UNDAF now stands for “action” rather than “assistance” as in the past. This is a subtle, but important change, which reflects an evolving partnership between the UN and the Government of India. This emphasis on action is reflected in the commitment of the UN to joint work which will bring greater coherence and synergy to its work in India” – Deputy Chairman of Planning Commission of India, the UN nodal partner from the Government of India (GoI).
Partnership & CoordinationMechanism
1. Identify key players
2. Identify tools and criteria for decision making
3. Set up a coordination and Collaboration structure
Climate Profiles
1. State profile
2. GHG emissionsinventories andScenarios
3. Climate ChangeScenarios
4. Assessments ofVulnerabilities (sectors, groups)
Climate ChangeStrategies
1. Regional andsectoral analysis
2. Identification and assessment ofoptions (mitigation& adaptation)
3. List of prioritizedoptions (time horizon, resources)
Financial and Policy Requirements
1. Assessment of cost implications
2. Identify, sequence& combine policy &financial options
Climate ChangeAction Plan1. List of measures
with time frame and allocation
2.Climate changepolicy and investment roadmap
3. Monitoring &Evaluation System
4. Integrating in state policy

Page 18
building capacity to adopt improved technologies and to address market barriers to more sustainable resource use”. The UNDAF 2013 – 2017 has an outcome that is directly relevant to this GEF-SAPCC project, namely sustainable development. The Sustainable Development Outcome includes “Government, industry and other relevant stakeholders actively promote more environmentally sustainable development”.
30. UNDP was an active partner in the development of the UNDAF and is also a lead agency for many of the thematic areas of interventions by the UN system in India under the UNDAF. The UNDAF states that the UN proposes to work in nine (9) States of India with the highest proportion of people living in poverty - Assam, Bihar, Chhattisgarh, Jharkhand, Madhya Pradesh, Maharashtra, Odisha, Rajasthan and Uttar Pradesh. Among these, the state of Jharkhand and Manipur are the targeted states in this project.
31. UNDP operations in India fall under the “Country Programme Action Plan” (CPAP) 2013 – 2017 agreed between the GOI and UNDP. Under the Sustainable Development Outcome of the CPAC 2013 - 2017, UNDP’s objective in this area is to expand access to clean energy and help build the capacity of communities to manage natural resources and withstand climate change and disasters. Specifically, at the request of the Government and in consultation with partners, UNDP will continue its support for initiatives that help to reduce the impact of climate change. UNDP is the lead agency appointed by the Ministry of Environment and Forests and Climate Change (MoEFCC) responsible for coordination, strategy preparation and implementation of phase out of Hydrocholoroflurocarbons (HCFCs) in the aerosol, fire-fighting, foam refrigeration, air conditioning and solvent sectors in close cooperation with the Ozone Cell in MoEFCC. UNDP will support the Ozone Cell to implement the accelerated phase out schedule of the Montreal Protocol on Substances that Deplete the Ozone Layer. UNDP will work directly with government counterparts to ensure national commitments under the UNFCCC are met including the National Communication and Biennial Update Report and will help to build the technical capacity of relevant departments to implement State Action Plans on Climate Change. UNDP will work with state and local governments in 10 cities and 25 multi-hazard prone districts to facilitate adoption of disaster and climate risk reduction measures. In select states, UNDP will partner with industry partners to strengthen community resilience through skill development and improved disaster preparedness”.
32. The Government of India, through its designated nodal department, the Department of Economic Affairs (DEA) in the Ministry of Finance, has exercised the necessary national ownership and direction of UNDP program activities by approving and signing the Country Programme Action Plan (CPAP) 2013-2017 with UNDP. Specific mention is made in the CPAC 2013 – 2017 that nearly 40% of the estimated $260 million resource requirement is expected to be mobilized from UN Trust Funds, including the GEF.
2. SAPCCS AND IMPLEMENTATION OF RENEWABLE ENERGY AND ENERGY
EFFICIENCY MITIGATION OPTIONS FOR CLIMATE CHANGE MITIGATION IN THE
TARGETED STATES
33. The current project targets two states: Jharkhand and Manipur. The state of Jharkhand is in eastern
India and Manipur is one of the north-eastern states. The two states are situated in two different regions of India, and with varying geographic and socio-cultural profiles. Brief geographic and socio-economic profiles of the two states are provided below.
2.1 Geographic and socio-economic profile
2.1.1 Jharkhand
34. Jharkhand is a new state that was formed in 2000. It was bifurcated from the southern part of Bihar; the state is generously endowed with mineral wealth. Besides minerals, Jharkhand is also endowed with adequate water resources, relatively moderate climate and a very fertile land
Page 19
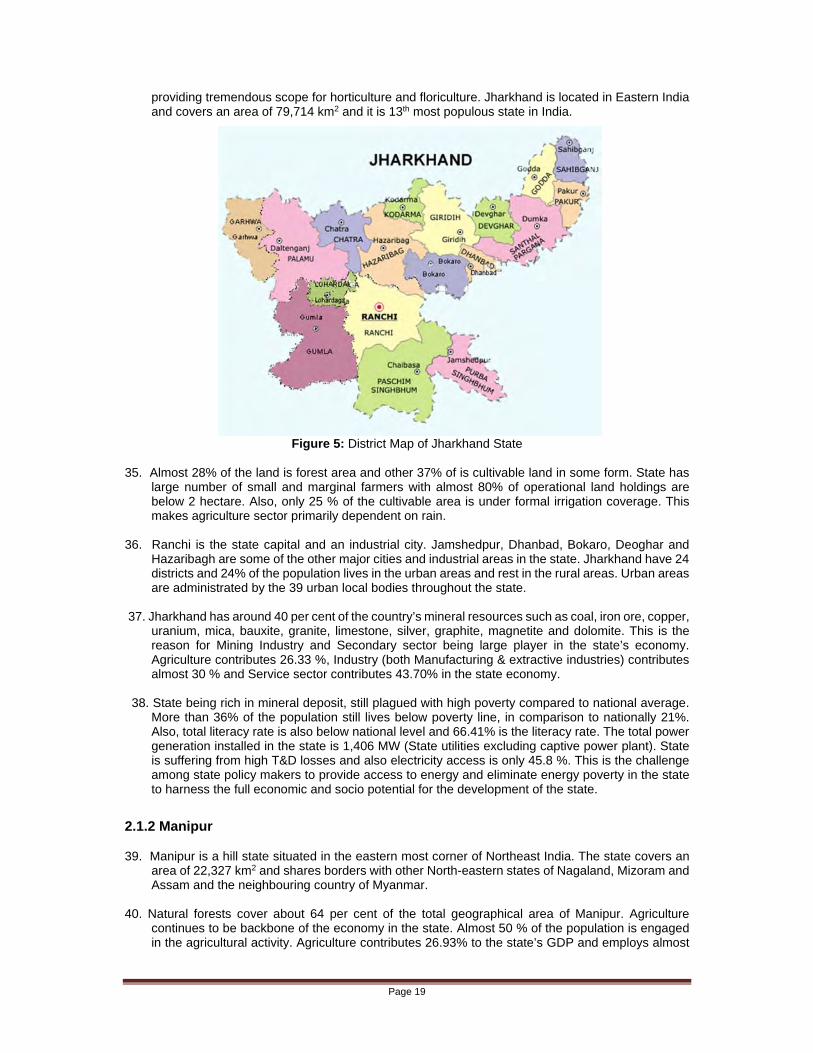
providing tremendous scope for horticulture and floriculture. Jharkhand is located in Eastern India and covers an area of 79,714 km2 and it is 13th most populous state in India.
Figure 5: District Map of Jharkhand State 35. Almost 28% of the land is forest area and other 37% of is cultivable land in some form. State has
large number of small and marginal farmers with almost 80% of operational land holdings are below 2 hectare. Also, only 25 % of the cultivable area is under formal irrigation coverage. This makes agriculture sector primarily dependent on rain.
36. Ranchi is the state capital and an industrial city. Jamshedpur, Dhanbad, Bokaro, Deoghar and
Hazaribagh are some of the other major cities and industrial areas in the state. Jharkhand have 24 districts and 24% of the population lives in the urban areas and rest in the rural areas. Urban areas are administrated by the 39 urban local bodies throughout the state.
37. Jharkhand has around 40 per cent of the country’s mineral resources such as coal, iron ore, copper,
uranium, mica, bauxite, granite, limestone, silver, graphite, magnetite and dolomite. This is the reason for Mining Industry and Secondary sector being large player in the state’s economy. Agriculture contributes 26.33 %, Industry (both Manufacturing & extractive industries) contributes almost 30 % and Service sector contributes 43.70% in the state economy.
38. State being rich in mineral deposit, still plagued with high poverty compared to national average.
More than 36% of the population still lives below poverty line, in comparison to nationally 21%. Also, total literacy rate is also below national level and 66.41% is the literacy rate. The total power generation installed in the state is 1,406 MW (State utilities excluding captive power plant). State is suffering from high T&D losses and also electricity access is only 45.8 %. This is the challenge among state policy makers to provide access to energy and eliminate energy poverty in the state to harness the full economic and socio potential for the development of the state.
2.1.2 Manipur
39. Manipur is a hill state situated in the eastern most corner of Northeast India. The state covers an area of 22,327 km2 and shares borders with other North-eastern states of Nagaland, Mizoram and Assam and the neighbouring country of Myanmar.
40. Natural forests cover about 64 per cent of the total geographical area of Manipur. Agriculture
continues to be backbone of the economy in the state. Almost 50 % of the population is engaged in the agricultural activity. Agriculture contributes 26.93% to the state’s GDP and employs almost

Page 20
60% of the working population. Industry and Manufacturing sector contribute 25.15% and service sector contributes 47.92% to the state’s GDP. The lower contribution from agriculture and allied service to the Gross State Domestic Product (GSDP) is due to the unsustainable and non-viable nature of the sectors and low capital base in the sectors. Manipur has significant potential for growing various horticultural crops because of varied agro-climatic conditions. Growing of fruits and vegetables on small plots of land provides additional income to the farmers undertaking crop-husbandry.
41. Manipur has very high literacy rate of 79.21%. Nonetheless, state suffers from a high rate of poverty
as well. Poverty ratio is 36.89%; it indicates that large number of population reels under the extreme poverty in the state. Manipur also lags in the state infrastructure development.
42. Power sector in the state is primarily dependent on the allocation from the central government and
from outside the state. The total installed capacity of the State owned generating stations is 45.11 MW as per the MSPDCL's tariff order for 2012-13, of which 8.51 MW is based on Diesel, 36 MW is based on heavy fuel and rest are Hydel Generation based power plants. All the existing generation assets of about 45 MW are primarily functioning as back-up generation facilities and as mentioned earlier major electricity source is from outside the state. Few hydel projects are proposed for the state to be self-sufficient in the electricity sector. Per capita power consumption is very low (240 units).
Figure 6: District Map of Manipur 43. Table 4 below outlines the similarities and differences among the two states on various basic
geographic and socio-economic aspects as relevant to RE and EE activities
Table 4: Status of two states on key development parameters
Parameter National Jharkhand Manipur Basic indicators – geographic and demographic Population (in millions) 1,210,193,422 32,988,134 2,570,390 Population Rank (29 States) - 13th 24th Population density (persons per square km)
382 414 115
Number of districts 640 24 9

Page 21
Parameter National Jharkhand ManipurNumber of inhabited villages 593,6159 32,620 2,588 Geographical area (square km) 3,287,240 79,714 22,327 Socio-economic indicators Income per capita (INR per capita real Net State Domestic Product at 2004-05 prices)
21,143 18,510 18,640
Human Development Index (HDI) 2007-08
0.58610 0.367 0.5731112
HDI rank in India (of 23 recorded States) 2007-08
- 19th 6th
Poverty (% below poverty line) (Tendulkar Methodology)13 2011-12 (Based on MRP Consumption)
21.92 36.96 36.89
Poverty rank (of 29 States)14 - 27th 26th Rural Unemployment rate (Nos. Per 1000 population)
16 39 7
% rural population below the poverty line
26% 34% 36%
Share of Agriculture in state economy 13.6815 26.3316 26.93 Share of Manufacturing in state economy
15.70 29.9717 25.15
Share of Services in the state economy
59.29 43.7018 47.92
Total power generation (MW) 2,23,343.60 1406 19 45.1120 21 Power consumption per capita (Units) 818 515 240.2222 Power deficit (%/MW)23 -7.9% -9.6%/108
MW -9.3%/14 MW
% of renewables in total installed capacity
13% 150MW (130 Hydro
POWER & 20.05
RE)/10.0624
5.45MW (Small
Hydro)/12%
No. of municipalities (urban local bodies) in the state
3,255 39 28
T&D losses (%) 23.6525 33.46 4526
9 http://censusindia.gov.in/Census_And_You/area_and_population.aspx 10 http://hdr.undp.org/en/content/table-1-human-development-index-and-its-components 11 This HDI is combined for all the North Eastern States excluding Assam 12 http://www.iamrindia.gov.in/media_coverage_compilation/IHDR_Summary.pdf 13 http://www.rbi.org.in/scripts/PublicationsView.aspx?id=15283 14 http://www.rbi.org.in/scripts/PublicationsView.aspx?id=15283 15 https://data.gov.in/catalog/gdp-india-and-major-sectors-economy-share-each-sector-gdp-and-growth-rate-gdp-and-other#web_catalog_tabs_block_10 16 Jharkhand Annual Plan 2014-2015, Government of Jharkhand 17 Jharkhand Annual Plan 2014-2015, Government of Jharkhand 18 Jharkhand Annual Plan 2014-2015, Government of Jharkhand 19 Jharkhand Annual Plan 2014-2015, Government of Jharkhand 20 http://www.mspdcl.com/irj/go/km/docs/internet/MANIPUR/webpage/pages/About.html/ http://manipurpower.nic.in/dieselgen.html 21 Most of the installed capacity by state is used as the stand by options whenever there power shortage or grid failure. 22 http://pib.nic.in/newsite/erelease.aspx?relid=74497 23 http://www.cea.nic.in/reports/yearly/lgbr_report.pdf 24 Including Hydro & RE 25 http://www.ibtimes.co.in/india-loses-23-power-during-td-reveals-piyush-goyal-604472 & http://www.cea.nic.in/reports/monthly/executive_rep/feb14.pdf 26 http://manipurpower.nic.in/Tariff_new.pdf

Page 22
2.2 Highlights of the SAPCCs
2.2.1 Jharkhand
44. Jharkhand Action Plan on Climate Change (JAPCC) has been prepared with a vision of ‘achieving economic growth -poverty alleviation objectives and enhancing livelihood opportunities while ensuring environmental sustainability’ (JAPCC, 2014). Keeping in view the SAPCC principles and state specific requirements, the JAPCC focused on experience of sector experts for developing the sector-approach by utilizing primary and secondary information available in public and state domain. The action plan is finalized by aligning the plan with state adaptive capabilities to strengthen the state response towards climate change.
45. The process of preparation of the JAPCC began in May 2011 with the formation of State Steering
Committee and State Advisory Group for the SAPCC. The action plan development process included development of sectoral papers, identifying issues and constraints and developed climate change responses specific to each of the sectors. The responses included both mitigation and adaptation measures. The climate change action plan was shared with department heads and also made available for wider public comments. The process of preparation of the plan was highly consultative with regular workshops to engage with industry experts, state departments, research and academia, financial institutions etc.
46. To arrive at impacts of climate change on state sectors, the results as reported in the plan are based
on multiple simulations carried out by reputed national and international research institutions that were analysed to quantify the impact of climate change. All the major climate change projects predict increase of rainfall in the state; under A1B scenario it is projected that by the end of this century the number of rainy days will go up by at least 10 days, similarly B2 scenario predicts that the average rainfall in the state will rise by ~20% (JAPCC, 2014).
47. Climate change will have repercussions on the performance of industrial processes and power
generation in the state. The water woes will reduce the output of the power plants. The hydro power plants will suffer as lesser water will be available, whereas the thermal power plants will require larger amount of coolants (water in this case) to maintain production levels (temperature rise reduces performance of machines that run on the principles of heat exchange). Similarly, industrial demand for water and power will rise to maintain their productivity levels. Since the demand for these critical services (water and power) will go up across sectors, hence the direct procurement cost of such services will rise, reducing the financial self-sufficiency of the industries.
48. In terms of emissions profile of the state, the JAPCC estimates a total of 106.53 Mt of CO2e in 2011.
Large and small industries emit 15.46 Mt of CO2e emissions; mining 22.07 Mt CO2e, power 44 Mt CO2e and urban sector nearly 25 Mt CO2e (JAPCC, 2014).
State’s Strategies & Focus: 49. The JAPCC focusses on eight sectors for the adaption and mitigation measures, for which it
proposed sectoral action plans. The sectors include: agriculture, forestry, health, industrial, mining, power, urban & transport sector and water sector.
50. In the agricultural sector JAPCC focuses on the Research & Development to map and ascertain the
impact of climate change on the agriculture sector. Establishing dedicated research for the research is proposed in the action plan. Through the help of R&D, Jharkhand state is focussing to implement the various methods to make agriculture sector climate resilient.
51. The sectoral plan for the forestry sector focuses on preparing climate change resilient forest
management plan. R& D efforts for identifying impact of the climate change on the Jharkhand’s forest cover are also one of the main focus strategies. Rural energy management through various

Page 23
programs to promote energy efficient cooking stoves and promoting cleaned energy options in the state of Jharkhand.
52. Health sectoral plan is focused on the development of the state monitoring and warning system and preparing the quick response team for any outbreak or health disasters. Focus of the R&D, creation of the institutional mechanism and capacity building for the Jharkhand Health sector is identified as key missions for this sector.
53. Industrial sectoral plan is primarily focused on the GHG emission inventory, Infrastructure planning and development, introduction of the renewable energy options, integrating and promotion of industrial energy efficiency in the sector.
54. Mining is a key activity for the state, thereby, the sectoral plan focusses on promoting sustainable and resource efficient mining practices that will help state to create better framework for its fight against climate change. Activities such as GHG emissions inventory, green growth planning, sustainable infrastructure planning and development, efficient usage of water and other natural resources, and promotion of sustainable mining practices to reduce pollution and water contamination are identified in the State Action Plan on Climate Change.
55. Urban & Transport sectoral plan identifies urban water use management, rainwater management, introduction of sustainable transport practices to reduce carbon footprint, solid waste management, promotion of sustainable urban habitats and waste water management.
56. Water sectoral plan strategically focusses on creation of Water Resource Regulatory authority and development of policy for drought management. Also, other key focused areas under JAPCC are groundwater management to avoid over exploitation, water management in mining areas, water use efficiency in the industrial sector, improving water use efficiency in rural/urban areas, payment for the ecosystem services option as conservation pool.
57. Energy sector is the most important sectors for any climate change mitigation strategy, Jharkhand has elaborated key strategies and focus areas for the sector in their action plan. JAPCC has identified key nine strategies with proposed activities to achieve the objectives.
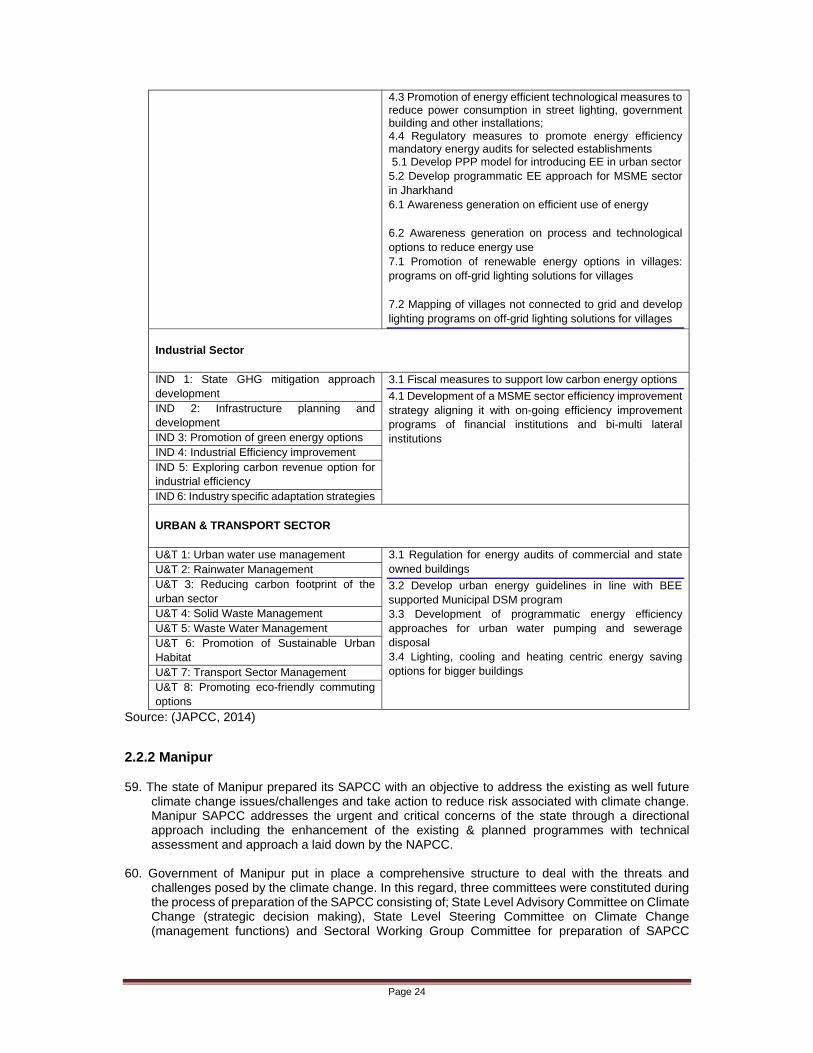
58. Focussing on RE and EE as key strategies for combating climate change in the state, JAPCC has proposed RE and EE measures across sectors in the plan. Table 5, highlights the RE & EE strategies and associated activities as proposed across sectors in the JAPCC.
Table 5: RE & EE strategies in the Jharkhand Action Plan on Climate Change
Strategies Activities (Proposed)
POWER SECTOR
PW1: Defining Low emission path for the power sector
1.1 Renewable energy (RE) & energy efficiency (EE) plan of the Jharkhand state 2.1 Assessment of financial and technical viability to improve efficiency of power plant; 2.2 Designing fiscal incentive to promote EE in the power utilities 3.1 Develop a state policy to promote small scale power generation facilities 3.2 Dedicated centre to extend technical support to small scale decentralized power generation units 4.2 Subsidy mechanism to promote adoption of Energy Efficiency options in urban sector/SME sector;
PW2: Enhancing efficiency in electricity generation PW3: Promotion of the distributed power generation facilities PW4: Demand side management for improving energy use efficiency PW5: Energy Efficiency approaches PW6: Awareness generation PW7: Harnessing RE potential in the state PW8: Institution Mechanism PW9: T& D loss reduction
Page 24
4.3 Promotion of energy efficient technological measures to reduce power consumption in street lighting, government building and other installations; 4.4 Regulatory measures to promote energy efficiency mandatory energy audits for selected establishments 5.1 Develop PPP model for introducing EE in urban sector 5.2 Develop programmatic EE approach for MSME sector in Jharkhand 6.1 Awareness generation on efficient use of energy 6.2 Awareness generation on process and technological options to reduce energy use 7.1 Promotion of renewable energy options in villages: programs on off-grid lighting solutions for villages 7.2 Mapping of villages not connected to grid and develop lighting programs on off-grid lighting solutions for villages
Industrial Sector IND 1: State GHG mitigation approach development
3.1 Fiscal measures to support low carbon energy options
4.1 Development of a MSME sector efficiency improvement strategy aligning it with on-going efficiency improvement programs of financial institutions and bi-multi lateral institutions
IND 2: Infrastructure planning and development IND 3: Promotion of green energy options IND 4: Industrial Efficiency improvement IND 5: Exploring carbon revenue option for industrial efficiency IND 6: Industry specific adaptation strategies URBAN & TRANSPORT SECTOR U&T 1: Urban water use management 3.1 Regulation for energy audits of commercial and state
owned buildings
3.2 Develop urban energy guidelines in line with BEE supported Municipal DSM program 3.3 Development of programmatic energy efficiency approaches for urban water pumping and sewerage disposal 3.4 Lighting, cooling and heating centric energy saving options for bigger buildings
U&T 2: Rainwater Management U&T 3: Reducing carbon footprint of the urban sector U&T 4: Solid Waste Management U&T 5: Waste Water Management U&T 6: Promotion of Sustainable Urban Habitat U&T 7: Transport Sector Management U&T 8: Promoting eco-friendly commuting options
Source: (JAPCC, 2014)
2.2.2 Manipur
59. The state of Manipur prepared its SAPCC with an objective to address the existing as well future climate change issues/challenges and take action to reduce risk associated with climate change. Manipur SAPCC addresses the urgent and critical concerns of the state through a directional approach including the enhancement of the existing & planned programmes with technical assessment and approach a laid down by the NAPCC.
60. Government of Manipur put in place a comprehensive structure to deal with the threats and
challenges posed by the climate change. In this regard, three committees were constituted during the process of preparation of the SAPCC consisting of; State Level Advisory Committee on Climate Change (strategic decision making), State Level Steering Committee on Climate Change (management functions) and Sectoral Working Group Committee for preparation of SAPCC

Page 25
(drafting of the plan). The Directorate of Environment, Manipur is the state nodal agency for the overall coordination of the activities to undertake the preparation of the SAPCC.
61. Manipur SAPCC is divided into four modules consisting of vulnerability assessment, identification
of options, prioritization of options and implementation and financing options. SAPCC brings forth the current climate and projected changes in future and its associated impacts on various vulnerable sectors, presented in Table 6.
Table 6: Projected Climate Changes and Impacts in Manipur
Climate Variables Current Climate Future Projected Climate
Precipitation Average annual rainfall varies from 935 to 2,636 mm
Extreme precipitation events increasing in the last 10 years
Unpredictable monsoon onset Frequent breaks in monsoon
rainfall
Rainfall is projected to increase by 20%
Extreme precipitation events are project to increase in frequency and intensity
Temperatures Average annual temperatures varied 12.2 to 15.8 °C
Extreme temperature events increasing in the last 10 years especially heat waves
Projected an increase in temperature above 1.70C
Vulnerable Sectors and Probable Impacts Agriculture Crop yields are projected to decrease by 10%
High inter-annual variability in crop yields are projected due to increased frequency of extreme precipitation events
Incidence of pest and diseases will increase Increased soil erosion with degradation of soil nutrients and
exposing roots Water Resources Increased river flow, with potential damage to river bunds
In a dry situation drying up of rivers Increased evaporation, runoff and decreased soil moisture
recharge Water pollution, siltation and scarcity of fresh drinking water
Forestry Loss of bio-diversity Invasive species Extension of rare/threaten flora and fauna Increased infestation of insects and pests Increased frequency of forest fires
Health Increased vector borne diseases Frequent illness from common cold and cough due to sudden
varying weather Favorable conditions for propagation of mosquitos and other
vectors Livelihoods Decreased income from poor crop production
Lower employment rate Food security and nutritional issues Migration of population from rural areas to urban Land use and change pattern
Energy Decreasing forest cover reduces the availability of fuel wood Impact on power generation (hydro- power) due to vulnerability of
water resources in changing climate Increased prices of fuel wood leading to rapid degradation of forest
cover Ecosystem Upward movement of plant species with rise in surface
temperatures Decreased microbial population with increasing altitudes Loss of vegetation poses potential threat for soil erosion
Source: MAPCC, 2014

Page 26
State Strategies and Focus: 62. MAPCC focusses on understanding the climate change, adaptation practices, mitigation of climate
variability and natural resource conservation through eight missions, which include: (1) State Mission for Ecosystem, Biodiversity and Livelihood Sustainability, (2) State Mission for Water Resources, (3) State Mission for Sustainable Agriculture Practices, (4) State Mission for Health, (5) State Mission for Forests Resources Conservation, (6) State Mission for Enhanced Energy efficiency & Conservation, (7) State Mission for Urban Planning and 8) State Mission for Climate Change Strategic Knowledge and Information.
63. State Mission for Ecosystem, Biodiversity & Livelihood Sustainability (Forest Sector) monitors key
impact by looking at the loss rates of forest, biomass, flora & fauna in the state due to adverse role of climate change in the forestry sector. Key strategies in this mission are Reforestation/afforestation program across the state, forest conservation program, capacity building in the forest fringe area for the better resource management and involvement of the local community in management.
64. The State Mission for Water Resources (Water Sector) focuses on the flood forecasting program,
water use efficiency program, water harvesting structures investment program, improvement of drainage program, better management and conservation of the wetlands in the state. This mission monitors key impacts like frequency of rainfall and water level in the river, usage pattern of the different water resources in the state.
65. The State Mission for the Sustainable Agricultural Practices (Agriculture Sector) is one of the key
mission and the key focus and programs for the mission are micro irrigation and farm pond development, perennial plantation program to promote sustainable agricultural practices in the state.
66. The State Mission for Health (Health Sector) under SAPCC strategizes several programs to monitor
and deal with the vector borne and water borne disease. This programs monitors the incidence of vector and water borne diseases in the state and works with SAPCC to make states more resilient.
67. State Mission for Urban Planning and Sustainable Habitat (Urban & Transport Sector) focuses on the rapid urbanization of the city of Imphal and impact due to the climate change. Under the SAPCC this mission focuses on the sustainable bulk transport program, biofuels programs, green belt development and GHG emission check-up programs. Urban sector programs focuses on the water use efficiency, solid waste management program, water supply connection program, Energy Efficient Street lighting program and promotion of EE in the building sector in the state.
68. State Mission for Enhanced Energy Efficiency & Conservation is the key mission, which directly
helps in mitigating the GHG emissions from the various sources and polluters. This mission focuses on the promotion of the various RE sources and helping state government to have sustainable energy mix. Key programs are wind and solar programs, Biogas promotion program, Capacity building of the office bearers and electricity department, T&D evaluation and improvement program, and various energy efficiency and demand side management programs to promote cleaner energy options in the state. Key Renewable Energy & Energy Efficiency programs across the sectors in the SAPCC are illustrated in the Table 7 below.
Table 7: Key RE & EE programs in all the sectors in MAPCC
Strategies State Mission on Enhanced Energy Efficiency and Conservation
Installation of stand-alone type of SPV power plant, wind solar hybrid systems, solar street & home lighting systems, home solar water heaters, solar street lights, solar water heating systems etc. Installation of grid connected rooftop / demonstration solar power plants (5 – 10 MW) at possible places Installation of solar power packs/inverter (10,000 units) and high intensity solar LED street light (10,000 units) Installation of 50,000 square metre of solar water heating systems Development and propagation of non-conventional renewable energy generation system, micro / small hydel power projects (2 x 5 MW) viz. Lokchao, Irang, etc.

Page 27
Energy audit of all government buildings Providing electricity access under Bharat Nirman, RGGVVY Preparation of state energy policy Awareness for conservation of energy through adaptation of newly introduced CFL, LED, star labelled appliances for TFL, AC, refrigerator, transformer etc. Trainings, advance communication system, relay & testing laboratory, works related to Energy Conservation; State Mission for Sustainable Agricultural PracticesDevelopment of canals / irrigation system in agriculture lands for multiple cropping throughout the year by introducing solar pumping system irrigation State Mission for Urban Planning & Sustainable Habitat Encourage construction of Green Building through LEED certification (Leadership in Energy and Environmental Design) in the line of Indian Green Building Rating System for Construction State Mission on Climate Change Strategic Knowledge & Information
Augmentation of the existing state climate change knowledge network system and state wide institutional support on climate sensitive activities under energy sector, Capacity Building to the stakeholders of energy sector, etc. Performance monitoring and evaluation of on-going & upcoming activities under energy sector for feasibility assessment linkages with climate change sensitive and SAPCC-Manipur, as well as NAPCC.
Source: (MSAPCC, 2013)
2.2.3 Renewable Energy and Energy Efficiency and Baseline Analysis for Jharkhand
69. Renewable Energy (RE) and Energy Efficiency (EE) have been identified as the key climate change mitigation strategies by the Government of Jharkhand in its SAPCC.
Current Baseline for Energy Efficiency & DSM Potential: 70. Total Installed capacity in Jharkhand (by Central-339.81 MW, Private-916 MW and State 1,324.05
MW, utilities) is given in Figure 7. The state’s per capita power consumption in the state is 552 kWh per year; this is very low in comparison to national average of 720 kWh per year in 2011. Power consumption by high tension (HT) consumers is about 46.65% of the total consumption, whereas agriculture consumption is about 1.20%. Although power demand of the state is low, still the state faces power deficit situation. The demand supply gap has been widening every year. The current deficit of power is to the extent of 200-400 MW. Clearly, the state is struggling to meet the electricity demand in the state. The major cause of power deficit in the state is transmission and distribution (T&D) losses. To meet the power deficit, the State would require over 2,400 MW of new capacity with an investment requirement of over INR 12,000 crores (JAPCC, 2014).
Source: CEA, 2015
Figure 7: Power Generation Capacity of Jharkhand state
2579.862358.88
200.9320.05
0
500
1000
1500
2000
2500
3000
Total PowerGeneration
Capacity
Thermal Hydro RES
Power Generation Installed Capacity (MW) in Jharkhand

Page 28
71. State Government in its Energy Policy 2012, JSERC (Demand Side Management Regulation), 2010 and SPACC have placed increased focus on promotion of energy efficiency. JSERC has notified regulation of the DSM in 2010; salient features of the regulation include the following:
It mandates the distribution utility to assess potential areas of the DSM. Distribution utilities
shall constitute DSM cell to carry-out related activities. The licensee shall develop and submit the DSM plan to commission. The licensee shall submit the programme document to the regulator for approval. The utility may propose the methodology for recovery of net incremental costs through tariff or any other mechanism. The utility shall monitor the initiatives based on the guidance provided by the regulator. (Jharkhand State Electricity Regulatory Commission, 2010, 2010)
It empowers the regulator to set DSM targets and issue guidelines on the DSM process. The commission shall approve the DSM plan developed by utilities. The commission may undertake third party evaluation measurement and verification of the DSM programme. The commission may provide incentives to distribution licensees for achieving or exceeding the set objectives. (Jharkhand State Electricity Regulatory Commission, 2010, 2010)
72. Jharkhand Energy Policy 2012 also laid special stress on the role of the DSM and energy
efficiency in the state and few key initiatives identified are:
As per guidelines of Bureau of Energy Efficiency, MoP, Government of India energy audit will be made compulsory for all major industrial and large commercial establishments.
Government of Jharkhand would initiate measures to improve efficiency of agricultural pump sets and all electrical installations.
Through suitable directives and fiscal incentives/disincentives, Government of Jharkhand will actively promote use of energy efficient equipment’s and launch of Bachat Lamp Yojna.
A communication campaign would be launched for consumer guidance and education programme for spreading mass awareness about energy conservation measures.
Energy efficient buildings would be encouraged (Department of Energy, 2012) Current RE Baseline: 73. Installed renewable energy is nearly 16 MW (MNRE, 2014)27of solar power, about 1.2 MW of
biomass power and 200.93 MW of installed hydropower generation capacity. This creates opportunity for Government of Jharkhand to increase the share of RE in their energy mix and help SAPCC to achieve their objectives. The Jharkhand Renewable Energy Development Agency (JREDA) was established to promote the use of renewable energy sources. Being a nodal agency, JREDA is working for implementation of fiscal and financial incentives made available by the MNRE and IREDA. JREDA also took initiative to promote off grid RE in the state. Under the Remote electrification program 698 villages of different districts of Jharkhand have been electrified through 66,355 nos. of Solar Home Lighting System and 5,380 nos. of Solar Street Lighting System Systems under the RVE programme. Also, under various programmes (i.e. Solar Photovoltaic Programme & Solar Thermal Programme) 327,180 nos. of Solar Lanterns, 10,016 nos. of Solar Home Lighting System and 15,998 nos. of Solar Street Lighting System Systems, 1,011,066 LPD Solar Hot Water Systems have been installed in the different locations across the State of Jharkhand till date (JREDA, 2014). JREDA also installed several off grid solar power plants at various locations in the state to increase the penetration of the technology and also demonstrate its feasibility in the state energy mix. List of these solar power plants is given below:
16 kWp SPV Power Plant at Nurda, Jhinkpani, West Singhbhum; 100 kWp SPV Plant at Jarri, Gumla; 100 kWp SPV Plant at Baba Baidyanath Temple, Deoghar; 2x50 kWp SPV Plant at Jasidih, Deoghar; 50 kWp SPV Plant at Baba Basukinath Temple, Dumka;
27 http://mnre.gov.in/file-manager/UserFiles/State-wise-Installed-Capacity-of-Solar-PV-Projects-under-various-Scheme.pdf.

Page 29
30.9 kWp SPV Plant at Rajbhawan, Ranchi; 20 kWp SPV Plant at Jhargaon, Chainpur, Gumla; 45 kWp SPV Plant at Tiger Project, Dalonganj (Palamu); 25 x 2.5 kWp & 50 x 5.0 kWp (312.5 kWp) SPV Plant at 75 Police Stations / Pickets of the
State. (JREDA, 2014).
Current Policy Scenarios: Jharkhand Energy Policy, 2012 74. In 2012, Government of Jharkhand looking at the current short fall in the energy sector and
foreseeing the future demand, drafted the Jharkhand Energy Policy, 2012 (Department of Energy, 2012). The policy lays special focus on promoting RE in the state. RE options that are identified in the Energy Policy, 2012 and also integrated in the SAPCC are:
Biomass projects by utilizing agriculture residues and animal waste; Mini, Micro and Small Hydropower projects (up to 25 MW). (Department of Energy, 2012); Solar energy based power projects; Government intends to create a Land Bank for setting up Solar Power Generation Projects at
suitable locations; Energy power projects based on municipal sewage, solid waste and Industrial Waste
(Department of Energy, 2012).
Draft State Solar Power Policy, 2013 75. National Institute of Solar Energy in its Nation-wide study for the solar energy potential,
estimated 18.8 GWp (NISE, 2014), energy potential in the state of the Jharkhand. To achieve this potential and in the line with the NAPCC’s National Solar Mission, Jharkhand drafted its State’s Solar Power Policy, 2013 with a vision to ensure significant contribution of solar energy in the energy mix in Jharkhand and promotion and motivation of public sector involvement and public-private partnership towards the end. Objective of the State Solar Policy is to encourage participation of Private Sector to set up Solar Power based projects in the State & increase solar generation to 500 MW by 2017 and 1,000 MW by 2022 in a phased manner and to define the incentives and benefits to be provided to the participants from the Private Sector in grid and off-grid solar applications in clear terms. Various programs and policies are introduced in the draft policy for Grid Connected Solar Power, Roof Top Solar Power Plant and Off Grid Solar Power Applications in the state.
Legal & Regulatory Framework of the Policy:
76. Key features of the Draft Policy’s Legal & regulatory framework are:
A tariff incentive for consumer for opting for solar generation shall be offered with respect to non-solar consumption subject to prefixed level of usage.
Incentive scheme for conversion of existing inverter to solar based ones. Introduction of mandatory Solar Procurement Obligation to purchase @ minimum 4% power of
their annual consumption for HT/ commercial/ Industrial/ Group Housing Projects consumers. Introduction of mandatory solar power procurement by the Telecom Towers. Mandatory installation of Solar Water Heating System in all industrial buildings / Govt. and
Private Hospitals and Nursing Homes/ Hotels/ Canteens/ Hostels/ Barracks and Residential buildings with an area of 3000 ft2 or more.
Incentive for people’s representative/ panchayat for promoting solar pumps/ light installation. (Department if Energy, 2013)
77. Incentives proposed in the Draft policy are:
Eligible for exemption of electricity duty.
Page 30
Grant as up to 4% of wheeling charges by Govt. Facility of 100% energy banking in every financial year on payment of 2% banking charges to
Discoms. Govt. to provide transmission facility up to 10 km. length to the developers of category-1 & 4
projects. The Industrial Consumers may have option of contract demand reduction without penal
charges. The Solar power projects to be terms as industry and will be eligible for benefits under Industry
Policy 2012. The equipment purchased will be entitled for VAT incentives as under Industry Policy 2012. Stamp duty exemption on purchase of private land as per Industry Policy 2012 (Department if
Energy, 2013)
78. Simultaneously under the RPOs, Jharkhand Electricity Regulatory Commission (JERC) set the targets and every distribution licensee, captive users and open access consumer had to meet the renewable purchase obligations as mentioned by the commission.
Table 8: Jharkhand RPOs Targets
Fixed RPOs28 Year Solar Non-Solar Total 2014-15 1.00% 3.00% 4.00% 2015-16 1.00% 3.00% 4.00%
Source: (CII, 2014)
2.2.4 Renewable Energy and Energy Efficiency and Baseline Analysis for Manipur
79. The State-owned generation in Manipur is only a fraction of a megawatt, a Micro Hydel Plant having capacity of 600 kW, which is in operation. A heavy fuel based Power Plant 36 MW (6 x 6 MW) is kept ready for operation in case of extreme emergency/crisis as its cost of generation is exorbitantly high. Besides, there are 5 diesel power houses (about 2.5 MW in total) kept standby for operation at VIP/strategic areas for any outage of power or failure of grid supply at any time. This makes Manipur heavily dependent on the outside support for its electricity requirement. The figure 10 shows the gap in demand and supply. Effective design and implementation of EE and RE projects in the state can help in reducing the gap between demand and supply.
28

Page 31
Source: Government of Manipur, 2012 and CEA 2007
Figure 8: Demand & Availability of Power in Manipur 80. As per CEA Executive Report January 2015, total installed power capacity in Manipur is 199.82
MW: Diesel-45.41 MW, Gas- 67.98 MW, Hydro-80.98 MW and RES-5.45 MW (Central-148.9 MW, Private- Nil and State 50.86 MW). The State has predominantly one source i.e. Central Sector allocation (mixture of hydro & thermal) of 142.8 MW and 10.5 MW of power from shared projects in Tripura. Total allocated share for the Manipur state is approximately 153.30 MW. Present (2014-15) peak demand of the state is 262 MW and this deficit poses lot of development challenges in the state. To tackle this situation Manipur Government formulated State Policy on Renewable Energy Source, 2006 to promote RE in the state. A comprehensive State Policy was prepared to provide a policy framework for promotion of energy generation under the Renewable Energy Sources (RES) to supplement energy under the power and electricity Department.
81. Augmentation of generation of Power especially village energy security for remote and inaccessible
villages will be actively pursued and promoted through the following energy sources:-
Generation of power through Pico, Micro, Mini and Small Hydro Power Projects up to 25 MW. Generation of power through Solar, Wind and Biomass energy. Various incentives for promotion of private investment have been provided.
82. Current RE installation capacity of the state is 5.45 MW from small hydro RE sources. State in
SAPCC has put lot of focus on the RE capacity and potential in the state. Under its different programs Manipur Government and its MANIREDA (Manipur Renewable Energy Development Agency) is promoting and installing RE (off grid) stand-alone Solar Power plants at the different government & public sector buildings in Manipur.
Current Policy Scenario in Manipur:
State Hydro Power Policy, 2012
83. The Government of Manipur is eager to harness the hydro potential of 2,190 MW (assessed at 60% Load Factor by the Departments the total realizable potential is 1,350 MW) (MSAPCC, 2014). For this State Hydro Power Policy, 2012 was drafted which covers all the Hydro Projects above 5 MW capacity in the state. Currently six hydro power projects of capacity 516 MW have been identified and at various stages of design & execution. (Planning Commission, 2013)
0
50
100
150
200
250
300
2006-07
2007-08
2008-09
2009-10
2010-11
2011-12
2012-13
2013-14
2014-15
2015-16
2016-17
MW
Peak Demand Availability
Linear (Peak Demand ) Linear (Availability )

Page 32
Manipur Grid Interactive Rooftop Solar Photo Voltaic (SPV) Power Policy, 2014 84. Government of Manipur and MANIREDA formulated “Manipur grid interactive rooftop solar photo
voltaic power policy,2014” with an objective to lay a framework for harnessing the ubiquitous Solar energy in the State by utilizing the empty rooftops of the buildings in the State.
Table 9: Summary of the Grid Interactive Rooftop Solar Photovoltaic Power Policy, 2014
General Description
Keeping the above in view, grid interactive rooftop solar plants will be supported under this scheme. The generated power from such SPV system/project will be utilized fully for powering captive loads during the day time and excess power will be fed into the Grid as long as Grid is available. In case solar power generation is not sufficient due to cloud cover etc., the captive loads will be served by drawing power from the Grid. The connectivity of such projects will be either at 33 KV/11 KV three phase lines or of 440/220 volt three/single phase line depending on the system installed. Ideally, grid interactive systems do not require battery back-up as Grid acts as the backup for feeding excess solar power and vice-versa. However, to enhance the performance reliability of the overall system, a minimum battery back-up of one hour of load capacity is recommended. In Grid interactive systems, it has, however to be ensured that in case the Grid fails, the solar power has to be fully utilized and feeding to the grid (if any in excess) be stopped immediately so as to safe-guard any grid person/technician from getting shock (electrocuted) while working on the grid for maintenance etc.
Tariff The feed in tariff for the power generated from the Solar Power Plant will be decided by JERC in such a manner that it provides safeguard to all stakeholders including DISCOMs. The availability of electricity Grid near the solar installation is an essential component which needs to be provided by the concerned agencies i.e. MSPDCL or MSPCL, as the case maybe.
Metering System
Net metering facility will be implemented for the consumers of MSPDCL who intend to encourage solar green energy and set up solar PV plants at available places on roof-tops. Individual households, industries, offices, commercial establishments, institutions, residential complexes etc. will be eligible for project capacity of minimum 1 kW up to a maximum of 500 kW with/ without battery back-up support. Consumers will generate solar power for self-consumption and can feed excess power into the grid through a bi-directional export/import meter. Alternatively, two meters can also be installed to measure the export and import of power separately. All the equipment to be installed like solar PV panels, inverters, synchronizer, MPPT, batteries, transformers, cables, junction boxes etc. shall be as per specified Indian/IEC standards.
Capacity The electricity generated by the rooftop solar system of an eligible consumer shall not be more than 80% of the electricity consumption by the eligible consumer at the end of the settlement period.
Eligibility & Targets
The policy aims to utilize the existing roof space of buildings for the roof-top SPV systems to replace DG gensets installed for minimum load requirement for operation during load shedding. It also aims to harness the available potential for generating solar power using unutilized space, along with promotion of green and clean power to reduce the dependence on conventional source of energy.
All the individuals, residential/commercial/Institutional/Govt. /Semi-Govt. building owners, Industrial units are eligible to set up Rooftop Solar Power Plant within the prescribed capacity limit. Eligible project capacity limit under the scheme will be from 1 kW up to 500 kW. The total capacity of 5 MW is targeted to be covered during 12th Plan (2012-2017) period for which a formal proposal was already been submitted to the MNRE, GoI. Actual target will be subject to allocated target by the Ministry.
Source: (MANIREDA, 2014) 85. Manipur has also participated in the RPOs to promote RE in the state. State in their SAPCC have
focused on the de centralized and off grid renewable energy sources to boost the penetration of RE in the state. A Solar radiation resource assessment station has also been installed in the State of Manipur by Government of India to assess the solar radiation availability in the region.

Page 33
Energy Efficiency
86. Manipur has implemented limited number of energy efficiency projects so far. The Manipur State Development Agency (MSDA) is the Nodal Agency for the implementation of energy efficiency programs in the state. There is a big gap between the supply and the demand of electricity in the state.
88. Joint Regulatory Electricity Commission Mizoram & Manipur drafted Demand Side Regulation, 2012. It mandates the distribution utility to assess potential areas of the DSM. Distribution utilities shall constitute DSM cell to carry-out related activities. The licensee shall develop and submit the DSM plan to commission. The licensee shall submit the programme document to the regulator for approval. The utility may propose the methodology for recovery of net incremental costs through tariff or any other mechanism. The utility shall monitor the initiatives based on the guidance provided by the regulator.
89. Also, in the SAPCC, Manipur government has prioritized various programs and strategies to create
awareness through communication/outreach programs and also promote more energy efficient appliances for energy conservation measures in the state.
90. MSDA is responsible to coordinate, regulate and enforce the Energy Conservation Act, 2001. The
role of MSDA is to create general awareness among masses benefits of Energy Conservation measures and also to institutionalize the energy efficiency project implementation in industry and domestic/residential sectors including Government buildings and commercial buildings with its broad objective. The key activities implemented by MSDA are:
Notified the Municipal Council of Imphal to include the Bureau of Energy Efficiency (BEE)
guidelines on Energy Conservation Building Codes (ECBC), promotion and use of Compact Fluorescent Lamps (CFL) and energy efficient appliances in the bylaws;
Working with Educational Institutions to help them in including Energy Conservation and efficient use of energy in school curriculums;
Organize National Energy Conservation Day every year on 14th December; Preparation of Action Plan for Energy Efficiency; Publication of calendar on Energy Saving Tips from MSDA; Publication of booklets and posters, highlighting the various provisions of EC Act 2001 and
Consumer's guides on efficient use of energy; Installation of hoardings on Awareness of efficient use of energy at various places in
Imphal; Requested BEE for implementation of Demo Project on Energy Conservation in
Government buildings and street lighting in Imphal city.
2.3 Problem Statement & Project Justification Statement for Implementation of EE & RE Investment Projects in the States of Jharkhand & Manipur
Jharkhand 91. The state of Jharkhand realizes the importance of energy for industrialization and also for providing
a better quality of life to its people. It is laying lot of emphasis on setting up policies and procedures to encourage setting up of conventional and renewable power generating units, so as to achieve uninterrupted power supply in the entire state, while also meeting its environmental objectives. In addition, continuous development of the state both industrially and commercially has resulted in continuously increasing demand for power and a per capita demand of 500 kWh is estimated within 5 years.
92. In view of this, the state is in the process of developing ambitious plans to accelerate the urban and
rural electrification. An urgent need exists to augment installed capacity from the existing level of 1,320 MW. A major issue with the state electricity distribution utility has been their failure to provide quality power with non-fluctuating voltage and frequency. The state has not yet developed any concrete plan for the design and implementation of energy efficiency measures in sectors like

Page 34
buildings, domestic, industry, municipal and agriculture. To improve the supply of electricity, there is a need for the implementation of demand side management programs.
93. The state has to go a long way to develop non-conventional sources of energy using clean
technology through private participation. The State proposes to promote increasing use of renewable and environmental friendly sources of energy. The state can achieve the capacity addition goals to get over the power supply deficit issues in coming years’ time. The renewable energy sources like grid connected solar and wind, roof-top solar, biomass and micro hydro will also contribute to the generation of power and meet the state requirements for achieving RPO targets. But in the process of focussing only on bridging the demand and supply gap, the state may lose the opportunity to plan and implement energy efficiency and the renewable energy projects with the active participation of stakeholders like financing institutions, private sector, vendors, technology providers, Energy Service Companies and research institutions. The state has prepared the SAPCC. There is a need for the integration of SAPCC in to the on-going state level energy sector activities to promote the implementation of renewable energy and energy efficiency programs using innovative approaches. The project on ‘Market Transformation and Removal of Barriers for Effective Implementation of the State-Level Climate Change Action Plans’ intends to focus on promoting the investment in renewable energy and energy efficiency technologies through effective implementation of SAPCC. The framework for program design and implementation developed under the project and the cost share committed by both public and private sector institutions are expected to remove barriers to the effective implementation of the State-Level Climate Change Action Plans, among which are investment barriers, and to transform the market for the uptake of energy efficiency and renewable energy technologies and achieve the targets for GHG emission reductions in the state.
Manipur 94. The state of Manipur depends almost 99% on Central Sector Generating Stations (CSGS) to meet
its power needs. It has high-energy deficit (37 MW net availability of power from CSGS against peak demand of 180 MW) and large energy access issues. Thus diversification of its energy mix through independently produced renewable energy and energy savings through energy efficiency measures is crucial for the state.
95. The Manipur Renewable Development Agency (MANIREDA) is the Nodal Agency for MNRE and
also the Designated Agency for Bureau of Energy Efficiency (BEE). The MANIREDA is working towards the development of renewable energy but the activities for the design and implementation of energy efficiency programs are limited. The greatest achievement in the state is the installation of pre-paid meters in some key market places. Pre-paid meters have saved good amount of electricity in supply to commercial consumers. There is a need to plan for state level demand side management programs for street lighting, municipal water pumping, building energy efficiency and energy efficiency in industries and agriculture sector. The decreasing availability of rainfall and surface water sources, the energy consumption in water pumping in agriculture sector is bound to increase. Thus this is the best time to introduce solar powered pumps. Manipur being the hilly state, the cost for implementation of renewable energy and energy efficiency measures is higher in comparison to other states. The state therefore, needs carefully designed innovative financing mechanisms to encourage the public and private sector to implement clean energy projects.
96. In addition, there is a need to plan and implement energy efficiency and the renewable energy
projects with the active participation of stakeholders like financing institutions, private sector, vendors, technology providers, Energy Service Companies and research institutions. The state has prepared the State Action Plan for Climate Change (SAPCC). There is a need for the integration of SAPCC in to the on-going state level energy sector activities to promote the implementation of renewable energy and energy efficiency programs using innovative approaches. The project on ‘Market Transformation and Removal of Barriers for Effective Implementation of the State-Level Climate Change Action Plans’ intends to focus on promoting the investment in renewable energy and energy efficiency technologies through effective implementation of SAPCC. The framework for program design and implementation developed under the project and the cost share committed by both public and private sector institutions are expected to remove barriers to the effective implementation of the State-Level Climate Change Action Plans, among which are the investment

Page 35
barriers, and to transform the market for the uptake of energy efficiency and renewable energy technologies and achieve the targets for GHG emission reductions in the state.
2.4 Prioritized RE and EE Measures for Climate Change Mitigation in Jharkhand & Manipur States
97. Through various stakeholder consultations at the state level (workshops, one to one meetings and field visits), the most promising RE and EE focussed mitigation strategies from Jharkhand and Manipur SAPCC have been identified. During these consultations all RE and EE focussed mitigation strategies (highlighted in the previous section), were discussed in detail, out of which the most relevant strategies were shortlisted for further analysis. These shortlisted strategies have been identified by the state stakeholders based on the current gaps in the mitigation actions in the states, availability of financing, need to showcase technologies which otherwise may not be implemented in a business as usual scenario, the GHG abatement potential and those which can be implemented in the next 4-5 years of project duration.
98. A detailed Marginal Abatement Cost Curves (MACC) of all the short listed and possible mitigations actions has been conducted during the PPG Phase to strengthen the justification of the final list of mitigations measures for both Jharkhand and Manipur states. The MACCs were developed to identify and compare the potential of energy savings, cost of implementation and potential CO2 emission reduction in the sectors like power, steel, solar, wind, EE municipal pumping, EE buildings, EE public lighting, EE agriculture pumping and EE in domestic sector. The results of state level analysis of mitigation actions are presented in the sections below for both Jharkhand and Manipur states.
2.4.1 Jharkhand
99. In the state of Jharkhand, state level stakeholders have identified four key areas for the selection and implementation of EE and RE strategies, these include:
J1. Promotion of the distributed power generation J2. Demand side management for improving energy use efficiency J3. Developing energy efficiency approaches J4. Reducing carbon footprint of the urban sector
100. Against these EE and RE strategies, the state on its own has planned for the implementation of
the following activities under JAPCC: 1.1 Develop a state policy to promote small scale power generation facilities 1.2 Dedicated centre to extend technical support to small scale decentralized power
generation units 2.1 Promotion of energy efficient technological measures to reduce power consumption in
street lighting, government building and other installations 2.2 Regulatory measures to promote energy efficiency mandatory energy audits for selected
establishments 3.1 Develop PPP model for introducing EE in urban sector 4.1 Development of programmatic energy efficiency approaches for urban water pumping and
sewerage disposal 101. The Table 10 present the energy saving/distributed generation and GHG emission reduction
potential along with the cost for implementation of mitigation actions for Jharkhand state. The Figure 9 presents the MACC for Jharkhand state, which is showing very high potential of energy savings in steel sector followed by domestic, power, EE public lighting, EE water pumping, and EE agriculture pumping sector in descending order. On RE side, the solar has the highest potential of electricity generation followed by wind. .
102. The MACC analysis has not included the curve for steel sector as it was overshadowing the MACCs for other sector due to very high energy saving potential. The outcome of the analysis conducted using MACCs was shared with the state level stakeholders to finalise the mitigation

Page 36
action investment projects for the state. The outcome of the discussion with key Government officials and the state level Stakeholder Consultation resulted the following:
Even having the highest energy saving and GHG emission reduction potential, the steel sector cannot be considered for investment projects as it is already covered under Perform Achieve and Trade (PAT) Scheme of Bureau of Energy Efficiency (BEE). In addition it would be difficult to develop replicable models which are scalable and of direct benefit to the electricity consumers and other stakeholders in the state.
The power sector also cannot be considered as it is also covered under PAT Scheme and good results cannot be achieved through UNDP-GEF project interventions during the short period (4-years) of project implementation.
The best choice for design and implementation of EE investment projects are EE public lighting, EE in commercial buildings, and EE municipal pumping. This is due the readiness of ESCOs and the private sector to invest in these projects and implement the projects using PPP or innovative financing models. The Energy Efficiency Services Limited (EESL), a super ESCO established by Government of India under NMEEE has agreed to invest in EE public lighting, EE municipal pumping and EE buildings projects in the state.
Based upon the analysis conducted using MACCs, state level stakeholder consultation and the potential for scale-up, the state has agreed to implement the investment projects in EE public lighting, EE municipal pumping and EE building sectors.
On the RE side, grid connected solar (solar parks and roof-top) has the highest potential followed by the wind. The state has decided to design and implement roof-top solar as investment project. The innovative financing and PPP module developed under the UNDP-GEF project will also help the implementation and scale up of solar park projects in the state. The newly formed Government in Jharkhand is also inviting private sector to invest in solar in the state. For UNDP-GEF project, the Solar Energy Corporation of India (SECI) has agreed to work with state level stakeholders to implement the roof-top solar projects.

Page 37
Table 10: GHG Abatement Potential of Different Sectors in Jharkhand
Details Unit
Sector Potential In Jharkhand
RE (Solar PV
Generation 18180 MW)
Municipal DSM (EE
Pumps)
EE in Commerci
al and Public Buildings
RE (Wind
Energy Generation
91 MW)
EE in Steel Industry
EE in Public Lighting
EE in Residential/
Domestic Buildings
EE in Power Sector
(Supply Side Management)
Ag DSM (EE Pumps for Agriculture &
Irrigation)
Capital Cost Billion USD
21,21.0 0.11 0.14 8.72 101.0 5.01 37.43 76.67 1.10
Annual Maintenance & Other Costs
Million USD/Year
786.36 0.01 0.014 1.74 10.10 0.50 3.74 7.67 0.11
Project Lifetime Year 25 15 15 15 15 15 15 15 15
Total Cost of Project in Lifetime
Billion USD
40,86.9 0.13 0.16 1.63 1,16.1 5.76 43.04 1.97 1.27
Net Present Value (NPV)
Billion USD
39,35.90 2.82 0.91 2.68 1,05.10 0.60 12.28 26.58 0.97
Annual Electricity Savings
GWh 31,851.36 36.49 13.07 215.23 20,459,810,010.0 64.24 798.84 591.44 14.79
Electricity Tariff + 5% Tariff Escalation/Yr.
USD/kWh 0.30 0.09 0.09 0.08 0.06 0.07 0.04 0.09 0.01
Avg. Annual Cost Savings
Billion USD/Yr
9,53.41 0.50 0.18 1.80 31.28 0.72 3.90 8.04 0.01
State Emission Factor
tCO2/MWh 1.68 1.68 1.68 1.68 1.68 1.68 1.68 1.68 1.68
Annual CO2 Emission Reductions
Billion tCO2
5.35 0.006 0.002 0.036 34,372,48.0 0.011 0.134 0.099 0.002
Discount Rate % 11.0 11.0 11.0 11.0 11.0 11.0 11.0 11.0 11.0
Marginal Abatement Cost (MAC)
USD/tCO2 (49.0) (30.6) (29.7) (4.9) 0.0 3.7 6.1 17.8 26.0
Annual Cumulative CO2e Reduction (2030) without Steel Sector
Billion tCO2e
5.35 5.36 5.36 5.39 0.0 5.41 5.54 5.64 5.64
Annual Cumulative CO2e Reduction (2030)
Billion tCO2e
5.35 5.36 5.36 5.40 34,372,53.47 34,372,53.49 34,372,53.6 34,372,53.7 34,372,53.7

Page 38
Figure 9: Sectoral MACC for State of Jharkhand

Page 39
2.4.2 Manipur
103. In the state of Manipur, state level stakeholders have identified four key areas for the selection and implementation of EE and RE mitigation strategies, these include:
M1: Installation of grid connected standalone type SPV power plant at Biodiversity parks, Eco
parks etc. M2: Installation of grid connected rooftop / demonstration solar power plants (5 – 10 MW) at
possible places; M3: Installation of solar power packs/inverters (10,000 units) and high intensity solar LED street
lights (10,000 units); M4: Energy Audit of all government buildings M5: Development of canals / irrigation system in agriculture lands for multiple cropping
throughout the year by introducing solar pumping system irrigation. 104. Against these EE and RE strategies, the state on its own has planned for design and
implementation of the investment projects in following areas:
Energy efficient street lighting in all the cities and towns; Energy efficient water pumping in all the municipalities across the state; Building energy efficiency programs in Government and Private buildings; Solar rooftop in Government and private buildings; Solar water pumps for agriculture pumping to avoid the burden on energy supply sources, and Solar grid connected systems to increase the electricity production using renewable energy.
105. The Table 13 present the energy saving/distributed generation and GHG emission reduction
potential along with the cost for implementation of mitigation actions for Manipur state. The Figure 12 presents the MACC for Manipur state, which is showing very high potential of energy savings in power sector followed by EE in domestic sector, EE public lighting, EE water pumping, EE in buildings and EE agriculture pumping sector in descending order. On RE side, the solar has the highest potential of electricity generation followed by the wind.
106. The outcome of the analysis conducted using MACCs was shared with the state level stakeholders to finalise the mitigation action investment projects for the state. The outcome of the discussion with key Government officials and the state level Stakeholder Consultation resulted the following:
Even having the highest energy saving and GHG emission reduction potential, the power sector cannot be considered as it is covered under PAT Scheme of BEE and good results cannot be achieved through UNDP-GEF project interventions due to the short period of project implementation (4-years).
The best choice for design and implementation of EE investment projects are EE public lighting, EE in commercial buildings, and EE municipal pumping. This is due the readiness of ESCOs and the private sector to invest in these projects and implement the projects using PPP or innovative financing models. EESL, a super ESCO established by Government of India under NMEEE has agreed to invest in EE public lighting, EE municipal pumping and EE buildings projects in the state.
Based upon the analysis conducted using MACCs, State level stakeholder consultation and the potential for scale-up, the state has agreed to implement the investment projects in EE public lighting and EE municipal pumping sectors.
On the RE side, grid connected solar (solar parks and roof-top) has the highest potential followed by the wind. The state has decided to design and implement roof-top solar and solar parks as investment projects. The innovative financing and PPP module developed under the UNDP-GEF project will also help the implementation and scale up of both solar park and roof-top solar projects in the state. For UNDP-GEF project, the Solar Energy Corporation of India (SECI) has agreed to work with state level stakeholders to implement the roof-top solar projects.

Page 40
Table 11: GHG Abatement Potential of Different Sectors in Manipur
Details Unit
Sector Potential In Manipur
Municipal DSM (EE Pumps)
RE (Solar PV Generation 10630 MW)
RE (Wind Energy Generation 56 MW)
EE in Commercial and Public Buildings
EE in Residential/Domestic Buildings
EE in Public Lighting
Ag DSM (EE Pumps for Agriculture & Irrigation)
EE in Power Sector (Supply Side Management)
Capital Cost Million USD 0.08 12,401.7 53.67 1.85 31.56 2.67 0.45 100.83
Annual Maintenance & Other Costs
Million USD/Year 0.000754 331.02 1.07 0.02 0.32 0.03 0.004 1.008
Project Lifetime Year 15 25 15 15 15 15 15 15
Total Cost of Project in Lifetime
Million USD 0.09 20,677.20 16.34 16.34 36.29 3.07 0.51 19.67
Net Present Value (NPV) Million USD 1.69 2,422.68 16.49 0.32 1.32 (-0.09) (-0.22) (-34.96)
Annual Electricity Savings
GWh 2.42 18,623.76 132.45 2.63 67.35 3.41 0.60 77.78
Electricity Tariff + 5% Tariff Escalation/y
USD/kWh 0.08 0.13 0.08 0.09 0.06 0.08 0.05 0.09
Avg. Annual Cost Savings
Million USD/Yr 0.30 2,396.26 11.08 0.35 5.19 0.42 0.03 10.57
State Emission Factor tCO2/MWh 1.56 1.56 1.56 1.56 1.56 1.56 1.56 1.56
Annual CO2 Emission Reductions
tCO2 3,782 29,053,066 206,624 4,102 105,069 5,327 936 121,343
Discount Rate % 11.0 11.0 11.0 11.0 11.0 11.0 11.0 11.0
Marginal Abatement Cost
USD/tCO2 -29.8 -5.6 -5.3 -5.3 -0.8 1.1 15.6 19.2
Annual Cumulative CO2e Reduction (2030)
Million tCO2e 0.004 29.06 29.26 29.27 29.37 29.38 29.38 29.50

Page 41
Figure 10: Sectoral MACC for State of Manipur

Page 42
2.5 Prioritised RE and EE Technologies for Climate Change Mitigation in the selected States
107. Based on discussions with the state government, use of MACCs and stakeholder consultations, a finalized set of RE and EE applications have been selected for the two states (mentioned in the previous section). This section provides the details about the technologies and their benefits.
LED based Energy Efficient Street Lighting
There is a rapid growth in LED street lighting because of promising nature of the technology, maximised energy savings and high investment returns. While LED technology for street lighting is relatively new, the science behind it is well understood because LEDs themselves have been around for decades. LED is just a light bulb without the filament and its colour and illumination intensity are dictated by the movement of electrons in the semiconductor material. The life span of an LED street light can exceed 50,000 hours, which is equivalent to almost six years of continuous operation which equates to 12 years of life when in operation 12 hours a day. These can be fitted to the existing structures as the mounting apparatus are available in conventional cobra head designs, and depending on the lighting application (i.e. highway, residential street, parking lot, etc.), LEDs are available in various wattages and with different colour temperatures (Kelvin) ranging from 3,000K (warm white) to 6,000K (day white). LED lights contain no toxic materials and are 100% recyclable. Because of their long life, they can significantly reduce landfills and bulb disposal costs compared to conventional streetlights. Both Jharkhand and Manipur states have opted for the design and implementation of LED Street Lighting investment projects using the innovative financing and investment models developed under the UNDP-GEF project.
Solar Rooftop Installations Cities in both selected states are experiencing a substantial growth in peak electricity demand. The electricity utilities are finding it difficult to cope with this rapid rise in demand and as a result most of the cities and towns are facing severe electricity shortages. Various industries and commercial establishments e.g., Malls, Hotels, Hospitals, Nursing homes etc. housing complexes developed by the builders and developers in cities and towns use diesel generators for back-up power even during the day time. The capacities of these generators vary from a few kilowatts to a couple of MW. With an objective to reduce dependency on diesel gensets, a scheme in the name of ‘Rooftop PV and Small Scale Solar Generation Program (RPSSGP)’ was launched under JNNSM. The rooftop solar PV system could be with or, without having grid interaction. In grid-interactive system, the DC power generated from solar PV panels is converted to AC power using power conditioning unit and is fed to the grid either of 11 KV three-phase line or, of 220V single-phase line depending on the system installed at institution, commercial establishment or, residential complex. Non-grid interactive systems ideally require a full load capacity battery power back-up system. However, with the introduction of advanced load management and power conditioning systems, and safety mechanisms, it is possible to segregate the day-time loads to be served directly by solar power without necessarily going through the battery back-up. MNRE has set up the Solar Energy Corporation of India (SECI)29 to work with public and private sector stakeholders for setting up solar power plants and rooftop solar plants in different states of India. To promote rooftop solar, MNRE launched an investment projects scheme in year 2013 for grid connected roof top PV power projects. This scheme is being implemented by SEC.
Energy Efficient Water Pumping Solutions The water supply is one of the key services in the growing cities, which consumes highest amount of energy. The water utilities or Municipalities run in to losses due to inefficiencies in both water and energy uses. In both selected states Jharkhand and Manipur, the data shows that there are inefficiencies in municipal water pumping systems. A good amount of water entering the system is lost before it reaches the customers. Pump systems are improperly sized, poorly maintained, operated at less than their optimal load, and because the systems were built a long time ago, usually for the lowest possible cost they are inefficient to begin with. The designs of Municipal Water pumping systems include information that demonstrates clear energy savings. The designs should clearly show that: (1) the most energy efficient equipment is being used in the project, (2) that energy efficient design and operational considerations and practices are followed, (3) the percent increase in energy efficiency and kWh saved, and (4) why further energy efficiency improvements cannot be achieved.
Solar Water Pumping
29 Solar Energy Corporation of India (SECI) was set up on 20th September 2011, as a not-for-profit company under Section-25 of the Companies Act 1956 as an implementation and facilitation institution dedicated to Solar Energy sector. SECI is established under the administrative control of the Ministry of New and Renewable Energy, Government of India. Mandate of SECI allows wide ranging activities to be undertaken with an overall view to facilitate implementation of JNNSM and achieving the targets set therein. The Corporation has the objective of developing Solar Technologies and ensuring inclusive solar power development throughout India.

Page 43
Agriculture continues to be an important sector in India’s economy. Most parts of the country requires irrigation for increasing agricultural productivity. As a result, there has been proliferation of agriculture pump sets in the country. It is estimated that there are around 18 million pump sets that are connected with electricity grid. In addition, there are around 7 million pump sets that are being powered by diesel. As per a report (KPMG), India uses more than 4 billion litres of diesel and around 85 million tons of coal per annum to support water pumping for irrigation. This increased carbon footprint. Considering the recent advances in solar photovoltaic technologies and appropriate application possibilities of solar water pumping systems for agricultural applications, Government of India has taken several initiatives to promote solar water pumping systems for agriculture and for drinking water supply. However, the upfront cost of a solar pump is several times more than that of a conventional pump. One of the key objectives of the Government program for solar pumping is to develop models that will foster solar power deployment for pumping in rural areas in a scalable manner and explore prospects to support rural development related aspects in addition to providing energy access. Therefore, few solar pumping based investment projects were developed in the proposed project to mitigate GHG emissions.
Energy Auditing in Office Buildings Energy audit of a building is a systematic procedure, which aims to evaluate the building’s existing energy consumption, to identify the potential energy savings and to report the findings. It is an important tool that can be used to implement energy efficiency measures and achieve energy conservation in the building sector together with extension of the electromechanical equipment life span. The energy audit consists mainly of collecting and measuring data that are valuable for the energy assessment of the building. Its main purpose is to conduct an initial energy survey and to identify operation and maintenance procedures. Its main scope is to describe and assess the current energy demand and consumption, identify the possible and most important energy management improvements, and ideally, to offer an energy management plan. The data collected during the energy audit, both from monitored data and also interviewing the tenants, have to describe the energy demand of the building. This data were mainly affected by the building use, its envelope, equipment and type of energy used for heating, cooling, ventilating, lighting the building, as well as for heating sanitary hot water.
Grid Connected Solar Parks A Solar Park is a concentrated zone of development of solar power generation projects. Depending on availability of land such parks can accommodate solar power projects with cumulative capacity of 100 MW and above. The necessary infrastructure that includes levelized land, drainage, transmission system, water, and road connectivity and communication network amongst other requirements. The solar parks are thus characterized by properly developed infrastructure for accommodating solar power projects of a number of developers where both the risks and gestation period of the projects can be minimized. At the state level, the solar parks will enable the states to bring in significant investment from project developers in solar power generating sector. Since each State is mandated to fulfil its Solar Purchase Obligation (SPO), solar parks are envisaged to be the appropriate platform that the State Governments may offer to solar power developers to achieve its SPO requirement. Development of solar parks would help generating employment opportunities and will be a key enabler for reduction of the State’s carbon footprint by avoiding emissions equivalent to the solar park’s generated capacity
2.6 Business as Usual Scenario & Market Transformation due to UNDP-GEF Project Interventions
108. The framework for implementation of EE and RE measures and the design and implementation of
investment projects under the proposed UNDP-GEF project is expected to remove the barriers and transform the market for increased implementation of EE and RE interventions in EE street lighting, EE municipal pumping, EE buildings, EE agriculture pumping, solar roof-top and solar park projects in both the states. The graph covering the analysis conducted using the business as usual scenario in EE and RE sectors in both the states and the possible transformation of market due to the UNDP-GEF project interventions is presented below (Figure 11 & 12 and Table 12 & 13).

Page 44
Source: (Greenpeace & Infraline Energy , 2013), IIEC Analysis
Figure 11: Manipur Renewable Energy's Scenarios
Table 12: Projected Renewable Energy Scenarios for Manipur
Manipur Renewable Energy
Year 2012 2013 2014 2015 2016 2017 2018 2019 2020
Total RE Installed (Solar) Capacity Forecast (MW)
0.26 1.01 2.13 3.62 5.11 6.98 9.22 11.46 13.70
Forecast RE Installed (Solar Installation) through UNDP-GEF interventions (MW)
0 0 0 20 24 28 32 37 42
RPOs Forecast (MW) 16 22 25 28 30 36 45 62 67
Electricity Forecast (GWh) in BAU scenario
581 596 612 629 646 664 683 703 723
Source: (Greenpeace & Infraline Energy , 2013), IIEC Analysis
Figure 12: Jharkhand State Renewable Energy's Scenarios
‐
100
200
300
400
500
600
700
800
Electricitiy Demand Forecast (GWh)
‐
2,000
4,000
6,000
8,000
10,000
12,000
Electricitiy Demand Forecast (GWh)

Page 45
Table 13: Projected Renewable Energy Scenarios for Jharkhand
Jharkhand Renewable Energy
Year 2012 2013 2014 2015 2016 2017 2018 2019 2020
Total RE Installed (Solar) Capacity Forecast (MW)
10.41 15.6 22.39 31.77 43.15 59.13 79.7 107.27 143.84
Forecast RE Installed (Solar Installation) through UNDP-GEF interventions (MW)
15 22 31 44 60 83 112 150 201
RPOs Forecast (MW)
231 267 349 486 657 765 1106 1388 1514
Electricity Forecast (GWh) in BAU scenario
6,457 6,892 7,349 7,831 8,339 8,873 9,436 10,029 10,563
109. The above two forecasts are highlighted in the graph for the different available scenarios in the
space of Renewable Energy in Manipur & Jharkhand state. For the past two decades India did see rapid growth opportunities in its economy and simultaneously in the power generation sector. Coming decades are very important in India’s quest for the balanced & sustainable growth with right mix of energy. In the above two graph (i.e. Manipur & Jharkhand), we have taken 3 different scenarios.
RPOs Forecast: Renewable energy potential of corresponding states is a prime factor, but
it should not be a limiting factor in deciding RPO targets. These targets are formulated on the factor of NAPCC target of achieving national target of 20 % RE by 2020. An attempt has been made to derive more realistic RPOs on the basis of these three factors:
Renewable Energy potential of the particular states; Power purchasing capacity of states (Financial Health); and Consumer profile of states.
Business as usual Solar Grid Connected RE Installed capacity forecast: State-wise
capacity addition estimates on basis of state renewable energy potential is the most important exercise in our RPO derivation model. This forecasts Solar Grid Connected RE target possibility by 2020 in the business as usual scenario for the Jharkhand & Manipur state.
Forecast of Installed RE capacity through UNDP-GEF interventions: This forecast is drawn upon the success factors due to RE pilot projects undertaken in this project i.e. in the Manipur state, two important pilots i.e. rooftop solar projects & grid connected solar park; and in Jharkhand state, rooftop solar installation at the public buildings & Solar Park under JNNSM. These investment projects are expected boost and transform the solar grid connected RE market by removing the foreseen barriers.
110. Two figures below highlight & forecast energy savings potentials for the state of Manipur &
Jharkhand. We have forecasted two scenarios for the energy savings potentials of these two states.
Total energy savings potential for the state: In this scenario, we have calculated potential energy savings in all the sectors for the respective states (i.e. Manipur & Jharkhand)
Energy Savings potential through UNDP-GEF interventions (alternative scenario): This scenario is drawn upon the success factors due to EE pilot projects identified and will be undertaken in UNDP-GEF proposal. This alternative scenario is based on the assumption that creation of new mechanisms, financial models, capacity building for implementation of the EE, will in turn help the two states in scaling up their efforts in implementing EE. The project interventions are expected to help in removing several of the barriers, particularly the market barriers in the two states and in turn propel other EE

Page 46
projects for implementation in Jharkhand and Manipur. The figure below, compare the energy saving potential that can be achieved through the UNDP GEF SAPCC project (both direct and indirect impacts) out of the total energy saving potential of the states till 2020.
Source: (Greenpeace & Infraline Energy , 2013), (JREC, 2014), (USAID, 2008), IIEC Analysis
Figure 13: Energy Savings Projections- Manipur
Source: (Greenpeace & Infraline Energy , 2013), (JSEB, 2013), (USAID, 2008), IIEC Analysis
Figure 14: Energy Savings Projections- Jharkhand

Page 47
2.7 Shortlisted Climate Change Mitigation Projects in States
111. Following the decision to design and implement the EE and RE investment projects in the areas identified on the basis of state level MACC analysis, stakeholder consultation and the key areas recommended in SAPCCs, the state nodal agencies have prepared a list of possible locations where the investment projects can be implemented. The list of locations and the type of investment project to be implemented is provided in the Table 14 below:
Table 14: List of potential investment projects along with location details for demonstration
phase
S.No. Location Key details of the
investment projects
Possible RE/EE Intervention City/Area District
Jharkhand 1. Project Building,
Dhurwa, Ranchi-834004
Nepal House, Doranda, Ranchi-834002
MDI Building, Dhurwa, Ranchi-834004
FFP Building, Dhurwa, Ranchi-834004
Ranchi - Investment Projects at government buildings including Project Building, Nepal House, MDI and FFP Building
- Ranchi has a total population of 1,126,741 in 2011
- Energy Auditing - EE Green Buildings
Retrofits -
2 Project Building, Dhurwa, Ranchi-834004
Nepal House, Doranda, Ranchi-834002
MDI Building, Dhurwa, Ranchi-834004
FFP Building, Dhurwa, Ranchi-834004
Ranchi - Investment Projects at government buildings including Project Building, Nepal House, MDI and FFP Building
- Ranchi has a total population of 1,126,741 in 2011
- Roof top grid connected solar
3. Mining Area Development Authority, (MADA), Dhanbad
Dhanbad - To be executed in area of Mining Area Development Authority (MADA)
- Total population of Dhanbad is 1,195,298
- Energy Efficient water pumping
4. Chas Area in Bokaro
Bokaro - Chas area of Bokaro Steel city
- Total number of poles is 1488 in the area
- Total population of Bokaro 563,417
- EE LED based street lighting
Manipur 5. Jiribam in
Imphal East Imphal
- Jiribam, Imphal East District, - Total Area 710 km2 - Population 452,661
- Grid Connected Solar Power Park 10MW
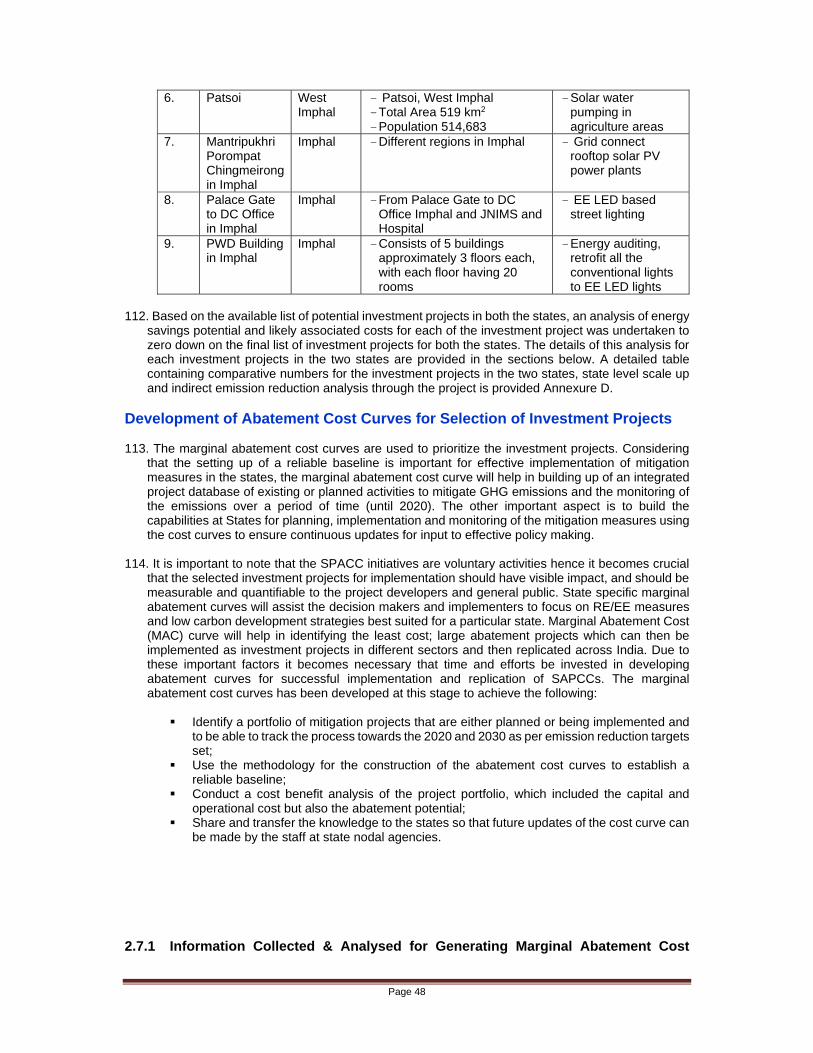
Page 48
112. Based on the available list of potential investment projects in both the states, an analysis of energy
savings potential and likely associated costs for each of the investment project was undertaken to zero down on the final list of investment projects for both the states. The details of this analysis for each investment projects in the two states are provided in the sections below. A detailed table containing comparative numbers for the investment projects in the two states, state level scale up and indirect emission reduction analysis through the project is provided Annexure D.
Development of Abatement Cost Curves for Selection of Investment Projects 113. The marginal abatement cost curves are used to prioritize the investment projects. Considering
that the setting up of a reliable baseline is important for effective implementation of mitigation measures in the states, the marginal abatement cost curve will help in building up of an integrated project database of existing or planned activities to mitigate GHG emissions and the monitoring of the emissions over a period of time (until 2020). The other important aspect is to build the capabilities at States for planning, implementation and monitoring of the mitigation measures using the cost curves to ensure continuous updates for input to effective policy making.
114. It is important to note that the SPACC initiatives are voluntary activities hence it becomes crucial
that the selected investment projects for implementation should have visible impact, and should be measurable and quantifiable to the project developers and general public. State specific marginal abatement curves will assist the decision makers and implementers to focus on RE/EE measures and low carbon development strategies best suited for a particular state. Marginal Abatement Cost (MAC) curve will help in identifying the least cost; large abatement projects which can then be implemented as investment projects in different sectors and then replicated across India. Due to these important factors it becomes necessary that time and efforts be invested in developing abatement curves for successful implementation and replication of SAPCCs. The marginal abatement cost curves has been developed at this stage to achieve the following:
Identify a portfolio of mitigation projects that are either planned or being implemented and
to be able to track the process towards the 2020 and 2030 as per emission reduction targets set;
Use the methodology for the construction of the abatement cost curves to establish a reliable baseline;
Conduct a cost benefit analysis of the project portfolio, which included the capital and operational cost but also the abatement potential;
Share and transfer the knowledge to the states so that future updates of the cost curve can be made by the staff at state nodal agencies.
2.7.1 Information Collected & Analysed for Generating Marginal Abatement Cost
6. Patsoi West Imphal
- Patsoi, West Imphal - Total Area 519 km2 - Population 514,683
- Solar water pumping in agriculture areas
7. Mantripukhri Porompat Chingmeirong in Imphal
Imphal - Different regions in Imphal - Grid connect rooftop solar PV power plants
8. Palace Gate to DC Office in Imphal
Imphal - From Palace Gate to DC Office Imphal and JNIMS and Hospital
- EE LED based street lighting
9. PWD Building in Imphal
Imphal - Consists of 5 buildings approximately 3 floors each, with each floor having 20 rooms
- Energy auditing, retrofit all the conventional lights to EE LED lights

Page 49
Curves for Selected Investment Projects
115. The Marginal Abatement Cost Curves are generated for both Jharkhand and Manipur states using the available data for all the technologies and possible mitigation measures to abate the GHG emissions in the states. The MACC are generated to establish a reliable baseline of all the technologies, mitigation measures, and current GHG emissions. The MACC also helped in ranking the technologies for best possible GHG abatements in the states and selection of technologies for investment. The outcome of the MACC is the identified investment projects and the costs per tonne of CO2 emission reduction.
116. To generate the Marginal Abatement Cost Curves (MACC), the following parameters have been
analysed for determining the financial details of the abatement/mitigation projects and the expected volume of greenhouse gases to be abated over the projects’ lifetime.
All the possible RE and EE measures in the states including the shortlisted interventions
as per the SAPCCs; Expected lifetime of the selected mitigation measures; Total cost of each RE and EE project (both capital and ongoing operational expenses); Expected savings to be delivered by the project over its useful lifetime; Expected amount of electricity generated using RE sources over the project lifetime; Expected volume of GHG emissions saved over the project lifetime Cost per unit of energy saved/generated and per tonne of CO2e abated Prioritized EE and RE measures for taking up the investment projects and state level
interventions Determining the Project Lifetime 117. The project lifetime is the number of years for which the project is expected to deliver GHG
abatement. For the shortlisted EE and RE projects, the lifetime is calculated on the basis of standard lifetime of technologies (like LEDs, solar PV, energy efficient pumps, etc.) by the technology providers/manufactures for the shortlisted mitigation projects. The average lifetime of selected investment projects is taken as 15 years to calculate the GHG emissions and other details.
Discount Rates 118. The discount rates are often applied to investment decisions to allow for the diminishing value of
money over time. A discount rate is represented as a percentage and is set by the implementing agency making an investment decision. It can be set low (such as 3-4%) or higher (such as 15%). A higher discount rate is used to reflect a higher risk that the future value of the money will be diminished. In determining what discount rate to apply to abatement calculations, intense discussions are required with stakeholders like financing agency, implementing agency, technology providers and the agency responsible for managing the project.
Discount Rates
The discount rates are often applied to investment decisions to allow for the diminishing value of money over time. A discount rate is represented as a percentage and is set by the implementing agency making an investment decision. It can be set low (such as 3-4%) or higher (such as 15%). A higher discount rate is used to reflect a higher risk that the future value of the money will be diminished. In determining what discount rate to apply to abatement calculations, intense discussions are required with stakeholders like financing agency, implementing agency, technology providers and the agency responsible for managing the project.
Determining the Full Project Cost 119. The complete project cost has been calculated using the upfront capital cost of technology, cost
of technology finance (if any), implementation costs, operational costs for the life of the project, discount rates.
Determining Project Savings

Page 50
120. The following types of savings have been calculated to determine the overall savings from the shortlisted EE and RE projects.
Operational cost savings – The calculations of including less resources being consumed (such
as electricity or fuel) and the associated costs saved due to the implementation of EE and RE projects.
Project Revenue – Additional revenue to be generated by the project due to the implementation of EE and RE measures. For example, electricity saved due to EE measures can be sold to high paying consumers like industry and commercial to generate additional revenue.
Asset Salvage Value – Revenues to be generated by the project due to the sale of the assets at the end of a project’s life or the junk assets replaced by the project sold to generate additional revenue.
Determining Emissions Abated 121. The changes in consumption of electricity due to the implementation of EE projects and the
changes in generation of electricity due to the implementation of RE projects have been calculated and the values have been multiplied by the local emission factors to determine the abated CO2e.
122. The MACC for individual investment projects in both the states and for the state level abatement
potential are presented below. The Figure and Tables depict the calculations for individual and state level investment projects in Jharkhand and Manipur are provided below.
Table 15: MACC Calculations for pilot investments in Jharkhand
Details Unit
Investment Projects in Jharkhand
EE Municipal Pumping
EE in Government
Buildings
EE Street
Lighting
Rooftop Solar in
GovernmentBuildings
(60kW)
Capital Cost Million USD 0.39 0.18 0.78 0.09
Annual Maintenance & Other Costs USD/Year 3,866 1,757 7,775 1,868
Project Lifetime Year 15.0 15.0 15.0 15.0
Total Cost of Project in Lifetime Million USD 0.44 0.20 0.89 0.12
Net Present Value (NPV) USD 9,386,309 1.141,275 92,400 21,691
Annual Electricity Savings kWh 12,163,204 1,633,738 995,720 90,761
Electricity Tariff + 5% Tariff Escalation/Yr. USD/kWh 0.09 0.09 0.07 0.09
Avg. Annual Cost Savings Million USD/y 1.65 0.22 0.11 0.01
State Emission Factor tCO2/MWh 1.68 1.68 1.68 1.68
Annual CO2 Emission Reductions tCO2e 20,434 2,745 1,673 153
Discount Rate % 11.0 11.0 11.0 11.0
Marginal Abatement Cost (MAC) (Carbon Discounted)
USD/tCO2 30.6 29.7 3.7 9.5
Annual Cumulative CO2e Reduction tCO2e 20,434 23,179 24,852 25,004

Page 51
Figure 15: Marginal Abatement Cost Curve for Mitigation Actions in Jharkhand

Page 52
Table 16: MACC Calculations for Investment Projects in Manipur
Details Unit
Investment Projects in Manipur
Municipal DSM (EE Pumps)
LED Lighting in Government Buildings
LED Street Lighting
Solar PV Park (10MW)
Solar Rooftop in Government & Public
Buildings (10MW)
Capital Cost Million USD 0.03 0.09 0.20 11.67 15.00
Annual Maintenance & Other Costs USD/Year 251 879 2,001 3,11,403 3,11,403
Project Lifetime Year 15 15 15 15 15
Total Cost of Project in Lifetime Million USD 0.029 0.10 0.23 16.33 19.67
Net Present Value (NPV) USD 5,664,229 15,588 3,840 641,609 1,269,556
Annual Electricity Savings kWh 808,268 125,227 260,172 14,016,000 17,520,000
Electricity Tariff + 5% Tariff Escalation/Yr. USD/kWh 0.08 0.09 0.08 0.13 0.09
Avg. Annual Cost Savings Million USD/y 0.100 0.017 0.032 1.80 0.14
State Emission Factor tCO2/MWh 1.56 1.56 1.56 1.56 1.56
Annual CO2 Emission Reductions tCO2e 1,261 195 406 21,865 27,331
Discount Rate % 11.0 11.0 11.0 11.0 11.0
Marginal Abatement Cost (MAC) USD/tCO2 29.8 5.3 0.6 2.0 3.1
Annual Cumulative CO2e Reduction tCO2e 1,261 1,456 1,862 23,727 51,058

Page 53
Figure 16: Marginal Abatement Cost Curve for Mitigation Actions in Manipur
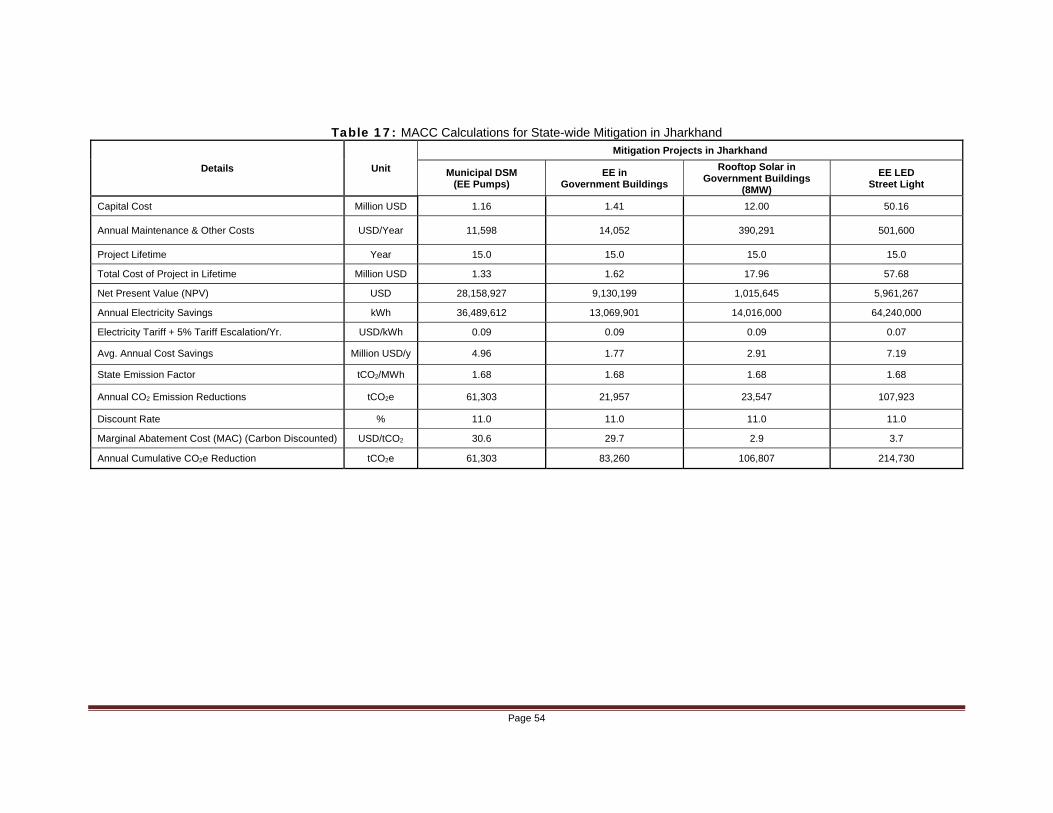
Page 54
Table 17: MACC Calculations for State-wide Mitigation in Jharkhand
Details Unit
Mitigation Projects in Jharkhand
Municipal DSM (EE Pumps)
EE in Government Buildings
Rooftop Solar in Government Buildings
(8MW)
EE LED Street Light
Capital Cost Million USD 1.16 1.41 12.00 50.16
Annual Maintenance & Other Costs USD/Year 11,598 14,052 390,291 501,600
Project Lifetime Year 15.0 15.0 15.0 15.0
Total Cost of Project in Lifetime Million USD 1.33 1.62 17.96 57.68
Net Present Value (NPV) USD 28,158,927 9,130,199 1,015,645 5,961,267
Annual Electricity Savings kWh 36,489,612 13,069,901 14,016,000 64,240,000
Electricity Tariff + 5% Tariff Escalation/Yr. USD/kWh 0.09 0.09 0.09 0.07
Avg. Annual Cost Savings Million USD/y 4.96 1.77 2.91 7.19
State Emission Factor tCO2/MWh 1.68 1.68 1.68 1.68
Annual CO2 Emission Reductions tCO2e 61,303 21,957 23,547 107,923
Discount Rate % 11.0 11.0 11.0 11.0
Marginal Abatement Cost (MAC) (Carbon Discounted) USD/tCO2 30.6 29.7 2.9 3.7
Annual Cumulative CO2e Reduction tCO2e 61,303 83,260 106,807 214,730

Page 55
Figure 17: Marginal Abatement Cost Curve for State-wide Mitigation Actions in Manipur
Table 18: MACC Calculations for State Wide Mitigation in Manipur
Details Unit
Mitigation Projects in Manipur
Municipal DSM (EE Pumps)
LED Lighting in Government Buildings
EE LED Street
Lighting
Solar Park (10MW)
Solar Rooftop in Government &
Private Buildings (10MW)
Capital Cost Million USD 0.07 1.84 2.67 11.67 15.00
Annual Maintenance & Other Costs USD/Year 754 18,461 26,665 3,11,403 3,11,403
Project Lifetime Year 15 15 15 15 15
Total Cost of Project in Lifetime Million USD 0.086 2.12 3.06 16.33 19.67
Net Present Value (NPV) USD 16,92,686 3,27,337 1 6,41,609 12,69,556

Page 56
Annual Electricity Savings kWh 24,24,803 1,25,227 34,14,998 140,16,000 175,20,000
Electricity Tariff + 5% Tariff Escalation/Yr. USD/kWh 0.08 0.09 0.08 0.13 0.09
Avg. Annual Cost Savings Million USD/y 0.29 0.35 0.42 1.80 0.14
State Emission Factor tCO2/MWh 1.56 1.56 1.56 1.56 1.56
Annual CO2 Emission Reductions tCO2e 3,783 4,102 5,327 21,865 27,331
Discount Rate % 11.0 11.0 11.0 11.0 11.0
Marginal Abatement Cost (MAC) (Carbon Discounted)
USD/tCO2 29.8 5.3 1.1 2.0 3.1
Annual Cumulative CO2e Reduction tCO2e 3,783 7,885 13,213 35,077 62,409
Figure 18: Marginal Abatement Cost Curve for State wide Mitigation Actions in Manipur

Page 57
2.8 Analysis of Finalized Investment Projects & State Level Abatement Potential
Jharkhand Investment Project 1: EE Street Lighting Project 123. An EE street lighting investment project will be undertaken in Chas Municipality in the Bokaro district.
The current inefficient streetlights will be replaced by 90 W efficient LED street lights. An annual energy savings of 995,720 kWh is estimated which will result in GHG abatement of 25,092 tCO2e by 2030 (Table 19).
Table 19: EE Street Lighting Investment Project at Chas, Jharkhand
124. The LED street lighting project will be implemented by JREDA, in coordination with the Department of
Energy and Department of Forests and Environment in Jharkhand. EESL has indicated its interest in the implementation of this investment project based on its annuity based deemed saving energy performance contracting approach. EESL has been implementing similar types of investment projects in other regions of the country for LED based street lighting projects. It is expected EESL will bring in the investment in this project along with some other local public/private financing institutions. Both BEE funds and State Government contributions can be utilized in implementing the investment project.
State Level Abatement Potential from Implementation of LED Street Lighting Projects 125. The state level abatement potential from the implementation of LED street lighting projects is very high.
The assistance using the GEF grant is expected to build state capacity to scale-up the implementation of LED street lighting projects in all the municipalities in the state. The GEF project will ensure that long-term relationship between the state agencies and the EESL are established and the implementation mechanism developed under the project is replicated in other cities in the state.
126. There are currently 100,000 nos. of 250 W HPSV street lights in Jharkhand. The current inefficient
street lights can be replaced by 90 W efficient LED street lights. An annual energy savings of 64,240,000 kWh is estimated which will result in GHG abatement of 1,618,848 tCO2e by 2030 (Table 20).
Table 20: Abatement Potential – State Level EE Street Lighting Projects, Jharkhand
Investment Project 2: EE Municipal Water Pumping Project 127. Energy efficient municipal water pumping project for the Mining Area Development Authority
(MADA) in the Dhanbad district is expected to realize annual energy savings of 12,163,204 kWh. The energy conservation measures will consist of pump replacement. The GHG abatement of this project is estimated to be 306,513 tCO2e by 2030.
EE Street Lighting Investment projects Project at Chas Technology LED
Expected Annual Energy Savings (kWh) 995,720 Expected GHG Abatement (2030) tCO2e 25,092 Approximate Cost $/tCO2e 3.7
EE Street Lighting Investment Projects in Jharkhand Technology LED Expected Annual Energy Savings (kWh) 64,240,000 Expected GHG Abatement (2030) tCO2e 1,618,848 Approximate Cost $/tCO2e 3.7

Page 58
Table 21: EE Municipal Water Pumping Project (MADA), Jharkhand 128. The investment project will be implemented by JREDA, in coordination with the Department of Energy
and Department of Forests and Environment in Jharkhand. EESL has indicated its interest in the implementing this project. EESL has been implementing similar types of projects in other regions of the country. It is expected EESL will bring in the investment in this project along with some other local public/private financing institutions. Both BEE funds and State Government contributions can be utilized in implementing the investment projects. The investment project will also collaborate with local pump manufacturers also identified in the state.
State Level Abatement Potential from Implementation of EE Water Pumping Projects 129. The state level abatement potential from the implementation of EE Water pumping projects is very
high. The assistance using the GEF grant is expected to build state capacity to scale-up the implementation of EE water pumping projects in all the municipalities in the state. The GEF project will ensure that long term relationship between the state agencies and the EESL are established and the implementation mechanism developed under the project is replicated in other cities in the state.
130. There are three water pumping sites similar to the pilot energy efficient municipal water pumping project
for the Mining Area Development Authority (MADA) in the Dhanbad. The EE pump retrofits will result in energy savings of 36,489,612 kWh. The energy conservation measures will consist of pump replacement. The GHG abatement of these projects is estimated to be 919,538 tCO2e by 2030.
Table 22: Abatement Potential – State Level EE Municipal Water Pumping Projects, Jharkhand
Investment Project 3: Energy Efficiency Improvements in Government Buildings 131. Energy Efficiency improvements are planned for two government buildings namely Project Building,
Dhurwa and Nepal House, Doranda. The investment project will include detailed energy audits of the buildings followed by EE retrofits in the buildings. EE retrofits will include replacement of inefficient lighting technologies and improvement to the HVAC system. The estimated annual energy savings for the Project Building is 1,633,738 kWh and the GHG abatement potential till 2030 is 38,426 tCO2e.
Table 23: Building Energy Efficiency (Project Building), Ranchi, Jharkhand
132. The investment project will be implemented by JREDA, in coordination with the Department of Energy
and Department of Forests and Environment in Jharkhand. EESL has indicated its interest in the
EE Municipal Water Pumping Project (MADA)
Technology EE Pumps Expected Annual Energy Savings (kWh) 12,163,204 Expected GHG Abatement (2030) tCO2e 306,513 Approximate Cost $/tCO2e -30.6
EE Municipal Water Pumping Projects in Jharkhand Technology EE Pumps Expected Annual Energy Savings (kWh) 36,489,612 Expected GHG Abatement (2030) tCO2e 919,538 Approximate Cost $/tCO2e -30.6
Building Energy Efficiency (Project Building)
Technology Different ECMs
Expected Annual Energy Savings (kWh) 1,633,738
Expected GHG Abatement (2030) tCO2e 38,426
Approximate Cost $/tCO2e -29.7

Page 59
implementing this project. It is expected that the EESL will bring in the investment for this project along with some other local public/private financing institutions. Both BEE funds and State Government contributions can be utilized in implementing the project. The project will also collaborate with local lighting solution provider as well as HVAC system manufacturers. The investment project will be undertaken based on a suitable energy saving performance contracting approach. The project will also explore possibilities of securing green rating for the building, through the Indian Green Building Council and other rating tools in the country.
State Level Abatement Potential from Implementation of EE Improvement Projects in Government Buildings 133. The state level abatement potential from the implementation of EE improvement projects in
Government buildings is very high. The assistance using the GEF grant is expected to build state capacity to scale-up the implementation of EE improvement projects in Government buildings in all the major cities in the state. The GEF project will ensure that long term relationship between the state agencies and the EESL are established and the implementation mechanism developed under the project is replicated in other cities in the state.
134. There are eight large government buildings in where energy efficiency improvements can be taken up.
The investment project will include detailed energy audits of the buildings followed by EE retrofits in the buildings. EE retrofits will include replacement of inefficient lighting technologies and improvement to the HVAC system. The estimated annual energy savings from this activity is estimated to be 13,069,901 kWh and the GHG abatement potential till 2030 is 307,404 tCO2e.
Table 24: Abatement Potential – State Level Building Energy Efficiency Projects, Jharkhand
Investment Project 4: Rooftop Solar Photovoltaic Project 135. A Rooftop Solar PV project is proposed at Project Building Dhurwa, in Ranchi. A 60kW solar PV
plant will be installed in a 485 m2 area of the Project Building. The system is expected to generate 90.761 MWh of electricity annually and the estimated cost of project is INR 55.7 Lakhs.
Table 25: Rooftop Solar PV Project (Project Building)
136. The project will be implemented by JREDA, in coordination with the Department of Energy and
Department of Forests and Environment in Jharkhand. The Solar Energy Corporation of India has expressed its interest in implementing this project. It is expected SECI will bring in the investment in this project along with some other local public/private financing institutions. Both MNRE funds and State Government contributions can be utilized in implementing the project. The project will also collaborate with local solar technology manufacturers.
Building Energy Efficiency Projects in Jharkhand
Technology Different ECMs
Expected Annual Energy Savings (kWh) 13,069,901
Expected GHG Abatement (2030) tCO2e 307,404
Approximate Cost $/tCO2e -29.7
Rooftop Solar PV Project (Project Building)
Technology Solar Photovoltaic
Expected Annual Energy Savings (kWh) 90,761
Expected GHG Abatement (2030) tCO2e 2,287
Approximate Cost $/tCO2e 9.5

Page 60
State Level Abatement Potential from Implementation of Rooftop Solar PV Projects 137. The state level abatement potential from the implementation of Rooftop solar PV projects in
Government buildings is very high. The assistance using the GEF grant is expected to build state capacity to scale-up the implementation of solar roof-top projects in Government buildings in all the major cities in the state. The GEF project will ensure that long term relationship between the state agencies and the SECI are established and the implementation mechanism developed under the project is replicated in other cities in the state.
138. The State of Jharkhand plans 8 MW capacity additions through Rooftop Solar PV. These systems will
generate 14,016 MWh annually and the estimated cost of project is INR 7,200 Lakhs with abatement potential of 353,203 by 2030.
Table 26: Abatement Potential – State Level Rooftop Solar PV Projects
Manipur
Investment Project 5: Grid Connected Solar Power Park 139. A 10 MW grid connect solar park is planned at Jiribam, East District of Imphal. The park will be
erected in a 50 hectare area and the system is expected to generate 14,016 MWh of electricity annually. An estimated 327,974 tCO2e equivalent GHG abatement potential is likely from the project by 2030.
Table 27: Grid Connected Solar Park (Jiribam), Manipur
140. The investment project will be implemented by MANIREDA, in coordination with the State Distribution
Company and Department of Environment in Manipur as the state nodal agency for implementation of the SAPCC. The Solar Energy Corporation of India has expressed its interest in implementing this project. It is expected SECI will bring in the investment in this project along with some other local public/private financing institutions. Both MNRE funds and State Government contributions can be utilized in implementing the project. The project will also collaborate with local solar technology manufacturers. The project may also find appropriate support from North Eastern Council and will also collaborate with local solar technology manufacturers.
State Level Abatement Potential from Implementation of Grid-connected Solar Park Projects 141. The state level abatement potential from the implementation of Grid-connected solar park projects is
not very high due to hilly and undulating terrain. The assistance using the GEF grant is expected to build state capacity to scale-up the implementation of small to medium size grid connected solar parks
Rooftop Solar PV Projects in Jharkhand
Technology Solar Photovoltaic
Expected Annual Energy Savings (kWh) 14,016,000
Expected GHG Abatement (2030) tCO2e 353,203
Approximate Cost $/tCO2e 2.9
Grid Connected Solar Park (Jiribam)
Technology Solar Photovoltaic
Expected Annual Energy Savings (kWh) 14,016,000
Expected GHG Abatement (2030) tCO2e 327,974
Approximate Cost $/tCO2e 2

Page 61
near different cities in the state. The GEF project will ensure that long term relationship between the state agencies, SECI and other private sector project developers are established and the implementation mechanism developed under the project is replicated in other cities in the state. The GEF interventions will ensure the implementation of 10 MW grid connect solar park is planned at Jiribam, East District of Imphal covering 50 hectare area.
Investment Project 6: EE Pumping City Water Supply 142. Energy efficient city water supply system is planned at Porompat city water supply. The estimated
energy savings from the project is estimated 808,268 kWh of electricity annually and the GHG abatement potential is 18,913 tCO2e by 2030.
Table 28: EE Pumping City Water Supply, Porompat, Manipur
143. The investment project will be implemented by MANIREDA, in coordination with the Manipur Public
Health Engineering Department (PHED). EESL has indicated its interest in the implementing this project. EESL has been implementing similar types of projects in other regions of the country. It is expected EESL will bring in the investment in this project along with some other local public/private financing institutions. Both BEE funds and State Government contributions can be utilized in implementing the investment project. The project will also collaborate with local pump manufacturers also identified in the state.
State Level Abatement Potential from Implementation of EE Water Pumping Projects 144. The state level abatement potential from the implementation of EE Water pumping projects is very
high. The assistance using the GEF grant is expected to build state capacity to scale-up the implementation of EE water pumping projects in all the municipalities in the state. The GEF project will ensure that long term relationship between the state agencies and the EESL are established and the implementation mechanism developed under the project is replicated in other cities in the state.
145. There are three city water supply stations where EE pumping can be undertaken. The estimated energy
savings from the project is 2,424,803 kWh annually and the GHG abatement potential is 56,740 tCO2e by 2030.
Table 29: Abatement Potential – State Level EE Pumping Projects, Manipur
Investment Project 7: Grid Connected Rooftop Solar Photovoltaic Project 146. Grid Rooftop Solar PV project is proposed at 21 different government buildings. The cumulative
installed capacity of these solar PV plants will be 10 MW. The system is expected to generate 17,520 MWh of electricity annually and the combined estimated project cost is INR 90 Crores.
EE Pumping, Porompat, Manipur
Technology EE Pumps Expected Annual Energy Savings (kWh) 808,268
Expected GHG Abatement (2030) tCO2e 18,913 Approximate Cost $/tCO2e -30
EE Pumping in Manipur
Technology EE Pumps Expected Annual Energy Savings (kWh) 2,424,803
Expected GHG Abatement (2030) tCO2e 56,740 Approximate Cost $/tCO2e -30

Page 62
Table 30: Rooftop Solar PV Projects (Multiple Buildings), Manipur 147. The investment project will be implemented by MANIREDA, in coordination with the Department of
Environment in Manipur. The Solar Energy Corporation of India has expressed its interest in implementing this project. It is expected SECI will bring in the investment in this project along with some other local public/private financing institutions. Both MNRE funds and State Government contributions can be utilized in implementing the project. The project will also collaborate with local solar technology manufacturers
State Level Abatement Potential from Implementation of Rooftop Solar PV Projects 148. The state level abatement potential from the implementation of Rooftop solar PV projects in
Government buildings is very high. The assistance using the GEF grant is expected to build state capacity to scale-up the implementation of solar roof-top projects in Government buildings in all the major cities in the state. The GEF project will ensure that long term relationship between the state agencies and the SECI are established and the implementation mechanism developed under the project is replicated in other cities in the state. The GEF interventions will ensure the successful implementation of solar roof top projects in all the 21 buildings situated across the state.
Investment Project 8: EE Street Lighting Project 149. An EE street lighting investment project is planned in Imphal East District from Palace Gate to DC
Office and JNIMS. The current inefficient street lights will be replaced by 90 W efficient LED street lights. An annual energy savings of 260,172 kWh is estimated which will result in GHG abatement of 6,088 tCO2e by 2030.
Table 31: EE Street Lighting Project (Imphal), Manipur
150. The investment project will be implemented by MANIREDA, in coordination with the Department of
Urban Development and Department of Environment in Manipur. EESL has indicated its interest in the implementing this project based on its annuity based deemed saving energy performance contracting approach. EESL has been implementing similar types of projects in other regions of the country based on this approach for LED based street lighting projects. It is expected EESL will bring in the investment in this project along with some other local public/private financing institutions. Both BEE funds and State Government contributions can be utilized in implementing the project.
State Level Abatement Potential from Implementation of LED Street Lighting Projects 151. The state level abatement potential from the implementation of LED street lighting projects is very high.
The assistance using the GEF grant is expected to build state capacity to scale-up the implementation of LED street lighting projects in all the municipalities in the state. The GEF project will ensure that long
Rooftop Solar PV Projects (Multiple Buildings)
Technology Solar Photovoltaic
Expected Annual Energy Savings (kWh) 17,520,000
Expected GHG Abatement (2030) tCO2e 409,968
Approximate Cost $/tCO2e -3.1
EE Street Lighting Project (Imphal)
Technology LED
Expected Annual Energy Savings (kWh) 260,172
Expected GHG Abatement (2030) MtCO2e
6,088
Approximate Cost $/tCO2e 0.63

Page 63
term relationship between the state agencies and the EESL are established and the implementation mechanism developed under the project is replicated in other cities in the state.
152. As per MSPDCL there are 5,316 inefficient 250 W HPSV street lights that can be replaced with 90 W
efficient LED street lights. An annual energy savings of 3,414,998 kWh is estimated which will result in GHG abatement of 79,911 tCO2e by 2030.
Table 32: Abatement Potential – State Level EE Street Lighting Projects, Manipur
Investment Project 9: Energy Efficiency Improvements in Government Buildings, Manipur 153: Energy Efficiency improvements are planned at PWD Building in Imphal. The investment project will
retrofit all the conventional lights to EE LED lights. The estimated annual energy savings for the investment project is 125,226 kWh and the GHG abatement potential till 2030 is 2,930 tCO2e.
Table 33: Building Energy Efficiency PWD Building, Imphal, Manipur
154. The investment project will be implemented by MANIREDA, in coordination with the Department of Urban Development and Department of Environment in Manipur and Department of Power, Government of Manipur. EESL has indicated its interest in the implementing this project. It is expected that the EESL will bring in the investment for this project along with some other local public/private financing institutions. Both BEE funds and State Government contributions can be utilized in implementing the project. The project will also collaborate with local lighting solution provider. The investment project will be undertaken based on a suitable energy saving performance contracting approach. The project will also explore possibilities of securing green rating for the building, through the Indian Green Building Council and other rating tools in the country.
State Level Abatement Potential from Implementation of EE Improvement Projects in Government Buildings 155. The state level abatement potential from the implementation of EE improvement projects in
Government buildings is very high. The assistance using the GEF grant is expected to build state capacity to scale-up the implementation of EE improvement projects in Government buildings in all the major cities in the state. The GEF project will ensure that long term relationship between the state agencies and the EESL are established and the implementation mechanism developed under the project is replicated in other cities in the state.
156. There are 21 government buildings in where energy efficiency improvements can be taken up. The investment project will include retrofitting conventional lights with EE LED lights. The estimated annual energy savings from this activity is estimated to be 2,629,757 kWh and the GHG abatement potential till 2030 is 61,536 tCO2e.
EE Street Lighting Projects, Manipur
Technology LED
Expected Annual Energy Savings (kWh) 3,414,998
Expected GHG Abatement (2030) MtCO2e 79,911
Approximate Cost $/tCO2e 1.1
Building Energy Efficiency (PWD Building)
Technology LED Lights
Expected Annual Energy Savings (kWh) 125,226
Expected GHG Abatement (2030) tCO2e 2,930
Approximate Cost $/tCO2e -5.32

Page 64
Table 34: Abatement Potential – State Level Building Energy Efficiency Projects, Manipur
3. BARRIER ANALYSIS
157. MNRE (the Ministry of New and Renewable Energy) is the nodal Ministry of the Government of India for all matters relating to new and renewable energy. MNRE provides considerable funding and other support for all forms of new and renewable energy in India. MNRE funding and support programmes are generally delivered through related state nodal agencies, who also often add further state-level support and funding mechanisms of their own to the MNRE funding and support programmes. MNRE currently operates “Grid Connected Power”, “Decentralised Systems” and “Off-Grid Power” programmes.
158. At the sub-national level, state governments are responsible for developing state-specific action
programmes for the power, transport, industry, buildings, and municipal energy efficiency and forestry sectors in line with NAPCC. There is a need to have greater synergy between national priorities and state-specific strategies, as it requires actions in several sectors that are State subjects and have to be implemented in the States. In the preparation of SAPCCs, the required inventory for these sectors is sourced from the national inventory management system (NIMS) that was established as part of the National Communication process; inventory estimation and management are not part of the SAPCC preparation process. The Government of India will provide some financial support to state governments for the implementation of their SAPCCs.
159. However, moving from development of a plan/strategy to implementation is a challenge for state
governments generally, and for Jharkhand and Manipur specifically, because of a number of barriers: limited institutional capacities, the absence of synergies between policies and incentive structures and limited technical capabilities to design relevant programs and catalyse private sector investments. In Jharkhand and Manipur, implementation of the SAPCCs has not yet started. Effective implementation of the SAPCCs is important and delays can jeopardise the achievement of NAPCC goals. Considering the growth of solar installations in the country and reduction of prices of this new technology that has progressing fast to achieve grid parity, MNRE is now considering reduction of financial assistance of projects that it offers as subsidy before withdrawing it completely within a time period. Therefore, it has become an important task for developmental organizations to set up suitable investment projects at this stage in the States and regions where the technology has not been explicitly demonstrated with its inherent strength. A well-managed successful project in this potential area will open the possibility of replication.
160. The key RE/EE and SAPCC major barriers that this project will address are presented in Table 35
below. Table 35: Barrier Analysis
Major Barriers Analysis Awareness and capacity development for implementation of SAPCCs
A key barrier to implementation of the SAPCC at the state level is very limited awareness and capacity of state level institutions, stakeholders on issues related to climate change mitigation. The limited know-how and shortage of relevant experts and manpower is proving to be a major hindrance to implementation of SAPCC. This in turn is due to several other sub-barriers further mounting this pressure. These include:
Building Energy Efficiency Projects in Manipur
Technology LED Lights
Expected Annual Energy Savings (kWh) 2,629,757
Expected GHG Abatement (2030) tCO2e 61,536
Approximate Cost $/tCO2e -5.3

Page 65
The role of stakeholders in the implementation of SAPCCs is
not clearly defined. Further, when it comes to the capacity of Stakeholders in terms of implementation, monitoring, and
reporting, they30 have limited awareness and understanding of climate change mitigation technologies (both RE and EE), including associated cost-benefits (both technical and economic feasibility).This is posing a major barrier for the effective implementation of climate change mitigation measures at the state level. There is very limited understanding of cost-effectiveness of RE and EE interventions in the local context, at the state level. This lack of understanding often renders these interventions as reductant and reduces uptake.
There is no appropriate institutional and incentive policy framework for adoption of climate change mitigation technologies and strategies. This is further exacerbated by conflicting state priorities, weak cohesion between institutional and incentive structures for adoption of climate change mitigation technologies and actions, and no cross-learning between centre and states or for cross-sectoral collaboration and coordination.
There are no formal platforms for engagement of the state governments with the private sector to consider information exchange and implementing PPP models for the rollout of identified RE and EE interventions. Existing ESCOs are trying different models for implementation of EE in various sectors in the states, but the business operations are simply not sustainable without external funding support. Overall, there is a limited engagement and participation of the private sector mainly because of these risks.
Framework for the implementation of SAPCCs at state level
SAPCC are a wish list of activities for most states, likely to be undertaken by the state for climate change adaptation and mitigation. In the states of Jharkhand and Manipur as well, SAPCC are standalone documents independent of state development plans. The states also lack an implementation strategy or framework for SAPCC. This is rather independent approach towards SAPCC has made implementation a challenge. This has been aggravated by:
GHG abatement cost curves are not established at the state level for different states in India. This process is not even foreseen in the near future. Without proper data obtained through energy audits, GHG abatement cost curves cannot be simply established. Without this analysis, cost-effective interventions in EE and RE can’t be selected and prioritised by the states and project developers.
Apart from this, there are limited number of technical staff at state nodal agencies such as Jharkhand Renewable Energy Development Agency and Manipur Renewable Energy Development Agency, to implement RE and EE solutions and later monitor progress. The staff is pressed for time for more urgent needs and not particularly focussing on SAPCC priorities.
30 Including government departments (notably the Pollution Control Boards, Department of Environment, Commerce and Industry (State), Power, Energy, Industries, Transports etc.), public enterprises, districts and local bodies such as Zilla Panchayats.

Page 66
Limited capacities of the states to replicate and scale-up established models of climate change mitigation technologies (e.g. linking with the Indian Renewable Energy Certificate (REC) market mechanism).
Very few EE and RE technology suppliers and equipment manufacturers are present in the state and others are not aware of the potential for RE and EE in the states. This posed a major implementation barrier for SAPCC. In wake of lack of any implementation framework, this is further aggravated and discourages the suppliers and equipment manufacturers to come to the states.
Investments for the implementation of RE and EE projects
There is limited capacity of state-level institutions to integrate and link climate change considerations within their programmes and state budgets (e.g. creating state clean energy funds for deployment of low-carbon technologies, providing soft loans routed through public banks, etc.). Because of this, states are missing the opportunity of economic planning and programmes at the sub-national level (e.g., building energy security through available RE sources, low-carbon infrastructure in public lighting etc.). Financial institutions, especially at the sub-national level, have limited knowledge of proven climate change mitigation technologies and strategies.
Because of this missing link and high interest rate loans availability, private sector participation is quite limited in the design, implementation, monitoring, evaluation and review of interventions (e.g. very few Public-Private Partnership (PPP models/projects at state level in areas such as demand-side management in municipalities, etc.). Private investors are not confident about performance-based payments (preferential tariffs) especially the case of ESCOs for EE projects. States limited capacities are also hindering to replicate and scale-up proven models such as linking with the Indian Renewable Energy Certificate (REC) market mechanism.
Inadequate regulatory incentives to encourage private investment through suitable and affordable financing. According to the International Energy Agency, India spent more than US$ 40 billion31 subsidizing fossil-fuels in 2011, which amounted to 3.4% of GDP32. These subsidies are a huge burden on the government budget as they encourage wasteful energy consumption, deter investments in energy efficiency and infrastructure, and reduce incentives for renewable energy technologies.
4. KEY STAKEHOLDERS
161. The strong participation of a large number of stakeholders from central government, state governments, NGOs, financial institutions, industry, and academic institutions, equipment manufacturers and suppliers, energy service companies, international organizations and financial institutions is required for the project’s interventions in the RE and EE application area in India to be successful. A brief description and proposed role of the project’s key stakeholders is presented in Table 36 below.
31 Source: International Energy Agency (IEA). World Energy Outlook 2012-Energy Subsidies, IEA/OECD: Paris 32 Source: International Energy Agency (IEA). World Energy Outlook 2010. IEA/OECD: Paris.

Page 67
Table 36: Key stakeholders involved in the project
Stakeholder Role in Project Implementation Government – Central Level
Ministry of Environment, Forests and Climate Change (MoEFCC)
MoEFCC is the GEF focal point for GEF projects in India and thus will liaise with GEF and provide overall coordination of the project. It will act as the Coordination Unit for the implementation of this project.
Ministry of New and Renewable Energy (MNRE)
MNRE will provide inputs for the planning, design and implementation of the project activities and will assist the states in design and implementation of renewable energy programs and investment projects. MNRE support will reach the states through various national and state level schemes and the National Solar Mission (NSM). MNRE will also ensure that the Solar Energy Corporation of India (SECI) takes up the investment projects in the states of Jharkhand and Manipur.
Solar Energy Corporation of India (SECI)
Solar Energy Corporation of India (SECI) has been set up as a not-for-profit company under Section-25 of the Companies Act 1956 for implementation and facilitation of Solar Energy programs. SECI will assist the states in design and implementation of solar park and roof-top solar projects. It will also facilitate the implementation of activities under JNNSM and achieving the targets set therein for both Manipur and Jharkhand states.
Bureau of Energy Efficiency (BEE)
BEE is the nodal agency for the National Mission on Enhanced Energy Efficiency, under the aegis of the Ministry of Power. Consultations and coordination with BEE will provide inputs for planning, design and implementation of the projects for achieving improved energy performances in the two selected states.
Energy Efficiency Services Limited (EESL)
EESL is a Super ESCO and has been created to deliver the market-related actions of the NMEEE. It will work with both the selected states for the implementation of energy efficiency projects for Demand Side Measures including municipal, agriculture, public building, lighting etc. It will also assist in developing the market for other private ESCO’s and companies to promote energy efficiency, and can act as a resource centre in the field of Energy Efficiency and take up the activities of Capacity Building Training and other related activities.
Government – State Level Department of Environment, Manipur and Department of Forests and Environment, Jharkhand
These departments are the nodal agencies both for preparation and implementation of the SAPCC. They are the key stakeholders in the project for coordinating project implementation. They will be lead agencies for project implementation, coordination with other departments for implementation, project monitoring, oversee the accomplishment of project objectives and tasks, lead co-funding requirements, initiate policy actions on its own and through other departments, and facilitate coordination with other key stakeholders.
Jharkhand Renewable Energy Development Agency (JREDA) and Manipur Renewable Energy Development Agency (MANIREDA)
These are the state level agencies for the promotion and implementation of renewable energy and energy efficiency. They will play the key role in the implementation of investment projects with support from EESL and SECI and other stakeholders (public & private sector). These agencies will work very closely with the state nodal agency for SAPCC during the implementation phase of the project, and ensure coordination with other stakeholders.
State Electricity Regulatory Commissions (SERCs) and State electricity
The SERCs have the responsibility for determining electricity tariffs and for regulating power purchase and procurement processes within their state. SERCs will be key project partners as it is expected that tariff structures for grid electricity generation (through solar rooftop PV) would ideally be updated through project activities. The state electricity

Page 68
distribution companies
distribution companies will also be involved in providing needed electricity generation and consumption data for the project sites under the project.
Urban Local Bodies in Jharkhand and Manipur
ULBs will be engaged in implementing municipal EE projects under the project and will be involved in preparing the replication and scale up plan for the state.
Financial Institutions Financial institutions such as IREDA, State Bank of India, Union Bank of India, NABARD, Pvt Equity Funds etc.
Financial institutions (including public and private sector banks, venture capitalists, etc.) will be involved in project implementation through co-financing, and would be engaged in project progress and monitoring etc.
International Organization United Nations Development Programme (UNDP)
UNDP will serve as the GEF implementing agency for the proposed project and ensure that the project will deliver its objectives. It will carry out monitoring & evaluation, and facilitate the budgetary provisions.
Private sector enterprises involved in developing / delivering specific renewable energy/EE solutions
RE/EE equipment providers and manufacturers
RE and EE equipment providers like TATA BP Solar, Schneider, inverter/battery manufactures and manufacturers of EE equipment’s and lights will be involved in the project implementation for supplying the related equipment for the project.
CSO and NGOs Civil Society Organizations
CSOs will be involved in the project implementation as one of the stakeholders, to generate ownership among identified stakeholders for the implementation of selected RE and EE interventions.
Academic and Research Institutes Academic Institutions Their role in the project implementation is to provide expert opinion,
design of monitoring and reporting system for the implemented RE and EE interventions. These are expected to respond to the needs of the PMU

Page 69
PART B. PROJECT STRATEGY
5. PROJECT RATIONALE, DESIGN PRINCIPLES AND STRATEGIC
CONSIDERATIONS
5.1 Project Rationale and Design Principles
162. This project has been designed to showcase the implementation of SAPCCs in two selected Indian states, with a potential scope to extend its activities to other states if there is a strong interest.
163. The state governments are responsible for developing state-specific action programmes for the power,
transport, industry, buildings, and municipal energy efficiency and forestry sectors in line with NAPCC. There is a need to have greater synergy between national priorities and state-specific strategies, as it requires actions in several sectors that are State subjects and have to be implemented in the States. In the preparation of SAPCCs, the required inventory for these sectors is sourced from the national inventory management system (NIMS) that was established as part of the National Communication process; inventory estimation and management are not part of the SAPCC preparation process. The Government of India will provide some financial support to state governments for the implementation of their SAPCCs.
164. The Government of India realises the importance of SAPCC implementation and in this context is
seeking GEF support to remove barriers and quick start and showcase the actual implementation of selected high level priorities of SAPCCs in the states. With the objective of addressing the barriers to implementation of SAPCC, the proposed GEF project will also help revisit the existing regulatory and policy frameworks at the national and state levels, including the directives under the national Missions, to overcome any regulatory and policy relates hurdles for implementation of SAPCC.
165. Considering that the states require GEF support for removal of barriers to the effective implementation
of mitigation measures in energy efficiency and renewable energy sectors, the design team in consultation with MOEFCC, UNDP and State Governments have selected two states to demonstrate that how the mitigations measures can be implemented effectively in partnership with private sector, financing institutions, research institutions, international agencies, SERCs, ESCOs and local EE and RE experts.
166. The detailed selection process resulted in the selection of Jharkhand and Manipur as the states for
GEF project interventions with the consideration that moving from development of a plan/strategy to implementation is a challenge for both Jharkhand and Manipur state governments because of a number of barriers like (a) limited awareness and capacities across institutions at various levels, (b) absence of framework for the implementation of SAPCCs at state level, and (c) lack of conducive environment for investments in the implementation of RE and EE projects. In Jharkhand and Manipur, implementation of the SAPCCs has not yet started. Effective implementation of the SAPCCs is important and delays can jeopardize the achievement of NAPCC goals.
167. The proposed project will support the implementation of SAPCC strategies in Jharkhand and Manipur.
These two states are among the most vulnerable states in India. They have been selected as pilot states in the proposed project so as to (a) build on their approved SAPCCs, which are now ready for implementation, (b) achieve geographical balance in project coverage, and (c) cover diverse climatic conditions, so as to link diverse aspects and cross-learning between neighbouring states. The two states also represent different techno-economic profiles in terms of technology cost, availability and energy mix. The collective indicative budget of the SAPCCs of the two state governments of Jharkhand and Manipur amounts to US$ 1,183 million (INR 7,093.35 Crores).
168. This project will involve working with a carefully chosen set of renewable energy and energy efficiency
actions under the purview of the SAPCC for identified investment projects, which showcase large potential for energy savings and emission reduction in the states. The selected RE and EE actions will be developed into carefully integrated solutions and then demonstrated, replicated and scaled up. Further extensive scale-up actions will continue after the project’s end with the help of a robust

Page 70
monitoring, reporting and verification framework (to be established by the project) that will help the states take stock of its mitigation action, report results and verify in way to compare projects and share lessons and learnings with other states.
169. The Government of India realizes the importance of SAPCC implementation and in this context seeks
GEF support to quick start and showcase the actual implementation, select high level priorities of SAPCCs in two states, Jharkhand and Manipur. The proposed GEF project will help revisit the existing regulatory and policy frameworks at the national and state levels, including the directives under the national Missions. To achieve the holistic approach envisaged in the NAPCC, it is important to showcase the inter-linkages between the power, transport, industry, municipal energy efficiency and buildings sectors.
170. In this regard, select strategies to build energy security through renewable energy and energy
efficiency of the states will play an instrumental role in development of the state. The Government of India’s ongoing flagship initiatives on renewable energy is large scale solar deployment scheme (Solar Mission) and energy efficiency programs initiated under NMEEE and by the EESL is Perform Achieve and Trade (PAT) scheme through cap and trade mechanism, they will be given particular prominence under the proposed project.
171. The proposed project will help prepare the ground for design and implementation of large-scale energy
efficiency projects at the state level with the help of EESL by demonstrating the effectiveness of energy efficiency measures that target municipalities and other sectors. The scope of complementary regulatory instruments, such as performance-based payments, capital subsidies, soft loans, etc. for renewable energy and energy efficiency will also be explored in the project.
172. Both Jharkhand and Manipur are endowed with good solar energy potentials of more than 5.0-5.5
kWh/m2/day and 4.5 kWh/m2/per day, respectively. It is estimated that 10% of the solar energy potentials of these 2 states can be productively utilized. At the current moment, state governments have allocated lands to private investors for the development of solar PV farms without proper due diligence. But private investors are facing challenges in terms of technical and financial feasibility studies and closure of project financials. The proposed project will therefore provide investment support for technical and financial feasibility. The project will help the states in establishing partnership with SECI as it is mandated to implement large-scale solar energy projects with the help of state agencies.
173. Further, the project will identify potential private investors, involve them in project development through
appropriate PPP arrangements, will ensure projects receive benefits from existing fiscal instruments, and will explore mechanisms to combine and sequence funds at the state level and leverage private sector investment. For large-scale grid-connected solar PV systems, the project will facilitate the installation of 10-12 MW of solar PV in the two target states through support to on-grid solar PV farms, each with a capacity of 2 MW or greater. The project will also include de-risking of public and private investments in large-scale solar PV (over 2 MW). For municipal energy efficiency, the proposed project will help state governments to identify appropriate technology, fiscal instruments and market mechanisms to leverage public and private finance in the area of municipal street lighting and municipal water pumping.
174. In India monitoring such efforts and its effects is a difficult task in absence of uniform Monitoring,
Reporting and Verification (MRV) system, and most international/ private funding recommends the use of such systems. Therefore, the proposed project will develop and implement MRV system for the two states, to measure, monitor and report state level actions and its impact. An MRV system that captures both implementation efforts and effects, would act as a useful tool for the Government to track progress and identify need for international support. The framework will include a verification mechanism that will ensure that all data and information pertaining to actions (under renewable energy and energy efficiency) performance indicator are measurable, comparable and can be applied to set of mitigation actions. A robust domestic MRV system would also foster confidence and impart greater credibility to our financing needs through NAMA or any other similar mechanism. However, the states will be responsible for monitoring and verifying the interventions in line with a common protocol, the proposed project will develop methodologies for measuring, monitoring, and reporting the actions taken by the states. This can provide inputs to other Indian states to adopt similar frameworks. The MRV framework

Page 71
will only be used for the proposed activities and this will not aid in assessing India’s progress on any voluntary/mandatory commitment to reduce emission intensity.
175. Though the two states selected under the GEF project have prepared and submitted their SAPCC’s in
2013, no real action had been undertaken ever since. SAPCC’s for the states presented more of a wish list of actions for climate change with no real prioritization or dovetailing of the SAPCC with other developmental plans in the states. SAPCC have more or less remained as standalone documents, being pursued in isolation by the nodal agencies. In addition, the states have several institutional and capacity barriers, as highlighted in the earlier sections, which have prevented implementation on the plans for this long. The current GEF project will be very timely in helping the selected states in kick starting the SAPCC implementation process. The project by prioritizing the RE and EE actions in the SAPCC will help steam line the SAPCC wish list in terms of what is doable in the immediate short term, medium term or long term. By engaging different state level stakeholders in implementation, the GEF project will also help in aligning the states climate change mitigation ambitions with other developmental efforts. The GEF project will also assist in building institutional capacities across state government departments for designing and implementing climate change mitigation actions, which otherwise would have not been prioritized. Additionally, few states in the country have started the implementation of their SAPCCs, though the results are yet to be seen. By the time, this current project is ready to be initiated and implemented there would be some learning available from other states experience from implementing some actions of the SAPCC. This project will take a stock of these lessons when it comes to the implementation.
Strategic Considerations and Consistency with UNDP Programme 176. The overall strategy for the project is to create an enabling environment for effective implementation
of state action plan on climate change. The project activities will greatly assist the Government of India in the implementation of the National Solar Mission and National Mission on Enhanced Energy Efficiency. As mentioned earlier, UNDP operations in India fall under the “Country Programme Action Plan” (CPAP) 2013 – 2017 agreed between the GOI and UNDP. Under the Sustainable Development Outcome of the CPAC 2013 - 2017, UNDP’s objective in this area is to expand access to clean energy and help build the capacity of communities to manage natural resources and withstand climate change and disasters. With respective state governments, UNDP will also support formulation of policy frameworks and help to address barriers to expanding and scaling up of RE and EE technologies in the state. Support will be provided to set up investment projects that promote entrepreneur-based business and delivery models that can be further scaled up. UNDP will help to strengthen the capacities of state departments to deploy new technologies, and monitor, report and verify results and of market-based service providers to adapt and maintain technologies.
177. The India GEF SAPCC project is fully aligned with the India UN Development Action Framework
(UNDAF) 2013-2017, which defines its sixth (Sustainable Development) outcome as “Government, industry and other relevant stakeholders actively promote more environmentally sustainable development and “It will also focus on clean energy for productive uses”.
178. The UNDP-GEF SAPCC project is closely linked to the UNDP Strategic Plan 2014-17 with its emphasis
on fostering supporting Sustainable Development Pathways as one of its three key focus areas. Energy, and in this case RE and EE, is clearly then linked to UNDP’s core mandate for 2014-17. UNDP has a specific focus on policy, legal and regulatory frameworks as well as institutional capacities that can lower investment risks, broaden and deepen markets, and strengthen private- and public-sector capacities to expand investment and increase access to sustainable energy at the national and sub-national levels to create better conditions to find and scale-up inclusive market-based solutions to achieving clean energy access, especially to off-grid sources of renewable energy.
6. POLICY CONFORMITY AND COUNTRY OWNERSHIP
6.1 Policy Conformity

Page 72
179. The India GEF SAPCC project fully conforms to the GEF-5 climate change mitigation focal area strategic objective, CCM-2 (promote market transformation for energy efficiency in major sectors) and CCM-3 (promote investment in renewable energy technologies).
180. In addition the project conforms to the following key policy, Acts, Regulations, Missions and
Programs. Renewable Energy
181. A wide range of Government of India (GoI) policies and schemes33 have sought to support the expansion of renewable energy, as follows:
Electricity Act 2003: came into force in June 2003, with the key aim of consolidating laws relating to generation, transmission, distribution, trading and use of electricity; and to reform legislation by “promotion of efficient and environmentally benign policies”. Mandates that each State Electricity Regulatory Commission (SERC) must establish minimum renewable power purchases; allow the Central Electricity Regulatory Commission (CERC) to set a preferential tariff for electricity generated from renewable energy technologies; and provides open access of the electricity transmission and distribution system to licensed renewable power generators.
National Electricity Policy 2005: Allows SERCs to establish preferential tariffs for electricity generated from renewable sources.
National Tariff Policy 2006: Mandates that each SERC must specify a RPO with distribution companies in a time-bound manner with purchases to be made through a competitive bidding process.
Rajiv Gandhi Grameen Vidyutikaran Yojana (RGGVY) 2005: Supports extension of electricity to all rural and below poverty line (BPL) households through a 90% subsidy of capital equipment costs for renewable and non-renewable energy systems.
Twelfth Five Year Plan (2012-2017): the 11th Five Year Plan (FYP) established a target that 10% of power generating capacity should be based on renewable sources by 2012 (a goal that has already been reached); it also supported the phasing out of investment-related subsidies in favour of performance-oriented incentives. GOI set up a goal of renewable energy capacity addition to 29.8 GW for the 12th Year Plan (2012-2017). This meant that taking RE total capacity almost to the 55 GW by the end of 2017. This includes 15 GW of wind, 10 GW of solar; 2.7 GW of biomass and 2.1 GW of small hydro. Investment in RE is expected to almost quadruple to INR 3,186 billion in the 12 FYP from INR 892 in the 11th FYP.
Jawarharlal Nehru National Solar Mission has a target for the deployment of 20,000 MW of solar power, 20 million m2 of solar thermal collector area and 20 million solar lighting systems by 2022. The Mission has adopted a 3-phased approach (Table 38), at the end of each plan, and mid-term during the 12th and 13th Plans, there will be an evaluation of progress and a review of capacity and targets for subsequent phases – to be based on emerging cost and technology trends, both domestic and global.
Energy Efficiency
182. In the last decade, the GOI has developed and implemented several policy and institutional initiatives to encourage adoption of EE in the country. These include enacting laws and amendments to legislations, announcing the NAPCC and the NMEEE, and developing green rating systems. All of these
33 Indian Renewable Energy Status Report. Background paper for DIREC 2010. NREL/TP-6A20-48948 October 2010

Page 73
initiatives are aimed at achieving EE potential of the country. Some of the key GOI policies and regulations for EE include (a snapshot of these is presented in Figure 5 above):
The Energy Conservation Act, 2001: was enacted in October 2001 (effective from March 1, 2002). The EC Act requires large energy consumers to adhere to energy consumption norms, and also directs new buildings to follow an Energy Conservation Building Code (ECBC). Electrical appliances need to meet minimum energy performance standards (MEPS) and display energy consumption labels. The EC Act, 2001 led to the formation of the BEE under the MOP, as a statutory body entrusted with regulatory powers for enforcement of various recommendation of the Act.
The Energy Conservation Building Code (ECBC): The ECBC was launched by the MOP in May 2007 as a first step towards promoting EE in the country's building sector. ECBC not only addresses the design of new, large commercial buildings, but also aims at optimizing the buildings' energy demand based on their location in different climatic zones of India. It sets minimum EE standards for design and construction. Nearly 100 buildings across the country are already following this code. Compliance with ECBC has been incorporated into the mandatory Environmental Impact Assessment (EIA) requirements for large buildings. While ECBC norms started as a voluntary initiative, a few states have already made it mandatory and several others are in the process of doing the same. In addition, last few years have also seen development of green building rating tools in the country, which provide green building certifications to new and retrofit building construction. The BEE developed a rating system based on the “Star Labelling Program”. It is meant for use in the Business Process Outsourcing (BPO) and office buildings; but does not apply to residential buildings. However, BEE is now working on benchmarking standards for residential buildings. In addition, the Indian Green Building Council (IGBC) and The Energy and Resources Institute (TERI) have introduced green building rating systems, which have been designed keeping in mind the Indian building requirements and the different climatic zones of the country.
The Electricity Act, 2003: The Act mandates efficiency in all aspects of power sector -- generation, transmission and distribution of electricity. In 2005, under Section 3(1) of this Act, the central government notified the National Electricity Policy (NEP) for the development of country's power sector based on optimal utilization of resources. NEP puts additional emphasis on higher efficiency levels of power generating plants, stringent measures against electricity theft, promoting energy conservation measures, and boosting renewable energy sources. NEP has accorded high priority to demand-side management (DSM) and has made periodic energy audits compulsory for energy intensive industries. The focus is also on labelling of appliances and high efficiency pumps in agriculture. NEP has also made suggestions for load management and differential tariffs and emphasized encouraging and promoting ESCOs. These initiatives are being implemented by BEE.
6.2 Country Eligibility 183. India ratified the United Nations Framework Convention on Climate Change (UNFCCC) on 01
November 1993. India has submitted its Second National Communications Report to UNFCCC on 04 May 2012 (see http://unfccc.int/resource/docs/natc/indnc2.pdf).
6.3 Country Drivenness 184. India has been at the forefront of the fight to combat climate change. In addition to its international
commitments and actions, India has been very pro-active in driving the country towards combating climate change, nationally. The launch of the NAPCC in 2008 showcased India’s commitment to actions to counter climate change. Soon after, India adopted a decentralized approach to managing its action towards climate change by asking the state governments to prepare their own SAPCCs consistent with the NAPCC strategies.
185. The NAPCC and the SAPCCs have at their core, the missions to promote renewable energy (the solar
mission) and enhance energy efficiency in the country (NMEEE). The National and State level missions

Page 74
on RE and EE had only gone further and firmed up India’s efforts of all these years to promote RE and EE through policy, regulatory and legal support. As have been described in the earlier sections, India has been proactive in promoting the RE sector and has been aggressively working towards creating conducive policy environment for promotion of RE. GOI has also designed various financial instruments and initiatives to engage private industry to participate in this renewable energy promotion and implementation. These initiatives include:
Tax incentives: income tax exemptions, accelerated depreciation Feed-In Tariffs Renewable Energy Purchase Obligations and Renewable Energy Certificates Subsidies for grid connected RE, rural electrification programs, for biomass projects, solar
projects Generation based incentives for wind and solar projects
7. PROJECT OBJECTIVES, OUTCOMES AND OUTPUTS
7.1 Project Goal and Objective
186. The India SAPCC project goal is the reduction of GHG emissions achieved through implementation of RE and EE solutions at the state level as identified in the SAPCCs. This will be achieved by removal of the key barriers that prevent effective implementation of SAPCC, with focus on RE and EE actions. The project’s emission reduction estimates are quantified in Annexure D.
187. The project focus is on removal of barriers to effective implementation of RE and EE actions at the
state level. The project is based on the premise that existence of several technical, financial, policy, institutional and awareness and capacity building barriers have constrained the large scale implementation of RE and EE projects in the states. While project benefits are likely to be in the tangible form of reduction in GHG emissions and total energy saved from EE measures more significant albeit gradual and less tangible co-benefits will flow in terms of improved state capacities in implementing RE and EE measures and incorporation of climate change mitigation actions in state development plans and schemes.
7.2 Project components, outcomes, outputs and activities
188. The major project components and outcomes are presented below in Table 39.
Table 37: Project Components, Outcomes and Outputs
Project Component 1: Framework for the implementation of climate change mitigation options in the selected states SAPCCs
Outcome Outputs Outcome 1: Successful and sustainable implementation of priority CCM actions on energy generation and application of EE & RE technologies in the major energy end-use sectors in selected states
Output 1.1: Regularly updated GHG abatement cost curves at state level Output 1.2: Selected prioritized RE and EE actions listed in Manipur and Jharkhand Action Plans on Climate Change for implementation Output 1.3: Designed and implemented common monitoring, reporting, and verification (MRV) system for the selected RE and EE actions of the Manipur and Jharkhand APCC, in a way to feedback into the SAPCC process
Project Component 2: Catalyzing investments for implementation of selected RE and EE mitigation action
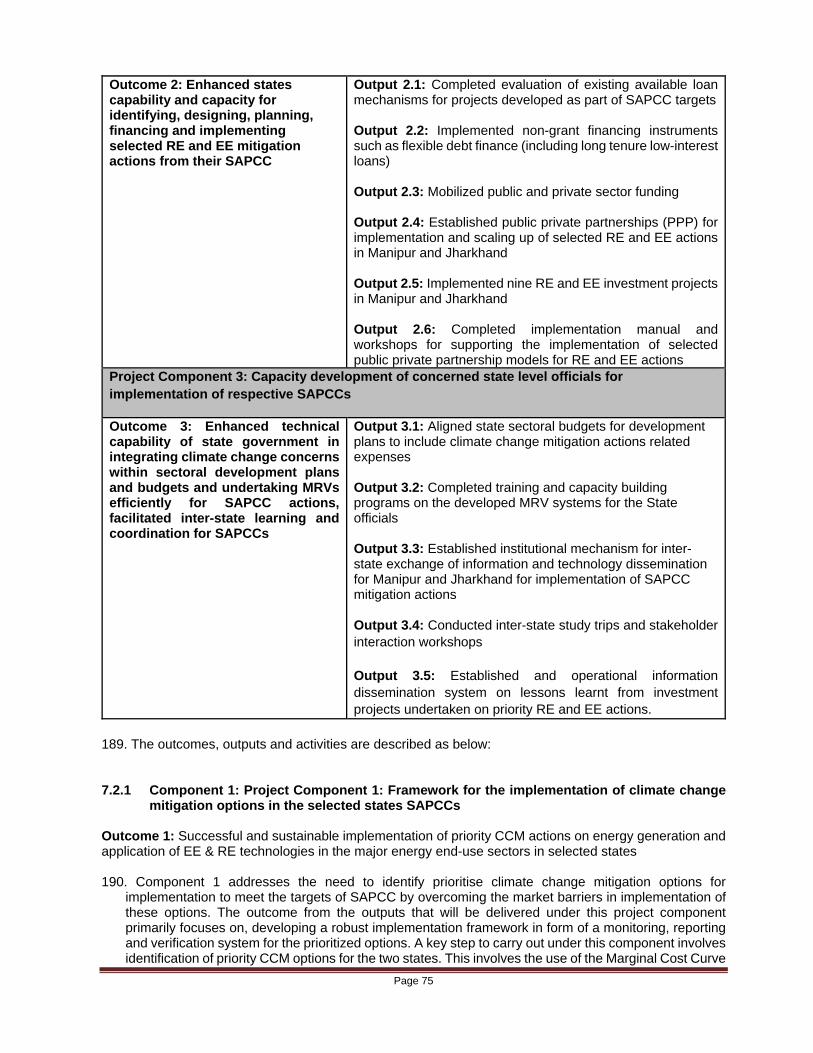
Page 75
Outcome 2: Enhanced states capability and capacity for identifying, designing, planning, financing and implementing selected RE and EE mitigation actions from their SAPCC
Output 2.1: Completed evaluation of existing available loan mechanisms for projects developed as part of SAPCC targets Output 2.2: Implemented non-grant financing instruments such as flexible debt finance (including long tenure low-interest loans) Output 2.3: Mobilized public and private sector funding Output 2.4: Established public private partnerships (PPP) for implementation and scaling up of selected RE and EE actions in Manipur and Jharkhand Output 2.5: Implemented nine RE and EE investment projects in Manipur and Jharkhand Output 2.6: Completed implementation manual and workshops for supporting the implementation of selected public private partnership models for RE and EE actions
Project Component 3: Capacity development of concerned state level officials for implementation of respective SAPCCs
Outcome 3: Enhanced technical capability of state government in integrating climate change concerns within sectoral development plans and budgets and undertaking MRVs efficiently for SAPCC actions, facilitated inter-state learning and coordination for SAPCCs
Output 3.1: Aligned state sectoral budgets for development plans to include climate change mitigation actions related expenses Output 3.2: Completed training and capacity building programs on the developed MRV systems for the State officials Output 3.3: Established institutional mechanism for inter-state exchange of information and technology dissemination for Manipur and Jharkhand for implementation of SAPCC mitigation actions Output 3.4: Conducted inter-state study trips and stakeholder interaction workshops Output 3.5: Established and operational information dissemination system on lessons learnt from investment projects undertaken on priority RE and EE actions.
189. The outcomes, outputs and activities are described as below: 7.2.1 Component 1: Project Component 1: Framework for the implementation of climate change
mitigation options in the selected states SAPCCs
Outcome 1: Successful and sustainable implementation of priority CCM actions on energy generation and application of EE & RE technologies in the major energy end-use sectors in selected states 190. Component 1 addresses the need to identify prioritise climate change mitigation options for
implementation to meet the targets of SAPCC by overcoming the market barriers in implementation of these options. The outcome from the outputs that will be delivered under this project component primarily focuses on, developing a robust implementation framework in form of a monitoring, reporting and verification system for the prioritized options. A key step to carry out under this component involves identification of priority CCM options for the two states. This involves the use of the Marginal Cost Curve

Page 76
analysis that was undertaken for SAPCC actions in the two states during the project design phase. Based on that analysis and stakeholder consultations (including pertinent state agencies), at least nine of such priority CCM options (5 in Manipur & 4 in Jharkhand) from the SAPCC were identified. These CCM options were identified by the states based on current gaps in the mitigation actions in the states, availability of financing, need to showcase technologies, which otherwise may not be implemented in a business as usual scenario. This further identifies the GHG abatement potential and those RE and EE actions that can be implemented during the 4 year duration of project implementation.
Table 38: Outputs and Activities Contributing to the Achievement of Outcome 1
Outputs Incremental Activities
Output 1.1: Regularly updated GHG abatement cost curves at state level
Activity 1.1.1: Create data templates for periodically updating abatement cost curves and institutionalize them within the state nodal agencies of Jharkhand and Manipur. Activity 1.1.2: Re-evaluate the abatement cost curves and update them with available improved data set as a result of project interventions.
Output 1.2: Selected prioritized RE and EE actions listed in Manipur and Jharkhand Action Plan on Climate Change for implementation
Activity 1.2.1: Re-validate the prioritized RE and EE actions from project design phase with concerned state departments in Jharkhand and Manipur Activity 1.2.2: Undertake detailed stakeholder analysis of all the concerned stakeholders likely to be associated with implementation of prioritized RE and EE actions Activity 1.2.3: Undertake meetings with concerned stakeholders identified in activity 1.2.2 related to prioritized RE and EE actions to ensure buy in.
Output 1.3: Designed and implemented common monitoring, reporting, and verification (MRV) system for the selected RE and EE actions of the Manipur and Jharkhand APCC, in a way to feedback into the SAPCC process
Activity 1.3.1: Set-up methodologies for monitoring (collection of all relevant data, sources and even models for projections) and identify performance indicators to measure progress in implementation of selected RE and EE actions Activity 1.3.2: Determine the appropriate roles and responsibilities for concerned agencies responsible for implementing EE and RE mitigation actions and establish the process for regular monitoring, reporting, and verification (MRV) of actions. Activity 1.3.3: Set-up and test, a data collection and data reporting system for the selected RE and EE actions Activity 1.3.4: Establish an institutional framework for implementation of the designed MRV framework
Output 1.1: Regularly updated GHG abatement cost curves at state level (GEF Grant US$ 252,000TA, Co-financing: MoEFCC US$ 1,049,063, UNDP US$ 41,667, Govt. of Jharkhand US$ 352,800, Govt. of Manipur US$ 448,812)

Page 77
191. Section 2.6 of the project document highlights the marginal abatement cost curve analysis undertaken
for the two states during the project design phase. The abatement cost curves analysis is a robust methodology for establishing the GHG abatement potential of mitigation actions. Thus, it is essential to keep updating the curves, as this will provide both a strong basis for selection of the mitigation actions as well as enable comparison between options at inter and intra state level. In order to ensure that, the abatement cost curves represent the exact situation in the two states, the first activity under the current project will be to re-evaluate the curves based on the availability of improved data set (any additional/revised data available between project design and implementation) and develop the formats/templates for data collection to update the MACCs for both the states (Activity 1.1.1 & 1.1.2). The updating exercise of the MACC curves will be done as soon as the project implementation starts. Data collection and preparation of data templates will be undertaken by the SPMU along with JREDA and MANIREDA. The project can also hire national consultants for this exercise. These activities are in addition to routine data analysis exercise that is undertaken by state nodal agencies towards climate change mitigation strategies. Development and updating of MACC would be an additional exercise, due to GEF interventions at the state level. This activity will create the needed value addition for a robust analysis on mitigation strategies for combating climate change at the state level, with a possibility of replication in other states as well. The updating activity of the cost curves should be undertaken as on periodic exercise and the project will create a basis for annual updating of the cost curves. The project will also institutionalize this activity within the JREDA and MANIREDA to ensure the activity is continued on an annual basis even after project completion.
Output 1.2: Selected prioritized RE and EE actions listed in Manipur and Jharkhand Action Plan on Climate Change for implementation (GEF Grant US$ 431,100 TA; Co-financing: MoEFCC US$ 1,049,062, UNDP US$ 41,667, Govt. of Jharkhand US$ 604,940, Govt. of Manipur US$ 769,570) 192. As described in section 2.3, a set of prioritized CCM actions from the SAPCC of the two states have
been identified during the project design phase. The identification of the priority CCM actions have been based on direct interactions with the selected states during the project design phase, and what has also worked in other states of India. This has been further supported by detailed marginal abatement actions, in order to select the most important mitigation options for the states. The second step in the implementation phase of the project will be to re-visit these prioritized CCM options to ensure that there has been no change in state priorities (Activity 1.2.1). The re-validation exercise during the implementation phase will be undertaken during the first quarter of the year 1 in close consultation with the State Nodal Agencies for the SAPCC. An exhaustive list of agencies/organizations likely to be involved in implementation of the project will be prepared and concerned officials identified (Activity 1.2.2). The State Nodal Agencies will also be encouraged to organize the meetings with concerned stakeholders to fix their roles and responsibilities and ensure the effective implementation of mitigation actions (Activity 1.2.3).
193. A detailed stakeholder list likely to be associated with the prioritized CCM options and their potential
role has been identified in the project design phase, included in this document. This list will be re-visited during the implementation phase to re-validate the stakeholders (Activity 1.2.2) and their specific roles. Detailed consultations will be undertaken with the identified stakeholders to ensure their buy-in and identify specific individuals within the organization, who will be responsible for execution of activities under the project. A meeting will also be undertaken in consultation with the state nodal agency for SAPCC, to kick-off the project in the state and bring all stakeholders together, highlighting their specific roles to each other and platforms of engagement and exchange of information during the course of the project (Activity 1.2.3).

Page 78
Output 1.3: Designed and implemented common monitoring, reporting, and verification (MRV) system for the selected RE and EE actions of the Manipur and Jharkhand SAPCC, in a way to provide feedback into the SAPCC process (GEF Grant US$ 529,600 TA; Co-financing: MoEFCC US$ 1,049,062, UNDP US$ 41,667, Govt. of Jharkhand US$ 741,440, Govt. of Manipur US$ 942,861) 194. A crucial aspect of this project is its ability to showcase actual implementation of SAPCC actions,
facilitate inter-state cooperation, exchange of information and cross learning. To ensure this, it is very important for the project to be able to monitor, report and verify the progress of the states against the identified CCM options in a way that there is proper documentation of information and that all activities are undertaken in line with the overall objectives of the SAPCC. In this regard, an important deliverable of the current project will be a robust Monitoring, Reporting and Verification framework for the two states, with potential application to other states. The framework will be developed in way that it captures both implementation efforts and effects, and would act as a useful tool for the Government to track progress as well as to identify need for national and international support. The framework will include a verification mechanism that will ensure that all data and information pertaining to actions (under renewable energy and energy efficiency) performance indicator are measurable, comparable and can be applied to the set of mitigation actions.
195. First step in designing this framework will be to identify concerned entities by Urban Local Bodies
(ULBs) and other state agencies responsible for implementing, measuring, reporting and verifying mitigation actions and determine the appropriate roles and responsibilities (Activity 1.3.2). This activity will be in line with Activity 1.2.1, to ensure consistency with engaged stakeholders in the project. This identification of concerned entities will also help in framing an institutional structure for implementation of the designed MRV framework (Activity 1.3.4). Design of such an institutional structure will be important to ensure continuity in state activities even after the completion of the current project, in a way that the designed MRV is institutionalized formally in the selected states climate change response mechanism.
196. In order to design methodologies and systems for the proposed MRV framework in the states, an
extensive review of MRV frameworks developed at sub-national level will be undertaken in the project implementation phase. Such review will consist of desk research and even consultation with some successful internationally applied MRV frameworks. Such a review will be important to ensure robustness of the framework design, also meeting international standards. Activity 1.3.1 will thus follow such a review and set-up methodologies for monitoring (collection of all relevant data, sources and even models for projections) and identify performance indicators to measure progress in implementation of selected RE and EE mitigation actions. Identification of the performance indicators will be undertaken based on the review of other MRV frameworks and also in consultation with the state agencies to ensure applicability of possible indicators in the Indian context.
197. Having identified the performance indicators, a data collection system for the selected RE and EE
mitigation actions will be designed (Activity 1.3.3) along with a reporting mechanism for data collated. The reporting mechanism will be supported by detailed report formats, templates and sourcing material. Whatever literature that will be referenced for the design of the framework will be made available to the state agencies for future referring and clarifications, if required. Appropriate verification system which is either, self-verification, intercity verification or third party verification will be designed. The verification system will be designed based on a suitable SWOT analysis of the verification options to suggest the most suitable one for the two states. All efforts will be made to design a MRV system for the two states which is one of its kinds in the country and could be potentially taken up by other states for application.
7.2.2 Project Component 2: Catalysing investments for implementation of selected RE and EE
mitigation action Outcome 2: Enhanced states capability and capacity for identifying, designing, planning, financing and implementing selected RE and EE actions from their SAPCC

Page 79
198. This outcome is to enable the selected states by the end of the project self-sufficient in terms of capacity
and capability in designing, planning, financing, implementing, monitoring RE and EE mitigation actions of SAPCC. By the end of the project, the state will have a well-defined state machinery (including new regulatory mechanisms or financial instruments) which is interwoven with the state’s current policies, mechanisms and development plans for the implementation of RE and EE mitigation actions.
Table 39: Outputs and Activities Contributing to the Achievement of Outcome 2
Output Incremental Activity
Output 2.1: Completed evaluation of existing available loan mechanisms for projects developed as part of SAPCC targets
Activity 2.1.1: Review available regulatory and financial tools (such as performance based contracts, capital subsidies, soft loans, risk insurance schemes and other non-grant financing instruments) for facilitating implementation of selected RE and EE mitigation action Activity 2.1.2: Undertake stakeholder consultation workshops for selecting the most suitable tools/financing mechanisms for Manipur and Jharkhand
Output 2.2: Implemented non-grant financing instruments such as flexible debt finance (including long tenure low-interest loans)
Activity 2.2.1: Design the selected tools/financial mechanisms (non-grant) in terms of procedures and protocols, institutional mechanism for application of the financial mechanisms for implementing the RE and EE actions Activity 2.2.2: Undertake training workshops for implementation of the designed tools (both loan mechanisms and non-grant instruments)
Output 2.3: Mobilized public and private sector funding
Activity 2.3.1: Identify funding sources for RE and EE mitigation actions, available at national and state level across government, private, multi/bi-lateral sources, based on innovative financing mechanisms designed in output 2.1 and 2.2.
Output 2.4: Established public private partnerships (PPP) for implementation and scaling up of selected RE and EE mitigation actions in Manipur and Jharkhand
Activity 2.4.1: Review, assess and shortlist available PPP based business models for implementing the selected RE and EE actions in both Jharkhand and Manipur states Activity 2.4.2: Estimate the likely funds flow for the selected actions Activity 2.4.3: Undertake meetings with select public and private sector funders to mobilize the funding for implementation of EE and RE mitigation actions
Output 2.5: Implemented nine RE and EE investment projects in Manipur and Jharkhand
Activity 2.5.1: Review the suitability of 9 investment project locations identified in project design phase in the two states Activity 2.5.2: Prepare detailed project reports/implementation plans for the finalized 9 investment projects. Activity 2.5.3: Identify and contract the implementing agencies and state coordinators for implementing the investment projects Activity 2.5.4: Prepare a framework for establishing a reliable baseline and the periodic monitoring and
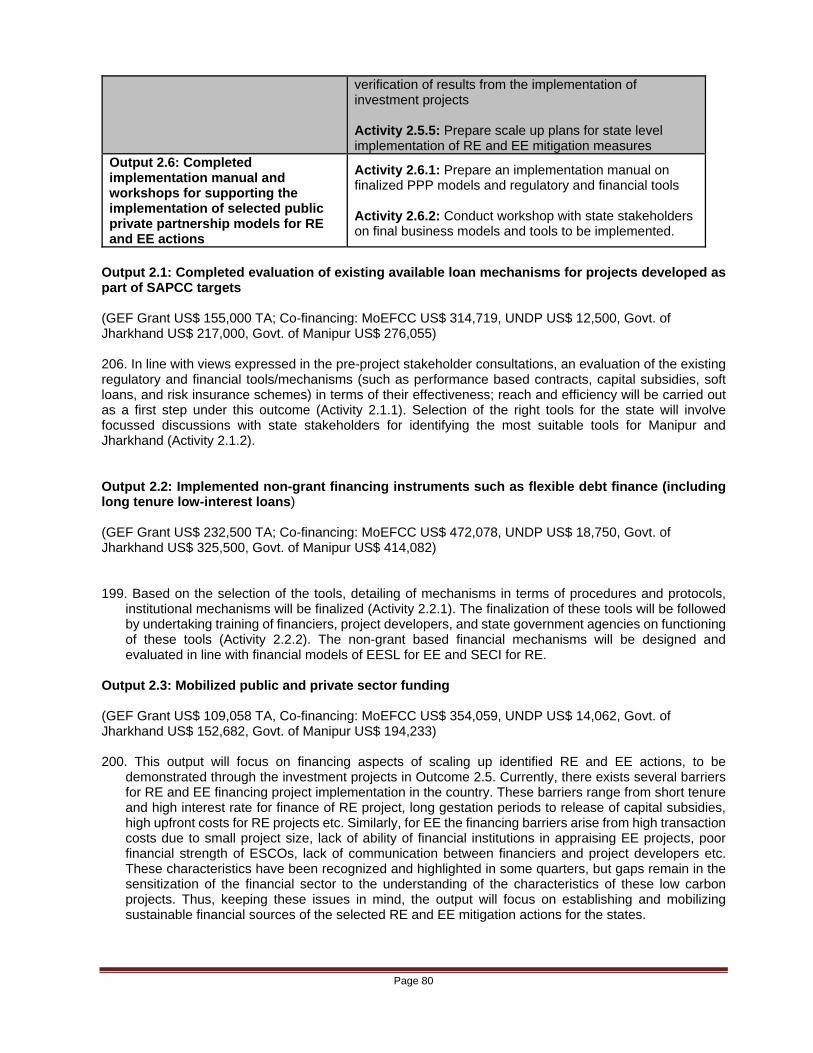
Page 80
verification of results from the implementation of investment projects Activity 2.5.5: Prepare scale up plans for state level implementation of RE and EE mitigation measures
Output 2.6: Completed implementation manual and workshops for supporting the implementation of selected public private partnership models for RE and EE actions
Activity 2.6.1: Prepare an implementation manual on finalized PPP models and regulatory and financial tools Activity 2.6.2: Conduct workshop with state stakeholders on final business models and tools to be implemented.
Output 2.1: Completed evaluation of existing available loan mechanisms for projects developed as part of SAPCC targets (GEF Grant US$ 155,000 TA; Co-financing: MoEFCC US$ 314,719, UNDP US$ 12,500, Govt. of Jharkhand US$ 217,000, Govt. of Manipur US$ 276,055) 206. In line with views expressed in the pre-project stakeholder consultations, an evaluation of the existing regulatory and financial tools/mechanisms (such as performance based contracts, capital subsidies, soft loans, and risk insurance schemes) in terms of their effectiveness; reach and efficiency will be carried out as a first step under this outcome (Activity 2.1.1). Selection of the right tools for the state will involve focussed discussions with state stakeholders for identifying the most suitable tools for Manipur and Jharkhand (Activity 2.1.2). Output 2.2: Implemented non-grant financing instruments such as flexible debt finance (including long tenure low-interest loans) (GEF Grant US$ 232,500 TA; Co-financing: MoEFCC US$ 472,078, UNDP US$ 18,750, Govt. of Jharkhand US$ 325,500, Govt. of Manipur US$ 414,082) 199. Based on the selection of the tools, detailing of mechanisms in terms of procedures and protocols,
institutional mechanisms will be finalized (Activity 2.2.1). The finalization of these tools will be followed by undertaking training of financiers, project developers, and state government agencies on functioning of these tools (Activity 2.2.2). The non-grant based financial mechanisms will be designed and evaluated in line with financial models of EESL for EE and SECI for RE.
Output 2.3: Mobilized public and private sector funding (GEF Grant US$ 109,058 TA, Co-financing: MoEFCC US$ 354,059, UNDP US$ 14,062, Govt. of Jharkhand US$ 152,682, Govt. of Manipur US$ 194,233) 200. This output will focus on financing aspects of scaling up identified RE and EE actions, to be
demonstrated through the investment projects in Outcome 2.5. Currently, there exists several barriers for RE and EE financing project implementation in the country. These barriers range from short tenure and high interest rate for finance of RE project, long gestation periods to release of capital subsidies, high upfront costs for RE projects etc. Similarly, for EE the financing barriers arise from high transaction costs due to small project size, lack of ability of financial institutions in appraising EE projects, poor financial strength of ESCOs, lack of communication between financiers and project developers etc. These characteristics have been recognized and highlighted in some quarters, but gaps remain in the sensitization of the financial sector to the understanding of the characteristics of these low carbon projects. Thus, keeping these issues in mind, the output will focus on establishing and mobilizing sustainable financial sources of the selected RE and EE mitigation actions for the states.

Page 81
201. The Project Management Unit (PMU) in consultation with Assigned State Agencies (ASAs) will review the available financing sources for the RE and EE actions. This review will consist of funding available from Centre and State budgets, international climate finance sources (in view of the upcoming Green Climate Fund), and domestic private sector funds both in form of debt from national/state level private banks, equity from private equity firms, venture capitalists, high net worth individuals etc. (Activity 2.3.1). Output 2.4: Established public private partnerships (PPP) for implementation and scaling up of selected RE and EE mitigation actions in Manipur and Jharkhand (GEF Grant US$ 133,294 TA; Co-financing: MoEFCC US$ 432,738, UNDP US$ 17,187, Govt. of Jharkhand US$ 186,611, Govt. of Manipur US$ 237,397) 202. In selecting the sources of funds, a review of the on-going financial mechanisms and sources of RE
and EE projects implemented in the past or currently being implemented will be undertaken, keeping in mind the new financing instruments designed in Output 2.1. Based on this review a shortlist of potential funders for the state will be identified and a dialogue will be initiated for ensuring financing through these sources (Activity 2.4.1). By the end of the output, a finalized list of financiers and funds contributed will be estimated (Activity 2.4.2).
203. One of the key objectives of the project is to promote and establish Public Private Partnership models
for implementation at state level. With the scale up and financing sources firmed, the project will design specific PPP based implementation models for scale up of RE and EE actions. The output will be achieved by first identifying public and private project implementers for RE and EE keen to work in the selected states (Activity 2.4.3). To be able to build state relevant and suitable PPP models of partnership a review will first have to be conducted of the available PPP models for RE and EE implementation both nationally and internationally (Activity 2.4.3). A comparative assessment of these PPP models based on specific criteria’s (to be developed working with the state stakeholders) will be undertaken to finalize the PPP models for implementation in the selected states (Activity 2.4.3).
Output 2.5: Implemented nine RE and EE mitigation action investment projects in Manipur and Jharkhand (GEF Grant US$ 347,900 Investment; Co-financing: MoEFCC US$ 786,805, UNDP US$ 31,250, Govt. of Jharkhand US$ 487,060, Govt. of Manipur US$ 619,610) 204. As described in section 2.4, a set of RE and EE investment projects have been identified during the
project design phase. The identification of the investment projects during the project design phase has been based on information collected through desk research, interactions with state agencies, financial institutions, energy service companies, technology suppliers and other stakeholders, and through site visits. The suitability of these RE and EE technologies, their demand and scale of deployment, and likely costs were estimated. A brief description of identified investment project options is available in Section 2.4. No field performance monitoring studies have been carried out during the project design phase and the analysis of technologies is based purely on secondary data. During year 1 and 2, a detailed assessment of the proposed investment projects will be carried out (Activity 2.5.1and 2.5.2).This assessment will also include collection of field performance data on the relevant investment projects. The assessment will take into account the technology development and, apart from monitoring and analysing technical performance of Investment projects, it will also cover cost-benefit analysis. The cost-benefit analysis will include analysis of investment required; operational costs; returns, payback period, etc. after the completion of the assessment the investment project locations will be finalized, along with involved agencies.
205. Having designed the 9 investment projects, the next activity will be focused on identifying and
contracting implementing agencies such as technology suppliers, energy service companies, vendors as well as state coordinating agencies. While this will be undertaken by the project developers in the two states, the current project will provide technical assistance in terms of facilitating the process of

Page 82
selection contracting agencies, reviewing the terms of reference of selection and matching the needs of the investment projects with the relevant agencies (Activity 2.5.3). Activity will be undertaken by the PMU at central and state level, in consultation with the identified state agencies responsible for specific investment projects. The state PMUs in consultation with responsible state agencies will also prepare detailed project reports and implementation plan for the investment projects (activity 2.5.4). The DPR’s will be prepared based on review of similar DPR’s prepared for other projects in other locations and states in India and tailored to meet the specific state needs. Contractual agreement for implementation of the investment projects will be finalized to implement the investment projects in the specified time (Activity 2.5.4).
206. The implementation of investment projects’ projects in the various investment projects locations will be
led by “Assigned State Agencies” (ASAs). ASA’s will be responsible for: consultations with target groups, identification of end-users, providing assistance in mobilizing /accessing financing, assistance in the identification of the most appropriate technology supplier, supervision of the implementation, training of end-users, providing handholding support post-installation, reporting and documenting the demonstration project progress, etc.
207. Concurrent to the implementation of the nine investment projects in the investment projects location,
the ASAs with the support from the state PMUs, will be documenting implementation activities (Activity 2.5.4) and undertaking assessment of investment projects and implementation mechanisms for replication and scale up (Activity 2.5.5)during the duration of the current project. The ASAs, and the PMU of the project working together will prepare district wise state-level sectoral replication plans and develop scale up plans for each sector and technology (Activity 2.5.5). The scale up plans will also be accompanied by detailed financial analysis to estimate the financing needs of the state level replication models. The Activities under output 2.1 is expected will be completed within Year 2 and 3 of the project.
Output 2.6: Completed implementation manual and workshops for supporting the implementation of selected public private partnership models for RE and EE actions (GEF Grant US$ 257,000 Investment; Co-financing: MoEFCC US$ 889,198, UNDP US$ 31,250, Govt. of Jharkhand US$ 359,800, Govt. of Manipur US$ 457,717) 208. In order to ensure proper documentation and smooth implementation of the newly formed PPP
implementation models and application of regulatory and financial tools, the project will draft an exhaustive implementation manual for operation of projects, which can be used by project developers, MANIREDA and JREDA, state municipalities, financiers, regulators etc. (Activity 2.6.1). The implementation manual so developed will also be presented to all stakeholders through workshops to seek feedback and incorporate comments from users of the Manual (Activity 2.6.2). The Manual will be developed in a way that it can be referred by any potential funders, project developers interested to work in the state for implementing selected RE and EE options.
7.2.3 Project Component 3: Capacity development of concerned state level officials for
implementation of respective SAPCCs
Outcome 3: Enhanced technical capability of state government in integrating climate change concerns within sectoral development plans and budgets and undertaking MRVs efficiently for SAPCC actions, facilitated inter-state learning and coordination for SAPCCs.
209. The project focuses on RE and EE CCM actions in way to overcome existing barriers to implementation
of these actions as specified in the SAPCCs. The investment projects referred to in Outcome 2 indicate the interventions that are seen as having a strong potential in addressing the energy deficit, emissions control and energy saving in the two states. While the investment projects may provide leads on the existing policy barriers / incentives for larger scale adoption of these actions, the state agencies themselves need to explicitly recognize the potential of these interventions. Work on the facilitation of the inclusion of these actions in appropriate policy statements / documents of the state development plans and budgets will be carried out. This project component thus focuses on building the capacity of

Page 83
state government in integrating these actions in the state functioning and also enabling them to effectively monitor and report and verify going forward.
Table 40: Outputs and Activities Contributing to the Achievement of Outcome 3
Outputs Incremental Activities
Output 3.1: Aligned state sectoral budgets for development plans to include climate change mitigation actions related expenses
Activity 3.1.1: Review the current state budgets for scope for climate change mitigation actions Activity 3.1.2: Conduct meetings with state officials seeking feedback on areas of alignment of the budget Activity 3.1.3: Draft a proposal for alignment of state budgets incorporating climate mitigation actions
Output 3.2: Completed training and capacity building programs on the developed MRV systems for the State officials
Activity 3.2.1: Prepare Handbook and Guidelines for implementation of the designed MRV systems in the two states Activity 3.2.2: Develop training curricula on the Handbook and Guidelines for the MRV system Activity 3.2.3: Undertake training sessions for state level project implementers, reviewers, auditors, state government officials. Activity 3.2.4: Conduct post-training evaluations to assess the effectiveness of the training program, and making of necessary revisions.
Output 3.3: Established institutional mechanism for inter-state exchange of information and technology dissemination for Manipur and Jharkhand for implementation of SAPCC mitigation actions
Activity 3.3.1: Review existing institutional mechanisms in place for promoting inter-state exchange of information and document key features Activity 3.3.2: Assist state governments in strengthening the existing institutional mechanisms for inter-state exchange of information
Output 3.4: Conducted inter-state study trips and stakeholder interaction workshops
Activity 3.4.1: Identify successful case examples and relevant upcoming workshops on RE and EE mitigation actions in other states and organize study trips to facilitate the interactions with other states Activity 3.4.2: Design and undertake at least two study trips and at least two stakeholder interaction workshops on RE and EE mitigation actions in the state.
Output 3.5: Established and operational information dissemination system on lessons learnt from investment projects undertaken on priority RE and EE mitigation actions
Activity 3.5.1: Design and implementation of a system of information dissemination through web portal of the state government on RE and EE mitigation investment projects in the state

Page 84
Activity 3.5.2: Prepare and publish in form of briefers, brochures, handbooks, case studies on the implemented RE and EE investment projects in the states. Activity 3.5.3: Formulate an information dissemination strategy (brochures, print ads, websites, TV documentary)
Output 3.1: Aligned state sectoral budgets for development plans to include climate change mitigation actions related expenses
(GEF Grant US$ 228,800 TA; Co-financing: MoEFCC US$ 729,191, UNDP US$ 25,000, Govt. of Jharkhand US$ 320,320, Govt. of Manipur US$ 407,493)
210. The project will work closely with the state relevant departments to first identify the areas of inclusion of CCM actions in state sectoral budgets and undertake detailed discussions on re-aligning the state budgets for incorporating CCM budgets (Activity 3.1.1 and 3.1.2). The project will develop a proposal for inclusion of CCM actions in mainstream budgeting of the state government in way it is interwoven with state sectoral development plans (Activity 3.1.3)
Output 3.2: Completed training and capacity building programs on the developed MRV systems for the State officials (GEF Grant US$ 329,400 TA; Co-financing: MoEFCC US$ 629,437, UNDP US$ 25,000, Govt. of Jharkhand US$ 461,160, Govt. of Manipur US$ 586,661)
211. Undertaking MRV for climate related actions is fairly a new concept at least at the sub-national level in India, thereby there will be a need for training and handholding programmes for state agencies on the newly designed MRV frameworks for the state (Output 1.2). Suitable sector-level institutions/ academic institutions (governmental or non-governmental) will be identified for the design and execution of such training and handholding programmes. These institutions will be given the task of preparing handbook and training curricula for the MRV systems (Activity 3.2.1 and 3.2.3). In order to ensure the smooth replication and post-project scale up activities, extensive training programmes based on the master training packages will be conducted for project implementers, reviewers, auditors, state government officials at district level (Activity 3.2.3). These training programmes will be conducted during Year 4 and in Year 5 for post-project scale up activities. In addition, as part of the project, post training evaluations will be undertaken to assess the effectiveness of the training program, and make necessary revisions during the course of the project for ease of implementation later (Activity 3.2.4). A careful approach will also be adopted while selecting the participants for training and capacity building to avoid extending the trainings to participants who are not going to be actively involved in project activities during the course of implementation of the project and even after the completion of project term (4-years).
Output 3.3: Established institutional mechanism for inter-state exchange of information and technology dissemination for Manipur and Jharkhand for implementation of SAPCC mitigation actions (GEF Grant US$ 136,800 TA; Co-financing: MoEFCC US$ 429,437, UNDP US$ 25,000, Govt. of Jharkhand US$ 191,520, Govt. of Manipur US$ 243,641)

Page 85
212. One of the key objectives of the project is to facilitate interstate learning, given the common mandate to all the states of implementation of SAPCC. In order facilitate this process; output will focus on building institutional mechanism for promoting inter-state exchange of information. To be able to suggest a most robust mechanism best suited to the needs of the Indian states, first a review of any existing institutional mechanisms in the country will be undertaken. This review will also be extended to experience from other countries in facilitating sub national government level cooperation and exchange of information (Activity 3.3.1). The project will also provide assistance to the two states in strengthening the institutional mechanisms for facilitating the exchange of information; particular emphasis will be given to energy departments in the two states (Activity 3.3.2).
Output 3.4: Conducted inter-state study trips and stakeholder interaction workshops (GEF Grant US$ 158,000 TA; Co-financing: MoEFCC US$ 529,400, UNDP US$ 25,000, Govt. of Jharkhand US$ 221,200, Govt. of Manipur US$ 281,398) 213. During the course of the project, since most of the investment projects selected in the two states are
overlapping. This provides an opportunity for a much focused interstate learning and cooperation. Thus under this output, the project will identify scope for specific learning areas in the two states, visit to the investment project locations in the two states to enable comparison as well as focused stakeholder interactions workshop to exchange learning’s during the study trips (Activity 3.4.1 and 3.4.2). The project will design and undertake at least two study trips and at least two stakeholder interaction workshops on RE and EE mitigation actions in the state (Activity 3.4.2). The study trips will be designed in way to enhance information sharing and actual site visits to relevant project locations.
Output 3.5: Established and operational information dissemination system on lessons learnt from investment projects undertaken on priority RE and EE mitigation actions (GEF Grant US$ 265,000 TA; Co-financing: MoEFCC US$ 727,307, UNDP US$ 25,000, Govt. of Jharkhand US$ 371,000, Govt. of Manipur US$ 471,965) 214. A key end result of the project will be a robust and effective system of information dissemination on
implementation of SAPCC, particularly the RE and EE mitigation activities which are the focus of the current project. To facilitate this project will design and implement a web portal on the state government initiatives on RE and EE (activity 3.5.1). Project will also prepare brochures, print ads, handbooks, case studies, TV documentaries, website, on implemented investment projects and also scaling up strategy for the project. It will ensure an effective strategy for information dissemination is embodied in the state infrastructure by the end of the project to ensure continuity even after project completion (activity 3.5.2 and 3.5.3).
7.3 Indicators
215. Overarching key indicators of the project’s (but not limited to) success are listed in text box below.
Box4: Key Indicators (Targets) to Measure the Progress
i. Cumulative CO2 emission reduced from start of project to End-Of-Project (EOP), (tCO2e)-
304,250 tCO2e ii. Total energy savings achieved from implemented mitigation actions by EOP – 190,452 MWh iii. Total renewable energy capacity installed in the states due to project interventions by EOP – 28
MW iv. Number of RE and EE projects implemented in the states by EOP - 9 v. Amount of funding mobilized for implementation of RE and EE projects by EOP – US$
12,000,000 vi. Number of projects replicated on the selected RE and EE actions (32) vii. No. of additional people employed in RE and EE projects by EOP (100)

Page 86
7.4 Risks 216. The project can be considered to be facing two categories of risks: external (political / policy / India /
international events/climate change related) and internal (risks that are inherent to the project implementation where the risk can be substantially controlled by the project’s management or in the project’s implementation).
217. The key external risks include:
a) Failure to secure the necessary effective ongoing policy, management or financial support from MoEFCC and state agencies, which will be the main project implementing agency and is the provider of most of the project’s co-financing – for example due to adverse impact changes in MoEFCC’s management, or from reduced MoEFCC funding.
b) Current levels of funding available to support the development and implementation of SAPCC at the central and state government level are reduced and hence there is less funding support available to be accessed by the project for the implementation of SAPCC aspects of project activities.
c) Implementation of SAPCC does not remain an important item on the relevant central and/or state political agendas.
d) Supporting RE and EE does not remain a high central or relevant state government priority. This is somewhat unlikely.
e) Civil, political or communal disorder or natural disasters (e.g. delayed or weak monsoon or other rains, cyclonic storms, disease outbreaks in monoculture crops, an outbreak of insect plagues like locusts, major outbreak of animal or human diseases, major forest fires, etc.) negatively impact on the project’s investment project locations.
f) There is a sustained reduction in the international oil price, or large subsidies are re-introduced and sustained for diesel used for captive power generation, or funds available for LPG subsidies is significantly increased, or the price of electricity for thermal sources falls – hence significantly undermining the economics of RE and EE for the concerned states.
g) Major adverse economic or political conditions significantly force up interest rates and/or curtail bank lending for a significant period in India during the project’s implementation, hence reducing the affordability of the bank loans or financial instruments that may be designed for implementation of RE and EE investment projects by project developers.
218. The internal risks include: a) The project is not able to find or to motivate additional RE technology and/or service providers to
enter the market and to grow their businesses in the concerned states.
b) The project is not able to get MoEFCC, MNRE, BEE, NSM, NMEEE and relevant state based agencies efforts to remain engaged or to effectively work together to support the growth of RE and EE for SAPCC.
c) The project is not able to mobilise the necessary financing from banks or microfinance institutions for the replication and scale up projects in the relevant RE and EE projects

Page 87
d) Project co-financers such as EESL, SECI and state governments are unable to keep to their commitments to financially support the project.
e) Relevant RE and EE investment projects are successfully demonstrated, but then do not get replicated for a variety of internal or external factors. This could lead to a negative circular effect in terms of credibility around the project.
f) There is a significantly slow start of on-the-ground project activities.
g) There is significant RE/EE technology underperformance or failure in project activities (technical risk).
h) There is a lack of necessary leadership and/or slow or low quality decision-making in the PMU.
i) There are significant delays in completing the recruitment process for SPMU and other India GEF SAPCC project consultancy assignments.
j) The project is unable to hire competent consultants in a timely fashion because of MoEFCC or UNDP administrative or management constraints in the process of selection and/or recruitment.
219. A detailed risk-analysis table is available in Annexure A. This also includes suggestions for countermeasures to deal with outlined risks to ensure successful implementation of this GEF project.
7.5 Assumptions 220. The assumption for the implementation of the project revolve around expectations from both the government and the market sides of RE and its use in rural livelihoods.
Continued support and participation from co-financing institutions, MoEFCC, MNRE, state nodal agencies, state renewable energy development agencies and other stakeholders
Selected end users and project implementers have sufficient financing and favourable regulatory and overall business environment
Enough technical and financial capacity is available in the state for implementation of projects
All state agencies are supportive of implementing the investment projects
Continued interest in the selected RE and EE mitigation actions by co-financing institutions
Freely available information on PPP based RE and EE business models
Interest of the state agencies in the adoption of MRV system and diligent data collection
Interested state agencies in both states for interstate exchange of information and technology
State nodal agencies continue to cooperate with SPMUs in the clearance of investment projects without delay.
8. COST-EFFECTIVENESS; GEF INCREMENTAL REASONING
221. To develop a conservative estimate of the probable “order-of-magnitude” estimate of GHG emission reductions that are attributable to the proposed project, it is considered that the main sources of direct lifetime GHG emission reductions are through catalysing investment activities: (a) Grid connected and off grid solar PV-based power generation; and (b) energy efficiency and energy conservation measures

Page 88
in municipalities like end-use efficiency of municipal street lighting and municipal water pumping. For energy efficiency interventions, the investment projects have been identified and the selection of technologies is also suggested. Although the selection of technologies and potential sites have been selected, final investment decision will be endorsed at the time of project implementation. The related emissions reductions are included in the analysis here, with the result that the estimates presented here can be considered conservative and may vary at the time of project implementation. The project is also expected to influence and catalyse wider adoption of improved EE and RE technologies, establishing commercial viability of technologies, improving access to finance and increasing investors’ interest. EE interventions in municipalities and RE interventions across the two target states, will result in energy savings of 866,051 MWh. Assuming the emission factor for Jharkhand as 1.68 tCO2/MWh and for Manipur as 1.56 tCO2/MWh and over a useful life of interventions across the two states, the potential GHG emission reductions achieved from EE and RE activities will be 1,382,906 tCO2.
222. GEF support is directed mainly towards identifying private investors, establishing PPPs, linking the
projects to access benefits from existing fiscal instruments, and explore mechanisms to combine and sequence funds at the state level and leverage private sector investment. Currently, in Jharkhand and Manipur, there is very limited participation of the private sector in implementing RE and EE projects. The current project, with GEF support, will play this incremental role of transforming the market by developing state specific PPP models, publically backed private financing leveraging financing mechanisms etc. In this way, states will be enabled to become fully capable of identifying, designing, planning, financing and implementing climate change mitigation interventions. GEF grant support is both in terms of TA (technical and financial feasibility studies and actions needed to integrate the developed MRV system) and incremental investment costs needed for the investment projects. It is estimated that the potential GHG emission reductions achieved from a capacity of 28 MW solar PV is about 986,973 tCO2 over its useful lifetime of the project, assuming a capacity factor of 20% and grid emission factor as 1.68 tCO2/MWh in Jharkhand and 1.56 tCO2/MWh in Manipur. Additionally, the selected investment projects under UNDP-GEF market transformation project for SAPCC are based on an in-depth and robust marginal abatement cost curve analysis. Through this method, the UNDP-GEF project has established and tested the cost effectiveness of the selected investment projects vis-à-vis their GHG emissions abatement potential. To generate the Marginal Abatement Cost Curves (MACC), the specific parameters have been analysed for determining the financial details of the abatement/mitigation projects and the expected volume of greenhouse gases to be abated over the projects’ lifetime. These parameters include: all the possible RE and EE measures in the states including the shortlisted interventions as per the SAPCCs; expected lifetime of the selected mitigation measures; total cost of each RE and EE project (both capital and ongoing operational expenses); expected savings to be delivered by the project over its useful lifetime; expected amount of electricity generated using RE sources over the project lifetime; expected volume of GHG emissions saved over the project lifetime, cost per unit of energy saved/generated and per tonne of CO2e abated, prioritized EE and RE measures for taking up the investment projects and state level interventions. The MACC analysis was built in into the project development strategy and regular updating of these curves at the state level is the foremost activity under the project strategy. Thus, this UNDP-GEF MACC not only makes the selection of investment projects robust but on a long term basis will assist the decision makers and implementers to focus on RE/EE measures and low carbon development strategies best suited for a particular state.
223. Without GEF support, the mitigation actions identified in the SAPCC will not be implemented. In that
scenario, the monetary benefits associated with avoided use of fossil fuel and reduced emissions would not be realized. States have an obligation to take action to successfully implement their SAPCCs in order to realise the goals of NAPCC. Rapid urbanisation, vulnerable existing infrastructure to climate disasters and natural hazards in urban sector need huge investments. This cost of rebuilding and responding to the disasters will be low if the existing infrastructure is climate proofed and diversified energy dependence on alternative sources of energy. The first is in terms of diversifying energy sources to alternatives such as solar PV and wind energy. Energy efficiency in public lighting and buildings is already identified as the most cost-effective intervention in the selected states. Although the capital cost of renewable energy interventions are not cost-effective in short term compared with fossil fuel based electricity generation, due to the high potential for scale up and replication across many states in India, the capital cost of these technologies are being brought down over a period time. This can be seen already in the case of solar PV. Overall, the project is expected to achieve potential

Page 89
cumulative direct and indirect CO2 emission reductions of about 31.16 million tCO2 during the economic lifetime of the interventions that will be carried out under the project.
9. SUSTAINABILITY AND REPLICABILITY
Sustainability and Replicability 224. The proposed project will facilitate the implementation of climate change mitigation actions stated in
the SAPCCs; maximize the benefits through exploring inter-state cooperation; showcase the actual implementation of SAPCCs; demonstrate institutional mechanisms for inter-state networking and cross-learning, including information sharing and technology dissemination; and develop and implement a common monitoring system to assess progress on the SAPCCs in the select states. The innovation of this project is the collaborative effort among the states in maximizing the effectiveness, and ultimately the impacts, of their respective climate change mitigation efforts (primarily EE and RE applications), which not only lead to the achievement of individual (state) objectives but also the collective (Mission-level) targets at the national level (NAPCC). The current project has been designed in a way that conducting training and capacity building, development of frameworks, templates of data collation, websites, training modules etc. have been incorporated as key outputs of the project. Currently at the state level, there is dearth of well-stocked information, measuring, reporting and verification systems, Development of robust information dissemination systems, MRV frameworks, training and capacity building modules under the current project will go a long way in overcoming the related barriers in the states. Innovative approaches of interactive training manuals, websites etc. will be developed in local languages to engage the stakeholders in the state. These outputs have been included to ensure that the information and expertise that will be developed during the course of the current project is well stocked and is available for reference and further application even after the project completion. Such information will also come useful for reference for other states for implementation of their SAPCCs, specifically for RE and EE intervention, replicability.
225. After the completion of the current UNDP-GEF project, it is expected that the impetus for implementing
RE and EE measures to mitigate GHG emissions will continue in India. The post project-end sustainability of this GEF-supported project will be ensured by:
Emergence of a stronger and more diverse RE/EE for SAPCC technology and service provider
industry in India, with stronger supply chains and improved quality RE/EE technology and service offerings, implementation models that meet defined standards, and improved delivery mechanisms for RE/EE abatement of GHG.
A significantly increased proportion of successful RE/EE for SAPCC projects working at the defined performance levels that are specified in government funding supports and that work as expected by the state level agencies and end users.
Availability of suitably documented demonstrations and replications of key RE/EE interventions for SAPCC, applications in real-world operating environments in India.
A higher level of awareness of the value of well-designed and suitably specified RE/EE implementation models incluidve of public private secytor engagement and financing models amongst the state level government agencies enterprises, entrepreneurs, suppliers, manufacturers, financing institutions, consumer associations etc.
A more supportive policy and regulatory framework that fosters the promotion and adoption of RE/EE activities for SAPCC implementation
226. One of the criteria for the selection of interventions, as listed in SAPCCs, is the potential to scale-up
and replicate. The proposed project will leverage private sector investments through combining market

Page 90
mechanisms for combining and sequencing of funds at the state level. The proposed project will, therefore, have high potential for scale-up and sustainability.

Page 91
10. PROJECT RESULTS FRAMEWORK
Table 41: Project results framework
The project will contribute to achieve following country program Outcomes (as defined in CPD): Project: Market Transformation and Removal of Barriers for Effective Implementation of the State-Level Climate Change Action Plans Outcome: Implementation of SAPCC Output: support for actions that assist in effective implementation of SAPCCs Output indicators: number of CCM investment projects implemented and plan prepared for scale up.
Country program outcome indicators: Outcome: Progress towards meeting national commitments under multilateral environmental agreements Output: Supporting national development objectives with co-benefits of mitigating climate change Output indicators: (a) Annual reductions in greenhouse gas (GHG) emissions in India; (b) million USD flowing annually to India from GEF through UNDP for this programme; (c) number of additional UNDP initiatives for achieving global and national targets under multilateral environmental agreements. Primary applicable key environment and sustainable development result area: Increased capacity at sub-national level to implement climate change mitigation actions and incorporation of CCM actions in state budgets and development plans.
Applicable GEF strategic objective and program: Strategic Objective: Objective 1: Promote the demonstration, deployment, and transfer of innovative low-carbon technologies. Objective 2: Promote market transformation for energy efficiency in industry and the building sector. Objective 3: Promote investment in renewable energy technologies Strategic Program: Climate Change Mitigation Applicable GEF expected outcomes: 1. Appropriate policy, legal and regulatory frameworks adopted and enforced 2. Sustainable financing and delivery mechanisms established and operational 3. GHG emissions avoided Applicable GEF outcome indicators: 1. Extent to which EE policies and regulations are adopted and enforced 2. Volume of investment mobilized 3. Tonnes CO2eq avoided
Strategy Objectively Verifiable Indicators Means of
Verification Critical Assumptions
Description Baseline Target
Project goal: Reduced GHG emissions achieved through implementation of RE and EE
Cumulative CO2 emission reduced from start of project to End-Of-Project (EOP), (million tCO2e)
0 304,250 M&E reports of the demonstration and replication projects
Continued support and participation from co-financing institutions, MoEFCC, MNRE, state nodal agencies, state

Page 92
solutions at the state level as identified in the SAPCCs
renewable energy development agencies and other stakeholders
Project Objective: To support the effective implementation of specific energy efficiency and renewable energy climate change mitigation actions identified in the SAPCCs for Manipur and Jharkhand
Total energy savings achieved from implemented RE and EE mitigation actions by EOP, MWh Total installed capacity of RE systems (MW) by EOP Number of people that benefitted directly or indirectly with improved energy access in the two states through the project interventions by the EOP (million). (This includes, improved job opportunity, quality of life and education.)
0 0 0
190,452
28
17.8
M&E reports of the demonstration and replication projects
Continued support and participation from co-financing institutions, MoEFCC, MNRE, state nodal agencies, state renewable energy development agencies and other stakeholders
Component 1: Framework for the implementation of climate change mitigation options in the selected states SAPCCs
Outcome 1: Successful and sustainable implementation of priority CCM actions on energy generation and application of EE & RE technologies in the major energy end-use sectors in selected states
Number of CCM actions implemented by the project in the states by EOP.
0 9 Mitigation actions finalized and feasibility report prepared
Continued interest of stakeholders
Output 1.1: Regularly updated GHG abatement cost curves at state level
Number of abatement cost curves prepared by Year 1
0 4 Updated abatement cost curves prepared
State nodal agencies adopts the developed diligent data collection and MRV systems
Output 1.2: Selected prioritized RE and EE actions listed in Manipur and Jharkhand Action Plans on Climate Change for implementation
Number of prioritized RE and EE mitigation actions selected for implementation in the states by end of year 1
0 9 Minutes of the meeting held with stakeholders for ensuring buy in on the prioritized actions
Continued support from MoEFCC, MNRE, State agencies for implementing RE and EE actions

Page 93
Output 1.3: Designed and implemented common monitoring, reporting, and verification (MRV) system for the selected RE and EE actions of the Manipur and Jharkhand APCC, in a way to feedback into the SAPCC process
No. of monitoring, reporting, and verification (MRV) systems designed and implemented in the states by Year 3
0 5 Report on designed monitoring, reporting, and verification (MRV) systems
Dedicated support from state agencies for design and implementation of MRV Systems
Component 2: Catalyzing investments for implementation of selected RE and EE mitigation action Outcome 2: Enhanced states capability and capacity for identifying, designing, planning, financing and implementing selected RE and EE actions from their SAPCC
Number of locally designed, planned and financed RE and EE projects implemented in the states by EOP
0 9 Inception reports/assessment reports of RE and EE mitigation projects operating in the states
There is continued support and participation from state agencies and ministries at national level. Enough technical and financial capacity is available in the state for implementation of projects
Output 2.1: Completed evaluation of existing available loan mechanisms for projects developed as part of SAPCC targets
Number of loan mechanisms evaluated by Year 2
0
5
Evaluation reports for loan mechanisms
All state agencies are supportive of implementing the selected RE and EE actions
Output 2.2: Implemented non-grant financing instruments such as flexible debt finance (including long tenure low-interest loans)
Number of non-grant based financial instruments developed by Year 3
0 1 Evaluation reports for non -grant instruments developed
All state agencies are supportive of implementing the selected RE and EE actions
Output 2.3: Mobilized public and private sector funding
Amount of total funding mobilized for implementation (US$) by Year 4
0
12,000,000
Letters of endorsement from funding sources
Continued interest in the selected RE and EE mitigation actions by co-financing institutions and public and private sector
Output 2.4: Established public private partnerships (PPP) for implementation and scaling up of selected RE and EE actions in Manipur and Jharkhand
Number of replication projects on the selected RE and EE mitigation actions implemented by EOP
0 32 Project assessment reports
Continued interest in the selected RE and EE mitigation actions by co-financing institutions and public and private sector
No. of PPP business models developed by Year 3
0 9 Comparative assessment report of PPP business models for RE and EE implementation
No. of demonstration investment projects based on
0 9 Performance assessment reports
All state agencies are supportive of implementing the investment projects

Page 94
Output 2.5: Implemented nine RE and EE investment projects in Manipur and Jharkhand
innovative financial models developed by end of year 1
of the investment projects
No. of demo investment projects implemented by EOP
0 5 M&E reports of the demonstration
All state agencies are supportive of implementing the investment projects
Output 2.6: Completed implementation manual and workshops for supporting the implementation of selected public private partnership models for RE and EE actions
No. of implementation manuals developed by Year 3 (one manual for each state)
0 2 Implementation manuals
Continued support and participation of the state governments and workshop proceedings are approved by state nodal agencies
No. of workshops conducted on sensitizing the state agencies on proposed models by Year 4
0 2 Workshop proceedings
Component 3: Capacity development of concerned state level officials for implementation of respective SAPCC
Outcome 3: Enhanced technical capability of state government in integrating climate change concerns within state sectoral development plans and budgets and undertaking MRVs efficiently for SAPCC actions, facilitated inter-state learning and coordination for SAPCCs
No. of sectoral state budgets for RE and EE activities that are aligned with the budgets proposed under SAPCCs by Year 2
0 2 Annual budgets for RE and EE activities in Jharkhand and Manipur
Increased interest of state level bodies in implementation of RE and EE mitigation actions
Output 3.1: Aligned state sectoral budgets for development plans to include climate change mitigation actions related expenses
Allotment of budget for climate change actions in departmental budgets by year 2
0 2 Review report Continued support and participation from State agencies and sharing of state documents
Output 3.2: Completed training and capacity building programs on the developed MRV systems for the State officials
No. of handbooks and guidelines prepared for MRV system by year 3
0 2 Handbook and guidelines
Continued support and participation from the state agencies
No. of training undertaken on the new MRV system by EOP
0 5 Training curricula and session reports
Continued support and participation of the state agencies

Page 95
Output 3.3: Established institutional mechanism for inter-state exchange of information and technology dissemination for Manipur and Jharkhand for implementation of SAPCC mitigation actions
No. of joint CCM actions discussed and planned for implementation between states by EOP
0 4 Meetings report Interested state agencies in both states for inter-state exchange of information and technology
Output 3.4: Conducted inter-state study trips and stakeholder interaction workshops
No. of study trips undertaken by EOP
0 4 Study trip reports Continued support and participation from state nodal agencies
No of workshops undertaken by EOP
0 4 Proceedings of the workshop
Interested state agencies in both states for attending the workshops on RE and EE mitigation actions and market transformation strategies
Output 3.5: Established and operational information dissemination system on lessons learnt from investment projects undertaken on priority RE and EE actions.
No. of brochures, case study reports and other printed material published and disseminated by year 4
0 10 Printed brochures, case study reports and other printed material
Public and Private sector agencies take higher amount of interest in disseminating the learning’s
No of users of the system/year starting Year 4
0 2,500 Web portal Number of hits on the web site
Wide use of internet by various state level stakeholders Interested public, private, research, education and voluntary agencies in both states and at national and international level visit the web portal of the project

Page 96
11. TOTAL BUDGET AND WORK PLAN
Table 42: Annual Budget and Work Plan (ABWP)
Award ID: 85842 Project ID(s): 93346
Award Title: Market Transformation and Removal of Barriers for Effective Implementation of the State-Level Climate Change Action Plans
Business Unit: IND10
Project Title: Market Transformation and Removal of Barriers for Effective Implementation of the State-Level Climate Change Action Plans
PIMS no. 4606
Implementing Partner (Executing Agency) Ministry of Environment, Forests & Climate Change (MOEFCC)
GEF Outcome / Atlas Activity
Responsible Party (Implemen
ting Agency)
Source Budget Code
ERP/ATLAS Budget Description/Input
Annual Expenses (USD) Total (USD)
Year 1 Year 2 Year 3 Year 4
Outcome 1: Identified and developed framework for implementation of priority CCM actions on energy generation and application of EE and RE technologies in the major energy use sectors in the selected states
MOEFCC GEF
62000
71200 International Consultants
120,000 120,000 100,000 80,000 420,000 1
71300 Local Consultants 60,000 60,000 45,000 40,000 205,000 2
71600 Travel 45,000 37,500 35,000 37,500 155,000 3
72100 Contractual Services - Companies
45,000 45,000 32,500 32,500 155,000 4
72200 Equipment and Furniture
0 0 6,000 7,500 13,500 6
72500 Supplies 12,000 12,000 12,000 12,000 48,000 9
72100 Contractual Services - Companies
27,500 27,500 25,000 25,000 105,000 8
72800 Information Tech Equipment
12,000 12,000 12,000 12,000 48,000 15
73100 Rental and Maintenance Premises
2,250 2,250 3,750 3,750 12,000 16
73400 Rental and Maintenance of Other Equipment
2,250 2,250 3,750 3,750 12,000 15
74200 Audio Visual & Printing Prod Costs
5,000 5,000 5,000 5,000 20,000 5

Page 97
74500 Miscellaneous 5,000 5,000 5,000 5,000 20,000 17
Total Outcome 1 336,000 328,500 285,000 264,000 1,213,500
Total Component 1 336,000 328,500 285,000 264,000 1,213,500
Outcome 2: Enhanced states capability and capacity for identifying, designing, planning, financing and implementing selected RE and EE mitigation actions from their SAPCC
MOEFCC GEF
62000
71200 International Consultants
87,500 92,500 64,000 67,500 311,500 7,
12 71300 Local Consultants 72,500 70,000 65,000 52,500 260,000 7
71600 Travel 40,000 40,000 40,000 40,000 160,000 3
72100 Contractual Services - Companies
66,000 49,500 52,500 57,500 225,500 4
72200 Equipment and Furniture
9,750 10,003 12,000 12,000 43,753 6
72500 Supplies 12,000 12,000 12,000 12,000 48,000 9
72100 Contractual Services - Companies
26,000 26,000 25,000 25,000 102,000 8
72800 Information Tech Equipment
5,000 5,000 5,000 5,000 20,000 15
73100 Rental and Maintenance Premises
3,000 3,000 3,000 3,000 12,000 16
73400 Rental and Maintenance of Other Equipment
3,000 3,000 3,000 3,000 12,000 16
74200 Audio Visual & Printing Prod Costs
5,000 5,000 5,000 5,000 20,000 5
74500 Miscellaneous 5,000 5,000 5,000 5,000 20,000 17
Total Outcome 2 334,750 321,003 291,500 287,500 1,234,753
Total Component 2 334,750 321,003 291,500 287,500 1,234,753 Outcome 3: Enhanced technical capability of state government in integrating climate change concerns within development plans and budgets and undertaking MRVs efficiently for SAPCC actions, facilitated
MOEFCC GEF
62000
71200 International Consultants
60,000 50,000 60,000 50,000 220,000 10,13
71300 Local Consultants 65,000 65,000 35,000 35,000 200,000 11
71600 Travel 45,000 45,000 42,500 42,500 175,000 3
72100 Contractual Services - Companies
30,000 30,000 30,000 30,000 120,000 12
72200 Equipment and Furniture
12,000 12,000 12,000 12,000 48,000 6
72500 Supplies 12,000 12,000 12,000 12,000 48,000 9
72100 Contractual Services - Companies
27,000 25,000 24,000 24,000 100,000 8
72800 Information Tech Equipment
13,000 11,000 13,000 11,000 48,000 15

Page 98
inter-state learning and coordination for SAPCCs
73100 Rental and Maintenance Premises
3,000 3,000 3,000 3,000 12,000 16
73400 Rental and Maintenance of Other Equipment
3,000 3,000 3,000 3,000 12,000 16
74200 Audio Visual & Printing Prod Costs
29,000 28,500 29,000 28,500 115,000 5
74500 Miscellaneous 5,100 5,100 4,950 4,850 20,000 17
Total Outcome 3 304,100 289,600 268,450 255,850 1,118,000
Total Component 3 304,100 289,600 268,450 255,850 1,118,000
SUB-TOTAL 974,850 939,103 844,950 807,350 3,566,253
Project Management
MOEFCC/UNDP
71400 Contractual Services-Individual
30,000 30,000 25,000 25,000 110,000 14
71600 Travel 2,500 2,500 2,500 2,247 9,747 3
72100 Contractual Services - Companies
1,500 0 1,500 0 3,000 4
72200 Equipment and Furniture
2,000 2,000 2,000 2,000 8,000 6
72500 Supplies 1,000 1,000 1,000 500 3,500 9
72800 Information Tech Equipment
1,000 1,000 1,000 1,000 4,000 15
74100 Professional Services - Audits
3,000 3,000 3,000 3,000 12,000 18
74200 Audio Visual & Printing Prod Costs
1,000 1,000 1,000 1,000 4,000 5
74500 Direct Project Services 5,500 5,500 5,500 5,500 22,000 19
74500 Miscellaneous 500 500 500 500 2,000 17
Total Project Management 48,000 46,500 43,000 40,747 178,247
Project Total 1,022,850 985,603 887,950 848,097 3,744,500
General notes to the budget:
- International consultants are budgeted at $ 3,500 per week and short-term national consultants at $ 1,000 per week - Travel cost (DSA and ticket) is budgeted at 20% of international consultant’s fee and 10% of national consultant’s fee as a general rule-of thumb - The cost of workshops has been divided in various budget lines as per UNDP ATLAS budget, which does not have a separate budget line for
training / workshops. For example, budget line 'international consultant' will have a % allocation for international experts to support workshops. The number of workshops for each output is given in the 'results framework'. A workshop having more than 20 participants will cost about USD 3,000

Page 99
per day; workshop having less than 20 participants will cost about USD 1,500 per day. A half-day high-level meeting with about 10 participants will cost around USD 750 per day.
- Miscellaneous is for unforeseen expenses that are difficult to anticipate. It is budgeted between 2% to 3% of the total cost of different components as a general rule-of-thumb.
- The cost for inception meeting and other allied service like audit has been kept USD 142,000, which is part of the overall budget provided in the budget table.
- Cost against hiring and contracting of local experts for supporting the implementation of investment projects and replication projects is budgeted under the ‘subcontract’ head. A part of this cost, as mentioned in above table, will be borne by GEF fund.
Specific notes (the numbers correspond to the last column of Error! Reference source not found.):
1. 80-100 person-weeks of international expertise to support development of framework for implementation of priority CCM measures and the selection of technologies for scaling up. Budget also includes mid-term review and terminal evaluation.
2. 175 person-weeks of local short-term consultancy for development of framework for implementation of priority CCM measures and the selection of technologies for scaling up. Budget also includes mid-term review and terminal evaluation.
3. Travel budget under component 1, 2 and 3 is for the travel of international and national consultants and for PMU staff. The travel budget under Project Management component is to cover the travel for auditors and PMU staff and for inviting experts for any accounting or monitoring related subjects.
4. Cost against hiring and contracting of local experts for supporting the implementation of investment projects and replication projects is budgeted under the ‘subcontract’ head. A part of this cost, as mentioned in above table, will be borne by GEF fund. $3,000 is budgeted for PMU in case of support needed from external contractor.
5. Printing and reproduction cost of technology application packages and knowledge dissemination documents 6. The equipment and furniture budget under Component 1, 2 and 3 is to cover the costs of equipment rental, maintenance and taking care of any
repair during the 4-years of project implementation. $8,000 is budgeted for PMU. 7. 98 person-weeks of international and local short-term consultancy for identifying suitable financing mechanisms, developing business models and
facilitating access to finance. 8. A support of US $ 307,000 will be provided to initial 9 investment project design and capacity development to support state agencies in
expanding/establishing the institutional structure and the supply chain for technology and other required technical expertise. 9. Under Component 1, 2 and 3, USD 144,000 is kept for supplies to cover PMU, workshop and meetings supplies during the 4-years. 10. 63 person-weeks of international consultancy for providing support to JREDA and MANIREDA in developing specific investment projects and
providing trainings to field staff. 11. 200 person-weeks of local short-term consultancy for establishing the institutional structure for dissemination of information to other states and to
promote the exchange of information between Jharkhand and Manipur states.

Page 100
12. 34 person-weeks of international short-term consultancy for development of risk mitigation mechanisms for EE and RE technology and service providers and end users.
13. 40 person weeks of international and local short-term consultancy for the design of MRV mechanisms for monitoring of both EE and RE mitigation actions and sharing of learning’s with other states.
14. Project personnel (National Project Manager, Finance & Admin Manager) to be located under Central PMU 15. Costs for InfoTech equipment’s under Component 1, 2 and 3 are to take care of printing, publishing, tools, software’s and other associated costs. 16. The costs for rental of premises and main equipment are to take care of utility and part costs of premises. 17. USD 60,000 has been kept to cover any miscellaneous costs during the 4-years. USD 2000 is for miscellaneous under project management. 18. For hiring of auditors for a undertaking audit of project accounts 19. Budget set up for provision of support services (UNDP Cost Recovery Charges) for recruitments, procurement, selection and awarding of sub-
contracts, approvals, etc.). Draft LOA for DPC will be available during DOA stage.
Allocation of MOEFCC Co-Financing Contribution: The MOEFCC’s co-financing contribution of US $ 12.58 million has been allocated as explained in the table below:
Table 43: Allocation of MOEFCC's Co-Financing Contribution Expenditure head Amount (US $)
Component 1: Framework for the implementation of climate change mitigation options in the selected states SAPCCs
3,147,187
Component 2: Catalysing investments for implementation of selected RE and EE mitigation action
3,249,599
Component 3: Capacity development of concerned state level officials for implementation of respective SAPCCs
3,044,772
Project Management Component 3,147,187Total 12,588,745
Table 44: Summary of Total Funds34
Donor Year 1 (USD) Year 2 (USD) Year 3 (USD) Year 4 (USD) Total (USD)
34 Summary table should include all financing of all kinds: GEF financing, co-financing, cash, in-kind, etc...

Page 101
GEF 1,022,850 985,603 887,950 848,097 3,744,500MOEFCC 3,147,186 3,147,186 3,147,186 3,147,187 12,588,745UNDP 125,000 125,000 125,000 125,000 500,000Jharkhand 1,310,575 1,310,575 1,310,575 1,310,575 5,242,300Manipur 1,667,238 1,667,239 1,667,238 1,667,240 6,668,955Total 7,272,849 7,235,603 7,137,949 7,098,099 28,744,500

Page 102
12. MANAGEMENT ARRANGEMENTS
12.1 Project Organization Structure 227. This UNDP-GEF project is to be implemented by the Ministry of Environment Forests and Climate
Change (MoEFCC), Government of India as the Implementing Partner of UNDP under National Implementation Modality (NIM), agreed by UNDP and the Government of India. As the implementing agency (on behalf of the GEF), the UNDP will provide overall management through its New Delhi Country Office (CO) and technical guidance from its Bangkok Regional Hub (BRH) in Bangkok. MoEFCC, as the Implementing Partner, will assume full responsibility and accountability in partnership with the state government of Manipur and Jharkhand for the effective use of UNDP and other resources and the achievement of the project outcomes and outputs at all levels as set forth in the document. The MoEFCC will be responsible for the overall implementation of the project at national and state levels. The MoEFCC will designate a National Project Director (NPD), who will be responsible for overall management, including achievement of planned results, and for the use of UNDP funds through effective process management and well established programme review and oversight mechanisms. MoEFCC will facilitate partnership development with state governments (Manipur and Jharkhand) and coordination with other relevant central ministries as required.
The accountability of MoEFCC is for:
Reporting, fairly and accurately, on project progress against agreed work plans in
accordance with the reporting schedule and formats included in the project document/Annual Work Plans;
Maintaining documentation and evidence that describes the proper and prudent use of project resources in conformity to the project document and in accordance with applicable regulations and procedures. This documentation will be available on request to project monitors (project assurance role) and designated auditors;
Meeting the targets and the outputs outlined in the approved and signed annual work plan; Approving and signing the Combined Delivery Report (CDR) at the end quarter and at the
end of the year; Signing the Financial Report or the Fund Authorization and Certificate of Expenditures
(FACE). 228. The MoEFCC in consultation with state governments (Manipur and Jharkhand) will sign a budgeted
Annual Work plan (AWP) with UNDP to achieve planned results. Each state government will designate a nodal officer who will facilitate support to the project at state, district and sub-district levels.
229. The India UNDP-GEF SAPCC project institutional structure has been developed to provide an effective
and integrated means to oversee and manage the multiple state level projects that are specified in the Project Document. Effective project management of the India GEF SAPCC project will require a combined mix of expertise in renewable energy, energy efficiency, project administration, and project management. It is critically important that all key project financial contributors and stakeholders have a strong ownership in the project design and execution at the strategic level. At the operational level on the ground, day-to-day activities will be carried out by assigned state agencies (ASAs), with support from the state project management units (SPMU) for each state. All activities at the investment project and state-levels will be supported and guided by a central Project Management Unit (PMU) located in MoEFCC. In addition, it is expected the project organization structure will evolve during the course of implementation of the project in a way that by the end of the implementation period there is a permanent institutional structure created in the two states focussed on taking forward the replication and scale-up of the RE and EE technologies in more locations across the state(s).

Page 103
230. Based on this overall project structure, the broad institutional arrangement for this project is shown below. Annexure C contains details of the TORs for the key central and state PMU positions. The Project Operations Manual provides details of the key project roles, positions and proposed assignments that are required to undertake and manage the project’s main activities.
Figure 199: Project Management Structure35
231. At the strategic level, a Project Steering Committee (PSC) will provide strategic guidance for the
project, while a Technical Advisory Committee (TAC) will provide the technical support to the Central PMU will oversee operational project aspects. The Project Management Unit (PMU) will constitute the core team for the project’s implementation. The PMU will supervise, co-ordinate and provide the integrated coherence of all project activities. At the state level, project activities will be undertaken by state PMUs, led by the assigned state agencies (ASAs). The ASAs and state PMU’s will provide the day-to-day practical on the ground support at the state and investment project level. More detailed descriptions follow in subsequent sections. A brief description of the different levels of project implementation is given below. Normally, the PMU will communicate with the ASAs through the respective state PMUs. However, the dotted line in the above organization structure represents that depending on the requirement, the PMU is free to directly communicate with the ASAs
232. Project Steering Committee: The PSC is an oversight and governance focused high-level group that
will be constituted by organisations that are core supporters and/or significant co-financiers of the project. Besides MoEFCC OFP, MNRE, UNDP, this Committee may also include IREDA, DEA (Dept. of Economic Affairs) as well as representatives of state-level agencies that bring a significant contribution to the project. The MoEFCC will chair the PSC meetings. The committee will also have state officials from Government of Jharkhand and Government of Manipur as its members. The
35 Normally, the central PMU will communicate with the ASAs through the respective state PMUs. However, the dotted line in the above organization structure represents that depending on the requirement, the central PMU is free to directly communicate with the ASAs. The institutionalization of the PSUs will happen post the implementation of the pilot, nearing the current project closure. The red line is indicating that the ASAs will develop the PSUs, which will come in action beyond the activities of the current project.
State PMU-2
Project Steering Committee
Central Project Management Unit National Project Director (1) National Project Manager (1)
Finance and Administration Manager (1)
State PMU-1
ASA-1 ASA-2
Technical Advisory Committee
Members to include: MoEFCC, MNRE, UNDP, BEE IREDA, DEA, state Chief Secretaries. Meetings chaired by Secretary MoEFCC
Representatives of MoEFCC, UNDP, SECI, EESL, heads of state SREDAs, independent RE and EE experts. Meetings chaired by Joint Secretary, MoEFCC.
Headed by high-level MOEFCC official (Director) NPD’s services provided as an in-kind contribution by MoEFCC
• State PMU Coordinator • State PMU Member – Renewable Energy Expert • State PMU Member – Energy Efficiency Expert • Housed in State Nodal agencies for SAPCC • Two technical members housed in SREDAs
Assigned State Agencies to lead implementation of investment projects. SREDA’s as ASAs

Page 104
Committee will meet at least twice a year to review the Project Report/Project Implementation Report (PR/PIR) for the last six months, and the review and formal endorsement of the Annual Work Plan (AWP) for the upcoming year of project operations. The PSC will at any stage during the implementation of the project have the power to make amendments to the Project Management Structure as may be seen essential, depending on the specific requirement that may emerge during project implementation.
233. Technical Advisory Committee (TAC): The TAC will comprise all major stakeholders who are actively
involved in project activities and who are interested in the project’s results. The TAC will include representatives of MoEFCC, UNDP and State representatives (JREDA and MANIREDA). It is also proposed the TAC may include independent RE and EE technical experts as its member to be able to monitor the technical aspects of the project. The Joint Secretary, MoEFCC, will chair the TAC meetings. This group will meet at least four times a year. The group is also expected to act as the forum for resolving major technical level issues.
234. Central Project Management Unit: The PMU is the core team for managing the operations of the
project. Given the extensive implementation of the project activities at the state level, it is proposed the project should have a PMU at the central level for overall monitoring and coordination and two state specific PMU in each state to implement and monitor state level activities. The central PMU it is suggested will meet at least once a month in a formal structured meeting (with comprehensive meeting minutes taken). The central PMU will be headed by MOEFCC official acting as National Project Director (NPD). The central PMU will also comprise a full-time operational level National Project Manager (NPM), for coordinating closely with the state PMUs and looking after the administration and financing aspects. While the NPD’s services will be provided as an in-kind project contribution by MoEFCC, the professional costs for full-time engagement of the NPM will be primarily borne by GEF.
235. Assigned State Agencies (ASAs): The implementation of investment projects’ in the various investment project locations will be led by “Assigned State Agencies” (ASAs) identified in each state. ASA’s will be responsible for: consultations with target groups, identification of end-users, providing assistance in mobilising /accessing financing, assistance in the identification of the most appropriate technology supplier, supervision of the implementation, training of end-users, providing handholding support post-installation, reporting and documenting the demonstration project progress, etc. Funds are expected to flow directly from the central PMU to assigned agency in each state. It is expected ASA for the two states will be the respective State Renewable Energy Development Agency (JREDA and MANIREDA).
236. State Level Project Management Unit: While the ASAs can be approached directly by the central PMU, it is felt, given the complexity of the project and the multiplicity of agencies involved at the state level, that a mechanism for coordination of activities and availability of technical expertise at the state-level would strengthen project management and execution arrangements. The state PMUs respectively in Jharkhand and Manipur are primarily extended arms of central PMU. State PMU will monitor the project on behalf of central PMC, liaise and provide extensive support to ASAs. State PMU will consist of at least three members. These members will represent three different types of expertise, i.e., Renewable Energy (technical expert); energy efficiency (technical expert) and state coordinator. Additionally, the state PMU may hire technical experts for inputs on particular technical and implementation interventions and sectors as required. Additionally, the State PMU will also have a full time finance and administration officer to manage the administration related issues. Thus the state PMU will comprise the following four permanent members.
1. State PMU Coordinator 2. State PMU Member – Renewable Energy Expert 3. State PMU Member – Energy Efficiency Expert 4. State PMU Administration and Finance Manager
237. The State PMU will be the key agency that will liaison with all the state level agencies (government department and private entities). The State PMU coordinator and Administration and Finance Manager can be housed in the respective state nodal agencies for implementation of the SAPCC (Department of
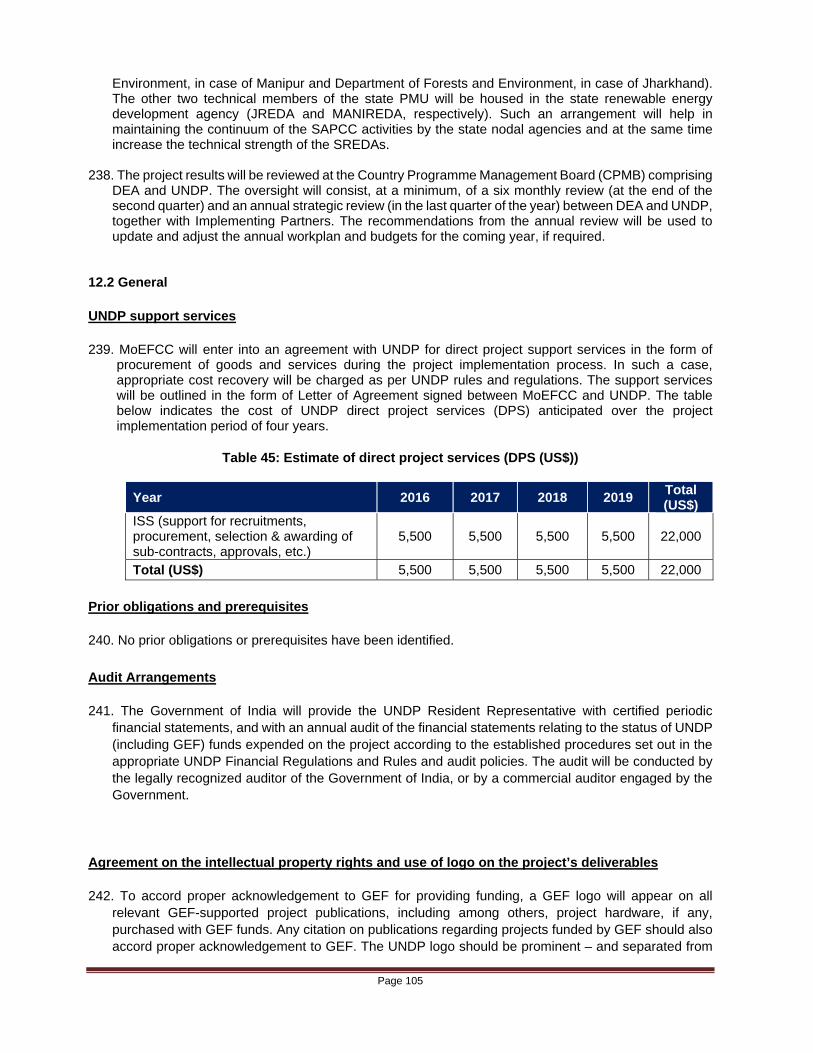
Page 105
Environment, in case of Manipur and Department of Forests and Environment, in case of Jharkhand). The other two technical members of the state PMU will be housed in the state renewable energy development agency (JREDA and MANIREDA, respectively). Such an arrangement will help in maintaining the continuum of the SAPCC activities by the state nodal agencies and at the same time increase the technical strength of the SREDAs.
238. The project results will be reviewed at the Country Programme Management Board (CPMB) comprising
DEA and UNDP. The oversight will consist, at a minimum, of a six monthly review (at the end of the second quarter) and an annual strategic review (in the last quarter of the year) between DEA and UNDP, together with Implementing Partners. The recommendations from the annual review will be used to update and adjust the annual workplan and budgets for the coming year, if required.
12.2 General UNDP support services 239. MoEFCC will enter into an agreement with UNDP for direct project support services in the form of
procurement of goods and services during the project implementation process. In such a case, appropriate cost recovery will be charged as per UNDP rules and regulations. The support services will be outlined in the form of Letter of Agreement signed between MoEFCC and UNDP. The table below indicates the cost of UNDP direct project services (DPS) anticipated over the project implementation period of four years.
Table 45: Estimate of direct project services (DPS (US$))
Year 2016 2017 2018 2019 Total (US$)
ISS (support for recruitments, procurement, selection & awarding of sub-contracts, approvals, etc.)
5,500 5,500 5,500 5,500 22,000
Total (US$) 5,500 5,500 5,500 5,500 22,000
Prior obligations and prerequisites 240. No prior obligations or prerequisites have been identified.
Audit Arrangements 241. The Government of India will provide the UNDP Resident Representative with certified periodic
financial statements, and with an annual audit of the financial statements relating to the status of UNDP (including GEF) funds expended on the project according to the established procedures set out in the appropriate UNDP Financial Regulations and Rules and audit policies. The audit will be conducted by the legally recognized auditor of the Government of India, or by a commercial auditor engaged by the Government.
Agreement on the intellectual property rights and use of logo on the project’s deliverables 242. To accord proper acknowledgement to GEF for providing funding, a GEF logo will appear on all
relevant GEF-supported project publications, including among others, project hardware, if any, purchased with GEF funds. Any citation on publications regarding projects funded by GEF should also accord proper acknowledgement to GEF. The UNDP logo should be prominent – and separated from

Page 106
the GEF logo. Alongside GEF and UNDP logo, the MoEFCC logo shall also feature as the Implementing Partner of the project.
Assets 243. The ownership of the assets procured under the project from GEF grant money lies with the UNDP
Resident Representative until the end of the project. At the end of the project, the assets would be transferred to the implementing ministry of the Indian government (MoEFCC in this case).
13. MONITORING FRAMEWORK AND EVALUATION
244. The project will be monitored through the following M&E activities. The M&E budget is provided in the Table 43 as below.
Project Start:
245. A formal Project Inception Workshop will be held within 2 months of the project’s start. The Inception Workshop must include the active participation of:
The responsible MoEFCC Director and other relevant MoEFCC staff
Relevant UNDP India Country Office Environment and Energy branch staff, and where feasible regional technical policy and programme advisors
Representatives from the key SAPCC missions
Relevant target state (Jharkhand and Manipur) government officials and key stakeholders
Other stakeholders such as (but not limited to) relevant RE/EE equipment and service suppliers.
246. The Inception Workshop will be a crucial formal step to building the necessary strong local ownership for the project’s focus, scope and ultimate results, and to confirm (and where required refine) the project’s first year Annual Work Plan (AWP).
247. The Inception Workshop will address a number of key issues including:
a) Assist all project partners to fully understand and take ownership of the project. Detail the roles, support services and complementary responsibilities of UNDP CO and BRH staff vis-à-vis MoEFCC, the PSC, the project team, and the project’s ASAs. Discuss the roles, functions, and responsibilities within the project's relevant decision-making structures, including reporting and communication lines, and conflict resolution mechanisms. The Terms of Reference for project staff will be discussed as required and as relevant.
b) Based on the project results framework and the relevant GEF Tracking Tool, finalize the project’s first annual work plan. Review and agree on the indicators, targets and their means of verification, and recheck the project’s assumptions and risks.
c) Provide a detailed overview of reporting, and monitoring and evaluation (M&E) requirements. The M&E work plan and budget should be agreed and M&E activities should be scheduled.
d) Discuss financial reporting procedures and obligations, and arrangements for, annual project audits.
e) Plan and schedule PSC (Board) meetings. The roles and responsibilities of project organisation structures should be clarified and the schedule for PSC meetings should be planned. The first PSC meeting should be planned for and held within the first 6 months following the Inception Workshop.

Page 107
248. A detailed Inception Workshop report is a key reference document and must be prepared and shared with participants to formalize the agreements, plans and next steps decided during the Inception Workshop.
Quarterly review:
249. The quarterly monitoring will involve: Project progress shall be monitored in the UNDP Enhanced Results Based Management
Platform.
Based on the initial risk analysis submitted, the project risk log shall be regularly updated in ATLAS. Risks become particularly critical when their impact and probability are high36.
Based on the information recorded in ATLAS, a Project Progress Report (PPR) can be generated in the Executive Snapshot.
Other ATLAS logs can be used to monitor issues, lessons learned etc. The use of these functions is a key indicator in the UNDP Executive Balanced Scorecard.
Annual Review:
250. Annual Project Review/Project Implementation Reports (APR/PIR): This key report is prepared to monitor progress made since project start and in particular for the previous reporting period (30 June to 1 July). The APR/PIR combines both UNDP and GEF reporting requirements. The APR/PIR includes, but is not limited to, reporting on the following:
Progress made towards project objective and project outcomes - each with indicators, baseline data and end-of-project targets (cumulative)
Project outputs delivered per project outcome (annual) Lesson learned/good practices AWP and other expenditure reports Risk and adaptive management ATLAS Project Progress Report (PPR) Portfolio level indicators (i.e. GEF focal area tracking tools) are used on an annual basis as well Each APR/PIR will be submitted to GEF OFP for review and then submitted to GEF SEC
Periodic Monitoring through site visits: 251. The UNDP CO and the UNDP BRH will conduct visits to project sites based on the agreed schedule in the project's Inception Report/Annual Work Plan to assess first hand project progress. Other members of the PSC may also join these visits. A Field Visit Report/Back to Office Report (BTOR) will be prepared by the CO and UNDP BRH and will be circulated no less than one month after the visit to the project team and PSC members.
Mid-term of project cycle:
252. The project will undergo an independent Mid-Term Review (MTR) at the mid-point of project implementation (scheduled for 2017). The MTR will determine the project’s progress being made toward the achievement of its outcomes and will identify any recommended project mid-course corrections. The MTR will focus on the effectiveness, efficiency, relevance, timeliness and impact of the project’s implementation to date; will highlight issues requiring decisions and actions; and will present initial lessons learned about project design, implementation, and management. The findings of the MTR will be incorporated as recommendations for enhanced implementation during the final half of the project’s term.
36 Note that the project does not have the high financial risks associated with financial instruments such as revolving funds, microfinance schemes, or capitalization of ESCOs – which are automatically classified as critical on the basis of their innovative nature (high impact and uncertainty due to no previous experience justifies classification as critical).

Page 108
The organization, terms of reference and timing of the MTR will be decided after consultation between the parties to the project document. The TOR for this MTR will be prepared by the UNDP CO based on guidance from the UNDP BRH and UNDP-GEF. The management response and the evaluation will be uploaded to UNDP corporate systems, in particular the UNDP Evaluation Office Evaluation Resource Center (ERC). The relevant GEF Focal Area Tracking Tools will also be completed during the MTR. MTR will be submitted to GEF OFP for review and then submitted to GEF SEC
End of Project:
253. An independent Terminal Evaluation (TE) will take place three months prior to the final PSC meeting and will be undertaken in accordance with UNDP and GEF guidance policies. The TE will focus on the delivery of the project’s results as initially planned (and as corrected after the MTR, if any such correction took place). The TE will look at the impact and sustainability of the project’s results, including the contribution to capacity development and the achievement of global environmental benefits/goals. The TOR for this TE will be prepared by the UNDP CO based on guidance from the relevant UNDP RSC and UNDP-GEF. The TE should also provide recommendations for follow-up activities and requires a management response, which should be uploaded to PIMS and to the UNDP ERC. The relevant GEF Focal Area Tracking Tools will also be completed during the Final Evaluation.
254. During the last three months of the project’s implementation, the project team will prepare the Project Terminal Report. This comprehensive report will summarize the results achieved (objectives, outcomes, outputs), lessons learned, problems met and areas where results may not have been achieved. It will also include recommendations for any further steps that may need to be taken to ensure the sustainability and replicability of the project’s results. The PTR will be submitted to GEF OFP for review and then submitted to GEF SEC
Learning and knowledge sharing:
255. Results from the project will be disseminated within and beyond the project intervention zone through existing information sharing networks and forums. The project will identify and participate, as relevant and appropriate, in scientific, policy-based and/or any other networks, which may be of benefit to project implementation though lessons learned. The project will identify, analyse, and share lessons learned that might be beneficial in the design and implementation of similar future projects. Finally, there will be a two-way flow of information between this project and other projects of a similar focus.
Communications and visibility requirements:
256. Full compliance will be undertaken with UNDP’s Branding Guidelines. These can be accessed at http://intra.undp.org/coa/branding.shtml, and specific guidelines on UNDP logo use can be accessed at: http://intra.undp.org/branding/useOfLogo.html. Amongst other things, these guidelines describe when and how the UNDP logo needs to be used, as well as how the logos of donors to UNDP projects should be used. For the avoidance of any doubt, when logo use is required, the UNDP logo needs to be used alongside the GEF logo. The GEF logo can be accessed at: http://www.thegef.org/gef/GEF_logo. The UNDP logo can be accessed at http://intra.undp.org/coa/branding.shtml.
257. Full compliance is also required with the GEF’s Communication and Visibility Guidelines (the “GEF Guidelines”). The GEF Guidelines can be accessed at: http://www.thegef.org/gef/sites/thegef.org/files/documents/C.40.08_Branding_the_GEF%20final_0.pdf. Amongst other things, the GEF Guidelines describe when and how the GEF logo needs to be used in project publications, vehicles, supplies and other project equipment. The GEF Guidelines also

Page 109
describe other GEF promotional requirements regarding press releases, press conferences, press visits, visits by Government officials, productions and other promotional items.
258. Where other agencies and project partners have provided support through co-financing, their branding policies and requirements should be similarly applied.

Page 110
Table 46: M & E work-plan and budget
Type of M&E activity
Responsible Parties Budget US$
Excluding project team staff time
Time frame
Inception Workshop and Report
Project Manager UNDP CO, UNDP GEF
Indicative cost: 10,000
Within first two months of project start up
Measurement of Means of Verification of project results.
UNDP GEF RTA/Project Manager will oversee the hiring of specific studies and institutions, and delegate responsibilities to relevant team members.
Indicative cost: 50,000
Start, mid and end of project (during evaluation cycle) and annually when required.
Measurement of Means of Verification for Project Progress on output and implementation
Oversight by Project Manager
Project team
Indicative cost: 10,000 (to be determined as part of the Annual Work Plan's preparation)
Annually prior to ARR/PIR and to the definition of annual work plans
ARR/PIR Project manager and team GEF OFP UNDP CO UNDP RTA UNDP EEG
None Annually
Periodic status/ progress reports
Project manager and team None Quarterly
Mid-term Evaluation GEF OFP Project manager and team UNDP CO UNDP BRH Independent External
Consultants (i.e. evaluation team)
Indicative cost: 30,000
At the mid-point of the project’s implementation.
Terminal Evaluation GEF OFP Project manager and team, UNDP CO UNDP BRH Independent External
Consultants (i.e. evaluation team)
Indicative cost: 30,000
At least three months before the end of the project’s implementation
Project Terminal Report
Project manager and team UNDP CO Local consultant
0 At least three months before the end of the project
Audit UNDP CO Project manager and team
Indicative cost per year: 3,000
Yearly @4 years
Visits to field sites UNDP CO UNDP BRH (as appropriate) Government representatives
For GEF supported projects, paid from IA fees and operational budget
Yearly
TOTAL indicative COST Excluding project team staff time and UNDP staff and travel expenses
US$ 142,000 (+/- 5% of total budget)

Page 111
14. LEGAL CONTEXT
259. It is understood that the Government of India has signed the Standard Basic Assistance Agreement (SBAA) with UNDP on 19 December 1994, and that therefore the following standard text has been quoted:
This document together with the CPAP signed by the Government of India and UNDP, which is incorporated by reference, constitute together a Project Document, and all CPAP provisions apply to this document.
Consistent with the Article III of the SBAA, the primary responsibility for the safety and security of the implementing partner (MoEFCC) and its personnel and property, and of UNDP’s property in the MoEFCC’s custody, rests with MoEFCC. MoEFCC shall therefore:
o Put in place an appropriate security plan and maintain the security plan, taking into account the security situation in India; and,
o Assume all risks and liabilities related to MoEFCC’s security, and the full implementation of the security plan.
UNDP reserves the right to verify whether such a plan is in place, and to suggest modifications to the plan when necessary. Failure to maintain and implement an appropriate security plan as required hereunder shall be deemed a breach of this agreement.
260. MoEFCC agrees to undertake all reasonable efforts to ensure that none of the UNDP funds received pursuant to the Project Document are used to provide support to individuals or entities associated with terrorism and that the recipients of any amounts provided by UNDP hereunder do not appear on the list maintained by the Security Council Committee established pursuant to resolution 1267 (1999). The list can be accessed via http://www.un.org/Docs/sc/committees/1267/1267ListEng.htm. This provision must be included in all sub-contracts or sub-agreements entered into under this Project Document.
15. UNDP SOCIAL AND ENVIRONMENTAL STANDARDS
261. UNDP’s Social and Environmental Standards (SES) and related Compliance Review and Stakeholder Response Mechanism (SRM) provide an operational means to translate the normative principles and commitments of the UN into on-the-ground results and impacts. UNDP is committed to ensuring such policies and accountability mechanisms are in place for programming. UNDP’s new Strategic Plan, Programme Alignment and quality assurance processes provide an important window of opportunity to embed the standards in our programming approach and scale up implementation. UNDP can also play a leadership role within the UN-system and at the country level by supporting partner and country capacities and driving a One-UN approach through the UNCT. Following an extensive internal and external consultation process, the OPG approved the SES and SRM, to be integrated into the POPP by the end of the year and effective starting January 1, 2015. UNDP’s Social and Environmental Compliance Unit (SECU) within the Office of Audit and Investigations (OAI) will also be launched on January 1, 2015, to investigate alleged non-compliance with UNDP’s Social and Environmental Standards and Screening Procedure from project-affected stakeholders.

Page 112
16. LIST OF REFERENCES
ODI 2014, The Coordination of Climate Finance in India, Overseas Development Institute, December 2014
Byravan, Sujatha and Rajan, Sudhir Chella, An Evaluation of India's National Action Plan on Climate Change (January 3, 2013). Available at SSRN: http://ssrn.com/abstract=2195819 orhttp://dx.doi.org/10.2139/ssrn.2195819
MNRE, 2015, Ministry of New and Renewable Energy (MNRE), http://mnre.gov.in/mission-and-vision-2/achievements/, last accessed on 13th February 2015
MNRE 2012, Laying the foundation for a bright future: India's National Solar Mission, MNRE, New Delhi
Taylor, et al. 2008. Robert P. Taylor et al. Financing Energy Efficiency: Lessons from Brazil, China, India and Beyond, the World Bank, Washington DC
ADB 2005, Asian Development Bank, Energy Efficiency enhancement Project, prepared by Charles River Associates (Asia-Pacific) Pty Ltd, 2005, Manila.
Planning Commission 2011. Low Carbon Strategies for Inclusive Growth – An Interim Report, Government of India, New Delhi
Jogesh 2014, From Margins to Mainstream? : State Climate Change Planning in India as "Door Opener" to a Sustainable Future, Centre for Policy Research Climate Initiative, New Delhi
JAPCC 2014, Jharkhand Action Plan on Climate Change, Government of Jharkhand, Ranchi
Department of Energy 2012, Jharkhand Energy Policy 2012
CII 2014, Confederation of Indian Industry, The Leap towards sustainable power in eastern India, 2014
Government of Manipur 2012, Draft 12th Five Year Plan (2012-17).
CEA 2007, Central Electricity Authority, 17th Electric Power Survey of India
CEA 2015, Power Sector Report, Central Electricity Authority, New Delhi
MSAPCC 2014, Manipur State Action Plan on Climate Change, Directorate of Environment, Government of Manipur
MANIREDA 2014, Grid Interactive Rooftop Solar Photovoltaic Power Policy, Manipur Renewable Energy Development Agency, Government of Manipur
Greenpeace & Infraline Energy 2013, Powering Ahead with Renewables: Leaders & Laggards
JERC 2014, Manipur - Expected Revenue from Revised Tariff (Telescopic) effective from 01.04.2014, Joint Regulatory Electricity Commission
USAID 2008, Financing Energy Efficiency in India, USAID, New Delhi
JSEB 2013, Detailed Power Analysis of Jharkhand, Jharkhand State Electricity Board

Page 113
PART C. ANNEXES
ANNEXURE A: RISK ANALYSIS
No.
Description Date Identified
Type
Impact and Probability (on a scale of 1 (low) to 5 (high))
Countermeasures/ Management Response
Owner Submitted, updated by
Last update
Status
1 The project is not able to get MoEFCC, MNRE, BEE, NSM, NMEEE and relevant state based agencies efforts to remain engaged or to effectively work together to support the growth of RE and EE for SAPCC.
15 June 2015
Strategic and organisational
Probability = 1Impact = 5 Overall Risk: Low
- The project implementing partner (MoEFCC) will establish a strong Central-level PSC and a strong Central/State-level TAC; hold frequent (annual PSC and quarterly TAC) meetings that involve key ministries; and engage and retain the strong interest and ownership of suitable high level champions in key central Ministries, in particular MoEFCC, MNRE, BEE, and in Ministries covering key RE and EE aspects.
- The quarterly TAC meetings will be rotated around the applicable states to ensure that each state hosts at least one TAC meeting a year for ongoing local project engagement and ownership.
UNDP UNDP CO
2 Current levels of funding available
to support the development and implementation of SAPCC at the central and state government level are reduced and hence there is less funding support available to be accessed by the project for the implementation of SAPCC aspects of project activities.
15 June 2015
Strategic and Financial
Probability = 2Impact = 4 Overall Risk: Medium
- The project through its implementing partner, MoEFCC, will work with the most important SAPCC missions that are highly likely to have durable mandates and funding into the future. Also for which funding from other sources, apart from SAPCC is also available.
UNDP UNDP CO

Page 114
No.
Description Date Identified
Type
Impact and Probability (on a scale of 1 (low) to 5 (high))
Countermeasures/ Management Response
Owner Submitted, updated by
Last update
Status
3 Implementation of SAPCC does not remain an important item on the relevant central and/or state political agendas.
15 June 2015
Strategic Probability = 1Impact = 5 Overall Risk: Low
- The scale of the energy access/deficit issues, the looming challenge of climate change and India’s national and global commitments at combating climate change, is highly likely to ensure that there will be a suitable ongoing central and local commitment to measures at addressing climate change through central and state level planning.
UNDP UNDP CO
4 There is a sustained reduction in
the international oil price, or large subsidies are re-introduced and sustained for diesel used for captive power generation, or funds available for LPG subsidies is significantly increased, or the price of electricity for thermal sources falls – hence significantly undermining the economics of RE and EE for the concerned states.
15 June 2015
Strategic Probability = 1Impact = 5 Overall Risk: Low
- As in the 2008 GFC, even a strong global financial crisis is unlikely to lead to sustained lower world crude oil prices as lower oil prices would lead directly to a lower global new oil field development rate and hence would be quickly self-correcting as occurred in 2009. An increase in diesel subsidies in India is unlikely as here is a strong political consensus and momentum towards reducing the remaining diesel subsidies in India.
UNDP UNDP CO
5 Major adverse economic or
political conditions significantly force up interest rates and/or curtail bank lending for a significant period in India during the project’s implementation, hence reducing the affordability of the bank loans or financial instruments that may be designed for implementation of RE and EE investment projects by project developers.
15 June 2015
Regulatory Probability = 1Impact = 5 Overall Risk: Low
- The Indian economy has strong internal growth drivers and has a low risk of significant domestically led major adverse economic conditions. The Indian economy is significantly nationally self-contained and is only weakly linked to potential international financial crises and events. Development of RE – rural livelihood applications is therefore not greatly at risk of
UNDP UNDP CO

Page 115
No.
Description Date Identified
Type
Impact and Probability (on a scale of 1 (low) to 5 (high))
Countermeasures/ Management Response
Owner Submitted, updated by
Last update
Status
major interest rate rises or significant bank lending restrictions.
6 Lack of active involvement of the relevant private sector entities like private investors, power project developers, manufacturers, ESCOs etc.
15 June 2015
Operational Probability = 2Impact = 2 Overall Risk: Low
- MNRE, MoP and BEE have schemes to encourage the private sector through incentive scheme to promote renewable energy and energy efficiency applications – facilitating the availability of financing for investments in SAPCC implementation as well as availability of capital loans and generation-based incentives to project developers. The project will help designing and operationalizing these aspects and institutional arrangements of the fiscal instruments, and to support interventions in the nascent RE and EE market at state level.
UNDP UNDP CO
7 Relevant RE and EE investment
projects are successfully demonstrated, but then do not get replicated for a variety of internal or external factors. This could lead to a negative circular effect in terms of credibility around the project.
15 June 2015
Organisational
Probability = 2Impact = 3 Overall Risk: Medium
- The project through its implementing partner, MoEFCC, will take a strongly pro-active approach to publicising demo project results and to actively supporting subsequent replication projects with suitable project information and support activities.
UNDP UNDP CO
8 Limited involvement of sector
agencies and stakeholders in the climate change mitigation options identified
15 June 2015
Strategic Probability = 3Impact = 2 Overall Risk: Medium
- One of the prime focuses of the project is strengthening stakeholder capacities and facilitating their involvement in the climate change mitigation actions identified. This will be undertaken largely under the capacity development
UNDP UNDP CO

Page 116
No.
Description Date Identified
Type
Impact and Probability (on a scale of 1 (low) to 5 (high))
Countermeasures/ Management Response
Owner Submitted, updated by
Last update
Status
component of the project. The project through its implementing partner, MoEFCC, will address constraints related to access to finance through market-based frameworks and de-risking the investment environment.
9 Delay in the adoption of priority actions outlined in the SAPCCs by the state government sectoral departments.
15 June 2015
Regulatory Probability = 3Impact = 2 Overall Risk: Medium
- The MoEFCC will be monitoring the SAPCC implementation. If states are not active they will not be able to utilize development funds earmarked under different Missions. So, MoEFCC is encouraging the state governments and monitoring the progress of state plan implementation. The project through its implementing partner, MoEFCC, will provide technical support to the State Nodal Agency (SNA) in influencing the sectoral decisions and the budgetary process for accelerating adoption of priority mitigation actions outlined in the plan with the relevant departments.
UNDP UNDP CO
10 Impact of climate change on the
proposed interventions due to change in climate variables including precipitation, humidity, wind speed and cloudiness
15 June 2015
Environmental
Probability = 2Impact = 2 Overall Risk: Low
- Both the states have subtropical dry climate which is suitable for solar applications. Change in temperature and level precipitation to an extent will not have any significant effect on the solar insolation.
UNDP UNDP CO
11 Limited institutional capacities to
support project implementation and programme continuity at the state level
15 June 2015
Organisational
Probability = 3Impact = 3 Overall Risk: Medium
- The technical and financial support, including the co-financing leveraged through the project, will address this risk by building and retaining the
UNDP UNDP CO

Page 117
No.
Description Date Identified
Type
Impact and Probability (on a scale of 1 (low) to 5 (high))
Countermeasures/ Management Response
Owner Submitted, updated by
Last update
Status
necessary technical, managerial and implementation capacities during the project life and beyond.
- - The project through its
implementing partner, MoEFCC, will promote common principles for planning and implementation, but with sufficient flexibility to take account of differences in institutional frameworks and in capacities of the state governments. The planning process will emphasise multi-stakeholder engagement to ensure inter-departmental coordination.
12 Lack of financial institutions’ sustained commitment for implementation of SAPCC
15 June 2015
Financial and organisational
Probability = 3Impact = 2 Overall Risk: Medium
- Engaging financial institutions at different levels and providing cost-benefit analysis of different technologies. One of the mechanisms could be developing and advocating for regulatory reforms to improve the business environment in the priority areas identified.
UNDP UNDP CO
13 There is a significantly slow start
of on-the-ground project activities 15 June 2015
Organisational
Probability = 3Impact = 5 Overall Risk: High
- In 2015 a Central PMU will be established in MoEFCC as well as the state PMUs. This will ensure that once all the necessary UNDP GEF-SAPCC project approvals are obtained that the project can then be implemented with the least possible delays.
UNDP UNDP CO

Page 118
No.
Description Date Identified
Type
Impact and Probability (on a scale of 1 (low) to 5 (high))
Countermeasures/ Management Response
Owner Submitted, updated by
Last update
Status
14 There is significant RE/EE technology underperformance or failure in project activities (technical risk)
15 June 2015
Others Probability = 1Impact = 5 Overall Risk: Low
- The project’s mix of RE and EE technology is carefully balanced between well proven RE- EE applications and the extension of proven RE/EE technologies into new state level applications.
UNDP UNDP CO
15 There is a lack of necessary
leadership and/or slow or low quality decision-making in the PMU.
15 June 2015
Organisational
Probability = 2Impact = 4 Overall Risk: Medium
- A detailed Project Operations Manual has already been developed to define key accountabilities, management responsibilities, and operational procedures for all levels of the project’s implementation. A strong PSC and TAC structure will be established and will be given strong support to ensure the ongoing effectiveness and efficiency in the project’s implementation.
UNDP UNDP CO

Page 119
ANNEXURE B: CO-FINANCING LETTERS

Page 120
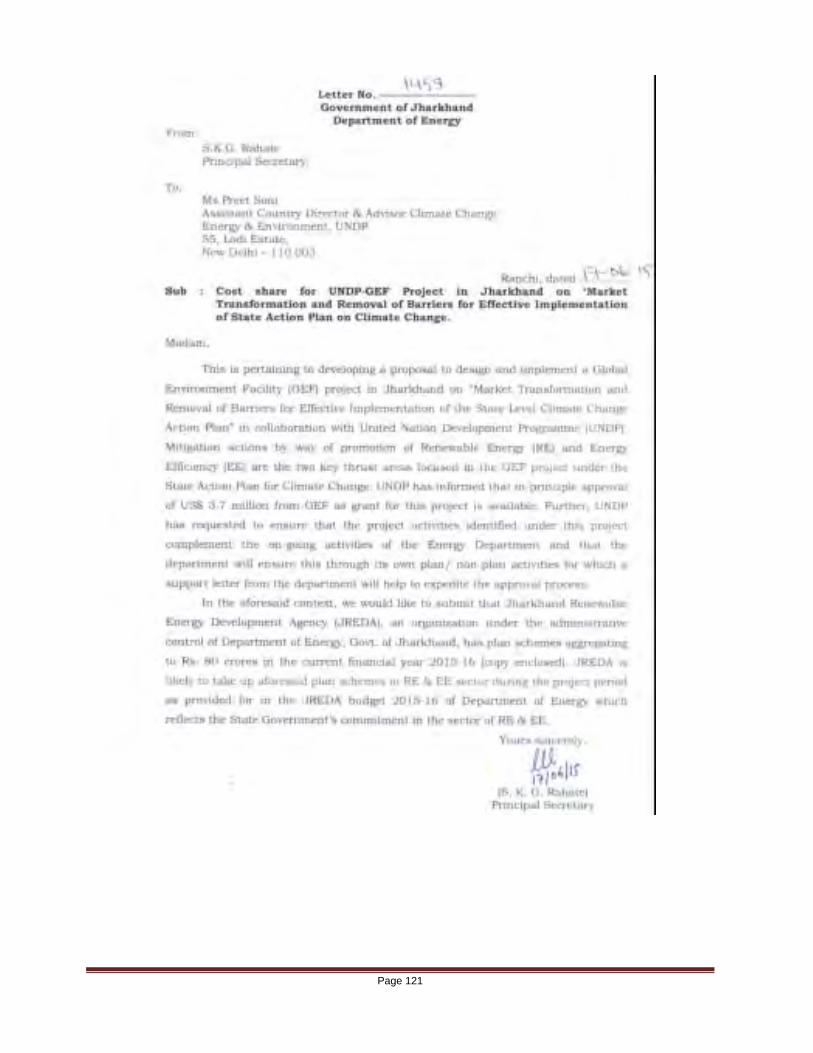
Page 121

Page 122

Page 123

Page 124
ANNEXURE C: TERMS OF REFERENCE
Central Project Management Unit (CPMU)
National Project Director (NPD) The NPD will lead and provide strategic direction to the CPMU while also actively providing the necessary linkages and co-ordination with PSC and TAC members as well as with other high-level state and central level government officials. Scope of work The following is the proposed scope of activities for the NPD:
Organize/convene PSC and TAC meetings as per UNDP and MoEFCC procedures.
Facilitate interaction and communication with other Ministries and Governmental departments, and agencies and missions, at both the central and state levels.
Provide overall guidance to the Project Management Unit (PMU) and State Project Management Units (SPMU)
Approve Terms of Reference for CPMU and SPMU staff.
Review project budget revisions, annual progress reports, quarterly progress reports, FACE (Fund Authorisation and Certification of Expenditures) annual work plan, facilitate audits, and facilitate any other administrative arrangements as required by MoEFCC and/or UNDP.
Ensure that the independent mid-term and terminal evaluations occur at appropriate times in the project cycle, and have overall responsibility for the consideration and implementation of the evaluations’ recommendations.
Ensure timely progress of activities and project implementation as per the ProDoc. Ensure that all required changes to the ProDoc take place, are based on changing project circumstances or on lessons learned during project implementation, and all significant changes are fully documented and justified, and are formally signed off by the NPD/PSC/TAC.
Ensure that the necessary central and state government and key NGO and other stakeholder support required is mobilised to achieve the project’s milestones, and to ensure the high quality and relevance of project outputs.
Guide the preparation of Annual Work Plans and adhering to physical and financial progress; timely submission of QPR [Quarterly Progress Reports], FACE [Fund Authorisation and Certificate of Expenditure] and APR/PIR [Annual Progress Reports/Project Information Report].
National Project Manager (NPM) The NPM will oversee all aspects of the implementation of the project. The NPM will also have to effectively co-ordinate all activities of the project and interact closely with the SPMUs and ASA, reporting progress and problems if any to the NPD on a regular basis. The NPM will also look after any administration requirements as well as financial aspects of the project. Scope of work The scope of activities envisaged for the NPM is as follows:
As co-ordinator of the project and with inputs from other CPMU and SPMU members
Oversee the day-to-day planning, implementation and monitoring of all project activities.

Page 125
Coordinate and manage the project’s Inception Workshop and the timely preparation of a comprehensive Inception Report.
Prepare project work plans, including technical requirements, their timing, and their budgets.
Facilitate the work of project consultants, SPMUs and ASAs.
Monitor project progress towards project results by maintaining a hands-on overall knowledge of, and personal involvement with, all project activities.
Identify any gaps in project activities and pro-actively make any required adjustments.
Prepare progress reports (quarterly and annual), FACE, annual work plans and budgets, facilitate audits, and be responsible for any other necessary documentation required by UNDP, MoEFCC and the PSC, and report recommendations to the PSC/TAC and implement PSU/TAC recommendations as appropriate.
Manage the day-to-day timely progress of activities and project implementation as per the ProDoc or any agreed changes to the ProDoc. Ensure that any significant changes as per the ProDoc are fully documented and formally signed off by both the NPD and the PSC/TAC.
Manage and support the undertaking and elaboration of project monitoring and evaluation reports (midterm, terminal etc.) to MoEFCC and UNDP/GEF.
Prepare and approve the Terms of Reference for consultants and subcontracts and for any equipment procurement.
Manage disbursement of funds, maintenance of accounts as per requirements of UNDP, and provide inputs to internal and external audits.
Liaise with counterparts and main stakeholders to ensure their roles are appropriately integrated into the project as envisaged, or as agreed as the project progresses.
Manage the day-to-day work priorities, workload and outputs of the SPMU members and Administration & Finance.
Be responsible for the recruitment, coordination, and outputs and funding of the SPMUs.
Supervise the performance of the project team members to ensure that all tasks areexecuted in a
sound and timely manner, to meet the objectives of the project.
Manage procurement, including supervision of contracts and staffing requirements of the project, to
comply with UNDP and MoEFCC/Indian Government rules andregulations.
Ensure the project’s coordination and coherence with other programs, projects and activities
onenergy, climate change and environment carried out by other UN Agencies, other international
organizations, the private sector, NGOs, Academia and the Government in India - and regionally and worldwide as relevant.
Prepare and present timely and accurate project status reports to the PSC/TAC.
Preparation of Annual Work Plans, ensuring physical and financial progress as per AWP; timely submission of QPR [Quarterly Progress Reports], FACE [Fund Authorisation and Certificate of Expenditure] and APR/PIR [Annual Progress Report/Project Information Report].

Page 126
State Project Management Unit (SPMU)
SPMU Coordinator (SPMUC) The state coordinators will coordinate with state level agencies, provide need-based support to ASAs, monitor the implementation of activities and report the field level issues to the CPMU. Scope of work Co-ordinate project activities within the state in co-ordination with the ASAs and other members of
SPMU as well as CPMU
Collate information and documentation for the investment project locations in the state and report on progress and / or problems to the NPM
Co-ordinate with state-level agencies to ensure participation and co-operation as required and solicit advice through the NPM from the state representatives on the TAC if required
Dialogue with the NPM and other state-level members on a regular basis (informally at least once a month and formally at least once a quarter through the quarterly reporting process) to facilitate cross pollination of ideas and learnings
Provide relevant state-level information and contacts to facilitate consultancy assignments
Field visits and monitoring of the given set of investment project locations.
SPMU Renewable Energy Expert (SPMU member) Scope of Work
Coordinate the Renewable Energy (RE) aspects of all project activities.
Maintain an ongoing updated knowledge and interaction with the key RE technology and service providers whose activities are relevant to the project activities.
Organize the selection of consultants for carrying out the RE aspects of project activities.
Coordinate the RE aspects of the investment projects development and deployment in the project including close coordination with ASAs.
Closely coordinate with ASAs finalising technology suppliers and service providers for investment projects
Coordinate the RE aspects of the investment projects supply and service providers involved in the project.
Coordinate the conduct of the RE aspects of RE policy and regulatory project aspects of the project investment project aspects.
Coordinate the assessment, development and deployment of the RE aspects of the financial and other support for project investment project.
Organize the RE aspects of the development, launch and management of the project website, publications, communications and knowledge management under the project.
Oversee the design, delivery and evaluation of the RE aspects of awareness and training programmes.
Network with all RE stakeholders to strengthen the awareness, capacity building and dissemination work under the project.

Page 127
SPMU Energy Efficiency Expert (SPMU Member) Scope of work
Coordinate the Energy Efficiency (EE) aspects of all project activities.
Maintain an ongoing updated knowledge and interaction with the key EE technology and service providers whose activities are relevant to the project activities.
Organize the selection of consultants for carrying out the EE aspects of project activities.
Coordinate the EE aspects of the investment projects development and deployment in the project including close coordination with ASAs.
Closely coordinate with ASAs finalising technology suppliers and service providers for investment projects
Coordinate the EE aspects of the investment projects supply and service providers involved in the project.
Coordinate the conduct of the EE aspects of EE policy and regulatory project aspects of the project investment project aspects.
Coordinate the assessment, development and deployment of the EE aspects of the financial and other support for project investment project.
Organize the EE aspects of the development, launch and management of the project website, publications, communications and knowledge management under the project.
Oversee the design, delivery and evaluation of the EE aspects of awareness and training programmes.
Network with all EE stakeholders to strengthen the awareness, capacity building and dissemination work under the project.
SPMU Finance and Administration Manager (SPMU Member)
Scope of work
Responsible for processing all payments Produce the required financial statements as needed, keep sound checks and balances in place to
ensure proper use of finances under appropriate headings, and report on financial expenditure and commitments.
Coordinate timely completion of annual audit. Prepare quarterly expenditure reports and ensure their timely submission to CPMU and then to
UNDP. Be responsible for administrative and secretarial matters. Arrange logistics, including travel and organization of meetings/workshops etc. Assist in the processing and reporting of all project co-financing and expenditures.
Assigned State Agencies (ASAs) The implementation of investment projects under the project during implementation phase will be led by the “ASAs”. ASAs are an extended arm of the SPMU, and will be JREDA and MANIREDA for Jharkhand and Manipur respectively. They will on a continuous basis work very closely with the SPMU and SPMU RE and EE experts.

Page 128
Scope of work The activities envisaged for an ASAs is broadly as follows:
For the development and implementation of investment projects (to be guided and structured by the SPMU)
o Consultations with target groups: The ASAs will carry out ongoing consultations with the target groups in the selected project locations to create awareness about the proposed initiative and get feedback.
o Preparation of the Detailed Project Report (DPR) for investment projects in line with SPMU templates: The ASA will carry out survey/field work to prepare a DPR for the investment project in the selected locations. The DPR will give details of the number of potential investment projects, replication and scale up installations, applicable financing mechanisms, implementation schedule, cost-benefit analysis, etc.
o Preparing a plan and providing assistance in mobilising /accessing financing for the investment projects: The capital expenditure on interventions are likely to be met through a combination of grants/subsidies, equity investment by the end-users, and bank loans. The ASAs will prepare a financing plan, which will include the pooling of grants/subsidies/ loans available under various government programmes and will assist the end-user(s) in accessing this finance.
o Assistance in identification of technology supplier: The ASA will assist the SPMU in identifying/short-listing one or more technology /service suppliers for the applicable investment project.
o Facilitating and supervising the implementation phase: While the physical implementation will be undertaken by the relevant technology/service providers, the ASAs on behalf of the SPMU will facilitate and supervise the implementation by closely involving Renewable Energy and EE experts at SPMU.
o Training of beneficiaries: The ASAs will coordinate the training of beneficiaries in the appropriate and optimal utilisation of the technology. The technical experts for conducting the training will be provided by technology suppliers and/or by the SPMU.
o Handholding support post-installation: The ASAs will provide handholding support to the user/beneficiary after the installation of the relevant RE and EE technology systems. The ASA will ensure that appropriate after-sales and servicing support is made available to the end user/ beneficiary by the technology supplier(s).
Reporting on progress of implementation – to the SPMU coordinator: The ASA will send monthly progress reports to the SPMU as per the format supplied by the SPMU.
Documentation of experience and lessons: The ASA will document the progress and results of the investment project(s). The documentation will follow the template(s) provided by the SPMU.
Facilitation of study tours and training towards replication and scaling up: Post-installation, the ASA will provide local facilitation to study tours by potential end-users from other investment project locations across states as well as helping conduct trainings for the replication and scaling-up phases.

Page 129
ANNEXURE D: COMPARATIVE TABLE FOR EMISSION REDUCTION CALCULATION
S. No.
Investment Projects
Parameters Duratio
n
Energy Savings & Emission Reductions due to Implementation of Investment Projects
Designed with Technical Support from UNDP‐GEF
Project
Energy Saving & Emission Reduction from State‐wide
Implementation of Investment Projects due to UNDP‐GEF Project
Interventions
Total Energy Savings (kWh) &
Emission Reduction (tCO2e)
Total Energy Savings (MWh)
& Emission Reduction
(Million tCO2e)
Jharkhand Manipur Jharkhand Manipur
1 LED Street Lighting
Total Energy Savings (kWh) 2030 14,935,800 3,902,580 963,600,000 51,224,976 1,014,824,976 1,014,825
Total GHG Abatement (tCO2e) 2030 25,092 6,088 1,618,848 79,911 1,698,759 1.70
Cost of Abatement USD/tCO2 4 1 4 1
2 Solar PV Roof‐Top
Total Energy Generation (kWh)
2030 1,361,415 262,800,000 210,240,000 262,800,000 473,040,000 473,040
Total GHG Abatement (tCO2e) 2030 2,287 409,968 353,203 409,968 763,171 0.76
Cost of Abatement USD/tCO2 9 3 3 3
3 Solar PV Parks
Total Energy Generation (kWh)
2030 NA 210,240,000 NA 210,240,000 210,240,000 210,240
Total GHG Abatement (tCO2e) 2030 NA 327,974 NA 327,974 327,974 0.33
Cost of Abatement USD/tCO2 NA 2 NA 2
4 EE Public Buildings
Total Energy Savings (kWh) 2030 24,506,064 1,878,398 196,048,512 39,446,357 235,494,869 235,495
Total GHG Abatement (tCO2e) 2030 38,426 2,930 307,404 61,536 368,940 0.37
Cost of Abatement USD/tCO2 ‐30 ‐5 ‐30 ‐5
5 EE
Municipal Pumping
Total Energy Savings (kWh) 2030 182,448,059 12,124,015 547,344,177 36,372,046 583,716,223 583,716
Total GHG Abatement (tCO2e) 2030 306,513 18,913 919,538 56,740 976,279 0.98
Cost of Abatement USD/tCO2 ‐31 ‐30 ‐31 ‐30
Total Energy Savings/Generation 2030 223,251,338 490,944,993 1,917,232,689 600,083,379 2,517,316,068 2,517,316
Total GHG Abatement 2030 372,318 765,874 3,198,993 936,130 4,135,124 4.14

Page 130
Possible Indirect Benefit of UNDP‐GEF Intervention in Other Sectors Using Level 2 Causality Factor (CF=40%)
6 RE ‐ Wind
Total Energy Generation (kWh)
2030
NA
1,291,399,200 794,707,200 2,086,106,400 2,086,106
Total GHG Abatement (tCO2e) 2030 2,169,551 1,239,743 3,409,294 3
Cost of Abatement INR/tCO2e ‐5 ‐5
7 Ag/Irrigatio
n
Total Energy Savings (kWh) 2030
NA
88,716,000 3,600,000 92,316,000 92,316
Total GHG Abatement (tCO2e) 2030 149,043 5,616 154,659 0
Cost of Abatement USD/tCO2 26 16
8 Domestic/ Residential
Total Energy Savings (kWh) 2030
NA
4,793,068,364 404,110,713 5,197,179,076 5,197,179
Total GHG Abatement (tCO2e) 2030 8,052,355 630,413 8,682,768 9
Cost of Abatement USD/tCO2 6.1 ‐0.8
9 Solar
Total Energy Generation (kWh)
2030
NA
20,971,440,000 1,103,760,000 22,075,200,000 22,075,200
Total GHG Abatement (tCO2e) 2030 14,092,808 688,746 14,781,554 15
Cost of Abatement USD/tCO2
Total Energy Savings/Generation 2030 NA
27,144,623,564 2,306,177,913 29,450,801,476 29,450,801
Total GHG Abetment 2030 24,463,756 2,564,518 27,028,274 27
Total Energy Savings and GHG Abatement form Direct and Indirect UNDP‐GEF Intervention
Direct Energy Savings (MWh) 2,517,316
Indirect Energy Savings (MWh) 29,450,801
Total (Direct + Indirect) Energy Savings (MWh) 31,968,118
Direct GHG Emissions Reduction (Million tCO2e) 4.14
Indirect GHG Emissions Reduction (Million tCO2e) 27.03
Total (Direct + Indirect) Emissions Reduction (Million tCO2e) 31.16

Page 131
ANNEXURE E: EMISSION REDUCTIONS CALCULATION
Direct Emissions Reductions The 9 investment projects (4 in Jharkhand and 5 in Manipur) and approximately 1,000 replication EE and RE projects implemented in collaboration with the India Market Transformation and Barrier Removal for Effective Implementation of SAPCC Project will result in direct greenhouse gas emission reductions of 304,250 tonnes of CO2 equivalent during the 4-year lifetime of the project. Assuming an average economic lifetime of the EE and RE technologies, the cumulative direct greenhouse gas emission reduction will be 1.382 million tonnes CO2 over the lifetime of the investments. Direct Post-Project Emission Reductions The project does not explicitly include the establishment of financial mechanisms that will continue to operate post-project end. Although some risk mitigation mechanism will be developed during the project which may continue to operate post-project end, however the project is not putting any fund for its continuance. These mechanisms may be continued to operate on financial support from states and the MOEFCC or from the partner agencies like EESL and SECI. Indirect emissions reductions The India Market Transformation and Barrier Removal for Effective Implementation of SAPCC Project have several elements for addressing the barriers in implementation of EE and RE investment projects and technology packages. These elements include developing a framework for implementation, mobilizing the investment from various sources including the private sector, capacity building, sharing of information with other states, etc. This will have significant impact on post project replication and consequently on the indirect emission reductions. However, it is also taken into the consideration that the majority of the users of these EE and RE technologies are both urban and rural communities which also include the marginalised sections of society including women and children and a conservative approach is followed while estimating the indirect emission reduction. As per the GEF manual37, using the top-down methodology, the project will also promote the implementation of medium and large solar and wind projects using the modules introduced under RE sector mitigation actions and EE DSM in agriculture, EE lighting and appliances in domestic and EE in power sectors under the modules introduced under EE sector mitigation actions as a result of market transformation and barrier removal under the project. The implementations of these EE and RE projects covering all the sectors will continue even after the completion of India Market Transformation and Barrier Removal for Effective Implementation of SAPCC Project. The mitigation projects that will be implemented after the completion of UNDP-GEF project, using the GEF causality factor of 40% (i.e. Level 2 = “the GEF contribution is modest and substantial indirect emissions reductions can be attributed to the baseline,” GEF causality = 40 percent), the indirect emission reduction that can be attributed to UNDP-GEF project is 27.02 million tonnes of CO2 equivalent (see para 47(a), GEF/ C.33/ Inf.18, April 16, 2008). Cost effectiveness Without GEF support, the mitigation actions identified in the SAPCC will not be implemented. In that scenario, the monetary benefits associated with avoided use of fossil fuel and reduced emissions would not be realized. States have an obligation to take action to successfully implement their SAPCCs in order to realise the goals of NAPCC. Rapid urbanisation, vulnerable existing infrastructure to climate disasters and natural hazards in urban sector need huge investments. This cost of rebuilding and responding to the disasters will be low if the existing infrastructure is climate proofed and diversified energy dependence on alternative sources of energy. The first is in terms of diversifying energy sources to alternatives such as solar PV and wind energy. Energy efficiency in public lighting and buildings is already identified as the most
37 Manual for calculating GHG benefits of GEF projects: Energy Efficiency and Renewable Energy. GEF/ C.33/ Inf.18, April 16, 2008.

Page 132
cost-effective intervention in the selected states. Although the capital cost of renewable energy interventions are not cost-effective in short term compared with fossil fuel based electricity generation, due to the high potential for scale up and replication across many states in India, the capital cost of these technologies are being brought down over a period time. This can be seen already in the case of solar PV. Overall, the project is expected to achieve potential cumulative direct and indirect CO2 emission reductions of about 31.16 million tCO2 during the economic lifetime of the interventions that will be carried out under the project. Detailed Calculation of Direct Emission Reductions Several types of EE and RE technology interventions have been proposed depending upon the requirements under SAPCCs. Reduction in emission is calculated by taking into account the emission reduction corresponding to each EE and RE technology. Table 49 below provides the calculation for emission reduction per year from the demonstration projects.
Table 47: Emission Reduction from Investment Projects
S. N. Investment Project GHG Emissions Reduction (4 Years)
(tCO2e) Number of Projects
Jharkhand Number of Projects
Manipur
1. LED Street Lighting 1 6,691 1 1,6232. EE in Public Buildings 1 10,979 1 7813. EE in Municipal
Pumping 1
81,7371
5,044
4. Solar PV Rooftop 1 610 1 109,3255. Solar PV Park 0 - 1 87,460Total 4 100,017 5 204,233 Total GHG Emissions Reduction in 4 Years tCO2e 304,250
The ratio of number of EE and RE projects to be implemented in replication phase to the demonstration phase is 1,000/5 = 200. So it is assumed that the reduction in emission per year from the implementation of replication projects would be 200 times the reduction in emission per year from demonstration projects.

Page 133
ANNEXURE F: SUMMARY REPORT ON STAKEHOLDERS CONSULTATIONS
Three stakeholder consultation workshops have been organised in the two phases in addition to one to one consultation with state level stakeholders. In the first phase, state workshops were focused on consultations with stakeholders at state level and were organised at the state capitals of the two targeted states. In the second phase consultation workshop with potential partners and the LFA workshop were organised at New Delhi. The highlights of the workshops are provided in Table 4850 below:
Table 48: Summary details of stakeholders' workshops
Phase – I (State level workshops) Participation
Ranchi, Jharkhand (December 15, 2014)
Around 35 participants from government agencies, financial institutions, technology/service providers, academics, technical experts and private sector. Majority belonging to Ranchi and a few from outside Ranchi and other parts of Jharkhand.
Imphal, Manipur (February 12, 2015) Around 30 participants from government agencies, financial institutions, technology/service providers, academics, technical experts and private sector. Majority from Imphal, a few technology suppliers from other parts of the state.
Phase – II
New Delhi (April 8, 2015) – LFA National workshop
Around 10 participants including UNDP, MoEF, MNRE, BEE, State Nodal Agency for Manipur, JREDA and national consultant team
As the project team sought to evolve and detail the project through the initial listing of major mitigation actions and investment projects, the stakeholder consultations in the states were geared towards not just sharing initial thoughts of the project team but importantly to also harvest local knowledge and views, particularly of those working on RE and EE projects, renewable energy/EE industry and implementation of government programmes. These discussions were seen as critical in shaping implementation aspects and institutional framework for the proposed project. Broadly, the questions posed to stakeholders in the various state-level consultations were as follows:
What are the key RE and EE activities (existing/potential) that can benefit from project and where are the gaps?
In which locations such projects will have high potential of success and impact?
Who could be the potential partners (Government agencies, NGOs, Community based organisations or CBOs, private and public sector institutions, financial institutions) for undertaking investment projects and replication?
What specific ideas do potential partners have to offer in terms of investment projects to provide RE/EE project activities?
What kind of PPP based models that can be considered for implementation in the state?
Who are the lead financiers in the state?
Which technology suppliers and service providers are most active in the state?
What are the key barriers to implementation of RE and EE solutions?

Page 134
At the LFA national workshop, these project ideas took more clear shape in terms of implementation aspects and recognition of the clean management structure for the project and agreement on cost shares. Key Highlights of the State Level Project Workshops, held at Ranchi, Jharkhand and Imphal, Manipur Stakeholder Analysis and Management: at both state level workshops, the importance proposer stakeholder management was highlighted. A careful identification of the relevant stakeholders and their classification as per the power-interest matric was highlighted to be important so that proper inputs can be obtained and measures may be undertaken to do a proper stakeholder management. An activity looking into stakeholder analysis and management was suggested to be included in the project implementation activities. Accordingly proper capacity building strategy for all relevant stakeholders should be designed, in a way to enable continuum in training and capacity building exercise even after project completion. Need for careful selection of state/local level implementers: State-level interest, financial resources and capacity and interest of State Nodal Agencies (SNAs) vary from state to state. This was emphasized, must be assessed and borne in mind while developing state-level activities and identifying project partners. Also important to understand at the local-level is the manner in which various RE/EE related activities are organised in various locations. This is well-understood by local community-based organisations, cooperatives and NGOs and they could become important partners in project conceptualisation and in some cases execution. Use of energy efficiency devices: the consultations in both the states, brought out, promotion of use of energy efficient devices/appliances in buildings is an important action, which should be focussed on in the project. The states emphasized that to start with energy audit and adoption of energy efficiency devices in all government buildings must be taken up. A project activity looking into aspects related to this must be designed. Establishment of state level project management cells: it was widely highlighted during the state workshops that, in order to ensure smooth implementation of the project and maintain maximum on ground relevance, it is important for the project to have state level project management units. The State Renewable Energy Development Agencies in the states have paucity of manpower and staff with technical know-how of RE and EE. Thus, the state level project units should be able to strengthen the state capacities in terms of technical RE and EE staff to complement SREDAs capacity. Involvement of the private sector: both, the state of Manipur and state of Jharkhand have very limited participation of the private sector in RE and EE both inters service providers and financing. Thus, the project will be looked upon to improve the engagement of the private sector especially private sector funding. In this regard, tapping on the CSR budgets and devising innovative financing solutions engaging public and private sector entities must be evolved as part of the project. Major Conclusions of National Project Workshop held at New Delhi, on 8th April 2015 Workshop Participants
Name Designation Organisation
Dr. V K Jain Director MoNRE, Govt. of India
Mr. D K Tewatia Director, JREDA Govt. of Jharkhand
Mr. Homeshwar Singh
Director Department of Environment, Govt. of Manipur
Mr. Braj Kumar Project Manager Department of Environment, Govt. of Manipur
Mr. Sanjay Seth Energy Economist - NPM
BEE, Govt. of India
Dr. S Satapathy Director MoEF&CC, Govt. of India

Page 135
Name Designation Organisation
Ms Preeti Soni Assistant Country Director
UNDP, India
Mr Saba Kalam Project Manager UNDP, India
Mr Sanjay Dube Director, South Asia International Institute for Energy Conservation (IIEC) (Project Consultant)
The major conclusions of the National Workshop are summarised below: State Level Validation: It was highlighted that all project activities and investment projects should be validated by the states. The project consultant team confirmed and informed the workshop participants that relevant validations have been conducted in finalizing the project investment projects and all activities shave been designed in close consultation with the state needs and gaps. Cost Commitment from the states: The state representatives at the national workshop meeting confirmed their cost shares support to the UNDP GEF SAPCC project. While this has been confirmed to MoEFCC and UNDP, the relevant cost share letters from the state are in the process and will soon be finalized and sent to all relevant agencies. Private Sector Participation and Financing: it was highlighted by the central ministries that the project should be designed in way that it ensured less use of public money and greater involvement and financing from the private sector. The project team informed the ministry that involvement and participation of the private sector has been in the core design of the project. The relevant private industry players have also been consulted during the state level consultations. The focus of the project has been to promote public private partnerships in implementation of selected mitigation actions. The project will also ensure development of suitable innovative financing mechanism during the implementation phase, which has clear leveraging of the private money. Project Management Structure: it was emphasized during the meeting that the proposed project management structure in the project should be designed in a way that it has a relatively lean structure at the centre and gives more power and support in terms of management at the state level. It was felt that the real activities are to happen at the state level, thereby all efforts should be made to provide the selected states the enough institutional strength to implement the project. Thus, taking into account the suggestion, the project management structure was accordingly amended and number of members in the state project management unit was increased and those in central project management unit decreased. It was emphasised that the project steering committee must be given powers to make amendments to the project management structure as deemed essential during the project implementation phase. Clear assignment of roles and responsibilities: The stakeholders highlighted clear defining of roles and responsibilities for all those involved in project implementation to avoid any confusion and overlaps. The same has been accounted for in the project design. List of Participants in the State Workshops Manipur
S. No
Participant
1. Chief Secretary, Govt. of Manipur
2. Addl. Chief Secretary (Works), Govt. of Manipur

Page 136
S. No
Participant
3. Principal Secretary (Power), Govt. of Manipur
4. Principal Secretary (Planning), Govt. of Manipur
5. Principal Secretary (Finance), Govt. of Manipur
6. Principal Secretary (Agriculture), Govt. of Manipur
7. Secretary (MAHUD), Govt. of Manipur
8. OSD (Forests & Environment), Govt. of Manipur
9. Principal Chief Conservator of Forest, Govt. of Manipur
10. Director (Environment), Govt. of Manipur
11. Managing Director, MSPDCL, Govt. of Manipur
12. Managing Director (Generation), MSPC Ltd.
13. Chief Engineer (PWD), Govt. of Manipur
14. Director (MANIREDA), Govt. of Manipur
15. Director (Agriculture), Govt. of Manipur
16. Director (MAHUD), Govt. of Manipur
17. Director (Planning), Govt. of Manipur
18. Executive Officer (Imphal Municipal Council), Manipur
19. Nodal Officer (MANIREDA), Govt. of Manipur
20. Nodal Officer (Transmission & Distribution), MSPC Ltd. Govt. of Manipur
21. Nodal Officer (Generation), MSPC Ltd. Govt. of Manipur
22. Nodal Officer (Agriculture), Govt. of Manipur
23. Nodal Officer (Forest), Govt. of Manipur
24. Nodal Officer (MAHUD), Govt. of Manipur
25. Nodal Officer (PWD), Govt. of Manipur
26. Joint Director (Environment), Govt. of Manipur
27. Junior Scientific Officer (Environment), Govt. of Manipur
28. Research Officer (Environment), Govt. of Manipur
29. Manager (State Bank of India), Main Branch, Manipur
30. Manager (United Bank of India), Main Branch, Manipur
31. Manger (Rural Bank), Main Branch, Manipur
32. NABARD
33. IFARD
34. M/S Mayol (Local Entrepreneur)
35. M/S Mangal (Local Entrepreneur)
36. President, NGO Forum, Manipur
37. President, United NGO Mission

Page 137
Jharkhand
S. No Stakeholder 1. Director General SKIPA & Additional Chief Secretary, Department of Drinking Water &
Sanitation, Govt. of Jharkhand 2. Principal Secretary, Department of Planning and Development/ Department of Energy, Govt. of
Jharkhand 3. Principal Secretary, Department of Forest and Environment, Govt. of Jharkhand 4. PCCF- HoFF, Department of Forest and Environment, Govt. of Jharkhand 5. PCCF, ED, Department of Forest and Environment, Govt. of Jharkhand 6. PCCF (Wildlife)& Special Secretary, Department of Forest and Environment, Govt. of
Jharkhand 7. APCCF, Department of Forests & Environment, Govt. of Jharkhand 8. CCF, Research, Department of Forests & Environment, Govt. of Jharkhand 9. Additional PCCF, CAMPA & Climate Change, Department of Forests and Environment, Govt.
of Jharkhand 10. Vice Chancellor, Birsa Agriculture University, Ranchi 11. APCCF, Regional Office, MoEF&CC 12. CF, Department of Forests & Environment Ranchi¸ Govt. of Jharkhand 13. Chief Engineer, Jharkhand Vidyut Nigam Limited, Ranchi, Govt. of Jharkhand 14. CCF, Department of Forest& Environment, Ranchi, Govt. of Jharkhand 15. Joint Secretary, Disaster Management, Govt. of Jharkhand 16. Environmental Engineer, State pollution Control Board, Ranchi, Govt. of Jharkhand 17. Deputy Director, Department of Science & Technology, Govt. of Jharkhand 18. Director, Department of Industries, Govt. of Jharkhand 19. Assistant Director, Department of Agriculture, Govt. of Jharkhand 20. Director, JREDA, Govt. of Jharkhand 21. Professor, IIM, Ranchi 22. Professor, BIT- Mesra, Ranchi 23. General Manager, NABARD, Ranchi 24. AGM SLBC, Bank of India, Ranchi 25. AGM, Union Bank, Ranchi 26. CPM, REC, Ranchi 27. DGM, MECON, Ranchi 28. Manager, Environment & Planning, Tata Steel 29. Manager, Millennium Synergy Pvt. Ltd., Ra

Page 138
ANNEXURE G: COUNTRY OFFICE SUPPORT SERVICE (COSS) AGREEMENT
STANDARD LETTER OF AGREEMENT BETWEEN UNDP AND THE GOVERNMENT FOR THE PROVISION OF
SUPPORT SERVICES
HOW TO USE THIS LETTER OF AGREEMENT
This agreement is used to provide appropriate legal coverage when the UNDP country office provides support services under national execution.
This agreement must be signed by a governmental body or official authorised to confer full legal coverage on UNDP. (This is usually the Minister of Foreign Affairs, the Prime Minister /or Head of State.) The UNDP country office must verify that the government signatory has been properly authorised to confer immunities and privileges.
A copy of the signed standard letter will be attached to each PSD and project document requiring such support services. When doing this, the UNDP country office completes the attachment to the standard letter on the nature and scope of the services and the responsibilities of the parties involved for that specific PSD/project document.
The UNDP country office prepares the letter of agreement and consults with the regional bureau in case either of the parties wishes to modify the standard text. After signature by the authority authorised to confer immunities and privileges to UNDP, the government keeps one original and the UNDP country office the other original. A copy of the agreement should be provided to UNDP headquarters (BOM/OLPS) and the regional bureau.
Dear [name of government official], 1. Reference is made to consultations between officials of the Government of India (hereinafter referred to as “the Government”) and officials of UNDP with respect to the provision of support services by the UNDP country office for nationally managed programmes and projects. UNDP and the Government hereby agree that the UNDP country office may provide such support services at the request of the Government through its institution designated in the relevant programme support document or project document, as described below. 2. The UNDP country office may provide support services for assistance with reporting requirements and direct payment. In providing such support services, the UNDP country office shall ensure that the capacity of the Government-designated institution is strengthened to enable it to carry out such activities directly. The costs incurred by the UNDP country office in providing such support services shall be recovered from the administrative budget of the office. 3. The UNDP country office may provide, at the request of the designated institution, the following support services for the activities of the programme/project: (a) Identification and/or recruitment of project and programme personnel; (b) Identification and facilitation of training activities; (c) Procurement of goods and services; 4. The procurement of goods and services and the recruitment of project and programme personnel by the UNDP country office shall be in accordance with the UNDP regulations, rules, policies and procedures. Support services described in paragraph 3 above shall be detailed in an annex to the programme support document or project document, in the form provided in the Attachment hereto. If the requirements for support services by the country office change during the life of a programme or project, the annex to the programme support document or project document is revised with the mutual agreement of the UNDP resident representative and the designated institution. 5. The relevant provisions of the [Insert title and date of the UNDP standard basic assistance agreement with the Government] (the “SBAA”), including the provisions on liability and privileges and immunities, shall apply to the provision of such support services. The Government shall retain overall responsibility for the nationally managed programme or project through its designated institution. The responsibility of the UNDP country office for the provision of the support

Page 139
services described herein shall be limited to the provision of such support services detailed in the annex to the programme support document or project document. 6. Any claim or dispute arising under or in connection with the provision of support services by the UNDP country office in accordance with this letter shall be handled pursuant to the relevant provisions of the SBAA. 7. The manner and method of cost-recovery by the UNDP country office in providing the support services described in paragraph 3 above shall be specified in the annex to the programme support document or project document. 8. The UNDP country office shall submit progress reports on the support services provided and shall report on the costs reimbursed in providing such services, as may be required. 9. Any modification of the present arrangements shall be effected by mutual written agreement of the parties hereto. 10. If you are in agreement with the provisions set forth above, please sign and return to this office two signed copies of this letter. Upon your signature, this letter shall constitute an agreement between your Government and UNDP on the terms and conditions for the provision of support services by the UNDP country office for nationally managed programmes and projects.
Yours sincerely,
________________________ Signed on behalf of UNDP
[Name] [Title: Resident Representative]
_____________________ For the Government [Name/title] [Date]

Page 140
Attachment
DESCRIPTION OF UNDP COUNTRY OFFICE SUPPORT SERVICES 1. Reference is made to consultations between [insert name of Designated institution], the institution designated by the Government of India and officials of UNDP with respect to the provision of support services by the UNDP country office for the nationally managed programme or project [insert programme or project number and title], “the Programme” [or “the Project”]. 2. In accordance with the provisions of the letter of agreement signed on [insert date of agreement] and the programme support document [or project document], the UNDP country office shall provide support services for the Programme [or Project] as described below. 3. Support services to be provided:
Support services (insert description)
Schedule for the provision of the support services
Cost to UNDP of providing such support services (where appropriate)
Amount and method of reimbursement of UNDP (where appropriate)
1. Recruitment of Project Staff To be recruited as per AWP
5,500 ATLAS billing
2. Recruitment of Consultants (i.e. Climate Experts, GIS Specialist, Innovative Finance Specialist, M&E Activities, etc.)
To be recruited as per AWP
7,000 ATLAS billing
3. Contractual service - Companies (i.e. procurement of equipment, annual audit)
To be engaged as per AWP
4,000 ATLAS billing
4. Payments To be arranged as per AWP
2,500 ATLAS billing
5. Workshops and training events To be organized as per AWP
3,000 ATLAS billing
4. Description of functions and responsibilities of the parties involved:

Page 141
ANNEXURE H: PROJECT ANNUAL TARGETS
Table 49: Project Annual Targets
Strategy Objectively Verifiable Indicators
Target Annual Targets
Year 1 Year 2 Year 3 Year 4
Project goal: Reduced GHG emissions achieved through implementation of RE and EE solutions at the state level as identified in the SAPCCs
Cumulative CO2 emission reduced from start of project to End-Of-Project (EOP), (tCO2e)
304,250 76,062 152,125 228,187 304,250
Project Objective: To support the effective implementation of specific energy efficiency and renewable energy climate change mitigation actions identified in the SAPCCs for Manipur and Jharkhand
Total energy savings achieved from implemented RE and EE mitigation actions by EOP, MWh Total installed capacity of RE systems (MW) by EOP Number of people benefitted directly or indirectly in the two states through the project interventions by the EOP (million)
190,452 28 17.8
47,613 0 0
95,226 5 3.2
142,839 25 15.9
190,452 28 17.8
Component 1: Framework for the implementation of climate change mitigation options in the selected states SAPCCs Outcome 1: Successful and sustainable implementation of priority CCM actions on energy generation and application of EE and RE technologies in the major energy end-use sectors in the selected states
Number of CCM actions implemented by the project in the states by EOP.
9 2 4 6 9
Output 1.1: Regularly updated GHG abatement cost curves at state level
Number of abatement cost curves prepared by year 1
4 4 4 4 4

Page 142
Strategy Objectively Verifiable Indicators
Target Annual Targets
Year 1 Year 2 Year 3 Year 4
Output 1.2: Selected prioritized RE and EE mitigation actions listed in Manipur and Jharkhand Action Plans on Climate Change for implementation
Number of prioritized RE and EE mitigation actions selected for implementation in the states by Year 1
9 9 9 9 9
Output 1.3: Designed and implemented common monitoring, reporting, and verification (MRV) system for the selected RE and EE mitigation actions of the Manipur and Jharkhand APCC, in a way to feedback into the SAPCC process
No. of monitoring, reporting, and verification (MRV) systems designed and available for implementation in the states by Year 3
5 0 0 5 5
Component 2: Catalyzing investments for implementation of selected RE and EE mitigation action Outcome 2: Enhanced states capability and capacity for identifying, designing, planning, financing and implementing selected RE and EE mitigation actions from their SAPCC
Number of locally designed, planned and financed RE and EE projects implemented in the states by EOP
9 2 4 6 9
Output 2.1: Completed evaluation of existing available loan mechanisms for projects developed as part of SAPCC targets
Number of loan mechanisms evaluated by Year 2
5 3 5 5 5
Output 2.2: Implemented non-grant financing instruments such as flexible debt finance (including long tenure low-interest loans)
Number of non-grant based financial instruments developed by Year 3
1 0 0 1 1

Page 143
Strategy Objectively Verifiable Indicators
Target Annual Targets
Year 1 Year 2 Year 3 Year 4
Output 2.3: Mobilized public and private sector funding
Amount of total funding mobilized for implementation (US$) by Year 4
12,000,000 2,000,000 6,000,000 3,000,000 1,000,000
Output 2.4: Established public private partnerships (PPP) for implementation and scaling up of selected RE and EE actions in Manipur and Jharkhand
Number of replication projects on the selected RE and EE mitigation actions implemented by the EOP
32 0 0 16 32
No. of PPP business models developed by Year 3
9 0 4 9 9
Output 2.5: Implemented nine RE and EE investment projects in Manipur and Jharkhand
No. of demo investment projects based on innovative financial models developed by end of year 1
9 9 9 9 9
No. of demo investment projects implemented by EOP
5 0 2 4 5
Output 2.6: Completed implementation manual and workshops for supporting the implementation of selected public private partnership models for RE and EE actions
No. of implementation manuals developed by Year 3 (one manual for each state)
2 0 0 2 2
No. of workshops conducted on sensitizing the state agencies on proposed models by Year 4
2 0 0 1 2
Component 3: Capacity development of concerned state level officials for implementation of respective SAPCC Outcome 3: Enhanced technical capability of state government in integrating climate change concerns within state sectoral development plans and budgets and undertaking MRVs efficiently for SAPCC actions, facilitated inter-state learning and coordination for SAPCCs
No. of sectoral state budgets for RE and EE activities are aligned with the budgets proposed under SAPCCs by Year 2
2 0 2 2 2

Page 144
Strategy Objectively Verifiable Indicators
Target Annual Targets
Year 1 Year 2 Year 3 Year 4
Output 3.1: Aligned state sectoral budgets for development plans to include climate change mitigation actions related expenses
Allotment of specific budget points for climate change actions in departmental budgets by Year 2
2 0 2 2 2
Output 3.2: Completed training and capacity building programs on the developed MRV systems for the State officials
No. of handbooks and guidelines prepared for MRV system by Year 3
2 0 0 2 2
No. of trainings undertaken on the new MRV system by EOP
5 0
0 1 4
Output 3.3: Established institutional mechanism for inter-state exchange of information and technology dissemination for Manipur and Jharkhand for implementation of SAPCC mitigation actions
No. of joint CCM actions discussed and planned for implementation between states by EOP
4 0 0 0 4
Output 3.4: Conducted inter-state study trips and stakeholder interaction workshops
No. of study trips undertaken by EOP
4 0 0 2 4
No of workshops undertaken by EOP
4 0 0 2 4
Output 3.5: Established and operational information dissemination system on lessons learnt from investment projects undertaken on priority RE and EE mitigation actions
No. of brochures, case study reports and other printed material published and disseminated by Year 4
10 2 6 8 10
Established web portal for information dissemination by starting year 4
1 0 0 0 1
No. of users of the system/year 2,500 0 2,500 2,500 2,500

Page 145
ANNEX I: SOCIAL AND ENVIRONMENTAL SCREENING
[The completed template, which constitutes the Social and Environmental Screening Report, must be included as an annex to the Project Document. Please refer to the Social and Environmental Screening Procedure for guidance on how to answer the 6 questions.]
Project Information
Project Information
1. Project Title Market Transformation and Removal of Barriers for Effective Implementation of the State-Level Climate Change Action Plans
2. Project Number 4606 3. Location
(Global/Region/Country) India
Part A. Integrating Overarching Principles to Strengthen Social and Environmental Sustainability
QUESTION 1: How Does the Project Integrate the Overarching Principles in order to Strengthen Social and Environmental Sustainability?
Briefly describe in the space below how the Project mainstreams the human-rights based approach
India faces a daunting energy access issue wherein nearly 300 million people lack access to electricity. Renewable energy and energy efficiency solutions provide robust methods of improving access to energy by both saving energy and making newer forms of energy available. By promoting renewable energy implementation and improving energy efficiency levels in the states, the project will go a long way in helping the country move towards greater energy access for its population. Although access to clean and affordable energy is not a rights based at the moment, but it will certainly help to improve living conditions and contribute towards poverty reduction. Therefore, it can be stated that it has a human dimension and the proposed project very carefully ties together this human rights based approach in its strategy and action plan.
Investment projects in India, especially energy sector, has to conduct Initial Environmental Evaluation (IEE) and subsequently Environmental Impact Assessment (EIA) as per MoEFCC rules and regulations. Therefore, the proposed project will ensure that each investment project will comply with these mandatory procedures.
Briefly describe in the space below how the Project is likely to improve gender equality and women’s empowerment
The project will also assist energy and gender linkages. The selected states under the project have large energy deficit and energy access is an issue. The proposed project will be contributing towards reducing this deficit through RE and EE interventions, and will also indirectly contribute to women empowerment. Women are most vulnerable due to the lack of energy access and shortage implications. The proposed project will work towards addressing this gap.

Page 146
Briefly describe in the space below how the Project mainstreams environmental sustainability
The principle of environmental sustainability is very well interwoven in the project design. The primary objective of the project to ensure implementation of RE and EE technologies in a way to reduce GHG emissions in the two states leading to environmental sustainability in the areas of focus. The project through the selected investment projects to be implemented during the project implementation phase will lead to direct GHG emission reduction and scale up activities after the project duration will further accentuate this impact. To develop a conservative estimate of the probable “order-of-magnitude” estimate of GHG emission reductions that are attributable to the current project, it is considered that the main sources of direct lifetime GHG emission reductions are through catalyzing investment activities: (a) Grid connected and off grid solar PV-based power generation; and (b) energy efficiency and energy conservation measures in municipalities like end-use efficiency of municipal street lighting and municipal water pumping. For energy efficiency interventions, the investment projects have been identified and the selection of technologies is also suggested. The final selection of technologies will take place at the time of project implementation. The related emissions reductions are included in the analysis in the project document, with the result that the estimates presented can be considered conservative and may vary at the time of project implementation. The project is also expected to influence and catalyze wider adoption of improved EE and RE technologies, establishing commercial viability of technologies, improving access to finance and increasing investors’ interest. Component 1 of the project deals with the development of framework for the effective implementation of climate change mitigation options in the State Action Plans for Climate Change (SAPCC). Under this component, project will work with selected states and develop an implementation and Monitoring, Reporting and Verification (MRV) framework, which can be shared with other states. The Component 2 focuses on catalysing investments for the application of feasible RE and EE measures. Under this component, the project will focus on catalysing the investments from both public and private sector stakeholders. Component 3 deals with the capacity development of relevant state government officials in selected states (Jharkhand and Manipur). Overall, the project is expected to achieve potential cumulative direct and indirect CO2 emission reductions of about 31.16 million tCO2 during the economic lifetime of the interventions that will be carried out under the project. Considering the US$ 3,744,500 contribution of the GEF for this project, the estimated unit abatement cost is about US$ 0.12/tonne CO2.
Part B. Identifying and Managing Social and Environmental Risks
QUESTION 2: What are the Potential Social and Environmental Risks? Note: Describe briefly potential social and environmental risks identified in Attachment 1 – Risk Screening Checklist (based on any “Yes” responses).
QUESTION 3: What is the level of significance of the potential social and environmental risks? Note: Respond to Questions 4 and 5 below before proceeding to Question 6
QUESTION 6: What social and environmental assessment and management measures have been conducted and/or are required to address potential risks (for Risks with Moderate and High Significance)?
Risk Description Impact and
Significance
Comments Description of assessment and management measures as reflected in the Project design. If

Page 147
Probability (1-5)
(Low, Moderate, High)
ESIA or SESA is required note that the assessment should consider all potential impacts and risks.
Risk 1: The project will result in abatement of GHG emissions; however some barriers to project implementation can potentially reduce the likely emissions reduction.
I = 2 P = 1
Low
Risk 2: implementation of pilot projects will require consumption of raw material, energy and water. Though the consumption of these will be less than conventional ways of implementing projects.
I = 2 P = 2
Low During the project implementation the private project developers will be asked to comply with SES guidelines
QUESTION 4: What is the overall Project risk categorization?
Select one (see SESP for guidance) Comments Low Risk ☐ Low
Moderate Risk ☐ High Risk ☐
QUESTION 5: Based on the identified risks and risk categorization, what requirements of the SES are relevant?
Check all that apply Comments
Principle 1: Human Rights ☐ NA Principle 2: Gender Equality and Women’s
Empowerment ☐ NA
1. Biodiversity Conservation and Natural Resource Management ☐
NA
2. Climate Change Mitigation and Adaptation ☐
NA. This project will contribute to reduced CO2
emissions. 3. Community Health, Safety and Working
Conditions ☐ NA
4. Cultural Heritage ☐ NA 5. Displacement and Resettlement ☐ NA 6. Indigenous Peoples ☐ NA

Page 148
7. Pollution Prevention and Resource Efficiency ☐
NA
Final Sign Off
Signature Date Description QA Assessor UNDP staff member responsible for the Project, typically a UNDP Programme Officer. Final
signature confirms they have “checked” to ensure that the SESP is adequately conducted.
QA Approver UNDP senior manager, typically the UNDP Deputy Country Director (DCD), Country Director (CD), Deputy Resident Representative (DRR), or Resident Representative (RR). The QA Approver cannot also be the QA Assessor. Final signature confirms they have “cleared” the SESP prior to submittal to the PAC.
PAC Chair UNDP chair of the PAC. In some cases PAC Chair may also be the QA Approver. Final signature confirms that the SESP was considered as part of the project appraisal and considered in recommendations of the PAC.

Page 149
SESP Attachment 1. Social and Environmental Risk Screening Checklist
Checklist Potential Social and Environmental Risks
Principles 1: Human Rights Answ
er (Yes/No)
1. Could the Project lead to adverse impacts on enjoyment of the human rights (civil, political, economic, social or cultural) of the affected population and particularly of marginalized groups?
No
2. Is there a likelihood that the Project would have inequitable or discriminatory adverse impacts on affected populations, particularly people living in poverty or marginalized or excluded individuals or groups? 38
No
3. Could the Project potentially restrict availability, quality of and access to resources or basic services, in particular to marginalized individuals or groups?
No
4. Is there a likelihood that the Project would exclude any potentially affected stakeholders, in particular marginalized groups, from fully participating in decisions that may affect them?
No
5. Are there measures or mechanisms in place to respond to local community grievances? No
6. Is there a risk that duty-bearers do not have the capacity to meet their obligations in the Project?
No
7. Is there a risk that rights-holders do not have the capacity to claim their rights? No
8. Have local communities or individuals, given the opportunity, raised human rights concerns regarding the Project during the stakeholder engagement process?
No
9. Is there a risk that the Project would exacerbate conflicts among and/or the risk of violence to project-affected communities and individuals?
No
Principle 2: Gender Equality and Women’s Empowerment
1. Is there a likelihood that the proposed Project would have adverse impacts on gender equality and/or the situation of women and girls?
No
2. Would the Project potentially reproduce discriminations against women based on gender, especially regarding participation in design and implementation or access to opportunities and benefits?
No
3. Have women’s groups/leaders raised gender equality concerns regarding the Project during the stakeholder engagement process and has this been included in the overall Project proposal and in the risk assessment?
No
3. Would the Project potentially limit women’s ability to use, develop and protect natural resources, taking into account different roles and positions of women and men in accessing environmental goods and services?
No
38 Prohibited grounds of discrimination include race, ethnicity, gender, age, language, disability, sexual orientation, religion, political or other opinion, national or social or geographical origin, property, birth or other status including as an indigenous person or as a member of a minority. References to “women and men” or similar is understood to include women and men, boys and girls, and other groups discriminated against based on their gender identities, such as transgender people and transsexuals.

Page 150
For example, activities that could lead to natural resources degradation or depletion in communities who depend on these resources for their livelihoods and well being
Principle 3: Environmental Sustainability: Screening questions regarding environmental risks are encompassed by the specific Standard-related questions below
Standard 1: Biodiversity Conservation and Sustainable Natural Resource Management
1.1 Would the Project potentially cause adverse impacts to habitats (e.g. modified, natural, and critical habitats) and/or ecosystems and ecosystem services? For example, through habitat loss, conversion or degradation, fragmentation, hydrological changes
No
1.2 Are any Project activities proposed within or adjacent to critical habitats and/or environmentally sensitive areas, including legally protected areas (e.g. nature reserve, national park), areas proposed for protection, or recognized as such by authoritative sources and/or indigenous peoples or local communities?
No
1.3 Does the Project involve changes to the use of lands and resources that may have adverse impacts on habitats, ecosystems, and/or livelihoods? (Note: if restrictions and/or limitations of access to lands would apply, refer to Standard 5)
No
1.4 Would Project activities pose risks to endangered species? No
1.5 Would the Project pose a risk of introducing invasive alien species? No
1.6 Does the Project involve harvesting of natural forests, plantation development, or reforestation?
No
1.7 Does the Project involve the production and/or harvesting of fish populations or other aquatic species?
No
1.8 Does the Project involve significant extraction, diversion or containment of surface or ground water?
For example, construction of dams, reservoirs, river basin developments, groundwater extraction
No
1.9 Does the Project involve utilization of genetic resources? (e.g. collection and/or harvesting, commercial development)
No
1.10 Would the Project generate potential adverse trans boundary or global environmental concerns?
No
1.11 Would the Project result in secondary or consequential development activities which could lead to adverse social and environmental effects, or would it generate cumulative impacts with other known existing or planned activities in the area?
For example, a new road through forested lands will generate direct environmental and social impacts (e.g. felling of trees, earthworks, potential relocation of inhabitants). The new road may also facilitate encroachment on lands by illegal settlers or generate unplanned commercial development along the route, potentially in sensitive areas. These are indirect, secondary, or induced impacts that need to be considered. Also, if similar developments in the same forested area are planned, then cumulative impacts of multiple activities (even if not part of the same Project) need to be considered.
No
Standard 2: Climate Change Mitigation and Adaptation

Page 151
2.1 Will the proposed Project result in significant39 greenhouse gas emissions or may exacerbate climate change?
Yes, but in a positive way
2.2 Would the potential outcomes of the Project be sensitive or vulnerable to potential impacts of climate change?
No
2.3 Is the proposed Project likely to directly or indirectly increase social and environmental vulnerability to climate change now or in the future (also known as maladaptive practices)?
For example, changes to land use planning may encourage further development of floodplains, potentially increasing the population’s vulnerability to climate change, specifically flooding
No
Standard 3: Community Health, Safety and Working Conditions
3.1 Would elements of Project construction, operation, or decommissioning pose potential safety risks to local communities?
No
3.2 Would the Project pose potential risks to community health and safety due to the transport, storage, and use and/or disposal of hazardous or dangerous materials (e.g. explosives, fuel and other chemicals during construction and operation)?
No
3.3 Does the Project involve large-scale infrastructure development (e.g. dams, roads, buildings)?
No
3.4 Would failure of structural elements of the Project pose risks to communities? (e.g. collapse of buildings or infrastructure)
No
3.5 Would the proposed Project be susceptible to or lead to increased vulnerability to earthquakes, subsidence, landslides, erosion, flooding or extreme climatic conditions?
No
3.6 Would the Project result in potential increased health risks (e.g. from water-borne or other vector-borne diseases or communicable infections such as HIV/AIDS)?
No
3.7 Does the Project pose potential risks and vulnerabilities related to occupational health and safety due to physical, chemical, biological, and radiological hazards during Project construction, operation, or decommissioning?
No
3.8 Does the Project involve support for employment or livelihoods that may fail to comply with national and international labor standards (i.e. principles and standards of ILO fundamental conventions)?
No
3.9 Does the Project engage security personnel that may pose a potential risk to health and safety of communities and/or individuals (e.g. due to a lack of adequate training or accountability)?
No
Standard 4: Cultural Heritage
4.1 Will the proposed Project result in interventions that would potentially adversely impact sites, structures, or objects with historical, cultural, artistic, traditional or religious values or intangible forms of culture (e.g. knowledge, innovations, practices)? (Note: Projects
No
39 In regards to CO2, ‘significant emissions’ corresponds generally to more than 25,000 tons per year (from both direct and indirect sources). [The Guidance Note on Climate Change Mitigation and Adaptation provides additional information on GHG emissions.]

Page 152
intended to protect and conserve Cultural Heritage may also have inadvertent adverse impacts)
4.2 Does the Project propose utilizing tangible and/or intangible forms of cultural heritage for commercial or other purposes?
No
Standard 5: Displacement and Resettlement
5.1 Would the Project potentially involve temporary or permanent and full or partial physical displacement?
No
5.2 Would the Project possibly result in economic displacement (e.g. loss of assets or access to resources due to land acquisition or access restrictions – even in the absence of physical relocation)?
No
5.3 Is there a risk that the Project would lead to forced evictions?40 No
5.4 Would the proposed Project possibly affect land tenure arrangements and/or community based property rights/customary rights to land, territories and/or resources?
No
Standard 6: Indigenous Peoples
6.1 Are indigenous peoples present in the Project area (including Project area of influence)? No
6.2 Is it likely that the Project or portions of the Project will be located on lands and territories claimed by indigenous peoples?
No
6.3 Would the proposed Project potentially affect the rights, lands and territories of indigenous peoples (regardless of whether Indigenous Peoples possess the legal titles to such areas)?
No
6.4 Has there been an absence of culturally appropriate consultations carried out with the objective of achieving FPIC on matters that may affect the rights and interests, lands, resources, territories and traditional livelihoods of the indigenous peoples concerned?
No
6.4 Does the proposed Project involve the utilization and/or commercial development of natural resources on lands and territories claimed by indigenous peoples?
No
6.5 Is there a potential for forced eviction or the whole or partial physical or economic displacement of indigenous peoples, including through access restrictions to lands, territories, and resources?
No
6.6 Would the Project adversely affect the development priorities of indigenous peoples as defined by them?
No
6.7 Would the Project potentially affect the traditional livelihoods, physical and cultural survival of indigenous peoples?
No
6.8 Would the Project potentially affect the Cultural Heritage of indigenous peoples, including through the commercialization or use of their traditional knowledge and practices?
No
Standard 7: Pollution Prevention and Resource Efficiency
40 Forced evictions include acts and/or omissions involving the coerced or involuntary displacement of individuals, groups, or communities from homes and/or lands and common property resources that were occupied or depended upon, thus eliminating the ability of an individual, group, or community to reside or work in a particular dwelling, residence, or location without the provision of, and access to, appropriate forms of legal or other protections.

Page 153
7.1 Would the Project potentially result in the release of pollutants to the environment due to routine or non-routine circumstances with the potential for adverse local, regional, and/or transboundary impacts?
No
7.2 Would the proposed Project potentially result in the generation of waste (both hazardous and non-hazardous)?
No
7.3 Will the proposed Project potentially involve the manufacture, trade, release, and/or use of hazardous chemicals and/or materials? Does the Project propose use of chemicals or materials subject to international bans or phase-outs?
For example, DDT, PCBs and other chemicals listed in international conventions such as the Stockholm Conventions on Persistent Organic Pollutants or the Montreal Protocol
No
7.4 Will the proposed Project involve the application of pesticides that may have a negative effect on the environment or human health?
No
7.5 Does the Project include activities that require significant consumption of raw materials, energy, and/or water?
Yes

• gef GLOBAL ENVIRONMENT FACILITY INVESTING IN OUR PLANET
Naoko Ishii CEO and Chairperson
September 17, 2015
Ms. Adriana Dinu GEF Executive Coordinator United Nations Development Programme One United Nations Plaza 304 East 45th St. FF Bldg., 10th floor New York, NY 10017
Dear Ms. Dinu:
l am pleased to inform you that I have endorsed the full-sized project proposal detailed below:
Decision Sought: CEO Endorsement of Full-sized Project
GEFSEC ID: 5361
Agency(ies): UNDP
Agency ID: 4606 (UNDP)
Focal Area: Climate Change
Project Type: Full Size Project
Country( ies ): India
Name of Project: Market Transformation and Removal of Barriers for Effective Implementation of the State Level Climate Change Action Plans
GEF Project Grant: $3,744,500
Agency Fee: $355,728
Funding Source: GEF Trust Fund
Break-down of Indicative Agency Fee
Agency Trust Fees committed at Council Fees to be committed at Total (US$) Fund Approval CEO Endorsement
UNDP GET $142,289 $213,439 $355,728
I am endorsing this project on the understanding that the GEF Agency will have its internal approval of the project no later than four months after the CEO endorsement.
1818 H Street, NW• Washington, DC 20433 •USA Tel:+ I (202) 473 3202 - Fax:+ I (202) 522 3240
E-mail: [email protected] www.thegeforg
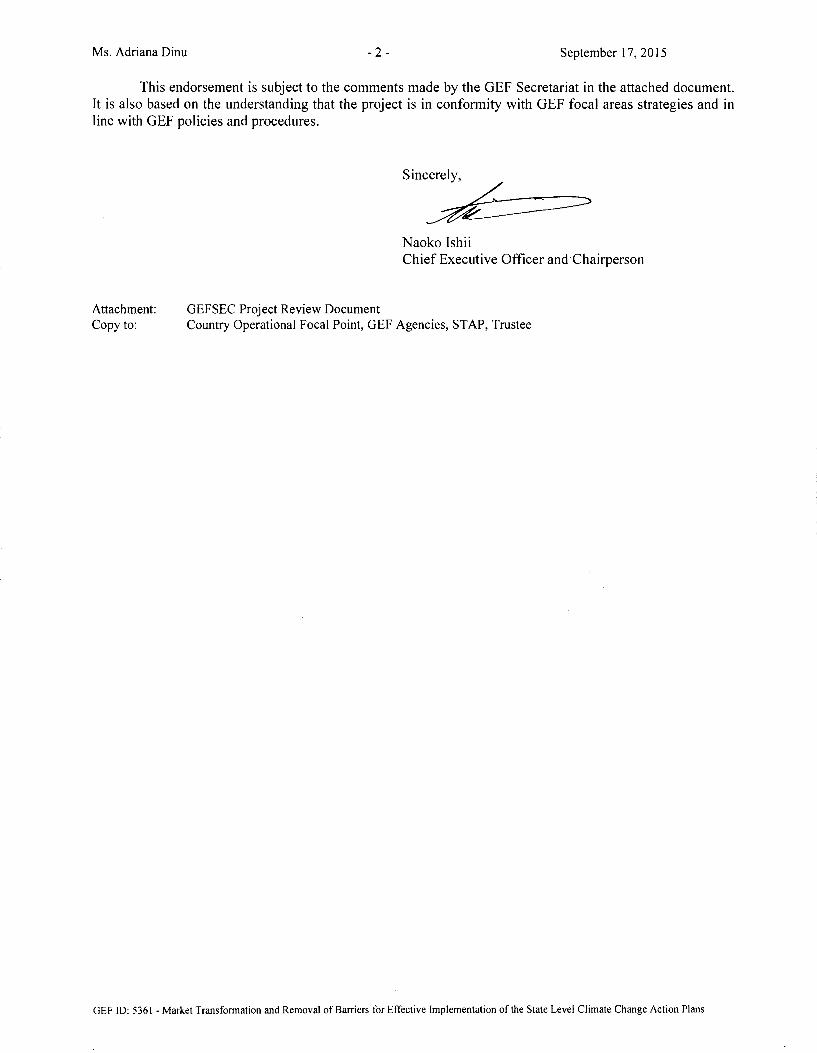
Ms. Adriana Dinu - 2 - September 1 7, 2015
This endorsement is subject to the comments made by the GEF Secretariat in the attached document. It is also based on the understanding that the project is in conformity with GEF focal areas strategies and in line with GEF policies and procedures.
Sincerely,
Naoko Ishii Chief Executive Officer and·Chairperson
Attachment: GEFSEC Project Review Document Copy to: Country Operational Focal Point, GEF Agencies, ST AP, Trustee
GEF ID: 5361 - Market Transfonnation and Removal of Barriers for Effective Implementation of the State Level Climate Change Action Plans