Embed Size (px)
Citation preview

ESA/STAT/AC.110 December 2005
Original: English
UNITED NATIONS DEPARTMENT OF ECONOMIC AND SOCIAL AFFAIRS
STATISTICS DIVISION
Cape Verde National Statistical Office and United Nations Statistics Division
REPORT OF THE MEETING ON DATA AND INDICATORS TO MONITOR PROGRESS TOWARDS THE MILLENNIUM DEVELOPMENT GOALS FOR
THE ECONOMIC COMMUNITY OF WESTERN AFRICAN STATES (ECOWAS)
PRAIA, CAPE VERDE, 5-9 December 2005

2
Executive Summary
The Meeting on Data and Indicators to Monitor Progress towards the Millennium Development Goals in the Economic Community for the Western African States (ECOWAS) was held in Praia, Cape Verde, from 5 to 9 December 2005. It was jointly organized by the United Nations Statistics Division and the National Statistical Office of Cape Verde. The main objectives of the meeting were to:
a. Achieve a common understanding of: (i) internationally recognized concepts and definitions for the indicators of the Millennium Development Goals (MDGs); (ii) and the integration of MDGs with Poverty Reduction Strategy (PRS) monitoring systems.
b. Review national experience in the production of MDG indicators; share country experiences in adapting the international list of goals, targets and indicators for national use; and assess countries’ capacity to monitor the MDG indicators.
c. Consider major problems encountered in the collection and compilation of MDG indicators and implications in the dissemination of consistent estimates at national and international level.
d. Identify good practices that countries might follow for (a) collecting data, (b) calculating MDG indicators, (c) evaluating their quality, (d) disseminating them, and (e) using the data for policy making.
e. Build a network of experts to exchange information on good practices and provide mutual support in the development of MDG indicators.
f. Recommend actions to be taken at the national and international levels to develop and sustain national programmes on data collection, analysis and dissemination to meet the ongoing data needs of countries to monitor the MDGs.
Twenty-three statisticians responsible for data and indicators to monitor the progress on MDGs from national statistical offices and six experts and data users responsible for MDG monitoring and policy making from ministries and other government institutions participated in the meeting. All of the 15 ECOWAS countries: Benin, Burkina Faso, Cape Verde, Côte d’Ivoire, Gambia, Ghana, Guinea, Guinea-Bissau, Liberia, Mali, Niger, Nigeria, Senegal, Sierra Leone, and Togo were represented. Several issues emerged from the meeting. The meeting took note that in ECOWAS, the capacity to monitor MDG indicators varies among countries and is particularly challenging in countries in post conflict situations like Liberia. In such circumstances, inequalities among the population are exacerbated. In order for the assessment of progress towards the Millennium Development Goals to reflect the reality of those

3
countries, the tracking needs to be done at sub-national levels and for specific population sub-groups. In the ECOWAS region:
a. All fifteen countries have produced an MDGs country report.
b. All countries have adapted the list of indicators used for the monitoring of progress achieved at the regional and global level to their national circumstances.
c. All countries have a designated authority in charge of monitoring MDGs.
d. Data are available for some but not all of the MDG indicators (except for Liberia where data are generally lacking). For some indicators, data are insufficient and/or outdated.
e. Most countries in the region lack capacity to monitor MDG indicators in the areas of environmental sustainability (Goal 7) and of global partnership for development (Goal 8).
f. National Statistical Offices (NSO) are involved in the monitoring of the MDGs, albeit at different levels of participation. NSOs supply data to MDG monitoring and most of them are also involved in the drafting of the report.
g. In many cases, NSOs programmes are based on National Strategies for the Development of Statistics (NSDS) or equivalent programmes. These programmes exist for most countries, and are in the process of development for others.
h. By and large, a functional institutional framework for MDGs monitoring exists. In some countries this is due to the existence of the PRSPs.
i. In some cases however, the institutional framework is inadequate due to lack of financial resources, human resources (quantity and quality), physical infrastructures, equipment, and incentives to work.
Among the needs identified to improve MDGs monitoring capacity in the region, participants underlined:
a. Conduct methodological training in the calculation of certain indicators.
b. Strengthen capacity in human resources.
c. Good governance.
d. Strengthen capacity in Information Technology (IT) and transportation equipment.
e. Establish public-private partnerships for data collection.
f. Adapt MDG at the sub-national level and improve data disaggregation capacity.

4
g. Improve data collection and data analysis.
h. Increase frequency of sample surveys to ensure greater availability of data points over time.
i. Establish a national database/bank for monitoring MDGs.
j. Enhance interactions between national statistical offices and international agencies; and establish a more effective and adequate mechanism of data reporting to international agencies.
Participants also noted that in order to improve national capacity, it is necessary to look at the quality of data and not only at the frequency of data production. The recommendations highlighted at the meeting are described in detail at the end of this report, under ‘Lessons learnt and Recommendations’. They include:
a. Strengthen collaboration between the agencies at national level.
b. Strengthen the reporting mechanism between countries and international agencies.
c. Establish an ECOWAS Regional Technical Committee on MDGs and Poverty Statistics.
d. Strengthen data analysis capacity of NSO staff.
e. Make use of “Poverty Maps” to detect inequalities at sub-national levels and among population groups.
f. Sensitise the public to the importance of MDGs.
g. Establish national statistical systems in post conflict situation.
h. Improve civil registration systems, the best source of mortality statistics.
i. Increase the frequency of surveys and censuses.
j. Adopt a National Strategy for the Development of Statistics (NSDS).
k. Privilege the use of NSDS to integrate national statistical systems.
l. Create an information network on MDGs for the ECOWAS countries.
m. Improve indicators for access to drinking water and basic sanitation.
n. Conduct population and housing censuses every 10 years.

5
Résumé
L’Organisation des Nations Unies a organisé une réunion sur les données et indicateurs pour le suivi des progrès accomplis vers les Objectifs du Millénaire pour le Développement (OMD) dans la région de la Communauté Économique des États de l'Afrique de l'Ouest (CEDEAO). La réunion s'est tenue à Praia au Cap Vert du 5 au 9 décembre 2005. Elle a été organisée par la Division de Statistique des Nations Unies en collaboration avec l’Institut National de la Statistique du Cap Vert. Les principaux objectifs de la réunion étaient les suivants :
a. Réviser et expliquer: (i) les concepts et définitions utilisées au niveau international pour les indicateurs des OMD; et (ii) l’intégration des OMD avec les systèmes de suivi des Stratégies de Réduction de la Pauvreté (SRP).
b. Examiner les pratiques nationales dans la production des indicateurs des OMD; partager les expériences des pays dans l’adaptation de la liste internationale des objectifs, cibles et indicateurs pour l’usage national ; et évaluer la capacité des pays dans le suivi des indicateurs des OMD.
c. Considérer les problèmes majeurs rencontrés dans la collecte et compilation des indicateurs des OMD et dans la dissémination de statistiques consistantes au niveau national et international.
d. Identifier des bonnes pratiques afin d’aider les pays à (a) collecter les données, (b) calculer les indicateurs, (c) évaluer leur qualité, (d) les disséminer, et (e) les utiliser pour informer les décisions politiques.
e. Créer un réseau d’experts pour échanger des informations sur les bonnes pratiques et apporter un support mutuel dans l’élaboration et suivi des indicateurs des OMD.
f. Recommander des actions aux niveaux national et international pour développer et renforcer les programmes nationaux de statistique pour la collecte, l’analyse et la dissémination de données et pour faire face à la demande croissante de données pour le suivi des OMD.
Ont participé à la réunion vingt-trois (23) experts responsables intervenant dans la compilation des indicateurs pour les OMD des instituts nationaux de statistique de la CEDEAO et six (6) experts et utilisateurs de données responsables du suivi et de l'élaboration des politiques des OMD en provenance d’autres ministères et organisations gouvernementales. Tous les quinze (15) pays de la CEDEAO étaient représentés : Bénin, Burkina Faso, Cap Verte, Côte d’Ivoire, Gambie, Ghana, Guinée, Guinée-Bissau, Liberia, Mali, Niger, Nigeria, Sénégal, Sierra Leone, et Togo.
Plusieurs enseignements se sont dégagés pendant la réunion. Il a été constaté qu’au sein de la CEDEAO la capacité de suivi des indicateurs des OMD varie selon les pays et

6
présente un défi particulier pour certains pays en sortie de crise comme le Liberia. Dans ces circonstances, les inégalités entre les habitants sont exacerbées, et pour que l’évaluation des progrès vers les OMD traduise la réalité de chaque pays, le suivi doit être effectué au niveau locale et sur des sous-groupes de la population.
Dans la région CEDEAO :
a. Les quinze (15) pays ont établi un rapport national sur les OMD ;
b. Tous les pays ont adapté aux circonstances nationales la liste des indicateurs utilisés pour le suivi des progrès accomplis au niveau régional et global ;
c. Tous les pays ont confié à une institution le suivi des OMD ;
d. Les données sont disponibles pour presque tous les indicateurs (sauf pour le Liberia dont la plupart des données manquent). Pour certains indicateurs les données sont insuffisantes ou anciennes ;
e. La plupart des pays de la région n’ont pas la capacité de suivi pour les indicateurs sur l’environnement durable (Objectif 7) et sur le Partenariat global pour le développement (Objectif 8);
f. Les bureaux nationaux de statistique (BNS) sont impliqués dans le suivi des OMD, bien qu’à des niveaux divers de participation. Les BNS fournissent des données pour le suivi des OMD et la plupart d’entre eux sont aussi impliqués dans la rédaction du rapport ;
g. Dans plusieurs cas, les programmes d’activités des BNS font partie d’une Stratégie Nationale pour le Développement de la Statistique (SNDS) ou de programmes similaires. Ces programmes existent dans la plupart des pays ou sont en cours d’élaboration pour les autres ;
h. Dans une très grande mesure, un dispositif institutionnel est en place pour le suivi des OMD; ceci étant dû pour certains pays à l’existence d’un Cadre Stratégique de Lutte contre la Pauvreté (CSLP) ou d’un Document de Stratégie pour la Réduction de la Pauvreté (DSRP) ;
i. Dans certains cas cependant, le cadre institutionnel est inadapté du fait du manque de ressources financières, de ressources humaines (en quantité et qualité), de locaux, d’équipement et d’incitations à travailler.
Parmi les besoins identifiés pour améliorer la capacité à suivre les OMD dans la région, les participants ont souligné:
a. La formation aux méthodes de calcul de certains indicateurs ;
b. Le renforcement des capacités en ressources humaines ;
c. La bonne gouvernance ;Le renforcement des capacités informatiques et en matériel de transport ;

7
d. La mise en place de partenariats public-privé pour la collecte des données ;
e. La régionalisation des OMD et l’amélioration de la capacité à désagréger les données ;
f. L’amélioration de la collecte des données et leur analyse ;
g. L’augmentation de la fréquence des enquêtes par sondage afin d’assurer une meilleure disponibilité de données dans le temps ;
h. La mise en place d’une base ou d’une banque de données pour le suivi des OMD ;
i. Le développement des relations entre les services statistiques et les agences internationales et la création des mécanismes plus performants et mieux adaptés pour transmettre les données aux instances internationales.
Les participants ont noté aussi que pour améliorer les capacités nationales, il est nécessaire de considérer la qualité des données et non pas uniquement la fréquence de leur production.
Plusieurs recommandations ont été faites au cours des réunions. Notamment:
a. Renforcer la collaboration entre les institutions nationales
Il est nécessaire de renforcer la coopération entre les Bureaux Nationaux de Statistiques (BNS) et les autres institutions nationales impliquées dans la collecte et le traitement de statistiques officielles pour l’élaboration des indicateurs de suivi des OMD. Les statisticiens se doivent de créer des partenariats et des conventions pour l’échange de données avec d’autres institutions comme les Ministères chargé de l’éducation, de la santé, de l’environnement, etc. Bien que ces relations soient formellement prévues dans les législations de beaucoup de pays, elles sont rarement opérationnelles.
b. Renforcer les mécanismes de communication des données entre les pays et les institutions internationales
Des contacts réguliers entre les BNS, les autres producteurs de données nationales, et le Système des Nations sont nécessaires. De plus, la formation du personnel des BNS aux techniques de diffusion de données est cruciale pour améliorer les transferts des données statistiques publiques nationales aux institutions internationales. Il a été remarqué que la base de données sur les indicateurs de suivi des OMD gérée par la Division de Statistique des Nations Unies (UNSD) reflète généralement bien la situation des données nationales disponibles. Pourtant, quelques écarts existent dans certains domaines comme la pauvreté.

8
c. Etablir un comité technique pour les statistiques sur les OMD et la pauvreté dans la région de la CEDEAO
Considérant qu’il existe déjà un Comité de pilotage de la coopération entre l’UNSD et la CEDEAO, les participants recommandent fortement la mise en place d’un comité technique pour les statistiques sur les OMD et la Pauvreté. Ce comité technique devrait comprendre les correspondants des BNS pour les statistiques des OMD et de la Pauvreté dans les BNS ainsi que des représentants de toutes les parties prenantes concernés par les OMD dans les pays membres.
d. Renforcer la capacité d’analyse du personnel des ONS
Il a été souligné l’importance d’améliorer les capacités d’analyse de données du personnel des organismes producteurs des statistiques officielles. Il a été aussi mis en lumière que parfois, bien que les données soient disponibles elles ne sont pas suffisamment analysées faute de capacité adéquate.
e. Faire usage des ‘cartes de pauvreté’ pour identifier les inégalités au niveau local et entre les différents groupes de population
Il a été proposé d’avoir recourt aux cartes de pauvreté pour identifier les localités pour lesquelles des mesures particulières sont à prendre ou pour adapter les politiques. Les cartes de pauvreté utilisent les Systèmes d’Information Géographique (SIG) permettant d’intégrer des données administratives, d’enquêtes et de recensement à différents niveaux géographiques.
f. Sensibiliser le public à l’importance des OMD
Les participants ont reconnu l’importance de sensibiliser le grand public, les techniciens et les décisionnaires sur les OMD par le biais de campagne dans les médias et d’ateliers.
g. Mettre en place un système statistique national dans les pays en sortie de crise
Pour les pays en situation de sortie de crise, il est important de mettre en place un système statistique solide. Une fois la paix rétablie, au cours de la période de reconstruction et lorsque les rôles sont formellement répartis, le BNS devrait saisir cette opportunité pour se positionner au centre du système statistique national. Il doit être bien représenté dans le processus de reconstruction, car les principales responsabilités en matière de statistique y seront réparties et les moyens de renforcement de capacité seront offerts par les partenaires extérieurs présents pendant cette période.
9
h. Améliorer le système d’enregistrement de l’état-civil, la meilleure source de données sur la mortalité
L’enregistrement de l’état-civil a été identifié comme la meilleure source de données nécessaires au calcul de certains indicateurs de suivi des OMD, en particulier pour ceux liés à la santé. Cependant, à l’exception du Cap Vert, la couverture des naissances et des décès dans les autres pays de la CEDEAO n’est pas complète. Les participants ont insisté sur la nécessité d’améliorer le système d’enregistrement de l’état-civil.
i. Augmenter la fréquence des enquêtes et recensements
Pour un suivi de la pauvreté, les participants ont recommandé que les Etats membres de la CEDEAO conduisent une Enquête Revenus et Dépenses des Ménages tous les cinq (5) ans accompagnée d’une enquête plus légère sur la pauvreté (de type QUIBB- Questionnaire sur les Indicateurs de Base du Bien-être) tous les ans et d’un recensement de la population tous les dix (10) ans.
j. Doter les pays d’une Stratégie Nationale pour le Développement de la Statistique (SNDS)
Les participants estiment souhaitable que tous les pays de la région se dotent d’une SNDS ou d’un programme de développement de la statistique de même nature. Les partenaires au développement devraient apporter un soutien particulier aux pays sortant d’une crise grave.
Dans la perspective du rendez-vous M+10, soit en 2010, ils recommandent que toutes les SNDS se fixent, parmi leurs objectifs, le renforcement des capacités nationales en vue: (a) de la production de meilleures statistiques pour le calcul des indicateurs de suivi des OMD, et des politiques de réduction de la pauvreté; (b) de l’amélioration des analyses faites de ces statistiques et de ces indicateurs; (c) et de la mise à jour du rapport sur les OMD pour le rendez-vous de 2010.
k. Utiliser les SNDS comme cadre privilégié de l’intégration des systèmes statistiques nationaux
La SNDS ou le programme de développement est le cadre privilégié de l’amélioration de l’intégration des systèmes statistiques nationaux. Les participants font appel aux partenaires internationaux, régionaux et bilatéraux pour que ceux-ci améliorent la couverture et ultérieurement l’intégration de leurs programmes d’enquêtes auprès des ménages. En particulier les enquêtes EDS (Enquêtes Démographiques et de Santé) et MICS (Enquêtes à Indicateurs Multiples) pourraient être fusionnées et l’enquête QUIBB (Questionnaire des Indicateurs de Base de Bien-être) pourrait servir d’instrument unique de suivi annuel des politiques nationales et sectorielles de lutte contre la pauvreté.

10
Ils recommandent une attention particulière, lors de l’élaboration des SNDS, au renforcement de la coordination des programmes d’activités statistiques entre l’organe central et les unités chargées des statistiques dans les ministères et des autres organismes publics.
l. Créer un réseau d’échange d’information sur les OMD pour les pays de la CEDEAO
Les participants recommandent la création d’un réseau d’échange d’information sur les OMD. Le réseau sera composé des ONS des pays de la CEDEAO. Les experts des pays pourront obtenir et échanger des renseignements et de la documentation statistique en rapport avec les OMD. La documentation doit faire l’objet d’une publication sur support électronique, afin d’être partagée plus facilement parmi les experts. Par conséquent, le réseau des BNS doit nécessairement se doter d’un site web dont l’organisme hébergeur sera à rechercher par l’ensemble des pays. Il n’est pas exclu que la CEDEAO soit dans un premier temps sollicité pour l’inscription de ce projet dans son plan d’action de connectivité des pays membres.
Les informations qui seront échangées auront un caractère dynamique. En effet, il peut être laissé aux experts toute latitude pour consulter et compléter les pages web avec d’autres informations qu’ils jugeront importantes. Le site devra être organisé de façon à permettre à chaque intervenant d’accéder plus facilement aux informations, mais et surtout d’avoir toute possibilité de revenir à l’information historique s’il le désire.
m. Améliorer les indicateurs pour l’accès à l’eau potable et à l’assainissement de base
Concernant les indicateurs relatives à l’accès de façon durable à un approvisionnement en eau de boisson salubre et à des services d’assainissement de base, les participants recommandent que les variables permettant de les calculer soient inclues dans les recensements de la population et de l’habitat et dans les enquêtes auprès des ménages.
n. Réaliser un recensement de la population et de l’habitat tout les dix ans
Les participants exhortent les autorités des Etats membres à prendre les dispositifs nécessaires pour assurer la réalisation effective d’un recensement de la population et de l’habitat aux alentours de 2010 dans tout les pays de la CEDEAO en collaboration avec la Commission Economique pour l’Afrique.

11
Conclusions de la session sur l’intégration des dispositifs de suivi des OMD et des Documents de Stratégie pour la Réduction de la Pauvreté (DSRP)
Tous les pays ont un cadre stratégique pour le suivi de la pauvreté. Les pays sont à des niveaux différents concernant le suivi de la mise en œuvre des politiques de réduction de la pauvreté. Le Togo par exemple a un document intérimaire alors que le Burkina Faso, le Sénégal et la Guinée en sont à leur second DSRP. De plus, certains pays disposent d’un secrétariat permanent ou d’une direction pour assurer le suivi de pauvreté. Au Liberia et Guinée- Bissau, il reste a décider l’emplacement de la cellule de suivi de la pauvreté.
L’intégration des OMD et des DSRP se fait au niveau des indicateurs. En fait, il existe un très fort rapprochement entre les indicateurs de suivi des OMD et des DSRP. De plus, dans la plupart des pays la même instance est chargée du suivi à la fois des OMD et des DSRP. Pourtant, le suivi en continu des DSRP est affaibli par le manque de données. Il faudrait aussi suivre les indicateurs des DSRP au niveau local.
Les participants ont noté l’initiative de la Sierra Leone qui a mis en place un mécanisme de suivi efficace du DSRP s’appuyant sur un comité central composé du Statisticien Général, du Secrétaire de Finance, et le Directeur du secrétariat du DSRP pendant la formulation du DSRP.
Conclusions de la session sur les indicateurs de pauvreté
Tous les pays de la région sont capables de collecter les données sur la pauvreté. Dans la majorité des cas, les Enquêtes Revenus et Dépenses (Budget/Consommation) des ménages constituent la source principale de données sur la pauvreté. D’autres sources peuvent être les recensements de population ou les enquêtes des programmes internationaux comme les enquêtes MICS, LSMS (Etudes des Mesures des Niveau de Vie), QUIBB ou QUID (Questionnaire Unifié des Indicateurs de Développement).
Il a été noté la difficulté d’obtenir des mesures sur le secteur informel, alors que ceci est d’importance dans la plupart des pays africains. La mesure de la consommation est préférable à celle du revenu en Afrique, car les ménages du secteur informel sont plus disposées à fournir des informations crédibles sur leur consommation. Enfin, le cas du Togo doit être remarqué pour le manque de données pour le suivi de la pauvreté; la seule source de données est une enquête par sondage de 1987 et le dernier recensement de population remonte à 1981.
Conclusions de la session sur les indicateurs pour l’éducation et l’autonomisation des femmes
Les pays de la région renseignent les indicateurs de l’éducation à partir des sources administratives des ministères de l’éducation, d’enquêtes par sondage et des recensements de population. Les participants ont noté la nécessité de coordonner la production des statistiques de l’éducation en vue d’éviter les doublons dans les activités. Concernant la part des femmes dans la population active, il a été noté dans certains pays l’absence d’enquêtes nationales sur la main d’œuvre. Il a été noté la nécessité d’une prise

12
de conscience effective de l’importance de présenter des données statistiques selon le genre dans la région.
Conclusions de la session sur les indicateurs pour la santé
Les indicateurs de santé des pays de la région sont obtenus surtout à partir des données fournies par les enquêtes par sondage auprès des ménages (EDS et MICS). Il est par conséquent nécessaire de renforcer le système d’enregistrement de l’état-civil afin d’améliorer le suivi de questions liées à la santé des populations. Dans la région, la couverture de l’enregistrement des naissances et des décès n’est pas complète, à l’exception du Cap Vert où le taux d’enregistrement est élevé, mais cependant pas totalement fiable (problèmes d’enregistrement tardif des naissances et classification des causes de décès). Il a été suggéré que l’amélioration de la couverture pourrait être obtenue en utilisant les infirmières et les aides à l’accouchement comme déclarant de l’événement au centre d’enregistrement de l’état-civil. De même, il a été noté que les variations dans la mortalité des pays de la région sont le fait de l’existence de politiques de santé différentes. Par exemple, le Cap Vert a un taux de médecins par habitant bien plus élevé que celui des autres pays de la CEDEAO. La question de la répartition appropriée des centres de santé dans tous le pays a aussi été indiquée comme un élément clef de l’amélioration de la santé des populations.

13
TABLE OF CONTENTS A. INTRODUCTION............................................................................................... 15 B. PARTICIPATION .............................................................................................. 15 C. PROCEEDINGS ................................................................................................. 16
Opening Ceremony ..................................................................................................... 16 Opening Statements .................................................................................................... 17 Election of Officers..................................................................................................... 17 Agenda ........................................................................................................................ 17
D. FIRST PLENARY SEESION: GLOBAL vs. NATIONAL MDG REPORTING .................................................................................................................. 18
MDG Reporting and Monitoring at the Global Level ................................................ 18 MDG Monitoring in the ECOWAS region: Outcomes and Challenges……………..18 National Strategies for Development of Statistics within National Strategies for Development ............................................................................................................... 19 Exercise on countries’ capacity to provide data for the MDG global monitoring and international requirements .......................................................................................... 19
E. SECOND PLENARY SESSION: INTEGRATION OF MDGs AND POVERTY REDUCTION STRATEGY (PRS) MONITORING SYSTEMS ........... 21
How Integrated are the MDGs in PRSPs? An Overview of PRSPs and Results from Meta-Analysis ............................................................................................................ 21 Countries’ experience on the implementation of Poverty Reduction Strategy (PRS) systems and their integration with MDGs .................................................................. 22
Cape Verde ........................................................................................................... 22 Sierra Leone ......................................................................................................... 22
Burkina Faso’s experience on MDGs awareness-raising campaigns ........................ 23 GhanaInfo an adaptation of DevInfo ......................................................................... 24
F. THIRD PLENARY SESSION: Goal 1 –POVERTY ....................................... 25
Measuring and Monitoring Poverty for the MDGs…………………………………..26 Exercise on poverty statistics...................................................................................... 26
G. FOURTH PLANARY SESSION: Goals 2 and 3 – EDUCATION and GENDER EQUALITY ................................................................................................... 27
Goal 3: Promote Gender Equality and Empower Women ......................................... 27 MDG Indicators on Education ................................................................................... 28 Countries’ experience on data collection and availability, calculation of indicators, obstacles and solutions for Goals 2 and 3................................................................... 29
Cape Verde, Goal 2............................................................................................... 29 Cape Verde, Goal 3 .............................................................................................. 29 UNDP Liberia ...................................................................................................... 29 Gambia ................................................................................................................. 30
Exercise on countries’ experience in measuring employment and education indicators..................................................................................................................................... 31

14
H. FIFTH PLENARY SESSION: Goals 4, 5, 6, 7 – CHILD and MATERNAL MORTALITY, HEALTH and ENVIRONMENT....................................................... 32
Monitoring Progress in Maternal Mortality Reduction ............................................. 32 Reducing Child Mortality .......................................................................................... 33 Combat HIV/AIDS, Malaria, TB ............................................................................... 34 Countries’ experience on data collection, data availability, calculation of indicator, obstacles, solutions for Goals 4 and 5......................................................................... 35
Burkina Faso ........................................................................................................ 35 Sierra Leone ......................................................................................................... 35
Countries’ experience on data collection, data availability, calculation of indicator, obstacles, solutions for Goal 6 .................................................................................... 36
Togo ...................................................................................................................... 36 Niger .................................................................................................................... 36 Mali ...................................................................................................................... 36
Monitoring Water and Sanitation ............................................................................... 37 Senegal’s experience on data collection, data availability, calculation of indicator, obstacles, solutions for Goal 7 .................................................................................... 37 Exercise on the capacity of countries to produce data for MDG indicators and the role of National Statistics Offices. ..................................................................................... 38
I. SIXTH PLENARY SESSION: LESSONS LEARNT AND RECOMMENDATIONS................................................................................................ 39 J. CLOSING CEREMONY ................................................................................... 44 Annex I. List of Participants.................................................................................. 46 Annex II. Bureau of the meeting............................................................................. 55 Annex III. Organisation of Work............................................................................. 56

15
A. INTRODUCTION
1. The Meeting on Data and Indicators to Monitor Progress towards the Millennium Development Goals was held in Praia, Cape Verde, from 5 to 9 December 2005. It was jointly organized by the United Nations Statistics Division and the National Statistical Office of Cape Verde.
2. The main objectives of the meeting were to:
a. Achieve a common understanding of: (i) internationally recognized concepts and definitions for the indicators of the Millennium Development Goals (MDGs); (ii) and the integration of MDGs with Poverty Reduction Strategy (PRS) monitoring systems.
b. Review national experience in the production of MDG indicators; share country experiences in adapting the international list of goals, targets and indicators for national use; and assess countries’ capacity to monitor the MDG indicators.
c. Consider major problems encountered in the collection and compilation of MDG indicators and implications in the dissemination of consistent estimates at national and international level.
d. Identify good practices that countries might follow for (i) collecting data, (ii) calculating MDG indicators, (iii) evaluating their quality, (iv) disseminating them, and (v) using the data for policy making.
e. Build a network of experts to exchange information on good practices and provide mutual support in the development of MDG indicators
f. Recommend actions to be taken at the national and international levels to develop and sustain national programmes on data collection, analysis and dissemination to meet the ongoing data needs of countries to monitor the MDGs.
3. This report summarizes the proceedings of the meeting and presents the conclusions and recommendations adopted by the participants.
B. PARTICIPATION
4. All 15 national statistical offices of the ECOWAS region were represented at the meeting for a total of twenty-nine statisticians and data users from the countries in the region: Benin, Burkina Faso, Cape Verde, Côte d’Ivoire, Gambia, Ghana, Guinea, Guinea-Bissau, Liberia, Mali, Niger, Nigeria, Senegal, Sierra Leone, Togo. Five resource persons contributed to the workshop: three from the UN Statistics Division, one from the World Bank and one from PARIS21. The list of participants is given in Annex I.

16
C. PROCEEDINGS
Opening Ceremony 7. The opening ceremony for the Meeting on Data and Indicators to Monitor Progress
towards the Millennium Development Goals was chaired by Mr. Francisco Tavares, President of the National Statistical Office of Cape Verde. Mr. Tavares welcomed the participants and introduced His Excellency Mr. Pedro Pires, President of the Republic of Cape Verde, Ms. Patricia de Mowbray, United Nations Resident Coordinator, and Mr. João Serra, Minister of Finance and Planning.
8. After welcoming the participants and commending the government of Cape Verde for
hosting such an event, Ms. Patricia de Mowbray, Resident Coordinator of the United Nations in Cape Verde, recalled the importance of the Millennium Development Goals (MDG) which have unprecedented political support, embraced at the highest levels by developed and developing countries, civil society and major development institutions alike. She mentioned that at present, out of 191 Member States, 149 countries have produced at last one national report, for a total of 176 reports, covering a wide range of indicators. She highlighted that monitoring progress towards the achievement of the MDGs has been possible thanks to the greater attention given to data and statistics, which are now at the core of all development agendas. She finally mentioned various areas where Cape Verde has achieved significant progress, such as: enrolment in primary education, promotion of gender equality and empowerment of women, reduction of child and maternal mortality.
9. His Excellency Mr. Pedro Pires, President of the Republic of Cape Verde, welcomed
the participants and commended the National Statistical Office of Cape Verde for organizing the event. He stated that the Cape Verdian authorities have always been aware of the importance of statistics and he stressed that the increasing improvement in national statistical systems is an imperative for all development partners, may they be in the public or private sectors. He then mentioned a few indicators that show the considerable progress attained by the country in its 30 years of independence and declared that Cape Verde will reach the targets set out by the United Nations, if the current tendencies are kept and the steering corrections, which shall be suggested by the statistical services, are introduced. Nevertheless, he noted that some constraints persist for the ECOWAS countries in reaching more significant progress, which demands a change in the course of action. To this end, he called on more generosity from donor countries, as well as more strictness and hard work from beneficiaries. He pointed out that long-term investments should be based on an MDG plan integrated with both poverty reduction strategies and programmes for sustainable development. In addition, he recalled the favourable conditions to the development of southern states such as: a fare market access, suppression of agricultural subsidies in developed countries, and the waiving of debts which penalize national economies. On the other side, good governance, effective policies, policies generating resources and well being, a socio-political environment favourable to the economy, in an atmosphere of

17
peace, security and stability should also be guaranteed. He concluded reiterating the importance of statistical services as indispensable tools for sound decision making. He congratulated the organisers and wished success to the event.
Opening Statements 10. Following the opening ceremony, Ms. Francesca Coullare from the United Nations
Statistics Division (UNSD) welcomed the participants. She highlighted that the meeting was the fifth of a series of meetings organized by UNSD on Millennium Development Goals (MDG) indicators over the past two years and was also part of a broader project for the ECOWAS region to promote intra-regional collaboration, to share country experiences and to build a network of regional experts. She stressed the new focus, at both country and international levels, on data and statistics as a result of the MDG monitoring exercise and she reminded the role of UNSD to lead efforts in strengthening country capacity to address such a greater demand for official data. She presented the objectives of the meeting, thanked the Cape Verde National Statistics Office for their warm welcome and organisation, and welcomed the ECOWAS Secretariat and present agencies.
11. Mr. Iliyasli Mustapha Bobbo, the ECOWAS Secretariat representative, welcomed all
on behalf of the ECOWAS Secretariat and thanked the government and the NSO of Cape Verde for hosting the workshop. He thanked UNSD for its technical and financial assistance and for proving to be a reliable partner for statistics. He presented the ECOWAS regional statistical program for 2006-2010 whose main objective is to create an enabling environment for each country in the region to have the capacity to produce the statistics necessary for decision-making and wished all a successful meeting.
Election of Officers
12. After the participants introduced themselves, the Bureau of the meeting was elected,
as per Annex II. Agenda 13. The programme of work was presented and adopted (see Annex IV). The sessions
were organized in introductory presentations followed by a plenary discussion. Most sessions were also structured to include group work based on specific questions related to the introductory presentation of each session.

18
D. FIRST PLENARY SEESION: GLOBAL vs. NATIONAL MDG REPORTING
Presentation: MDG Reporting and Monitoring at the Global Level – Ms. Francesca Coullare, UNSD
14. Ms. Francesca Coullare, United Nations Statistics Division, presented the official
framework used for the global monitoring of progress towards the achievement of MDGs, consisting of 8 goals, 18 time-bound targets, and more than 48 indicators. She highlighted the difference between global and national monitoring for MDGs. The former is based on data provided by international agencies and is used to present a global assessment of progress at the regional and global levels. It is under the responsibility of the Inter-agency and Expert Group on MDG indicator composed of experts from international agencies and national statistical offices and coordinated by UNSD. The latter is under the country responsibility and is usually based on the set of indicators used at the global level, adapted to address specific priorities for national development. Countries are encouraged to adapt the list of goals/targets/indicators to cover their own concerns. The national monitoring should be used to raise awareness of development needs and to inform national policies. Ms. Coullare gave some background information on the origin of the official MDG framework that was spelled out from the Millennium Declaration and finalized by a group of technical experts who identified the list of indicators on the basis methodological concerns, including availability and frequency of data. She introduced the MDG indicators global database maintained by UNSD that presents MDG indicators for the period 1990-2005 by country. She recalled that country-level data presented in the UNSD database are those available in the international statistical system—adjusted for international comparability—and may differ from those available in national databases. She also described other characteristics of the database including information on its coverage: she pointed out that out of 191 UN Member States, 48% have at least 2 data points since 1990 for 21 to30 of the MDG indicators.
Presentation: MDG Monitoring in the ECOWAS region: Outcomes and Challenges - Ms. Léa Hakim, UNSD 15. Ms. Léa Hakim, United Nations Statistics Division, presented the results of a review
of the 15 national Millennium Development Goal Reports (MDGR) from the ECOWAS region. The objective of the review was to assess if and to which extent countries adapted the list of targets and indicators used for global monitoring of the MDGs. Ms. Hakim highlighted that all countries have adapted the MDG framework with country-specific targets and/or indicators. She noted that although all MDGRs cite the UN Country Team and more than half state that the MDGR was a collaborative process engaging all stakeholders, the real extent of NSO participation in providing data or drafting the report was unclear for most countries. She reported that all ECOWAS countries track targets 1 – 7 (goal 1 to goal 6). Targets within Goal 8 are the least tracked. There are seven MDG indicators tracked by all ECOWAS countries. One of these, the HIV/AIDS prevalence rate for 15-24 year old pregnant

19
women, is also the indicator most tracked by proxy. The main national data sources cited to track MDG indicators are NSOs, line ministries and national programmes. International data sources were also cited namely for Goal 7. It was stressed that there is a lack of data source citation in many of the MDGRs. The presentation also covered availability of countries’ data for trend analysis and for data disaggregation according to selected variables (sex, urban/rural).
Group Discussion 16. The importance of adapting the global MDG framework to countries’ own concerns
was stressed and encouraged. The difference in values between the MDG international and national databases was also clarified: international agencies may modify data values in international databases to ensure comparability of data for regional aggregation. In addition, in some cases, available country data are not reflected in international databases as the data are not disseminated.
Presentation: National Strategies for Development of Statistics within National Strategies for Development – Mr. Gerard Chenais PARIS21
17. The representative of PARIS21, Mr. Gerard Chenais, introduced the Partnership in
Statistics for Development in the 21st Century (PARIS21) as a partnership of policy-makers and statisticians from around the world dedicated to promote evidence-based policymaking, especially in developing countries. PARIS21’s main three activities are: (a) to advocate for the use of statistics by decision-makers; (b) to develop National Strategies for the Development of Statistics (NSDS); and (c) to coordinate between partners.
18. A National Strategy for the Development of Statistics (NSDS) is a set of coherent
interdependent decisions taken by national authorities for a 4-5 year plan in response to the priority needs of national and international policy makers and civil society. It seeks to make available to the user the best statistics and their analysis. PARIS21 is working to help countries in developing strategies that best suit them considering initial country conditions, supporting national development strategies, soliciting national means and international support and building on national human potential. NSDS should thus be realistic and adapted to the national context. It was recommended for all countries to have developed and adopted a NSDS by 2006 in order to have nationally produced data for all MDG indicators by 2010. It was also stressed that the design of the NSDS is as important as the product.
Exercise on countries’ capacity to provide data for the MDG global monitoring and international requirements 19. Ms. Coullare presented the analysis undertaken by UNSD to assess countries’
capacity to monitor the Millennium Development Goals (MDGs). She recalled that, at its latest session, in March 2005, the UN Statistical Commission requested that a report be prepared regularly, under the guidance of the “Friends of the Chair” (FOC) group, on the ability of countries to produce individual indicators and on how

20
metadata should be presented to accompany the indicators. The assessment was summarized in three tables: Table A, presenting the number of “country data points” available in the UNSD database per country and indicator since 1990, Table B showing the "nature/origin" of the data stored in the UNSD database (country data, country data adjusted by agencies or agencies’ estimates), and Table C presenting the latest available data point in the database for each indicator and country since 1990. The three tables had been circulated to national statisticians in advance, in order to allow sufficient time to review them before the meeting.
20. Participants reviewed the tables and the discussion that followed focused on: (a) assessing whether or not the exercise carried out by UNSD adequately reflected the situation in countries; (b) suggesting ways to improve reporting mechanisms from countries to agencies; and (c) identifying problematic indicators/areas where statistical capacity building was more urgently needed.
Group Discussion 21. Participants commended the work done by UNSD and agreed that the analysis was a
useful basis to stimulate the dialogue between national statistical offices and international agencies on ways to improve the use of national official statistics in international sources and reduce discrepancies between data used and published at the national and international levels.
22. It was noted that the exercise prepared by UNSD generally reflected countries’ capacity although some discrepancies exist in some areas like poverty.
23. Participants pointed out that problems with reporting to international agencies are
linked to the lack of coordination: (i) within countries among various statistical agencies (administrative data from line ministries, national statistical offices); and (ii) between national statistical agencies and country offices of international agencies. The following was proposed to improve the reporting mechanism between countries and agencies:
a. Periodic consultations between NSOs and other data producers at the national level.
b. Data dissemination training for National Statistical Offices (NSOs). c. A focal point to facilitate the dissemination process of MDG indicator
data.
24. It was also noted that the main problematic indicators/areas, i.e. where statistical capacity building is more urgently needed, are those for Goals 7 and 8.
25. In general, the following were recognized as needs to be addressed: a. Methodological training in the calculation of certain indicators; b. Human resources, good governance, transparency, and IT training; c. Public-private partnerships for data collection; d. MDG localization and data disaggregation capacity; e. Improvement in data collection and data analysis;

21
f. Higher frequency of sample surveys to ensure greater availability of data points over time (MDG indicators are mostly obtained from Household Sample Surveys);
g. More interaction between NSOs and international agencies; h. A more effective and adequate mechanism of reporting to international
agencies.
26. During the course of the discussion the participants also noted that in order to improve country capacity, there is a need to look not only at the frequency of data production, but also at the quality of data. It was also mentioned that NSOs are overburdened by numerous software by different specialized agencies. This only pressures limited human resources and time and creates confusion in the country.
E. SECOND PLENARY SESSION: INTEGRATION OF MDGs AND POVERTY REDUCTION STRATEGY (PRS) MONITORING SYSTEMS
Presentation: How Integrated are the MDGs in PRSPs? An Overview of PRSPs and Results from Meta-Analysis – Mr. Johan Mistiaen, World Bank
27. Mr. Johan Mistiaen, World Bank (WB), presented an overview of Poverty Reduction
Strategy Papers (PRSP) and the results of a WB study on the integration of MDGs and PRSPs in 40 countries.1 This study highlighted that :
a. There is a high alignment between MDG and PRSP monitoring indicators, especially in education and health, and for the poverty headcount ratio indicator;
b. MDG indicators are necessary but not sufficient to monitor the implementation of the PRSPs that cover a broader list of topics and in more details;
c. With the exceptions of infant and maternal mortality, PRSP targets for most goals are at least as ambitious as the MDG targets in terms of expected improvement in a given time frame;
d. Continuous monitoring of the PRSP indicators is weak due to lack of data; e. There is a need for sub-national monitoring for the PRSPs.
28. Mr. Mistiaen stressed the importance of comparing PRSP and MDG indicators. He
mentioned that a PRPS is a country development strategy that contains indicators that are relevant for the country. In many cases the main themes of indicators are included in the PRSPs with a notable overlap with MDG indicators in terms of coverage. Not all MDG indicators are included in PRSPs however, because some are not relevant at the country level.
1 Harrison, Klugman and Swanson (2005). Data can be found at <www.worldbank.org/poverty/strategies/>

22
Group Discussion 29. The discussion that followed Mr. Mistiaen’s presentation centered on how to link the
MDGs, which are based on international standards, to the PRSPs, which are based on national indicators and are mid-term instruments to reach the MDGs. It was noted that indicators rather than targets are important in the first stage of integration between MDGs and PRSPs. It is important to determine which are the relevant indicators and which require modification. In addition, a detailed statistical analysis by indicator should be undertaken to assess the availability of current data and the frequency of future data production, necessary for the calculation of the indicators.
30. The importance of having a monitoring and evaluation (M&E) mechanism in place for the integration of the PRSPs and MDGs to improve the national level of monitoring was also pointed out. It is the responsibility of every country to start the process to develop an M&E system. The example of some countries in East Africa that have undertaken a collaborative process led by the government, with the presence of development partners to discuss each indicator, was given.
Countries’ experience on the implementation of Poverty Reduction Strategy (PRS) systems and their integration with MDGs
Cape Verde - Mr. Antonio Pires 31. Mr. Antonio Pires presented the PRS process in Cape Verde which provides a
framework for reforms for sustainable growth with a significant impact on poverty and inequality. He mentioned that the elaboration process behind the PRS had political and technical supervision as well as a technical secretariat. Politically it was difficult to manage the policy instruments dealing with the growth strategy and with poverty reduction for the 2004-2007 period at the global, sectoral, and regional and local levels. Thirty-seven indicators were defined for monitoring purposes, all of which are directly or indirectly linked to the MDG indicators. He also noted that the Growth and Poverty Reduction Strategy Paper (DECRP in Portuguese) itself contributed to accelerate the attainment of MDGs by 2015. The PRS process was a participative one with stakeholders and development partners.
Sierra Leone – Mr. Gbogboto Musa
32. Mr. Gbogboto Musa outlined the preparation of Sierra Leone’s PRSP and MDG
reports. An interim Poverty Reduction Strategy Paper (PRSP) was prepared as a working document for reconstruction during the recovery period after the war. During this stage, a PRSP Secretariat was established to spear head the development of the PRSP. A core committee including the NSO and ministries was set up as well as a steering committee with departmental-level sub-committees and a working group with experts from ministries. There were no data records after the war. As such, MICS 1995 has been used as a baseline for monitoring. More data on MDGs will be available in mid-2006. A main challenge in the preparation of the PRSP and MDGs was that the PRSP was not a priority on the government’s agenda. The core team

23
which supervised the PRSP Secretariat met every week and was instrumental in the preparation of the Poverty Reduction Strategy Paper. The three pillars of the PRSP, i.e. Good Governance, Security and Peace Building, Promoting Pro-poor Growth for Food Security and Job Creation, and Promoting Human Development, and their linkages to the MDGs were mentioned.
Burkina Faso’s experience on MDGs awareness-raising campaigns - Mr. Salifou Zoungrana
33. Mr. Salifou Zougrana’s presentation focused on Burkina Faso’s MDG sensibilization
campaigns. These have been instrumental in raising awareness on the MDGs in the absence of a formal monitoring framework and are necessary since few development actors understand the content of MDGs. The sensibilization campaigns mainly consisted of the publication and dissemination of the country’s MDG report, press intervention, and workshops and seminars. These primarily targeted the general public, decision-makers, journalists, students and private-sector operators. The use of the press is important to sensibilize the masses and there are plans to use television-programs in this regard. More workshops are planned targeting deputies, governors, elected officials and the general population.
Group Discussion 34. The representative from Cape Verde added that the selection of monitoring indicators
for the Growth and Poverty Reduction Strategy Paper was based on those indicators linked to the country’s development strategies in coherence with the MDGs. Data are unavailable for some indicators such as those related to Malaria and HIV/AIDS. He also mentioned that there is a national committee chaired by the Minister of Finance and other stakeholders namely the Central Bank in charge of monitoring. This is due to the strong link between poverty and governance and a high correlation between fiscal and monetary policies. There are also local committees in charge of the implementation of programmes.
35. The meeting took note of Sierra Leone’s initiative in establishing an effective PRSP monitoring system based on an active and effective core committee composed of the Statistician General, the Secretary of Finance, and the Director of the PRSP Secretariat during the PRSP preparation. Every week a different sub-committee reported to this core committee in charge of monitoring progress towards the target of producing a Poverty Reduction Strategy Paper.
36. Participants recognized the importance of sensitizing the general public, technicians and policy makers about the MDGs via different channels such as mass media campaigns and workshops. The effectiveness of using television campaigns was questioned given that only a certain sub-group of the population has access to television. It was acknowledged that TV programs are insufficient to cover all issues. Community radio could be considered as another communication tool to raise awareness on the MDGs.

24
Presentation: GhanaInfo an adaptation of DevInfo – Mr. Issa Ouedraogo and Mr. Andrew Young Lamptey 37. Mr. Issa Ouedraogo from the National Development Planning Commission (NDPC)
in Ghana presented GhanaInfo, a project of NDPC and the Ghana Statistical Service (GSS), that is an adaptation of the DevInfo application. He highlighted that the government of Ghana uses GhanaInfo as a national database for MDGs and PRSPs. He noted that all agencies involved with Monitoring and Evaluation had been involved in the project to avoid duplication. Three main units have contributed to the institutional setup of GhanaInfo: first, the Steering Committee serving as a guide and supervisor of the implementation, administration and general progress of the database; second, the Technical Advisory Committee (TAC), involved in issues such as the choice of indicators and the harmonisation and quality control of data; third, the Management Committee Unit providing the secretariat for the other two units.
38. Mr. Andrew Young Lamptey from the Ghana Statistical Service (GSS) added that the
main objectives of GhanaInfo are to create a harmonised framework for country socio-economic information system development and to ensure the use of information by district and regional constituencies. Until now, 219 indicators have been entered into Ghana’s database. Data are produced by GSS and request for indicators and related information were sent to Ministries, departments and agencies. It is the duty of the TAC to certify and approve indicators in the database based on minimum criteria that include availability of metadata on the indicators. It was highlighted that one advantage of GhanaInfo is that the database will contribute to a better Ghana’s dissemination system, more organized and effective and with data available to a broader range of users.
39. The following session of questions and answers clarified the issues such as:
a. There is no limit in the number of indicators GhanaInfo can store. It currently includes 219 indicators but this number is expected to increase. Other country databases contain more indicators like Niger’s database with 450 indicators.
b. The aim for GhanaInfo is to serve as a central database for Ghana’s data. This would require every Ministry to add its data to the statistical database every couple of months and would thus require training of personnel.
c. GhanaInfo is composed of 2 main parts: the user part and the administrator part used to input data.
d. After the launch of GhanaInfo, representatives from Ministries were trained. Ideally, each Ministry would have its own version of GhanaInfo which would be centralized at Ghana’s NSO.
e. Although there are many groups involved in the setup of GhanaInfo, all committees function well together as each has specific activities. The steering committee includes the heads of UNICEF and DFID (British Department for International Development). The technical advisory group

25
includes experts from different ministries as well as NGOs. The management committee meets on a regular basis.
f. Information Technology (IT) experts are needed to define which format and what type of data different users need.
g. The national database would include all statistics and would be used at the national, regional and global levels. GhanaInfo provides the interface with the central database which should collect the data at the grass root levels from different projects in the country;
h. Before GhanaInfo was launched in July 2005, an advisory committee was formed which is responsible for adding indicators.
F. THIRD PLENARY SESSION: Goal 1 –POVERTY
Presentation: Measuring and Monitoring Poverty for the MDGs – Mr. Johan Mistiaen, World Bank 40. The representative from the World Bank presented an overview of the challenges
faced when measuring and monitoring poverty for the MDGs. He reviewed the three poverty indicators in the MDG framework and explained the computation procedures to arrive to the international standardization of the poverty line.2 The definition of the “$1-a-day” and its relevance at the country level was clarified. It was recalled that the “$1” measure is used mainly because the 1990 national poverty lines expressed in PPP (purchasing power parity) terms were concentrated around the $1-a-day value. It was reminded that the $1-a-day measure is only used for international comparison purposes and that national poverty lines should be used at the country level.
41. In the following session of questions and answers, participants: (a) suggested excluding countries affected by war in regional poverty aggregates. Some Sub-Saharan African countries in conflicts or post-conflicts situations have very different circumstances from more stable countries in the continent. Including these countries in poverty aggregates distorts the regional estimates; (b) recognized the importance of a poverty map to target areas where interventions are needed was also pointed out. Poverty maps make use of Geographic Information System (GIS) technology that was presented as one way to integrate administrative, census and survey data at different levels on the poverty map as a basis for policy-making. Participants agreed that poverty maps are a useful tool to detect inequalities at sub-national levels and among population groups. Poverty maps were proposed to identify areas where specific interventions are needed and to formulate appropriate policies; (c) noted that consumption measures are preferred to income measures for poverty monitoring in Africa as people in the informal sector—which is prominent in most African countries—are more likely to be truthful about consumption information.
2 Poverty measurement and dissemination tools available at www.worldbank.org/research/povmonitor and the interactive website PovcalNet at <www://iresearch.worldbank.org/PovcalNet>.

26
Exercise on poverty statistics
42. Participants were asked to discuss on the following issues: (a) main sources of data and methodology used for poverty calculations; (b) the existence of a monitoring strategy for poverty reduction; and (c) major challenges, proposed solutions and recommendations to improve poverty statistics in the region.
Question: What are the sources of data and methodology used for poverty calculations? 43. All countries have the capacity to collect poverty data. The main sources of data used
for poverty calculations are mainly the Household Income and Expenditure (Consumption) Surveys. Other sources include censuses and international data sources such as MICS (Multiple Indicator Cluster Survey), LSMS (Living Standards Measurement Study) and CWIQ (Core Welfare Indicators Questionnaire). Some countries use calorie or energy intake to calculate a measure of poverty.
Question: Does a monitoring strategy for poverty reduction exist? 44. All countries have a strategy/plan for poverty monitoring even though countries are at
different levels in terms of the monitoring process. Togo for example has an intermediary PRSP report. Burkina Faso, Senegal and Guinea are on their second PRSP report. The creation of a monitoring framework for Guinea Bissau and Liberia is not yet in place. Some countries have a permanent secretariat or department within the monitoring framework to monitor poverty. A couple of countries are unsure in which department to place a poverty monitoring unit.
Question: What are the major challenges for monitoring poverty and what are the recommendations to improve poverty statistics in the region? 45. Participants highlighted the following as the major challenges faced by countries in
the ECOWAS region, in measuring and monitoring poverty: The need to (a) strengthen data analysis capacity; (b) increase human and financial resources; (c) improve data collection; (d) establish a centralized system for data and coordinated data production; (e) ensure an effective plan is in place.
46. Other problems that participants noted during the discussion included: (a)
misunderstandings as to which departments were responsible to carry out tasks during surveys with international agencies; (b) defining a food consumption basket given different consumption patterns in different regions; (c) the absence in distinguishing between living conditions and lifestyle; (d) the lack of means to proceed to data dissemination.

27
G. FOURTH PLANARY SESSION: Goals 2 and 3 – EDUCATION and GENDER EQUALITY
Presentation: Goal 3: Promote Gender Equality and Empower Women – Ms. Fabia Yazaki, UNSD 47. Ms. Fabia Yazaki from UNSD focused on the share of women in wage employment
in the non-agricultural sector (indicator 11) in her presentation given that this indicator is the least tracked by ECOWAS countries under Goal 3. She highlighted that although, on average since 1990, there has been a trend of growth for this indicator in Africa, that does not necessarily reflect an improvement in the quality of women’s employment, i.e. the types of jobs, security, earnings and benefits. Since non-agricultural wage employment represents only a portion of total employment and since gender inequality in the labour market takes many forms, such as segregation by occupation, wage differentials, women’s higher relative unemployment rates, and women’s disproportionate participation in informal types of employment, more indicators are necessary to portray women’s position in the labour market and paid employment. She thus reported on a new set of indicators proposed by the gender sub-group of the Inter-Agency Expert Group (IAEG) to monitor women’s participation in the labour market at the national level. This proposal includes the share of women in total employment, in agricultural employment and in non-agricultural employment broken down by own account workers, employers and members of producers’ cooperatives (MPC), contributing family workers, employees, and domestic employees. These categories are broken down into formal and informal sectors to capture women’s high participation in the informal economy in most African countries.
Group Discussion 48. In the following session of questions and answers, participants pointed out:
a. The need of improving expertise in data analysis at the country level. The representative from Sierra Leone stated that data sources for gender indicators are available since most surveys ask gender-related questions. However, the major problem is that although data are collected, there is not enough expertise to analyze these data.
b. The high presence of women in the agricultural sector in Africa. This is significant and is also reflected in the 2005 World Summit Outcome Document.
c. The need to stress at the advocacy level the situation of women in the region: because women do not have title to land and also lack status and credibility, they do not have the same access as men to credit and to knowledge on more efficient and environmentally smart techniques.
d. The higher unemployment rate of women compared to men even at the same level of qualification/education.

28
Presentation: MDG Indicators on Education - Ms. Fabia Yazaki, UNSD 49. The representative from UNSD presented the definition, computation, data sources
and limitations of the education indicators within goals 2 and 3. She highlighted that the gender parity index should be calculated as the ratio of female gross enrolment rate to male gross enrolment rate rather than the rate of the absolute enrolment number of girls to boys to take into consideration the age and sex structure of the population. She gave an example of calculating the survival rate to grade 5 by using sample surveys and administrative records based on the reconstructed cohort method. She reminded that, together, the MDG indicators on education measure three dimensions of a country educational system: (a) the access to education; (b) the capacity to retain pupils in school; and (c) the quality of the education received. She stressed that in order to better measure and evaluate education, additional indicators need to be used to obtain a more complete understanding of the educational system.
Group Discussion 50. In the following plenary session participants discussed:
a. The rationale for using the first five years of schooling in the calculation of the survival rate for primary education (indicator 7). This is due to the fact that this five-year range is the minimum requirement for a child to be considered literate. Nevertheless, the indicator should be adapted to reflect the definition adopted by the national education system. Therefore, countries whose primary school system is 6 years were encouraged to adapt indicator 7 to reflect this.
b. The calculation of the survival rate based on the modified cohort method was elaborated. Only four questions, found in most household surveys, are needed to calculate this indicator: is the child currently at school?; in what grade?; was the child in school last year?; if yes, in which grade?
c. The difficulty of measuring literacy both at national and international levels was discussed as countries often have their own definition of literacy. It was recalled that UNESCO is working on the Literacy Assessment Monitoring Program (LAMP) to address this issue. The program is based on tests for literacy rather than rely on a respondent’s answer as to whether he/she is literate. It was noted that if the respondent can read or write in any language, even if it is not the official language, the respondent should be considered literate.
51. Participants recommended the creation of an online network for the ECOWAS region
to share methodological and technical aspects for monitoring the MDGs.

29
Countries’ experience on data collection and availability, calculation of indicators, obstacles and solutions for Goals 2 and 3
Cape Verde, Goal 2– Mr. Pedro Moreno Brito 52. Mr. Pedro Moreno Brito, from the Cape Verde National Statistical Office, presented
Cape Verde’s experience in tracking Goal 2: Achieve Universal Primary Education. Cape Verde tracks the net enrolment rate, the proportion of pupils starting grade 1 who reach grade 5, and the literacy rate of 15-24 year-olds (indicators 6, 7, 8). Adequate data are available for all three indicators. Administrative sources are used to collect data for indicators 6 and 7, whereas censuses are used to measure literacy which has increased by 12 percentage points nationally from 1990 to 2000.
Cape Verde, Goal 3 – Ms. Maria de Lurdes Fernandes Lopes 53. Ms. Maria de Lurdes Fernandes Lopes, from Cape Verde National Statistical Office,
presented the most relevant gender-related indicators for Cape Verde. In addition to the MDG indicators for Goal 3, these indicators are: (a) the net enrolment rate at primary and secondary school by sex; (b) degree holders at primary and secondary education by sex; (c) the rate of women’s illiteracy aged 15-24; (d) the proportion of women with decision-making power; and (e) the rate of women who are victims of violence. She highlighted that violence against women is a very complex phenomenon in Cape Verde and noted the lack of sex disaggregated data as one of the main constraints to analyse and address the issue. Cape Verde has almost achieved Goal 2 but the educational system remains to be improved. Although significant progress has been made in achieving gender parity in primary education, women are disproportionately illiterate and unemployed compared to men. A Statistical Agenda for Development is being prepared to improve the production and dissemination of statistics. In order to achieve this, there is a need for an employment survey every semester, a yearly Common Welfare Indicators Questionnaire (CWIQ), Household Surveys every 5 years, Population and Housing Censuses every 10 years and reliable education administrative records.
UNDP Liberia – Mr. George Gould
54. Mr. Gould, from the Liberia UNDP office noted that education and gender data are
available but difficult to collect in Liberia especially in rural areas due to logistic constraints, poor infrastructure (communication, roads, etc), and low wages. He proposed certain solutions to improve data collection problems such as building capacity, improving work incentives (income), improving preparation to conduct surveys or collect data, and increasing the provision of basic logistics. He stressed that modern methods such as IT infrastructure and software are especially needed to calculate MDG indicators. He stressed that political will and transparency are necessary in the public and private sectors. Reform is needed at all levels in the public sector. He also mentioned the need to empower the Liberia NSO and improve M&E implementation, and to localize DevInfo. In order to improve data collection on

30
gender, he additionally exposed the need to increase awareness on women’s situation, and to encourage women’s participation in all activities.
Gambia – Mr. Baba Suwareh
55. Mr. Baba Suwareh of the Gambian NSO presented Gambia’s experience in
monitoring MDG Goals 2 and 3 and stressed the need for capacity building. Gambia collects data on the net enrolment rate in primary education and on the proportion of pupils starting grade 1 who reach grade 5 (indicators 6 and 7). These are mainly collected by the NSO and the Directorate of Planning of the Department of State for Education (DOSE). He stressed that although some other indicators on education obtained from censuses are available, they are not produced timely for some users due to the large-scale nature of the census operation. He pointed out that the Net Enrolment Ratio (NER) tends to be underestimated due to the use of overestimated population projections used in the calculation. He proposed some strategies to overcome these challenges such as to solicit assistance to build human and resource capacity of the NSO from international organisations, to make use of indicators calculated from MICS, and to strengthen the collaboration between the NSO and other data producing institutions. Under Goal 3, Gambia monitors two indicators: the ratio of girls to boys in primary education and the ratio of girls to boys in lower secondary education. Since there has not been a comprehensive study on gender and empowerment of women by the Women’s Bureau, the mandated agency, the main data on gender are captured by other agencies such as the Central Statistics Department. A comprehensive study on gender, which is in an advanced stage of preparation, is planned to address this shortcoming. The Gambia representative also pointed out that all stakeholders take part in the Census.
Group Discussion 56. The following points were discussed in plenary: (a) the Nigerian representative
stressed that it is important not to isolate gender in response to a study on gender. This only results in treating gender as a subject such as women’s issues, therefore wasting the opportunity to have a gender sensitive approach in the various areas of development; (b) the representative from Sierra Leone advised the Liberian NSO to be involved in the building of the statistics infrastructure and data collection as soon as possible after peace is established. It is important for the NSO to be part of the exercise from the start and establish itself as the central organ of statistics and not to lag behind in the recovery phase. NSO should be well represented during this period, when international aid is present, and aim to build capacity so as to rebuild a sustainable system and ensure the NSO role in it.

31
Exercise on countries’ experience in measuring employment and education indicators 57. Participants were divided into three working groups to answer the following
questions on employment and on education: (a) Employment:
1) In your country’s context, how well does indicator 11 reflect women’s employment situation? 2) What data sources are you using to measure employment? 3) Challenges and recommendations for measuring women’s employment.
b) Education:
1) In your country’s context, are you using more than one data source to measure education indicators? If yes, how are the multiple sources integrated? 2) How are countries adapting the indicators to their reality/context? 3) Challenges for measuring education and recommendations.
Question: In your country’s context, how well does indicator 11 reflect women’s employment situation? 58. Generally, participants agreed that indicator 11 does not reflect women’s employment
situation as a large proportion of women work in the agricultural sector, in family settings or housekeeping activities where women are not remunerated, and in the informal sector.
Question: What data sources are you using to measure employment? 59. Some countries measure employment through Labour Force Surveys. Household
Surveys such as MICS, Budget Consumption Surveys and CWIQ are also widely used as data sources. Other sources of data mentioned by fewer countries include censuses, establishment surveys, Participatory Poverty Assessment and surveys on the informal sector. It was noted that some countries lack specialized surveys for employment.
Question: Challenges and recommendations for measuring women’s employment 60. The main challenges participants acknowledged in measuring women’s employment
are: a) lack of sex-disaggregated data; b) lack of human resource capacity for analysis; c) bias in the reporting of analysis as most of the data are not collected nor analyzed in a gender-sensitive manner; d) lack of gender focus in planning activities; e) some countries have very outdated data from censuses; f) not enough coverage from Labour Force Surveys, especially outside capital cities.
61. Some recommendations that participants proposed to improve the measurement of women’s employment included: a) conduct Labour Force Surveys on a national scale; b) harmonise concepts and methodologies to guarantee comparability; c) improve

32
human resource capacity for analysis d) promote the importance and improve staff skills in incorporating an gender perspective in all stages of the production of statistics g) increase NSO staff retention rates.
62. The distinction between sex-disaggegated data and gender sensitive data was
emphasized. Sex-disaggregated data is insufficient to be gender sensitive. For data to be gender sensitive a gender perspective needs to be applied since the development of surveys. Such a distinction appears not to be very clear, especially among data users.
Question: In you country’s context, are you using more than one data source to measure education indicators? If yes, how are these multiple sources are integrated? 63. All countries use more than one data source to measure education indicators.
Administrative records are the main data source. Question: How are countries adapting the indicators to their reality/context? 64. Most indicators are calculated in accordance with the international standard definition
and methodology. However, an example of adapted indicator is in the calculation of the net enrolment ratio in primary education, since the number of years of primary education may vary from country to country.
Question : Challenges for measuring education and recommendations. 65. The challenges participants noted include: a) data gaps; b) need to address
compulsory education; d) duplication in data collection. Several recommendations for measuring education were pointed out such as: a) wider and better use of administrative sources; b) strengthen capacity at the level of the administration; c) ensure the frequency of Household Surveys; d) improve coordination of data collections.
H. FIFTH PLENARY SESSION: Goals 4, 5, 6, 7 – CHILD and MATERNAL MORTALITY, HEALTH and ENVIRONMENT
Presentation: Monitoring Progress in Maternal Mortality Reduction – Ms. Francesca Coullare, UNSD 66. Ms. Coullare distinguished between the maternal mortality ratio (MMR) and the
maternal mortality rate and mentioned that the former is the one used for the global and regional monitoring of maternal mortality. She pointed out that the most reliable data source to measure mortality is a complete vital registration system (registering more than 90% of deaths). For most countries that have incomplete vital registration, censuses and surveys are used to obtain estimates of maternal mortality. For example, twenty-three per cent of global births occur in countries using censuses and household surveys to estimate maternal mortality. The Reproductive Age Mortality Surveys

33
(RAMOS) were also mentioned as the gold standard for measuring mortality in the absence of a complete registration of deaths and cause of deaths. Ms. Coullare emphasized that until civil registration is improved, trend analysis based on the MMR should be avoided. She noted that process indicators that are highly correlated with maternal deaths are used to assess progress achieved in maternal mortality over time. These indicators have more data available, can be measured more frequently, are less expensive to measure, and unlike the MMR, can be used for monitoring programmes. One such process indicator is the Proportion of births attended by skilled health personnel (indicator 17). It was stressed that traditional birth attendants (TBA) are not considered to have the necessary skills and should not be included in the calculation of this indicator.
Presentation: Reducing Child Mortality – Ms. Francesca Coullare UNSD 67. The three indicators under Goal 4 were presented by Ms. Francesca Coullare. She
explained the definition, concept, method of computation and limitations to the under-five mortality rate, the infant mortality rate, and the proportion of 1 year old children immunized against measles (indicators 13, 14, 15). There are extremely high variations in Africa for each of the three indicators. If both MICS and Demographic and Health Surveys (DHS) are available as data sources for child and infant mortality, it was recommended to use DHS (based on complete birth histories and providing direct estimates of chills and infant mortality), rather than MICS. The latter uses indirect estimates based on questions on children ever born and surviving and it generally overestimates infant mortality rates for countries with poor social conditions.
Group Discussion 68. Several points were discussed in plenary after the introductory presentations
including: a. The two definitions of maternal mortality: maternal death and death
pregnancy related. The former is used when it is established that the death was due to obstetric complications or was attributable to pregnancy. The latter is used when no accurate health statistics are available. Both definitions cover the period of 42 days after the termination of pregnancy. The reason 42 days is used in the definitions is that, biologically, women are more susceptible to complications during this period called the post-partum effect.
b. Participants recommended investing in vital registration in every country as a strategy to promote accuracy of health data. Unless birth and death records are registered, data on indicators such as the maternal mortality ratio are flawed. A complete vital registration system is needed for effective monitoring of these indicators.
c. Participants noted the need to provide continuous training to midwives, health centres, and hospitals to meet health objectives and to be able to diagnose causes of death accurately. Many times women who die from

34
obstetric complications go unnoticed leading to a misclassified death. There is a need for data to be coherent between statisticians and those who register the data. Midwives play a vital role in this registration process. It was noted that often the difference between traditional birth attendants(TBAs) and midwives is not clear to respondents of DHS. This impacts the measurement of indicator 17 (the proportion of births assisted by skilled birth attendants). Although some TBAs are trained in some countries to compensate for a deficit in staff to help midwives, they are not officially considered as skilled birth attendants.
d. Health indicators in the countries of the region are obtained mainly from household sample surveys (DHS and MICS). There is thus the need to strengthen vital registration to improve the monitoring of health issues. Coverage of registration of births and deaths in the region is not complete, with the exception of Cape Verde where registration of births and deaths is high, but still not completely reliable (problem of late registration for births and of classification of cause of deaths).
e. It was noted that the variations in mortality among countries in the region is due to the presence of different health policies. For example, Cape Verde has a much higher rate of doctors per population than other countries in the ECOWAS region. The issue of properly distributing health centres across the country was also pointed out as a key element to improve health status in the population.
f. In addition to focusing on the MMR, it was suggested to look at the issue of contraceptives and causes of death due to early pregnancies and pregnancies that are not properly spaced. As the true objective is to improve women’s health, family planning and reproductive health should be addressed.
g. The monitoring of immunization against measles (indicator 15) instead of other diseases was questioned. It was stressed that measles is used in the global monitoring framework. Countries are encouraged to monitor other diseases if more relevant to their health situation. It was also noted that measles was chosen as it is the most deadly disease in children with a known vaccine.
h. Ms. Coullare presented the UNSD programme to strengthen vital statistics and registration systems mainly based on training workshops covering all steps of the civil registration: the preparation of the legal framework, the registration of the events and maintenance of the systems and the dissemination of vital statistics.
Presentation: Combat HIV/AIDS, Malaria, TB – Mr. Moussa Diakhate, Senegal 69. Mr. Moussa Diakhate presented the targets and indicators within Goal 6. For indicator
18, he distinguised between countries with generalized epidemics (those with an estimated HIV prevalence greater than 1%) that measure the HIV prevalence among pregnant women aged 15-24 years, and those with non-generalized epidemics (estimated prevalence less than or equal to 1%) where HIV prevalence is measured

35
among population groups at high risk. The two main sources of data are data on women attending antenatal care clinics (ANC) and population based surveys including testing for HIV in selected countries. ANC-based sentinel surveillance systems are the gold standard since surveys tend to have more biased results. He noted that indicator 19b, the proportion of respondents 15-24 with comprehensive correct knowledge of HIV/AIDS is not computed in many countries and is curently based on two proxy indicators. He also mentioned that the effect of sensitization campaigns can be reflected in the contraceptive prevalence rate (indicator 19c). The limitation pointed out with respect to the Orphan school attendance ratio is that it does not include children that live out of households.
70. With respect to malaria indicators, it was highlighted that there is no valid method
currently avaible for malaria prevalence. The definition based on the number of thick smear and malaria cases notified in a year divided by the population estimate for the same year is not valid. The under 5 mortality rate should be used in combination with the measured coverage of the three interventions, i.e. insecticide-treated bednets (ITN), availability of drugs, and protection of pregnant women, as the best way to monitor malaria mortality.
Countries’ experience on data collection, data availability, calculation of indicator, obstacles, solutions for Goals 4 and 5
Burkina Faso – Mr. Bakari Traore 71. Burkina Faso’s development process of indicators for Goals 4 and 5 was presented by
Mr. Bakari Traore. Monitoring of MDGs is mainly conducted by the National Statistical and Demographic Institute, the Survey and Planning Division within ministerial departments and the National Observatory for Poverty and Sustainable Human Development that is responsible for centralising data on different indicators. One challenge in the monitoring of indicators is that timing in the production of indicators is not respected. Other challenges are the multiplicity of sources—as data production systems are not harmonised, the lack of qualified staff to collect, analyse and disseminate data, and financial constraints. The tracking of indicators 13 and 14 will be incorporated in the annual CWIQ (Core Welfare Indicators Questionnaire). Collaboration between the Health Division and the NSO is needed to harmonise population projections used in the calculation of indicator 15. Burkina Faso measures the MMR through the sisterhood method.
Sierra Leone – Mr. Gbogboto Musa 72. Mr. Gbogboto Musa presented Sierra Leone’s experience in drafting its first MDG
Report (MDGR) which concentrated on infant, child and maternal mortality due to the high rates prevailing after the war. Beyond Freetown, there is no vital statistics registration system. The main data sources for Goals 4 and 5 are household surveys conducted for PRSPs. Analysis beyond that required for PRSP is a problem. The main challenge in collecting data for these goals is destruction of infrastructure

36
caused by the 10 year war, an uncoordinated vital registration system between local and government levels, a weak monitoring system and a need for the NSO to coordinate statisticians in different ministries. The statistical capacity of line ministries themselves needs to be strengthened. He highlighted that the Statistics Department is now independent from the Ministry of Planning. Sierra Leone’s MDGR preparation was a collaboration between the Government, the UN Country Team (UNCT), and civil society with the UNCT leading the process.
Countries’ experience on data collection, data availability, calculation of indicator, obstacles, solutions for Goal 6
Togo – Mr. Totomba Boukpessi 73. Mr. Totomba Boukpessi focused on some indicators on the level and trends of
HIV/AIDS reflecting the progression of this pandemic for Togo. He highlighted the necessity to fight this pandemic as Togo is one of the top three countries affected by HIV/AIDS in West Africa according to UNAIDS. Some of the indicators mentioned include the HIV prevalence rate in the general population and in most affected groups, the number of orphans with HIV/AIDS and the number of persons who have died from AIDS. He stressed that one major reason for the propagation of HIV/AIDS is the existence of two main roads in Lome that are frequented by truck drivers who get in touch with the local population. He highlighted that malaria is one of the principal causes of child mortality and that tuberculosis is highly correlated with HIV/AIDS. The MDG monitoring setup is weak due to low capacity to collect and analyse data, low quality of recent data (last census was in 1981). Togo lacks an adequate statistical law and statistical coordination at national level. Nevertheless, a road map to develop a National Strategy for the Development of Statistics (NSDS) is being developed and should improve data production.
Niger – Mr. Dangana Alio
74. Mr. Dangana Alio highlighted high population growth, insufficient development aid,
food insecurity, and weak access to basic social services as major challenges to achieving MDGs in Niger. Main data sources for the monitoring of Goal 6 are DHS, MICS, CWIQ, the National Survey on Seroprevalence, and data from the National Health Information System (SNIS) in charge of monitoring indicators related to health policies. The SNIS and NSO lack of human resources among other obstacles to data collection and production. He stressed that statistical capacity for the monitoring of Goal 6 is weak and a plan to address this needs should be prepared quickly.
Mali – Mr. Arouna Sougane 75. Mr. Arouna Sougane presented Mali’s MDGs framework. Mali has adapted the MDG
framework to national needs by identifying 8 goals, 19 targets and 61 indicators that are nationally relevant. Only 34 of these indicators have been analysed so far. Mali is using DevInfo to centralise data and facilitate data analysis. The representative

37
specified that HIV/AIDS indicator data are mainly from DHS. Data for malaria and tuberculosis indicators are collected at the level of health structures and compiled at the level of the National Directorate of Health. Data from UNDP were used for Mali’s MDG national report however, as the necessary information was not centralised. He also noted general problems with data collection and the national health system.
Presentation: Monitoring Water and Sanitation – Ms. Francesca Coullare, UNSD 76. Ms. Coullare introduced the monitoring of water and sanitation within Goal 7. At the
international level there is an attempt to harmonise questionnaires in the Joint Monitoring Programme (JMP) for Water Supply and Sanitation3. Prior to 1997 the data produced by the administrative sector (Ministry of Health, Water Departments) were used as the basis for monitoring. Since 1997 there has been a methodological shift to using household sample surveys. The definitions for improved drinking water sources and improved sanitation facilities as spelled out by target 10 were reviewed. The JMP can provide materials on methodology, harmonised survey questions and indicators and run regional workshops. NSOs were encouraged to promote harmonised water and sanitation modules in surveys and in national censuses.
Presentation: Senegal’s experience on data collection, data availability, calculation of indicator, obstacles, solutions for Goal 7 – Ms. Fall Mariama 77. Ms. Fall Mariama highlighted the importance of water strategies within Senegal’s
development strategies. In addition to MDG target 10, Senegal has set a number of country targets in relation to water and sanitation such as to ensure access to 35 litres of drinking water per day per person by 2010. She noted the various government projects in place to achieve these targets especially at regional and rural levels and specified the funding needed for each project. CWIQ (Core Welfare Indicators Questionnaire), the main source of data on water and sanitation, shows that access to drinking water in urban areas increased by 8.5 percentage points between 1996 and 2005. She mentioned that one challenge is the lack of coordination between MDGs and PRSP which is in a separate unit. She noted that the Ministry of Planning is the body that manages data and often excludes the NSO from decisions.
Group Discussion 78. The plenary discussion focused on the following: (a) some concern about malaria
prevention was raised. It was questioned whether sleeping under mosquito nets, the basis of the malaria prevention indicator, is really the solution for malaria prevention as there is a high probability of being bitten by a mosquito at any other time; (b) the 1% HIV prevalence cut-off point was questioned. When the rate of HIV is below 1% the disease is considered to develop inside the population at risk and thus estimates within this population would reflect the situation. (c) a representative from Cape
3 Joint Monitoring Programme country figures, files, graphs and information are available at www.wssinfo.org

38
Verde shared his country’s experience about monitoring goals 6 and 7. Sentinel sites are used as data sources to measure HIV prevalence which is under 1%. It was also noted that Demographic and Health Surveys (DHS) collected blood from 6,000 people to study the prevalence of AIDS and anemia. Indicators 18 and 19 will be tracked but there is no capacity to measure indicator 20 yet. Drinking water under Goal 7 was included in the DHS survey and Consumption Budget Survey of 2001/02; (d) it was suggested that the transportation aspect described by Togo is not enough to explain its high HIV/AIDS prevalence rate. Sensibilisation campaigns must be strengthened. In Benin for example, focal points to fight AIDS have been appointed encouraging the population to use condoms.
Exercise on the capacity of countries to produce data for MDG indicators and the role of National Statistics Offices.
79. Participants were divided into 3 groups and asked to answer the following questions: Question: Where do ECOWAS countries stand in the production of indicators for the monitoring of MDGs? 80. Participants mentioned that: (a) data are available for some but not all of the MDG
indicators (except for Liberia where data are generally lacking). Data are insufficient with respect to coverage in all cases and outdated in some; (b) human resources are inadequate in all countries. In some this is due to an insufficiency in the number of staff and necessary qualification. In others, human resources are qualified but suffer from insufficient remuneration, leading to excessively high staff turnover; (c) there are capacity building needs for human resources, financial and logistic resources (such as computers, cars, and survey equipment), data processing equipment.
Question: what is the level of involvement of NSOs in the production and monitoring of the MDGs ? 81. Participants answered that: all ECOWAS countries’ National Statistical Offices are
involved in the monitoring of the MDGs, albeit at different levels of participation. All NSOs supply data to the MDG national reports and some are also involved in the drafting of the report. Other countries however are weakly involved in the writing of the report and the monitoring of the MDGs.
Questions: What are the NSO’s responsibilities and priorities for MDG monitoring? Who does what among data producers in the country? Are responsibilities and roles well defined? Are the priorities of the NSO well defined? 82. Participants pointed out that: (a) NSOs tend to have clear roles, responsibilities and
well defined priorities. In many cases NSO priorities are based on the National Strategy for the Development of Statistics (NSDS) or equivalent framework which exist for most countries and are in the process of development for others. In most

39
cases a functional institutional framework for MDG monitoring exists. In some cases, however, it is inadequate due to lack of staff, offices, equipment, and motivation to work. For some countries the existence of an MDG functional institutional framework is due to the existence of the PRPS framework on which the former is based; (b) among the data producers in a country, in general, NSOs carry out surveys and the Census and line ministries produce administrative and sectoral data; (c) although the responsibilities and roles of NSOs are well defined, often there are duplications and in some instances, data are not analysed because of conflict between departments.
I. SIXTH PLENARY SESSION: LESSONS LEARNT AND RECOMMENDATIONS
83. The following conclusions and recommendations were discussed in plenary and
endorsed by the participants. General assessment: 84. In the ECOWAS region: (a) all fifteen countries have produced an MDGs country
report; (b) all countries have adapted the list of indicators used for the monitoring of progress achieved at the regional and global level to their national circumstances; (c) all countries have a designated authority in charge of monitoring MDGs; (d) data are available for some but not all of the MDGs indicators (except for Liberia where data are generally lacking) and for some indicators, data are insufficient and/or outdated; (e) most countries in the region lack capacity to monitor MDGs indicators in the areas of environmental sustainability (Goal 7) and of global partnership for development (Goal 8); (f) National Statistical Offices (NSO) are involved in the monitoring of the MDGs, albeit at different levels of participation. NSOs supply data to MDG monitoring and most of them are also involved in the drafting of the report; (g) in many cases, NSOs programmes are based on National Strategies for the Development of Statistics (NSDS) or equivalent programmes. These programmes exist for most countries or are in the process of development for others; (h) by and large, a functional institutional framework for MDGs monitoring exists. In some countries this is due to the existence of PRSPs; (i) in some cases however, the institutional framework is inadequate due to lack of financial resources, human resources (quantity and quality), physical infrastructures, equipment, and incentives to work.
85. Among the needs identified to improve MDGs monitoring capacity in the region,
participants underlined:
a) Conduct methodological training in the calculation of certain indicators.
b) Strengthen capacity in human resources
c) Good governance
d) Strengthen capacity in IT and transportation equipment

40
e) Establish public-private partnerships for data collection
f) Localise MDGs and improve data disaggregation capacity
g) Improve data collection and data analysis.
h) Increase frequency of sample surveys to ensure greater availability of data points over time
i) Establish a national database/bank for monitoring MDGs
j) Enhance interactions between national statistical offices and international agencies and establish a more effective and adequate mechanism of data reporting to international agencies.
k) Participants also noted that in order to improve national capacity, it is
necessary to look at the quality of data and not only frequency of data production.
Recommendations: 86. Several recommendations were highlighted. Namely:
a.Strengthen collaboration between the agencies at national level There is a need for strengthening cooperation among NSOs and other national institutions involved in the collection and processing of official statistics for MDGs indicators. Statisticians need to initiate partnerships and protocols for exchanging data with other authorities such as the Ministries in charge of education, health, environment, etc. Although such an arrangement is specifically sanctioned by legislation in many countries, in practice it is seldom operational.
b.Strengthen the reporting mechanism between countries and international
agencies Periodic consultations between NSOs, other data producers at the national level, and the United Nations System is needed. Furthermore, training of NSO staff on data dissemination techniques to enhance the communication of official statistics from national statistical offices to specialised international agencies is also crucial. It was noted that the MDG indicators database maintained by the United Nations Statistics Division (UNSD) generally reflects country data well, although some discrepancies exist in some areas like poverty.
c.Establish an ECOWAS Regional Technical Committee on MDGs and Poverty
Statistics
Considering the fact that the UNSD/ECOWAS Statistical Cooperation has a steering committee in place, the participants strongly recommend that a technical committee on MDGs and Poverty statistics be established. The technical committee should consist of MDGs and Poverty statistics focal persons in the

41
National Statistical Offices and representatives of all MDGs stakeholders in the member countries of the region.
d.Strengthen data analysis capacity of NSO staff
The importance of improving data analysis skills among personnel in the institutions that produce official statistics was emphasized. It was also highlighted that although sometimes data are available, sufficient analysis is not conducted due to lack of adequate capacity.
e.Make use of “Poverty Maps” to detect inequalities at sub-national levels and
among population groups Poverty maps were proposed to identify areas where specific interventions are needed and to formulate appropriate policies. Poverty maps make use of Geographic Information Systems (GIS) technology integrating administrative, census and survey data at different geographic levels.
f.Sensitise the public to the importance of MDGs
Participants recognized the importance of sensitising: the general public, technicians and policy makers about MDGs via different channels such as mass media campaigns and workshops.
g.Establish national statistical systems in post conflict situations
For post conflict countries, timing is essential for the establishment of a solid statistical system. Once peace is reached, during the recovery stage and when roles are being instituted, the NSO should seize the opportunity to establish itself as the centre of the national statistical system. It needs to be well represented in the recovery process especially as major statistical responsibilities are being defined and capacity building is available from external contributors who will be present for that period.
h.Improve civil registration systems, the best source of mortality statistics
Civil registration has been recognised as the best source for data needed to calculate selected MDGs indicators, particularly for those related to health. With the exception of Cape Verde, however, the coverage of birth and death registration in the other ECOWAS countries is not complete. Participants stressed the need to improve vital registration systems.
i.Increase the frequency of Surveys and Censuses
In order to be able to monitor poverty, the participants recommend that ECOWAS members states conduct a Household Income and Expenditure Survey every 5 years accompanied by a “lighter” survey on poverty (CWIQ type) every year, and a population census every 10 years.

42
j.Adopt a National Strategy for the Development of Statistics (NSDS) The participants judge it desirable that all countries in the region adopt NSDS or an equivalent statistical development programme. Development partners should support particularly post conflict countries.
In light of the M+10 milestone, to take place in 2010, they recommend that all NSDS set, among other objectives, the strengthening of national capacity towards: (a) the production of better statistics to calculate indicators for MDGs monitoring and for poverty reduction policies monitoring;(b) the improvement of analysis of these statistics and indicators; (c) the update of the MDGs reports for 2010.
k.Privilege the use of NSDS to integrate national statistical systems
NSDS or the development programme is the privileged framework for the improvement of the integration of national statistical systems. Participants call on international, regional and bilateral partners for the improvement of coverage and ultimately the integration of their household sample survey programmes. Particularly, DHS (Demographic and Health Surveys) and MICS (Multi Indicators Clusters Surveys) could be merged and CWIQ (Core Welfare Indicators Questionnaire) surveys could be used as the only instrument to annually monitor national and sector-specific policies in the fight against poverty.
They recommend paying special attention when elaborating the NSDS to improve coordination of statistical activity programmes between the central institution and other units in charge of statistics in ministries and other governmental administrations.
l.Create an information network on the MDGs for the ECOWAS countries
Participants recommended the creation of a network for the exchange of information on MDGs. The network will be composed of NSOs from the ECOWAS countries. Country experts will be able to get information, exchange ideas and initiate statistical documentation on MDGs. The exchange, in order to be easily shared among experts, shall be done electronically. Thus, the NSO network will necessarily adopt a website. The host of this website is to be chosen by the group of countries. It is not excluded that the ECOWAS secretariat be, in the beginning, requested to include this project in its plan of action to connect its member countries.
The information to be exchanged will be of a dynamic nature. In fact, experts will have the freedom to consult, adding other information they judge necessary to the web pages. The website shall be set up in such a way that will allow each contributor to easily access the information and above all be able to review historical information if desired.
m.Improve indicators for access to drinking water and basic sanitation

43
Regarding the indicators relative to “sustainable access to safe drinking water and basic sanitation”, the participants recommend the inclusion of the variables used in their calculation in population and housing censuses and household surveys.
n.Conduct a population and housing census every 10 years.
Participants urge the authorities of member states to take the required actions to assure the effective realisation of a population and housing census around 2010 in all ECOWAS countries in collaboration with the Economic Commission for Africa.
Specific conclusions on the session on how to integrate MDGs and Poverty Reduction Strategies monitoring systems (PRSP) All countries have a strategic plan for poverty monitoring. Countries are at different levels in terms of their poverty reduction monitoring process. Togo for example has an interim PRSP report, while Burkina Faso, Senegal and Guinea are on their second PRSP report. In addition, some countries in the region have a permanent secretariat or department within the monitoring framework to monitor poverty. In Liberia and Guinea Bissau, the placement of a poverty monitoring unit is yet to be decided. The integration of MDGs with PRSPs is done at the level of indicators. There is in fact a high alignment between MDG and PRSP monitoring indicators. Furthermore, in most of the countries the same authority is in charge of both the MDGs and PRSPs monitoring. On the other hand, continuous monitoring of the PRSP indicators is weak due to lack of data and there is a need for sub-national monitoring for PRSPs. The participants took note of Sierra Leone’s initiative in establishing an effective PRSP monitoring system based on an active and effective core committee composed of the Statistician General, the Secretary of Finance, and the Director of the PRSP Secretariat during the PRSP preparation. Specific conclusions on the session on poverty indicators All countries in the region have the capacity to collect poverty data. In general, Household Income and Expenditure (Consumption) Surveys are the main sources of poverty data. Other sources include censuses and international data sources such as MICS (Multiple Indicator Cluster Survey), LSMS (Living Standards Measurements Studies) and CWIQ.
The difficulty of measuring the informal sector, important in most African countries in the measurement of poverty, was noted. Consumption measures are preferred to income measurements in Africa as people in the informal sector are more likely to be truthful about consumption information. Finally, the case of Togo needs to be highlighted from the rest of the region for the lack of data to monitor poverty. Its only source of data is a sample survey from 1987 and the last population census dates back to 1981.

44
Specific conclusions on the session on indicators on education and gender empowerment Countries in the region obtain indicators on education from administrative data from ministries of education, household sample surveys and censuses. Participants noted the need to coordinate the production of education statistics to avoid duplication of efforts. As for women’s participation in the labour force, it was noted that in some countries there is the lack of nationally representative Labour Force Surveys. It was noted that there is the need for public awareness of the importance of gender sensitive statistics in the region. Specific conclusions on the session on health indicators
Health indicators in the countries of the region are obtained mainly from household sample surveys (DHS and MICS). There is thus the need to strengthen vital registration to improve the monitoring of health issues. Coverage of registration of births and deaths in the region is not complete, with the exception of Cape Verde where registration of births and deaths is high, but still not completely reliable (problem of late registration for births and of classification of cause of deaths). It was suggested that improved coverage of births and deaths could be achieved by using nurses and birth attendants as “notifiers” of the event to the civil registration office.
It was also noted that the variations in mortality among countries in the region is due to the presence of different health policies. For example, Cape Verde has a much higher doctors/population rate than other countries in the ECOWAS region. The issue of properly distributing health centres across the country was also pointed out as a key element to improve health status in the population.
J. CLOSING CEREMONY 87. Mrs. Patricia de Mowbray, United Nations resident Coordinator, thanked the
organizers for the successful meeting, acknowledged the importance of a sound statistical system to properly inform policy makers and encouraged the group to keep working together to be ready for the next challenge in data production for 2010.
88. The Minister of Planning and Finance addressed the participants and emphasized the
importance of international cooperation on the improvement and strengthening of official statistics. Cape Verde has benefited from such cooperation and now has a series of comparable statistics at the ECOWAS level. Special mention and thanks were given to the cooperation with PARIS21, the ECOWAS secretariat, the European Union and the United Nations Statistics Division. The Minister highlighted the role and challenges of statisticians in best applying the science of statistics and the latest information technologies for the increasingly pressing, diversified and complex needs of data users. He emphasized the increased responsibility of the authorities in

45
promoting the good use of statistics, strengthening capacity in statistical analysis, promoting the mobilization of financial resources in order to facilitate the major statistical operations, and preserve already achieved gains. Attention was also brought to the authorities’ responsibility in promoting the dialogue among data users, and in guaranteeing the legal and institutional conditions to the independence and impartiality of official statistics. The commitment of the Cape Verdian government in achieving all of the MDGs until 2015 was restated.
89. Mr. Francisco Tavares closed the ceremony, stressing the importance of the event and
highlighting the main conclusions and recommendations elaborated by the participants throughout the week, pointing out their relevance for the development in the ECOWAS region.

46
Annex I. List of Participants
Meeting on Data and Indicators to Monitor Progress towards the Millennium Development Goals
Praia – Cape Verde, 5-9 December 2005
Participants List Benin Ms. Justine Adekounle ODJOUBE Coordonnatrice de l'Observatoire du Changement Social Ministere Charge de la Planification et du Developpement
Phone: (229) 21 32 78 06 Phone 2: (229) 90926231 Fax: Email address: [email protected] Email address 2: [email protected]
Benin Mr. Sourou KOUBADJE DJATON Directeur de la Coordination Statistique, de la Formation et de la Recherche Institut National de la Statistique et de l`Analyse Economique
Phone: (229) 909 15 523 Phone 2: (229) 932 04 959 Fax: (229) 21 30 82 46 Email address: [email protected] Email address 2:
Burkina Faso Mr. Salifou ZOUNGRANA Chargé d'étude General Economique Bureau
Phone: (226) 766 21 551 Phone 2: Fax: (226) 503 15 410 Email address: [email protected] Email address 2:
Burkina Faso Mr. Bakari TRAORE Chef du Service de la Prevision et de l'Analyse de Conjoncture
Phone: (226) 70 26 32 52 Phone 2: (226) 50324431 Fax: (226) 50 39 97 37 Email address: [email protected]

47
Cape Verde Mr. Francisco Fernandes Tavares Presidente Instituto Nacional de Estatistica
Phone: (238) 261-3827 Phone 2: Fax: (238) 261-1656 Email address: [email protected] Email address 2: [email protected]
Cape Verde Mr. Pedro Moreno Brito Technician of statistics and planning Institute of National Statistics of Cape Verde GEP-MEVRH
Phone: (238) 261 02 07 Phone 2: (238) 99131 39 Fax: (238) 261 56 76 Email address: [email protected] Email address 2: [email protected]
Cape Verde Ms. Maria de Lurdes Lopes Demographer Demographics and Social Statistics - INECV
Phone: (238) 262 12 28 Phone 2: (238) 997 61 07 Fax: Email address: [email protected] Email address 2: [email protected]
Cape Verde Mr. Rene Charles Silva Director of Demographics and Social Statistics Demographics and Social Statistics - INECV
Phone: Phone 2: Fax: Email address: [email protected] Email address 2:

48
Cape Verde Ms. Larissa Fernandes Director of the Labour Department Institute of National Statistics of Cape Verde – INECV
Phone: (238) 9817541 Phone 2: Fax: Email address: [email protected] Email address 2: [email protected]
Cape Verde Ms. Miriam Monteiro Technicienne du Secretariat Technique D`Appui au Developpe (STAD) Direction General du Plan – Ministere des Finances and Plan
Phone: 00238 2607531 Phone 2: Fax: Email address: [email protected] Email address 2: [email protected]
Cape Verde Mr. António Pires National Expert Project Coordination Ministry of Finance and Planning
Phone: Phone 2: Fax: Email address: [email protected] Email address 2:
Cape Verde Mr. Sanoussi Idrissa Economist PNUD Praia-Cape Verde
Phone: (238) 2621401 /02 Phone 2: (238) 2621402/03 Fax: Email address: [email protected] Email address 2: [email protected]
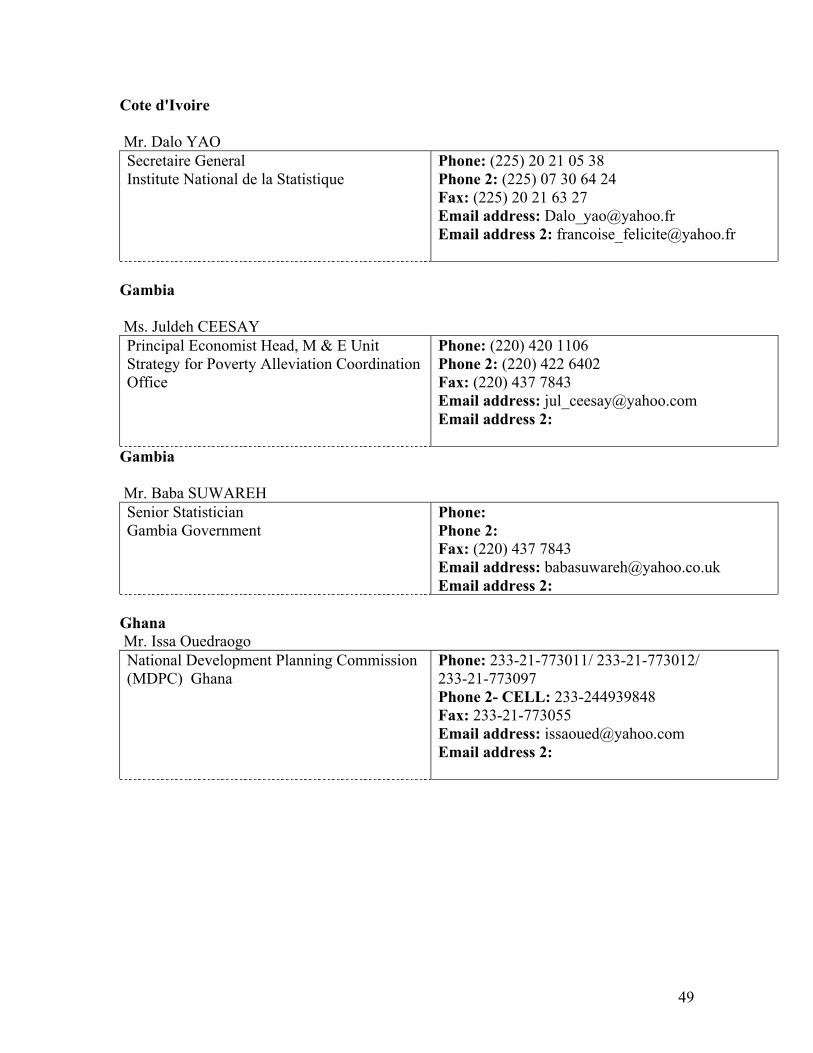
49
Cote d'Ivoire Mr. Dalo YAO Secretaire General Institute National de la Statistique
Phone: (225) 20 21 05 38 Phone 2: (225) 07 30 64 24 Fax: (225) 20 21 63 27 Email address: [email protected] Email address 2: [email protected]
Gambia Ms. Juldeh CEESAY Principal Economist Head, M & E Unit Strategy for Poverty Alleviation Coordination Office
Phone: (220) 420 1106 Phone 2: (220) 422 6402 Fax: (220) 437 7843 Email address: [email protected] Email address 2:
Gambia Mr. Baba SUWAREH Senior Statistician Gambia Government
Phone: Phone 2: Fax: (220) 437 7843 Email address: [email protected] Email address 2:
Ghana Mr. Issa Ouedraogo National Development Planning Commission (MDPC) Ghana
Phone: 233-21-773011/ 233-21-773012/ 233-21-773097 Phone 2- CELL: 233-244939848 Fax: 233-21-773055 Email address: [email protected] Email address 2:

50
Ghana Mr. Andrew Young LAMPTEY Senior Statitician Ghana Statistical Service
Phone: (233) 021 682 642 Phone 2: Fax: Email address: [email protected] Email address 2:
Guinea Mr. Saikou Ahmed Tidiane BALDE Chef de Section Statistiques Direction Nationale de la Statistique
Phone: (224) 57 71 82 Phone 2: (224)414567 Fax: (224) 41 30 59 Email address: [email protected] Email address 2:
Guinea-Bissau Mr. Francisco DA COSTA EX-Directeur General Institute Nacional de Estatistica e Census (INEC) Membre du Comité de Pilotage OMD
Phone: (245) 20 54 57 Phone 2-Mobil: (245) 7218234 Fax: Email address: [email protected]
Liberia Mr. Kormay ADAMS Research Officer LISGIS, Ministry of Planning & Economic Affairs
Phone: (231) 6533 149 Phone 2: Fax: (231) 227 698 Email address: [email protected] Email address 2: [email protected]

51
Liberia Mr. George B. Gould UNDP - Liberia
Phone: 231-6513017 Phone 2: Fax: Email address: [email protected] Email address 2: [email protected]
Mali Mr. Arouna SOUGANE Charge de methodes et outils Statistiques Direction Nationale de la Statistique et de l'Informatique (DNSI)
Phone: (223) 613 89 98 Phone 2: Fax: (223) 222 71 45 Email address: [email protected] Email address 2:
Niger Mr. Dangana ALIO Chef Division Enquetes socio demographiques Institut National de la Statistique
Phone: (227) 59 80 79 Phone 2: Fax: (227) 73 59 34 Email address: [email protected] Email address 2: [email protected]
Nigeria Ms. Alice NWOSU Assistant Director Federal Office of Statistics
Phone: (234) 1 481 4159 Phone 2: (234) 80 23 194 877 Fax: (234)-3149684 Email address: [email protected] Email address 2:
Nigeria Mr. Iliyasu Mustapha BOBBO National Accounts Statistician ECOWAS
Phone: (234)- 3149683 Phone 2: (234)-8057962335 Fax: (234)- 3149684 Email address: [email protected] Email address 2: [email protected]

52
Senegal Mr. Moussa DIAKHATE Responsible of health system information Ministere de la Sante et de la Prevention Medicale
Phone: (221) 656 5672 Phone 2: (221) 8552261 Fax: (221) 869 4249 Email address: [email protected] Email address 2: [email protected]
Senegal Ms. Fall MARIAMA Bureau du Suivi des Conditions de Vie des Menages (BSCVM) Division de Enqueetes Demographiques et Sociales
Phone: (221) 824 03 01 Phone 2: (221) 651 44 15 Fax: (221) 824 90 04 Email address: [email protected] Email address 2:
Sierra Leone Mr. Gbogboto Bundu MUSA Statistician Statistics Sierra Leone
Phone: (232) 22 223898 Phone 2: (232) 76636420 Fax: (232) 22 223897 Email address: [email protected]; [email protected] Email address 2:
Togo Mr. Totomba Bassante BOUKPESSI Chef de Division Ministere du Developpment et de l`emenegement du Territoire
Phone: (228) 221 22 87 Phone 2: (228) 221 62 24 Fax: (228) 221 27 75 Email address: [email protected] Email address 2:

53
Resource Persons United Nations Statistics Division Ms. Francesca Coullare Head, Development Indicators Unit 2 United Nations Plaza DC2-1678 New York New York 10017 United States
Phone: (1212) 963-4950 Phone 2: Fax: (1 212) 963-9851 Email address: [email protected] Email address 2:
United Nations Statistics Division Ms. Fabia Yazaki Statistician 2 United Nations Plaza DC2-1680 New York New York 10017 United States
Phone: (1212) 963-4823 Phone 2: Fax: (1 212) 963-9851 Email address: [email protected] Email address 2:
United Nations Statistics Division Ms. Léa Hakim Associate Statistician 2 United Nations Plaza DC2-1657A New York New York 10017 United States
Phone: (1212) 963-4512 Phone 2: Fax: (1 212) 963-9851 Email address: [email protected] Email address 2: [email protected]
The World Bank Mr. Johan A. Mistiaen Economist-Statistician
Phone: (1 202) 473-5866 Phone 2: (1 202) 522-1153 Fax: Email address: [email protected] Email address 2:

54
PARIS21 Mr. Gerard CHENAIS OECD\ Secrétarial de PARIS21 Conceiller Senior en Statistique
Phone: 33.1 45248984 Phone 2: 33-1 45249051(Secrétarial) Fax: 2: 33-1 45249406 Email address: [email protected] Email address 2: [email protected]

55
Annex II. Bureau of the meeting Table 1: Meeting Chairpersons and Vice-Chairpersons
Table 2 : Rapporteurs
Session Rapporteur 1 Rapporteur 2 5 – 9 Dec.
Mr. Baba SUWAREH Senior Statistician Gambia Government (English)
Mr. Arouna SOUGANE Charge de Methodes et Outils Statistiques Direction Nationale de la Statistique et de l'Informatique (DNSI) Mali (French)
Session Chairperson Vice-Chairperson Monday, Dec. 5th
Mr. Francisco Fernandes TAVARES President Instituto Nacional de Estatistica Cape Verde
Ms. Alice NWOSU Assistant Director Federal Office of Statistics Nigeria
Tuesday Dec. 6th
Mr. Issa OUEDRAOGO Ghana Planning Commission
Ms. Justine Adekounle ODJOUBE Coordinatrice de l'Observatoire du Changement Social Ministee Charge de la Planification et du Developpement Benin
Wednesday Dec. 7th
Ms. Fall MARIAMA Bureau du Suivi des Conditions de Vie des Menages (BSCVM) Division de Enquetes Demographiques et Sociales Senegal
Mr. Gbogboto Bundu MUSA Statistician Statistics Sierra Leone
Thursday Dec. 8th
Ms. Francesca Coullare Head: Development Indicators Unit United Nations Statistics Division
Mr. Moussa DIAKHATE Responsible of health system information Ministere de la Sante et de la Prevention Medicale Senegal
Friday Dec. 9th
Mr. Francisco Fernandes TAVARES President Instituto Nacional de Estatistica Cape Verde

56
Annex III. Organisation of Work Cape Verde, 5 – 9 December 2005
Monday, 5 December 2005 09:00-10:00 Welcome / Opening 10:00-10:15 COFFEE BREAK 10:15-10:45 Introduction and administrative information
Presentation of workshop objectives and agenda Election of members of the meeting’s bureau
10:45-12:00 Introduction: MDG, Goals, Targets & Indicators Monitoring the implementation of the Millennium Declaration: national and global monitoring
12:00-13:00 PARIS21 – National Strategies for Development of Statistics within national strategies for development
13:00-14:30 LUNCH BREAK
14:30-16:00 Group discussion based on the pre-workshop assignment sent to participants
16:00-16:15 COFFEE BREAK
16:15-17:00 Summary of first day

57
Tuesday, 6 December 2005 8:30-9:45 Integration of MDGs and Poverty Reduction Strategies (PRS)
Monitoring Systems
9:45-10:30 Countries’ experience: presentations on the integration of PRS and MDGs - Cape Verde, Sierra Leone
10:30-10:45 COFFEE BREAK
10:45-11:00 Countries’ experience (cont.): presentation on raising MDGs awareness campaigns - Burkina Faso
11:00-11:20 Plenary discussion
11:20-12:30 DEVInfo presentation - Ghana (data user) and Ghana (Ghana Statistical Services)
12:30-14:00 LUNCH BREAK
14:00-15:00 Eradicate extreme poverty (Goal 1)
15:00-16:00 Discussion and/or exercise on poverty statistics
16:00-16:15 COFFEE BREAK
16:15-17:30 Conclusions on poverty statistics
Wednesday, 7 December 2005
08:30-9.30 Achieve universal primary education (Goal 2) and Promote gender equality and empower women (Goal 3)
9:30-10:30 Countries’ experience: presentations on data collection, data availability, calculation of indicator, obstacles, solutions - Cape Verde, Liberia, Gambia
10:30-10:45 COFFEE BREAK
10:45-12:30 Countries’ experience (continuation)
12:30-14:00 LUNCH BREAK
14:00-15:00
Group work
15:00-15:30 Conclusions on education and gender statistics
16:00 Activity prepared by the Institute of National Statistics of Cape Verde

58
Thursday, 8 December 2005
08:30-10:30
Health: child mortality and maternal health (Goals 4 and 5) Health: HIV/AIDS, malaria and TB (Goal 6) Water and Sanitation (Goal 7)
10:30-10:45 COFFEE BREAK
10:45-12:30
Countries’ experience: presentations on data collection, data availability, calculation of indicator, obstacles, solutions Goals 4 and 5: Burkina Faso, Sierra Leone Goal 6: Togo, Niger, Mali, Goal 7 (water and sanitation): Senegal
12:30-14:00 LUNCH BREAK
14:00-16:00 Group work
16:00-16:15 COFFEE BREAK
16:15-17:30
Conclusions from the group work
Friday, 9 December 2005
10:30-12:00 Presentation of conclusions and recommendations of the meeting and plenary discussion
12:00-15:00 Adoption of conclusions and recommendations of the meeting Evaluation of the meeting
15:00-15:15 COFFE BREAK
15:15-15:45
Closing