Embed Size (px)
Citation preview

United Kingdom:Abbey
Third Quarter 2008
London, 28th October 2008
México

Disclaimer
Abbey National plc (“Abbey”) and Banco Santander, S.A. ("Santander") both caution that this presentation contains forward-looking statements within the meaning of Section 27A of the U.S. Securities Act of 1933, as amended, (the “Securities Act”) and Section 21E of the U.S. Securities Exchange Act of 1934, as amended. These forward-looking statements are found in various places throughout this presentation and include, without limitation, statements concerning our future business development and economic performance. While these forward-looking statements represent our judgment and future expectations concerning the development of our business, a number of risks, uncertainties and other important factors could cause actual developments and results to differ materially from our expectations. These factors include, but are not limited to: (1) general market, macro-economic, governmental and regulatory trends; (2) movements in local and international securities markets, currency exchange rates, and interest rates; (3) competitive pressures; (4) technological developments; and (5) changes in the financial position or credit worthiness of our customers, obligors and counterparties. The risk factors and other key factors that we have indicated in our past and future filings and reports, including those with the Securities and Exchange Commission of the United States of America (the “SEC”), could adversely affect our business and financial performance. Other unknown or unpredictable factors could cause actual results to differ materially from those in the forward-looking statements.
The information contained in this presentation is subject to, and must be read in conjunction with, all other publicly available information, including, where relevant any fuller disclosure document published by Abbey or Santander. Any person at any time acquiring securities must do so only on the basis of such person's own judgment as to the merits or the suitability of the securities for its purpose and only on such information as is contained in such public information having taken all such professional or other advice as it considers necessary or appropriate in the circumstances and not in reliance on the information contained in the presentation.
In making this presentation available, both Abbey and Santander give no advice and make no recommendation to buy, sell or otherwise deal in shares in Abbey or Santander, or in any other securities or investments whatsoever.
No offering of Securities shall be made in the United States except pursuant to registration under the Securities Act or an exemption therefrom.Nothing contained in this presentation is intended to constitute an invitation or inducement to engage in investment activity for the purposes of the prohibition on financial promotion in the U.K. Financial Services and Markets Act 2000.
Note: Statements as to historical performance, historical share price or financial accretion are not intended to mean that future performance, historical share price or future earnings (including earnings per share) for any period will necessarily match or exceed those of any prior year. Nothing in this presentation should be construed as a profit forecast.
Note: The results information contained in this presentation has been prepared according to Spanish accounting criteria and regulation in a manner applicable to all subsidiaries of the Santander Group and as a result it may differ from the one disclosed locally by Abbey.

3
n Market Environment
Agenda
n Q3 2008
- Business Update
- Results
NOTE: Unless otherwise stated the figures/comments on subsequent pages exclude the impact of the B&B and A&L transactions

4
4.6 4.65.5
4.9
3.8
2005* 2006* 2007* 2008 (e) 2009 (e)
Interest Rates (%, annual average)
1.47 1.461.28 1.28
1.46
2005* 2006* 2007* 2008 (e) 2009 (e)
GBP : Euro exchange rates (annual average)
Inflation is expected to fall in 2009 as growth slows
2.1 2.3 2.3
3.93.3
2005* 2006* 2007* 2008 (e) 2009 (e)
Annual CPI inflation rate (%, annual average)
*source - Office for National Statistics & Bank of England (e) estimated by Abbey
Market Environment
2.0
2.9 3.0
0.9
0.0
2005* 2006* 2007* 2008 (e) 2009 (e)
Annual GDP Growth ( %, annual average )

5
Unemployment is rising and expected to increase in 2009
Market Environment
Monthly change in claimant count unemployment (000)
Source – Office for National Statistics
-20
-15
-10
-5
0
5
10
15
20
25
30
35
40
Jan-05 Jul-05 Jan-06 Jul-06 Jan-07 Jul-07 Jan-08 Jul-08
Unemployment rate (end year, %)
(e) estimated by Abbey
5.1
5.55.2
6.0
7.1
4.0
4.5
5.0
5.5
6.0
6.5
7.0
7.5
2005* 2006* 2007* 2008(e) 2009(e)*end year, ILO definition

6
The level of mortgage approvals has fallen sharply in the last year. Lower house purchase activity is now resulting in falling house prices.
Market Environment
-10
-5
0
5
10
15
Q1 '04 Q3 '04 Q1 '05 Q3 '05 Q1 '06 Q3 '06 Q1 '07 Q3 '07 Q1 '08 Q3-Q4'08 (e)
Annual house price growth (%)
Source – Department for Communities and Local Government.
Annual house price growth (%)
Aug ‘07:
11.3%Aug ‘08:
(3.4%)
-80%
-60%
-40%
-20%
0%
20%
40%
60%
Jan-04 Aug-04 Mar-05 Oct-05 May-06 Dec-06 Jul-07 Feb-08
House Purchase Remortgage
House purchase and remortgage approvals (number of approvals (s.a., 000s))
Source – Bank of England
Annual growth in the number of approvals(%, sa)
Aug-08

7
The growth of household borrowing has slowed sharply since the middle of 2007 and by end of 2008 growth could be around 4%
*Please note: • Growth rates are calculated using the Bank of England’s methodology - this expresses period net lending as a percentage of the prior period stock.
1,314 1,345 1,383 1,409 1,428 1,443 1,452 1,464
9.4
4.45.5
7.38.610.010.210.5
Q1'07
Q2'07
Q3'07
Q4'07
Q1'08
Q2'08
Q3'08est
Q4'08est
1,101 1,130 1,166 1,187 1,198 1,211 1,220 1,230
10.0
4.15.3
11.57.4
9.010.911.2
Q1'07
Q2'07
Q3'07
Q4'07
Q1'08
Q2'08
Q3'08est
Q4'08est
Source – Bank of England.
- annual growth rates (%)
Total lending to individuals* Mortgage lending market stock* Consumer credit market stock*
213 215 218 222 230 232 232 234
5.9 5.66.57.06.7
5.65.25.8
Q1'07
Q2'07
Q3'07
Q4'07
Q1'08
Q2'08
Q3'08est
Q4'08est
Market Environment
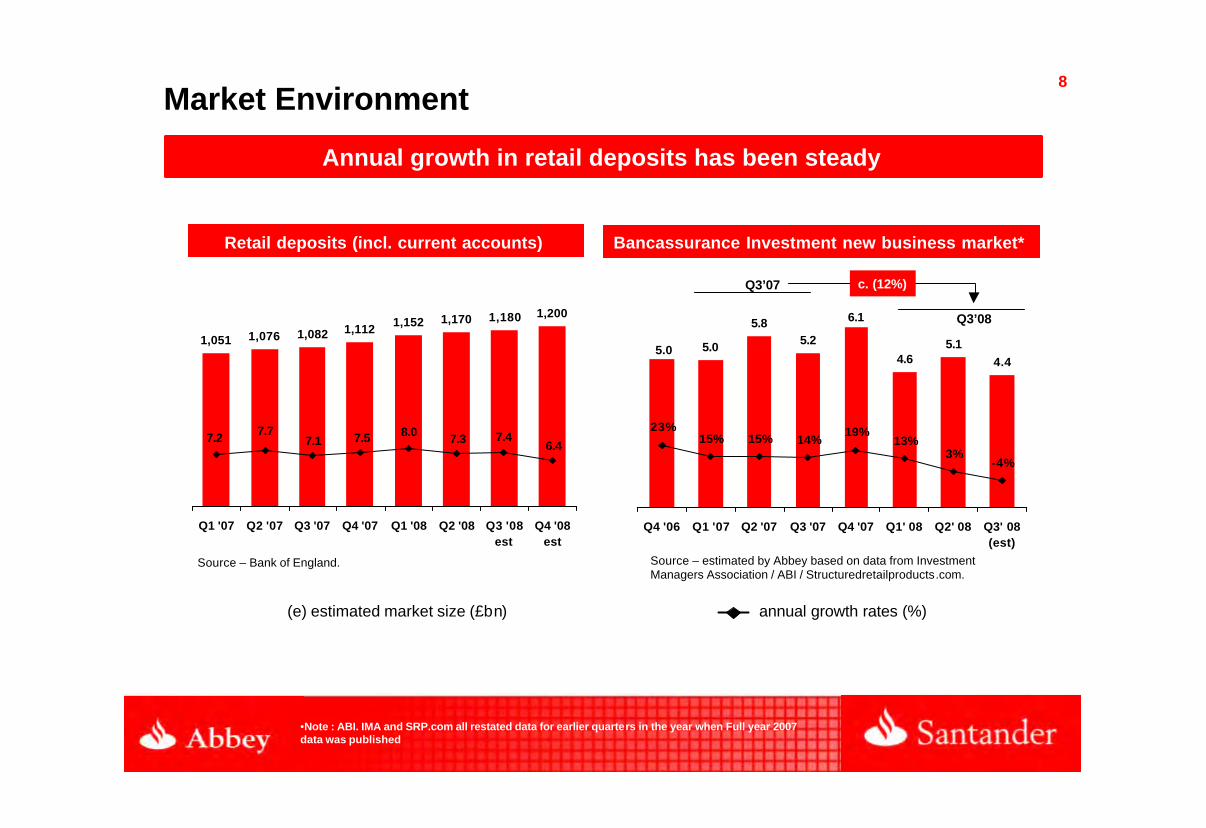
8
Annual growth in retail deposits has been steady
Market Environment
(e) estimated market size (£bn)
1,051 1,076 1,082 1,112 1,152 1,170 1,180 1,200
6.47.47.38.07.57.1
7.77.2
Q1 '07 Q2 '07 Q3 '07 Q4 '07 Q1 '08 Q2 '08 Q3 '08est
Q4 '08est
Retail deposits (incl. current accounts)
Source – Bank of England.
•Note : ABI. IMA and SRP.com all restated data for earlier quarters in the year when Full year 2007 data was published
Source – estimated by Abbey based on data from Investment Managers Association / ABI / Structuredretailproducts.com.
annual growth rates (%)
Bancassurance Investment new business market*
Q3’07
Q3’08
c. (12%)
5.0
5.85.2
6.1
4.65.1
4.45.0
14%
-4%
15% 15%23% 19%
13%3%
Q4 '06 Q1 '07 Q2 '07 Q3 '07 Q4 '07 Q1' 08 Q2' 08 Q3' 08(est)

9
Recent transactions make Santander the third largest Retail deposit taker in the UK
Santander’s UK Franchise
(1) excludes Social Housing – this portfolio now included into Corporate Banking(2) includes cahoot(3) based on Abbey’s estimate of market size(4) Abbey UPL stock excludes cahoot(5) the B&B total includes 141 agencies
Bradford & Alliance & TotalAbbey Bingley Leicester 30/09/08
Customer deposits (£bn) 72.6 19.7 23.8 116.0Residential Mortgages (1) (£bn) 115.4 n/a 39.5 154.9UPLs (2) (£bn) 2.4 n/a 3.5 5.9Total Retail Lending (£m) 121.9 n/a 43.1 165.0
Estimated market shares: (3)
Mortgage stock 9.9% n/a 3.4% 13.3%Deposits / Savings stock 6.0% 1.9% 2.1% 10.0%UPL's stock (4) 2.9% n/a 4.3% 7.2%
Branches (5) 708 338 254 1,300Branch market share 5.6% 2.7% 2.0% 10.3%ATMs 2,111 58 2,358 4,527ATM market share 3.0% 0.1% 3.3% 6.4%

10
n Market Environment
Agenda
n H1 2008
- Business Update
- Results

11Business Update
Abbey on track for another
year of strong results
§ excellent business & financial results
§ revenue growth of over 13% – well ahead of last year and outperforming our peers
§ strong operating jaws and improvement in cost:income ratio
§ increased coverage of secured lending portfolio
Moving towards a fully fledged commercial bank
§ c.64% of remortgages versus c.48% last year§ consumer loans via further advances rather than UPLs – lower risk§ unsecured represents less than 2% of portfolio following continued active reduction § BTL 1% of total mortgage book§ prime lending only and average LTV of stock significantly below CML average – in the third
quarter negligible lending in ‘greater than 90%’ LTV bracket§ arrears / PIPs better than CML average§ strong coverage of both secured (28%) and unsecured portfolios (over 100%)
Prudent lending / portfolio
Excellent performance in mortgages
Q3 ytd
§ improved margins, tighter lending criteria
§ gross lending £27.0bn in line with last year: market share 12.6% vs. 9.8% in prior year
§ repayments of £16.2bn, 20% lower than last year: market share 9.2% vs. 10.6% in prior year
§ net lending growth driven by strong performance in retention activities and sustained gross lending
volumes

12
Deposit flows well ahead of
last year
§ Q3 ytd retail deposit flows of £4.3bn up 70%, corporate banking flows of £1.7bn compared to £0.1bn in 2007 and retail structured products flows of £0.8bn, up 169% on prior year
§ overall investment sales up 18% despite market decline c.12%
§ retail assets funded c. 60% by deposits (further strengthened with the addition of B&B deposits of
c. £20bn)
§ short-term funding requirement reduced
§ Private Banking – successful launch of its first Structured Product and an agreed strategy in place for the future development of Abbey Stockbroking. Strong liability growth in both Cater Allen and Abbey International with development of the premium banking team, in the latter, progressing well
§ Corporate Banking - continue to have significant success expanding corporate banking business and have continued with project to build a full service small and medium-size enterprise (SME) operation that will ultimately enable Abbey to fully compete in the UK's mid-corporate business banking segment
§ Santander Global Banking & Markets – robust performance due to a focus on core business
Strategic projects
Business UpdateMoving towards a fully fledged commercial bank
Phase 2 of Abbey’s transformation is on track despite unprecedented markets
Transaction update
§ the B&B transaction completed on 29th September, adding an additional 338 Branches/Agencies to the franchise, strengthening Abbey’s funding position and significantly increasing retail customer deposit relationships
§ B&B’s c. £20bn of customer deposits mitigates A&L’s deposit/loan gap identified at announcement of A&L acquisition
§ the A&L transaction completed on 10th October and will bring Santander’s plans in the UK forward by two to three years in the SME/Corporate Banking segment

13Business Update
(1) API: Annual Premium Income measures the new business flows that impact revenue and commissions, excluding redemptions and market movements
Note: spread variances based on quarterly averages(2) Stock excludes FUM and spread excludes FUM and B&B
Business performance
Gross lending
Stock spread Q3'08 vs :Q3'07 +11bps Spread Q3'08 vs :Q3'07 +118bps
Spread Q3'08 vs :Q3'07 -11bps Spread Q3'08 vs :Q3'07 +5bps
Retail Deposits and Investments Bank accounts
Gross Lending Stock
Net Flows Stock (2) Adult openings Ave. current a/c
Mortgages Personal Loans
Gross lending Stock
5.2 5.0
Q3'07 Q3'08
191
287
Q3'07 ytd Q3'08 ytd
2.2 1.9
0.80.5
2.92.4
Q3'07 Q3'08
108.4
121.2
Q3'07 Q3'08
£m£bn £bn
2.54.3
1.3
1.63.95.9
Q3'07 ytd Q3'08 ytd
19.7
72.666.6
Q3'07 Q3'08
B&B
£bn £bn (000s) Liability (£bn)
£bn
Retail deposits API (1)
(0%) +12% (18%)
(3%)+50%+9%+52%
(20%)
Abbey branded Cahoot
769 632
13190
899 722
Q3'07 ytd Q3'08 ytd
6.7 10.8
20.3 16.2
27.1 27.0
Q3'07 ytd Q3'08 ytd
Net lending Repayments
(exc B&B)

14
Stock position restored to historical share of around 10%
Business: Lending trends / growth
(1) Social Housing reported within Corporate Banking
103.2 104.9 107.8 113.0 115.4
5.2 5.5 5.5 5.7 5.8
108.4 110.4 113.3 118.7 121.2
9.3% 9.3% 9.4% 9.7% 9.9%
Value Year on Year variance %
£bn
114.5 116.5 119.5125.1 127.7
7.7
11.5
Q3'07 Q4'07 Q1'08 Q2'08 Q3'08
Residential retail mortgage stock (£bn)
Social Housing stock (£bn)
Total Residential mortgages
Market share (%)
Q3'08£bn
Q3'08 vs Q3'07
Residential Retail mortgage 115.4 11.8%
Commercial mortgage 3.6 32.4%
UPLs 2.4 (18.4)%
Overdraft & Other 0.5 6.8%
Total retail loans 121.9 11.5%
Social Housing (1) 5.8 11.6%
Total retail loans and Social Housing 127.7 11.5%

15
Net lending share:
6.0% 6.0% 4.9% 7.7% 10.8% 8.5% 16.0% 42.2% 28.3%
Comment
Residential mortgage net lending and stock (£bn)
99.9 101.7 102.9 105.1 108.4 110.4 113.3 118.7 121.2
1.8 1.8 1.33.3
2.02.9
5.4
2.52.2
Q3'06 Q4'06 Q1'07 Q2'07 Q3'07 Q4'07 Q1'08 Q2'08 Q3'08
StockNet lending Stock +12%
Maintained strong retention and gross lending performance focused on longer term, lower LTV business
Business Update
§ growth in net mortgage lending attributed to a strong retention performance and sustained gross lending volumes in a smaller market
§ strong pricing and successful campaigns across both direct and intermediary channels
§ improved new business margins whilst tightening lending criteria
§ increased mix of longer term (3yr+) business through pricing and targeted channel and customer communications and offers
Gross lending share:
8.9% 9.1% 9.0% 10.0% 10.3% 9.8% 11.8% 14.4% 11.6%
Repayments share:
10.2% 10.6% 10.8% 10.9% 10.2% 10.3% 10.5% 8.6% 9.0%
Total residential mortgage repayments (£bn)
Total residential mortgage gross lending (£bn)
8.2 8.47.5
9.310.2
8.6 8.910.7
7.5
Q3'06 Q4'06 Q1'07 Q2'07 Q3'07 Q4'07 Q1'08 Q2'08 Q3'08
6.4 6.7 6.37.1
6.65.9
5.3 5.0
6.9
Q3'06 Q4'06 Q1'07 Q2'07 Q3'07 Q4'07 Q1'08 Q2'08 Q3'08
(27%)
(28%)
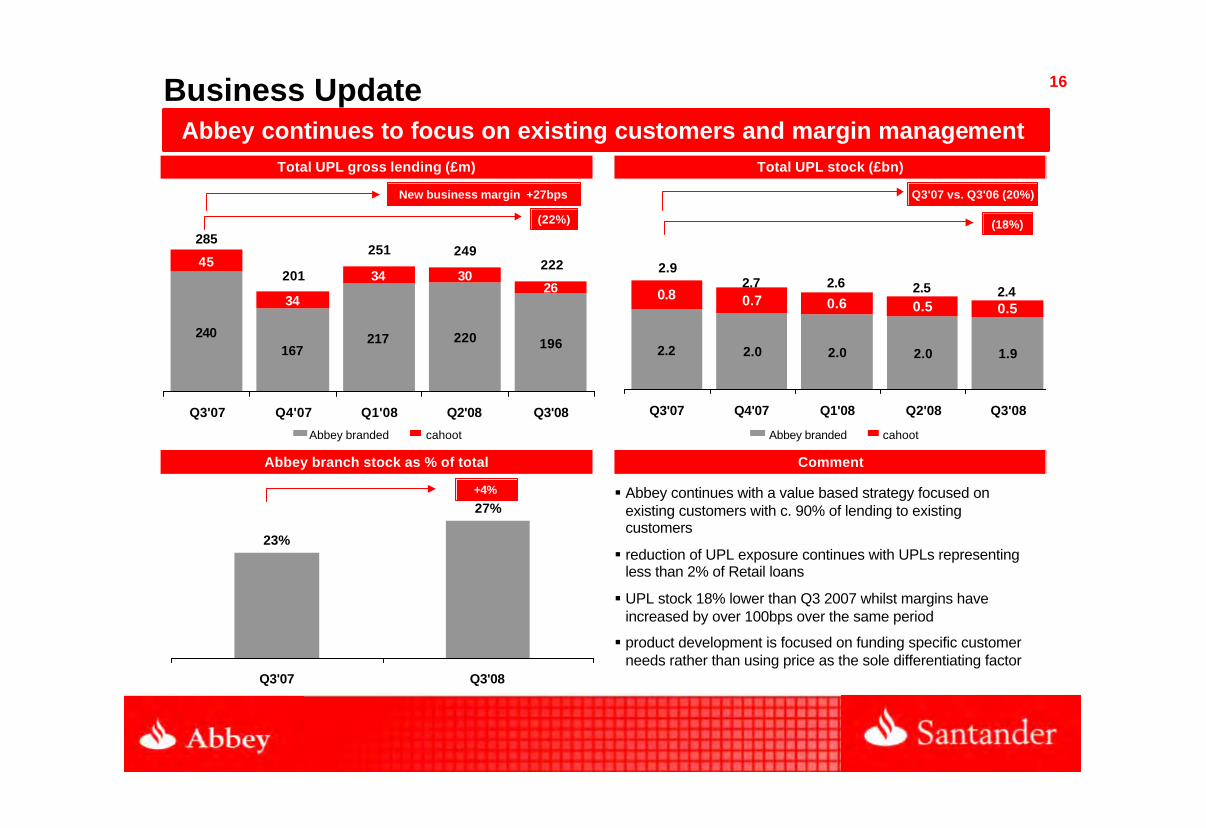
16
Comment
Total UPL stock (£bn)
2.2 2.0 2.0 2.0 1.9
0.8 0.7 0.6 0.5 0.52.42.52.62.7
2.9
Q3'07 Q4'07 Q1'08 Q2'08 Q3'08
(18%)
Abbey branded cahoot
Q3'07 vs. Q3'06 (20%)
Abbey continues to focus on existing customers and margin management
Business Update
§ Abbey continues with a value based strategy focused on existing customers with c. 90% of lending to existing customers
§ reduction of UPL exposure continues with UPLs representing less than 2% of Retail loans
§ UPL stock 18% lower than Q3 2007 whilst margins have increased by over 100bps over the same period
§ product development is focused on funding specific customer needs rather than using price as the sole differentiating factor
Abbey branch stock as % of total
Total UPL gross lending (£m)
240167
217 220 196
45
34
34 3026
285
201
251 249222
Q3'07 Q4'07 Q1'08 Q2'08 Q3'08
(22%)
New business margin +27bps
Abbey branded cahoot
23%
27%
Q3'07 Q3'08
+4%

17Business: Liability trends / growth
Overall growth supported by stronger product range
managed through Santander Asset Management(3)(2) other businesses including Abbey Business and cahoot(1) growth based on monthly average balance rather than closing which is subject to volatility
growth excluding market movement was -4%(4)
Q3'08£bn
Q3'08 vs Q3'07
Abbey branded savings 47.9 9.3%
Abbey bank accounts 5.5 (3.4)%
Private Banking 10.1 14.8%
Structured Product deposits 2.6 73.0%
Other (2) 6.4 (5.3)%
Total customer deposits 72.6 8.9%
Retail FUM (3) 4.1 (22.9)%
Total funds under management 76.6 6.6%
B&B customer deposits 19.7 n/a
Value Year on Year variance %
66.6 67.4 68.5 70.9 72.6
4.4
8.9
Q3'07 Q4'07 Q1'08 Q2'08 Q3'08
£bn
(1)
(4)

18
Abbey branch stock as % of total
Customer deposit flows (£bn)
0.7 0.6 0.8
2.11.40.1 0.2
0.3
0.2
0.30.9 0.8
1.2
2.4
1.7
Q3'07 Q4'07 Q1'08 Q2'08 Q3'08
+95%
25.2 26.0 26.728.5 28.9
Q3'07 Q4'07 Q1'08 Q2'08 Q3'08
+14%
Retail Structured Product flowsRetail deposit flows
Excellent growth in retail deposits supported by innovative product range
Business Update
(1) API: Annual Premium Income measures the new business flows that impact revenue and commissions, excluding redemptions and market movements
§ Abbey continued to deliver very strong deposit flows supported by the successful launch of the Instant Access Saver account, Super Saver campaign and tactical fixed rate bonds in the second quarter, along with the introduction of the Fixed Rate Reward Saver in the third quarter
§ despite the market being down c.12% for 9 months to Q3 08, Abbey investment sales were up 18%, as customers continue to move to low risk structured products, such as Abbey’s excellent capital guaranteed fixed-term investment range
§ continued expansion in the number of sales advisors
Comment
Investment new business sales - API (1) (£bn)
0.440.35 0.39
0.670.52
Q3'07 Q4'07 Q1'08 Q2'08 Q3'08
+17%

19
Successful in achieving targeted uplift in the level of openings
Business Update
§ Abbey continued to increase its level of bank account openings achieving a record number of account openings in the third quarter
§ continue to build on success in adult account openings and switcher customers, up over 60% and 40% respectively in Q3 08 compared to Q3 07
§ the continuation of successful products focused on switcher and adult : 6% youth account, 8% in credit rate, 0% overdraft has supported the growth in these segments
§ Abbey sees the current account relationship as a key driver of a customers overall experience with the bank and has increased focus to develop the business value
Total
Adults
Stock (m):
4.16 4.20 4.27 4.35 4.44
Abbey branded accounts
Bank account openings (000)
66 6586 93 107
44 3737
4454111 102
124137
161
Q3'07 Q4'07 Q1'08 Q2'08 Q3'08
Adults Other
+45%
71.6
33.3
70.2 75.995.1
Q3'07 Q4'07 Q1'08 Q2'08 Q3'08
+33%
Net Openings (000s)
+63%
Comment
Abbey branded average current a/c liability (£bn)
5.25.3
5.2 5.15.0
Q3'07 Q4'07 Q1'08 Q2'08 Q3'08
(3%)
20
n Market Environment
Agenda
n H1 2008
- Business Update
- Results
21
Strong performance drives income growth of 13.1%
Results: Gross operating income
644 661 698 720 756
573 591 621 625 674
404 416 441 452 495
169 175 180 17318072 70
78 9582
Q3'07 Q4'07 Q1'08 Q2'08 Q3'08
Net Interest IncomeNet FeesGains on Financial Transactions
£m 9M '08 9M '07
Net Interest Income 1,388 1,181 17.5%
Net Fees 532 514 3.4%
Total Commercial Margin 1,920 1,695 13.2%
Gains on Financial Transactions 255 227 12.0%
Gross Operating Income 2,175 1,923 13.1%
Var.% 08/07
Total £m
Total Commercial margin £m
Commercial revenues:
§ robust retail asset growth of 11% in challenging market conditions
§ continued focus on effective margin management for both mortgages and customer deposits contributed to an increase of 17.5% in net interest income

22Results: Commercial banking spreads
Asset spread benefiting from improvement in mortgage new business margins
0.69 0.69 0.65 0.61 0.66 0.70 0.77
1.28 1.32 1.36 1.37 1.341.25 1.24
1.43 1.41 1.40 1.39 1.43 1.41 1.43
1.97 2.01 2.01 1.98 2.00 1.95 2.01
Q1'07 Q2'07 Q3'07 Q4'07 Q1'08 Q2'08 Q3'08
Loans Deposits (product spread) Commercial Spread Undiluted spread
Note: Commercial spreads have been restated to include Wealth Management and Corporate Banking. Previously, only Retail Banking spreads were disclosed. Trends remain largely consistent.

23
Costs impacted by investment in growth businesses
Results: Costs
§ operating expenses were ahead, impacted by investment in growth businesses such as Corporate Banking and Private Banking which are contributing to good income growth.
FTE
16,855 16,827 16,489 16,272 16,264
324334 333 337
343
Q3'07 Q4'07 Q1'08 Q2'08 Q3'08
£m 9M '08 9M '07
General and administrative expenses
Depreciation andamortisation
Operating expenses 1,014 978 3.6%
Var.% 08/07
95 51
918 927 (1.0%)
87.2%

24
Cost:Income ratio (1), %
50.1%
46.0%
Q3'07 ytd Q3'08 ytd
4.1p.p
(1) Includes depreciation & amortisation
Cost:income ratio now better than the average of the sector, andaccelerating Abbey’s progress to becoming best in class
Results: Ratios
Operating Jaws, %
100 100 101103
109113
10098 98
101 101 102104
118
Q1'07 Q2'07 Q3'07 Q4'07 Q1'08 Q2'08 Q3'08
Income
Costs
14

25
974
1,189
Q3'07 ytd Q3'08 ytd
422
392374
334330
Q3'07 Q4'07 Q1'08 Q2'08 Q3'08
£m
Improvement in net operating income reflecting strong revenue growth
Results: Net Operating Income
22%

26
Increase in secured provisions to strengthen coverage
Results: Provisions and credit quality
The total coverage ratio has reduced largely due to the change in mix of arrears, with increase in secured arrears with lower coverage due to security held. Secured coverage is more than double the industry benchmark and unsecured coverage, of over 100%, is also well above peer group. The NPL ratio has increased in part due to reduction in unsecured asset and in part due to modest increase in secured arrears.
Net loan loss provisions £m Coverage ratio and NPL,%
88
5861
5054
Q3'07 Q4'07 Q1'08 Q2'08 Q3'08
19
28
0.58
0.76
Q3'07 Q3'08
Secured Coverage Total NPL
Total coverage74% 57%

27
Average new business mortgage LTV (%) Average indexed mortgage LTV on stock (%)
63% 66% 66% 67%62%
Q3'07 Q4'07 Q1'08 Q2'08 Q3'08
44% 46% 48% 50% 50%
Q3'07 Q4'07 Q1'08 Q2'08 Q3'08
Results: Provisions and credit quality
Underlying credit quality has remained strong, with negligible third quarter lending at LTV greater than 90%
New business application and approval LTV has reduced further in the 3rd quarter and will flow through to completions in the 4th quarter.
65% 66% 67% 63% 59%
Approvals

28
Net Income up 20.2%
Results: Net Income
£m
252250
235
209207
Q3'07 Q4'07 Q1'08 Q2'08 Q3'08
£m 9M '08 9M '07
Provisions for income tax (250) (207) 20.6%
Net Income 737 613 20.2%
Var.% 08/07
987 820 20.3%PBT
29Business summary
Positioned for sustainable growth
Well positioned in
current market
Moving towards a fully
fledged commercial
bank
§ resilient retail balance sheet performance - Abbey’s retail funding mix (c. 60% customer deposit based, less than 10% of retail and corporate assets are funded by short term wholesale funds)
§ innovative savings and investment products in fiercely competitive market – significantly increasing sales capacity
§ mortgage lending focused on longer term, lower LTV business at significantly higher margins
§ Abbey remains well capitalised and has capital resources well in excess of current regulatory requirements. Abbey's position was further strengthened in October with the injection of £1bn of capital from Santander. The injection fulfills Santander's commitment made on the announcement of the A&L acquisition earlier in the year, as well as Santander’s commitment to support the UK government’s banking support scheme
§ Abbey on track for another year of strong results in difficult market conditions
§ prudent lending and reduction in exposure to unsecured personal loans
§ performance underpinned by a strong results across all four business divisions
§ strategic projects in-place to develop opportunities in Private Banking, Corporate Banking and Santander Global Banking and Markets
Transaction update
§ the B&B transaction completed on 29th September, adding an additional 338 Branches/Agencies to the franchise, strengthening Abbey’s funding position and significantly increasing retail customer deposit relationships
§ B&B’s c. £20bn of customer deposits mitigates A&L’s deposit/loan gap identified at the announcement of the A&L acquisition
§ the A&L transaction completed on 10th October and will bring Santander’s plans in the UK forward by two to three years in the SME/Corporate Banking segment
30
APPENDIX
n Financial results
n Balance sheet
n A&L transaction
n B&B transaction

31
Financial Results

32Financial results: Profit and loss
(*).- Dividends included
£ million Variation
9M 08 9M 07 Amount %
Net interest income* 1,388 1,181 207 17.5
Income from companies accounted for by the equity method 0 0 (0) (30.0)
Net fees 532 514 18 3.4
Insurance activity — 0 (0) (100.0)
Commercial revenue 1,920 1,696 224 13.2
Gains (losses) on financial transactions 255 227 27 12.0
Gross operating income 2,175 1,923 252 13.1
Income from non-financial services (net) and other operating income 28 29 (1) (3.2)
Operating expenses (1,014) (978) (35) 3.6
General administrative expenses (918) (927) 9 (1.0)
Personnel (560) (529) (31) 5.8
Other administrative expenses (358) (398) 40 (10.0)
Depreciation and amortisation (95) (51) (44) 87.2
Net operating income 1,189 974 215 22.1
Net loan loss provisions (206) (163) (43) 26.5
Other income 4 10 (5) (55.0)
Profit before taxes 987 820 167 20.3
Tax on profit (250) (207) (43) 20.6
Net profit from ordinary activity 737 613 124 20.2
Net profit from discontinued operations — — — —
Net consolidated profit 737 613 124 20.2
Minority interests — — — —
Attributable profit to the Group 737 613 124 20.2

33Financial results: Profit and loss
(*).- Dividends included
£ millionQ1 07 Q2 07 Q3 07 Q4 07 Q1 08 Q2 08 Q3 08
Net interest income* 383 394 404 416 441 452 495
Income from companies accounted for by the equity method 0 0 0 1 0 0 0
Net fees 169 177 169 175 180 173 180
Insurance activity 0 0 (0) 0 — — —
Commercial revenue 552 571 573 592 621 625 674
Gains (losses) on financial transactions 88 68 72 70 78 95 82
Gross operating income 640 639 644 662 698 720 756
Income from non-financial services (net) and other operating income 9 10 10 6 9 9 10
Operating expenses (330) (324) (324) (334) (333) (337) (343)
General administrative expenses (313) (307) (307) (315) (314) (300) (304)
Personnel (175) (175) (179) (180) (180) (187) (193)
Other administrative expenses (138) (131) (129) (135) (134) (113) (111)
Depreciation and amortisation (17) (17) (17) (19) (19) (37) (39)
Net operating income 319 325 330 334 374 392 422
Net loan loss provisions (55) (54) (54) (50) (61) (58) (88)
Other income 3 3 3 5 2 (1) 4
Profit before taxes 268 274 278 289 316 333 339
Tax on profit (67) (69) (71) (80) (80) (83) (87)
Net profit from ordinary activity 201 205 207 209 235 250 252
Net profit from discontinued operations — — — — — — —
Net consolidated profit 201 205 207 209 235 250 252
Minority interests — — — — — — —
Attributable profit to the Group 201 205 207 209 235 250 252

34
Balance Sheet

35Financial Results: Balance Sheet
£ million Variation
30.09.08 30.09.07 Amount %
Loans and credits* 137,159 131,522 5,636 4.3
Trading portfolio (w/o loans) 24,983 42,723 (17,740) (41.5)
Available-for-sale financial assets 1,030 34 996 —
Due from credit institutions* 13,464 14,133 (669) (4.7)
Intangible assets and property and equipment 3,418 3,410 8 0.2
Other assets 27,362 6,303 21,059 334.1Total assets/liabilities & shareholders' equity 207,416 198,125 9,291 4.7
Customer deposits* 101,535 86,423 15,112 17.5
Marketable debt securities* 48,394 54,683 (6,289) (11.5)
Subordinated debt 5,847 5,571 277 5.0
Insurance liabilities 3 8 (5) (63.4)
Due to credit institutions* 31,665 30,685 980 3.2
Other liabilities 16,660 18,112 (1,452) (8.0)
Shareholders' equity 3,312 2,644 669 25.3
Off-balance-sheet funds 6,750 7,611 (861) (11.3)
Mutual funds 6,750 7,611 (861) (11.3)
Pension funds — — — —
Managed portfolios — — — —
Savings-insurance policies — — — —Customer funds under management 162,526 154,288 8,238 5.3

36
A&L Transaction

14 July 2008
Recommended Offer forAlliance & Leicester
38
Disclaimer
This document does not constitute an offer to sell, or an invitation to subscribe for or purchase, any securities or the solicitation of any approval in any jurisdiction, nor shall there be any sale, issuance or transfer of the securities referred to in this Investor Presentation in any jurisdiction in contravention of applicable law. This document is not an offer of securities for sale in the United States. No securities will be offered or sold in the United States absent registration or an exemption from registration.
This Investor Presentation does not constitute a prospectus or prospectus equivalent document.
This Investor Presentation contains forward-looking statements within the meaning of the US Private Securities Litigation Reform Act of 1995. Forward looking statements may be identified by words such as “expects”, “anticipates”, “intends”, “plans”, “believes”, “seeks”, “estimates”, “will” or words of similar meaning and include, but are not limited to, statements about the expected future business and financial performance of Santander resulting from and following the implementation of the Scheme. These statements are based on management's current expectations and are inherently subject to uncertainties and changes in circumstance. Among the factors that could cause actual results to differ materially from those described in the forward looking statements are factors relating to satisfaction of the Conditions, Santander's ability to successfully combine the businesses of Santander and Alliance & Leicester and to realise expected synergies from the Acquisition, and changes in global, political, economic, business, competitive, market and regulatory forces, as well as those factors described under the headings 'Risk Factors' and 'Operating and Financial Review and Prospects' in Santander's annual report on Form 20-F for the year ended December 31, 2007, as filed with the US Securities and Exchange Commission. Neither Santander nor Alliance & Leicester undertakes any obligations to update the forward-looking statements to reflect actual results, or any change in events, conditions, assumptions or other factors.
This presentation is not intended for distribution to, or use by any person or entity in any jurisdiction or country where such distribution or use would be contrary to local law or regulation.
The distribution of the information or material on this site may be restricted by local law or regulation. This Investor Presentation may only be accessed in or from the United Kingdom by persons falling within the definition of Investment Professionals (contained in Article 19(5) of the Financial Services and Markets Act 2000 (Financial Promotion) Order 2005 (the “Order”)) or within Article 49 of the Order, or other persons to whom it may lawfully be communicated in accordance with the Order.
No statement in this Investor Presentation is intended to constitute a profit forecast for any period, nor should any statements be interpreted to mean that earnings or earnings per share will necessarily be greater or lesser than those for the relevant preceding financial periods for either Santander or Alliance & Leicester as appropriate.

39
Description of the deal
Strategic rationale
Financial impact
Summary

40
n 1 Santander share for every 3 A&L shares(1)
n The value of 299 pence per A&L share plus an 18 pence per share interim dividend
n 36.4% premium to closing price on 11 July 2008
n 9.3% premium based on average share prices over 4 weeks prior to11 July 2008
n Significant premium to peer group based on P/E multiples
A full and fair offer
(1) Based on approximately 421m A&L shares outstanding, approximately 140m Santander shares will be issued
Recommended by A&L’s board

41
Additional information
n Structured as Scheme of Arrangement
n Subject to
n Santander EGM to approve share issuance
n A&L shareholder approval and UK court sanction
n Regulatory and anti-trust approvals
n The Board of A&L will declare an interim dividend of 18 pence per share prior to completion
n A&L shareholders will receive Santander dividends following completion of the transaction

42
Description of the deal
Strategic rationale
Financial impact
Summary

43Strong strategic rationale for A&L shareholders to accept the offer
n Santander believes that A&L’s business is affected by current market conditions and cannot take full advantage of growth opportunities
n Write-downs of treasury assets impacting regulatory capital position
n Treasury portfolio is relatively large and balance sheet is reliant on wholesale funding
n Santander considers there is a risk of franchise deterioration for A&L as a standalone business in a higher risk environment

44Abbey has performed well with Santander’s business model
(50%)
(40%)
(30%)
(20%)
(10%)
0%
10%
20%
30%
Grossoperating
income
Netoperating
income
Attributableprofit
Abbey
A&L
Cost/Income ratio
45%
50%
55%
60%
FY 2006 FY 2007
Abbey A&L
FY 2007 vs. FY 2006

45
Strong strategic rationale for Santander
Increased critical mass in the UK market (as part of our “Vertical Strategy”)
In-market synergies (migration to Partenon, integration of back office functions)
Good geographic fit - better market reach
Acceleration of Abbey’s planned expansion in SME / commercial market by 2-3 years
1
2
3
4

46Increased critical mass in the UK market (as part of our “Vertical Strategy”)1
3.4%
4.3%
2.1%
2.0%5.6%
6.0%
2.9%
9.9%
0% 2% 4% 6% 8% 10% 12% 14%
Mortgage Balances
Unsecured PersonalLoan Balances
Savings Balances
Branches
Abbey
A&L
7.6%
8.1%
7.2%
13.3%
Market Share
Notes: § Data as at September 2008§ Market share is based on Abbey’s estimate of market size

47
0.67%
0.95%
0.0%
0.3%
0.5%
0.8%
1.0%
A&L Abbey
Total expenses /totalcustomer balances
We believe A&L’s efficiency can be improved through best practices
Adjusting for differences in business mix, we believe there is a £30-50m opportunity on a standalone basis, before integration cost synergies are
taken into account
Benchmarking: operating expenses (2008)
2
(1) Including depreciation and amortisation(2) Total customer balances are defined as total mortgage, unsecured personal loan, corporate loan and customer deposit balances at 31 December 2007
(1)
(2)

48
2
Implementation of Partenon reaching final stages
In-market synergies: migration to Partenon, integration of back office functions
… we are now ready to integrate A&L with low execution risk

49
£180m
£30m
£15m£10m
£35m
£25m
£65m
0
50
100
150
200
Efficiency best
practices
IT initiatives
Operations Central andsupport
rationalisation
Property synergies
Other e.g.purchasing
Total
These initiatives will allow Santander to capture approximately £180 million in pre-tax cost synergies
£ million
2
n Top-down analysis conducted by Santander based on experience of prior transactions (including the acquisition of Abbey)
n £70m of synergies expected by end of 2009, £140m by end of 2010 and approximately £180m by end of 2011
n Estimated cost synergies represent 23% of A&L’s 2007 cost base

50
Good geographic fit - better market reach
n Abbey network strengthened by the addition of 254 A&L branches, particularly in Central England, the South Coast and Northern Ireland
n A&L branch network fits extremely well with Abbey’s existing plans to open 300 new branches, accelerating planned build-out by several years
3
Abbey branchnetwork
1
0
0
1 112
12
1 1
1
12
1 1
0
11
1
A&L branchnetwork
Total branches254
Note: Maps show 699 out of total 705 Abbey branches and 246 of total 254 A&L branches
10
105
3
4
5
2
24
29
3
4
5
4
41
31
5 415
337
3
9
4
90
5
6
8
12 7615216
15 12
3
16613 5
15
76
8
9912
6
8
6 5
53 4
4 10
85 7
2 4
472
52
72
6
42
10
3 43
5
117
625
612
8
8
2
3
13
5
3
310
21
16
3
1
3
2
1
3
4
2
4
1
1
53
5
2153
6 4
Total branches705
2
52
6
2
3
0
22
06
1
2
1
3
11
20
4 26
214
1
2
1
30
634
3
2
1 2
21 1
0 2
52 1
2 2
3620
72
5 1
2
41
1
0 21
0
12
2
222
2
1
1
0
0
1
3
1
14
14
3
2
1
2
2
1
2
2
2
0
1
1
21
1
0002
1 0

51
Acceleration of Abbey's planned expansion in SME / commercial market by 2-3 years
120,00092,400
212,400
Abbey A&L Combined
A&L's business centre network
77%
Business banking franchise
4
2.9
8.4
11.3
Abbey A&L Combined
290%
Active Customers
Commercial Loan Balances (£bn)

52
Measures will be taken to manage potential risks
Credit and liquidity
n Increasing Santander’s exposure to the UK…
n … at a time where asset quality across the market may be softening
n Relatively large liquidity gap and exposure to short-term funding in A&L as a standalone business
1. Increase A&L regulatory capital ratios to higher levels
2. Incremental provisions factored into our P&L projections
3. Increase coverage ratios to Abbey’s standards
4. Projected assets of combined A&L and Abbey reduced by approximately £20-30bn over two years (deleveraging impact factored into our P&L projections)
Risks Mitigants

53
Description of the deal
Strategic rationale
Financial impact
Summary

54
In current market conditions, Santander’s conservative approach would imply that an additional £1bn of capital is required
§ Santander will allocate £1 billion of capital against balance sheet strengthening and integration costs
§ Protection against future adverse development of treasury portfolio
§ Previous mark-to-market losses on AFS portfolio have not been deducted from regulatory capital to date
§ Anticipated increased credit impairments through the cycle
§ Improvement of coverage ratios and other balance sheet strengthening
§ Restructuring charges associated with integration

55
Funding gap in A&L will be addressed
§ Significant funding gap in A&L's balance sheet currently due to size of treasury and loan portfolios versus retail deposits
§ Has created challenges for A&L in less benign market conditions
§ Santander intends to close the funding gap by reducing the projected total assets of the combined A&L and Abbey by approximately £20-30 billion over two years

56Santander’s estimate of potential adjustments to profits under its prudent approach in current environment
Net Profit
Net profit incl. synergies andother adjustments
Adjust for: higher provisionsIncrease provisioning by 17 bps by 2010 over
average of analyst estimates of 44bps
Adjust for: cost of de-leveragingProjected assets of combined A&L and Abbey
reduced by approx. £20-30bn over 2 years
Adjust for: lower “extraordinary” cost of funding
Lower funding costs (due to reduced funding gap, stronger balance sheet)
Adjust for: synergies Estimate of £180m (pre-tax)
Adjust for: reduced incremental costs at Abbey
Mainly expansion into SME market (£35m benefit pre-tax)
Adjust for: net yield from additional capital £1bn invested in risk-free instruments

57
Financial impact: the deal meets our financial criteria
The banking sector’s cost of equity has clearly gone up over the past 12 months - higher ROIs are expected
(1) Resulting core Tier 1 based on pro forma core tier 1 as of 1Q08 (initial impact, not assuming deleveraging). Assuming A&L 2007 year end core Tier 1 capital net of goodwill of £1,666m (Basel 2) adjusted for £346m AFS reserves as at 30 April 2008, £189m reduction in fair value and impairment losses (pre-tax) in four months to 30 April 2008, £24,082m of risk-weighted assets and assuming a tax rate of 28%. If the full amount of additional capital (£1 billion) were assumed to affect Santander’s core capital, the impact would be 19bps
(2) Adjusted for items listed on slide 20(3) This statement as to financial accretion is not intended to mean that Santander's future earnings per share will necessarily exceed or match those of any prior year
§ Accretion in Santander's earnings per share including synergies (before restructuring costs) expected from 2009(3)
§ These figures are not based on A&L estimates and have not been approved by A&L
1 Santander share for every 3 A&L shares
Price proposed per share 299p
Total equity valuation £1.26bn
Plus: additional capital £1.00bn
Total cost £2.26bn
Core Tier 1 impact(1) (7)bps2009 2010 2011
Net attributable profit inc. synergies and other adjustments(2) £309m £372m £419m
Return on investment 14% 16% 19%

58
Description of the deal
Strategic rationale
Financial impact
Summary

59
§ Credit / risk concentration
§ Liquidity risk
However, we are aware of the risks involved
The acquisition of A&L makes sense from an “industrial” point of view…
We are taking clear measures to address these risks
Summary
§ Higher economies of scale / commercial reach
§ In-market synergies (IT migration, integration of back offices)
§ Recapitalisation
§ Higher provisions factored into our projections
§ £1bn additional capital
§ The funding gap will be closed over the next 2 years
§ Return on investment of 19% in 2011
§ Earnings accretion from 2009(1)
… and meets Santander’s financial criteria
(1) This statement as to financial accretion is not intended to mean that Santander's future earnings per share will necessarily exceed or match those of any prior year

60
B&B Transaction

29 September 2008
Abbey / Bradford & Bingley
62
Disclaimer
This document does not constitute an offer to sell, or an invitation to subscribe for or purchase, any securities or the solicitation of any approval in any jurisdiction, nor shall there be any sale, issuance or Transfer of the securities referred to in this Investor Presentation in any jurisdiction in contravention of applicable law. This document is not an offer of securities for sale in the United States. No securities will be offered or sold in the United States absent registration or an exemption from registration.
This Investor Presentation does not constitute a prospectus or prospectus equivalent document.
This Investor Presentation contains forward-looking statements within the meaning of the US Private Securities Litigation Reform Act of 1995. Forward looking statements may be identified by words such as “expects”, “anticipates”, “intends”, “plans”, “believes”, “seeks”, “estimates”, “will” or words of similar meaning and include, but are not limited to, statements about the expected future business and financial performance of Santander resulting from and following the implementation of the Scheme. These statements are based on management's current expectations and are inherently subject to uncertainties and changes in circumstance. Among the factors that could cause actual results to differ materially from those described in the forward looking statements are factors relating to satisfaction of the Conditions, Santander's ability to successfully combine the businesses of Santander and Bradford & Bingley and to realise expected synergies from the Transfer, and changes in global, political, economic, business, competitive, market and regulatory forces, as well as those factors described under the headings 'Risk Factors' and 'Operating and Financial Review and Prospects' in Santander's annual report on Form 20-F for the year ended December 31, 2007, as filed with the US Securities and Exchange Commission. Neither Santander nor Bradford & Bingley undertakes any obligations to update the forward-looking statements to reflect actual results, or any change in events, conditions, assumptions or other factors.
This presentation is not intended for distribution to, or use by any person or entity in any jurisdiction or country where such distribution or use would be contrary to local law or regulation.
The distribution of the information or material on this site may be restricted by local law or regulation. This Investor Presentation may only be accessed in or from the United Kingdom by persons falling within the definition of Investment Professionals (contained in Article 19(5) of the Financial Services and Markets Act 2000 (Financial Promotion) Order 2005 (the “Order”)) or within Article 49 of the Order, or other persons to whom it may lawfully be communicated in accordance with the Order.
No statement in this Investor Presentation is intended to constitute a profit forecast for any period, nor should any statements be interpreted to mean that earnings or earnings per share will necessarily be greater or lesser than those for the relevant preceding financial periods for either Santander or Bradford & Bingley as appropriate.
Nothing contained in this presentation is intended to constitute an invitation or inducement to engage in investment activity for the purposes of the prohibitionon financial promotion in the U.K. Financial Services and Markets Act 2000

63
Description of the deal
Strategic rationale
Financial impact
Summary

64
n HM Treasury to take Bradford & Bingley plc (B&B) into public ownership
n the following components of B&B will transfer to Abbey:
n £20 billion retail deposit base with 2.7 million customers
n direct channels including 197 retail branches, 141 agencies (distribution outlets in 3rd party premises) telephone distribution, internet and related employees
n £200m of capital from Isle of Man operations
n no credit risk transfer is involved
n no head office infrastructure transfer is involved: the HMT will charge for certain support costs relating to B&B deposits and direct channels
Acquisition of B&B’s retail deposit base and direct channels from UK HM Treasury
Santander pays £0.6bn (of which £0.2bn is capital) - no risk taking involved
65
Description of the deal
Strategic rationale
Financial impact
Summary

66Transaction strengthens Abbey’s Retail funding franchise and accelerates progress to becoming the best commercial bank in the UK
Critical mass in UK
Potential for efficiency
improvement
Low riskn All customer loans inc. buy-to-let / self cert mortgages retained by UK
HMT
n All wholesale assets retained by UK HMT
n Cross sales of other retail products (banking, investments, credit cards, insurance)
n Sales productivity improvements
n Integration of back-office functions, leveraging Partenon to deliver synergies
n Combination of A&L and B&B moves Abbey’s estimated share of the PFS market from c. 6% to c. 10% including deposit share
n Expansion of branch network with complementary fit
n £20bn of customer deposits, further improving Abbey’s strong deposit franchise and funding profile
n B&B deposit base is well established with over 61% of customers having been with B&B for over 10 years
n 94% of customers have balances below £35,000
Balance sheet
strength
1
2
3
4

67Increased critical mass in core UK PFS markets
3.4%
2.1% 2.0%
1.9%
9.9%
2.9%6.0% 5.6%
4.3%
2.7%
10.0%
13.3%
7.2%
10.3%
Mortgages UPL Retail deposits Branches
Abbey A&L B&B
Notes: § Data as at September 2008§ Market share is based on Abbey’s estimate of market size consistently applied for all entities
Santander vertical strategy: Increasing our share of core markets
§ Santander’s network will be strengthened by the addition of B&B’s 197 branches / 141 agencies
Abbey average share across markets c. 6% Combined average share across markets c.10%
1

68B&B’s network concentration in the North / Midlands complements Abbey’s geographic spread
1
5% 2% 1%Scotland
6% 2%1%North West
6% 4%N. Ireland
4.0% 2.0%2.0%West
Midlands
5% 2% 1%Wales
4% 2% 2%South West
5% 2%2%SouthEast
5% 3%2%Yorkshire
2% 2%4%East
Midlands
3% 3% 1%East
Anglia
10% 1% 1%London
Abbey Alliance & Leicester Bradford & Bingley
8%
9%
10%
8%
8%
8%
7%
10%
8%
7%
12%
9%
Combined
4% 1% 2%NorthEast

69
PFS Cost to Income ratio – Historical Trends
Santander has a proven track record in reducing costs - Abbeyis now reaching a competitive advantage in terms of efficiency
70.0%
60.6%
55.0%
49.7%
46.7%
55.0%
48.8% 49.4% 48.3% 49.3%
2004 2005 2006 2007 H1 2008
Abbey Sector
-15.0p.p
Gap vs. Sector
-11.8p.p -5.6p.p -1.4p.p +2.6p.p
PFS sector average based on internal segmental analysis of the results of Lloyds TSB, HBOS, Barclays, Royal Bank of Scotland and Bradford & Bingley
2

70Scope for revenue synergies
Fee income per branch
B&B base B&B post-synergies
Abbey
§ Cross-sale opportunity to
2.7m customers
§ In addition, some scope for
margin management of the
deposit base through time
2
x3
x5
x1
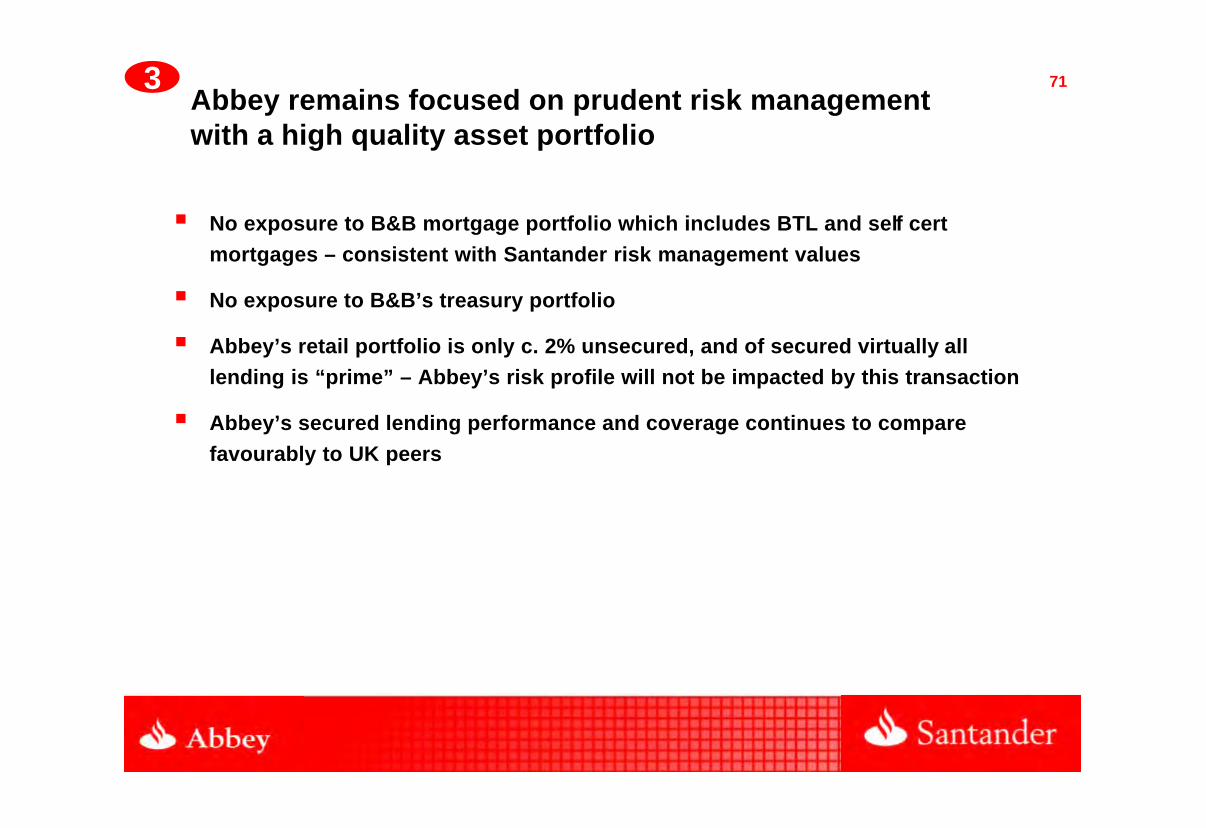
71Abbey remains focused on prudent risk management with a high quality asset portfolio
§ No exposure to B&B mortgage portfolio which includes BTL and self cert mortgages – consistent with Santander risk management values
§ No exposure to B&B’s treasury portfolio
§ Abbey’s retail portfolio is only c. 2% unsecured, and of secured virtually all lending is “prime” – Abbey’s risk profile will not be impacted by this transaction
§ Abbey’s secured lending performance and coverage continues to compare favourably to UK peers
3
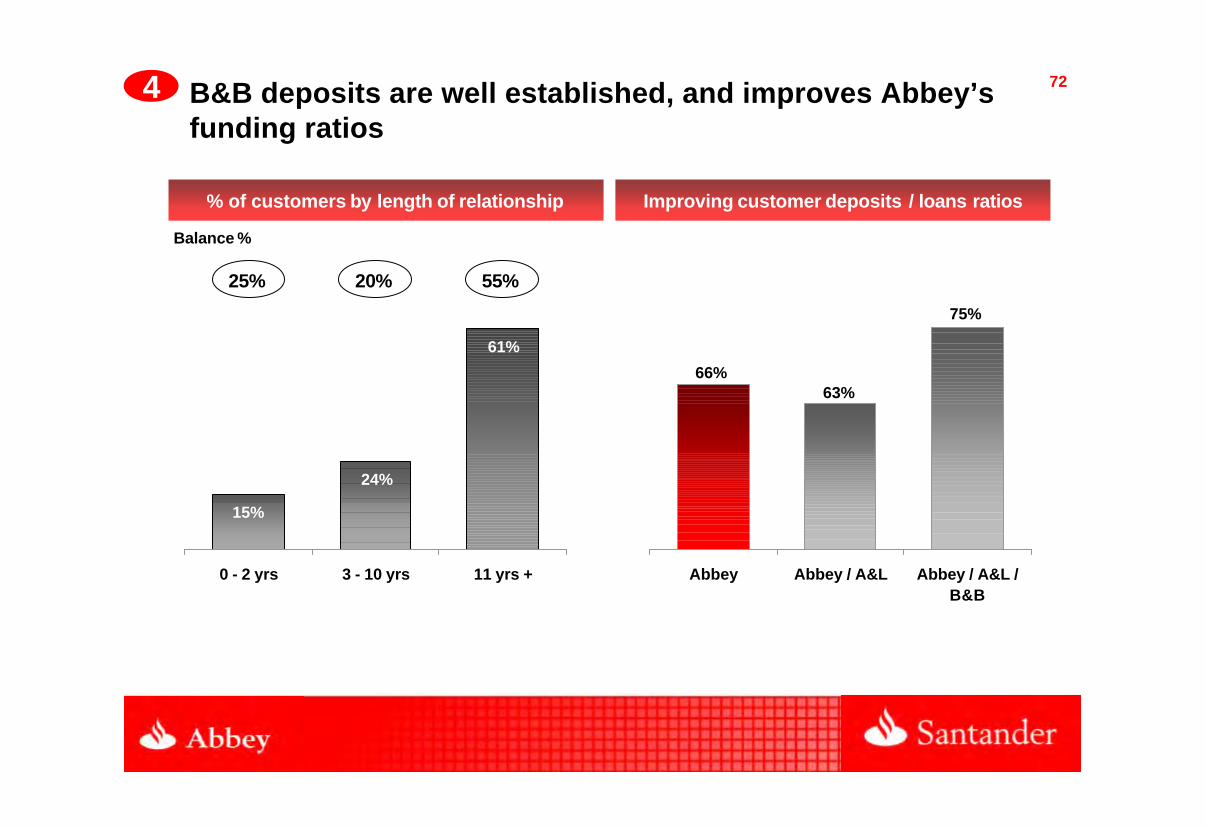
72
61%
24%
15%
0 - 2 yrs 3 - 10 yrs 11 yrs +
% of customers by length of relationship
66%63%
75%
Abbey Abbey / A&L Abbey / A&L /B&B
B&B deposits are well established, and improves Abbey’s funding ratios
Balance %
25% 20% 55%
Improving customer deposits / loans ratios
4

73
1.9%
…and establishes Abbey as one of the largest retail deposit takers in the UK
PFS deposits – UK sector (£bn)
Source: Company reports as at June 2008 (market share based on September 2008 figures where available), Nationwide per 2008 annual report & accounts, market shares calculated by Abbey using consistent base
20 2471 88 113 116 124
160
86
B&B A&L Abbey Barclays Nationwide Combined RBS
2.1% 6.0% 7.5% 20.9%10.0%9.8% 10.6%
Market share:
Santander moves to 3rd largest retail
deposit taker
4
LTSB
HBOS
(B&B / A&L adds c. 4%)

74
Description of the deal
Strategic rationale
Financial impact
Summary

75
Financial impact: the deal meets our financial criteria
Net Profit Assumptions
Net profit incl. synergies andother adjustments
Modest liability attrition offset by margin management
Impact of negative margin, fixed-term maturities in the short-term
Reduced wholesale funding cost Removal of significant LIBOR premium
Adjust for: cost synergies c. 25% of costs relating to savings / direct channels
Adjust for: revenue synergies Sales productivity and broader product range (bank accounts, credit cards, investments)

76
Financial impact: the deal meets our financial criteria
Given the low risk nature of the acquisition and funding benefits, the ROI offers excellent value to Santander
(1) This statement as to financial accretion is not intended to mean that Santander's future earnings per share will necessarily exceed or match those of any prior year
§ Accretion in Santander's earnings per share including synergies expected from 2009(1)
§ These figures are based on internal estimates, and before restructuring charges
£bn
Purchase price (excl. capital £0.2bn)0.4
2009 2010 2011
Net attributable profit inc. synergies and other adjustments 40 60 80
Return on investment (based on £0.4bn above) 10% 15% 20%

77
§ Investment of c.£0.4bn for B&B’s direct channels and c.£20bn of deposits
(2% of the UK Market)
§ £200m paid for Isle of Man capital
§ Profits of £ 40, 60 and 80 mn in the first 3 years assuming no credit taking
activities
§ The deal is expected to be EPS enhancing: +0.3% in 2009; +0.4% in 2010;
+ 0.6% in 2011
§ ROI of 20% year 3 (based on £0.4bn purchase price)
§ Loan / deposit ratio of 75% with B&B deposit base
Summary financials

78
Description of the deal
Strategic rationale
Financial impact
Summary

79Summary
…enhanced funding position, significantly increasing retail customer deposit relationships. This deal closes A&L’s loan / deposit gap…
…with no exposure to B&B’s mortgage / wholesale portfolios
…continuing to leverage core skills and efficient UK operating platform…
Accelerates growth strategy and distribution scale in the UK, combination of A&L and B&B adds 4% deposit market share…
ROI offers excellent value and is earnings accretive from 2009(1)
Transaction fits core Santander principles
Critical mass in UK
Potential for efficiency
improvement
Low risk
Balance sheet strength
1
2
3
4
(1) This statement as to financial accretion is not intended to mean that Santander's future earnings per share will necessarily exceed or match those of any prior year

Investor RelationsAbbeyHouseLevel 52 Triton SquareRegentsPlaceLondon NW1 3ANe-mail: ir@abbey. comwww.abbey.com
Bruce Rush Tel. +44 (0) 20 7756 4275Simon Donovan Tel. +44 (0) 20 7756 4476
Investor RelationsCiudad Grupo SantanderEdificio Pereda, 1st floorAvda de Cantabria, s/n 28660 Boadilla del Monte, Madrid (Spain)Tel.: +34 91 259 65 14 - +34 91 259 65 20Fax: +34 91 257 02 45e-mail: investor@gruposantander .com www.santander.com