Embed Size (px)
Citation preview

Monroe County Middle School 8th Grade Mathematics Pacing Guide 2012-2013
Craddock/Emmert Page 1
Unit Essential
Questions
I CAN Statements Vocabulary Standards Assessments Program
Review
1:
Expressions
Part A:
Powers and
Roots
(2-3 Weeks)
How can
algebraic
expressions
be used to
model,
analyze, and
solve
mathematical
situations?
I can use the properties of integer exponents to simplify expressions. (R) I can recognize taking a square root as the inverse of squaring a number. (K) I can use reasoning to determine between which two consecutive whole numbers a square root will fall. (S) I can recognize taking a cube root of a perfect square. (K) I can evaluate the cube root of a perfect cube. (S)
exponents
square
cube
radical
perfect square
perfect cube
square root
cube root
8.NS.2
8.EE.2
Powers and
Roots Unit Test
Extended
Response
Quizzes
Homework
In-class
Assignments
Exit Slips
Practical
Living/Career
Studies and
Writing
Extended
Response
2: The
Number
System:
Rational and
Irrational
Numbers
(2 Weeks)
In what ways
can rational
numbers be
useful?
I can classify a number as rational or irrational based on its decimal expansion. (K) I can convert a repeating decimal into a rational number. (K) I can plot the estimated value of an irrational number on a number line. (K) I can estimate the value of an irrational number by rounding to a specific place value. (K) I can use estimated values to compare two or more
rational
number
irrational
number
8.NS.1 Rational and
Irrational
Numbers Unit
Test
Extended
Response
Quizzes
Homework
In-class
Assignments
Exit Slips
Practical
Living/Career
Studies
Construction
Connection

Monroe County Middle School 8th Grade Mathematics Pacing Guide 2012-2013
Craddock/Emmert Page 2
irrational numbers. (S) I can justify that the square root of a non-perfect square will be irrational. (S)
3:
Expressions
Part B:
Laws of
Exponents
(2 Weeks)
How can
algebraic
expressions
be used to
model,
analyze, and
solve
mathematical
situations?
I can determine the properties of integer exponents by exploring patterns and applying my understanding of properties of whole number exponents. (R) I can use the properties of integer exponents to simplify expressions. (R)
integer
exponent
8.EE.1 Laws of
Exponents Unit
Test
Extended
Response
Quizzes
Homework
In-class
Assignments
Exit Slips
Arts and
Humanities
Creating a
Poem,
Drawing, or
Song
Assignment
4: Scientific
Notation
(2-3 Weeks;
End 1st Nine
Weeks)
How can
algebraic
expressions
be used to
model,
analyze, and
solve
mathematical
situations?
I can write an estimation of a large quantity by expressing it as the product of a single-digit number and a positive power of ten. (S) I can write an estimation of a very small quantity by expressing it as the product or a single-digit number and a negative power of ten. (S) I can compare quantities written as the product of a single digit number and a power of ten by stating their multiplicative relationship. (R) I can add and subtract two numbers written in scientific
power of ten
scientific
notation
8.EE.3
8.EE.4
Scientific
Notation Unit
Test
Extended
Response
Scientist Project
Quizzes
Homework
In-class
Assignments
Exit Slips
Practical
Living/Career
Studies
Scientist
Project
Monroe County Middle School 8th Grade Mathematics Pacing Guide 2012-2013
Craddock/Emmert Page 3
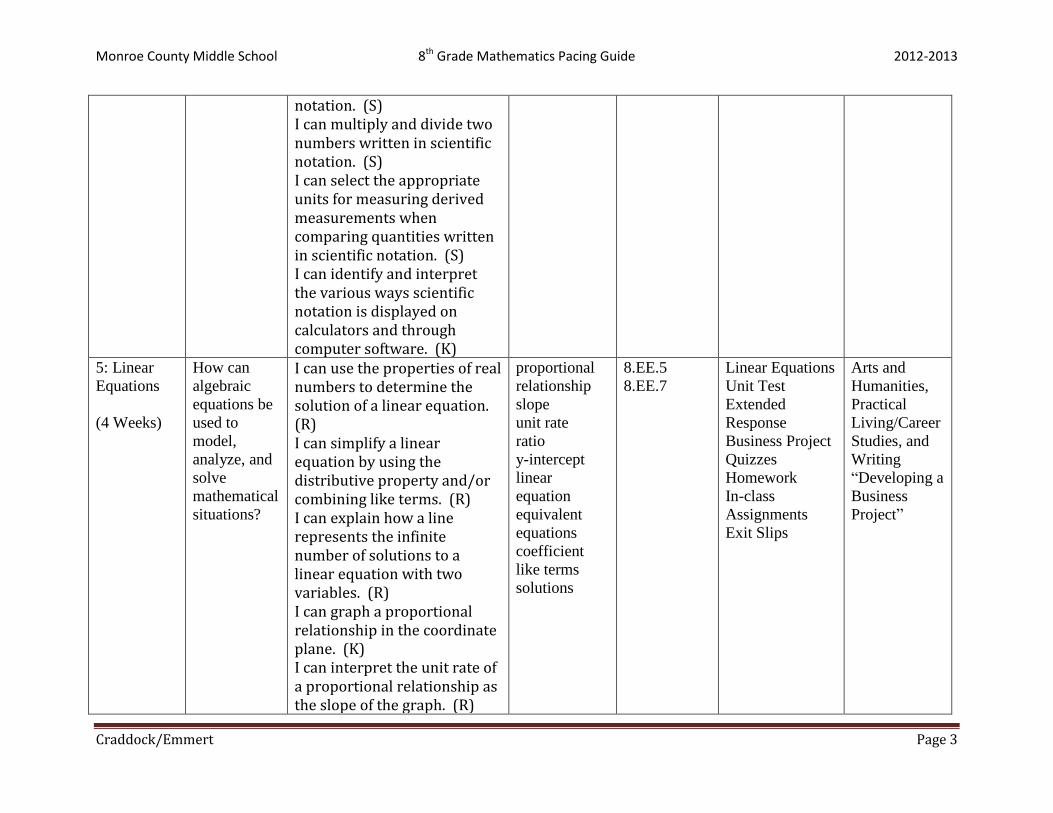
notation. (S) I can multiply and divide two numbers written in scientific notation. (S) I can select the appropriate units for measuring derived measurements when comparing quantities written in scientific notation. (S) I can identify and interpret the various ways scientific notation is displayed on calculators and through computer software. (K)
5: Linear
Equations
(4 Weeks)
How can
algebraic
equations be
used to
model,
analyze, and
solve
mathematical
situations?
I can use the properties of real numbers to determine the solution of a linear equation. (R) I can simplify a linear equation by using the distributive property and/or combining like terms. (R) I can explain how a line represents the infinite number of solutions to a linear equation with two variables. (R) I can graph a proportional relationship in the coordinate plane. (K) I can interpret the unit rate of a proportional relationship as the slope of the graph. (R)
proportional
relationship
slope
unit rate
ratio
y-intercept
linear
equation
equivalent
equations
coefficient
like terms
solutions
8.EE.5
8.EE.7
Linear Equations
Unit Test
Extended
Response
Business Project
Quizzes
Homework
In-class
Assignments
Exit Slips
Arts and
Humanities,
Practical
Living/Career
Studies, and
Writing
“Developing a
Business
Project”

Monroe County Middle School 8th Grade Mathematics Pacing Guide 2012-2013
Craddock/Emmert Page 4
I can justify that the graph of a proportional relationship will always intersect the origin (0,0) of the graph. (R) I can use a graph, a table, or an equation to make comparisons between various proportional relationships. (R) I can give examples of linear equations with one solution, infinitely many solutions, or no solution. (R) I can justify that an equation in the form y=mx will represent the graph of a proportional relationship with a slope of m and a y-intercept of 0. (R) I can justify that an equation in the form y=mx+b represents the graph of a linear relationship with a slope of m and a y-intercept of b. (R)
6: Systems
of Linear
Equations
(5 Weeks;
End 2nd
9
Weeks)
How can
algebraic
equations be
used to
model,
analyze, and
solve
mathematical
I can explain how the point(s) of intersection of two graphs will represent the solution to the system of two linear equations because that/those point(s) are solutions to both equations. (R) I can use algebraic reasoning
system of
linear
equations
intersection
8.EE.8 Systems of
Linear Equations
Unit Test
Extended
Response
Quizzes
Homework
In-class
Arts and
Humanities
and Practical
Living/Career
Studies
Business
Connection

Monroe County Middle School 8th Grade Mathematics Pacing Guide 2012-2013
Craddock/Emmert Page 5
situations? (simple substitution) and the properties of real numbers to solve a system of linear equations. (S) I can use the graphs of two linear equations to estimate the solution of the system. (S) I can use mathematical reasoning to estimate solve simple systems of linear equations. (S) I can solve real-world problems and mathematical problems dealing with systems of linear equations and interpret the solution in the context of the problem. (S)
Assignments
Exit Slips
7: Functions
(2-3 Weeks)
How are
functions
useful?
I can explain that a function represents a relationship between an input and an output where the output depends on the input; therefore, there can be only one output for each input. (R) I can show the relationship between the inputs and outputs of a function by graphing them as ordered pairs on a coordinate grid. (S) I can determine the properties if a function written in algebraic form. (S)
function
input
output
linear
function
rate of change
increasing
decreasing
linear
nonlinear
8.F.1
8.F.2
8.F.3
8.F.4
8.F.5
Functions Unit
Test
Extended
Response
Quizzes
Homework
In-class
Assignments
Exit Slips
Arts and
Humanities
Drawing
Connection
Monroe County Middle School 8th Grade Mathematics Pacing Guide 2012-2013
Craddock/Emmert Page 6
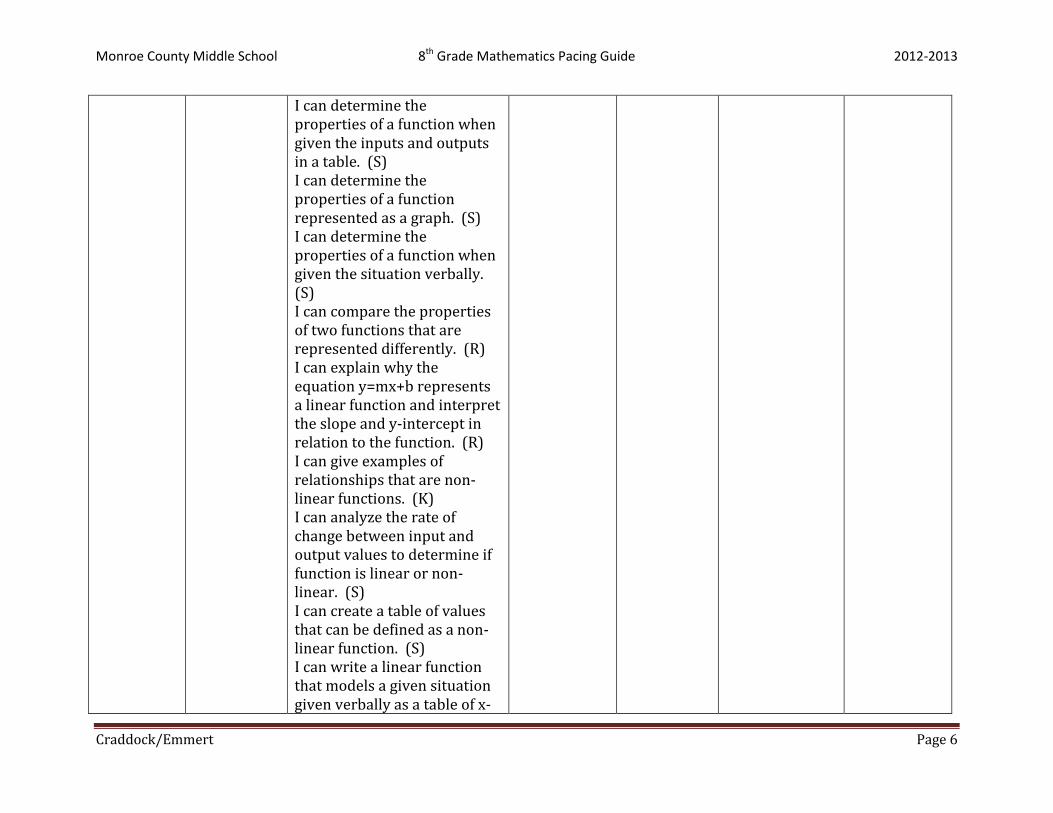
I can determine the properties of a function when given the inputs and outputs in a table. (S) I can determine the properties of a function represented as a graph. (S) I can determine the properties of a function when given the situation verbally. (S) I can compare the properties of two functions that are represented differently. (R) I can explain why the equation y=mx+b represents a linear function and interpret the slope and y-intercept in relation to the function. (R) I can give examples of relationships that are non-linear functions. (K) I can analyze the rate of change between input and output values to determine if function is linear or non-linear. (S) I can create a table of values that can be defined as a non-linear function. (S) I can write a linear function that models a given situation given verbally as a table of x-

Monroe County Middle School 8th Grade Mathematics Pacing Guide 2012-2013
Craddock/Emmert Page 7
and y- values as a graph. (S) I can define the initial value of the function in relation to the situation. (S) I can define the rate of change in relation to the situation. (S) I can define the y-intercept in relation to the situation. (S) I can explain any constraints on the domain in relation to the situation. (S) I can match the graph of a function to a given situation. (S) I can write a story that describes the functional relationship between two variables depicted on a graph. (P) I can create a graph of function that describes the relationship between two variables. (S)
8: Similarity
and
Congruence
(3-4 Weeks)
How does
geometry
better
describe
objects?
I can verify—by measuring and comparing lengths, angle measures, and parallelism of a figure and its image—that after a figure has been translated, corresponding lines and line segments remain the same length, corresponding angles have
transformatio
n
translation
reflection
rotation
parallel line
congruent
dilation
similar
8.EE.6
8.G.1
8.G.2
8.G.3
8.G.4
Similarity and
Congruence Unit
Test
Extended
Response
Quizzes
Homework
In-class
Assignments
Arts and
Humanities
Drawing
Connection

Monroe County Middle School 8th Grade Mathematics Pacing Guide 2012-2013
Craddock/Emmert Page 8
the same measure, and corresponding parallel lines remain parallel. (K) I can verify—by measuring and comparing lengths, angle measures, and parallelism of a figure and its image—that after a figure has been reflected, corresponding lines and line segments remain the same length, corresponding angles have the same measure, and corresponding parallel lines remain parallel. (K) I can verify—by measuring and comparing lengths, angle measures, and parallelism of a figure and its image—that after a figure has been rotated, corresponding lines and line segments remain the same length, corresponding angles have the same measure, and corresponding parallel lines remain parallel. (K) I can explain how transformations can be used to prove that two figures are congruent. (R) I can perform a series of transformations (reflections,
similar
triangles
Exit Slips

Monroe County Middle School 8th Grade Mathematics Pacing Guide 2012-2013
Craddock/Emmert Page 9
rotations, and/or translations) to prove or disprove that two given figures are congruent. (S) I can describe the changes occurring to the x- and y-coordinates of a figure after a translation. (R) I can describe the changes occurring to the x- and y-coordinates of a figure after a reflection. (R) I can describe the changes occurring to the x- and y-coordinates of a figure after a rotation. (R) I can describe the changes occurring to the x- and y-coordinates of a figure after a dilation. (R) I can explain how transformations can be used to prove that two figures are similar. (R) I can describe a sequence of transformations to prove or disprove that two given figures are similar. (S) I can apply proven relationships to establish minimal properties to justify similarity. (R)
9: Angles How does I can informally prove that the interior angles 8.G.5 Angles Unit Test Arts and

Monroe County Middle School 8th Grade Mathematics Pacing Guide 2012-2013
Craddock/Emmert Page 10
(1-2 Weeks;
End 3rd
Nine
Weeks)
geometry
better
describe
objects?
sum of any triangle’s interior angles will have the same measure as a straight angle. (R) I can informally prove that the sum of any polygon’s exterior angles will be 360-degrees. (R) I can make conjectures regarding the relationships and measurements of the angles created when two parallel lines are cut by a transversal. (R)
exterior
angles
parallel lines
transversal
Extended
Response
Foldable Project
Quizzes
Homework
In-class
Assignments
Exit Slips
Humanities
Drawing
Connection
10: The
Pythagorean
Theorem
(2-3 Weeks)
How does
geometry
better
describe
objects?
I can use visual models to demonstrate the relationship of the three side lengths of any right triangle. (R) I can create right triangles by drawing a horizontal line segment and a vertical line segment from any two points on a non-vertical line in the coordinate plane. (S) I can justify that these right triangles are similar by comparing the ratios of the lengths of the corresponding legs. (R) I can justify that since the triangles are similar, the ratios of all corresponding hypotenuses, representing the
right triangle
leg
hypotenuse
Pythagorean
Theorem
converse
8.G.6
8.G.7
8.G.8
The Pythagorean
Theorem Unit
Test
Extended
Response
Quizzes
Homework
In-class
Assignments
Exit Slips
Arts and
Humanities
Practical
Living/Career
Studies
Drawing and
Construction
Connection

Monroe County Middle School 8th Grade Mathematics Pacing Guide 2012-2013
Craddock/Emmert Page 11
slope of the line, will be equivalent. (R) I can use algebraic reasoning to relate the visual model to the Pythagorean Theorem. (R) I can use the Pythagorean Theorem to determine if a given triangle is a right triangle. (R) I can use the Pythagorean Theorem to find an unknown side length of a right triangle. (S) I can draw a diagram and use the Pythagorean Theorem to solve real-world problems involving right triangles. (S) I can draw a diagram to find right triangles in a three-dimensional figure and use the Pythagorean Theorem to calculate various dimensions. (S) I can connect any two points on a coordinate grid to a third point so that the three points form a right triangle. (K) I can use the right triangle and the Pythagorean Theorem to find the distance between the original two points. (S)
11: Volume How does I can describe the similarity cylinder 8.G.9 Volume Unit Arts and

Monroe County Middle School 8th Grade Mathematics Pacing Guide 2012-2013
Craddock/Emmert Page 12
(1-2 Weeks) geometry
better
describe
objects?
between finding the volume of a cylinder and the volume of a right prism. (R) I can recall the formula to find the volume of a cylinder. (K) I can informally prove the relationship between the volume of a cylinder and the volume of a cone with the same base. (R) I can recall the formula to find the volume of a cone. (K) I can informally prove the relationship between the volume of a sphere and the volume of a circumscribed cylinder. (R) I can recall the formula to find the volume of a sphere. (K) I can use the formulas to find the volume of cylinders, cones, and spheres. (S) I can solve real-world problems involving the volume of cylinders, cones, and spheres. (S)
cone
sphere
volume
Test
Extended
Response
Foldable Project
Quizzes
Homework
In-class
Assignments
Exit Slips
Humanities
Sculpture
Assignment;
Practical
Living/Career
Studies
Farming
Connection
12: Scatter-
plots
(2-3 Weeks;
Testing)
How does
probability
better
describe
objects?
I can plot ordered pairs on a coordinate grid representing the relationship between two data sets. (K) I can describe patterns in the plotted points such as clustering, outliers, positive
scatter plot
bi-variate
clustering
outliers
positive
association
negative
8.SP.1
8.SP.2
8.SP.3
8.SP.4
Scatter Plots
Unit Test
Extended
Response
Quizzes
Homework
In-class
Arts and
Humanities
Drawing
Connection;
Practical
Living/Career
Studies and
Monroe County Middle School 8th Grade Mathematics Pacing Guide 2012-2013
Craddock/Emmert Page 13
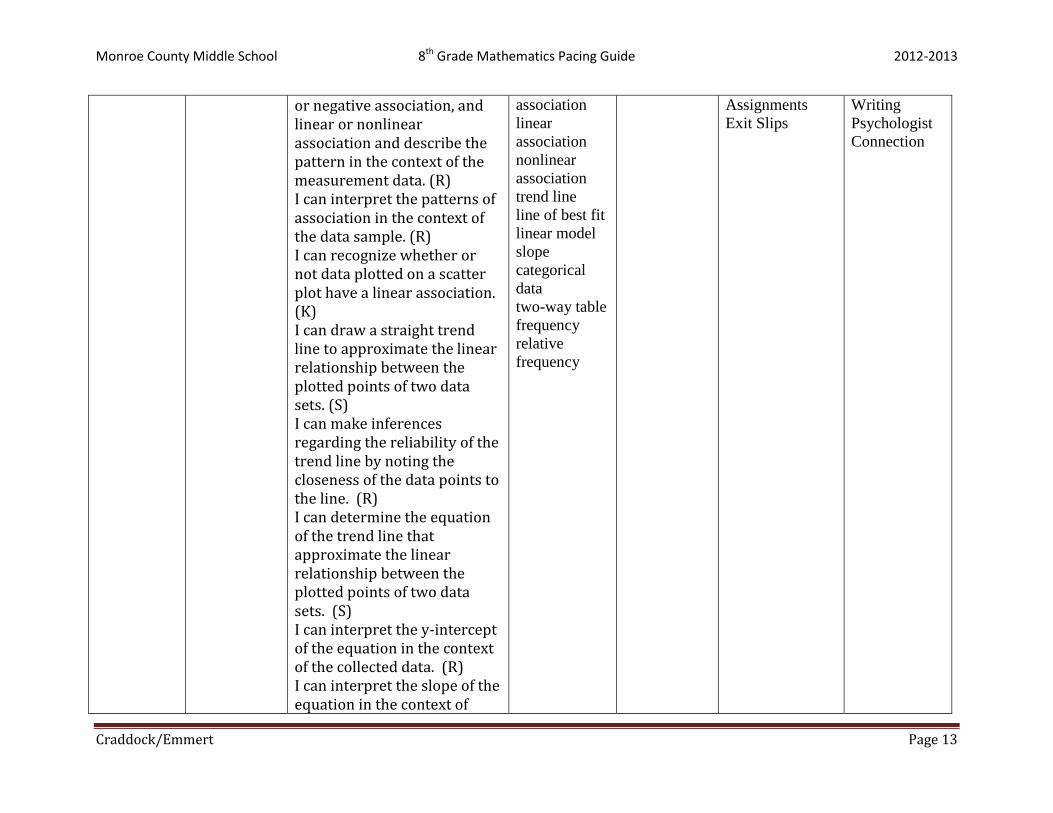
or negative association, and linear or nonlinear association and describe the pattern in the context of the measurement data. (R) I can interpret the patterns of association in the context of the data sample. (R) I can recognize whether or not data plotted on a scatter plot have a linear association. (K) I can draw a straight trend line to approximate the linear relationship between the plotted points of two data sets. (S) I can make inferences regarding the reliability of the trend line by noting the closeness of the data points to the line. (R) I can determine the equation of the trend line that approximate the linear relationship between the plotted points of two data sets. (S) I can interpret the y-intercept of the equation in the context of the collected data. (R) I can interpret the slope of the equation in the context of
association
linear
association
nonlinear
association
trend line
line of best fit
linear model
slope
categorical
data
two-way table
frequency
relative
frequency
Assignments
Exit Slips
Writing
Psychologist
Connection

Monroe County Middle School 8th Grade Mathematics Pacing Guide 2012-2013
Craddock/Emmert Page 14
collected data. (R) I can use the equation of the trend line to summarize the given data and make predictions regarding additional data points. (R) I can create a two-way table to record the frequencies of bi-variate categorical values. (K) I can determine the relative frequencies for rows and/or columns of a two-way table. (S) I can use the relative frequencies and context of the problem possible associations between the two sets of data. (R)