Embed Size (px)
Citation preview
1
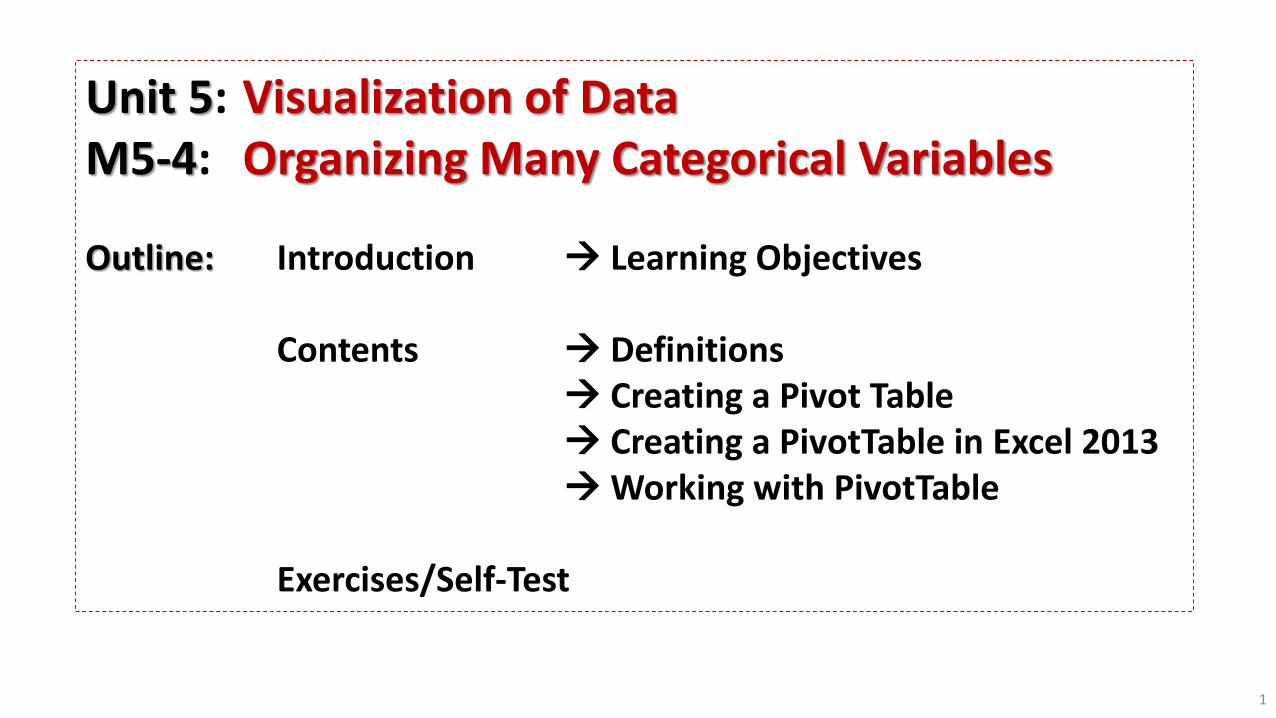
Unit 5: Visualization of DataM5-4: Organizing Many Categorical Variables
Outline: Introduction Learning Objectives
Contents Definitions Creating a Pivot Table Creating a PivotTable in Excel 2013Working with PivotTable
Exercises/Self-Test

The purpose of this module is to help students learn in a clear, concise, and easy way
what is the multidimensional contingency table,
why it is used, and
how and where to apply it.
2
Introduction: Learning Objectives

In statistics, a categorical variable is a variable that can take on one of a limited, and usually fixed, number of possible values. In computer science and some branches of mathematics, categorical variables are referred to as enumerations or enumerated types.Categorical data is the statistical data type consisting of categorical variables or of data that has been converted into that form, for example as grouped data. More specifically, categorical data may derive from either or both of observations made of qualitative data, where the observations are summarized as counts or cross tabulations, or of quantitative data, where observations might be directly observed counts of events happening or they might counts of values that occur within given intervals. Often, purely categorical data are summarized in the form of a contingency table.
1
Definition: Categorical Variable
Categorical Variable :
Source: Basic Business Statistics Concepts and Applications, 13rd Edition, Berenson/Levine/Szabat

Power Pivot is an Excel 2013 add-in you can use to perform powerful data analysis and create sophisticated data models. With Power Pivot, you can mash up large volumes of data from various sources, perform information analysis rapidly, and share insights easily.In both Excel and in Power Pivot, you can create a Data Model, a collection of tables with relationships. The data model you see in a workbook in Excel is the same data model you see in the Power Pivot window. Any data you import into Excel is available in Power Pivot, and vice versa.
Reference: http://office.microsoft.com/en-us/excel-help/power-pivot-powerful-data-analysis-and-data-modeling-in-excel-HA102837110.aspx?CTT=5&origin=HA104103581
2
Definition: Power Pivot

In data processing, a pivot table is a data summarization tool found in data visualization programs such as spreadsheets or business intelligence software. Among other functions, a pivot-table can automatically sort, count total or give the average of the data stored in one table or spreadsheet. It displays the results in a second table (called a "pivot table") showing the summarized data. Pivot tables are also useful for quickly creating unweightedcross tabulations. The user sets up and changes the summary's structure by dragging and dropping fields graphically. This "rotation" or pivoting of the summary table gives the concept its name.
3
Definition: Pivot Table
Pivot Table:
Source: Basic Business Statistics Concepts and Applications, 13rd Edition, Berenson/Levine/Szabat

4
Creating a PivotTable in Excel 2013
Characteristics of a PivotTable in Excel 2013:
A PivotTable allows you to summarize, analyze, and explore large amounts of data
Data can be dynamically arranged to view it from different angles
One column must have duplicate values to create categories for organizing and summarizing data
Another column must have numeric values
One can create a PivotTable by clicking ‘PivotTable’ in the Tables group on the ‘Insert’ tab
Working with PivotTable, An Example:
1. Introduction2. Create a PivotTable3. Create a Calculated Field4. Modify a PivotTable5. Change Values Field6. Sort, Filter, and Slice a PivotTable7. Format a PivotTable

5
Working with PivotTable
# Products Production Costs (Variable Costs), per pint Notes
Materials Labor Others
Ingredients (*) CO2 + H2O
1 Pilsner All-Malt Beer $0.35 $0.02 - $0.05 $0.15 - $0.25 $0.22 - $0.35 (**); (****)
2 Bavarian Lager All-Malt Beer $0.35 $0.02 - $0.05 $0.15 - $0.25 $0.22 - $0.35 (**); (****)
3 Light Wheat Beer $0.33 $0.02 - $0.05 $0.15 - $0.25 $0.22 - $0.35 (***); (****)
4 Red Wheat Beer $0.33 $0.02 - $0.05 $0.15 - $0.25 $0.22 - $0.35 (***); (****)
5 Pale Ale Beer $0.33 $0.02 - $0.05 $0.15 - $0.25 $0.22 - $0.35 (***); (****)
6 Nut Brown Ale $0.33 $0.02 - $0.05 $0.15 - $0.25 $0.22 - $0.35 (****)
7 Bock Dark Beer $0.33 $0.02 - $0.05 $0.15 - $0.25 $0.22 - $0.35 (***); (****)
8 Stout Beer $0.33 $0.02 - $0.05 $0.15 - $0.25 $0.22 - $0.35 (****)
9 Selection of 17 more products $0.33-$0.35 $0.02 - $0.05 $0.15 - $0.25 $0.22 - $0.35 (****)
Estimates – Production Costs per Products [$ per pint]
Notes: (*) The cost per product is based on the price of a delivered, complete set of ingredients (one supply batch kit is required for the production of one 155 gallon tank of beer)
(**) Products recommended for both direct sales in the existing restaurant/tavern AND as draught beer tapped in kegs (wholesale)
(***) Products recommended for direct sales in the existing restaurant/tavern(****) Cost per products for CO2, H2O, Labor, and Others varies for different locations
This example is used in the graduate course BU MET AD715 ‘Quantitative & Qualitative Decision Making, and is part of the Business Running Case ‘Investing in New BrewPub?’ © Zlatev, 2013-2014
1. An Introduction

6
Product ID Distribution Name Materials Labor Others Overall Prices Quantity
BR01-01, [retail] Pilsner 0.38 0.20 0.26 $0.84 $5.00 1000
BR01-02, [retail] Bavarian Lager 0.38 0.20 0.26 $0.84 $5.00 800
BR01-03, [retail] Light Wheat 0.38 0.20 0.26 $0.84 $3.50 500
BR01-04, [retail] Red Wheat 0.38 0.20 0.26 $0.84 $3.50 600
BR01-05, [retail] Pale Ale 0.38 0.20 0.26 $0.84 $3.50 400
BR01-06, [retail] Bock Dark 0.38 0.20 0.26 $0.84 $3.50 600
BR01-07, [wholesale] Pilsner 0.38 0.20 0.26 $0.84 $1.25 1200
BR01-08, [wholesale] Bavarian Lager 0.38 0.20 0.26 $0.84 $1.28 1500
BR01-10, [retail] Nut Brown Ale 0.38 0.20 0.26 $0.84 $4.00 900
BR01-11, [retail] Special Offer 0.38 0.20 $0.26 $0.84 $2.50 700
Dataset of the Example:
Data Preparation
2. Create a PivotTableWorking with PivotTable

7
Choose the data and click on “PivotTable” under “Insert” menu
2. Create a PivotTableWorking with PivotTable

8
Introduction to Calculated Field
• Calculated field:I. Is a user-defined field
II. Does not exist in the original dataset
• Use basic arithmetic operations, but not cell references or range names
• Use built-in calculations
3. Create a Calculated FieldWorking with PivotTable

9
Insert Calculated Field under “Field, Items, & Sets” which is listed under “Analyze” menu
Create “Overall Cost”=Overall*Quantity;
“Overall Contribution”=Overall*Prices.
Working with PivotTable 3. Create a Calculated Field

10
Modify a PivotTable
• Add, remove, or rearrange fields to get a different perspective of the data
• Be careful not to make the data overwhelming with too many details
• Excel does not automatically update PivotTables
Working with PivotTable 4. Modify a PivotTable

11
Change the Values Field
• Select the function used to calculate summary statistics
• Default is:
o Sum for values
o Count for text fields
• Specify a custom column heading
• Apply number formatting
Working with PivotTable 5. Change Values Field

12
Edit “PivotTable Field” by checking the following fields:
Product ID – FiltersDistribution – RowsName – ColumnsQuantity – ValuesOverall Contribution – ValuesOverall Cost– Values
Working with PivotTable 5. Change Values Field

13
Sort data in a PivotTable Default is alphabetical by row label text
To quickly rearrange data click in a cell in the column you want to sort,
and then
click Sort Smallest to Largest (Sort A to Z for text) or
Sort Largest to Smallest (Sort Z to A for text) in the Sort & Filter group on the Options tab
For specialized sorting click Sort in the Sort & Filter group on the
Options tab
If you click in a row label or column label first, you get a dialog box that has slightly different options than if you click on a value first
Working with PivotTable 6. Sort, Filter, and Slice a PivotTable

14
Apply filters to show a subset of data in a PivotTable
Two types of filters:
A report filter sets the overall conditions for aggregating data
A group filter filters out data based on a row or column category
Filter by one or multiple items, as well as by entering a search condition
Working with PivotTable 6. Sort, Filter, and Slice a PivotTable

15
Use slicers to filter data in a PivotTable
Slicers: Are graphical
Provide buttons that you can click for quick filtering
Indicate the current filtering state
To insert slicer click the Options tab,
click the Insert Slicer button in the Sort & Filter group,
click one or more field check boxes for which you want to create a slicer, and then
click OK
To use slicero click a button to filter data
Working with PivotTable 6. Sort, Filter, and Slice a PivotTable
16
7. Format a PivotTable
Basic formatting applied to PivotTables:
Primary row labels formatted in bold
Subtotals are bold
Use PivotTable Tools Design tab to apply a PivotTable style and control:
Font color
Fill color
Bolding
Border lines
Working with PivotTable

17
Get the ResultWorking with PivotTable
Product ID Distribution Name Materials Labor Others Overall Prices Quantity
BR01-01, [retail] Pilsner 0.38 0.20 0.26 $0.84 $5.00 1000
BR01-02, [retail] Bavarian Lager 0.38 0.20 0.26 $0.84 $5.00 800
BR01-03, [retail] Light Wheat 0.38 0.20 0.26 $0.84 $3.50 500
BR01-04, [retail] Red Wheat 0.38 0.20 0.26 $0.84 $3.50 600
BR01-05, [retail] Pale Ale 0.38 0.20 0.26 $0.84 $3.50 400
BR01-06, [retail] Bock Dark 0.38 0.20 0.26 $0.84 $3.50 600
BR01-07, [wholesale] Pilsner 0.38 0.20 0.26 $0.84 $1.25 1200
BR01-08, [wholesale] Bavarian Lager 0.38 0.20 0.26 $0.84 $1.28 1500
BR01-10, [retail] Nut Brown Ale 0.38 0.20 0.26 $0.84 $4.00 900
BR01-11, [retail] Special Offer 0.38 0.20 $0.26 $0.84 $2.50 700
Starting Table
Final Table