Embed Size (px)
Citation preview

SIC1203 MEASUREMENTS & INSTRUMENTATION UNIT - IV ELECTRONIC MEASUREMENTS PREPARED BY : Mr. Bestley Joe, Dr.S.Poornapushpakala & Mr. M.A.Muthaih
UNIT 4 ELECTRONIC MEASUREMENTS
Fundamentals of Cathode Ray Oscilloscope: Block diagram, CRO probes, Delay
line, types of Oscilloscopes. Measurement of: Signal voltage, Current, Phase &
Frequency using Lissajous patterns, Industrial applications of CRO. DC and AC
voltmeter and Ammeter, Ohmmeter, Range Extension, Electronic Multimeters,
Types of Voltmeters - Differential type, true RMS type, Vector voltmeter - Wave
Analyzer, Spectrum Analyzer and Distortion Analyzer
FUNDAMENTALS OF CATHODE RAY OSCILLOSCOPE
The cathode ray oscilloscope is probably the most versatile tool for the
development of electronic circuit and systems and has been one of the most important
tools in the development of modern electronics. The cathode ray oscilloscope is a
device that allows the amplitude of the electrical signal whether they may be voltage,
current, power, etc., to be displayed primarily as a function of time. The oscilloscope
depends on the movement of an electron beam, which is then made visible by allowing
the beam to impinge on a phosphor surface, which produces a visible spot. If the
electron beam is deflected in either of the two orthogonal axes, such as familiar X and Y
axes used in conventional graph construction, the luminous spot can be used to create
two-dimensional displays.
BLOCK DIAGRAM OF OSCILLOSCOPE:
The major block circuit of general purpose CRO is as follows:
1)CRT
2)Vertical Line
3)Delay line
4)Horizontal amplifier
5)Time base generator
6)Trigger circuit
7)Power Supply.

SIC1203 MEASUREMENTS & INSTRUMENTATION UNIT - IV ELECTRONIC MEASUREMENTS PREPARED BY : Mr. Bestley Joe, Dr.S.Poornapushpakala & Mr. M.A.Muthaih
Fig: Block Diagram of oscilloscope
The description is below:
1) Cathode Ray Tube (CRT):
A cathode ray oscilloscope consists of a cathode ray tube (CRT) which is the
heart of the oscilloscope, and some additional circuitry to operate the CRT. The main
parts of a CRT are:
a)Electron gun assembly.
b)Deflection plate assembly
c)Fluorescent screen
d)Glass envelope
The electron gun assembly produces a sharply focussed beam of electrons
which are accelerated to high velocity. This focussed beam of electrons strikes the
fluorescent screen with sufficient energy to cause a luminous spot on the screen

SIC1203 MEASUREMENTS & INSTRUMENTATION UNIT - IV ELECTRONIC MEASUREMENTS PREPARED BY : Mr. Bestley Joe, Dr.S.Poornapushpakala & Mr. M.A.Muthaih
Fig: Internal Structure of CRT
After leaving the electron gun, the electron beam passes through two pairs of
"electrostatic deflection plates". Voltages applied to these plates deflect the beam.
Voltages applied to one pair of plates move the beam vertically up and down and the
voltages applied to the other pair of plates move the beam horizontally from one side to
another. Focusing anode is used to focus the beam on the screen, and the accelerating
anode makes the electron beam to move with high velocity.
2)Vertical Amplifier:
Fig: Vertical Amplifier
This is a wide band amplifier used to amplify signals in the vertical section.

SIC1203 MEASUREMENTS & INSTRUMENTATION UNIT - IV ELECTRONIC MEASUREMENTS PREPARED BY : Mr. Bestley Joe, Dr.S.Poornapushpakala & Mr. M.A.Muthaih
The vertical amplifier consists of several stages, with fixed overall sensitivity or
gain expressed in v/divisions. The advantage of fixed gain is that the amplifier can be
more easily designed to meet the requirements of stability and between the vertical
amplifier is kept within its signal handling capability by proper selection of the input
attenuator switch. The first element of the pre-amplifier is the input stage, often
consisting of a FET source follower whose high input impedance isolates from the
attenuator.
This FET input stage is followed by a BJT emitter followers to match the medium
impedance of FET output with the low impedance input of the phase inverter.
The phase inverter provides two anti-phase output signals which are required to
operate the push pull output amplifier. The push pull output stage delivers equal signal
voltages of opposite polarity to the vertical plates of the CRT.
The advantages of push pull operation on CRO are similar to those obtained
from push pull operation. In addition a number of focusing and non-linear effects are
reduced, because neither plate is ground potential.
3)Delay Line:
It is used to delay the signal from some time in the vertical section.
Comparing the vertical and horizontal deflection circuits in the oscilloscope block
diagram, we observe that the deflection signal is initiated or triggered, by a portion of
the output signal applied to the vertical CRT plates. Signal processing in the horizontal
channel consists of generating and shaping a trigger pulse that starts the sweep
generator, whose output is fed to the horizontal deflection plates. This whole process
takes time on the order of 80 ns. To allow the operator to observe the leading edge of
the signal waveform, the signal drive for the vertical CRT plates must therefore be
delayed by atleast the same amount of time. This is the function of time delay line.
4) Horizontal Amplifier:
The horizontal basically serves two purposes:
a)When the oscilloscope is being in the X-Y node, the signal applied to the horizontal
input terminal will be amplified by the horizontal amplifier.

SIC1203 MEASUREMENTS & INSTRUMENTATION UNIT - IV ELECTRONIC MEASUREMENTS PREPARED BY : Mr. Bestley Joe, Dr.S.Poornapushpakala & Mr. M.A.Muthaih
b) When the oscilloscope is being used in the ordinary mode of operation to display a
signal applied to the vertical input, the horizontal amplifier will amplify the sweep
generator output.
Fig: Horizontal Amplifier
5) Time base generator:
It is used to generate the saw tooth voltage required to deflect the beam in the
horizontal section.
6) Trigger circuit:
This is used to convert the incoming signal into trigger pulses that the input signal
and the sweep frequency can be synchronised.
7) Power supply:
There are two power supplies, a negative high voltage (HV) supply and a positive
low voltage (LV) supply. Two voltages are generated in the CRO. The positive volt
supply is from -100V to +1500V. This voltage is passed through a bleeder resistor at a
few mA. The intermediate voltages are obtained from the bleeder resistor for intensity,
focus and positioning controls.
Screens for CRT's:
When the electron beam strikes the screen of the CRT, a spot light is produced.
The screen material on the inner surface of the CRT that produces this effect is the
phosphor. The phosphor absorbs the kinetic energy of the bombarding electrons and

SIC1203 MEASUREMENTS & INSTRUMENTATION UNIT - IV ELECTRONIC MEASUREMENTS PREPARED BY : Mr. Bestley Joe, Dr.S.Poornapushpakala & Mr. M.A.Muthaih
remits energy at the lower frequency in the visible spectrum. The property of some
crystalline materials such as phosphor or zinc oxide to emit light when simulated by
radiation is called flourescence. Fluorescent materials have a second characteristic
called as phosphorescence which refers to the property of the material to continue light
emission even after the source of excitation is cut off. The length of time during which
phosphorescence or afterglow occurs is called as the persistence of phosphor.
Phosphor Data Chart:
Phosphor Type Flourescence Phosphorescence
P1 Yellow green Yellow green
P2 Blue green Yellow green
P4 White White
P7 Blue Yellow green
P11 Purple blue Purple blue
P31 Yellow green Yellow green
Applications of Oscilloscope:
Because the oscilloscope is an extremely flexible and versatile instrument, it can
be used to measure a number of parameters associated with DC and AC signals. Using
a single channel oscilloscope, it is capable of making measurements of voltage, current,
time, frequency and rise/fall time. If a dual trace oscilloscope is used, the phase shift
between two synchronous signals can be measured.
a)Power Analysis:
Oscilloscopes can be used to measure and analyse the operating characteristics
of power conversion devices, circuits and line power harmonics. Differential amplifier
probes are needed to this and special software is also offered to make analysis of data
easier.
b)Serial data analysis:
Digital data signals are moving to ever-increasing serial data formats.
Oscilloscopes are used to analyse and characterize such data formats as USB, SCSI,

SIC1203 MEASUREMENTS & INSTRUMENTATION UNIT - IV ELECTRONIC MEASUREMENTS PREPARED BY : Mr. Bestley Joe, Dr.S.Poornapushpakala & Mr. M.A.Muthaih
Ethernet, Serial ATA, Fibre channel, firewire, Rapid I/O, Infiniband, bluetooth and CAN
Bus (for automotive industry)
c)Jitter analysis:
Today high bandwidth circuits have extremely fast clocks and signals.
Oscilloscopes are used to characterise and debug signal jitter as well as timing for
clocks, clock-to-data and data stream analysis.
d)Data storage device testing:
Oscilloscopes are used to test CD/DVD and disk drive designs by measuring
disk performance, media noise and optical recording characteristics.
e)Time-domain reflectometry:
Time Domain reflectometry (TDR) is a way to measure impedance values and
variations (such as faults) along transmission cables, cable connectors or microstrips on
a circuit board.
CRO PROBES
The CRO probe performs the very important function of connecting the test circuit to the
oscilloscope without altering, loading or otherwise disturbing the test circuit.
There are three different probes:
a)Direct reading probe, b)circuit isolation probe, c)detector probe.
They are discussed below:
a) Direct reading probe
This probe is the simplest of all probes and it uses a shielded coaxial cable.
It avoids stray pickups which may lead to problems when low level signals are being
measured. It is used usually for low frequency and low impedance circuits. However in
using the shielded probe, the shunt capacitance of the probe is added to the input
impedance and capacity of the scope and acts to lower the response of the oscilloscope
to high impedance and high frequency circuits.
b) Isolation probe
Isolation probe is used in order to avoid the undesirable circuit loading effects of
shielded probe. The isolation probe which is used along with the capacitive voltage

SIC1203 MEASUREMENTS & INSTRUMENTATION UNIT - IV ELECTRONIC MEASUREMENTS PREPARED BY : Mr. Bestley Joe, Dr.S.Poornapushpakala & Mr. M.A.Muthaih
divider, decreases the input capacitance and increases the input resistance of the
oscilloscope. This way the loading effects are drastically reduced.
c) Detector probe
When analyzing the response to modulated signals in communication equipment
like AM, FM and TV receivers, the detector probe functions to separate the lower
frequency modulation component from the higher frequency carrier. The amplitude of
the modulator carrier (which is proportional to the response of the receiver to the much
high frequency carrier signal) is displayed on the oscilloscope by rectifying and
bypassing action. This permits an oscilloscope capable of audio-frequency response to
perform signal tracing tests on communication signals in the range of hundreds of Mhz,
a range which is beyond the capabilities of all oscilloscopes except the highly
specialized ones.
Fig: A CRO Probe
DELAY LINE
The amplitude of the signal is with respect to time and relative position of the
sweep generator output signal. When the delay line is not used, the initial part of the
signal is lost and only part of the signal is displayed. To counteract this disadvantage,
the signal is not applied directly to the vertical plates but is passed through the delay
line circuit. This gives time for the sweep to start at the horizontal plates before the
signal has passed through the main amplifier. The sweep generator delivers the sweep
to the horizontal amplifier and the sweep starts at the horizontal deflection plate after

SIC1203 MEASUREMENTS & INSTRUMENTATION UNIT - IV ELECTRONIC MEASUREMENTS PREPARED BY : Mr. Bestley Joe, Dr.S.Poornapushpakala & Mr. M.A.Muthaih
+80ns. Hence the sweep starts well in time, since the signal arrives at the vertical
deflection plate at a time to +200ns.
Fig: Delay line circuit
Delay line is packed by inductor and capacitor. This delay is atleast equal to the delay in
horizontal.
1)Lumped parameter delay line.
2)Distributor parameter delay line.
They are discussed below:
1) Lumped Parameter delay line:
The lumped parameter delay line was constructed using the T-section. Each T-
section produces the delay as follows:
Fs=1
π𝑓𝑠
where,
fs=Time delay for the single RT section.
fd=nfs
here 'n' is the number of T section.

SIC1203 MEASUREMENTS & INSTRUMENTATION UNIT - IV ELECTRONIC MEASUREMENTS PREPARED BY : Mr. Bestley Joe, Dr.S.Poornapushpakala & Mr. M.A.Muthaih
Fig: Lumped parameter delay line
2) Distributed parameter delay line:
Fig: Distributor parameter delay line
It is a special type of cable. Inner conductor is made up of ferromagnetic core.
The inductor coil is wound in the helix shape of the core. Outer core is used to reduce
the eddy current loss. We increase the ferromagnetic core that increases the delay line.
The coaxial line is advantageous because it does not require the careful adjustment of a
lumped-parameter line as it occupies less space.

SIC1203 MEASUREMENTS & INSTRUMENTATION UNIT - IV ELECTRONIC MEASUREMENTS PREPARED BY : Mr. Bestley Joe, Dr.S.Poornapushpakala & Mr. M.A.Muthaih
TYPES OF OSCILLOSCOPES
There are a number of oscilloscopes which are used for special applications.
Some of the oscilloscopes are described below:
a)Multiple beam oscilloscopes
In many cases it becomes necessary to compare one signal with that of the
other. In such cases Multiple beam oscilloscopes are used. They enclose in a single
tube several beam producing systems each with its vertical pair of plates, but mostly
with a common time-base. Each Y-channel has its own amplifier. The synchronization
or triggering is done from the input of a desired Y-channel or from an external input
voltage.
Double beam oscilloscopes use two electron guns within the same cathode ray tube.
the electron beam of the two channels are completely independent of each other. The
same effect may be produced by a single electron gun, the output from it being split into
two independent controllable electron beams.
b) Multiple Trace Oscilloscopes
This oscilloscope uses single electron guns and produces multiple traces by
switching the Y-deflection plates from one input signal to another (this means that the Y-
channel is time shared by many signals). The eyes interpret this is a continuous
simultaneous display of the input signals although it is a sampled display. This method
reduces the cost of manufacturing multi-channel oscilloscopes.
c) Sampling oscilloscopes
The oscilloscopes presently can be used for continuous display for frequencies in
the 50-300 Mhz range depending upon the design of the oscilloscopes. The display may
have upto 1000 dots of luminescence. The vertical deflection for each dot is obtained
from progressively later points in each successive cycle of input waveform as shown
below:

SIC1203 MEASUREMENTS & INSTRUMENTATION UNIT - IV ELECTRONIC MEASUREMENTS PREPARED BY : Mr. Bestley Joe, Dr.S.Poornapushpakala & Mr. M.A.Muthaih
Fig: Principle of Sampling Oscilloscopes.
The horizontal deflection of the electron beam is obtained by applying staircase
waveform to X-deflection plates.
The sampling oscilloscope is able to respond and store rapid bits of information
and present them in a continuous display. The sampling techniques immediately the
input signals into lower frequency domain, where conventional low frequency circuitry is
then capable of producing a highly effective display.
This type of oscilloscopes can be used beyond 50Mhz into the UHF range
around 500Mhz and beyond upto 10Ghz. It should be noted that the sampling
techniques cannot be used the display of transient waveforms.
d) Scanning Oscilloscopes
These oscilloscopes use television tubes. The data to be measured are applied
through intensity modulation on the standard screen. Several phenomena can be
observed simultaneously on a single screen by using this technique. As a result of
large number of factors influencing the quality of recording, experience with the
particular camera CRO combination is usually the best guide.
e) Storage type Oscilloscopes
They are rapidly becoming one of the most useful tools in the presentation of
very slowly swept signals and finds many application in mechanical and
biomedical fields.

SIC1203 MEASUREMENTS & INSTRUMENTATION UNIT - IV ELECTRONIC MEASUREMENTS PREPARED BY : Mr. Bestley Joe, Dr.S.Poornapushpakala & Mr. M.A.Muthaih
Usually in conventional CRTs, the persistence of phosphor ranges from
microseconds to seconds. In applications where the persistence of the screen is
smaller than the rate at which the signal sweeps across the screen, the start of
screen will have disappeared before the end of the display is written.
In storage oscilloscopes, the persistence times are much greater than a few
seconds or even hours are available, making it possible to store events on the
CRT screen.
The special CRT of storage oscilloscope contains electron gun, deflection
plates, phosphor bronze screen but also it holds many number of special
electrodes. The CRT used here is called as storage tube.
The schematic diagram of Storage CRT below:
Fig: Schematic diagram of a storage type CRT
The storage mesh or the storage target is mounted just behind the phosphor
screen is a conductive mesh covered with a highly resistive coating of
magnesium fluoride.
The write gun is a high-energy electron gun, similar to the conventional gun
giving a narrow focussed beam which can be deflected and used to write the
information to be stored.
Because of the excellent insulating properties of the magnesium fluoride
coating, the positively charged pattern remains exactly in the same position on
the storage target which it was first deposited.

SIC1203 MEASUREMENTS & INSTRUMENTATION UNIT - IV ELECTRONIC MEASUREMENTS PREPARED BY : Mr. Bestley Joe, Dr.S.Poornapushpakala & Mr. M.A.Muthaih
The stored pattern may be made available for viewing at a later time by the use
of two special electron guns called flood guns. The flood guns are placed inside
the CRT in a position between the deflection plates and the storage target and
they emit low-velocity electrons over a large area towards the entire screen.
When the flood guns are switched for viewing mode low energy electrons are
sprayed towards the screen. The electron trajectories are adjusted by the
collimating electrodes which constitute a low-voltage electrostatic lens system ,
so that the flood electrons cover the entire screen area.
To erase the pattern which is etched on the storage mesh, a negative voltage is
applied to the storage target, neutralizing the stored positive charge.
To get variable persistence, the erase voltage is applied in the form of pulses
instead of a steady dc voltage. By varying the width of these pulses, the rate of
erase is verified.
f) Impulse waveform oscilloscopes
These oscilloscopes are used for the investigation of transient non-period
phenomena which occur at high voltages. These oscilloscopes use special types of
CRT wherein the plates are mounted on the sides. The voltage to be measured is
applied to these plates either directly or through capacitive potential dividers.
Simultaneously, an impulse is suddenly applied to the cathode voltage. A very bright
display is obtained on account of the high voltage and the high beam current which exist
for a very short duration. Therefore, photographic records of the display can be obtained
even at very high speeds of upto 50x106 m/s.
MEASUREMENT OF SIGNAL VOLTAGE
Oscilloscopes are best suited for the measurement of peak and peak to peak
values of AC voltage waveform, although DC coupled oscilloscopes also permit the
display and measurement of an AC signal with a DC component. Before making a
voltage measurement, it is important to be sure that the probe is properly compensated
and the fine adjustment control of the vertical attenuator is in CAL or "calibrated"
position. This control should not be disturbed during a measurement.

SIC1203 MEASUREMENTS & INSTRUMENTATION UNIT - IV ELECTRONIC MEASUREMENTS PREPARED BY : Mr. Bestley Joe, Dr.S.Poornapushpakala & Mr. M.A.Muthaih
The signal to be measured is connected to the vertical input via the probe. The
vertical sensitivity, time base, coupling and trigger controls are set to provide a stable
display that covers as many vertical divisions as possible without exceeding the limits of
the screen. The vertical and horizontal position controls can be used to reposition the
traces lightly with respect to the graticule, in order to use the minor divisions of the
graticule to the best advantage. If desired, a zero-voltage, or base line reference can be
established by switching the vertical input selector switch to ground (GND) and
adjusting the vertical position control to make the zero level coincide with the major
horizontal grid line. The oscilloscope is a "personalised" instrument which means that
the control settings can be adjusted to suit the operator.
AC voltage measurements are easiest when taken as peak-to-peak readings
from the oscilloscope screen. A ground reference is established at the mid horizontal
graticule line, and then the AC waveform is displayed. Peak-to-peak voltage is read as
vp-p = vertical divisions x volts/divisions x probe attenuation
The number of divisions is the number of major vertical graticule divisions
measured between the negative and positive peaks of the waveform. The
"volts/divisions" is the setting of the vertical sensitivity control, while probe attenuation
depends on the type of the probe such as 1X or 10X. The voltage of an AC with a non-
zero DC (average) level can be measured. To obtain the RMS or average values of
standard waveforms, it is best to measure the peak to peak value and convert
mathematically using the factors like Vav and Vrms for different types of waveforms.
MEASUREMENT OF CURRENT USING OSCILLOSCOPE
There are two ways to measure current with an oscilloscope. Alternating and
direct current can be measured by looking at the voltage across a known value of
resistance and applying Ohm's law to the observed trace. Application of this technique
is limited by the need for one side of the resistor and oscilloscope to be at ground
potential, although some oscilloscopes are equipped with differential preamplifiers that
permit viewing the voltage drop across components that have both terminals "floating"
above ground. The second method requires the use of the current probe and is only
applicable to the measurement of alternating current.
SIC1203 MEASUREMENTS & INSTRUMENTATION UNIT - IV ELECTRONIC MEASUREMENTS PREPARED BY : Mr. Bestley Joe, Dr.S.Poornapushpakala & Mr. M.A.Muthaih
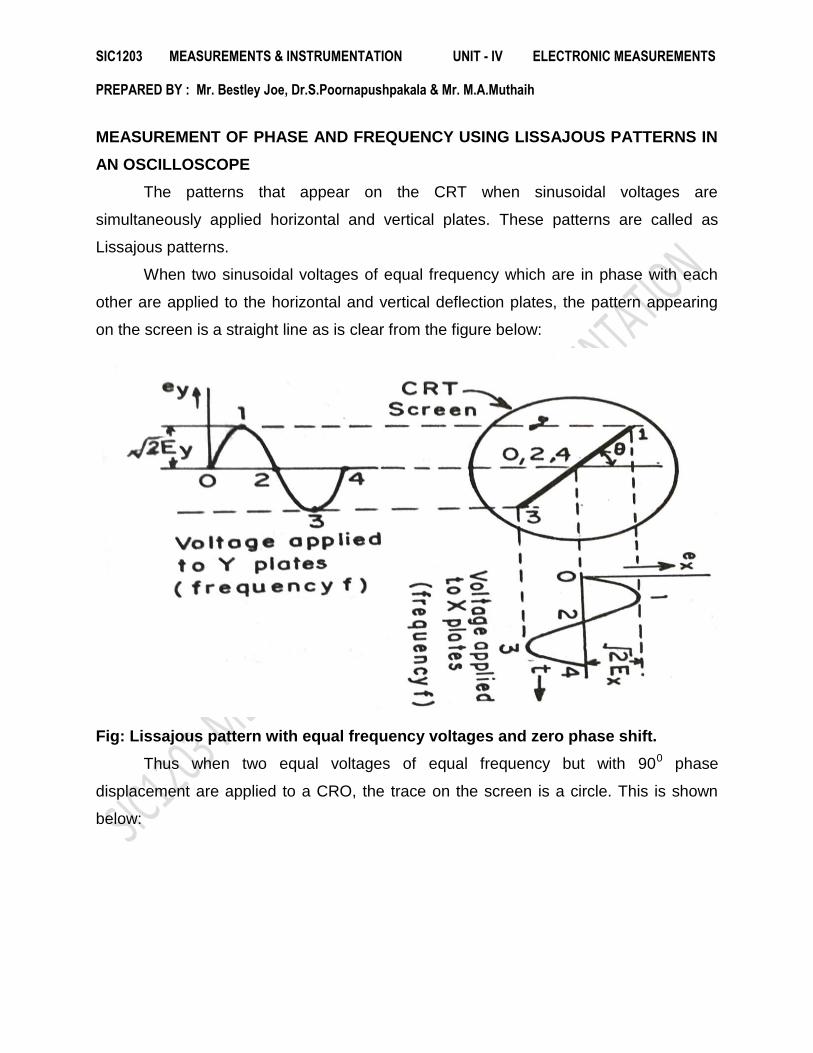
MEASUREMENT OF PHASE AND FREQUENCY USING LISSAJOUS PATTERNS IN
AN OSCILLOSCOPE
The patterns that appear on the CRT when sinusoidal voltages are
simultaneously applied horizontal and vertical plates. These patterns are called as
Lissajous patterns.
When two sinusoidal voltages of equal frequency which are in phase with each
other are applied to the horizontal and vertical deflection plates, the pattern appearing
on the screen is a straight line as is clear from the figure below:
Fig: Lissajous pattern with equal frequency voltages and zero phase shift.
Thus when two equal voltages of equal frequency but with 900 phase
displacement are applied to a CRO, the trace on the screen is a circle. This is shown
below:

SIC1203 MEASUREMENTS & INSTRUMENTATION UNIT - IV ELECTRONIC MEASUREMENTS PREPARED BY : Mr. Bestley Joe, Dr.S.Poornapushpakala & Mr. M.A.Muthaih
Fig: Lissajous pattern with equal voltages of equal frequency and a phase shift of
900
When two equal voltages of equal frequencies but with a phase shift "ɸ" (not equal to 00
or 900) are applied to a CRO we obtain an ellipse as shown in figure below:
Fig: Lissajous patterns with two equal voltages of same frequencies and phase
shift "ɸ"
An ellipse is also obtained when unequal voltages of same frequencies are applied to
the CRO.

SIC1203 MEASUREMENTS & INSTRUMENTATION UNIT - IV ELECTRONIC MEASUREMENTS PREPARED BY : Mr. Bestley Joe, Dr.S.Poornapushpakala & Mr. M.A.Muthaih
A number of conclusions can be drawn from the above discussions. When two
sinusoidal voltages of same frequencies are applied:
(i) A straight line results when the two voltages are equal and are in either in phase with
each other or 1800 out of phase with each other. The angle formed with the horizontal is
450 when the magnitudes of voltages are equal. An increase in the vertical deflection
voltage causes the line to have an angle greater than 450 with the horizontal. On the
other hand a greater horizontal voltages makes the angle less than 450 with the
horizontal.
(ii) Two sinusoidal waveforms of the same frequency produce a lissajous pattern, which
may be a straight line, a circle or an ellipse depending upon the phase and magnitude
of the voltages.
A circle can be formed only when the magnitude of the two signals are equal and
the phase difference between them is either 900 or 2700. However if the two voltages
are not equal and/or out of phase an ellipse is formed. If the 'Y' voltage is larger, an
ellipse with vertical major axis is formed while if the X-plate voltage has a greater
magnitude, the major axis of the ellipse lies along horizontal axis.
Fig: Lissajous patterns with different phase shifts

SIC1203 MEASUREMENTS & INSTRUMENTATION UNIT - IV ELECTRONIC MEASUREMENTS PREPARED BY : Mr. Bestley Joe, Dr.S.Poornapushpakala & Mr. M.A.Muthaih
It is clear from the above figure that for equal voltages of same frequency, progressive
variation of phase voltage causes the pattern to vary from a straight diagonal line to
ellipses of different eccentricities and then to a circle, after that through another series
of ellipses and finally a diagonal straight line again.
Regardless of the two amplitudes of the applied voltages, the ellipses provides a
simple means of finding phase difference between two voltages. Referring to the below
figure, the sine of the phase angle between the voltages is given by:
sin ɸ = 𝑌1
𝑌2=
𝑋1
𝑋2
Fig: Lissajous patterns with different frequency ratios.
If the major axis of the ellipse lies in the first and third quadrants (ie., its slope is
positive) as shown in figure (a) below, the phase angle is either between 00 or 900 or
between 2700 to 3600. When the major axis of the ellipse lies in the second and fourth
quadrants, ie., when its slope is negative as in figure (b) below, the phase angle is
between 900 and 1800 or between 1800 and 2700.
Fig: Determination of angle of phase shifts
SIC1203 MEASUREMENTS & INSTRUMENTATION UNIT - IV ELECTRONIC MEASUREMENTS PREPARED BY : Mr. Bestley Joe, Dr.S.Poornapushpakala & Mr. M.A.Muthaih
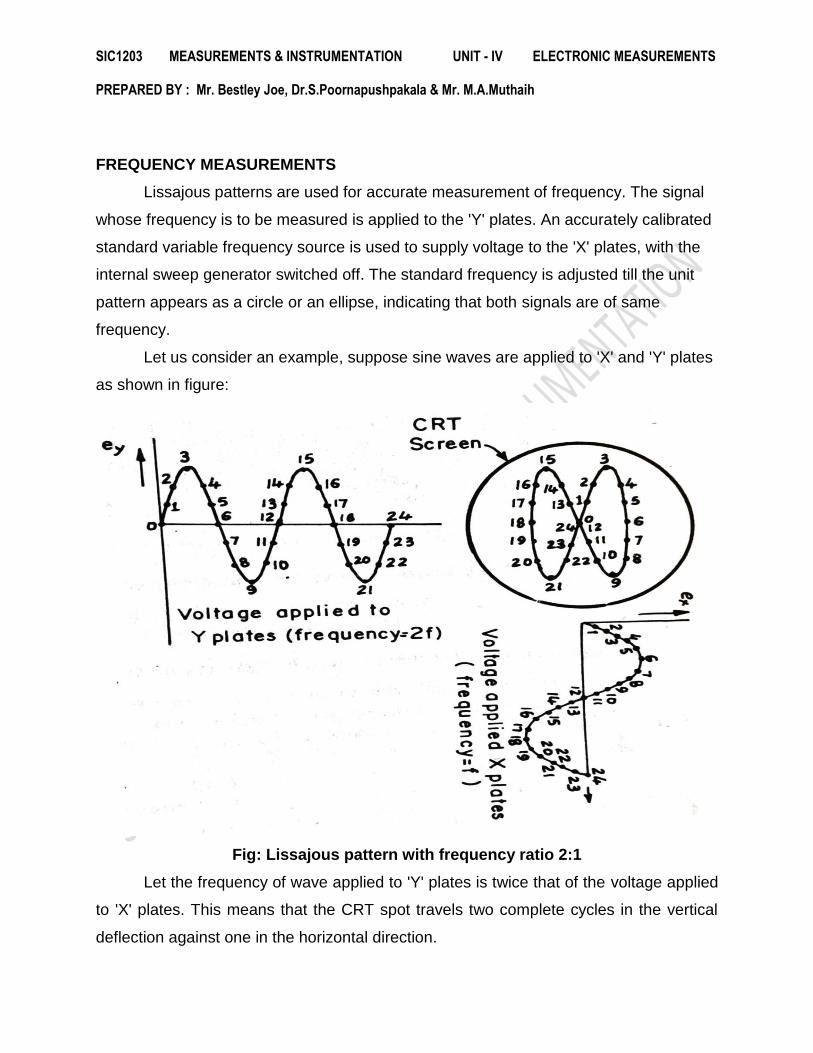
FREQUENCY MEASUREMENTS
Lissajous patterns are used for accurate measurement of frequency. The signal
whose frequency is to be measured is applied to the 'Y' plates. An accurately calibrated
standard variable frequency source is used to supply voltage to the 'X' plates, with the
internal sweep generator switched off. The standard frequency is adjusted till the unit
pattern appears as a circle or an ellipse, indicating that both signals are of same
frequency.
Let us consider an example, suppose sine waves are applied to 'X' and 'Y' plates
as shown in figure:
Fig: Lissajous pattern with frequency ratio 2:1
Let the frequency of wave applied to 'Y' plates is twice that of the voltage applied
to 'X' plates. This means that the CRT spot travels two complete cycles in the vertical
deflection against one in the horizontal direction.

SIC1203 MEASUREMENTS & INSTRUMENTATION UNIT - IV ELECTRONIC MEASUREMENTS PREPARED BY : Mr. Bestley Joe, Dr.S.Poornapushpakala & Mr. M.A.Muthaih
Two waves start at the same instant. Lissajous pattern may be constructed in the
usual way and the 8 shaped pattern with the loops is obtained. If the two waves do not
start at the same instant we get different patterns for the same frequency ratio. The
Lissajous patterns for other frequency ratios can be similarly drawn. Some of these
patterns are shown below:
Fig: Lissajous patterns with different frequency ratios
In all the cases, the ratios of the two frequencies are:
𝑓𝑥
𝑓𝑦 =
𝑁𝑢𝑚𝑏𝑒𝑟 𝑜𝑓 𝑡𝑖𝑚𝑒𝑠 𝑡𝑎𝑛𝑔𝑒𝑛𝑡 𝑡𝑜𝑢𝑐 𝑒𝑠 𝑡𝑜𝑝 𝑜𝑟 𝑏𝑜𝑡𝑡𝑜𝑚
𝑁𝑢𝑚𝑏𝑒𝑟 𝑜𝑓 𝑡𝑖𝑚𝑒𝑠 𝑡𝑎𝑛𝑔𝑒𝑛𝑡 𝑡𝑜𝑢𝑐 𝑒𝑠 𝑒𝑖𝑡𝑒𝑟 𝑠𝑖𝑑𝑒
= 𝑛𝑢𝑚𝑏𝑒𝑟 𝑜𝑓 𝑜𝑟𝑖𝑧𝑜𝑛𝑡𝑎𝑙 𝑡𝑎𝑛𝑔𝑒𝑛𝑐𝑖𝑒𝑠
𝑛𝑢𝑚𝑏𝑒𝑟 𝑜𝑓 𝑣𝑒𝑟𝑡𝑖𝑐𝑎𝑙 𝑡𝑎𝑛𝑔𝑒𝑛𝑐𝑖𝑒𝑠
where,
fx= frequency of signal applied to 'Y' plates
fy= frequency of signal applied to 'X' plates.
INDUSTRIAL APPLICATIONS OF CRO
Because the oscilloscope is an extremely flexible and versatile instrument, it can
be used to measure a number of parameters associated with DC and AC signals. Using
a single channel oscilloscope, it is capable of making measurements of voltage current,
time, frequency and rise/fall time. If a dual trace oscilloscope is used the phase shift
between two synchronous signals can be measured.
Other major applications of CRO are listed below:
(A) In Radio Work
1. To trace and measure a signal throughout the RF, IF and AF channels of radio and
television receivers.

SIC1203 MEASUREMENTS & INSTRUMENTATION UNIT - IV ELECTRONIC MEASUREMENTS PREPARED BY : Mr. Bestley Joe, Dr.S.Poornapushpakala & Mr. M.A.Muthaih
2. It provides the only effective way of adjusting FM receivers, broadband high-
frequency RF amplifiers and automatic frequency control circuits;
3. to test AF circuits for different types of distortions and other spurious oscillations;
4. To give visual display of wave-shapes such as sine waves, square waves and their
many different combinations;
5. To trace transistor curves
6. To visually show the composite synchronized TV signal
7. To display the response of tuned circuits etc.
(B) Scientific and Engineering applications:
1.Measurement of ac/dc voltages,
2. Finding B/H curves for hysteresis loop,
3. for engine pressure analysis,
4. for study of stress, strain, torque, acceleration etc.
5. Frequency and phase determination by using Lissajous figures,
6. Radiation patterns of antenna,
7. Amplifier gain,
8. Modulation percentage,
9. Complex waveform as a short-cut for Fourier analysis,
10. Standing waves in transmission lines etc.
DC AND AC VOLTMETERS
Generally AC electromechanical meters are based on two basic movements: those
based on DC movement, and those designed for AC use alone. Permanent magnet
moving coil (PMMC) meter movement does not work correctly if it is directly connected
to alternating current, because the direction of needle movement will change with each
half-cycle of AC quantity. Figure 1 shows D’Arsonval meter movement causes useless
flutter of the needle while ac is passing through this wire coil. Permanent-magnet meter
is a device whose motion depends on the polarity of the applied voltage. In D’Arsonval
meter movement, initially the dc current must be rectified through diodes. The diodes
act like a one-way valve for electron flow: acting as a conductor for one polarity and an

SIC1203 MEASUREMENTS & INSTRUMENTATION UNIT - IV ELECTRONIC MEASUREMENTS PREPARED BY : Mr. Bestley Joe, Dr.S.Poornapushpakala & Mr. M.A.Muthaih
insulator for another. The arrowhead in each diode symbol points against the permitted
direction of electron flow. Arranged in a bridge, four diodes serve to steer AC through
the meter movement in a constant direction throughout all portions of the AC cycle
shown in Figure 2
Figure1. PassingAC through this D’Arsonval meter movement causes
Useless flutter of the needle.
Figure 2 Passing AC through this rectified AC meter movement will drive it
in one direction.

SIC1203 MEASUREMENTS & INSTRUMENTATION UNIT - IV ELECTRONIC MEASUREMENTS PREPARED BY : Mr. Bestley Joe, Dr.S.Poornapushpakala & Mr. M.A.Muthaih
Another strategy for a practical AC meter movement is to redesign the movement
without the inherent polarity sensitivity of DC types. This means avoiding the use of
permanent magnets. The simplest design is to use a non- magnetized iron vane to
move the needle against spring tension, the vane being attracted toward a stationary
coil of wire energized by the AC quantity to be measured as in Figure 3.
Figure 3 Iron-vane electromechanical meter movement
Electrostatic attraction between two metal plates separated by an air gap is an
alternative method for generating a needle-moving force proportional to applied voltage.
The forces involved are very small, much smaller than the magnetic attraction between
an energized coil and an iron vane, and as such these “electrostatic” meter movements
tend to be fragile and easily disturbed by physical movement. This technology
possesses high input impedance, meaning that no current need be drawn from the
circuit under test. Also, electrostatic meter movements are capable of measuring very
high voltages without need for range resistors or other, external apparatus
DC Voltmeter
The DC voltmeter mainly consists of a dc amplifier apart from the attenuator, as shown
in Figure 4
Figure 4 Block diagram of DC voltmeter
Attenuator Multi stage DC
Amplifier PMMC
DC Voltage
to be
measured

SIC1203 MEASUREMENTS & INSTRUMENTATION UNIT - IV ELECTRONIC MEASUREMENTS PREPARED BY : Mr. Bestley Joe, Dr.S.Poornapushpakala & Mr. M.A.Muthaih
DC voltmeters can be divided into two categories.
1. Direct coupled amplifier DC Voltmeter.
2. Chopper type DC Voltmeter.
Figure 5 Direct coupled amplifier DC voltmeter
This type of voltmeter is very common because of its low cost. This instrument is used
only to measure voltages of the order of milli-volts owing to limited amplifier gain. The
circuit diagram for a direct coupled amplifier dc voltmeter using cascaded transistors is
shown in Figure 5. An attenuator is used in input stage to select voltage range. A
transistor is a current controlled device so resistance is inserted in series with the
transistor Q1 to select the voltage range. It can be seen from figure that sensitivity of
voltmeter is 200 kilo ohms/volt neglecting small resistance offered by transistor Q1.
Other values of range selecting resistors are so chosen that sensitivity remains same
for all the ranges. So current drawn from the circuit is only 5micro Ampere.
Two transistors in cascaded connections are used instead of using a single transistor
for amplification in order to increase the sensitivity of the circuit. Transistors Q1 and Q2
are taken complement to each other and are directly coupled to minimize the number of
components in the circuit. They form a direct coupled amplifier. A variable resistance R

SIC1203 MEASUREMENTS & INSTRUMENTATION UNIT - IV ELECTRONIC MEASUREMENTS PREPARED BY : Mr. Bestley Joe, Dr.S.Poornapushpakala & Mr. M.A.Muthaih
is put in the circuit for zero adjustment of the PMMC. It controls the bucking current from
the supply E to buck out the quiescent current. The draw-back of such a voltmeter is
that it has to work under specified ambient temperature to get the required accuracy
otherwise excessive drift problem occurs during operation.
Another circuit diagram of a direct coupled amplifier dc voltmeter using FET in input
stage is shown in Figure 6. In this voltmeter, voltage to be measured is firstly attenuated
with range selector switch to keep the input voltage of amplifier within its level. FET is
used in the input stage of amplifier because of its high input impedance so that is does
not load the circuit of which voltage is to be measured and it also keeps the sensitivity of
voltmeter very high. As FET is a voltage controlled device so resistance network of
attenuator is put in shunt in the circuit. Transistors Q2 and Q3 form the direct coupled
dc amplifier whose output is finally supplied to PMMC meter. When transistors work
within their operating region, the deflection of meter remains proportional to the applied
input voltage. This voltmeter can be used for measurement of voltages of the order of
milli-volts because of sufficient gain of amplifier
Figure 6 Direct coupled amplifier DC voltmeter using FET
Apart from having high input impedance, this circuit has another advantage that when
input voltage exceeds its limit, amplifier gets saturated which limits the current passing
through the PMMC meter. So meter does not burn out.

SIC1203 MEASUREMENTS & INSTRUMENTATION UNIT - IV ELECTRONIC MEASUREMENTS PREPARED BY : Mr. Bestley Joe, Dr.S.Poornapushpakala & Mr. M.A.Muthaih
Chopper Type DC Voltmeter
The simple block diagram of the chopper fed DC voltmeter is shown in Figure 7
Chopper type dc amplifier is used in highly sensitive dc electronic volt-meters. Its block
diagram is shown in Figure 7. Firstly dc input voltage is converted into ac voltage by
chopper modulator and then it is supplied to an ac amplifier, Output of amplifier is then
demodulated to a dc voltage proportional to the original input voltage. Modulator
chopper and demodulator chopper act in anti-synchronism.Chopper system may be
either mechanical or electronic.
Figure 8 Chopper type DC voltmeter
Circuit diagram of an electronic chopper employing photo diodes is shown in
Figure 8. Photo diodes change its resistance under different illumination conditions;
this property of photo diode is used in chopper amplifier. Its resistance changes from
the order of few mega-ohms to few hundred ohms when it is illuminated by a light
source in the dark place. Two neon lamps are used in this circuit which is supplied by
an oscillator for alternate half cycles. Two photo diodes are used in input stage which
acts as half-wave modulators because of its alternate switching action by the neon
lamps at the frequency of oscillator.
Output of chopper modulator is a square wave voltage (proportional to
the input signal) which is supplied to the ac amplifier through a capacitor. Amplified
output is again passed through a capacitor and then fed to chopper demodulator.
Capacitor is used to remove dc drift from the signal. Chopper demodulator gives a
Chopper Modulation
Chopper DC
Modulator PMMC
DC input DC Amplifier
Lowpass Filter

SIC1203 MEASUREMENTS & INSTRUMENTATION UNIT - IV ELECTRONIC MEASUREMENTS PREPARED BY : Mr. Bestley Joe, Dr.S.Poornapushpakala & Mr. M.A.Muthaih
dc output voltage (proportional to the input voltage) which is passed through the low
pass filter to remove any residual ac component. Now this dc output voltage is
supplied to the PMMC meter for measurement of input voltage.
In chopper amplifier dc voltmeter, input impedance is of the order of
hundred mega-ohms and it has sensitivity of one micro-volt per scale division.
AC Voltmeter
Sometimes signal is firstly amplified by ac amplifier and then rectified before
supplying it to dc meter, as shown in Figure 9. In the former case the advantage is
of economical amplifiers and the arrangement is usually used in low priced
voltmeters.
Figure 9 Block diagram of AC voltmeter
Broadly ac voltmeters can be divided into three categories.
1. Average reading AC voltmeters using vacuum tube diode
2. Average reading AC voltmeters using semiconductor diode
3. Peak reading AC voltmeter
Figure 10 AC voltmeter using vacuum tube diode
Normally ac voltmeters are average responding type and the meter is calibrated
in terms of rms values for a sine wave. Since most of the voltage measurements
involve sinusoidal waveform so this method of measuring rms value of ac voltages
works satisfactorily and is less expensive than true rms responding voltmeters.
DC Voltage
to be
measured
Attenuator Multi stage
DC Amplifier
PMMC Rectifier

SIC1203 MEASUREMENTS & INSTRUMENTATION UNIT - IV ELECTRONIC MEASUREMENTS PREPARED BY : Mr. Bestley Joe, Dr.S.Poornapushpakala & Mr. M.A.Muthaih
However, in case of measurement of non-sinusoidal waveform voltage, this meter will
give high or low reading depending on the form factor of the waveform of the voltage to
be measured.
The circuit diagram for an average reading voltmeter using a vacuum tube
diode is shown in Figure 10. The arrangement requires a vacuum tube diode, an high
resistance (of the order of 105 Q.) R and PMMC instrument, all connected in series, as
shown in fig. Resistance R is used to limit the current and make the plate The linear
plate characteristics are essential in order to make the current directly proportional to
voltage. Also because of high series resistance R, plate resistance of vacuum tube
diode becomes negligible and therefore variations in plate resistance do not cause
non-linearity in voltage-current characteristics. Thus, the scale of PMMC instrument is
uniform and independent of variations of tube plate resistance. Voltage across the high
resistance is fed to dc amplifier and output of the amplifier is fed to PMMC instrument.
Circuit diagram of an average reading ac voltmeter using semi-conductor diode is
shown in Figure 11.The diode conducts during the positive half cycle and does not
conduct during the -ve half cycle, as shown in figure. The average current through the
meter will be given by the expression,
Vrms is the effective or rms value of applied voltage and 1.11 is the form factor
of sinusoidal wave. R is multiplied by 2 because the voltmeter operates on half-wave
rectification. It is to be worthnoting that this instrument can be used to indicate dc
voltages but in such a case the instrument readings will have to be multiplied by 2 x
1.11, that is, as the diode conducts all the time. Circuit diagram of an average reading
ac voltmeter using semi-conductor diodes as a full-wave rectifier is shown in figure. In
this case average current through the meter will be Vrms/ 1.11R. Main advantages
associated with these voltmeters are that they are simple in construction, have high
input impedance, low power consumption and uniform scale. Main disadvantage of
these voltmeters is that these operate in audio-frequency range. In radio-frequency
range, distributed capacitance of the high resistance R introduces error in the

SIC1203 MEASUREMENTS & INSTRUMENTATION UNIT - IV ELECTRONIC MEASUREMENTS PREPARED BY : Mr. Bestley Joe, Dr.S.Poornapushpakala & Mr. M.A.Muthaih
readings.
Another disadvantage of such a voltmeter is that due to non-linear volt-ampere
characteristic for lower voltage the readings of the voltmeter at lower voltage are not
correct.
Figure 11 Average Reading AC voltmeter using Semi conductor as half
wave rectifier

SIC1203 MEASUREMENTS & INSTRUMENTATION UNIT - IV ELECTRONIC MEASUREMENTS PREPARED BY : Mr. Bestley Joe, Dr.S.Poornapushpakala & Mr. M.A.Muthaih
Figure 12 Peak reading AC Voltmeter and its waveform
The circuit diagram for peak reading voltmeter using vacuum tube and semi-conductor
diode are shown in figures respectively. In this type of voltmeters capacitor C is charged
to the peak value of the applied voltage and capacitor is discharged through high
resistance R between two peaks of the wave which results in a small fall in capacitor
voltage. But this voltage is again built up during next peak of the wave, as shown in
figure. So, voltage across capacitor C and resistance R remains almost constant and
equal to peak value of the applied voltage.
Either the average voltage across R or the average current through R, can be
used to indicate the peak value of applied voltage. In case the vacuum tube diode (or
semi-conductor diode), series resistance R shunted by capacitance C and PMMC are
connected in series across the source of unknown voltage, the current through the
PMMC will indicate the peak value of applied voltage. In case, the circuit shown in
figure making use of rectifying diode, series resistance R, dc amplifier and PMMC is
employed, the average voltage across R will indicate the peak value of applied voltage.
The high value input resistance also gives more linear relationship between peak
applied voltage and the instrument indication. Also the performance of the diode with
inputs consisting of pulses and modulated waves is improved.

SIC1203 MEASUREMENTS & INSTRUMENTATION UNIT - IV ELECTRONIC MEASUREMENTS PREPARED BY : Mr. Bestley Joe, Dr.S.Poornapushpakala & Mr. M.A.Muthaih
The dc amplifier associated with the diode rectifier should be provided with stabilizing
means in order to prevent drift in the indication of the output meter. Usually a voltage
regulated supply combined with a compensating circuit is used. The use of high series
resistance R, associated with dc amplifier, no doubt results in a high input resistance
but at the same time it implies that an applied voltage of sufficient amplitude is required
so that the system acts as a peak voltage device. The main disadvantage of this system
is with regards to measurement of low voltage. If the applied voltage is too small, then
there is a flow of some current throughout the cycle of the voltage because of high
velocity of emission of electrons, and the input resistance may be a few hundred ohms
and it defeats the very purpose with which electronic instruments are used.
AMMETER
Ammeter means Ampere-meter which measures ampere value. Ampere is the unit of
current so an ammeter is a meter or an instrument which measures current.
Types of Ammeter
Depending on the constructing principle, there are many types of ammeter we get, they
are mainly -
1. Permanent Magnet Moving Coil (PMMC) ammeter
2. Moving Iron (MI) Ammeter
3. Electrodynamometer type Ammeter
4. Rectifier type Ammeter
Depending on this types of measurement we do, we have-
1. DC Ammeter.
2. AC Ammeter.
DC Ammeter are mainly PMMC instruments, MI can measure both AC and DC
currents, also Electrodynamometer type thermal instrument can measure DC and AC,
induction meters are not generally used for ammeter construction due to their higher
cost, inaccuracy in measurement.
Description of Different Types of Ammeters

SIC1203 MEASUREMENTS & INSTRUMENTATION UNIT - IV ELECTRONIC MEASUREMENTS PREPARED BY : Mr. Bestley Joe, Dr.S.Poornapushpakala & Mr. M.A.Muthaih
PMMC Ammeter
Principle PMMC Ammeter: When current carrying conductor placed in a magnetic
field, a mechanical force acts on the conductor, if it is attached to a moving system, with
the coil movement, the pointer moves over the scale. Explanation: As the name
suggests it has permanent magnets which are employed in this kind of measuring
instruments. It is particularly suited for DC measurement because here deflection is
proportional to the current and hence if current direction is reversed, deflection of the
pointer will also be reversed so it is used only for DC measurement. This type of
instrument is called D Arnsonval type instrument. It has major advantage of having
linear scale, low power consumption, high accuracy. Major disadvantage of being
measured only DC quantity, higher cost etc.
Deflecting torque,
Where, B = Flux density in Wb/m². i = Current flowing through the coil in Amp. l =
Length of the coil in m. b = Breadth of the coil in m. N = No of turns in the coil.
Extension of Range in a PMMC Ammeter: Now it looks quite extraordinary that we
can extend the range of measurement in this type of instrument. Many of us will think
that we must buy a new ammeter to measure higher amount of current and also many
of us may think we have to change the constructional feature so that we can measure
higher currents, but there is nothing like that, we just have to connect a shunt resistance
in parallel and the range of that instrument can be extended, this is a simple solution
provided by the instrument.
In the figure I = total current flowing in the circuit in Amp. Ish is the current through the
shunt resistor in Amp. Rm is the ammeter resistance in Ohm.

SIC1203 MEASUREMENTS & INSTRUMENTATION UNIT - IV ELECTRONIC MEASUREMENTS PREPARED BY : Mr. Bestley Joe, Dr.S.Poornapushpakala & Mr. M.A.Muthaih
MI Ammeter
It is a moving iron instrument, used for both AC and DC, It can be used for both
because the deflection θ propotional square of the current so whatever is the direction
of current, it shows directional deflection, further they are classified in two more ways-
1. Attraction type.
2. Repulsion type.
Its torque equation is:
where I is the total current flowing in the circuit in Amp. L is the self inductance of the
coil in Henry. θ is the deflection in Radian.
1. Attraction Type MI Instrument Principle: When an unmagnetised soft iron is
placed in the magnetic field, it is attracted towards the coil, if a moving system
attached and current is passed through a coil, it creates a magnetic field which
attracts iron piece and creates deflecting torque as a result of which pointer moves
over the scale.
2. Repulsion Type MI Instrument Principle: When two iron pieces are magnetized
with same polarity by passing a current than repulsion between them occurs and
that repulsion produces a deflecting torque due to which the pointer moves. The
advantages of MI instruments are they can measure both AC and DC, cheap, low
friction errors, robustness etc. It is mainly used in AC measurement because in DC
measurement error will be more due to hysteresis.
Electrodynamometer Type Ammeter
This can be used to measure both i.e. AC and DC currents. Now we see that we have
PMMC and MI instrument for the measurement of AC and DC currents, a question may
arise - "why do we need Electrodynamometer Ammeter? if we can measure current
accurately by other instrument also?". The answer is Electrodynamometer instruments
have the same calibration for both AC and DC i.e. if it is calibrated with DC , then also

SIC1203 MEASUREMENTS & INSTRUMENTATION UNIT - IV ELECTRONIC MEASUREMENTS PREPARED BY : Mr. Bestley Joe, Dr.S.Poornapushpakala & Mr. M.A.Muthaih
without calibrating we can measure AC. Principle Electrodynamometer Type
Ammeter: There we have two coils, namely fixed and moving coils . If a current is
passed through two coils it will stay in the zero position due to the development of equal
and opposite torque. If somehow, the direction of one torque is reversed as the current
in the coil reverses, an unidirectional torque is produced. For ammeter, the connection
is a series one and φ = 0 Where φ is the phase angle.
Where, I is the amount of current flowing in the circuit in Amp. M = Mutual inductance of
the coil.
They have no hysteresis error, used for both AC and DC measurement, the main
disadvantages are they have low torque/weight ratio, high friction loss, expensive than
other measuring instruments etc.
Rectifier Ammeter
Principle of Rectifier Ammeter: They are used for AC measurement which is
connected to secondary of a current transformer, the secondary current is much less

SIC1203 MEASUREMENTS & INSTRUMENTATION UNIT - IV ELECTRONIC MEASUREMENTS PREPARED BY : Mr. Bestley Joe, Dr.S.Poornapushpakala & Mr. M.A.Muthaih
than primary and connected with a bridge rectifier to moving coil ammeter.
Advantages:
1. It can be used in high frequency also.
2. Uniform scale for most of the ranges.
Disadvantages being error due to temperature decrease in sensitivity in AC operation.
OHMMETER
The ohmmeter means that it is an instrument which measures resistance of a quantity.
Resistance in the electrical sense means the opposition offered by a substance to the
current flow in the device. Every device has a resistance, it may be large or small and it
increases with temperature for conductors, however for semiconducting devices the
reverse is true. There are many types of ohmmeters available such as
1. Series ohmmeter.
2. Shunt ohmmeter.
3. Multi range ohmmeter.
Working Principle of Ohmmeter
The instrument is connected with a battery, a series adjustable resistor and an
instrument which gives the reading. The resistance to be measured is connected at
terminal ob. When the circuit is completed by connecting output resistance, the circuit
current flows and so the deflection is measured.
Series type Ohmmeter

SIC1203 MEASUREMENTS & INSTRUMENTATION UNIT - IV ELECTRONIC MEASUREMENTS PREPARED BY : Mr. Bestley Joe, Dr.S.Poornapushpakala & Mr. M.A.Muthaih
The series type ohmmeter consists of a current limiting resistor R1, Zero adjusting
resistor R2, EMF source E, Internal resistance of D’Arsonval movement Rm and the
resistance to be measured R. When there is no resistance to be measured, current
drawn by the circuit will be maximum and the meter will show a deflection. By adjusting
R2 the meter is adjusted to a full scale current value since the resistance will be zero at
that time. The co-responding pointer indication is marked as zero. Again when the
terminal AB is opened it provides very high resistance and hence almost zero current
will flow through the circuit. In that case the pointer deflection is zero which is marked at
very high value for resistance measurement. So a resistance between zeros to a very
high value is marked and hence can be measured. So, when a resistance is to be
measured, the current value will be somewhat less than the maximum and the
deflection is recorded and accordingly resistance is measured. This method is good but
it posses certain limitations such as the decrease in potential of the battery with its use
so adjustment must be made for every use. Te meter may not read zero when terminals
are shorted, these types of problem may arise which is counteracted by the adjustable
resistance connected in series with the battery.

SIC1203 MEASUREMENTS & INSTRUMENTATION UNIT - IV ELECTRONIC MEASUREMENTS PREPARED BY : Mr. Bestley Joe, Dr.S.Poornapushpakala & Mr. M.A.Muthaih
Shunt type Ohmmeter
In this type of meters we have a battery source and an adjustable resistor is connected
in series with the source. We have connected the meter in parallel to the resistance
which is to be measured. There is a switch by the use of which we can on or off the
circuit. The switch is opened when it is not in use. When the resistance to be measured
is zero, the terminals A and F are shorted so the current through the meter will be zero.
The zero position of the meter denotes the resistance to be zero. When the resistance
connected is very high, then a small current will flow the terminal AF and hence full
scale current is allowed to flow through the meter by adjusting the series resistance
connected with the battery. So, full scale deflection measures very high resistance.
When the resistance to be measured is connected between A and F, The pointer shows
a deflection by which we can measure the resistance values. In this case also, the
battery problem may arise which can be counteracted by adjusting the resistance. The
meter may have some error due to its repeated use also.

SIC1203 MEASUREMENTS & INSTRUMENTATION UNIT - IV ELECTRONIC MEASUREMENTS PREPARED BY : Mr. Bestley Joe, Dr.S.Poornapushpakala & Mr. M.A.Muthaih
Multi range Ohmmeter
This instrument provides the reading up to a very wide range. In this case we have to
select the range switch according to our requirement. An adjuster is provided so that we
can adjust the initial reading to be zero. The resistance to be measured is connected in
parallel to the meter. The meter is adjusted so that it shows full scale deflection when
the terminals in which the resistance connected is full scale range connected through
the range switch. When the resistance is zero or short circuit, there is no current flow
through the meter and hence no deflection. Suppose we have to measure a resistance
under 1 ohm, then the range switch is selected at 1 ohm range at first. Then that
resistance is connected in parallel and the corresponding meter deflection is noted. For
1 ohm resistance it shows full scale deflection but for the resistance other that 1 ohm it
shows a deflection which is less than the full load value and hence resistance can be
measured. This is the most suitable method of all the ohmmeters as we can get
accurate reading in this type of meters. So this meter is most widely used now days.

SIC1203 MEASUREMENTS & INSTRUMENTATION UNIT - IV ELECTRONIC MEASUREMENTS PREPARED BY : Mr. Bestley Joe, Dr.S.Poornapushpakala & Mr. M.A.Muthaih
Electronic Multimeters
A multimeter is an electronic instrument which can measure resistances, currents
and voltages. It is an indispensable instrument and can be used for measuring d.c. as
well as a.c. voltages and currents. Multimeter is the most inexpensive equipment and
can make various electrical measurements with reasonable accuracy.
Construction
A multimeter consists of an ordinary pivoted type of moving coil galvanometer.
This galvanometer consists of a coil pivoted on jeweled bearings between the poles of a
permanent magnet. The indicating needle is fastened to the coil. When electric current
is passed through the coil, mechanical force acts and the pointer moves over the scale.
Functions
A multimeter can measure voltages, currents and resistances. To achieve this
objective, proper circuits are incorporated with the galvanometer. The galvanometer in a
multimeter is always of left zero type i.e. normally its needle rests in extreme left
position as compared to centre zero position of ordinary galvanometers.
(i) Multimeter as voltmeter.
When a high resistance is connected in series with a galvanometer, it
becomes a voltmeter. Fig. 5 (i) shows a high resistance R connected in series
with the galvanometer of resistance G. If Ig is the full scale deflection current,
then the galvanometer becomes a voltmeter of range 0 − V volts. The
required value of series resistance R is given by:
V = Ig R + Ig G
or V/Ig = R + G
or R = V/Ig – G

SIC1203 MEASUREMENTS & INSTRUMENTATION UNIT - IV ELECTRONIC MEASUREMENTS PREPARED BY : Mr. Bestley Joe, Dr.S.Poornapushpakala & Mr. M.A.Muthaih
Fig. 5.(i)
For maximum accuracy, a multimeter is always provided with a number of
voltage ranges. This is achieved by providing a number of high resistances in the
multimeter as shown in Fig.5 (ii). Each resistance corresponds to one voltage
range. With the help of selector switch S, we can put any resistance (R1, R2 and
R3) in series with the galvanometer. When d.c. voltages are to be measured, the
multimeter switch is turned on to d.c. position. This puts the circuit shown in Fig.
5 (ii) in action. By throwing the range selector switch S to a suitable position, the
given d.c. voltage can be measured.
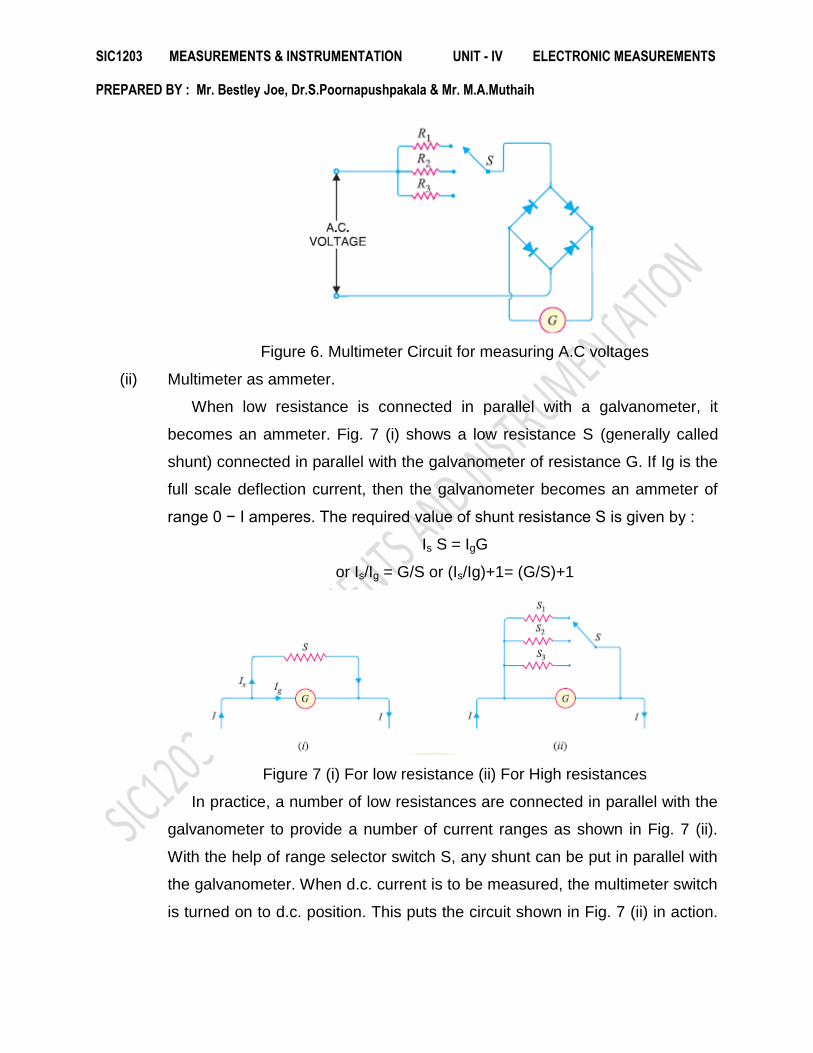
The multimeter can also measure a.c. voltages. To permit it to perform this
function, a full-wave rectifier is used as shown in Fig. 6. The rectifier converts a.c.
into d.c. for application to the galvanometer. The desired a.c. voltage range can
be selected by the switch S. When a.c. voltage is to be measured, the multimeter
switch is thrown to a.c. position. This puts the circuit shown in Fig. 6 in action. By
throwing the range selector switch S to a suitable position, the given a.c. voltage
can be measured. It may be mentioned here that a.c. voltage scale is calibrated
in r.m.s. values. Therefore, the meter will give the r.m.s. value of the a.c. voltage
under measurement.
SIC1203 MEASUREMENTS & INSTRUMENTATION UNIT - IV ELECTRONIC MEASUREMENTS PREPARED BY : Mr. Bestley Joe, Dr.S.Poornapushpakala & Mr. M.A.Muthaih
Figure 6. Multimeter Circuit for measuring A.C voltages
(ii) Multimeter as ammeter.
When low resistance is connected in parallel with a galvanometer, it
becomes an ammeter. Fig. 7 (i) shows a low resistance S (generally called
shunt) connected in parallel with the galvanometer of resistance G. If Ig is the
full scale deflection current, then the galvanometer becomes an ammeter of
range 0 − I amperes. The required value of shunt resistance S is given by :
Is S = IgG
or Is/Ig = G/S or (Is/Ig)+1= (G/S)+1
Figure 7 (i) For low resistance (ii) For High resistances
In practice, a number of low resistances are connected in parallel with the
galvanometer to provide a number of current ranges as shown in Fig. 7 (ii).
With the help of range selector switch S, any shunt can be put in parallel with
the galvanometer. When d.c. current is to be measured, the multimeter switch
is turned on to d.c. position. This puts the circuit shown in Fig. 7 (ii) in action.

SIC1203 MEASUREMENTS & INSTRUMENTATION UNIT - IV ELECTRONIC MEASUREMENTS PREPARED BY : Mr. Bestley Joe, Dr.S.Poornapushpakala & Mr. M.A.Muthaih
By throwing the range selector switch S to a suitable position, the desired d.c.
current can be measured.
Figure 8. Measuring A.C
The multimeter can also be used to measure alternating current. For this
purpose, a full – wave rectifier is used as shown in Fig. 22.4. The rectifier
converts a.c. into d.c. for application to the galvanometer. The desired current
range can be selected by switch S. By throwing the range selector switch S to
a suitable position, the given a.c. current can be measured. Again, the a.c.
current scale is calibrated in r.m.s. values so that the instrument will give
r.m.s. value of alternating current under measurement.
Applications of Multimeter
It is used
(i) For checking the circuit continuity. When the multimeter is employed as
continuity- checking device, the ohmmeter scale is utilised and the equipment
to be checked is shut off or disconnected from the power mains.
(ii) For measuring d.c. current flowing through the cathode, plate, screen and
other vacuum tube circuits.
(iii) For measuring d.c. voltages across various resistors in electronic circuits.
(iv) For measuring a.c. voltages across power supply transformers.
For ascertaining whether or not open or short circuit exists in the circuit under study.

SIC1203 MEASUREMENTS & INSTRUMENTATION UNIT - IV ELECTRONIC MEASUREMENTS PREPARED BY : Mr. Bestley Joe, Dr.S.Poornapushpakala & Mr. M.A.Muthaih
TYPES OF VOLTMETER
DIFFERENTIAL VOLTMETER
The differential voltmeter technique, is one of the most common and accurate methods
of measuring unknown voltages. In this technique, the voltmeter is used to indicate the
difference between known and unknown voltages, i.e. an unknown voltage is compared
to a known voltage. The figure shows a basic circuit of a differential voltmeter based on
the potentiometer method; hence it is also called as a potentiometric voltmeter.
In this method the potentiometer is varied until the voltage across it equals the unknown
voltage, which is indicated by the null indicator reading zero. Under null conditions, the
meter draws current from neither the reference source nor the unknown voltage source,
and hence the differential voltmeter presents infinite impedance to the unknown source.
To detect small differences the meter movement must be sensitive, but it need not be
calibrated, since only zero has to be indicated. The reference source used is usually a 1
V dc standard source or a zener controlled precision supply. A high voltage reference
supply is used for measuring high voltages.
The usual practice, however is to employ voltage dividers or attenuators across an
unknown source to reduce the voltage. The input voltage divider has relatively low input
impedance, especially for unknown voltages much higher than the reference standard.
The attenuation will have a loading effect and the input resistance of voltmeter is not
infinity when attenuator is used.
SIC1203 MEASUREMENTS & INSTRUMENTATION UNIT - IV ELECTRONIC MEASUREMENTS PREPARED BY : Mr. Bestley Joe, Dr.S.Poornapushpakala & Mr. M.A.Muthaih
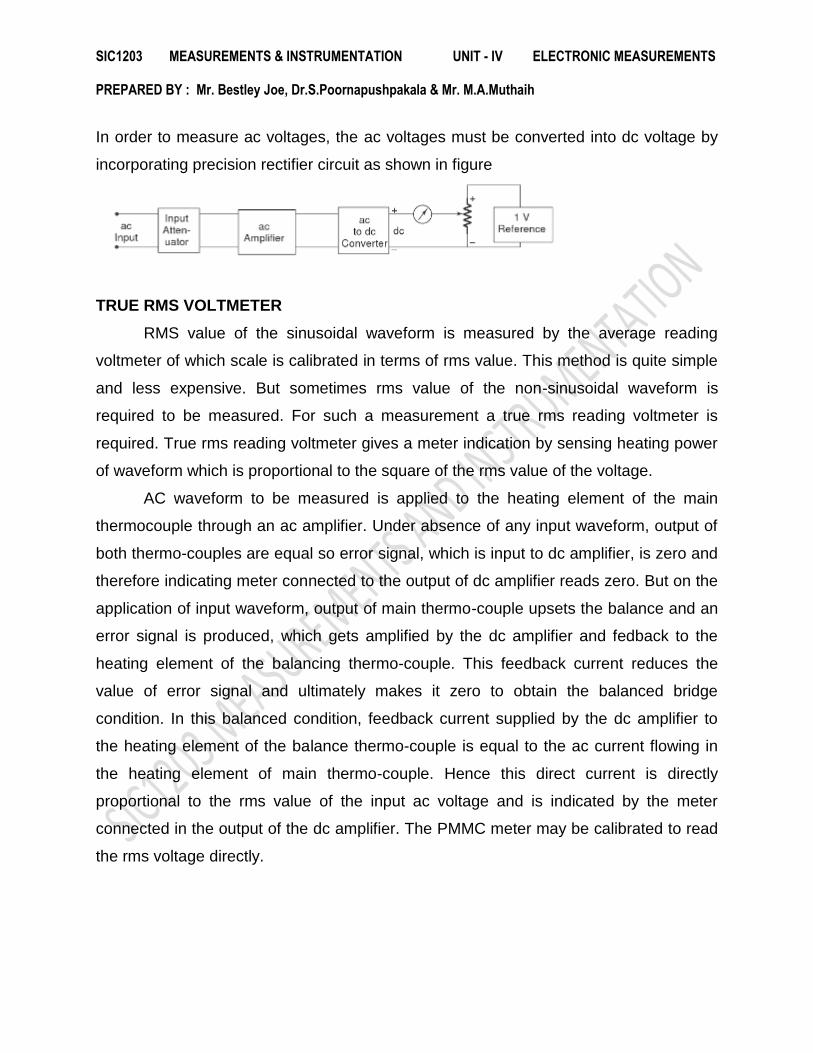
In order to measure ac voltages, the ac voltages must be converted into dc voltage by
incorporating precision rectifier circuit as shown in figure
TRUE RMS VOLTMETER
RMS value of the sinusoidal waveform is measured by the average reading
voltmeter of which scale is calibrated in terms of rms value. This method is quite simple
and less expensive. But sometimes rms value of the non-sinusoidal waveform is
required to be measured. For such a measurement a true rms reading voltmeter is
required. True rms reading voltmeter gives a meter indication by sensing heating power
of waveform which is proportional to the square of the rms value of the voltage.
AC waveform to be measured is applied to the heating element of the main
thermocouple through an ac amplifier. Under absence of any input waveform, output of
both thermo-couples are equal so error signal, which is input to dc amplifier, is zero and
therefore indicating meter connected to the output of dc amplifier reads zero. But on the
application of input waveform, output of main thermo-couple upsets the balance and an
error signal is produced, which gets amplified by the dc amplifier and fedback to the
heating element of the balancing thermo-couple. This feedback current reduces the
value of error signal and ultimately makes it zero to obtain the balanced bridge
condition. In this balanced condition, feedback current supplied by the dc amplifier to
the heating element of the balance thermo-couple is equal to the ac current flowing in
the heating element of main thermo-couple. Hence this direct current is directly
proportional to the rms value of the input ac voltage and is indicated by the meter
connected in the output of the dc amplifier. The PMMC meter may be calibrated to read
the rms voltage directly.

SIC1203 MEASUREMENTS & INSTRUMENTATION UNIT - IV ELECTRONIC MEASUREMENTS PREPARED BY : Mr. Bestley Joe, Dr.S.Poornapushpakala & Mr. M.A.Muthaih
Figure 1. True RMS reading voltmeter
VECTOR VOLTMETER
The vector voltmeter is basically a new type of amplitude and phase measuring device.
It uses two samplers to sample the two waves whose amplitude and relative phase are
to be measures. It measures the voltages at two different points in the circuit and also
measures the phase difference between these voltages at these two points. In this
voltmeter, two RF signals of the same fundamental frequency (1MHz to GHz) are
converted to two IF signals. The amplitudes, waveforms and the phase relations of IF
signals are same as that of RF signals. Thus, the fundamental components of the IF
signal have the same amplitude and phase relationships as the fundamental
components RF signals. These fundamental components are filtered from the IF signals
and are measured by a voltmeter and phase meter.

SIC1203 MEASUREMENTS & INSTRUMENTATION UNIT - IV ELECTRONIC MEASUREMENTS PREPARED BY : Mr. Bestley Joe, Dr.S.Poornapushpakala & Mr. M.A.Muthaih
WAVE ANALYZER
A wave analyzer is an instrument designed to measure relative amplitudes of
single frequency components in a complex waveform. It can analysis of waveforms
includes the determination of amplitude, frequency and phase angle of the harmonic
components.
Types of wave analyzer
1. Frequency selective wave analyzer.
2. Heterodyne wave analyzer.
Frequency selective wave analyzer
The waveform to be analyzed is passed through an adjustable attenuator.
This acts as a range multiplier. The driver amplifier feeds the waveform to a high
Q filter. This filter consists of cascade arrangement of RC resonant sections and
filter amplifiers. The capacitors are used for range changing. The potentiometer
is used to change frequency within the selected pass band. The entire AF range
is covered in decade steps by the switching capacitors in the RC section The
final amplifier stage supplies the selected signal to the meter circuit and to an
untuned buffer amplifier. The function of buffer amplifier is to drive the output

SIC1203 MEASUREMENTS & INSTRUMENTATION UNIT - IV ELECTRONIC MEASUREMENTS PREPARED BY : Mr. Bestley Joe, Dr.S.Poornapushpakala & Mr. M.A.Muthaih
devices, such as the recorders, electronic counters etc. The analyzer input must
have low input distortion. The meter has several voltage ranges as well as
decibel scale marked on it. It is driven by an average reading rectifier type
detector.
Figure 1. Frequency selective wave analyzer
Heterodyne wave analyzer
This is RF range analyzer works on the principle of mixing i.e.
heterodyning. In this type of wave analyzer the input signal is heterodyned to a
higher intermediate frequency (IF) by an internal local oscillator. Tuning the local
oscillator shifts the various signal frequency components into the pass band of
the IF amplifier. The output of the IF amplifier is then rectified and applied to the
metering circuit. The input is applied first to the attenuator section. This gives the
output frequency in the range of 0 to 18 MHz The untuned amplifier amplifies this
signal and gives it to the first mixer. The first mixer heterodynes the input with the
frequency from local oscillator. This oscillator has frequency range 30-48 MHz

SIC1203 MEASUREMENTS & INSTRUMENTATION UNIT - IV ELECTRONIC MEASUREMENTS PREPARED BY : Mr. Bestley Joe, Dr.S.Poornapushpakala & Mr. M.A.Muthaih
The output of the first mixer difference frequency of 30 MHz.The IF amplifier
amplifies this signal and gives it to the second mixer. The second mixer
heterodynes the signal with 30 MHz frequency crystal oscillator. Thus at the
output of second mixer the zero difference frequency is obtained. The active filter
having controlled bandwidth and symmetrical slopes of 72 dB per octave, then
passes the selected component to the meter amplifier and detector. The output
from the meter detector is then used to obtain final indication on the output meter
which is having a decibel calibrated scale. The output from detector may be
applied to a recording device.
Figure 2. Heterodyne wave analyzer
Applications of wave analyzer
To measure the harmonic distortion of an amplifier
To carry out complete harmonic analysis
To measure the signal energy with the well-defined bandwidth.
SIC1203 MEASUREMENTS & INSTRUMENTATION UNIT - IV ELECTRONIC MEASUREMENTS PREPARED BY : Mr. Bestley Joe, Dr.S.Poornapushpakala & Mr. M.A.Muthaih
SPECTRUM ANALYZERS
Spectrum analysis is defined as the study of energy distribution across the
frequency spectrum of a given electrical signal. The spectrum analysis is divided into
two major categories on account of instrumentation limitations and capabilities.
They are:
Audio frequency (AF) analysis, and
Radio frequency (RF) spectrum analysis.
The RF spectrum analysis covers a frequency range of 10 MHz to 40 GHz, and
hence is more important, because it includes the vast majority of communication,
navigation, radar, and industrial instrumentation frequency bands. The spectrum
analyzers are sophisticated instruments which are capable of portraying graphically
the amplitude as a function of frequency in a portion of RF spectrum. These
instruments find wide apphcat10ns for measurement of attenuation, FM dev1atton,
and frequency in pulse studies
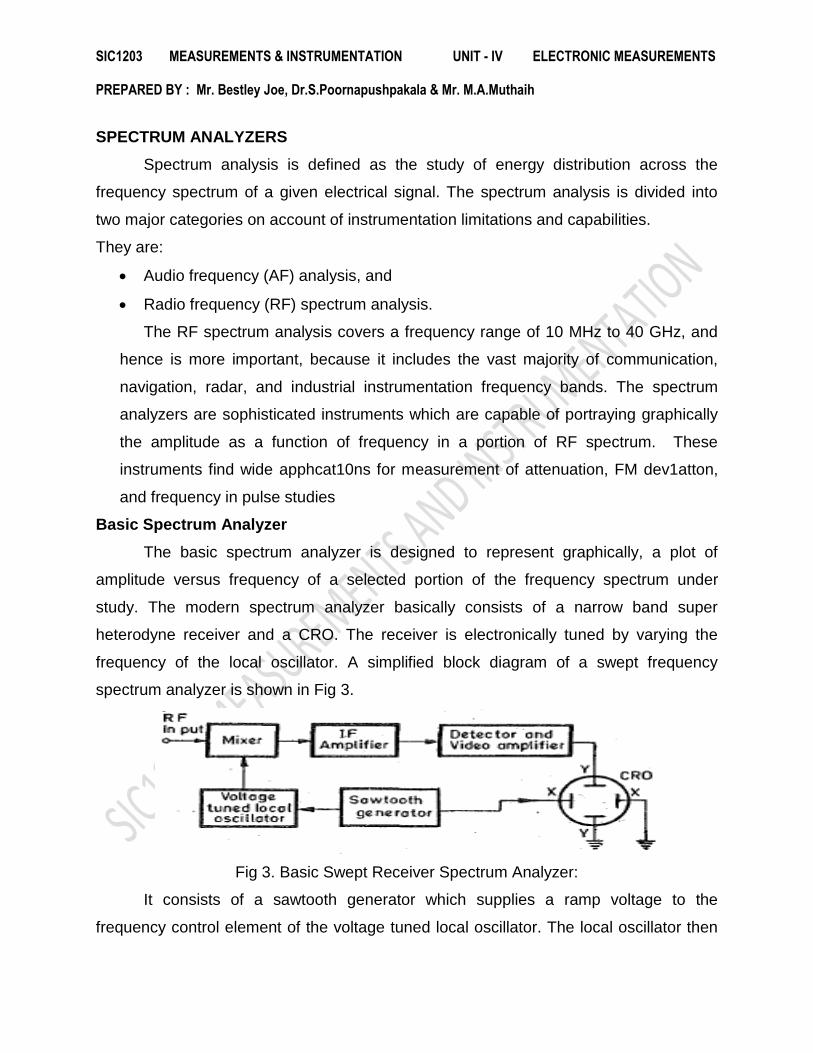
Basic Spectrum Analyzer
The basic spectrum analyzer is designed to represent graphically, a plot of
amplitude versus frequency of a selected portion of the frequency spectrum under
study. The modern spectrum analyzer basically consists of a narrow band super
heterodyne receiver and a CRO. The receiver is electronically tuned by varying the
frequency of the local oscillator. A simplified block diagram of a swept frequency
spectrum analyzer is shown in Fig 3.
Fig 3. Basic Swept Receiver Spectrum Analyzer:
It consists of a sawtooth generator which supplies a ramp voltage to the
frequency control element of the voltage tuned local oscillator. The local oscillator then

SIC1203 MEASUREMENTS & INSTRUMENTATION UNIT - IV ELECTRONIC MEASUREMENTS PREPARED BY : Mr. Bestley Joe, Dr.S.Poornapushpakala & Mr. M.A.Muthaih
sweeps through its frequency band at a recurring linear rate. The same sawtooth
voltage is simultaneously applied to the horizontal plates of the CRO. The RF signal to
be tested is applic4 to the input of the mixer stage.
The sawtooth generator makes the local ·oscillator sweep through it; frequency
band to beat with the input signal to produce the desired intermediate frequency (IF). An
IF component is produced only when the corresponding component is present in the RF
input signal The resulting IF signals are amplified and then detected. After that they are
applied to the vertical deflection plates of the CRO, thereby producing a display of
amplitude versus frequency on the screen.
DISTORTION ANALYZERS
Generally, the output waveform of an electronic device, such as an amplifier,
should become an exact replica of the input waveform. Distortions may be a result of
the inherent non-linear characteristics of components used in the electronic circuit. Non-
linear behavior of circuit elements introduces harmonics in the output waveform and the
resultant distortion is often termed Harmonic Distortion (HD).
Types of Distortion
The various types of distortions which occur are explained below.
1. Frequency Distortion
This distortion occurs due to the amplification factor of the amplifier is different for
different frequencies.
2. Phase distortion
This distortion occurs due to the presence of energy-storage elements in the
system, which cause the output signal to be displaced in phase with the input signal. If
signals of all frequencies are displaced by the same amount, the phase shift distortion
would not be observed. However, in actual practice, signals at different frequencies are
shifted in phase by different angles and therefore, the phase-shift distortion becomes
noticeable.
3. Amplitude Distortion

SIC1203 MEASUREMENTS & INSTRUMENTATION UNIT - IV ELECTRONIC MEASUREMENTS PREPARED BY : Mr. Bestley Joe, Dr.S.Poornapushpakala & Mr. M.A.Muthaih
Harmonic distortion occurs due to the fact that the amplifier generates harmonics
of the fundamental of the input signal. Harmonics always give rise to amplitude
distortion, for example, when an amplifier is overdriven and clips the input signals.
4. Inter-modulation Distortion
This type of distortion occurs as a consequence of interaction or heterodyning of
two frequencies, giving an output which is the sum or difference of the two original
frequencies.
5. Cross-over Distortion
This type of distortion occurs in push-pull amplifier due to incorrect bias levels.
6. Total Harmonic Distortion
A non-linear system produces harmonics of an input sine wave, the harmonics consists
of a sine wave with frequencies which are multiples of the fundamental of the input
signal. The Total Harmonic Distortion (THD) is measured in terms of the harmonic
contents of the wave, as given by
𝑇𝐻𝐷 =[∑ 𝐻𝑎𝑟𝑚𝑜𝑛𝑖𝑐𝑠 2]1/2
𝐹𝑢𝑛𝑑𝑎𝑚𝑒𝑛𝑡𝑎𝑙𝑋100%
In a measurement system, noise is read in addition to harmonics, and the total
waveform, consisting of harmonics, noise and fundamental, is measured instead of the
fundamental alone. Therefore, the measured value of the total harmonic distortion
(THDm) is given by
𝑇𝐻𝐷𝑚 =[∑ 𝐻𝑎𝑟𝑚𝑜𝑛𝑖𝑐𝑠 2 + (𝑁𝑜𝑖𝑠𝑒2)]1/2
[∑ 𝐹𝑢𝑛𝑑𝑎𝑚𝑒𝑛𝑡𝑎𝑙 2 + (𝑁𝑜𝑖𝑠𝑒2)]1/2
Figure 4 shows the block diagram of a harmonic distortion analyser which is used to
measure THD. The signal source has very low distortion and this can be checked by
reading its output distortion by connecting directly into the analyser. The signal from the
source is fed into the amplifier under test. This generates harmonics and the original
fundamental frequency. The fundamental frequency is removed by a notch filter. In the
manual system, as shown in Figure 4 (a), the switch S is first placed in the position 1
and the total content of fundamental and harmonics (ET) is measured. Then the switch

SIC1203 MEASUREMENTS & INSTRUMENTATION UNIT - IV ELECTRONIC MEASUREMENTS PREPARED BY : Mr. Bestley Joe, Dr.S.Poornapushpakala & Mr. M.A.Muthaih
is moved to the position 2 to measure just the harmonics EH. The value of THD is then
found using following equation:
The meter can be calibrated by putting the switch in the position 1 and adjusting
the reading for full scale deflection. With the switch position 2, the meter reading is now
proportional to THD. Figure 4(b) shows an alternative arrangement, where the value of
ET and EH are read simultaneously and their ratio calculated and displayed as THD on
the indicator. For good accuracy, the notch filter must have excellent rejection and high
pass characteristics. It should attenuate the fundamental by 100 db or more and the
harmonics by less than 1 db. The filter also needs to be tuned accurately to the
fundamental of the signal source. This is difficult to achieve manually and most
distortion analysers do this automatically. A common form of notch filter is a Wien
bridge. This balances at one frequency only and at this frequency, the output voltage at
the bridge null detector is minimum.
Figure. 4 Simplified block diagrams of fundamental suppression harmonic distortion
analysers: (a) Manual reading (b) Ratio reading

SIC1203 MEASUREMENTS & INSTRUMENTATION UNIT - IV ELECTRONIC MEASUREMENTS PREPARED BY : Mr. Bestley Joe, Dr.S.Poornapushpakala & Mr. M.A.Muthaih
𝑇𝐻𝐷 =𝐸
𝐸𝑡𝑋100%