Embed Size (px)
Citation preview

Unit 3:
Aggregate Demand and
Supply and Fiscal Policy
1

Aggregate means “added all together.”
When we use aggregates
we combine all prices and all quantities.
Aggregate Demand is all the goods and services
(real GDP) that buyers are willing and able to
purchase at different price levels.
The Demand for everything by everyone in the US. There is an inverse relationship between
price level and Real GDP.
If the price level:
•Increases (Inflation), then real GDP demanded falls.
•Decreases (deflation), the real GDP demanded
increases.
What is Aggregate Demand?
2

Aggregate Demand Curve
Price
Level
Real domestic output (GDPR)
AD
3
AD is the demand by consumers,
businesses, government, and
foreign countries
What definitely doesn’t shift
the curve?
Changes in price level cause
a move along the curve
= C + I + G + Xn

Why is AD downward sloping?
1.The Wealth Effect- • Higher price levels reduce the purchasing power of
money. This decreases the quantity of expenditures
• Lower price levels increase purchasing power and
increase expenditures
Example:
• If the price level doubles, people are going to buy less
stuff because they have less purchasing power.
• So…price level goes up, GDP demanded goes down.
4

2. Interest-Rate Effect • When the price level increases, lenders
need to charge higher interest rates to get a REAL return on their loans.
• Higher interest rates discourage consumer spending and business investment. WHY?
• Example: An increase in prices leads to an increase in the interest rate from 5% to 25%. You are less likely to take out loans to improve your business.
• Result…Price Level goes up, GDP demanded goes down (and Vice Versa).
5
Why is AD downward sloping?

3. Foreign Trade Effect • When U.S. price level rises, foreign buyers
purchase fewer U.S. goods and Americans
buy more foreign goods
• Exports fall and imports rise causing real
GDP demanded to fall. (XN Decreases) • Example: If prices triple in the US, Canada will no
longer buy US goods causing quantity demanded of
US products to fall.
• Again, Price Level goes up, GDP demanded goes
down (and Vice Versa).
6
Why is AD downward sloping?

Shifters of
Aggregate Demand
GDP = C + I + G + Xn
7

Shifts in Aggregate Demand
Price
Level
Real domestic output (GDPR)
AD
8
An increase in spending shift AD right, and decrease in
spending shifts it left
= C + I + G + Xn
AD1
AD2

Shifters of Aggregate Demand 1. Change in Consumer Spending
Increase in Disposable Income (Higher incomes…)
Consumer Expectations (People fear a recession…)
Household Indebtedness (More consumer debt…)
Taxes (Decrease in income taxes…)
2. Change in Investment Spending Real Interest Rates (Price of borrowing $)
(If interest rates increase…)
(If interest rates decrease…)
Future Business Expectations (High expectations…)
Productivity and Technology (New robots…)
Business Taxes (Higher corporate taxes means…)
9

Shifters of Aggregate Demand 3. Change in Government Spending
(War…)
(Nationalized Heath Care…)
(Decrease in defense spending…)
10
4. Change in Net Exports (X-M) Exchange Rates
(If the us dollar depreciates relative to the euro…)
National Income Compared to Abroad
(If a major importer has a recession…)
(If the US has a recession…)
“If the US get a cold, Canada gets Pneumonia”
AD = GDP = C + I + G + Xn

Unit 3:
Aggregate Demand/Supply
and Fiscal Policy
11

What is Aggregate Supply? Aggregate Supply is the amount of goods and
services (real GDP) that firms will produce in an
economy at different price levels.
The supply for everything by all firms. Aggregate Supply differentiates between short run and long-run and has two different curves.
Short-run Aggregate Supply •Wages and Resource Prices will not increase as price levels increase.
Long-run Aggregate Supply •Wages and Resource Prices will increase as price levels increase.
12

Short-Run Aggregate Supply In the Short Run, wages and resource prices will NOT
increase as price levels increase.
Example:
• If a firm currently makes 100 units that are sold for
$1 each. The only cost is $80 of labor.
How much is profit?
• Profit = $100 - $80 = $20
What happens in the SHORT-RUN if price level
doubles?
• Now 100 units sell for $2, TR=$200.
How much is profit?
• Profit = $120
With higher profits, the firm has the incentive to
increase production. 13

Aggregate Supply Curve
Price
Level
Real domestic output (GDPR)
AS
14
AS is the
production of all
the firms in the
economy

Long-Run Aggregate Supply
In the Long Run, wages and resource prices WILL increase as price levels increase.
Same Example:
• The firm has TR of $100 and uses $80 of labor.
• Profit = $20.
What happens in the LONG-RUN if price level
doubles?
• Now TR=$200
•In the LONG RUN workers demand higher wages
to match prices. So labor costs double to $160
• Profit = $40, but REAL profit is unchanged.
If REAL profit doesn’t change
the firm has no incentive to increase output. 15

Long run Aggregate Supply
Price level
GDPR
In Long Run, price level increases but GDP doesn’t
LRAS
Long-run
Aggregate
Supply
QY
Full-Employment
(Trend Line)
We also assume that in the long run the economy
will be producing at full employment. 16

Shifters Aggregate Supply
I. R. A. P.

Shifts in Aggregate Supply
Price
Level
Real domestic output (GDPR)
AS
18
An increase or decrease in national production can shift
the curve right or left
AS1
AS2

Shifters of Aggregate Supply
1. Change in Inflationary Expectations If an increase in AD leads people to expect higher
prices in the future. This increases labor and
resource costs and decreases AS.
(If people expect lower prices…)
2. Change in Resource Prices
Prices of Domestic and Imported Resources
(Increase in price of Canadian lumber…)
(Decrease in price of Chinese steel…)
Supply Shocks
(Negative Supply shock…)
(Positive Supply shock…) 19
Shifters of Aggregate Supply 3. Change in Actions of the Government
(NOT Government Spending)
Taxes on Producers
(Lower corporate taxes…)
Subsidies for Domestic Producers
(Lower subsidies for domestic farmers…)
Government Regulations
(EPA inspections required to operate a farm…)
4. Change in Productivity
Technology
(Computer virus that destroy half the computers…)
(The advent of a teleportation machine…)
20

Unit 3:
Aggregate Demand and
Supply and Fiscal Policy
21

Shifters of Aggregate Demand
Change in Consumer Spending
Change in Investment Spending
Change in Government Spending
Net EXport Spending
AD = C + I + G + X
Shifters of Aggregate Supply
AS = I + R + A + P
Change in Resource Prices
Change in Actions of the Government
Change in Productivity (Investment) 22
Change in Inflationary Expectations

Practice
23

B A
D
A
D
B
A
A
C A major increase in productivity. A
Answer and identify shifter: C.I.G.X or I.R.A.P
24

Inflationary and Recessionary Gaps
25
Putting AD and AS together to get
Equilibrium Price Level and Output

Ca
pit
al G
oo
ds
Consumer Goods
The economy can only be in one of three places at any time
26
Full Employment
5% Unemployment
Max Capacity
0% Unemployment
Time
Real
GDP
Real GDP
Recessionary Gap
Full Employment
Inflationary Gap

What Happens In
the Short-Run?
27

Price
Level
28
AD
AS
Example: Assume the government increases
spending. What happens to PL and Output?
GDPR
LRAS
QY
AD1
PLe
PL1
Q1
PL and Q will
Increase

Price
Level
29
AS
Inflationary Gap
GDPR
LRAS
QY
AD1
PL1
Q1
Output is high and unemployment is less than NRU
Actual GDP
above potential
GDP

Price
Level
30
AD
AS
GDPR QY
PLe
PL1
Q1
LRAS
AD1
Example: Assume consumer spending falls.
What happens to PL and Output?
PL and Q will
decrease

Price
Level
31
AS
GDPR QY
PL1
Q1
LRAS
AD1
Actual GDP
below potential
GDP
Recessionary Gap
Output low and unemployment is more than NRU

Price
Level
32
AD
AS
GDPR QY
PLe
PL1
Q1
LRAS AS1
Stagflation Stagnate Economy
+ Inflation
Example: If there is a negative “supply shock”
of oil. What happens to PL and Output?
Still considered
recessionary gap

AD and AS Practice
Worksheet
33

What Happens In
the Long-Run?
34
35
AD
AS
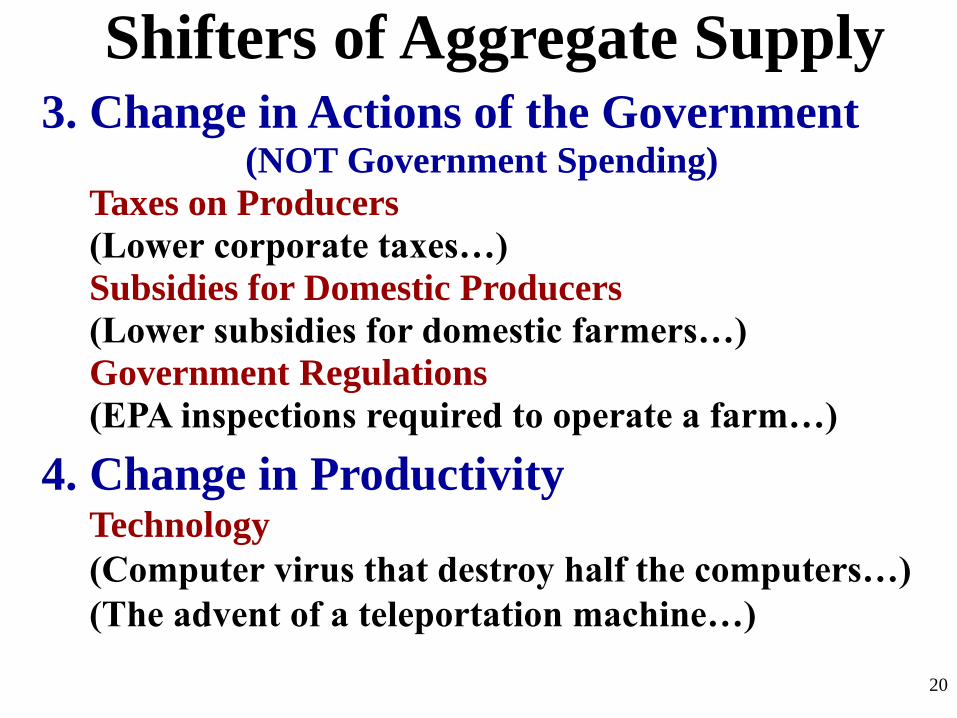
If consumer spending increases, what will
happen in the short-run and in the long-run?
GDPR QY
AD1
PLe
PL1
Q1
LRAS
In the long-run, wages and costs increase
AS1
PL2
Time
Real
GDP Price Level
Real
GDP

36
If consumer spending increases, what will
happen in the short-run and in the long-run?
GDPR QY
AD1
LRAS
In the long-run, wages and costs increase
AS1
PLe
Time
Real
GDP Price Level
Real
GDP

37
AD
AS
If consumer spending decreases, what will
happen in the short-run and in the long-run?
GDPR QY
AD2
PLe
PL1
Q1
LRAS
In the long-run, wages & costs eventually decrease
AS2
PL2
Time
Real
GDP Price Level
Real
GDP

Practice
38

Price
Level
39
AD
AS
#1. Assume there is an increase in government
spending. What happens to PL and output in the
short- run?
GDPR
LRAS
QY
AD1
PLe
PL1
Q1
PL and Q will
Increase

Price
Level
40
AD
AS
#2. Consumer expectations fall and consumer
spending plummets. What happens to price level
and output in the long-run?
GDPR
LRAS
QY
AD AD1
PL1
Q1
AS1
PL2
PLe Price Level
decreases and
output stay s the
same

Price
Level
41
AD
AS
#3. If consumer spending increases, what happens
to price level and output in the long-run?
GDPR QY
AD1
PLe
PL1
Q1
LRAS AS1
PL2 Price level
increases and
output stays the
same

Economic Growth
42

43
AD
AS
If investment increases, what happens in the short-run and long-run?
GDPR QY
AD1
PLe
PL1
Q1
LRAS
Capital Stock- Machinery and tools purchased by businesses that increase their output
AS1
Price Level
Ca
pit
al G
oo
ds
Consumer Goods
The PPC shifts outward since
producers can make more
LRAS1
QY1

44 GDPR
AD1
PLe
An increase in consumption or government spending doesn’t cause economic growth.
Only Investment causes growth since firms increase their capital stock
AS1
Price Level
Ca
pit
al G
oo
ds
Consumer Goods
LRAS1
QY1

Unit 3:
Aggregate Demand and
Supply and Fiscal Policy
45

Adam Smith
1723-1790
John Maynard Keynes
1883-1946 46
Classical
vs.
Keynesian

Keynes vs. Hayek
Rap Battle
47
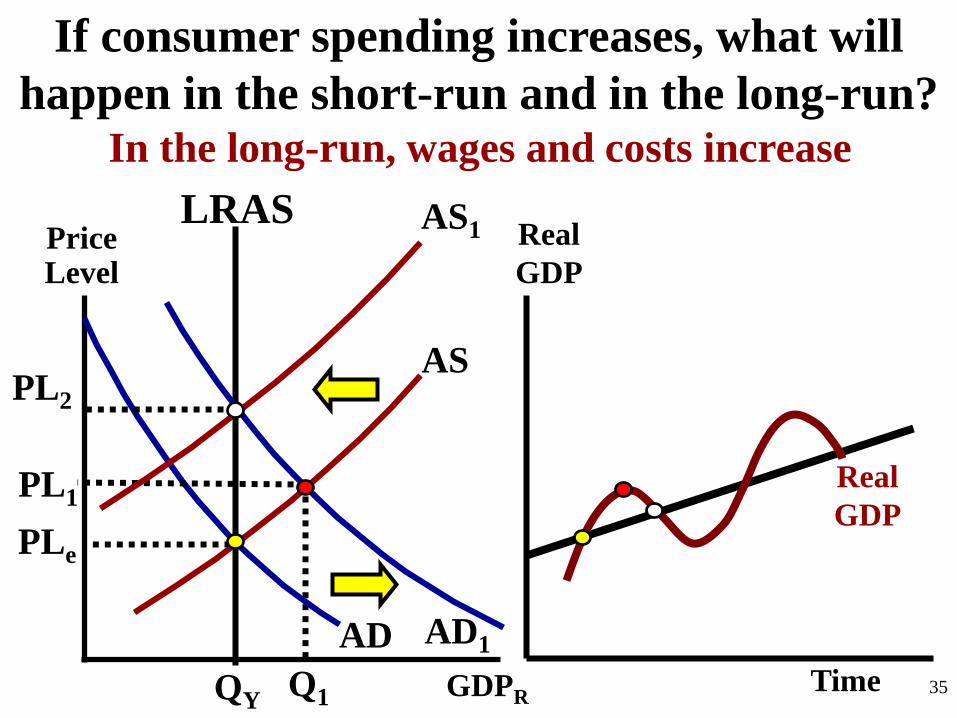
Debates Over Aggregate Supply
Classical Theory 1. A change in AD will not change output even in the short run
because prices of resources (wages) are very flexible.
2. AS is vertical so AD can’t increase without causing inflation.
Price
level
Real domestic output, GDP
AS
Qf
AD
48

Debates Over Aggregate Supply
Classical Theory 1. A change in AD will not change output even in the short run
because prices of resources (wages) are very flexible.
2. AS is vertical so AD can’t increase without causing inflation.
Price
level
Real domestic output, GDP
AS
Qf
AD
49
Recessions caused by a fall
in AD are temporary.
Price level will fall and
economy will fix itself.
No Government Involvement
Required
AD1
50
John Maynard Keynes
“The long run is a misleading guide to current
affairs. In the long run we are all dead.
Economists set themselves too easy, too useless
a task if in tempestuous seasons they can only
tell us that when the storm is past the ocean is
flat again”
Translation:
In times of need, economists
should do more than say that
the economy will fix itself.
They should suggest policies
that can help the economy, like
deficit spending.
Do you agree or disagree?

Debates Over Aggregate Supply
Keynesian Theory 1. A decrease in AD will lead to a persistent recession because
prices of resources (wages) are NOT flexible.
2. Increase in AD during a recession doesn’t cause inflation
Price
level
Real domestic output, GDP
AS
Qf
AD
51

Debates Over Aggregate Supply
Keynesian Theory 1. A decrease in AD will lead to a persistent recession because
prices of resources (wages) are NOT flexible.
2. Increase in AD during a recession puts no pressure on prices
Price
level
Real domestic output, GDP
AS
Qf
AD
52
Q1
“Sticky Wages” prevents
wages to fall.
The government should
increase spending to
close the gap
AD1

Debates Over Aggregate Supply
Keynesian Theory 1. A decrease in AD will lead to a persistent recession because
prices of resources (wages) are NOT flexible.
2. Increase in AD during a recession puts no pressure on prices
Price
level
Real domestic output, GDP
AS
Qf
AD2
53
AD1
Q1
When there is high
unemployment, an
increase in AD doesn’t
lead to higher prices
until you get close to full
employment
AD3

Does deflation (falling prices) often occur?
Not as often as inflation. Why? • If prices were to fall, the cost of resources must
fall or firms would go out of business.
• The cost of resources (especially labor) rarely fall
because:
• Labor Contracts (Unions)
• Wage decrease results in poor worker morale.
• Firms must pay to change prices (ex: re-
pricing items in inventory, advertising new
prices to consumers, etc.)
54

Three Ranges of Aggregate Supply
1. Keynesian Range- Horizontal at low output
2. Intermediate Range- Upward sloping
3. Classical Range- Vertical at Physical Capacity
Price
level
Real domestic output, GDP
AS
Qf 55
Keynesian
Range Intermediate
Range
Classical
Range

Unit 3:
Aggregate Demand and
Supply and Fiscal Policy
56

The Phillips Curve Shows tradeoff between inflation and
unemployment.
What happens to inflation and unemployment
when AD increase?

58
In general, there is an inverse relationship
between unemployment and inflation

Inflation
59
SRPC
Short Run Phillips Curve
Unemployment 2% 9%
1%
5%
When the economy is overheating, there is low unemployment but high inflation
When there is a recession, unemployment is high but
inflation is low

Inflation
60
SRPC
Short Run Phillips Curve
Unemployment 2% 9%
1%
5%
What happens when AS falls causing stagflation? Increase in unemployment and inflation
SRPC1

Inflation
61
SRPC
Short Run vs. Long Run
Unemployment 2% 9%
1%
5%
What happens when AD increases?
SRPC1
3%
5%
Long Run Phillips Curve
In the long run, wages
and resource prices
increase. AS falls.
SRPC shifts right.
What happens in the long run?

Inflation
62
Short Run vs. Long Run
Unemployment 2% 9%
1%
5%
3%
5%
Long Run Phillips Curve
In the long run there is no tradeoff between inflation
and unemployment
The LRPC is vertical at
the Natural Rate of
Unemployment

Inflation
63
SRPC
Short Run vs. Long Run
Unemployment 2% 9%
1%
5%
What happens when AD falls?
SRPC1
3%
5%
Long Run
Phillips Curve
In the long run wages
fall and there is no
tradeoff between
inflation and
unemployment
What happens in the long run?

The Phillips Curve in real life isn’t like the textbook

AD/AS and the
Phillips Curve

Price
Level
66
AD
AS
AD/AS and the Phillips Curve
GDPR QY
PLe
LRAS Inflation
SRPC
Unemployment
UY
LRPC
Show what happens on both graphs if AD increase
AD1

Price
Level
67
AD
AS
AD/AS and the Phillips Curve
GDPR QY
PLe
LRAS Inflation
SRPC
Unemployment
UY
LRPC
Correctly draw the LRPC and SRPC with the recessionary gap. What happens when AD falls?
AD1

Price
Level
68
AD
AS
AD/AS and the Phillips Curve
GDPR QY
PLe
LRAS Inflation
SRPC
Unemployment
UY
LRPC
Correctly draw the LRPC and SRPC at full employment. What happens when AS falls?
AS1
SRPC1

Price
Level
69
AD
AS
AD/AS and the Phillips Curve
GDPR QY
PLe
LRAS Inflation
SRPC
Unemployment
UY
LRPC
Correctly draw the LRPC and SRPC with a recessionary gap. What happens when AS goes up?
AS1
SRPC1

Price Level
SRAS
GDPR QY
LRAS Inflation
SRPC
Unemployment UY
LRPC

AD
Price Level
SRAS
GDPR QY
LRAS Inflation
SRPC
Unemployment UY
LRPC
AD2
AD3
PLe

AD
Price Level
SRAS
GDPR QY
LRAS Inflation
SRPC
Unemployment UY
LRPC AS1
PLe
AS2
SRPC1
SRPC2

AD
Price Level
AS
GDPR QY
LRAS Inflation
SRPC
Unemployment UY
LRPC AS2
PLe
SRPC1 AD2

Analyzing the Economy
Graphically
74

Use the following models to show full
employment, a recessionary gap, and an
inflationary gap.
1. PPC
2. Business Cycle
3. AD/AS
4. Phillips Curve
75

Unit 3:
Aggregate Demand and
Supply and Fiscal Policy
76

The Car Analogy The economy is like a car…
• You can drive 120mph but it is not sustainable. (Extremely Low unemployment)
• Driving 20mph is too slow. The car can easily go faster. (High unemployment)
• 70mph is sustainable. (Full employment)
• Some cars have the capacity to drive faster then others. (industrial nations vs. 3rd world nations)
• If the engine (technology) or the gas mileage (productivity) increase then the car can drive at even higher speeds. (Increase LRAS)
The government’s job is to brake or speed up when needed as well as promote things that will improve the engine.
(Shift the PPC outward) 77

Consumption is the most important part of the economy. Consumers will spend a certain amount no matter what, regardless of their income. This is called autonomous consumption. This is usually to pay for necessities. Consumer spending is made up of autonomous spending and disposable income (income after taxes) If incomes are less than autonomous spending then there is dissaving (or negative savings)
But what if incomes fall and people stop buying things. Who often steps in?
The Role of Consumers in the Economy
78

How does the Government Stabilizes the
Economy?
The Government has two different tool boxes it can use:
1. Fiscal Policy-
Actions by Congress to stabilize the economy.
OR
2. Monetary Policy-Actions by the
Federal Reserve Bank to stabilize the
economy. 79

For now we will only focus on Fiscal Policy.
80

Fiscal Policy
81

Two Types of Fiscal Policy
Discretionary Fiscal Policy- • Congress creates a new bill that is designed to change AD through government spending or taxation. •Problem is time lags due to bureaucracy. •Takes time for Congress to act. •Ex: In a recession, Congress increase spending.
Non-Discretionary Fiscal Policy •AKA: Automatic Stabilizers •Permanent spending or taxation laws enacted to work counter cyclically to stabilize the economy •Ex: Welfare, Unemployment, Min. Wage, etc. •When there is high unemployment, unemployment benefits to citizens increase consumer spending.
82

Laws that reduce inflation, decrease GDP
(Close a Inflationary Gap)
• Decrease Government Spending
• Tax Increases
• Combinations of the Two
Contractionary Fiscal Policy (The BRAKE)
Laws that reduce unemployment and increase GDP (Close a Recessionary Gap)
• Increase Government Spending • Decrease Taxes on consumers • Combinations of the Two
Expansionary Fiscal Policy (The GAS)
How much should the Government Spend? 83

Pri
ce
lev
el
Real GDP (billions)
The government should
increasing spending
which would increase AD
They should NOT spend 100
billion!!!!!!!!!!
If they spend 100 billion, AD
would look like this:
AD1
AD2
• What type of gap and what type of policy is best?
• What should the government do to spending? Why?
• How much should the government spend?
P1
$400 $500
AS
LRAS
FE
WHY?
84

The Multiplier Effect Why do cities want the Superbowl in their stadium? An initial change in spending will set off a spending chain
that is magnified in the economy. Example: • Bobby spends $100 on Jason’s product • Jason now has more income so he buys $100 of Nancy’s product • Nancy now has more income so she buys $100 of Tiffany’s product. • The result is an $300 increase in consumer spending
The Multiplier Effect shows how spending is magnified in the economy.
85

Unit 3:
Aggregate Demand and
Supply and Fiscal Policy
86

Pri
ce l
evel
Real GDP (billions)
The government should increasing spending which would increase AD, but
they should NOT spend 100 billion!
If they spend 100 billion, AD would look like this:
AD1
AD2
• What type of gap and what type of policy is best?
• What should the government do to spending? Why?
• How much should the government spend?
P1
$400 $500
AS
LRAS
FE
WHY?
87

The Multiplier Effect Why do cities want the Superbowl in their stadium? An initial change in spending will set off a spending chain
that is magnified in the economy. Example: • Bobby spends $100 on Jason’s product • Jason now has more income so he buys $100 of Nancy’s product • Nancy now has more income so she buys $100 of Tiffany’s product. • The result is an $300 increase in consumer spending
The Multiplier Effect shows how spending is magnified in the economy.
88

Effects of Government Spending
If the government spends $5 Million, will AD
increase by the same amount?
• No, AD will increase even more as spending becomes income for consumers.
• Consumers will take that money and spend, thus increasing AD.
How much will AD increase? • It depends on how much of the new income
consumers save. • If they save a lot, spending and AD will increase
less. • If the save a little, spending and AD will be
increase a lot. 89

Marginal Propensity to Consume Marginal Propensity to Consume (MPC)
•How much people consume rather than save
when there is an change in income.
•It is always expressed as a fraction (decimal).
Examples:
1. If you received $100 and spent $50.
2. If you received $100 and spent $80.
3. If you received $100 and spent $100. 90
Change in Consumption
Change in Income MPC=

Marginal Propensity to Save Marginal Propensity to Save (MPS) •How much people save rather than consume
when there is an change in income.
•It is also always expressed as a fraction (decimal)
Examples:
1. If you received $100 and save $50.
2. If you received $100 your MPC is .7 what is
your MPS? 91
Change in Savings
Change in Income MPS=

Why is this true? Because people can either save or consume
92
MPS = 1 - MPC

How is Spending “Multiplied”?
Assume the MPC is .5 for everyone •Assume the Super Bowl comes to town and there is an
increase of $100 in Ashley’s restaurant.
•Ashley now has $100 more income.
•She saves $50 and spends $50 at Karl’s Salon
•Karl now has $50 more income
•He saves $25 and spends $25 at Dan’s fruit stand
•Dan now has $25 more income.
This continues until every penny is spent or saved
93
Total change
in GDP = Multiplier x Initial Change
in Spending

Calculating the Spending Multiplier
If the MPC is .5 how much is the multiplier?
•If the multiplier is 4, how much will an initial
increase of $5 in Government spending increase
the GDP?
•How much will a decrease of $3 in spending
decrease GDP?
94
Total change
in GDP = Multiplier x Initial Change
in Spending
Spending
Multiplier OR

The Multiplier Effect Let’s practice calculating the spending multiplier
1. If MPC is .9, what is multiplier?
2. If MPC is .8, what is multiplier?
3. If MPC is .5, and consumption increased
$2M. How much will GDP increase?
4. If MPC is 0 and investment increases $2M.
How much will GDP increase?
Conclusion: As the Marginal Propensity to
Consume falls, the Multiplier Effect is less 95
Spending
Multiplier OR

Pri
ce l
evel
Real GDP (billions)
Fiscal Policy Practice
1. What type of gap?
2. Contractionary or
Expansionary needed?
3. What are two options
to fix the gap?
4. How much initial
government spending
is needed to close gap?
AD1 AD2 $100 Billion
Congress uses discretionary fiscal policy to the
manipulate the following economy (MPC = .8)
P1
$500 $1000FE
AS
LRAS
96

Pri
ce l
evel
Real GDP (billions)
Fiscal Policy Practice
AD1 AD
P2
$80FE $100
AS
1. What type of gap?
2. Contractionary or
Expansionary needed?
3. What are two options
to fix the gap?
4. How much needed to
close gap?
LRAS
Congress uses discretionary fiscal policy to the
manipulate the following economy (MPC = .5)
-$10 Billion
97

What about taxing? •The multiplier effect also applies when the government
cuts or increases taxes.
•But, changing taxes has less of an impact then
government spending. Why?
Expansionary Policy (Cutting Taxes) •Assume the MPC is .75 so the multiplier is 4
•If the government cuts taxes by $4 million how much
will consumer spending increase?
•NOT 16 Million!!
•When they get the tax cut, consumers will save $1
million and spend $3 million.
•The $3 million is the amount magnified in the
economy.
•$3 x 4 = $12 Million increase in consumer spending .98

Calculating the Tax Multiplier
If the MPC is .75 how much is the tax multiplier?
•If the spending multiplier is 4, then the tax
multiplier is only 3
•But remember that an increase in taxes
decreases GDP so the tax multiplier is negative.
Total change
in GDP = Tax Multiplier x Initial Change
in Taxes
Simple Tax
Multiplier OR MPC x
MPC
MPS

Pri
ce l
evel
Real GDP (billions)
Cutting Tax Practice
1. What two options does
the government have?
2. How much should they
increase government
spending?
$10 Billion 3. How much should they
cut taxes?
AD2 AD1 -$20 Billion
Congress uses discretionary fiscal policy to the
manipulate the following economy (MPC = .5)
P1
$80 $100FE
AS
LRAS
100
Non-Discretionary
Fiscal Policy
101

Non-Discretionary Fiscal Policy
Legislation that act counter cyclically without explicit action by policy makers.
AKA: Automatic Stabilizers
The U.S. Progressive Income Tax System acts counter cyclically to stabilize the economy. 1. When GDP is down, the tax burden on
consumers is low, promoting consumption, increasing AD.
2. When GDP is up, more tax burden on consumers, discouraging consumption, decreasing AD.
The more progressive the tax system, the
greater the economy’s built-in stability. 102

Unit 3:
Aggregate Demand and
Supply and Fiscal Policy
103

Pri
ce
lev
el
Real GDP (billions)
Draw and Practice
AD1 AD
P2
$50FE $100
AS
1. What type of gap?
2. Contractionary or
Expansionary needed?
3. What are two options
to fix the gap?
4. How much needed to
close gap?
LRAS
Congress uses discretionary fiscal policy to the
manipulate the following economy (MPC = .9)
-$5 Billion
104

Pri
ce
le
ve
l
Real GDP (billions)
Draw and Practice
1. What type of gap?
2. Contractionary or
Expansionary needed?
3. What are two options
to fix the gap?
4. How much initial
government spending
is needed to close gap?
AD2 AD1 +$40 Billion
Congress uses discretionary fiscal policy to the
manipulate the following economy (MPC = .8)
P1
$800 $1000FE
AS
LRAS
105

Problems With
Fiscal Policy
106

Problems With Fiscal Policy •When there is a recessionary gap what two options does
Congress have to fix it?
•What’s wrong with combining both?
Deficit Spending!!!! •A Budget Deficit is when the government’s
expenditures exceeds its revenue.
•The National Debt is the accumulation of all the budget
deficits over time.
•If the Government increases spending without
increasing taxes they will increase the annual deficit and
the national debt.
Most economists agree that budget deficits are a
necessary evil because forcing a balanced budget would
not allow Congress to stimulate the economy. 107

108

109

Additional Problems with Fiscal Policy
1. Problems of Timing • Recognition Lag- Congress must react to
economic indicators before it’s too late • Administrative Lag- Congress takes time to
pass legislation • Operational Lag- Spending/planning takes time
to organize and execute ( changing taxing is quicker)
2. Politically Motivated Policies • Politicians may use economically inappropriate
policies to get reelected. • Ex: A senator promises more welfare and public
works programs when there is already an inflationary gap.
110

3. Crowding-Out Effect • In basketball, what is “Boxing Out”?
• Government spending might cause unintended
effects that weaken the impact of the policy. Example:
• We have a recessionary gap
• Government creates new public library. (AD increases)
• Now consumers spend less on books (AD decreases)
Another Example:
• The government increases spending but must borrow
the money (AD increases)
• This increases the price for money (the interest rate).
• Interest rates rise so Investment to fall. (AD decrease)
The government “crowds out” consumers
and/or investors 111
Additional Problems with Fiscal Policy

4. Net Export Effect
International trade reduces the effectiveness
of fiscal policies. Example:
• We have a recessionary gap so the government
spends to increase AD.
• The increase in AD causes an increase in price
level and interest rates.
• U.S. goods are now more expensive and the US
dollar appreciates…
• Foreign countries buy less. (Exports fall)
• Net Exports (Exports-Imports) falls, decreasing
AD. 112
Additional Problems with Fiscal Policy