Embed Size (px)
Citation preview
Unit 2, Lesson 1: Introducing Ratios and Ratio LanguageLet’s describe two quantities at the same time.
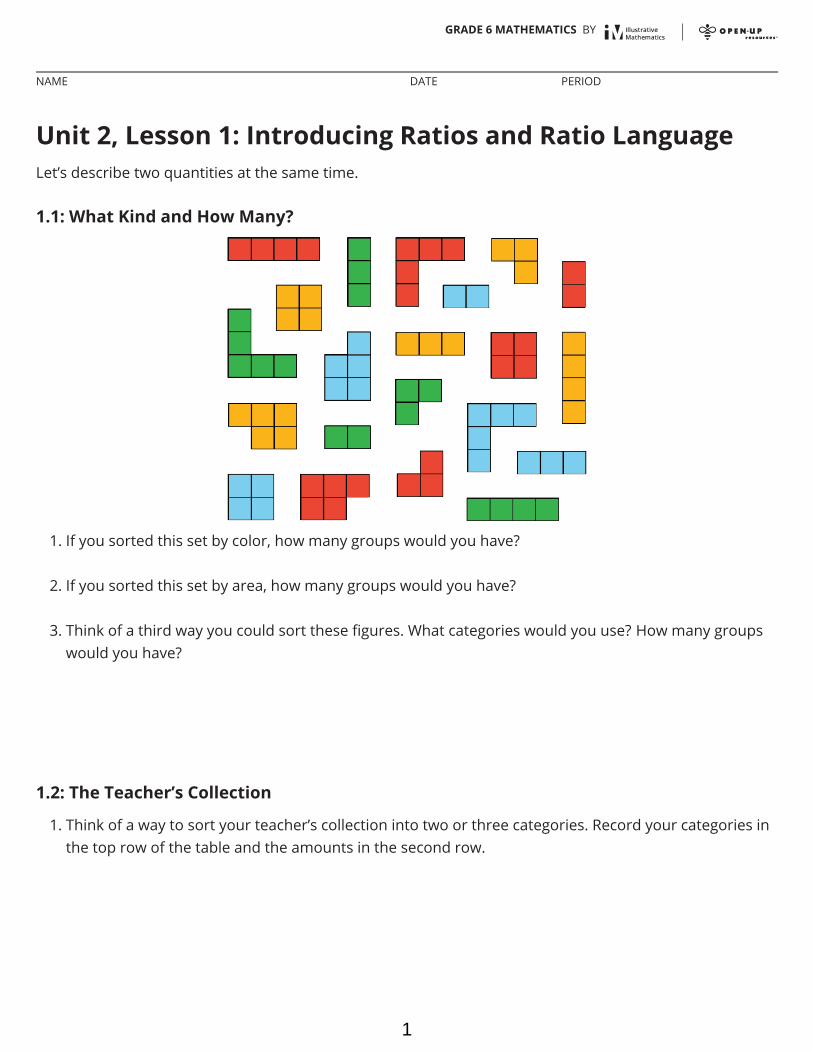
1.1: What Kind and How Many?
1. If you sorted this set by color, how many groups would you have?
2. If you sorted this set by area, how many groups would you have?
3. Think of a third way you could sort these figures. What categories would you use? How many groupswould you have?
1.2: The Teacher’s Collection
1. Think of a way to sort your teacher’s collection into two or three categories. Record your categories inthe top row of the table and the amounts in the second row.
GRADE 6 MATHEMATICS BY
NAME DATE PERIOD
1
category name
category amount
Pause here so your teacher can review your work.
2. Write at least two sentences that describe ratios in the collection. Remember, there are many ways towrite a ratio:
The ratio of one category to another category is ________ to ________.The ratio of one category to another category is ________ : ________.There are _______ of one category for every _______ of another category.
1.3: The Student’s Collection
1. Sort your collection into three categories. You can experiment with different ways of arranging thesecategories. Then, count the items in each category, and record the information in the table.
2. Write at least two sentences that describe ratios in the collection. Remember, there are many ways towrite a ratio:
The ratio of one category to another category is __ to __.The ratio of one category to another category is __ : __.There are __ of one category for every __ of another category.
◦◦◦
◦◦◦
GRADE 6 MATHEMATICS BY
NAME DATE PERIOD
2
Pause here so your teacher can review your sentences.
3. Make a visual display of your items that clearly shows one of your statements. Be prepared to shareyour display with the class.
GRADE 6 MATHEMATICS BY
NAME DATE PERIOD
3
Are you ready for more?
Lesson 1 Summary
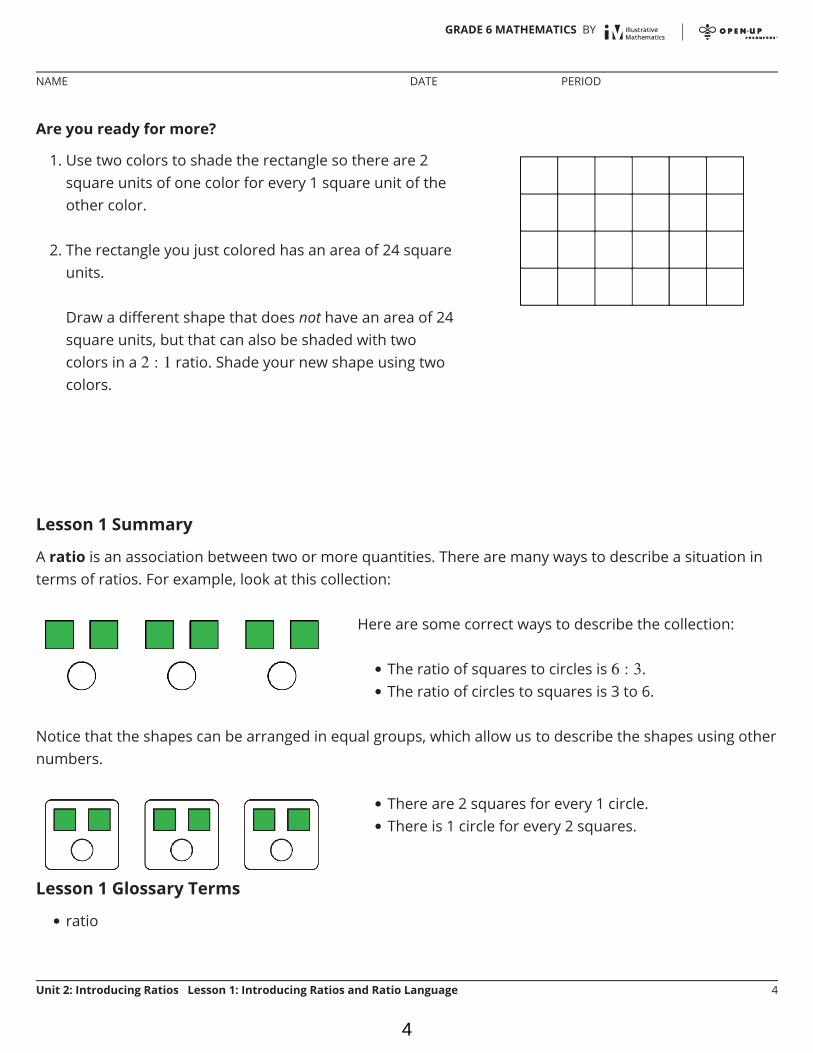
A ratio is an association between two or more quantities. There are many ways to describe a situation interms of ratios. For example, look at this collection:
Notice that the shapes can be arranged in equal groups, which allow us to describe the shapes using othernumbers.
Lesson 1 Glossary Terms
ratio
1. Use two colors to shade the rectangle so there are 2square units of one color for every 1 square unit of theother color.
2. The rectangle you just colored has an area of 24 squareunits.
Draw a different shape that does not have an area of 24square units, but that can also be shaded with twocolors in a ratio. Shade your new shape using twocolors.
Here are some correct ways to describe the collection:
The ratio of squares to circles is .The ratio of circles to squares is 3 to 6.
There are 2 squares for every 1 circle.There is 1 circle for every 2 squares.
••
••
•
GRADE 6 MATHEMATICS BY
NAME DATE PERIOD
Unit 2: Introducing Ratios Lesson 1: Introducing Ratios and Ratio Language 4
4

Unit 2, Lesson 2: Representing Ratios with DiagramsLet’s use diagrams to represent ratios.
2.1: Number Talk: Dividing by 4 and Multiplying by
Find the value of each expression mentally.
2.2: A Collection of Snap Cubes
Here is a collection of snap cubes.
2. Trade papers with a partner. On their paper, write a sentence to describe a ratio shown in theirdiagram. Your partner will do the same for your diagram.
1. Choose two of the colors in the image, and drawa diagram showing the number of snap cubes forthese two colors.
GRADE 6 MATHEMATICS BY
NAME DATE PERIOD
5

3. Return your partner’s paper. Read the sentence written on your paper. If you disagree, explain yourthinking.
GRADE 6 MATHEMATICS BY
NAME DATE PERIOD
6
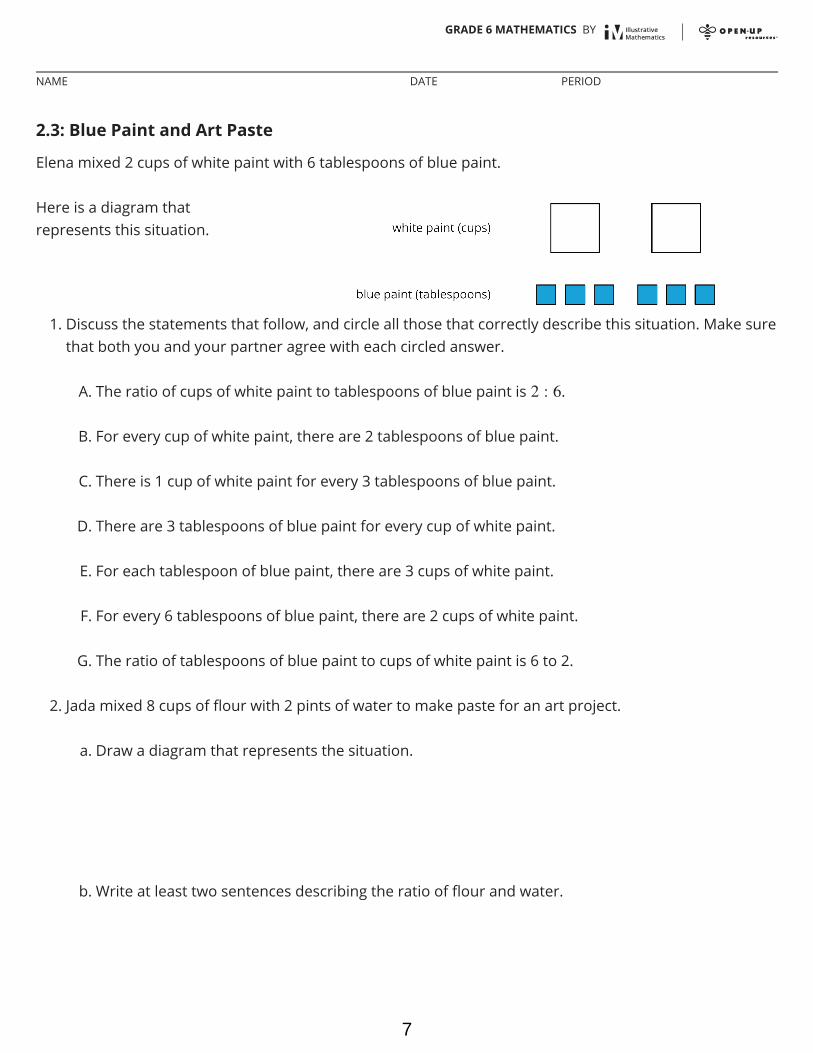
2.3: Blue Paint and Art Paste
Elena mixed 2 cups of white paint with 6 tablespoons of blue paint.
1. Discuss the statements that follow, and circle all those that correctly describe this situation. Make surethat both you and your partner agree with each circled answer.
A. The ratio of cups of white paint to tablespoons of blue paint is .
B. For every cup of white paint, there are 2 tablespoons of blue paint.
C. There is 1 cup of white paint for every 3 tablespoons of blue paint.
D. There are 3 tablespoons of blue paint for every cup of white paint.
E. For each tablespoon of blue paint, there are 3 cups of white paint.
F. For every 6 tablespoons of blue paint, there are 2 cups of white paint.
G. The ratio of tablespoons of blue paint to cups of white paint is 6 to 2.
2. Jada mixed 8 cups of flour with 2 pints of water to make paste for an art project.
a. Draw a diagram that represents the situation.
b. Write at least two sentences describing the ratio of flour and water.
Here is a diagram thatrepresents this situation.
GRADE 6 MATHEMATICS BY
NAME DATE PERIOD
7
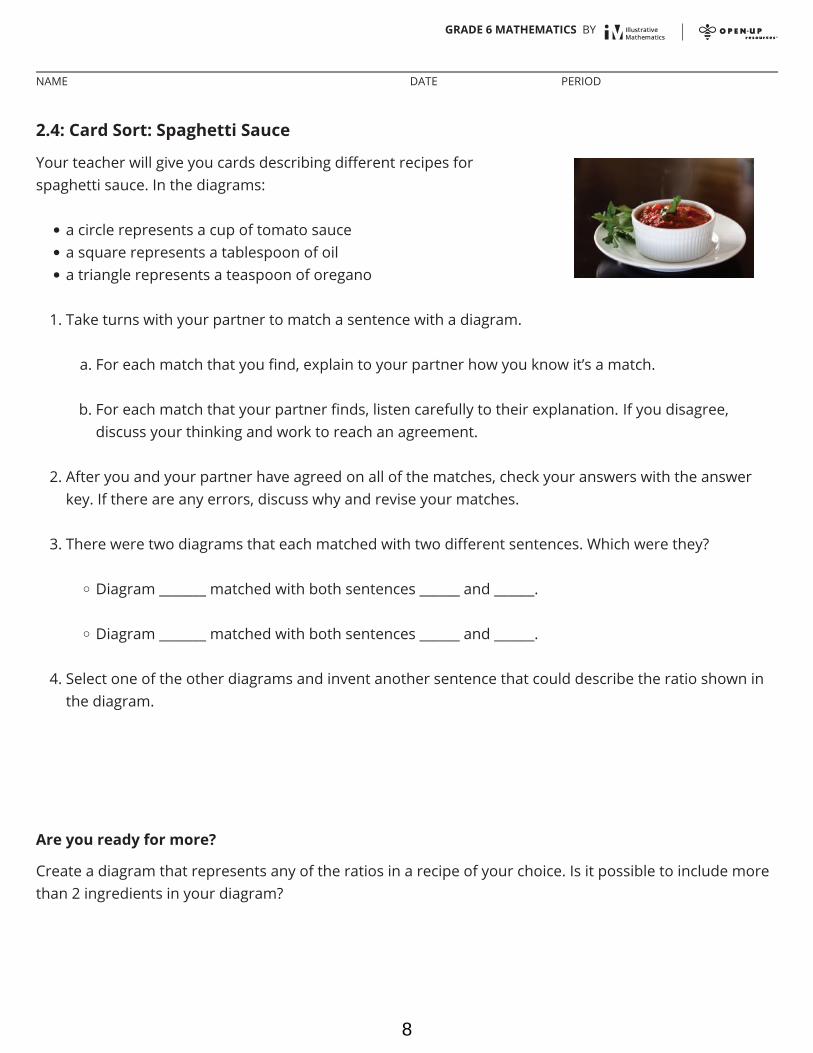
2.4: Card Sort: Spaghetti Sauce
1. Take turns with your partner to match a sentence with a diagram.
a. For each match that you find, explain to your partner how you know it’s a match.
b. For each match that your partner finds, listen carefully to their explanation. If you disagree,discuss your thinking and work to reach an agreement.
2. After you and your partner have agreed on all of the matches, check your answers with the answerkey. If there are any errors, discuss why and revise your matches.
3. There were two diagrams that each matched with two different sentences. Which were they?
Diagram _______ matched with both sentences ______ and ______.
Diagram _______ matched with both sentences ______ and ______.
4. Select one of the other diagrams and invent another sentence that could describe the ratio shown inthe diagram.
Are you ready for more?
Create a diagram that represents any of the ratios in a recipe of your choice. Is it possible to include morethan 2 ingredients in your diagram?
Your teacher will give you cards describing different recipes forspaghetti sauce. In the diagrams:
a circle represents a cup of tomato saucea square represents a tablespoon of oila triangle represents a teaspoon of oregano
•••
◦
◦
GRADE 6 MATHEMATICS BY
NAME DATE PERIOD
8
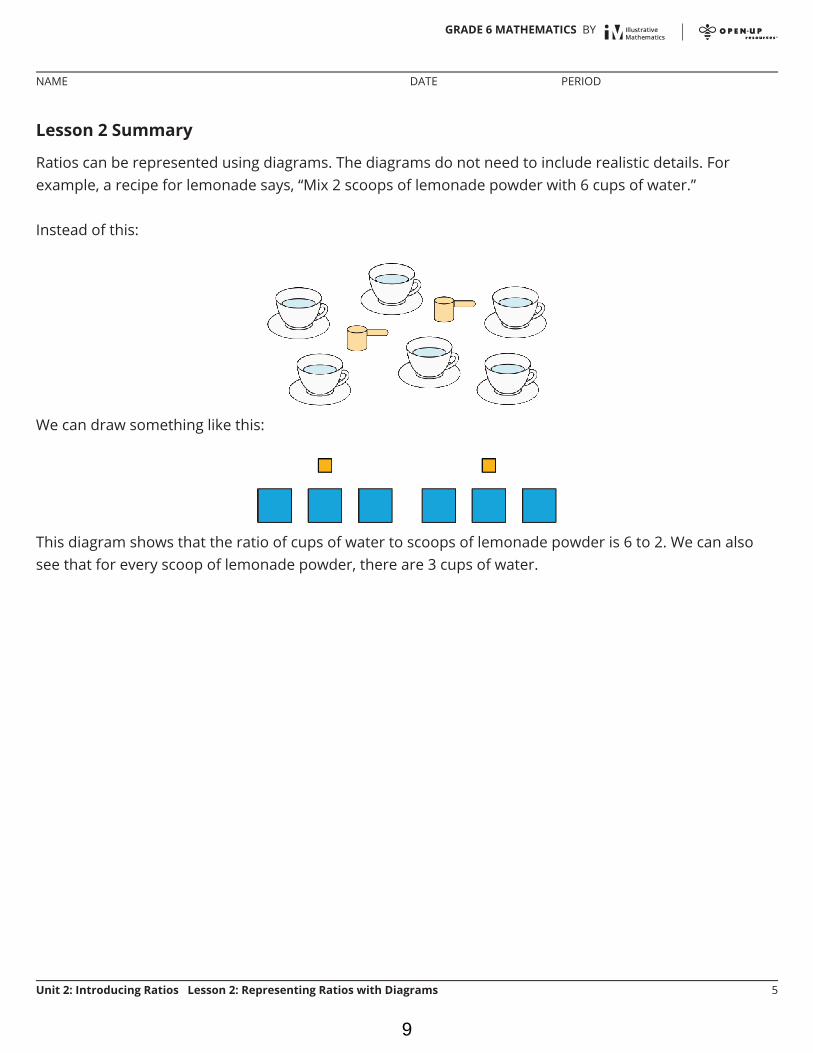
Lesson 2 Summary
Ratios can be represented using diagrams. The diagrams do not need to include realistic details. Forexample, a recipe for lemonade says, “Mix 2 scoops of lemonade powder with 6 cups of water.”
Instead of this:
We can draw something like this:
This diagram shows that the ratio of cups of water to scoops of lemonade powder is 6 to 2. We can alsosee that for every scoop of lemonade powder, there are 3 cups of water.
GRADE 6 MATHEMATICS BY
NAME DATE PERIOD
Unit 2: Introducing Ratios Lesson 2: Representing Ratios with Diagrams 5
9

Unit 2, Lesson 3: RecipesLet’s explore how ratios affect the way a recipe tastes.
3.1: Flower Pattern
This flower is made up of yellow hexagons, red trapezoids, and green triangles.
3.2: Powdered Drink Mix
Here are diagrams representing three mixtures of powdered drink mix and water:
1. How would the taste of Mixture A compare to the taste of Mixture B?
1. Write sentences to describe the ratios of the shapes that makeup this pattern.
2. How many of each shape would be in two copies of this flowerpattern?
GRADE 6 MATHEMATICS BY
NAME DATE PERIOD
10

2. Use the diagrams to complete each statement:
a. Mixture B uses ______ cups of water and ______ teaspoons of drink mix. The ratio of cups of waterto teaspoons of drink mix in Mixture B is ________.
b. Mixture C uses ______ cups of water and ______ teaspoons of drink mix. The ratio of cups of waterto teaspoons of drink mix in Mixture C is ________.
3. How would the taste of Mixture B compare to the taste of Mixture C?
Are you ready for more?
Sports drinks use sodium (better known as salt) to help people replenish electrolytes. Here are thenutrition labels of two sports drinks.
1. Which of these drinks is saltier? Explain how you know.
GRADE 6 MATHEMATICS BY
NAME DATE PERIOD
11
2. If you wanted to make sure a sports drink was less salty than both of the ones given, what ratio ofsodium to water would you use?
GRADE 6 MATHEMATICS BY
NAME DATE PERIOD
12

3.3: Batches of Cookies
A recipe for one batch of cookies calls for 5 cups of flour and 2 teaspoons of vanilla.
1. Draw a diagram that shows the amount of flour and vanilla needed for two batches of cookies.
2. How many batches can you make with 15 cups of flour and 6 teaspoons of vanilla? Indicate theadditional batches by adding more ingredients to your diagram.
3. How much flour and vanilla would you need for 5 batches of cookies?
4. Whether the ratio of cups of flour to teaspoons of vanilla is , , or , the recipes wouldmake cookies that taste the same. We call these equivalent ratios.
a. Find another ratio of cups of flour to teaspoons of vanilla that is equivalent to these ratios.
b. How many batches can you make using this new ratio of ingredients?
GRADE 6 MATHEMATICS BY
NAME DATE PERIOD
13
Lesson 3 Summary
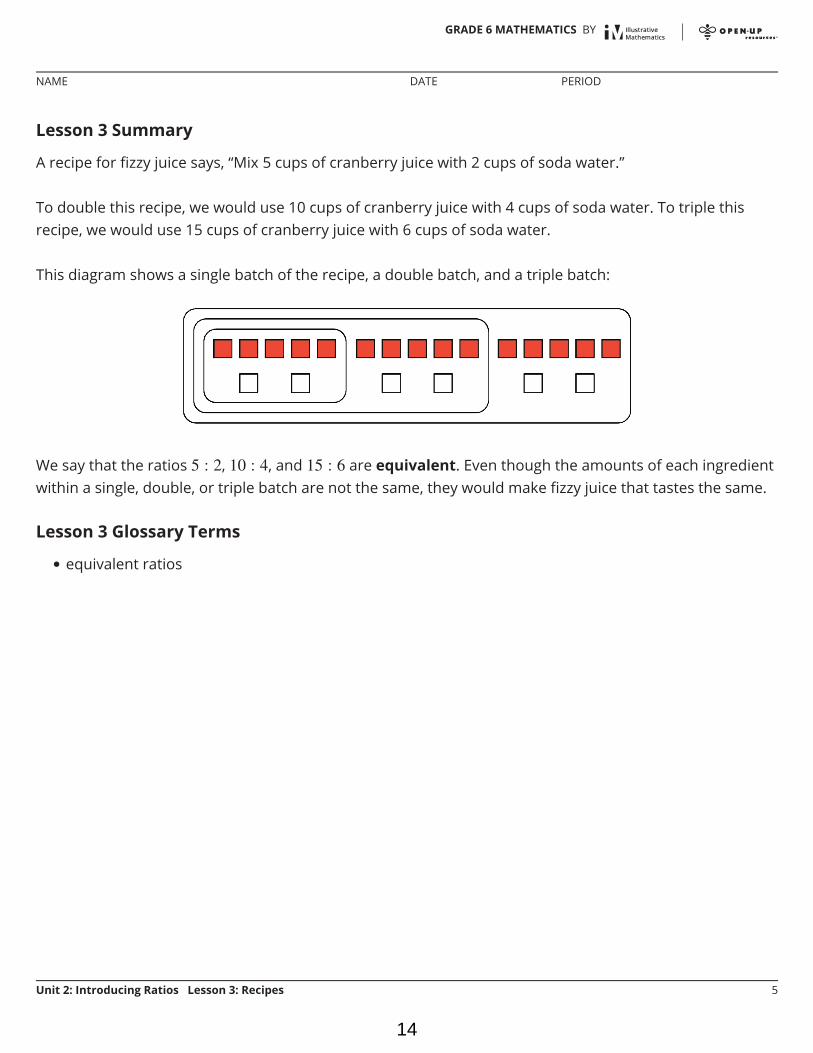
A recipe for fizzy juice says, “Mix 5 cups of cranberry juice with 2 cups of soda water.”
To double this recipe, we would use 10 cups of cranberry juice with 4 cups of soda water. To triple thisrecipe, we would use 15 cups of cranberry juice with 6 cups of soda water.
This diagram shows a single batch of the recipe, a double batch, and a triple batch:
We say that the ratios , , and are equivalent. Even though the amounts of each ingredientwithin a single, double, or triple batch are not the same, they would make fizzy juice that tastes the same.
Lesson 3 Glossary Terms
equivalent ratios•
GRADE 6 MATHEMATICS BY
NAME DATE PERIOD
Unit 2: Introducing Ratios Lesson 3: Recipes 5
14
m.openup.org//6-2-4-2
Unit 2, Lesson 4: Color MixturesLet’s see what color-mixing has to do with ratios.
4.1: Number Talk: Adjusting a Factor
Find the value of each product mentally.
4.2: Turning Green
Your teacher mixed milliliters of blue water and milliliters of yellow water in the ratio.
1. Doubling the original recipe:
a. Draw a diagram to represent the amount of each color that you will combine to double yourteacher’s recipe.
b. Use a marker to label an empty cup with the ratio of blue water to yellow water in this doublebatch.
c. Predict whether these amounts of blue and yellow will make the same shade of green as your
GRADE 6 MATHEMATICS BY
NAME DATE PERIOD
15
teacher’s mixture. Next, check your prediction by measuring those amounts and mixing them inthe cup.
d. Is the ratio in your mixture equivalent to the ratio in your teacher’s mixture? Explain yourreasoning.
GRADE 6 MATHEMATICS BY
NAME DATE PERIOD
16
2. Tripling the original recipe:
a. Draw a diagram to represent triple your teacher’s recipe.
b. Label an empty cup with the ratio of blue water to yellow water.
c. Predict whether these amounts will make the same shade of green. Next, check your predictionby mixing those amounts.
d. Is the ratio in your new mixture equivalent to the ratio in your teacher’s mixture? Explain yourreasoning.
3. Next, invent your own recipe for a bluer shade of green water.
a. Draw a diagram to represent the amount of each color you will combine.
GRADE 6 MATHEMATICS BY
NAME DATE PERIOD
17

b. Label the final empty cup with the ratio of blue water to yellow water in this recipe.
c. Test your recipe by mixing a batch in the cup. Does the mixture yield a bluer shade of green?
d. Is the ratio you used in this recipe equivalent to the ratio in your teacher’s mixture? Explain yourreasoning.
Are you ready for more?
Someone has made a shade of green by using 17 ml of blue and 13 ml of yellow. They are sure it cannotbe turned into the original shade of green by adding more blue or yellow. Either explain how more can beadded to create the original green shade, or explain why this is impossible.
4.3: Perfect Purple Water
The recipe for Perfect Purple Water says, “Mix 8 ml of blue water with 3 ml of red water.”
Jada mixes 24 ml of blue water with 9 ml of red water. Andre mixes 16 ml of blue water with 9 ml of redwater.
1. Which person will get a color mixture that is the same shade as Perfect Purple Water? Explain or showyour reasoning.
2. Find another combination of blue water and red water that will also result in the same shade asPerfect Purple Water. Explain or show your reasoning.
GRADE 6 MATHEMATICS BY
NAME DATE PERIOD
18

Lesson 4 Summary
When mixing colors, doubling or tripling the amount of each color will create the same shade of the mixedcolor. In fact, you can always multiply the amount of each color by the same number to create a differentamount of the same mixed color.
For example, a batch of dark orange paint uses 4 ml of red paint and 2 ml of yellow paint.
To make two batches of dark orange paint, we can mix 8 ml of red paint with 4 ml of yellow paint.
To make three batches of dark orange paint, we can mix 12 ml of red paint with 6 ml of yellow paint.
Here is a diagram that represents 1, 2, and 3 batches of this recipe.
We say that the ratios , , and are equivalent because they describe the same color mixturein different numbers of batches, and they make the same shade of orange.
•
•
GRADE 6 MATHEMATICS BY
NAME DATE PERIOD
Unit 2: Introducing Ratios Lesson 4: Color Mixtures 5
19

Unit 2, Lesson 5: Defining Equivalent RatiosLet’s investigate equivalent ratios some more.
5.1: Dots and Half Dots
5.2: Tuna Casserole
Here is a recipe for tuna casserole.
InstructionsCombine the pasta, tuna, soup, and half of the cheese. Transfer into a 9 inch by 18 inch baking dish. Putthe remaining cheese on top. Bake 30 minutes at 350 degrees. During the last 5 minutes, add the Frenchfried onions. Let sit for 10 minutes before serving.
1. What is the ratio of the ounces of soup to the cups of shredded cheese to the cups of pasta in one
Dot Pattern 1: Dot Pattern 2:
Ingredients3 cups cooked elbow-shaped pasta6 ounce can tuna, drained10 ounce can cream of chicken soup1 cup shredded cheddar cheese
cups French fried onions
•••••
GRADE 6 MATHEMATICS BY
NAME DATE PERIOD
20
batch of casserole?
GRADE 6 MATHEMATICS BY
NAME DATE PERIOD
21
2. How much of each of these 3 ingredients would be needed to make:a. twice the amount of casserole?
b. half the amount of casserole?
c. five times the amount of casserole?
d. one-fifth the amount of casserole?
3. What is the ratio of cups of pasta to ounces of tuna in one batch of casserole?
4. How many batches of casserole would you make if you used the following amounts of ingredients?
a. 9 cups of pasta and 18 ounces of tuna?
b. 36 ounces of tuna and 18 cups of pasta?
c. 1 cup of pasta and 2 ounces of tuna?
Are you ready for more?
The recipe says to use a 9 inch by 18 inch baking dish. Determine the length and width of a baking dishwith the same height that could hold:
5.3: What Are Equivalent Ratios?
The ratios and are equivalent ratios.
1. Is the ratio equivalent to these? Explain your reasoning.
1. Twice the amount of casserole
2. Half the amount of casserole
3. Five times the amount of casserole
4. One-fifth the amount of casserole
GRADE 6 MATHEMATICS BY
NAME DATE PERIOD
22

2. Is the ratio equivalent to these? Explain your reasoning.
3. Give two more examples of ratios that are equivalent to .
4. How do you know when ratios are equivalent and when they are not equivalent?
5. Write a definition of equivalent ratios.
Pause here so your teacher can review your work and assign you a ratio to use for your visual display.
6. Create a visual display that includes:
the title “Equivalent Ratios”your best definition of equivalent ratiosthe ratio your teacher assigned to youat least two examples of ratios that are equivalent to your assigned ratioan explanation of how you know these examples are equivalentat least one example of a ratio that is not equivalent to your assigned ratioan explanation of how you know this example is not equivalent
Be prepared to share your display with the class.
◦◦◦◦◦◦◦
GRADE 6 MATHEMATICS BY
NAME DATE PERIOD
23

Lesson 5 Summary
All ratios that are equivalent to can be made by multiplying both and by the same number.
Lesson 5 Glossary Terms
equivalent ratios
For example, the ratio is equivalent tobecause both 9 and 6 are multiplied by the samenumber: 2.
is also equivalent to , because both 9 and6 are multiplied by the same number: .
Is equivalent to ?
No, because 18 is , but 15 is not .
•
GRADE 6 MATHEMATICS BY
NAME DATE PERIOD
Unit 2: Introducing Ratios Lesson 5: Defining Equivalent Ratios 5
24

Unit 2, Lesson 6: Introducing Double Number LineDiagramsLet’s use number lines to represent equivalent ratios.
6.1: Number Talk: Adjusting Another Factor
Find the value of each product mentally.
6.2: Drink Mix on a Double Number Line
The other day, we made drink mixtures by mixing 4 teaspoons of powdered drink mix for every cup ofwater. Here are two ways to represent multiple batches of this recipe:
GRADE 6 MATHEMATICS BY
NAME DATE PERIOD
25

1. How can we tell that and are equivalent ratios?
2. How are these representations the same? How are these representations different?
3. How many teaspoons of drink mix should be used with 3 cups of water?
4. How many cups of water should be used with 16 teaspoons of drink mix?
5. What numbers should go in the empty boxes on the double number line diagram? What do thesenumbers mean?
Are you ready for more?
Recall that a perfect square is a number of objects that can be arranged into a square. For example, 9 is aperfect square because 9 objects can be arranged into 3 rows of 3. 16 is also a perfect square, because 16objects can be arranged into 4 rows of 4. In contrast, 12 is not a perfect square because you can’t arrange12 objects into a square.
1. How many whole numbers starting with 1 and ending with 100 are perfect squares?
2. What about whole numbers starting with 1 and ending with 1,000?
6.3: Blue Paint on a Double Number Line
Here is a diagram showing Elena’s recipe for light blue paint.
GRADE 6 MATHEMATICS BY
NAME DATE PERIOD
26
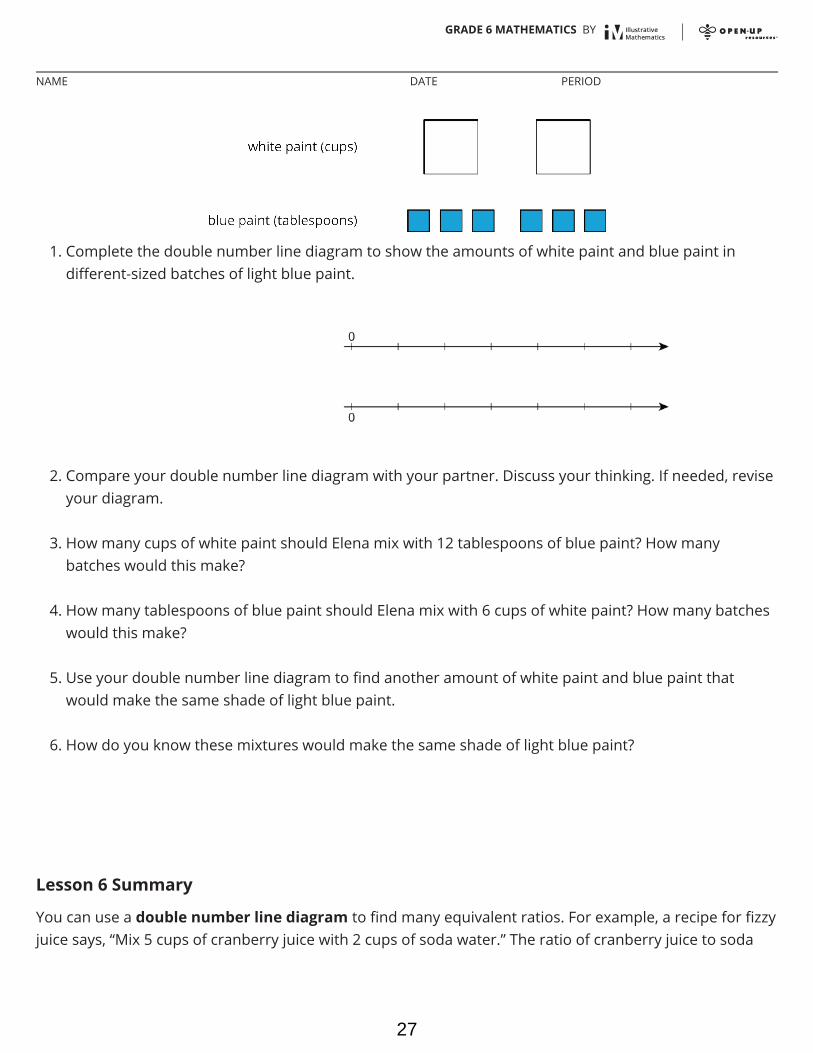
1. Complete the double number line diagram to show the amounts of white paint and blue paint indifferent-sized batches of light blue paint.
2. Compare your double number line diagram with your partner. Discuss your thinking. If needed, reviseyour diagram.
3. How many cups of white paint should Elena mix with 12 tablespoons of blue paint? How manybatches would this make?
4. How many tablespoons of blue paint should Elena mix with 6 cups of white paint? How many batcheswould this make?
5. Use your double number line diagram to find another amount of white paint and blue paint thatwould make the same shade of light blue paint.
6. How do you know these mixtures would make the same shade of light blue paint?
Lesson 6 Summary
You can use a double number line diagram to find many equivalent ratios. For example, a recipe for fizzyjuice says, “Mix 5 cups of cranberry juice with 2 cups of soda water.” The ratio of cranberry juice to soda
GRADE 6 MATHEMATICS BY
NAME DATE PERIOD
27

water is . Multiplying both ingredients by the same number creates equivalent ratios.
This double number line shows that the ratio is equivalent to . If you mix 20 cups of cranberryjuice with 8 cups of soda water, it makes 4 times as much fizzy juice that tastes the same as the originalrecipe.
Lesson 6 Glossary Terms
double number line diagram•
GRADE 6 MATHEMATICS BY
NAME DATE PERIOD
Unit 2: Introducing Ratios Lesson 6: Introducing Double Number LineDiagrams
4
28

Unit 2, Lesson 7: Creating Double Number Line DiagramsLet's draw double number line diagrams like a pro.
7.1: Ordering on a Number Line
1. Locate and label the following numbers on the number line:
2. Based on where you placed the numbers, locate and label four more fractions or decimals on thenumber line.
7.2: Just a Little Green
The other day, we made green water by mixing 5 ml of blue water with 15 ml of yellow water. We want tomake a very small batch of the same shade of green water. We need to know how much yellow water tomix with only 1 ml of blue water.
1. On the number line for blue water, label the four tick marks shown.
2. On the number line for yellow water, draw and label tick marks to show the amount of yellow waterneeded for each amount of blue water.
3. How much yellow water should be used for 1 ml of blue water? Circle where you can see this on thedouble number line.
4. How much yellow water should be used for 11 ml of blue water?
1.5 1.75
GRADE 6 MATHEMATICS BY
NAME DATE PERIOD
29
5. How much yellow water should be used for 8 ml of blue water?
6. Why is it useful to know how much yellow water should be used with 1 ml of blue water?
7.3: Art Paste on a Double Number Line
A recipe for art paste says “For every 2 pints of water, mix in 8 cups of flour.”
1. Follow the instructions to draw a double number line diagram representing the recipe for art paste.
a. Use a ruler to draw two parallel lines.b. Label the first line “pints of water.” Label the second line “cups of flour.”c. Draw at least 6 equally-spaced tick marks that line up on both lines.d. Along the water line, label the tick marks with the amount of water in 0, 1, 2, 3, 4, and 5 batches of
art paste.e. Along the flour line, label the tick marks with the amount of flour in 0, 1, 2, 3, 4, and 5 batches of
art paste.
2. Compare your double number line diagram with your partner’s. Discuss your thinking. If needed,revise your diagram.
3. Next, use your double number line to answer these questions:
a. How much flour should be used with 10 pints of water?
b. How much water should be used with 24 cups of flour?
c. How much flour per pint of water does this recipe use?
Are you ready for more?
A square with side of 10 units overlaps a square with side of 8 units in such a way that its corner isplaced exactly at the center of the smaller square. As a result of the overlapping, the two sides of the largesquare intersect the two sides of the small square exactly at points and , as shown. The length of is
GRADE 6 MATHEMATICS BY
NAME DATE PERIOD
30

6 units.
7.4: Revisiting Tuna Casserole
The other day, we looked at a recipe for tuna casserole that called for 10 ounces of cream of chicken soupfor every 3 cups of elbow-shaped pasta.
1. Draw a double number line diagram that represents the amounts of soup and pasta in different-sizedbatches of this recipe.
2. If you made a large amount of tuna casserole by mixing 40 ounces of soup with 15 cups of pasta,would it taste the same as the original recipe? Explain or show your reasoning.
3. The original recipe asked for 6 ounces of tuna for every 3 cups of pasta. Add a line to your diagram torepresent the amount of tuna in different batches of casserole.
4. How many ounces of soup should you mix with 30 ounces of tuna to make a casserole that tastes the
What is the area of the overlapping region ?
GRADE 6 MATHEMATICS BY
NAME DATE PERIOD
31
same as the original recipe?
GRADE 6 MATHEMATICS BY
NAME DATE PERIOD
32

Lesson 7 Summary
Here are some guidelines to keep in mind when drawing a double number line diagram:
The two parallel lines should have labels that describe what the numbers represent.The tick marks and numbers should be spaced at equal intervals.Numbers that line up vertically make equivalent ratios.
For example, the ratio of the number of eggs to cups of milk in a recipe is . Here is a double numberline that represents the situation:
We can also say that this recipe uses “4 eggs per cup of milk” because the word per means “for each.”
Lesson 7 Glossary Terms
per
•••
•
GRADE 6 MATHEMATICS BY
NAME DATE PERIOD
Unit 2: Introducing Ratios Lesson 7: Creating Double Number Line Diagrams 5
33
m.openup.org//6-2-8-2
Unit 2, Lesson 8: How Much for One?Let’s use ratios to describe how much things cost.
8.1: Number Talk: Remainders in Division
Find the quotient mentally.
8.2: Grocery Shopping
Answer each question and explain or show your reasoning. If you get stuck, considerdrawing a double number line diagram.
3. A 10-pound sack of flour costs $8.
a. How much does 40 pounds of flour cost?
b. What is the cost per pound of flour?
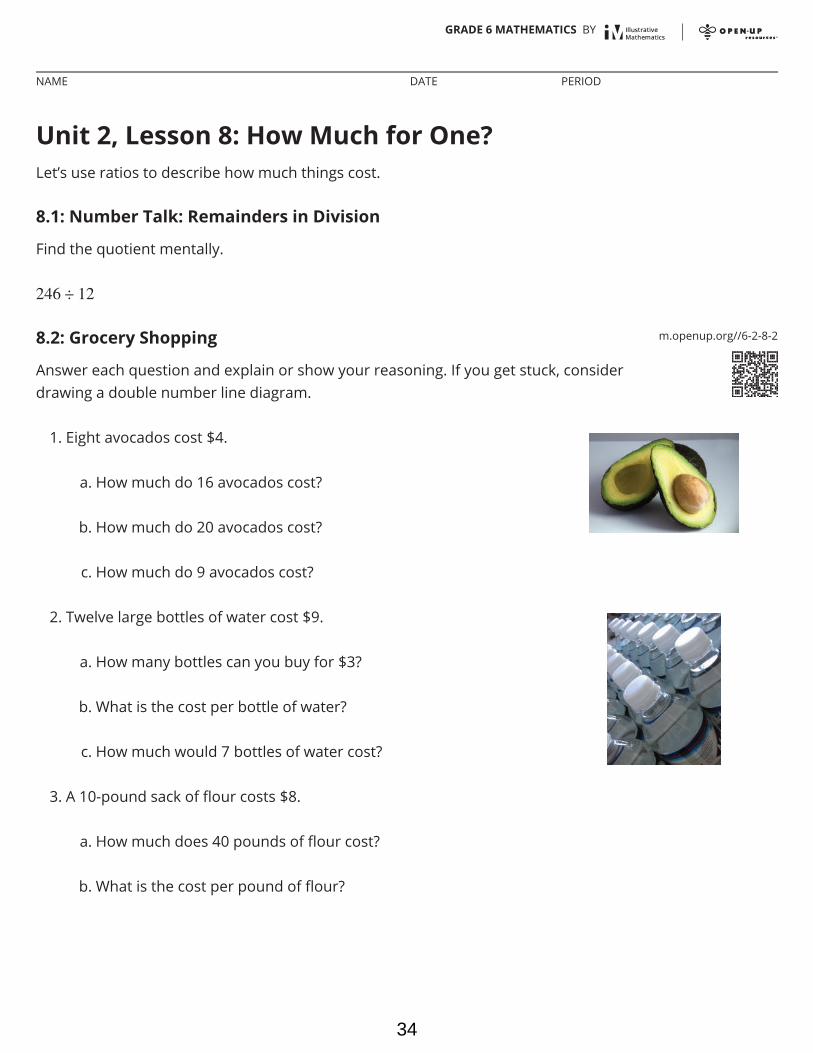
1. Eight avocados cost $4.
a. How much do 16 avocados cost?
b. How much do 20 avocados cost?
c. How much do 9 avocados cost?
2. Twelve large bottles of water cost $9.
a. How many bottles can you buy for $3?
b. What is the cost per bottle of water?
c. How much would 7 bottles of water cost?
GRADE 6 MATHEMATICS BY
NAME DATE PERIOD
34
m.openup.org//6-2-8-3
Are you ready for more?
Is bigger always better? It is commonly thought that buying larger packages or containers, sometimescalled buying in bulk, is a great way to save money. For example, a 6-pack of soda might cost $3 while a12-pack of the same brand costs $5.
Find 3 different cases where it is not true that buying in bulk saves money. You may use the internet or goto a local grocery store and take photographs of the cases you find. Make sure the products are the samebrand. For each example you find, give the quantity or size of each, and describe how you know that thelarger size is not a better deal.
8.3: More Shopping
3. Neon bracelets cost $1 for 4.
a. What is the cost per bracelet?
b. At this rate, how much will 11 neon bracelets cost?
Pause here so you teacher can review your work.
4. Your teacher will assign you one of the problems. Create a visual display that shows your solution tothe problem. Be prepared to share your solution with the class.
1. Four bags of chips cost $6.
a. What is the cost per bag?
b. At this rate, how much will 7 bags of chips cost?
2. At a used book sale, 5 books cost $15.
a. What is the cost per book?
b. At this rate, how many books can you buy for $21?
GRADE 6 MATHEMATICS BY
NAME DATE PERIOD
35
Lesson 8 Summary
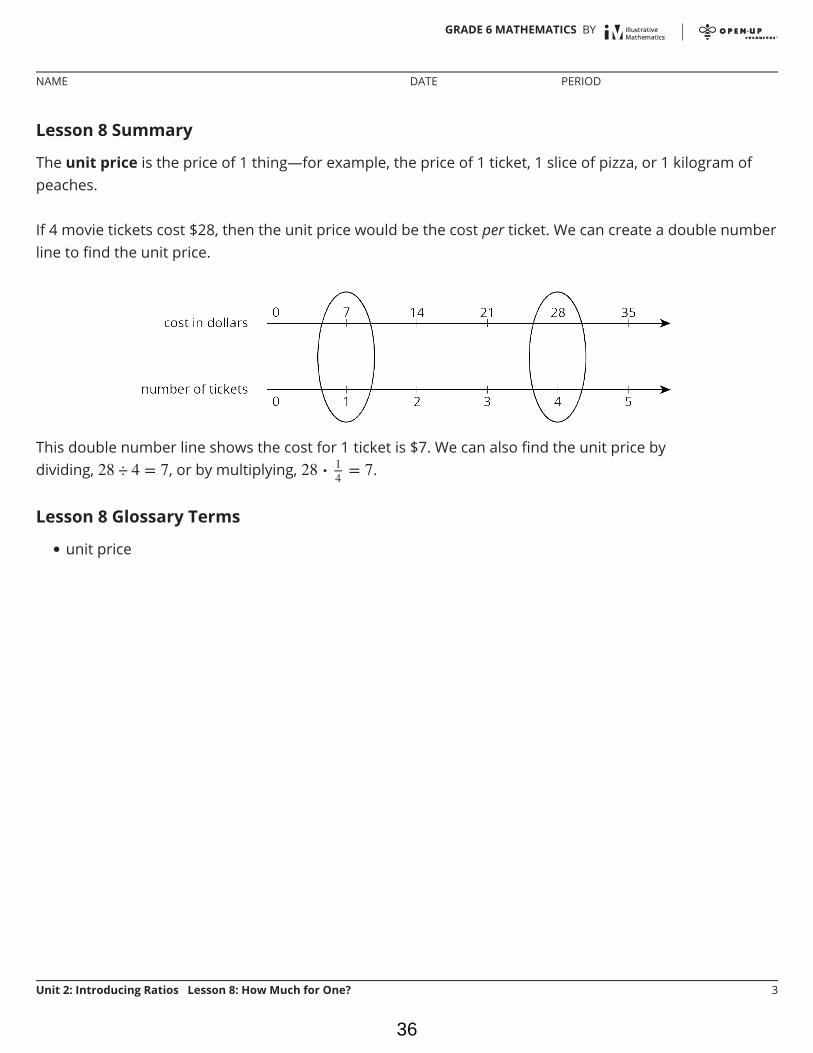
The unit price is the price of 1 thing—for example, the price of 1 ticket, 1 slice of pizza, or 1 kilogram ofpeaches.
If 4 movie tickets cost $28, then the unit price would be the cost per ticket. We can create a double numberline to find the unit price.
This double number line shows the cost for 1 ticket is $7. We can also find the unit price bydividing, , or by multiplying, .
Lesson 8 Glossary Terms
unit price•
GRADE 6 MATHEMATICS BY
NAME DATE PERIOD
Unit 2: Introducing Ratios Lesson 8: How Much for One? 3
36
Unit 2, Lesson 9: Constant SpeedLet’s use ratios to work with how fast things move.
9.1: Number Talk: Dividing by Powers of 10
Find the quotient mentally.
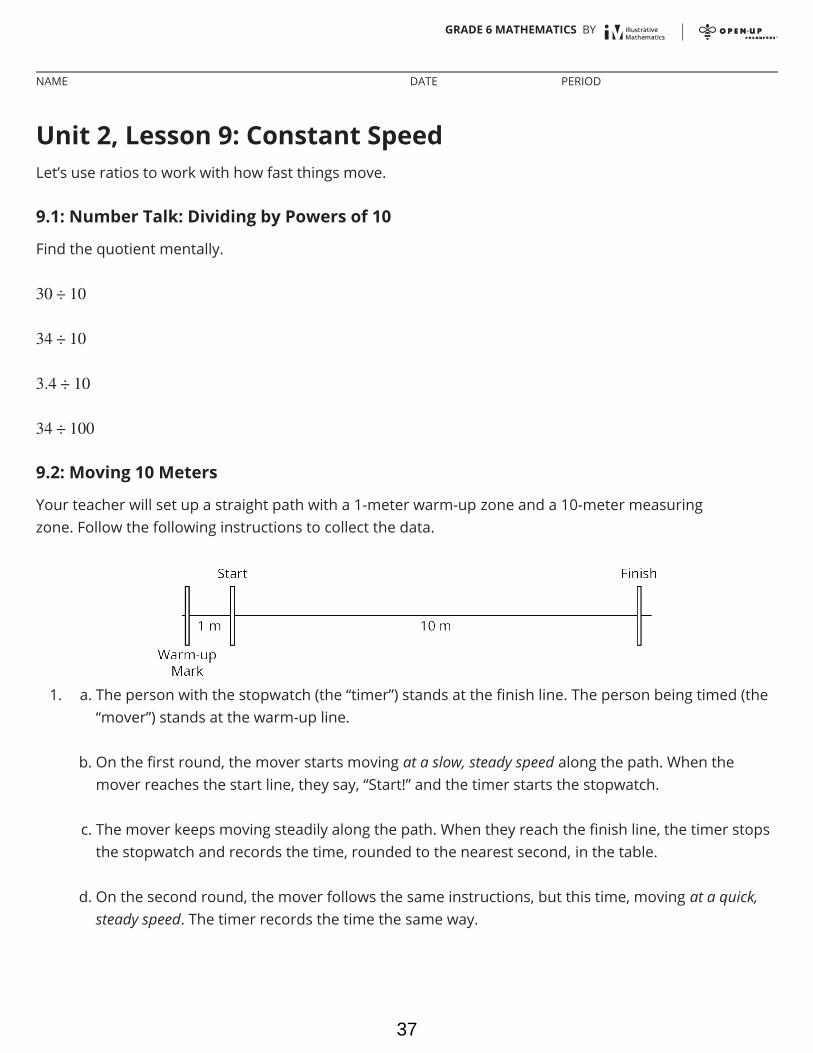
9.2: Moving 10 Meters
Your teacher will set up a straight path with a 1-meter warm-up zone and a 10-meter measuringzone. Follow the following instructions to collect the data.
1. a. The person with the stopwatch (the “timer”) stands at the finish line. The person being timed (the“mover”) stands at the warm-up line.
b. On the first round, the mover starts moving at a slow, steady speed along the path. When themover reaches the start line, they say, “Start!” and the timer starts the stopwatch.
c. The mover keeps moving steadily along the path. When they reach the finish line, the timer stopsthe stopwatch and records the time, rounded to the nearest second, in the table.
d. On the second round, the mover follows the same instructions, but this time, moving at a quick,steady speed. The timer records the time the same way.
GRADE 6 MATHEMATICS BY
NAME DATE PERIOD
37
m.openup.org//6-2-9-3
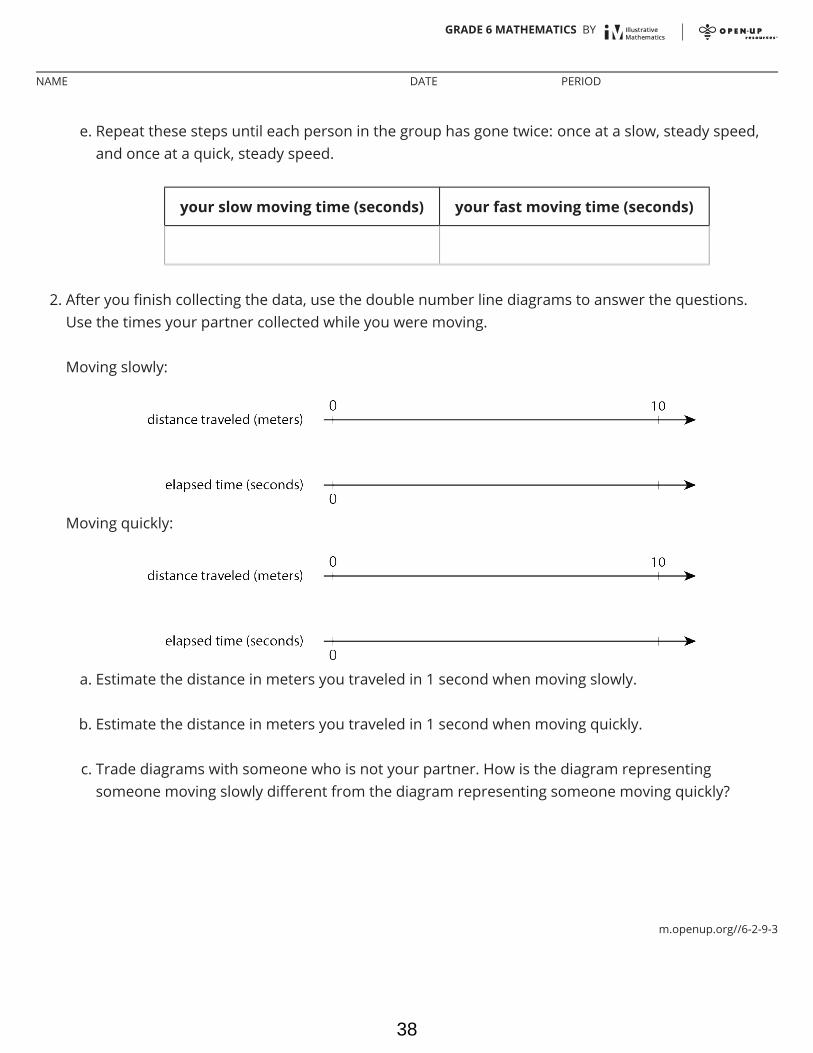
e. Repeat these steps until each person in the group has gone twice: once at a slow, steady speed,and once at a quick, steady speed.
your slow moving time (seconds) your fast moving time (seconds)
2. After you finish collecting the data, use the double number line diagrams to answer the questions.Use the times your partner collected while you were moving.
Moving slowly:
Moving quickly:
a. Estimate the distance in meters you traveled in 1 second when moving slowly.
b. Estimate the distance in meters you traveled in 1 second when moving quickly.
c. Trade diagrams with someone who is not your partner. How is the diagram representingsomeone moving slowly different from the diagram representing someone moving quickly?
GRADE 6 MATHEMATICS BY
NAME DATE PERIOD
38
9.3: Moving for 10 Seconds
Lin and Diego both ran for 10 seconds, each at their own constant speed. Lin ran 40 meters andDiego ran 55 meters.
1. Who was moving faster? Explain your reasoning.
2. How far did each person move in 1 second? If you get stuck, consider drawing double number linediagrams to represent the situations.
3. Use your data from the previous activity to find how far you could travel in 10 seconds at your quickerspeed.
4. Han ran 100 meters in 20 seconds at a constant speed. Is this speed faster, slower, or the same asLin’s? Diego’s? Yours?
Are you ready for more?
Lin and Diego want to run a race in which they will both finish when the timer reads exactly 30 seconds.Who should get a head start, and how long should the head start be?
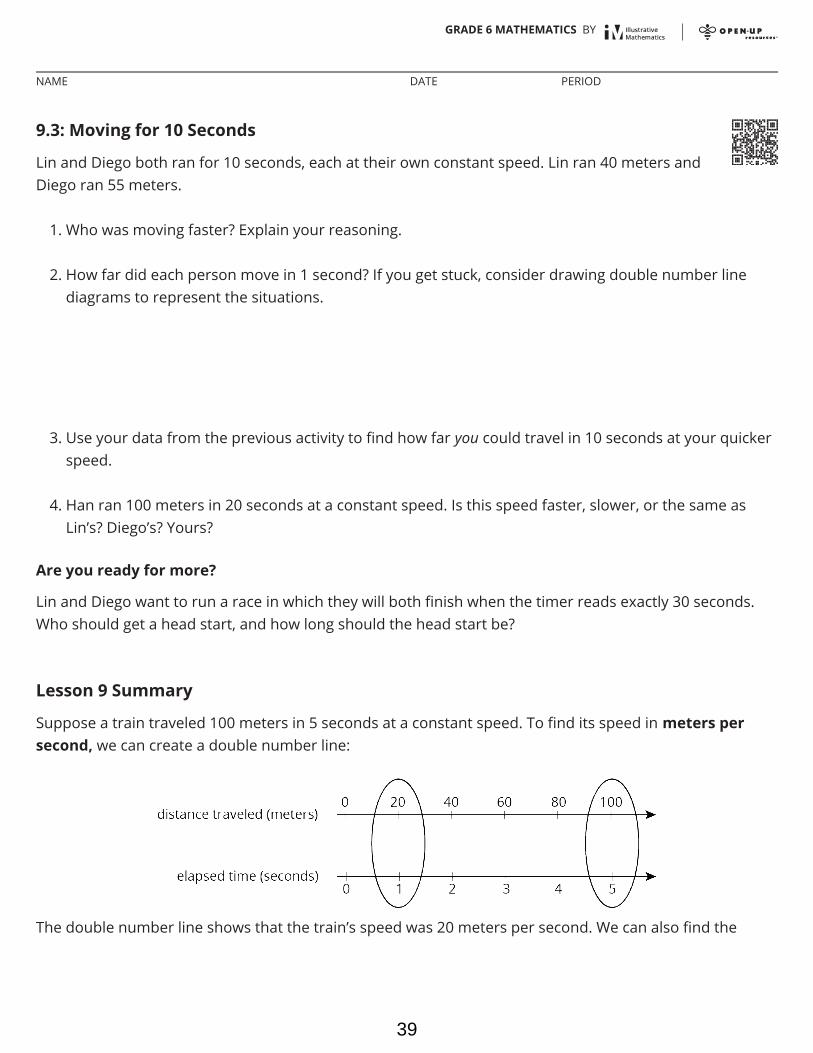
Lesson 9 Summary
Suppose a train traveled 100 meters in 5 seconds at a constant speed. To find its speed in meters persecond, we can create a double number line:
The double number line shows that the train’s speed was 20 meters per second. We can also find the
GRADE 6 MATHEMATICS BY
NAME DATE PERIOD
39

speed by dividing: .
Once we know the speed in meters per second, many questions about the situation become simpler toanswer because we can multiply the amount of time an object travels by the speed to get the distance. Forexample, at this rate, how far would the train go in 30 seconds? Since , the train would go 600meters in 30 seconds.
Lesson 9 Glossary Terms
meters per second•
GRADE 6 MATHEMATICS BY
NAME DATE PERIOD
Unit 2: Introducing Ratios Lesson 9: Constant Speed 4
40

m.openup.org//6-2-10-2
Unit 2, Lesson 10: Comparing Situations by ExaminingRatiosLet’s use ratios to compare situations.
10.1: Treadmills
Mai and Jada each ran on a treadmill. The treadmill display shows the distance, in miles, each personran and the amount of time it took them, in minutes and seconds.
1. What is the same about their workouts? What is different about their workouts?
2. If each person ran at a constant speed the entire time, who was running faster? Explain yourreasoning.
10.2: Concert Tickets
Diego paid $47 for 3 tickets to a concert. Andre paid $141 for 9 tickets to a concert. Didthey pay at the same rate? Explain your reasoning.
Here is Mai’s treadmill display: Here is Jada’s treadmill display:
GRADE 6 MATHEMATICS BY
NAME DATE PERIOD
41
m.openup.org//6-2-10-310.3: Sparkling Orange Juice
Lin and Noah each have their own recipe for making sparkling orange juice.
Lin mixes 3 liters of orange juice with 4 liters of soda water.Noah mixes 4 liters of orange juice with 5 liters of soda water.
How do the two mixtures compare in taste? Explain your reasoning.
Are you ready for more?
1. How can Lin make her sparkling orange juice taste the same as Noah’s just by adding more of oneingredient? How much will she need?
2. How can Noah make his sparkling orange juice taste the same as Lin’s just by adding more of oneingredient? How much will he need?
••
GRADE 6 MATHEMATICS BY
NAME DATE PERIOD
42
Lesson 10 Summary
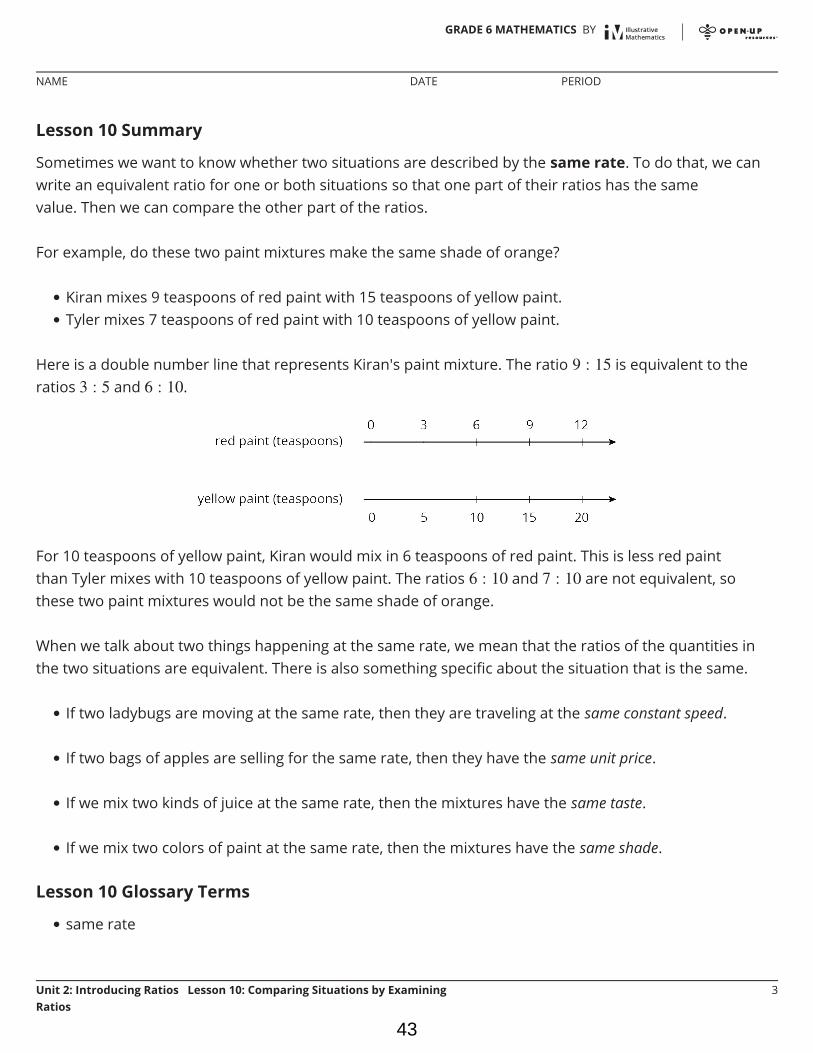
Sometimes we want to know whether two situations are described by the same rate. To do that, we canwrite an equivalent ratio for one or both situations so that one part of their ratios has the samevalue. Then we can compare the other part of the ratios.
For example, do these two paint mixtures make the same shade of orange?
Kiran mixes 9 teaspoons of red paint with 15 teaspoons of yellow paint.Tyler mixes 7 teaspoons of red paint with 10 teaspoons of yellow paint.
Here is a double number line that represents Kiran's paint mixture. The ratio is equivalent to theratios and .
For 10 teaspoons of yellow paint, Kiran would mix in 6 teaspoons of red paint. This is less red paintthan Tyler mixes with 10 teaspoons of yellow paint. The ratios and are not equivalent, sothese two paint mixtures would not be the same shade of orange.
When we talk about two things happening at the same rate, we mean that the ratios of the quantities inthe two situations are equivalent. There is also something specific about the situation that is the same.
If two ladybugs are moving at the same rate, then they are traveling at the same constant speed.
If two bags of apples are selling for the same rate, then they have the same unit price.
If we mix two kinds of juice at the same rate, then the mixtures have the same taste.
If we mix two colors of paint at the same rate, then the mixtures have the same shade.
Lesson 10 Glossary Terms
same rate
••
•
•
•
•
•
GRADE 6 MATHEMATICS BY
NAME DATE PERIOD
Unit 2: Introducing Ratios Lesson 10: Comparing Situations by ExaminingRatios
3
43

m.openup.org//6-2-11-2
Unit 2, Lesson 11: Representing Ratios with TablesLet’s use tables to represent equivalent ratios.
11.1: How Is It Growing?
Look for a pattern in the figures.
11.2: A Huge Amount of Sparkling Orange Juice
Noah’s recipe for one batch of sparkling orange juice uses 4 liters of orange juice and 5liters of soda water.
1. Use the double number line to show how many liters of each ingredient to use for different-sizedbatches of sparkling orange juice.
2. If someone mixes 36 liters of orange juice and 45 liters of soda water, how many batches would theymake?
3. If someone uses 400 liters of orange juice, how much soda water would they need?
4. If someone uses 455 liters of soda water, how much orange juice would they need?
1. How many total tiles will be in:
a. the 4th figure?
b. the 5th figure?
c. the 10th figure?
2. How do you see it growing?
GRADE 6 MATHEMATICS BY
NAME DATE PERIOD
44

5. Explain the trouble with using a double number line diagram to answer the last two questions.
11.3: Batches of Trail Mix
A recipe for trail mix says: “Mix 7 ounces of almonds with 5 ounces of raisins.” Here is a table that hasbeen started to show how many ounces of almonds and raisins would be in different-sized batches of thistrail mix.
Are you ready for more?
You have created a best-selling recipe for chocolate chip cookies. The ratio of sugar to flour is .
Create a table in which each entry represents amounts of sugar and flour that might be used at the sametime in your recipe.
One entry should have amounts where you have fewer than 25 cups of flour.One entry should have amounts where you have between 20–30 cups of sugar.One entry can have any amounts using more than 500 units of flour.
almonds (oz) raisins (oz)
7 5
28
10
3.5
250
56
1. Complete the table so that ratios represented by eachrow are equivalent.
2. What methods did you use to fill in the table?
3. How do you know that each row shows a ratio that isequivalentto ? Explain your reasoning.
•••
GRADE 6 MATHEMATICS BY
NAME DATE PERIOD
45

Lesson 11 Summary
A table is a way to organize information. Each horizontal set of entries is called a row, and each vertical setof entries is called a column. (The table shown has 2 columns and 5 rows.) A table can be used to representa collection of equivalent ratios.
Here is a double number line diagram and a table that both represent the situation: “The price is $2 forevery 3 mangos.”
Lesson 11 Glossary Terms
table•
GRADE 6 MATHEMATICS BY
NAME DATE PERIOD
Unit 2: Introducing Ratios Lesson 11: Representing Ratios with Tables 3
46
Unit 2, Lesson 12: Navigating a Table of Equivalent RatiosLet’s use a table of equivalent ratios like a pro.
12.1: Number Talk: Multiplying by a Unit Fraction
Find the product mentally.
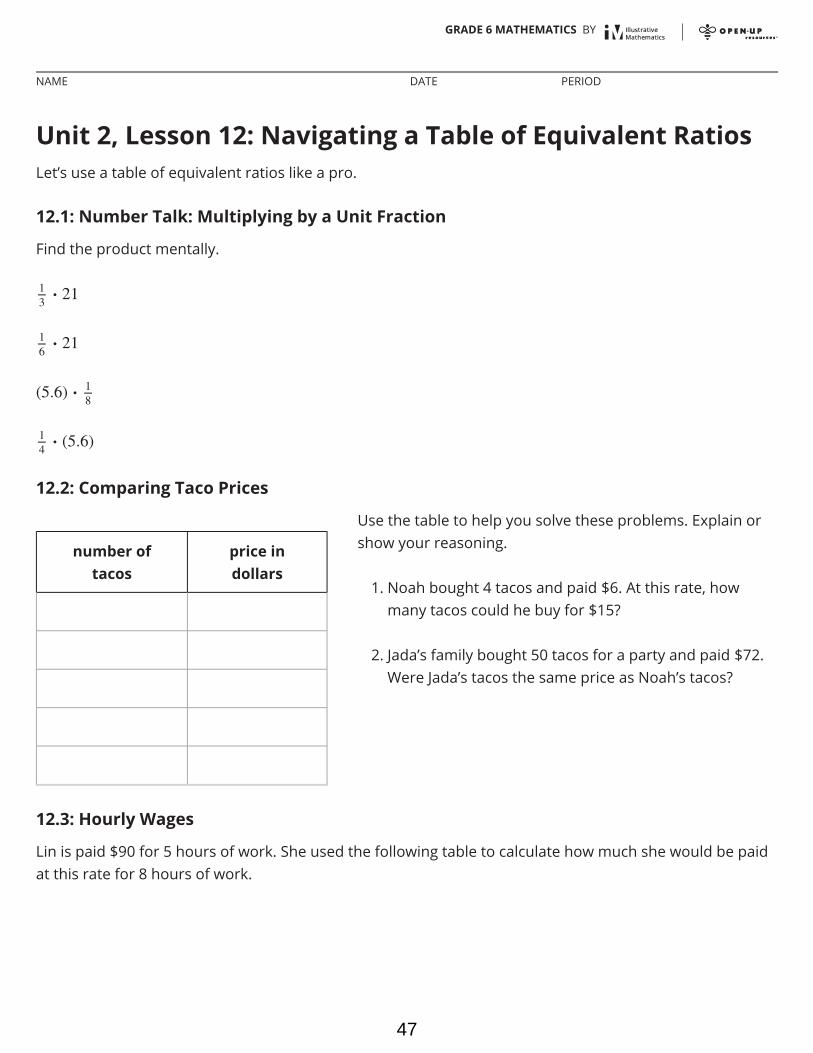
12.2: Comparing Taco Prices
12.3: Hourly Wages
Lin is paid $90 for 5 hours of work. She used the following table to calculate how much she would be paidat this rate for 8 hours of work.
number oftacos
price indollars
Use the table to help you solve these problems. Explain orshow your reasoning.
1. Noah bought 4 tacos and paid $6. At this rate, howmany tacos could he buy for $15?
2. Jada’s family bought 50 tacos for a party and paid $72.Were Jada’s tacos the same price as Noah’s tacos?
GRADE 6 MATHEMATICS BY
NAME DATE PERIOD
47

12.4: Zeno’s Memory Card
In 2016, 128 gigabytes (GB) of portable computer memory cost $32.
1. Here is a double number line that represents the situation:
1. What is the meaning of the 18 that appears inthe table?
2. Why was the number used as a multiplier?
3. Explain how Lin used this table to solve theproblem.
4. At this rate, how much would Lin be paid for 3hours of work? For 2.1 hours of work?
GRADE 6 MATHEMATICS BY
NAME DATE PERIOD
48

One set of tick marks has already been drawn to show the result of multiplying 128 and 32 each by .
Label the amount of memory and the cost for these tick marks.
Next, keep multiplying by and drawing and labeling new tick marks, until you can no longer clearly
label each new tick mark with a number.
2. Here is a table that represents the situation. Find the cost of 1 gigabyte. You can use as many rows asyou need.
Are you ready for more?
A kilometer is 1,000 meters because kilo is a prefix that means 1,000. The prefix mega means 1,000,000and giga (as in gigabyte) means 1,000,000,000. One byte is the amount of memory needed to store oneletter of the alphabet. About how many of each of the following would fit on a 1-gigabyte flash drive?
memory(gigabytes)
cost(dollars)
128 32
3. Did you prefer the double number line or thetable for solving this problem? Why?
a. letters b. pages c. books d. movies e. songs
GRADE 6 MATHEMATICS BY
NAME DATE PERIOD
49
Lesson 12 Summary
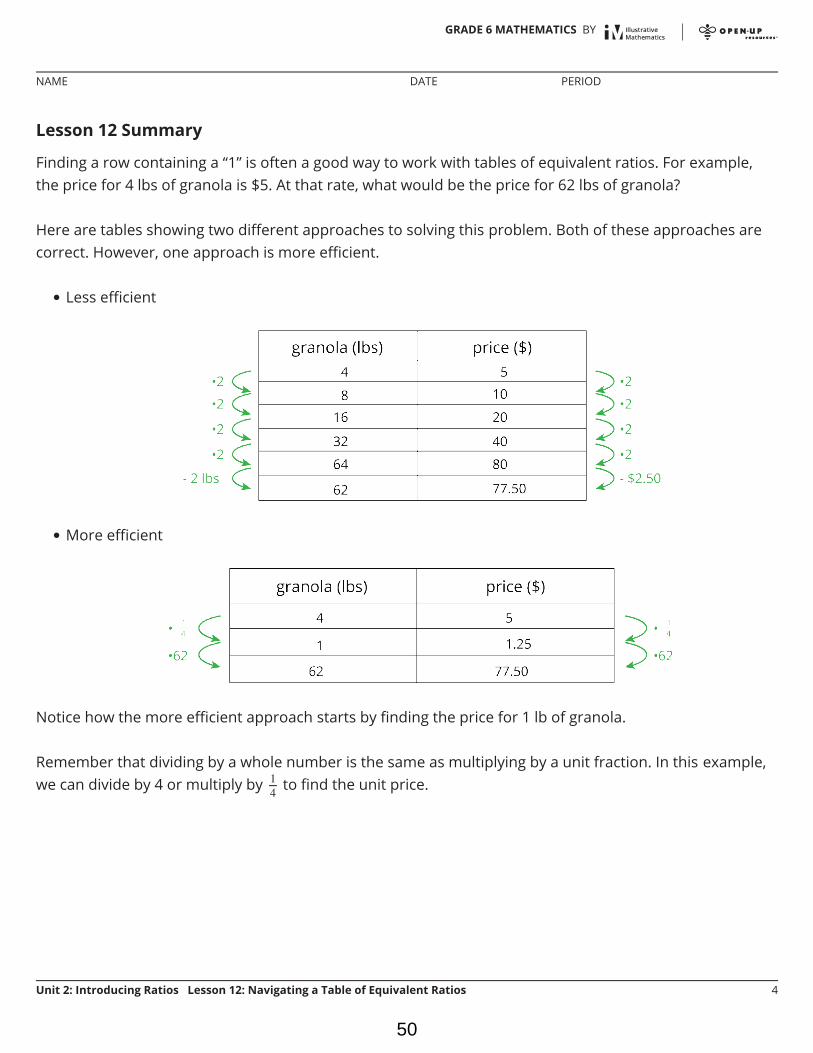
Finding a row containing a “1” is often a good way to work with tables of equivalent ratios. For example,the price for 4 lbs of granola is $5. At that rate, what would be the price for 62 lbs of granola?
Here are tables showing two different approaches to solving this problem. Both of these approaches arecorrect. However, one approach is more efficient.
Less efficient
More efficient
Notice how the more efficient approach starts by finding the price for 1 lb of granola.
Remember that dividing by a whole number is the same as multiplying by a unit fraction. In this example,we can divide by 4 or multiply by to find the unit price.
•
•
GRADE 6 MATHEMATICS BY
NAME DATE PERIOD
Unit 2: Introducing Ratios Lesson 12: Navigating a Table of Equivalent Ratios 4
50

Unit 2, Lesson 13: Tables and Double Number LineDiagramsLet’s contrast double number lines and tables.
13.1: Number Talk: Constant Dividend
1. Find the quotients mentally.
2. Locate and label the quotients on the number line.
13.2: Moving 3,000 Meters
The other day, we saw that Han can run 100 meters in 20 seconds.
2. Complete the last row with the missing number.
Han wonders how long it would take him to run 3,000 meters at thisrate. He made a table of equivalent ratios.
1. Do you agree that this table represents the situation? Explainyour reasoning.
20 100
10 50
1 5
3,000
GRADE 6 MATHEMATICS BY
NAME DATE PERIOD
51

13.3: The International Space Station
The International Space Station orbits around the Earth at a constant speed. Your teacher will give youeither a double number line or a table that represents this situation. Your partner will get the otherrepresentation.
3. What is the speed of the International Space Station?
3. What question about the situation does thisnumber answer?
4. What could Han do to improve his table?
5. Priya can bike 150 meters in 20 seconds. Atthis rate, how long would it take her to bike3,000 meters?
6. Priya’s neighbor has a dirt bike that can go 360meters in 15 seconds. At this rate, how longwould it take them to ride 3,000 meters?
1. Complete the parts of your representation that you canfigure out for sure.
2. Share information with your partner, and use theinformation that your partner shares to complete yourrepresentation.
GRADE 6 MATHEMATICS BY
NAME DATE PERIOD
52

4. Place the two completed representations side by side. Discuss with your partner some ways in whichthey are the same and some ways in which they are different.
5. Record at least one way that they are the same and one way they are different.
Are you ready for more?
The Earth’s circumference is about 40,000 kilometers and the orbit of the International Space Station isjust a bit more than this. About how long does it take for the International Space Station to orbit the Earth?
GRADE 6 MATHEMATICS BY
NAME DATE PERIOD
53
Lesson 13 Summary
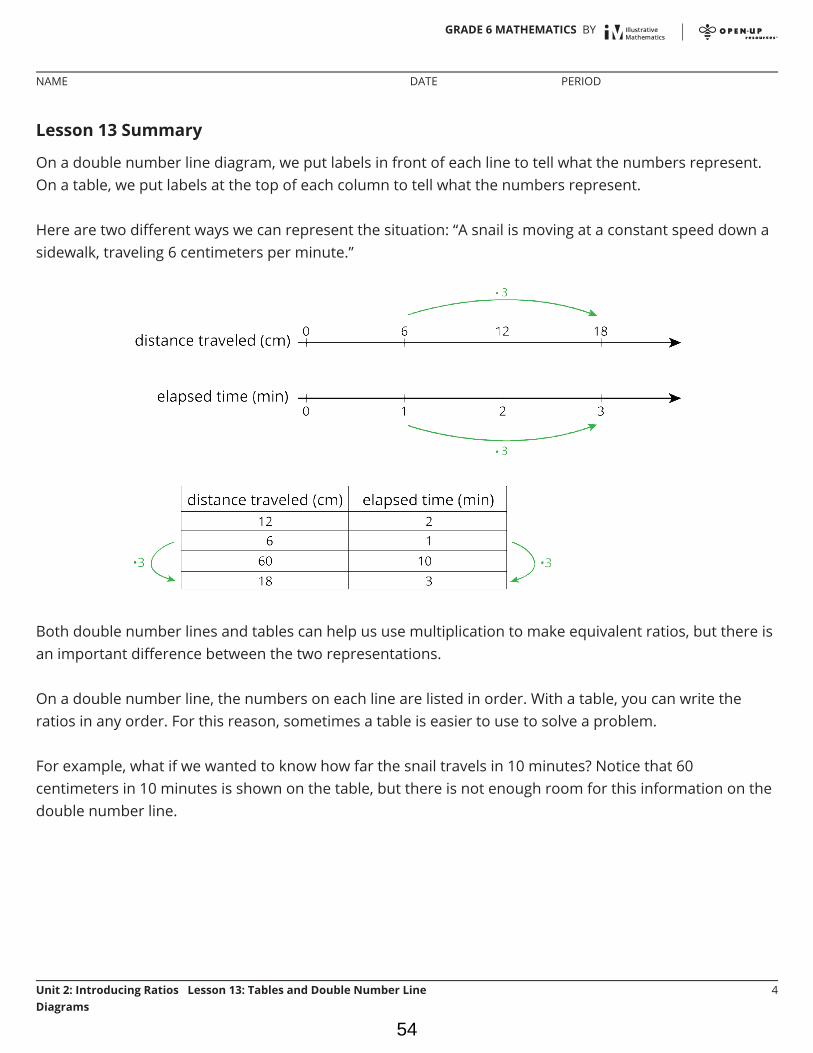
On a double number line diagram, we put labels in front of each line to tell what the numbers represent.On a table, we put labels at the top of each column to tell what the numbers represent.
Here are two different ways we can represent the situation: “A snail is moving at a constant speed down asidewalk, traveling 6 centimeters per minute.”
Both double number lines and tables can help us use multiplication to make equivalent ratios, but there isan important difference between the two representations.
On a double number line, the numbers on each line are listed in order. With a table, you can write theratios in any order. For this reason, sometimes a table is easier to use to solve a problem.
For example, what if we wanted to know how far the snail travels in 10 minutes? Notice that 60centimeters in 10 minutes is shown on the table, but there is not enough room for this information on thedouble number line.
GRADE 6 MATHEMATICS BY
NAME DATE PERIOD
Unit 2: Introducing Ratios Lesson 13: Tables and Double Number LineDiagrams
4
54

Unit 2, Lesson 14: Solving Equivalent Ratio ProblemsLet's practice getting information from our partner.
14.1: What Do You Want to Know?
Here is a problem: A red car and a blue car enter the highway at the same time and travel at a constantspeed. How far apart are they after 4 hours?
What information would you need to solve the problem?
14.2: Info Gap: Hot Chocolate and Potatoes
Your teacher will give you either a problem card or a data card. Do not show or read your card to yourpartner.
Both you and your partner should record a solution to each problem.
If your teacher gives you the problem card:
1. Read your card silently and think about whatyou need to know to be able to answer thequestions.
2. Ask your partner for specific information youneed.
3. Explain how you are using the information tosolve the problem.
4. Solve the problem and show your reasoning toyour partner.
If your teacher gives you the data card:
1. Read your card silently.
2. Ask your partner “What specific information doyou need?” and wait for them to ask forinformation.
If your partner asks for information that is noton the card, do not do the calculations forthem. Tell them you don’t have thatinformation.
3. Have them explain “Why do you need thatinformation?” before telling them theinformation.
4. After your partner solves the problem, askthem to explain their reasoning, even if youunderstand what they have done.
GRADE 6 MATHEMATICS BY
NAME DATE PERIOD
55

14.3: Comparing Reading Rates
Lin read the first 54 pages from a 270-page book in the last 3 days.Diego read the first 100 pages from a 320-page book in the last 4 days.Elena read the first 160 pages from a 480-page book in the last 5 days.
If they continue to read every day at these rates, who will finish first, second, and third? Explain or showyour reasoning.
Are you ready for more?
The ratio of cats to dogs in a room is . Five more cats enter the room, and then the ratio of cats todogs is . How many cats and dogs were in the room to begin with?
Lesson 14 Summary
To solve problems about something happening at the same rate, we often need:
Two pieces of information that allow us to write a ratio that describes the situation.
A third piece of information that gives us one number of an equivalent ratio. Solving the problemoften involves finding the other number in the equivalent ratio.
Suppose we are making a large batch of fizzy juice and the recipe says, “Mix 5 cups of cranberry juice with2 cups of soda water.” We know that the ratio of cranberry juice to soda water is , and that we need2.5 cups of cranberry juice per cup of soda water.
•••
•
•
GRADE 6 MATHEMATICS BY
NAME DATE PERIOD
56
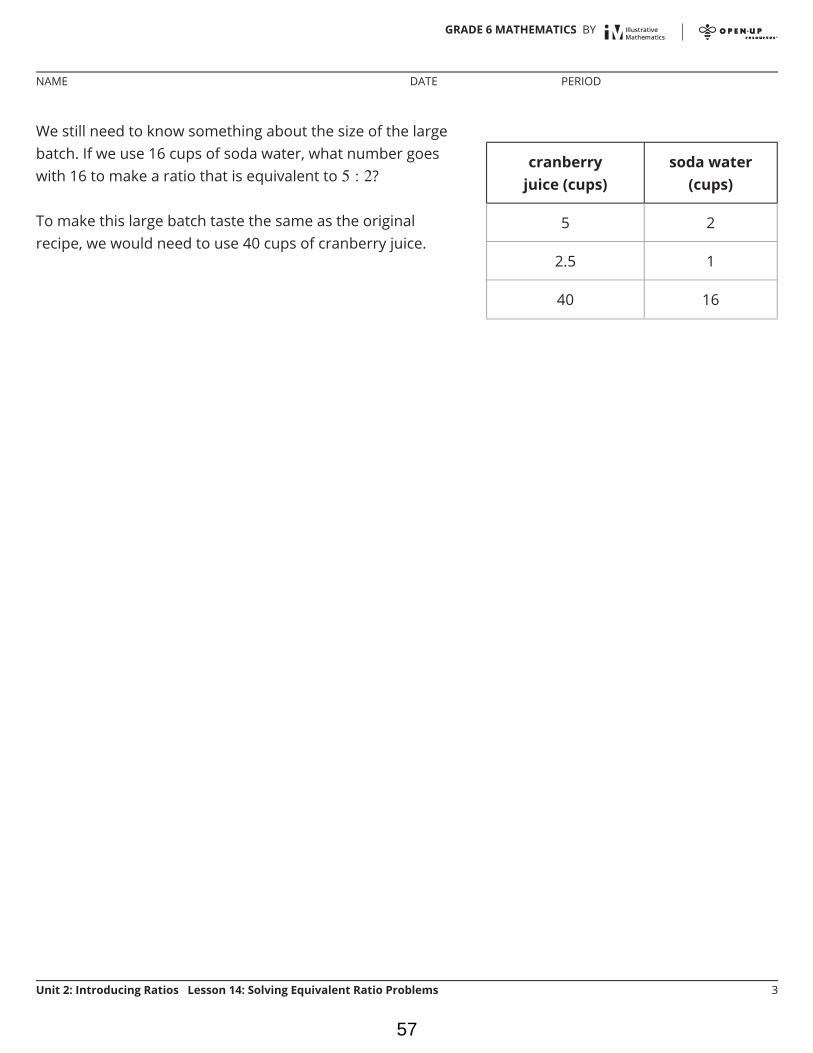
We still need to know something about the size of the largebatch. If we use 16 cups of soda water, what number goeswith 16 to make a ratio that is equivalent to ?
To make this large batch taste the same as the originalrecipe, we would need to use 40 cups of cranberry juice.
cranberryjuice (cups)
soda water(cups)
5 2
2.5 1
40 16
GRADE 6 MATHEMATICS BY
NAME DATE PERIOD
Unit 2: Introducing Ratios Lesson 14: Solving Equivalent Ratio Problems 3
57
Unit 2, Lesson 15: Part-Part-Whole RatiosLet’s look at situations where you can add the quantities in a ratio together.
15.1: True or False: Multiplying by a Unit Fraction
True or false?
15.2: Cubes of Paint
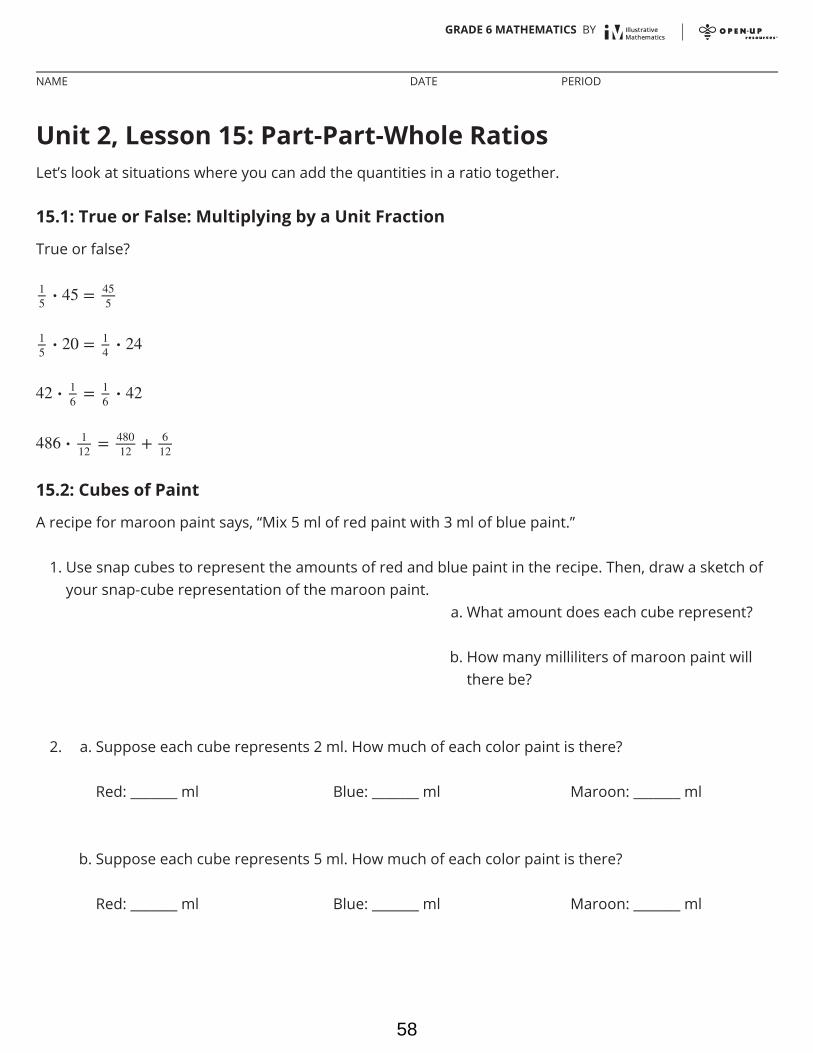
A recipe for maroon paint says, “Mix 5 ml of red paint with 3 ml of blue paint.”
1. Use snap cubes to represent the amounts of red and blue paint in the recipe. Then, draw a sketch ofyour snap-cube representation of the maroon paint.
2. a. Suppose each cube represents 2 ml. How much of each color paint is there?
b. Suppose each cube represents 5 ml. How much of each color paint is there?
a. What amount does each cube represent?
b. How many milliliters of maroon paint willthere be?
Red: _______ ml Blue: _______ ml Maroon: _______ ml
Red: _______ ml Blue: _______ ml Maroon: _______ ml
GRADE 6 MATHEMATICS BY
NAME DATE PERIOD
58

3. a. Suppose you need 80 ml of maroon paint. How much red and blue paint would you mix? Beprepared to explain your reasoning.
b. If the original recipe is for one batch of maroon paint, how many batches are in 80 ml of maroonpaint?
Red: _______ ml Blue: _______ ml Maroon: 80 ml
GRADE 6 MATHEMATICS BY
NAME DATE PERIOD
59

15.3: Sneakers, Chicken, and Fruit Juice
Solve each of the following problems and show your thinking. If you get stuck, consider drawing a tapediagram to represent the situation.
1. The ratio of students wearing sneakers to those wearing boots is 5 to 6. If there are 33 students in theclass, and all of them are wearing either sneakers or boots, how many of them are wearing sneakers?
2. A recipe for chicken marinade says, “Mix 3 parts oil with 2 parts soy sauce and 1 part orange juice.” Ifyou need 42 cups of marinade in all, how much of each ingredient should you use?
3. Elena makes fruit punch by mixing 4 parts cranberry juice to 3 parts apple juice to 2 parts grape juice.If one batch of fruit punch includes 30 cups of apple juice, how large is this batch of fruit punch?
Are you ready for more?
Using the recipe from earlier, how much fruit punch can you make if you have 50 cups of cranberry juice,40 cups of apple juice, and 30 cups of grape juice?
GRADE 6 MATHEMATICS BY
NAME DATE PERIOD
60

15.4: Invent Your Own Ratio Problem
1. Invent another ratio problem that can be solved with a tape diagram and solve it. If you get stuck,consider looking back at the problems you solved in the earlier activity.
2. Create a visual display that includes:
The new problem that you wrote, without the solution.Enough work space for someone to show a solution.
3. Trade your display with another group, and solve each other’s problem. Include a tape diagram aspart of your solution. Be prepared to share the solution with the class.
4. When the solution to the problem you invented is being shared by another group, check their answerfor accuracy.
◦◦
GRADE 6 MATHEMATICS BY
NAME DATE PERIOD
61

Lesson 15 Summary
A tape diagram is another way to represent a ratio. All the parts of the diagram that are the same sizehave the same value.
For example, this tape diagram represents the ratio of ducks to swans in a pond, which is .
Suppose we know there are 18 of these birds in the pond, and we want to know how many are ducks.
There are 4 parts of the tape representing ducks, and , so there are 8 ducks in the pond.
Lesson 15 Glossary Terms
tape diagram
The first tape represents the number of ducks. Ithas 4 parts.
The second tape represents the number of swans.It has 5 parts.
There are 9 parts in all, because .
The 9 equal parts on the diagram need torepresent 18 birds in all. This means that each partof the tape diagram represents 2 birds, because
.
•
GRADE 6 MATHEMATICS BY
NAME DATE PERIOD
Unit 2: Introducing Ratios Lesson 15: Part-Part-Whole Ratios 5
62
Unit 2, Lesson 16: Solving More Ratio ProblemsLet’s compare all our strategies for solving ratio problems.
16.1: You Tell the Story
Describe a situation with two quantities that this tape diagram could represent.
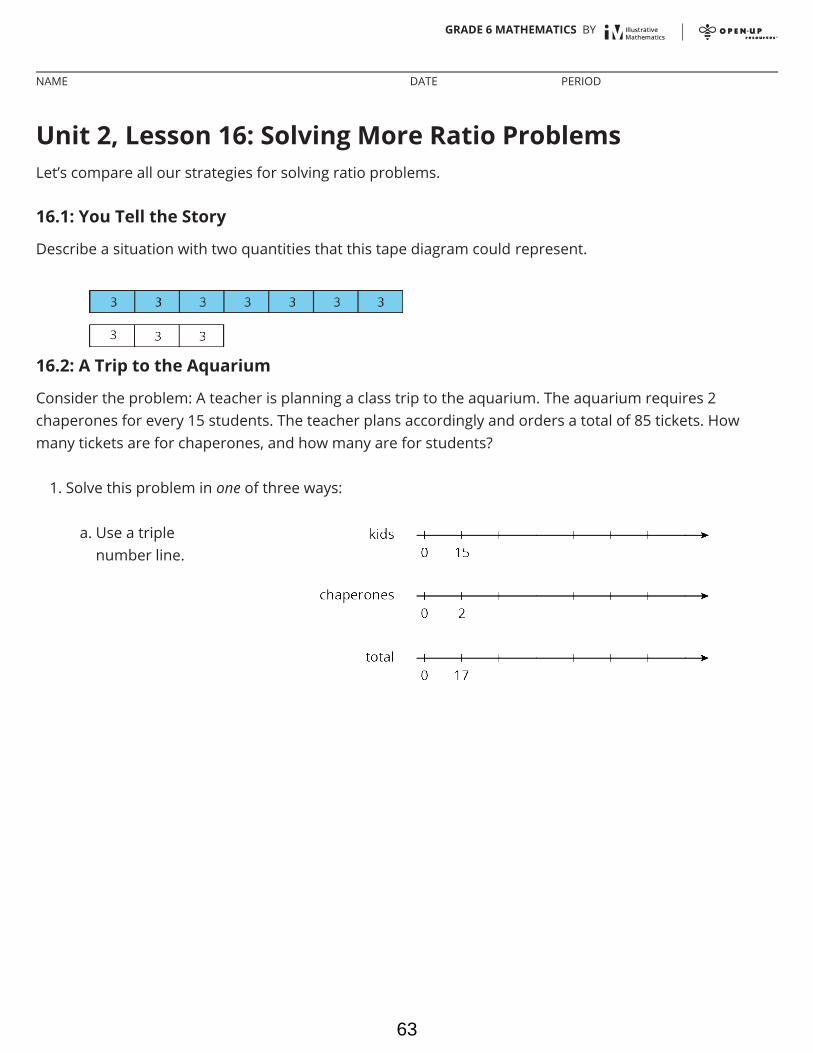
16.2: A Trip to the Aquarium
Consider the problem: A teacher is planning a class trip to the aquarium. The aquarium requires 2chaperones for every 15 students. The teacher plans accordingly and orders a total of 85 tickets. Howmany tickets are for chaperones, and how many are for students?
1. Solve this problem in one of three ways:
a. Use a triplenumber line.
GRADE 6 MATHEMATICS BY
NAME DATE PERIOD
63
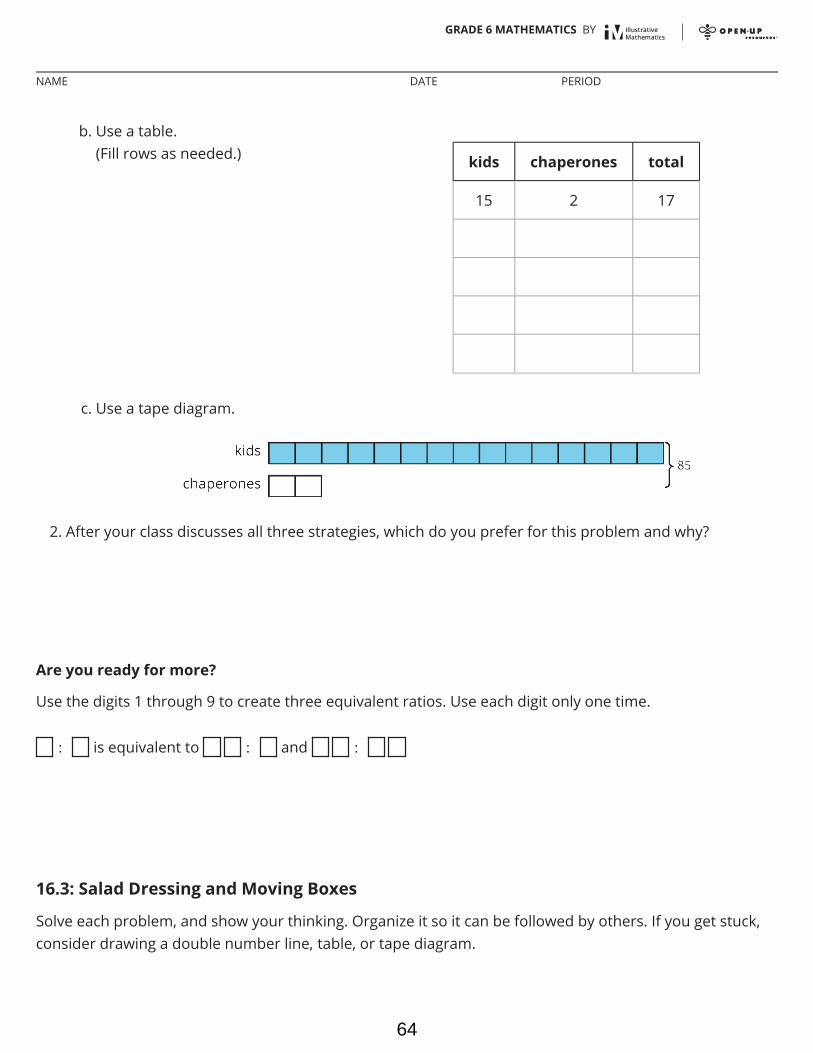
c. Use a tape diagram.
2. After your class discusses all three strategies, which do you prefer for this problem and why?
Are you ready for more?
Use the digits 1 through 9 to create three equivalent ratios. Use each digit only one time.
is equivalent to and
16.3: Salad Dressing and Moving Boxes
Solve each problem, and show your thinking. Organize it so it can be followed by others. If you get stuck,consider drawing a double number line, table, or tape diagram.
b. Use a table.(Fill rows as needed.) kids chaperones total
15 2 17
GRADE 6 MATHEMATICS BY
NAME DATE PERIOD
64
1. A recipe for salad dressing calls for 4 parts oil for every 3 parts vinegar. How much oil should you useto make a total of 28 teaspoons of dressing?
GRADE 6 MATHEMATICS BY
NAME DATE PERIOD
65

2. Andre and Han are moving boxes. Andre can move 4 boxes every half hour. Han can move 5 boxesevery half hour. How long will it take Andre and Han to move all 72 boxes?
Lesson 16 Summary
When solving a problem involving equivalent ratios, it is often helpful to use a diagram. Any diagram isfine as long as it correctly shows the mathematics and you can explain it.
Let’s compare three different ways to solve the same problem: The ratio of adults to kids in a school is. If there is a total of 180 people, how many of them are adults?
Tape diagrams are especially useful for this type of problem because both parts of the ratio have thesame units (“number of people") and we can see the total number of parts.
This tape diagram has 9 equal parts, and they need to represent 180 people total. That means eachpart represents , or 20 people.
Two parts of the tape diagram represent adults. There are 40 adults in the school because .
•
GRADE 6 MATHEMATICS BY
NAME DATE PERIOD
66

Double or triple number lines are useful when we want to see how far apart the numbers are from oneanother. They are harder to use with very big or very small numbers, but they could support ourreasoning.
Tables are especially useful when the problem has very large or very small numbers.
We ask ourselves, “9 times what is 180?” The answer is 20. Next, we multiply 2 by 20 to get the totalnumber of adults in the school.
Another reason to make diagrams is to communicate our thinking to others. Here are some good habitswhen making diagrams:
Label each part of the diagram with what it represents.Label important amounts.Make sure you read what the question is asking and answer it.Make sure you make the answer easy to find.Include units in your answer. For example, write “4 cups” instead of just “4.”Double check that your ratio language is correct and matches your diagram.
•
•
••••••
GRADE 6 MATHEMATICS BY
NAME DATE PERIOD
Unit 2: Introducing Ratios Lesson 16: Solving More Ratio Problems 5
67
Unit 2, Lesson 17: A Fermi ProblemLet’s solve a Fermi problem.
17.1: Fix It!
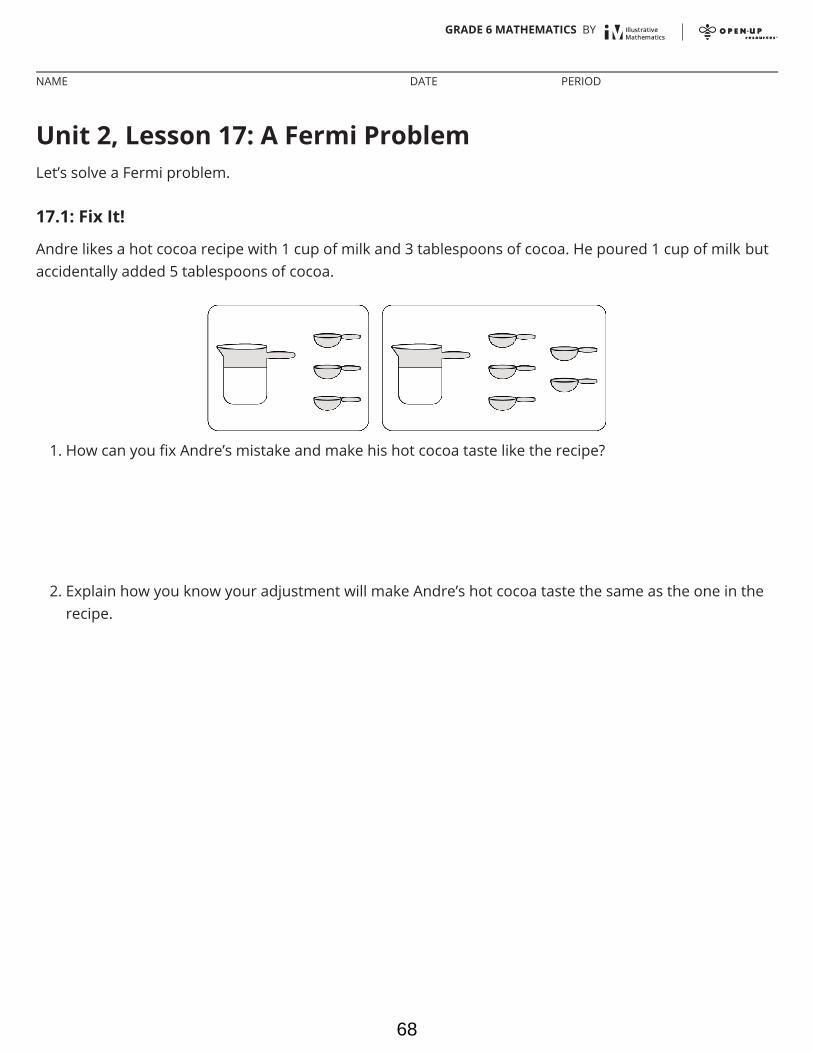
Andre likes a hot cocoa recipe with 1 cup of milk and 3 tablespoons of cocoa. He poured 1 cup of milk butaccidentally added 5 tablespoons of cocoa.
1. How can you fix Andre’s mistake and make his hot cocoa taste like the recipe?
2. Explain how you know your adjustment will make Andre’s hot cocoa taste the same as the one in therecipe.
GRADE 6 MATHEMATICS BY
NAME DATE PERIOD
68
17.2: Who Was Fermi?
1. Record the Fermi question that your class will explore together.
2. Make an estimate of the answer. If making an estimate is too hard, consider writing down a numberthat would definitely be too low and another number that would definitely be too high.
3. What are some smaller sub-questions we would need to figure out to reasonably answer our biggerquestion?
4. Think about how the smaller questions above should be organized to answer the big question. Labeleach smaller question with a number to show the order in which they should be answered. If younotice a gap in the set of sub-questions (i.e., there is an unlisted question that would need to beanswered before the next one could be tackled), write another question to fill the gap.
GRADE 6 MATHEMATICS BY
NAME DATE PERIOD
69

17.3: Researching Your Own Fermi Problem
1. Brainstorm at least five Fermi problems that you want to research and solve. If you get stuck, considerstarting with “How much would it cost to . . .?” or “How long would it take to . . .?”
2. Pause here so your teacher can review your questions and approve one of them.
GRADE 6 MATHEMATICS BY
NAME DATE PERIOD
70
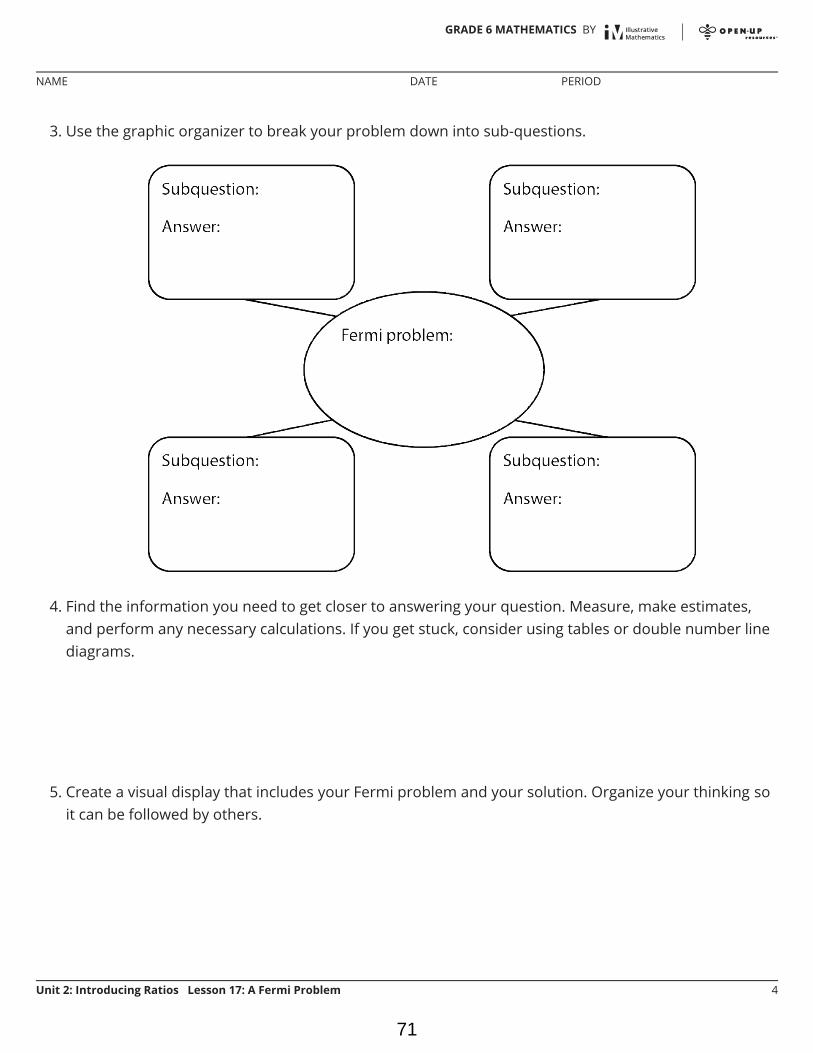
3. Use the graphic organizer to break your problem down into sub-questions.
4. Find the information you need to get closer to answering your question. Measure, make estimates,and perform any necessary calculations. If you get stuck, consider using tables or double number linediagrams.
5. Create a visual display that includes your Fermi problem and your solution. Organize your thinking soit can be followed by others.
GRADE 6 MATHEMATICS BY
NAME DATE PERIOD
Unit 2: Introducing Ratios Lesson 17: A Fermi Problem 4
71