Embed Size (px)
Citation preview

Unit 01 Review: Description Statistics Describing or comparing distributions: Always give the shape, center, and spread in the context of the question. You may need to include outliers as well. Shape: Tell me what the graph looks like.
- Symmetric - Skewed and direction of skewness - Uniform - Peaks (modes) and the location of the peaks - Gaps in data and the location of the gaps - Unusual values in the data and the location of those values
Center: Tell (numerically) where the center of the data is.
- Mean (average): 𝜇 for population, �̅� for sample - Median: middle value when data is listed from low to high - Mode: peak in the distribution or most frequently occurring value
Spread or variability: Tell (numerically) how spread out the data is.
- Standard deviation: the “average” distance between the data points and the mean - Inter-Quartile Range (IQR): range of the middle 50% of the data = Q3 – Q1 - Range: maximum – minimum
Identifying an outlier:
- An unusual value in the data set which is too far from its quartiles - Numerically, this is any value that exceeds Q1 – 1.5(IQR) or Q3 + 1.5(IQR) for skewed
distributions or �̅� ± 2(standard deviation) Choosing appropriate measures of center and spread:
- If the data is fairly symmetric, use the mean and standard deviation. These are not resistant to the presence of skewness or outliers.
- If the data is skewed or outliers are present, use the median and IQR instead. - Use the mode or range for additional information or if the other measures cannot be
calculated from the information given. Drawing and/or interpreting graphs (by hand or by your calculator):
- Histogram (with either frequency or relative frequency on the vertical axis) - Stemplot (also called stem-and-leaf plot) - Dot plot (for small data sets) - Boxplot and modified boxplot (which shows outliers) - Cumulative frequency plot or OGIVE - Normal quartile plot
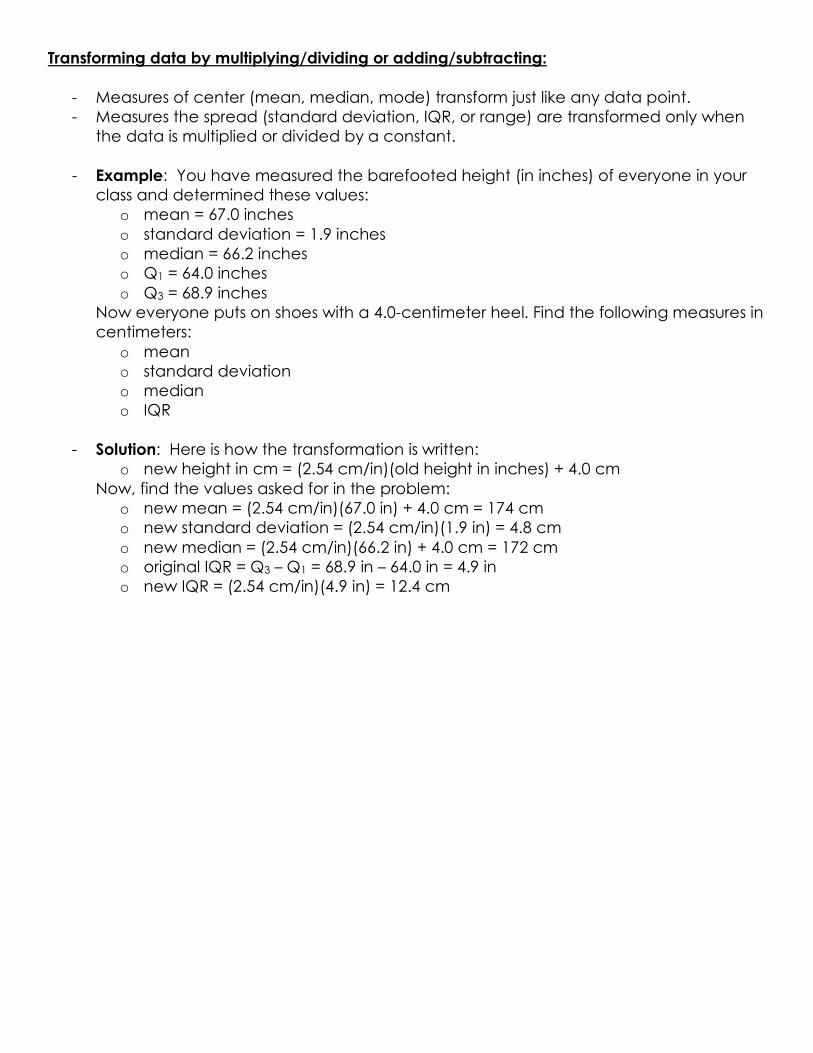
Transforming data by multiplying/dividing or adding/subtracting:
- Measures of center (mean, median, mode) transform just like any data point. - Measures the spread (standard deviation, IQR, or range) are transformed only when
the data is multiplied or divided by a constant.
- Example: You have measured the barefooted height (in inches) of everyone in your class and determined these values:
o mean = 67.0 inches o standard deviation = 1.9 inches o median = 66.2 inches o Q1 = 64.0 inches o Q3 = 68.9 inches
Now everyone puts on shoes with a 4.0-centimeter heel. Find the following measures in centimeters:
o mean o standard deviation o median o IQR
- Solution: Here is how the transformation is written:
o new height in cm = (2.54 cm/in)(old height in inches) + 4.0 cm Now, find the values asked for in the problem:
o new mean = (2.54 cm/in)(67.0 in) + 4.0 cm = 174 cm o new standard deviation = (2.54 cm/in)(1.9 in) = 4.8 cm o new median = (2.54 cm/in)(66.2 in) + 4.0 cm = 172 cm o original IQR = Q3 – Q1 = 68.9 in – 64.0 in = 4.9 in o new IQR = (2.54 cm/in)(4.9 in) = 12.4 cm

Multiple Choice:
1. If the largest value of a data set is doubled, which of the following is false? a. The mean increases b. The standard deviation increases c. The interquartile range increases d. The range increases e. The median remains unchanged
2. The five-number summary for scores on a statistics exam is 35, 68, 77, 83, 97. In all, 196
students took the test. About how many had scores between 77 and 83? a. 6 b. 39 c. 49 d. 98 e. it cannot be determined from the information given
3. The following list is a set of data ordered from smallest to largest. All values are integers.
2 12 y y y 15 18 18 19
I. The median and the first quartile cannot be equal II. The mode is 18 III. 2 is an outlier
a. I only b. II only c. III only d. I and III only e. I, II, and III
4. A substitute teacher was asked to keep track of how long it took her to get to her
assigned school each morning. Here is a stem plot of the data. Would you expect the mean to be higher or lower than the median?
a. Lower, because the data are skewed to the left b. Lower, because the data are skewed to the right c. Higher, because the data are skewed to the left d. Higher, because the data are skewed to the right e. Neither, because the mean would equal the median

5. A professor scaled (curved) the scores on an exam by multiplying the students’ raw scores by 1.2, then adding 15 points. If the mean and standard deviation of the scores before the curve were 51 and 5, respectively, then the mean and standard deviation of the scaled scores are respectively:
a. 76.2 and 21 b. 76.2 and 6 c. 76.2 and 5 d. 61 and 6 e. cannot be determined without knowing if the scores are Normally distributed
6. In the northern US, schools are often closed during severe snowstorms. These missed days must be made up at the end of the school year. The following histogram shows the number of days missed per year for a particular school district using data from the past 75 years. Which of the following should be used to describe the center of the distribution?
a. Mean, because it uses information from all 75 years b. Median, because the distribution is skewed c. IQR, because it excludes outliers and includes the middle 50% of the data d. Quartile 1, because the distribution is skewed to the right e. Standard deviation, because it is unaffected by outliers

7. Which boxplot was made from the same data as this histogram?
a.
b.
c.
d.
e. none of the above
8. One advantage of using a stem-and-leaf plot rather than a histogram is that the stem-and-leaf plot
a. Shows the shape of the distribution more easily than the histogram b. Changes easily from frequency to relative frequency c. Shows all of the data on the graph d. Presents the percentage distribution of the data e. Shows the mean on the graph

9. This histogram shows the closing price of a stock on 51 days. In which range does the first quartile lie?
a. 0 to 10 b. 10 to 20 c. 20 to 30 d. 30 to 40 e. 80 to 90
10. The scores of male (M) and female (F) students on a statistics exam are displayed in
the following boxplots. The pluses indicate the location of the means. Which of the following is correct?
a. The mean grade of the females is about 72 b. About 75% of the males score above 82 c. The median of the male students is about 66 d. The scores of the males have a higher variability than the scores of the females e. About 25% of the females scored above 72

Free Response:
1. As a project in their physical education classes, elementary students were asked to kick a soccer ball into a goal from a fixed distance away. Each student was given 8 chances to kick the ball, and the number of goals was recorded for each student. The number of goals in 200 first graders is given in the table.
Number of goals scored Number of first graders
0 14 1 37 2 51 3 33 4 30 5 14 6 11 7 7 8 3
In order to compare whether older children are better at kicking goals, the exercise was repeated with 200 fourth graders.
Number of goals scored Number of fourth graders
0 5 1 11 2 18 3 24 4 27 5 34 6 39 7 38 8 14

a. Graph these two distributions so that the number of goals scored by the first graders and the number of goals scored by the fourth graders can be easily compared.
b. Based on your graphs, how do the results from the fourth graders differ from those of the first graders? Write a few sentences to answer this question.
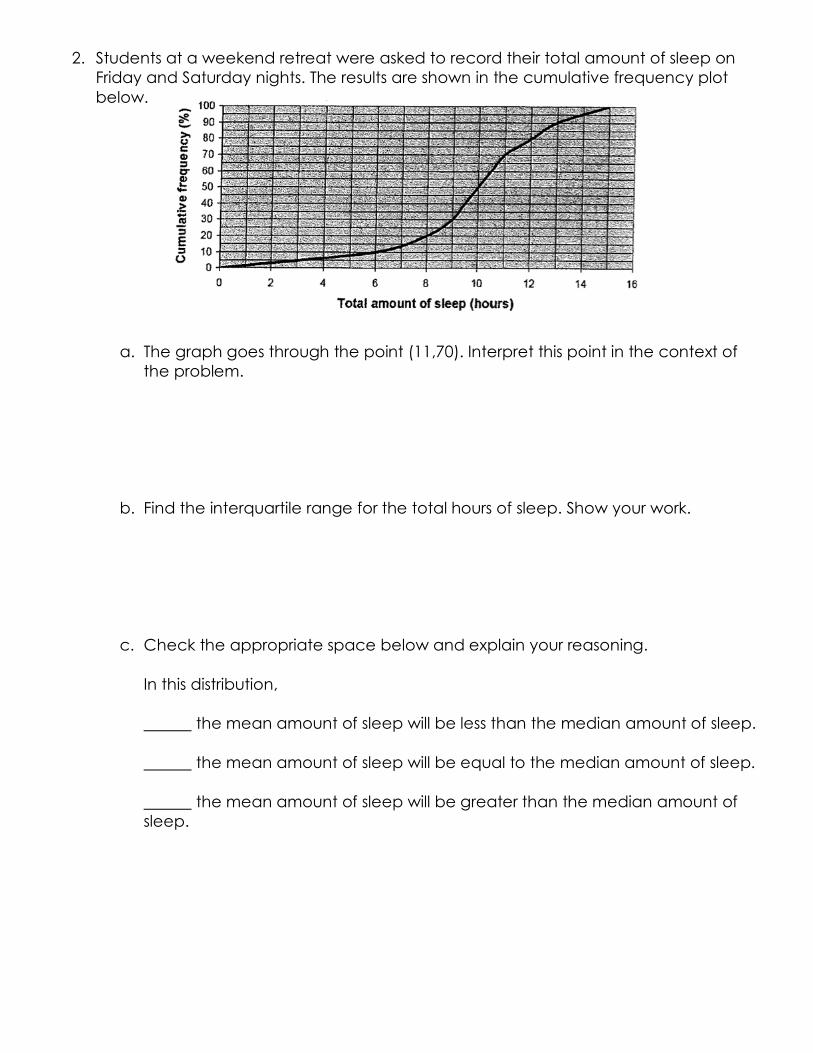
2. Students at a weekend retreat were asked to record their total amount of sleep on Friday and Saturday nights. The results are shown in the cumulative frequency plot below.
a. The graph goes through the point (11,70). Interpret this point in the context of the problem.
b. Find the interquartile range for the total hours of sleep. Show your work.
c. Check the appropriate space below and explain your reasoning.
In this distribution, the mean amount of sleep will be less than the median amount of sleep. the mean amount of sleep will be equal to the median amount of sleep. the mean amount of sleep will be greater than the median amount of sleep.

3. Employees of a British company are paid monthly salaries in British pounds (£). One division of the company will be relocated to France for a year, where their salaries will be paid in the currency of the European Union (the euro: €). One British pound is equal to 1.27 euros. While the employees are in France, each will also get a monthly bonus of €325 (or 325 euros).
The following are statistics for the employees’ original salaries in Great Britain.
Minimum £ 800 First quartile £ 1250 Median £ 1470 Third quartile £ 2250 Maximum £ 4500 Mean £ 2025 Standard deviation £ 475
a. One employee earns £1600 per month in Great Britain. Calculate this person’s monthly salary in euros (including bonus) after the relocation to France.
b. Find the mean and standard deviation of the employees’ monthly salaries in euros after the move to France. Show your work.
c. Based on the salaries in Great Britain, are there any outliers in the salary data? Explain why or why not.
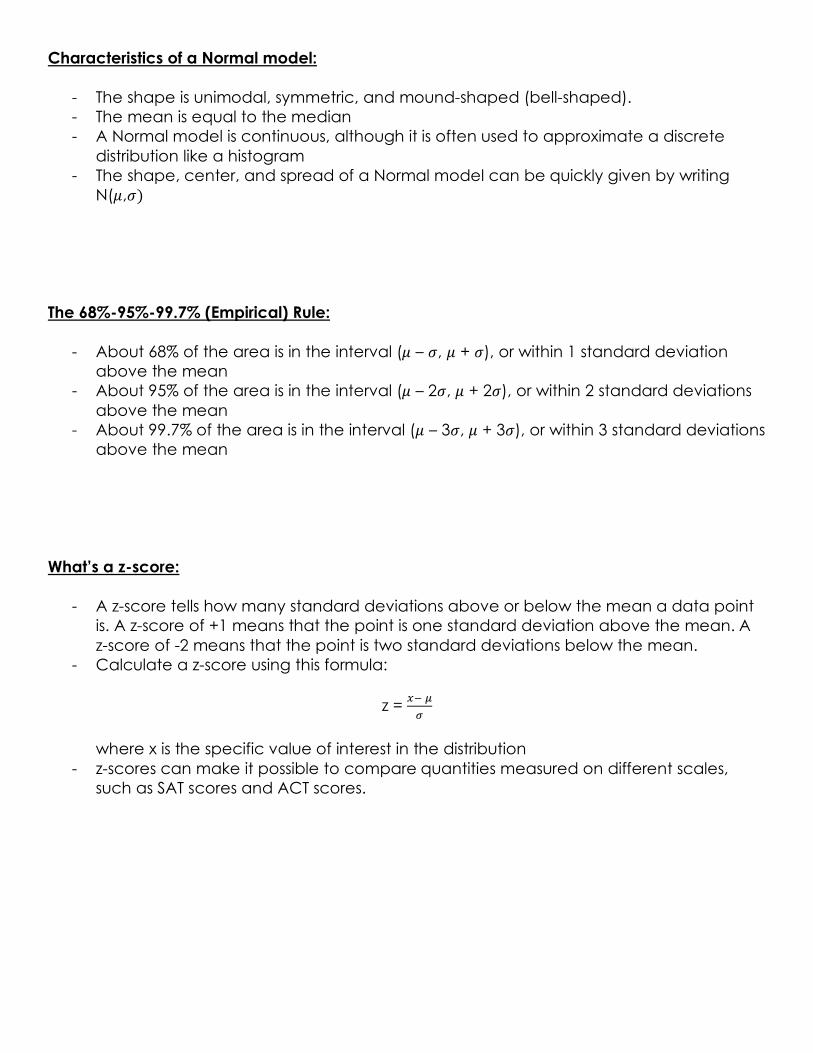
Characteristics of a Normal model:
- The shape is unimodal, symmetric, and mound-shaped (bell-shaped). - The mean is equal to the median - A Normal model is continuous, although it is often used to approximate a discrete
distribution like a histogram - The shape, center, and spread of a Normal model can be quickly given by writing
N(𝜇,𝜎) The 68%-95%-99.7% (Empirical) Rule:
- About 68% of the area is in the interval (𝜇 – 𝜎, 𝜇 + 𝜎), or within 1 standard deviation above the mean
- About 95% of the area is in the interval (𝜇 – 2𝜎, 𝜇 + 2𝜎), or within 2 standard deviations above the mean
- About 99.7% of the area is in the interval (𝜇 – 3𝜎, 𝜇 + 3𝜎), or within 3 standard deviations above the mean
What’s a z-score:
- A z-score tells how many standard deviations above or below the mean a data point is. A z-score of +1 means that the point is one standard deviation above the mean. A z-score of -2 means that the point is two standard deviations below the mean.
- Calculate a z-score using this formula:
z = '(*+
where x is the specific value of interest in the distribution - z-scores can make it possible to compare quantities measured on different scales,
such as SAT scores and ACT scores.

Finding probabilities and using a Normal model (forwards!):
- Strategy: x à z à P - Sketch a Normal model, draw a vertical line at the x value, and shade the area of
interest - Take the x value and find the z-score using the formula - Find the area to the right or left of the z-score using the normalcdf( , ) command in
the distribution menu of your calculator using ± 10,000 as either the upper or lower bound as appropriate
- If you want to find the area between two z-scores, use them as the upper and lower bounds
Finding an x value given a Normal probability (backwards!):
- Strategy: P à z à x - Sketch a Normal model, draw a vertical line where you think the x value will be, and
label the area/probability you have been given - Find the p-value using the invNorm( ) command in the distribution menu of your
calculator to find the corresponding z-score - Plug the z-score, mean, and standard deviation into the formula and solve for x

Multiple Choice:
1. If heights of 3rd graders follow a Normal distribution with a mean of 52 inches and a standard deviation of 2.5 inches, what is the z-score for a 3rd grader who is 47 inches tall?
a. -5 b. -2 c. 2 d. 5 e. 26.2
2. Suppose that a Normal model describes the acidity (pH) of rainwater, and that water
tested after last week’s storm had a z-score of 1.8. This means that the acidify of the rain
a. Had a pH 1.8 higher than average rainfall b. Had a pH of 1.8 c. Varied with the standard deviation 1.8 d. Had a pH 1.8 standard deviations higher than that of average rainwater e. Had a pH 1.8 times that of average rainwater
3. In a factory, the weight of the concrete poured into a mold by a machine follows a
Normal distribution with a mean of 1150 pounds and a standard deviation of 22 pounds. Approximately 95% of molds filled by this machine will hold weights in what interval?
a. 1084 to 1216 pounds b. 1106 to 1150 pounds c. 1106 to 1194 pounds d. 1128 to 1172 pounds e. 1150 to 1194 pounds
4. Which of the following are true?
I. In a Normal distribution, the mean is always equal to the median II. All unimodal and symmetric distributions are Normal from some value of 𝜇
and 𝜎 III. In a Normal distribution, nearly all of the data is within 3 standard deviations
of the mean, no matter the mean and standard deviation
a. I only b. II only c. III only d. I and III only e. I, II, and III

5. The height of male Labrador Retrievers is Normally distributed with a mean of 23.5 inches and a standard deviation of 0.8 inches. The height of a dog is measured from his shoulder. Labradors must fall under a height limit in order to participate in certain dog shows. If the maximum height is 24.5 inches for male labs, what proportion of male labs are not eligible?
a. 0.1056 b. 0.1250 c. 0.8750 d. 0.8944 e. 0.9750
6. The heights of mature pecan trees are approximately Normally distributed with a
mean of 42 feet and a standard deviation of 7.5 feet. What proportion of pecan trees are between 43 and 46 feet tall?
a. 0.1501 b. 0.2969 c. 0.4470 d. 0.5530 e. 0.7031
7. Heights of fourth graders are Normally distributed with a mean of 52 inches and a
standard deviation of 3.5 inches. Ten percent of fourth graders should have a height below what number?
a. -1.28 inches b. 45.0 inches c. 47.5 inches d. 48.9 inches e. 56.5 inches
8. A large college class is graded on a total points system. The total points earned in a
semester by the students in the class vary Normally with a mean of 675 and a standard deviation of 50. Another large class in a different department is graded on a 0 to 100 scale. The final grades in that class follow a Normal model with a mean of 82 and a standard deviation of 6. Jessica earns 729 points in the first class while Ana scores 90 in the second class. Which student did better and why?
a. Jessica did better because her score is 54 points above the mean while Ana’s is only 8 points above the mean
b. The students did equally well because both scored above the mean c. Ana did better because her score is 1.33 standard deviations above the mean
while Jessica’s is only 1.08 standard deviations above the mean d. Neither student did better; they cannot be compared because their classes
have a different scoring system e. None of the above
Free Response:
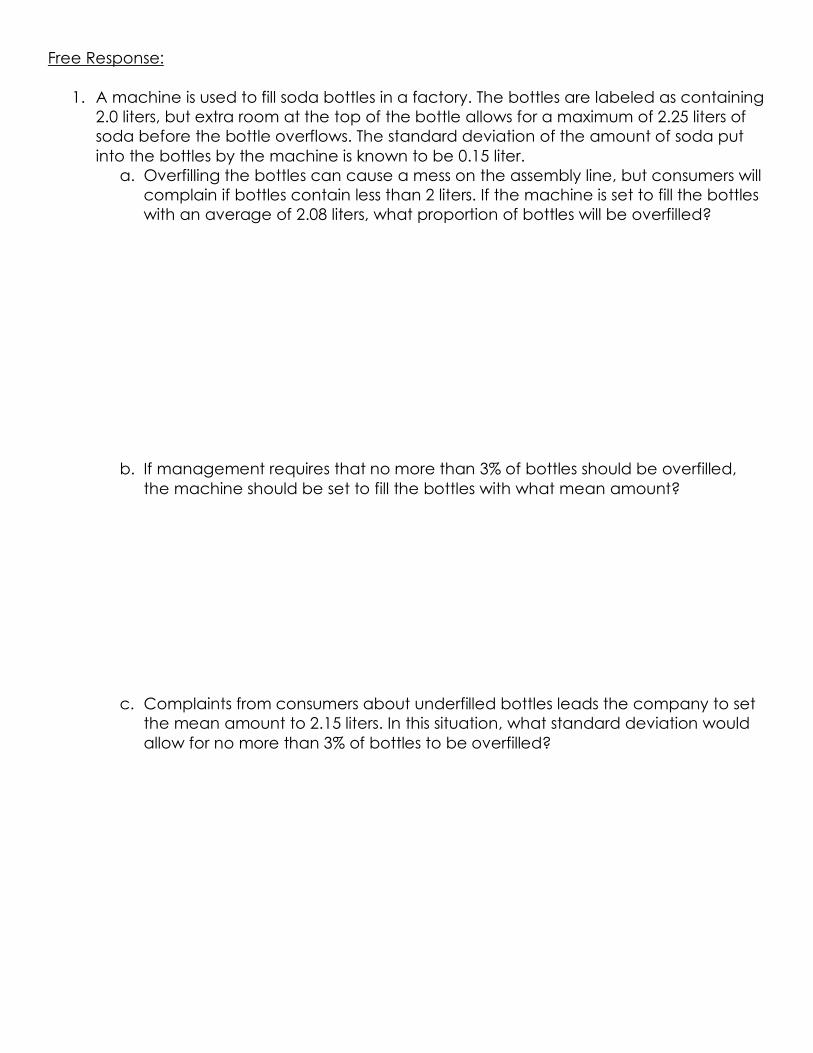
1. A machine is used to fill soda bottles in a factory. The bottles are labeled as containing 2.0 liters, but extra room at the top of the bottle allows for a maximum of 2.25 liters of soda before the bottle overflows. The standard deviation of the amount of soda put into the bottles by the machine is known to be 0.15 liter.
a. Overfilling the bottles can cause a mess on the assembly line, but consumers will complain if bottles contain less than 2 liters. If the machine is set to fill the bottles with an average of 2.08 liters, what proportion of bottles will be overfilled?
b. If management requires that no more than 3% of bottles should be overfilled, the machine should be set to fill the bottles with what mean amount?
c. Complaints from consumers about underfilled bottles leads the company to set the mean amount to 2.15 liters. In this situation, what standard deviation would allow for no more than 3% of bottles to be overfilled?


![Visualizationmu = quartiles[1] sigma = 0.74*(quartiles[2]-quartiles[0]) print(mu, sigma) Aggregation & Grouping • Now we want to filter out all values that are more than away from](https://img.dokumen.tips/doc/110x75/60f899f38d692014c36763d5/visualization-mu-quartiles1-sigma-074quartiles2-quartiles0-printmu.jpg)