Embed Size (px)
Citation preview

UNIPETROL FINANCIAL RESULTS
#Unipetrol
@unipetrolcz
Andrzej Modrzejewski, CEO
Mirosław Kastelik, CFO
20 October 2016
Prague, Czech Republic
3Q 2016
3Q16

2 3Q16
Financial results
21 Back-up
3 Key highlights of
8 Financial and operating results
15 Cash flow and financial position
18 Operational update and outlook
5 Macro environment
TABLE OF CONTENTS
3Q 2016

3 3Q16
Financial results
AGENDA
Back-up
Operational update and outlook
Cash flow and financial position
Financial and operating results
Macro environment
Key highlights of 3Q 2016

4 3Q16
Financial results
-4.2
3Q16
1.6
2Q16
3.1
3Q15
5.8
Refining model margin
(USD/bbl)
841942 877
-11%
3Q16 2Q16 3Q15
Petrochemical model margin
(EUR/t)
External macro
environment
Operational
performance
Value creation &
financial position
-44%
3Q16
1,039
2Q16
998
3Q15
1,840
Processed crude
(kt)
3Q16
1,613
2Q16
1,515
3Q15
1,679
-4%
Refining sales incl. retail
(kt)
-36%
3Q16
1,928
2Q16
4,582
3Q15
3,001
EBITDA LIFO
(CZK m)
3Q16
+3,256
2Q16
-3,624
3Q15
-6,648 -6,880
Net debt/(net cash)
(CZK m)
► Czech GDP growth remained at solid level of 2.6% y/y in 2Q16,
a decline to 2.0% is expected in 3Q16
► Crude oil price declined by 8% y/y to 46 USD/bbl
► Refining model margin decreased by 72% y/y to 1.6 USD/bbl
► Petrochemical model margin decreased by 11% y/y, however
maintained at very good level of 841 EUR/t
► Steam cracker unit and Kralupy refinery out of operation for the
whole quarter which materially impacted operational
performance (processed crude volume and sales volumes)*
► Refining utilization ratio declined from 85% to 48% y/y as a result
of not operating steam cracker unit and Kralupy refinery
► Refining sales volumes slightly decreased by 4% y/y to 1.6 mt
► Benzina further increased its market share to 17.2%
► EBITDA LIFO decreased by 36% y/y to CZK 1.9 bn due to
production limitations
► Agreed next payment for steam cracker accident insurance claim
of CZK 2.2 bn
► Net cash position decreased by CZK 3.2 bn resulting from increased
financing needs of working capital and capital spendings
► Steam cracker unit and Kralupy refinery repair works completed
► Dividend payment of CZK 1 bn executed
* Note: For more information on steam cracker and Kralupy refinery refer to slide 19.
KEY HIGHLIGHTS OF 3Q16

5 3Q16
Financial results
AGENDA
Operational update and outlook
Cash flow and financial position
Financial and operating results
Macro environment
Key highlights of 3Q 2016
Back-up

6 3Q16
Financial results
Czech GDP growth remained at solid level of 2.6% y/y in 2Q16
GDP dynamics (quarterly data, y/y)
Source: OECD, Bloomberg
Confidence in the Czech economy (monthly data)
Source: Czech Statistical Office
FX (monthly data)
Source: Czech National Bank
0
1
2
3
4
5
3.0
4Q15
2.0
4.0
3Q15
2.0
4.8
2Q15
2.0
5.0
1Q15
1.8
4.6
3Q17
E
1.4
2.6
2Q17
E
1.3
2.5
1Q17
E
4Q14
1.2
3.0
1.2
2.5
4Q16
E
1.4
2.1
3Q16
E
1.5
2.0
2Q16
1.6
2.6
1Q16
1.7
95
106
60
70
80
90
100
110
120
2016 2015 2014 2013 2012
Consumer confidence
Business confidence
16
18
20
22
24
26
28
24.10
27.02
2016 2015 2014 2013 2012
CZK/USD
CZK/EUR
September
Eurozone
Czech Republic
► Czech GDP growth remained at solid level of 2.6% y/y in 2Q16,
a decrease to 2.0% is expected in 3Q16
► Increase in both business and consumer confidence in the Czech
economy in 3Q16
► CZK stable against EUR, slightly above ČNB’s target of 27 CZK/EUR;
stable against USD at 24.1 CZK/USD in September; eurodollar relatively
stable around 1.1 USD/EUR
► Diesel consumption increased by 2.4% y/y, gasoline consumption
increased by 1.4% y/y in the Czech Republic (mt)*:
GENERAL MACRO ENVIRONMENT
+1.4% +2.4%
3Q16
0.425
3Q15
0.419
3Q16
1.262
3Q15
1.232
Diesel Gasoline
* Own estimates based on available data from the Czech Statistical Office.
September

7 3Q16
Financial results
Crude oil price further dropped y/y to 46 USD/bbl
Brent crude oil price (quarterly average)
USD/bbl
Refining model margin and Brent-Ural differential
USD/bbl
Combined petrochemical model margin
EUR/t
46
34
44
102
110108109110
102
113110
119
4650
30
40
50
60
70
80
90
100
110
120
130
-8%
3Q16 1Q16 3Q15
62
1Q15
54
76
3Q14 1Q14 3Q13 1Q13 3Q12
110 108
1Q12
109
0
1
2
3
+0.9 USD/bbl
3Q16
2.4 2.6
1Q16
2.6 2.7
3Q15
1.5 1.5
1Q15
1.7 1.5
3Q14
1.8
1Q13
1.7 1.1
3Q12
0.7
2.1
1Q12
1.3
0.3
3Q13
0.2 0.7
1.4
1Q14
2.2 1.5
0
2
4
6
-4.2 USD/bbl
1.6
3.1 3.6
4.2
5.8 5.3 5.5
2.2 2.5
0.5 0.2 0.5 0.2
1.4 1.9
4.3 5.1
2.5 2.0
0.6
Refining model margin
Brent-Ural differential
700
600
1,000
900
800
500
400
300
200
100
0
476
-11%
3Q15
838
1Q16
877 841
3Q16
884
1Q12
617
943
514
871
1Q15
611
714
3Q14
661 627
1Q14
648 605
3Q13
615 631
1Q13
631 609
3Q12
554
Polyolefin
Olefin ► Crude oil price remained stable q/q at the level of 46 USD/bbl;
however decreased by 8% y/y
► Brent-Ural differential increased by 60% y/y to 2.4 USD/bbl
► Refining model margin decreased by 72% y/y to 1.6 USD/bbl
► Petrochemical model margin decreased by 11% y/y, however
maintained at very good level of 841 EUR/t
DOWNSTREAM MACRO ENVIRONMENT

8 3Q16
Financial results
AGENDA
Operational update and outlook
Cash flow and financial position
Financial and operating results
Macro environment
Key highlights of 3Q 2016
Back-up

9 3Q16
Financial results
Revenues
EBITDA LIFO
EBITDA
EBIT
Net profit/loss
CZK m
-1,714
1,928
4,582 3,642
-1,720
1,391
4,260 3,111
-1,724
892
3,774
2,616
-1,388
722
3,106 2,110
Net profit of CZK 722 m
► Revenues decreased by 22% y/y due to lower crude oil
prices and lower refining and petrochemical products sales
► EBITDA LIFO decreased by 36% y/y to CZK 1.9 bn due to
production limitations
► Agreed next payment for steam cracker accident insurance
claim of CZK 2.2 bn
► Company expects, based on internal estimates, it should be
in a position to recover from insurer lost business profit for
3Q16 resulting from steam cracker accident of CZK 3.3 bn
(not included in financial results)
► Company expects, based on internal estimates, it should be
in a position to recover from insurer lost business profit for
3Q16 due to Kralupy refinery shutdown of CZK 0.6 bn (not
included in financial results)
► LIFO effect negative of CZK 537 m
► Depreciation and amortization of CZK 499 m
► EBIT of CZK 892 m in 3Q16
► Positive result from financial operations of CZK 3 m
► Net profit of CZK 722 m in 3Q16
9M2015 – Gain on acquisition (Eni’s stake in Česká rafinérská) of CZK -429 m, Provision for removal of old ecological
burdens of CZK 110 m, related deferred tax of CZK -30 m, Corporate function provision of CZK 50 m.
-22%
23,110 20,551 29,452
FINANCIAL RESULTS
3Q2016 2Q2016 3Q2015 9M2016 9M2015
-29%
61,347 85,950
-3,582
6,861 10,443
-4,096
6,210
10,306
4,769
8,844
-4,075
-3,280
3,803
7,083
10 3Q16
Financial results
Change in segment results y/y
CZK m
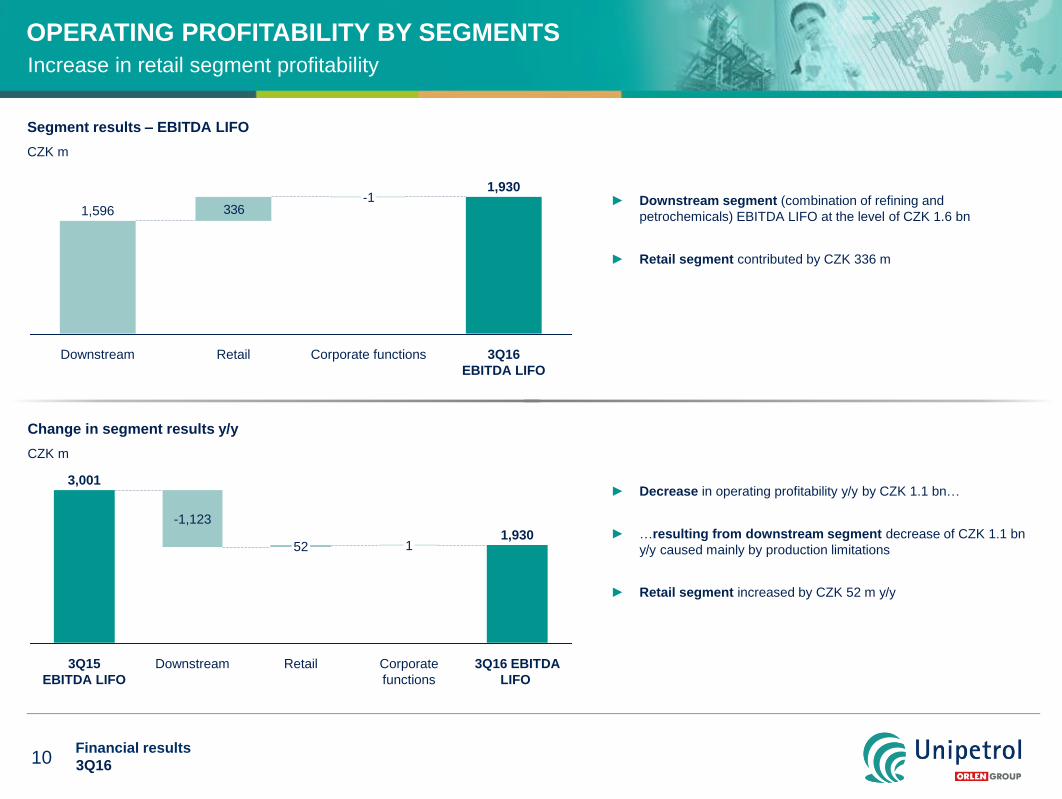
Increase in retail segment profitability
► Downstream segment (combination of refining and
petrochemicals) EBITDA LIFO at the level of CZK 1.6 bn
► Retail segment contributed by CZK 336 m
336
3Q16
EBITDA LIFO
1,930
Corporate functions
-1
Retail Downstream
1,596
Segment results – EBITDA LIFO
CZK m
1,930
3Q16 EBITDA
LIFO
Corporate
functions
1
Retail
52
Downstream
-1,123
3Q15
EBITDA LIFO
3,001 ► Decrease in operating profitability y/y by CZK 1.1 bn…
► …resulting from downstream segment decrease of CZK 1.1 bn
y/y caused mainly by production limitations
► Retail segment increased by CZK 52 m y/y
OPERATING PROFITABILITY BY SEGMENTS

11 3Q16
Financial results
Downstream segment results – Drivers of change y/y
CZK m
EBITDA LIFO at the level of CZK 1.6 bn due to agreed next payment from the insurer
3Q16
EBITDA LIFO
1,596
Other**
3,631
Volumes
-3,863
Macro
-892
3Q15
EBITDA LIFO
2,719
EBITDA LIFO quarterly – Adjusted*
CZK m
448122106
531384
8759411,000
4,000
2,500
3,000
2,000
500
4,500
1,500
0
-1,000
-500
3,500
2,330
2,080
854
1Q14 3Q13 3Q12
1,225
1Q12
-78
3Q16
1,596
4,398
1Q16
132
665
3Q15
3,360
3,589
1Q15
2,986
-887
1Q13 3Q14
EBITDA LIFO quarterly – Adjusted* - w/o impairment in 2011, 2012 and 2Q14, gain on acquisition in 1Q14 and 2Q15,
provision for removal of old ecological burdens in 2Q15 and one-offs related to steam cracker accident in 3Q15, 4Q15.
Other**– incl. agreed next payment for steam cracker accident claim of CZK 2.2 bn
► Negative macro impact of CZK (-) 892 m y/y driven by lower
refining and petrochemical margins partially compensated by
lower crude oil prices
► Negative volumes impact of CZK (-) 3.9 bn y/y driven by:
Significantly lower petrochemical sales volumes due to
steam cracker accident
Lower refining sales volumes resulting from Kralupy refinery
shutdown partially compensated by sales of petrochemical
feedstock and trading activities
–
DOWNSTREAM – EBITDA LIFO
+ ► Positive impact of Other category of CZK 3.6 bn y/y mainly
driven by:
Agreed next payment from the insurer
Inventory revaluation effect (NRV)

12 3Q16
Financial results
Refining operations impacted by production limitations
Processed crude and refining utilization ratio
kt, %
998
3Q16
48%
1,039
2Q16
46%
1Q16
66%
1,429
4Q15
72%
1,568
3Q15
85%
1,840
Distillation yields
3Q16 2Q16
9%
50%
33%
1Q16
6%
46%
38%
4Q15
7%
48%
36%
3Q15
9%
47%
35% 33%
11%
49%
Heavy
Middle
Light
► Sales volumes of refining products decreased by 4% y/y to 1.6 mt due to
lower refinery utilization resulting from shutdown of steam cracker and
Kralupy refinery partially compensated by:
Significant increase in trading of fuels
Sales of steam cracker feedstock
► Much lower level of processed crude by 801 kt compared to 3Q15 due to
Kralupy refinery and steam cracker unit shutdowns
► Consequently, refining utilization ratio declined from 85% to 48% y/y
► Lower yields of light distillates due to shutdown of Kralupy refinery y/y
914
762
836816
737775892866
751842
1,000
800
600
400
1,800
1,600
1,400
1,200
3Q12 1Q12
-4%
3Q16
1,613 1,538 1,609
3Q15
1,679
1,457
1Q15
1,055 1,050
3Q14
1,174
1,130
1Q14 3Q13 1Q13
1,515
1Q16
Sales volumes of refining products, incl. retail (Benzina network)
kt
DOWNSTREAM (REFINING) – OPERATIONAL DATA

13 3Q16
Financial results
Petrochemical operations materially impacted by production limitations
193
225
442446
439445440420
389403
453
411440
387
332
449
366
466
100
150
200
250
300
350
400
450
500
-26%
3Q16
247
185
62
227
183
43
1Q16 3Q15 1Q15 3Q14 1Q14 3Q13 1Q13 3Q12 1Q12
Sales volumes of petrochemical products
kt
Steam-cracker utilization ratio
3Q16
0%
2Q16
0%
1Q16
0%
4Q15
0%
3Q15
37%
► Petrochemical operations materially impacted by steam cracker
accident
Steam cracker unit out of operation
Sales volumes declined by 26% to 247 kt, partially
compensated by Spolana sales
373731
2122
32
22
49
25
59 -56%
-58%
3Q16 2Q16 1Q16 4Q15 3Q15 3Q16 2Q16 1Q16 4Q15 3Q15
Sales volumes of polyethylene and polypropylene
kt Polyethylene Polypropylene
DOWNSTREAM (PETROCHEMICALS) – OPERATIONAL DATA
Spolana’s
sales
volumes

14 3Q16
Financial results
Very good profitability with EBITDA LIFO of CZK 336 m
EBITDA LIFO quarterly
CZK m
201
288316
173145
110
146
336
284
147
210
0
50
100
150
200
250
300
350
169
120
1Q14
100
3Q13 1Q13
43
76
3Q12
151
1Q12 3Q16
174
1Q16 3Q15
123
1Q15
134
3Q14
Retail segment results – Drivers of change y/y
CZK m
Benzina market share
+ ► Positive fuel sales volumes impact of CZK 45 m y/y thanks to
solid dynamics of Czech GDP and higher demand for fuels
► Positive impact of non-fuel sales of CZK 30 m y/y driven by
expansion of StopCafe concept and various promotions
► Further increase in Benzina market share to 17.2% at the end
of July 2016
July 2016* – last available official statistical data.
12
13
14
15
16
17
18
July
2016*
17.2% 16.8%
1Q16
16.3%
16.1%
3Q15
15.6% 15.4%
1Q15
15.3%
15.2%
3Q14
14.9% 14.8%
1Q14
14.7%
14.5%
3Q13
14.5% 14.1%
1Q13
13.7%
13.6%
3Q12
13.6%
13.5%
1Q12
13.6%
13.8%
4530
336
284
3Q16
EBITDA
LIFO
Other
-10
Non-fuel
sales
Fuel sales
volumes
Fuel
margins
-15
3Q15
EBITDA
LIFO
RETAIL SEGMENT
► Negative impact of fuel margins of CZK (-) 15 m y/y due to
lower diesel margin –

15 3Q16
Financial results
AGENDA
Operational update and outlook
Cash flow and financial position
Financial and operating results
Macro environment
Key highlights of 3Q 2016
Back-up

16 3Q16
Financial results
Extensive CAPEX spending of CZK 2.4 bn
Free cash flow (FCF) reconciliation
CZK m
Net working capital (NWC)
CZK bn
3Q16
6.8
20.1
12.5
14.4
2Q16
4.0
22.3
12.8
13.5
1Q16
1.6
18.5
9.6
10.5
4Q15
5.9
15.7
10.4
11.3
3Q15
7.2
16.2
11.4
12.0
► Operating cash flow of CZK (-) 666 m
► Free cash flow negative of CZK (-) 2.1 bn due to extensive
CAPEX spendings (construction of PE3, reconstruction of
steam cracker unit and FCC unit)
► NWC increased by CZK 2.8 bn q/q mainly due to decrease
in investing and dividend liabilities
-666
3Q16
Free cash
flow (FCF)
-2,054
Other
investing CF
1,041
CAPEX
-2,429
3Q16
Operating
cash flow
NWC
decrease *
1,074
3Q16
Operating
cash flow
before ∆ NWC
-1,740
Other
operating CF
-2,435
Tax paid
-696
LIFO effect
-537
3Q16
EBITDA LIFO
1,928
NWC
Receivables
Inventories
Payables
CASH FLOW & NET WORKING CAPITAL
* Free cash flow (FCF) reconciliation
Net working capital (NWC) – NWC on cash flow basis adjusted for change in investment payables,
receivable from prepayments for assets and dividend payables.

17 3Q16
Financial results
Net cash position of CZK 3.6 bn at the end of 3Q16
Net debt/(net cash)* change
CZK m
Net debt/(net cash)*, financial gearing & Net debt/EBITDA LIFO**
CZK bn, %
3Q16
-3.6
2Q16
-6.6
1Q16
-9.6
4Q15
-5.9
3Q15
-6.9
► Net cash position decreased to CZK 3.6 bn in 3Q16
resulting from intensive capex spendings and
dividend payment
► Negative level of financial gearing at the level (-) 9.6%
► Net debt/EBITDA LIFO indicator at (-) 0.5
-9.6% -18.0%
-27.4%
-16.7% -19.8%
• Net debt/(net cash)* – includes cash pool liabilities.
• Net debt/EBITDA LIFO** – 4-quarter trailing adjusted EBITDA LIFO.
3Q16
Net debt /
(net cash)
-3,624
Other
-784
CAPEX
2,429
NWC decrease
-1,074
Tax paid
696
LIFO effect
537
3Q16
EBITDA LIFO
-1,928
2Q16
Net debt /
(net cash)
-6,648
2,179
969
Dividend paid Agreed next
payment from
the insurer
-0.7 -0.5
-1.1
-0.5 -0.5
Net debt/(net cash)
Financial gearing
Net debt/EBITDA LIFO
FINANCIAL GEARING

18 3Q16
Financial results
AGENDA
Operational update and outlook
Cash flow and financial position
Financial and operating results
Macro environment
Key highlights of 3Q 2016
Back-up

19 3Q16
Financial results
Steam cracker unit update
► Production was resumed on 8 out of 10 steam cracker heaters allowing
maximized production at Litvínov refinery. Steam cracker restoration to
normal modes of operation is expected at the end of October.
► Company expects, based on internal estimates made at the end of
September 2016, it should be in a position to recover from insurer costs
of repair at the level of CZK 3.9 bn and lost business profit at the level of
CZK 9.9 bn. The final amount of compensation will depend on the final
agreement with insurers.
► Unipetrol has received CZK 3.9 bn (recognized in 2Q2016), the next
agreed payment of CZK 2.2 bn is presented in 3Q2016 financial
statements.
OPERATIONAL UPDATE AND OUTLOOK
Kralupy refinery update
► Kralupy refinery running at full capacity.
► Company expects, based on internal estimates made at the end of
September 2016, it should be in a position to recover from insurer
lost business profit for 3Q16 due to Kralupy refinery shutdown of
CZK 0.6 bn and costs of repair of CZK 0.3 bn. The final amount of
compensation will depend on the final agreement with insurers.
Takeover of OMV filling stations
► 13 filling stations were included in BENZINA retail chain by the
end of September.
► 15 more filling stations are planned to be taken over by the end
of this year.
► The entire filling stations acquisition and rebranding project is
expected to be completed next year.

20 3Q16
Financial results
K 2016 Over 3,000 companies presented from the international plastics and rubber sector

For more information contact Investor Relations Department:
Robert Pecha
Investor Relations Manager
Phone: +420 225 001 425
Email: [email protected]
Kateřina Smolová
IR Specialist
Phone: +420 225 001 488
Email: [email protected]
www.unipetrol.cz
Thank you for your attention THANK YOU

22 3Q16
Financial results
AGENDA
Back-up
Operational update and outlook
Cash flow and financial position
Financial and operating results
Macro environment
Key highlights of 3Q 2016

23 3Q16
Financial results
Revenues
EBITDA LIFO
EBITDA
EBIT
Net profit/loss
CZK m
-22%
23,110 20,551 29,452
-1,073
1,928
4,582
3,001
-1,079
1,391
4,260
2,470
-1,083
892
3,774
1,975
-860
722
3,106 1,582
FINANCIAL RESULTS – REPORTED NUMBERS
3Q2016 2Q2016 3Q2015
-3,051
3,803
6,854
-29%
61,347 85,950
-3,210
6,861 10,071
-3,724
6,210 9,934
8,472
4,769
-3,703
9M2015 9M2016

24 3Q16
Financial results
Detailed breakdown
EBITDA & EBIT – REPORTED NUMBERS
CZK m 1Q 2015 2Q 2015 3Q 2015 4Q 2015 1Q 2016 2Q 2016 3Q 2016 9M 2015 9M 2016
EBITDA LIFO 3 111 3 959 3 001 807 350 4 582 1 928 10 071 6 861
EBITDA 2 897 4 567 2 470 708 559 4 260 1 391 9 934 6 210
EBIT LIFO 2 640 3 463 2 505 342 -106 4 096 1 429 8 608 5 420
EBIT 2 426 4 071 1 975 243 103 3 774 892 8 472 4 769
EBITDA LIFO 2 986 3 908 2 719 553 132 4 398 1 596 9 613 6 126
EBITDA 2 772 4 516 2 188 454 341 4 075 1 058 9 476 5 475
EBIT LIFO 2 602 3 502 2 313 181 -234 4 002 1 189 8 417 4 957
EBIT 2 388 4 110 1 783 82 -25 3 680 652 8 280 4 306
EBITDA LIFO 134 123 284 288 201 174 336 541 711
EBITDA 134 123 284 288 201 174 336 541 711
EBIT LIFO 54 41 200 204 125 96 255 296 476
EBIT 54 41 200 204 125 96 255 296 476
EBITDA -9 -71 -2 -33 16 11 -1 -83 25
EBIT -16 -80 -7 -42 3 -2 -15 -104 -13
Group
Downstream
Retail
Corporate functions

25 3Q16
Financial results
Explanation of key indicators
► Refining margin = revenues from products sold (96% Products = Gasoline 17%, Naphtha 20%, JET 2%, Diesel 40%, Sulphur Fuel Oils 9%, LPG 3%,
Other feedstock 5%) minus costs (100% input = Brent Dated); product prices according to quotations.
► Conversion capacity of Unipetrol’s refineries = Conversion capacity till 2Q2012 was 5.1 mt/y (Česká rafinérská – Kralupy 1.642 mt/y, Česká rafinérská
– Litvínov 2.813 mt/y, Paramo 0.675 mt/y). From 3Q2012 till 4Q2013 conversion capacity was 4.5 mt/y, i.e. only Česká rafinérská refineries conversion
capacity, adjusted for 51.22% shareholding of Unipetrol, after discontinuation of crude oil processing in Paramo refinery (Česká rafinérská – Kralupy 1.642
mt/y, Česká rafinérská – Litvínov 2.813 mt/y). From 1Q2014 till 1Q2015 conversion capacity was 5.9 mt/y after completion of acquisition of Shell’s 16.335%
stake in Česká rafinérská, corresponding to Unipetrol’s total stake of 67.555% (Česká rafinérská – Kralupy 2.166 mt/y, Česká rafinérská – Litvínov 3.710
mt/y). In 2Q15 conversion capacity increased to 7.8 mt/y driven by operation of Eni’s 32.445% stake in Česká rafinérská from May. From 3Q15 conversion
capacity is 100% of Česká rafinérská, i.e. 8.7 mt/y (Česká rafinérská – Kralupy 3.206 mt/y, Česká rafinérská – Litvínov 5.492 mt/y).
► Light distillates = LPG, gasoline, naphtha
► Middle distillates = JET, diesel, light heating oil
► Heavy distillates = fuel oils, bitumen
► Petrochemical olefin margin = revenues from products sold (100% Products = 40% Ethylene + 20% Propylene + 20% Benzene + 20% Naphtha) minus
costs (100% Naphtha); product prices according to quotations.
► Petrochemical polyolefin margin = revenues from products sold (100% Products = 60% Polyethylene/HDPE + 40% Polypropylene) minus costs (100%
input = 60% Ethylene + 40% Propylene); product prices according to quotations.
► Free cash flow (FCF) = sum of operating and investing cash flow
► Net working capital (NWC) = inventories + trade and other receivables – trade and other liabilities
► Net debt = non-current loans, borrowings and debt securities + current loans, borrowings and debt securities + cash pool liabilities – cash and cash
equivalents
► Financial gearing = net debt / (total equity – hedging reserve)
DICTIONARY

26 3Q16
Financial results
The following types of statements:
Projections of revenues, income, earnings per share, capital expenditures, dividends, capital structure or other financial items; Statements of plans
or objectives for future operations; Expectations or plans of future economic performance; and Statements of assumptions underlying the
foregoing types of statements are "forward-looking statements", and words such as "anticipate", "believe", "estimate", "intend", "may", "will",
"expect", "plan“, “target” and "project" and similar expressions as they relate to Unipetrol, its business segments, brands, or the management of
each are intended to identify such forward looking statements. Although Unipetrol believes the expectations contained in such forward-looking
statements are reasonable at the time of this presentation, the Company can give no assurance that such expectations will prove correct. Any
forward-looking statements in this presentation are based only on the current beliefs and assumptions of our management and information
available to us. A variety of factors, many of which are beyond Unipetrol’s control, affect our operations, performance, business strategy and
results and could cause the actual results, performance or achievements of Unipetrol to be materially different from any future results,
performance or achievements that may be expressed or implied by such forward-looking statements. For us, particular uncertainties arise, among
others, from: (a) changes in general economic and business conditions (including margin developments in major business areas); (b) price
fluctuations in crude oil and refinery products; (c) changes in demand for the Unipetrol’s products and services; (d) currency fluctuations; (e) loss
of market and industry competition; (f) environmental and physical risks; (g) the introduction of competing products or technologies by other
companies; (h) lack of acceptance of new products or services by customers targeted by Unipetrol; (i) changes in business strategy; (j) as well as
various other factors. Unipetrol does not intend or assume any obligation to update or revise these forward-looking statements in light of
developments which differ from those anticipated. Readers of this presentation and related materials on our website should not place undue
reliance on forward-looking statements.
DISCLAIMER