Embed Size (px)
Citation preview
Unilever Trading Statement Q3 2014
Jean-Marc Huët / James Allison
October 23rd 2014

Jean-Marc Huët

SAFE HARBOUR STATEMENT
This announcement may contain forward-looking statements, including ‘forward-looking statements’ within the meaning of the United
States Private Securities Litigation Reform Act of 1995. Words such as ‘will’, ‘aim’, ‘expects’, ‘anticipates’, ‘intends’, ‘looks’, ‘believes’,
‘vision’, or the negative of these terms and other similar expressions of future performance or results, and their negatives, are intended to
identify such forward-looking statements. These forward-looking statements are based upon current expectations and assumptions
regarding anticipated developments and other factors affecting the Unilever group (the “Group”). They are not historical facts, nor are they
guarantees of future performance.
Because these forward-looking statements involve risks and uncertainties, there are important factors that could cause actual results to
differ materially from those expressed or implied by these forward-looking statements. Among other risks and uncertainties, the material or
principal factors which could cause actual results to differ materially are: Unilever’s global brands not meeting consumer preferences;
Unilever’s ability to innovate and remain competitive; Unilever’s investment choices in its portfolio management; inability to find sustainable
solutions to support long-term growth; customer relationships; the recruitment and retention of talented employees; disruptions in our
supply chain; the cost of raw materials and commodities; the production of safe and high quality products; secure and reliable IT
infrastructure; successful execution of acquisitions, divestitures and business transformation projects; economic and political risks and
natural disasters; financial risks; failure to meet high ethical standards; and managing regulatory, tax and legal matters. Further details of
potential risks and uncertainties affecting the Group are described in the Group’s filings with the London Stock Exchange, Euronext in
Amsterdam and the US Securities and Exchange Commission, including the Group’s Annual Report on Form 20-F for the year ended 31
December 2013 and Annual Report and Accounts 2013. These forward-looking statements speak only as of the date of this
announcement. Except as required by any applicable law or regulation, the Group expressly disclaims any obligation or undertaking to
release publicly any updates or revisions to any forward-looking statements contained herein to reflect any change in the Group’s
expectations with regard thereto or any change in events, conditions or circumstances on which any such statement is based.

Europe: market declining Pricing deflation in Europe North America: improving
Developed markets remain challenging
0.7%
Source: ONS/ Market data
Value market growth (%) UK Foods Consumer Price Inflation
Sep 2012 Sep 2014
0%
2013 L12 wks
Value market growth (%)
2013 L12 wks
-2%
+1%
-2%

Slowing economies Lower consumer spending Reduced market growth
Emerging markets have slowed even further
<0%
China shampoo retail sales in hypermarkets
Q2 2013 Q3 2014
+3.5%
Source: OECD / Oxford Economics / Market data
Value market growth (%) Brazil GDP growth (%)
2012 YTD 2014
-3% +14%
2013 2013 L12 wks
9M Q3
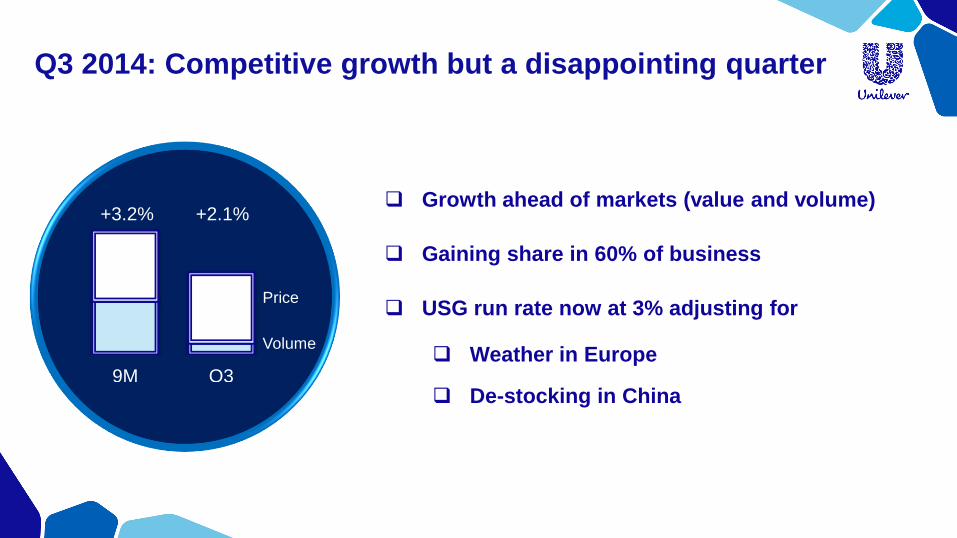
Q3 2014: Competitive growth but a disappointing quarter
Growth ahead of markets (value and volume)
Gaining share in 60% of business
USG run rate now at 3% adjusting for
Weather in Europe
De-stocking in China
+2.1% +3.2%
Price
Volume
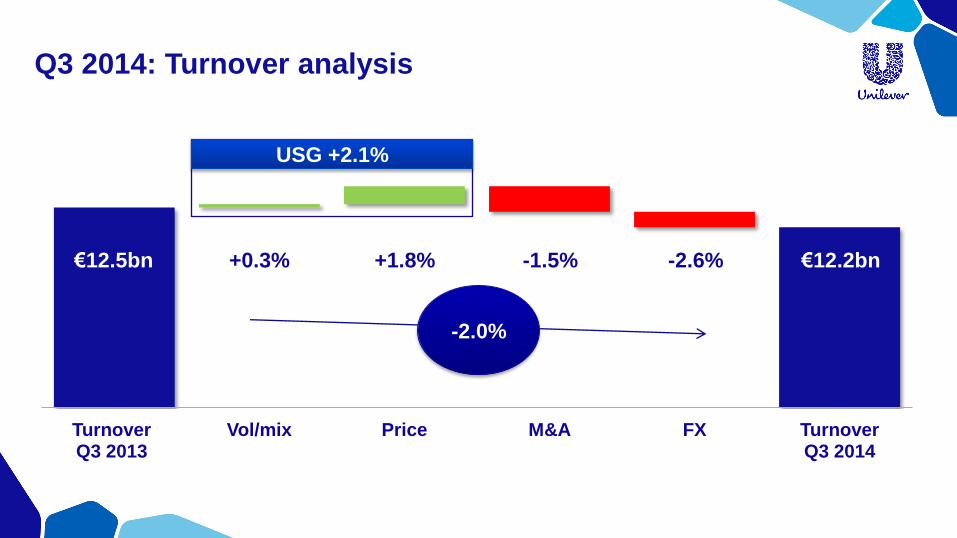
Turnover Q3 2013
Vol/mix Price M&A FX Turnover Q3 2014
Q3 2014: Turnover analysis
-1.5% -2.6% €12.2bn €12.5bn +0.3%
-2.0%
USG +2.1%
+1.8%

James Allison

Growth ahead of markets Premiumising the core Combining technology and
brand purpose
Personal Care: Broad based growth
Dove Advanced Hair Series New Lifebuoy launched in South Asia
+3.0% +4.0%
2014 USG
9M Q3

Q3 12 Q3 14
Broadly stable in weak
markets
Continued Knorr growth Margarine decline
despite share gains
Foods: Stable performance
9M Q3
-0.5% -0.5%
Knorr seasonings in Argentina
Market growth
D markets
Source: Market data
2014 USG
-7%
0bps
100bps Market share
0%

Q3 held back by weak
ice cream sales in Europe
Refreshment: Growth ahead of markets
+0.5% +3.5%
Ben & Jerry’s Core Lipton: #1 tea K-Cup brand
Premium segments growing US tea solid growth
9M Q3
2014 USG
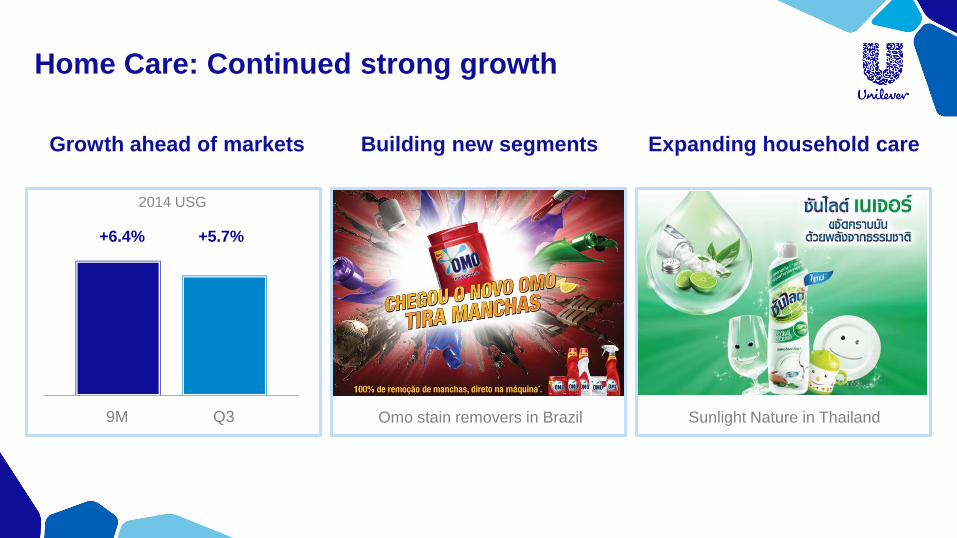
Growth ahead of markets Building new segments Expanding household care
Home Care: Continued strong growth
Omo stain removers in Brazil Sunlight Nature in Thailand
+5.7% +6.4%
9M Q3
2014 USG

Q3 2014: Developed markets overview
+0.6% -0.5% -4.3% -1.8%
Europe North America
Q3 9M Q3 9M

Q3 2014: Emerging markets overview
Asia/AMET/RUB Latin America
+12.4% +10.5% +3.1% +5.1%
Q3 9M Q3 9M

Jean-Marc Huët

Growing premium segments Entering white space Improving affordability
Pursuing growth opportunities
Omo in Saudi Arabia and Gulf 1 Euro and 1 Turkish Lira Cornetto Maille dressings

Simplification: Project Half
Marketing Fit to Win
Enterprise Technology & Solutions
€500m
savings
Accelerating cost initiatives
Improving productivity Project Half on track Improving returns on Brand
& Marketing Investment
9M 2013 9M 2014
-380bps
Non-working media%
1,400 roles reduced
Productivity
Management and supporting functions

Enhancing agility
Harmonisation Faster decision making Process simplification
Before After
Performance review process steps No. of detergent powder formulations
Now Future
-80%
Marketing hubs in Europe
Before After
8 steps 4 steps

Applying all the levers of earnings growth
Financing and pension Tax rate Corporate activities
Pension exposure
Same Reduced No pension
25% 26%
Leverhulme family :core EPS +2%*
India ownership :from 52% to 67%
Pakistan ownership :delisted
25%
2014 estimate
*Annualised impact
2014 objectives
Volume growth ahead of our markets
Steady and sustainable improvement in core operating margin
Strong cash flow

Unilever Trading Statement Q3 2014
Jean-Marc Huët / James Allison
October 23rd 2014

Full year 2014: Estimated currency overview
(4)~(5)%
(30)~(40)bps
ca €(300)m
(7)~(8)%
Turnover Margin Earnings Free cash
flow