Embed Size (px)
Citation preview

Unified storm tracking
Ronald FrenetteHigh impact weather lab Québec region Environment CanadaCMOS, Montréal May 2012

Menu
• Storm tracking algorithm1. Preprocess
2. Minima and tropical centers diagnostic
3. Tracking
4. Outputs
• Applications– Operational– Model verification– Climatology– Impact oriented product

Group effort
• Rabah Aider
• Jean-François Caron
• Louis-Philippe Caron
• Corina Costea
• Ronald Frenette
• Stéphane Gagnon
• Philippe Gachon
• Rares Gheti
• Anne-Marie Leduc
• Philippe Martin,
• Milka Rodojevik
• Christian Saad
• Mark R Sinclair
• Katja Winger
• Ayrton Zadra
Canadian Meteorological cener
Université du Québec à Montréal
High impact LabQuébec regionEnvironment Canada

Rational - Unifying the code
Tropical center diagnosticsimple tracking method
Pressure/Vorticity centers elaborated tracking method
Tropical center and transition diagnostic
AND
Pressure/Vorticity centers
Both using same elaborated tracking method
Several versions of the code
One program, one code. Maintenance, implementation easier
}
}

Step 1. Preprocessing the data
For pressure center tracking
Raw NWP output 300km Cressman filter to remove small scale details

Step 1. Preprocessing the data
For 850 or 500 hPa vorticity tracking
800 km Cressman filter 0.75 x10⁻⁵ for 1000 hPa 1.5x10⁻⁵ for 500 hPa

Step 2a. Identifying minima
• Uses cubic splines between grid points for interpolation for a more precise location.
• Surface pressure field unreliable over higher terrain:• Filter with vorticy threshold.• Threshold varies with terrain height

Step 2b. Identifying tropical centers
• Pressure minimum• A 300km Cressman filter is applied to the 850 hPa vorticity field
– A vorticity max higher the 2.5x10⁻⁵ s-1 is present within 150km of pressure center.
• 850-250 hPa thickness higher then 925 dam within 150km.– Indicating the presence of a deep and vertical warm center
• A 10m wind speed higher then 22 kts within 225km • A baroclinicity in the low levels
– Measured in terms of the asymmetry of the 900-600 hPa thickness*.
*Sinclair, M. R., 2004: Extratropical Transition of Southwest Pacific Tropical Cyclones. Part II: Midlatitude Circulation Characterisitcs, Mon. Wea. Rev., 132, p. 2149.
Use the Safir-Simpson surface wind thresholds to classify• Tropical Depression : V10m < 34 kts • Tropical Storm : 34 < V10m < 64 kts • Hurricane : V10m > 64 kts

Step 3. Tracking the centers
• r(t*) is the position of the first point of the trajectory and r(t) is the position of the current point.
• wm is a weight function depending on the number of analysis per day (2,4,8,..)
Mark R Sinclair’s method
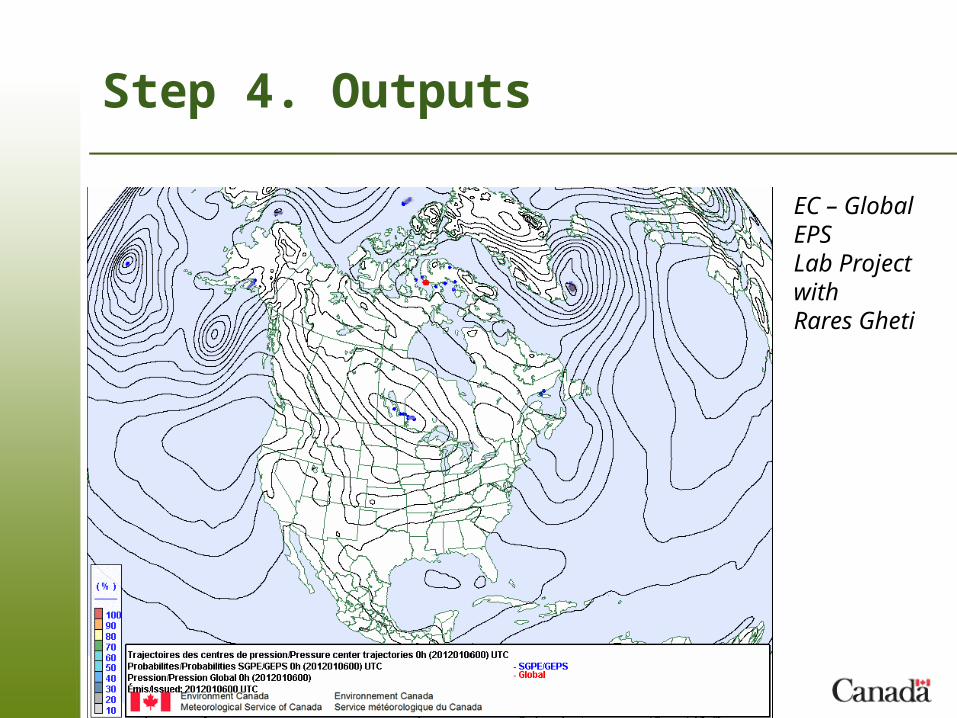
Step 4. Outputs
EC – Global EPS Lab Project with Rares Gheti

Step 4. Outputs
http://meteocentre.com/tracking/index_e.html
From: Jean - François Caron – UK Met
Multi model outputs

Application – operational forecasting
• Snow storm/Freezing rain - jan2012• Rares Gheti poster
– May 29 – 15:30 - 16:30 - Soprano - 5521
Half of the member tracks shifting more to the north (right solution). Deterministic still with southern track
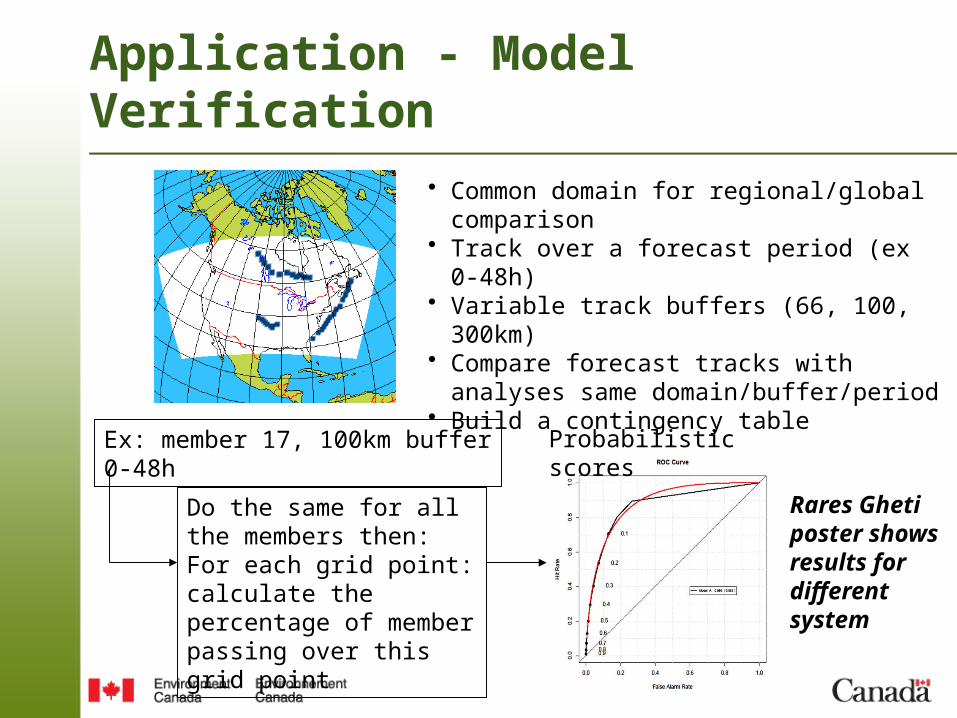
Application - Model Verification
• Common domain for regional/global comparison
• Track over a forecast period (ex 0-48h)• Variable track buffers (66, 100, 300km)• Compare forecast tracks with analyses same
domain/buffer/period• Build a contingency table
Ex: member 17, 100km buffer 0-48h
Do the same for all the members then:For each grid point:calculate the percentage of member passing over this grid point
Probabilistic scores
Rares Gheti poster shows results for different system

Application - Storm impacts study
• To improve our knowledge of weather systems affecting urban and surrounding zone• Hudson Bay (MTQ project) and southern Québec• track density, storm duration, mean circulation, mean vorticity and wind 1000 hPa
• To analyze the links between storms and hazardous events (extremes, high impact) • 2m temperatures, precipitations and 10m wind
• To understand the impact of these extremes on population health and infrastructures.
• To predict future changes in the storm climatology and theirs effects on surface extremes• cerca 2050

Application – Storm impact forecasting
vorticity center
Storm buffer:• vorticity radially changes sign
Risk zone:• 1979-2011 Climatology of storm
positions and characteristics using reanalyses/observations.
• Determine pertinent variables and thresholds impacting local infrastructures (wind speed, storm duration and speed of storm, ice, waves,…)
• Storm impact risk zone forecast products (vigilance, alert system, multi time scale)
-Done -Ongoing -Planned

Talks, links and articles
CMOS Talks and Posters:• Philippe Gachon:
• Extratropical cyclones responsible for storm surge events and coastal erosion processes in the Gulf of St. Lawrence (Québec, Canada): an assessment over the present and future periods
• Changes in weather storm events over the Hudson Bay area (Canada) in links with regional sea-ice state
• Rares Gheti:• On the use of the ensembles by the Quebec Storm Prediction Center in
detecting and tracking surface cyclones
Internal link:• http://neige.wul.qc.ec.gc.ca/produits/trajectoires/ External link:• http://meteocentre.com/tracking/
Articles:• Sinclair, M. R., 1997: Objective identification of cyclones and their circulation
intensity, and climatology. Wea. Forecasting, 12, 595–612• Sinclair, M. R., 2004: Extratropical Transition of Southwest Pacific Tropical
Cyclones. Part II: Midlatitude Circulation Characterisitcs, Mon. Wea. Rev., 132, p. 2149