Embed Size (px)
Citation preview
1 / 16
Unequal household carbon footprints in China
Dominik Wiedenhofera,*, Dabo Guanb,*, Zhu Liuc, Jing Mengb, Ning Zhangd, Yi-Ming Weie,*
a. Institute of Social Ecology (SEC), IFF- Vienna, Alpen-Adria University Klagenfurt, Austria
b. School of International Development, University of East Anglia, Norwich, NR4 7JT, UK;
c. Kennedy School of Government, Harvard University, Cambridge, MA 02138, US.
d. College of Economics, Jinan University, Guangzhou, 510632, China.
e. Center for Energy and Environmental Policy Research, Beijing Institute of Technology, Beijing 100081,
China.
* Corresponding email: [email protected]; [email protected]; [email protected]
Keywords: climate justice; carbon footprint; inequality; sustainable consumption; multi-regional input-output
analysis;
Households’ carbon footprints are unequally distributed among the rich and poor due to differences in the
scale and patterns of consumption. We present distributional focused carbon footprints for Chinese
households and use a carbon-footprint-Gini coefficient to quantify inequalities. We find that in 2012 the
urban very rich, comprising 4% of population, induced 19% of the total carbon footprint from household
consumption in China with 6.4 tCO2/cap. The average Chinese household footprint remains comparatively
low (1.7 tCO2/cap), while those of the rural population and urban poor, comprising 64% of population, are
0.5 – 1.6 tCO2/cap. Between 2007 and 2012 the total footprint from households increased by 19%, with
75% of the increase due to growing consumption of the urban middle class and the rich. This suggests that a
transformation of Chinese lifestyles away from the current trajectory of carbon-intensive consumption
patterns requires policy interventions to improve living standards and encourage sustainable consumption.
The growing climate crisis1 shows that becoming wealthy, while enabling a clean-up of the local
environment2, drives economic activity and subsequently carbon emissions, often in distant
places1,3,4. The concept of a carbon footprint, is increasingly used in the public debate on
responsibility and mitigation of climate change to describes the direct and indirect carbon emissions
of consumption along the international supply chain5–8. To achieve absolute reductions of emissions
fairly, proposals grounded in climate justice have been put forward to target high emitting individuals
across all countries9–11 while ensuring minimum levels required for a human development11. In 2013
a growing global upper class of top 10% consuming households already contributed 40-51% of global
emissions from fossil fuels and other sources with their footprints, a third of them in emerging
economies like China10. At the same time the global poor (lower 50% of global income distribution)
2 / 16
are driving 10-13% of global greenhouse gas emissions10. Improved methods12 as employed in this
study provide important information for policy-makers to explicitly consider the interactions and
trade-offs between measures targeting inequality, poverty, climate mitigation and towards
sustainable lifestyles for the emerging middle class and rich households.
China, which recently announced a stronger focus on bolstering domestic consumption over its
current export orientation, is steadily moving towards carbon- and resource intensive consumer
lifestyles, tracking the way of high-income countries1,5,8,13,14. The sheer scale of the Chinese economy
means that the future global climate is strongly determined there1,14,15. Since the 1980’s a rapid
reduction of the proportion of people living below the poverty line of 1.9 dollar (2011 PPP) income
per day has been achieved, from 88% in 1981 to 11% in 201416. At the same time income inequality
grew substantially to a Gini-Index of 0.55 in 2010, leading to a stop of official reporting on the Gini
coefficient for incomes17, an established indicator on income distributions. A clear urban-rural divide
of energy consumption can be observed in China, where rural households often use traditional and
locally polluting energy carriers like straw,wood or coal while electricity and natural gas is slowly
penetrating these areas18,19. In urban areas modern energy carriers like electricity, natural gas and
LPG are dominant and mobility is the main driver of direct household energy use18,19. Annually
approximately 20 million people move from rural to urban areas and future population growth is
projected to be concentrated in cities, which entails large new infrastructure and housing
requirements5. Especially in urban areas a sizeable middle class and a small segment of households
with high incomes has emerged5,8,20, while large swaths of rural China and migrant workers coming to
cities still largely remain in poverty21. Increasing consumption in urbanizing China has been identified
as important driver of household carbon footprints over the last 20 years, due to growing urban
population and incomes, while decreasing carbon intensity of the Chinese economy only weakly
dampens these trends5,22,23. These growing disparities in incomes and carbon footprints are driven by
government investment policies favouring coastal and urban areas17. But in a globally carbon-
constrained future with the urgent need for absolute reductions of annual emissions1,24, relying on
economic growth to lift all boats while also decreasing inequality and improving human development
can become very challenging. Clearly decarbonising the energy system via production-focused
efficiency measures and energy pricing reforms is essential3,25,26. But developing carbon-free lifestyles
beyond the current trajectory of increasing carbon footprints while becoming wealthy will require
much more substantial debates on the limits of green consumerism and the potentials towards
sustainable consumption11,20,27–29.
Herein we present the unequal distribution of carbon footprints between Chinese households along
national and international supply chains for 13 income groups (5 rural and 8 urban). We quantify
3 / 16
inequality between urban-rural and 13 income groups with a carbon-footprint-Gini coefficient (CF-
Gini), for the latest available years 2012 and 2007. Gini coefficients are used to quantify
inequality10,17,30 and were applied to production-based territorial emissions30, cumulative historical
territorial emissions31, interregional assessments of household footprints7, urban Chinese carbon
footprints20 and estimates of household carbon footprints across countries10,12. For income inequality
and carbon footprints an inverse relationship was found32–37. We utilize a detailed Chinese Input-
Output Table with latest, substantially revised Chinese emissions statistics38,39 and a Multi-Regional
Input-Output Model (GTAP 9 database) for all other countries. Emissions datasets cover carbon
emissions from fossil fuels and cement production.
From a production-based territorial perspective Chinese carbon emissions are 6.7 tons of per capita
in 201338. But from a consumption-based perspective the majority of Chinese emissions are related
to capital investments (48%) and exports (20%) as main drivers3,23, while households only induce 17%
of the national footprint in 2012. We find that the average Chinese household footprint is only 1.7
tCO2 /cap in 2012, more than double the Indian average (0.9 tCO2/cap), similar to the Brazilian
average (1.5 tCO2/cap), but one quarter of that in the EU27 (6.7 tCO2/cap) and one sixth of that in the
USA (10.4 tCO2/cap) (Fig. 1, Table 1). However, due to high income inequality in China17, 4% of the
Chinese population, the very rich urban dwellers, have carbon footprints of consumption at 6.4
tCO2/cap, nearly 4 times of the average Chinese. The three richest urban groups, 18% of Chinese
population, induce 48% of the total Chinese household carbon footprint. At the same time rural
China and the urban poor, 60% of the population, only induce 31% of the total household footprint,
all below the national average of 1.7 tCO2/cap. The total household carbon footprint of 1,354 million
Chinese is estimated at 2,332 Million tons of CO2. In comparison, the total footprint of 1,247 million
Indians is only half (1,152 MtCO2), while 500 million Europeans, 37% the population size of China,
have 1.4 times the total footprint (EU27: 3,347 MtCO2) and 312 million US-Americans, 23% the
population of China, also have 1.4 times the total carbon footprint (3,262 MtCO2) (Table 1).
FIGURE 1 GOES HERE
Figure 1: Carbon footprints of Chinese and international household consumption in 2012/11, from fossil fuels and cement production. *Due to data constraints the emissions from direct energy use of international households could not be allocated to the respective indirect emissions from mobility and housing. For Chinese households mobility and housing includes direct and indirect emissions.
Urban residents, 47% of the Chinese population, induce 75% of the national household carbon
footprint in 2012. Their average per capita footprint is 2.4 tCO2 (Table 1). The top 4% very rich urban
Chinese spend 7,237 US$ per year and have a per capita footprint of 6.4 tCO2 - which is very similar
to the national averages of OECD countries, i.e. Japan (6.6 tCO2 with 27,692 US$), Russia (5.9 tCO2
and 7,585 US$), the EU27 average (6.7 tCO2 and 21,082 US$) and Germany (7.6 tCO2 with 20,374
4 / 16
US$) (Figure 1; Table 1). This richest urban group comprises approximately 59 million people or 4% of
the entire Chinese population, inducing 19% of the total household carbon footprint in 2012 (Table
1). The total footprint of that richest group amounts to 455 MtCO2, 1.6 times the entire Brazilian
household footprint (290 MtCO2). The second group, the urban rich, 4% of total Chinese population,
spends approximately 4,298 US$ per capita and has an average footprint of 3.7 tCO2. The urban
middle class, divided into three income groups, spends 1,725 – 3,159 US$ and has a per capita
footprint of 1.5 – 2.8 tCO2. In total the two urban rich groups and middle class together induce 69%
of the national Chinese household carbon footprint. At the same time the urban poor, divided into
three groups totalling 8% of Chinese population, spend only 650 – 1,270 US$ and have footprints of
0.6 – 1.1 tCO2/cap. This means their carbon footprints are below the Chinese (1.7 tCO2) and Brazilian
average (1.5 tCO2) but similar to the Indian average (0.9 tCO2) and in the same range as Chinese rural
households. The extremely poor in urban areas only have a footprint of 0.5 tCO2/cap.
Consumption of Chinese rural households, 53% of the population, induces 25% of the national
household carbon footprint in 2012 (Table 1). The average rural carbon footprint is 0.9 tCO2/cap, 1/4
of the urban average. Further decomposing the rural population into five income groups yields
footprints of 0.5 – 1.6 tCO2/cap. Even the richest rural households, 11% of the Chinese population,
only spend 1,611 US$ per capita and have a footprint of 1.6 tCO2/cap, which is similar to the urban
lower-middle class (1.5 tCO2/cap). The rural middle and middle-high classes have footprints of 0.8 -
1.1 tCO2/cap, spending 785 – 1,054 US$ per capita. The two poorest rural groups, 22% of the entire
Chinese population, have footprints of 0.5 - 0.6 tCO2, which together is only 6% of the total national
household carbon footprint and less than the Indian average footprint.
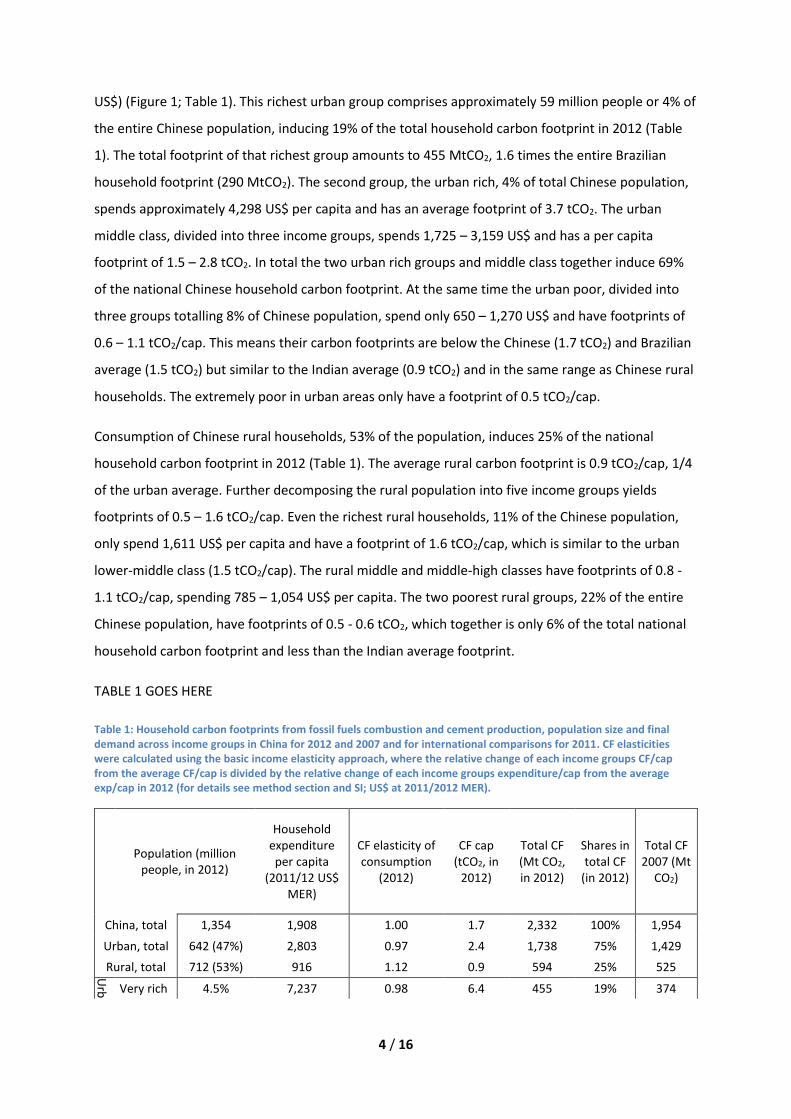
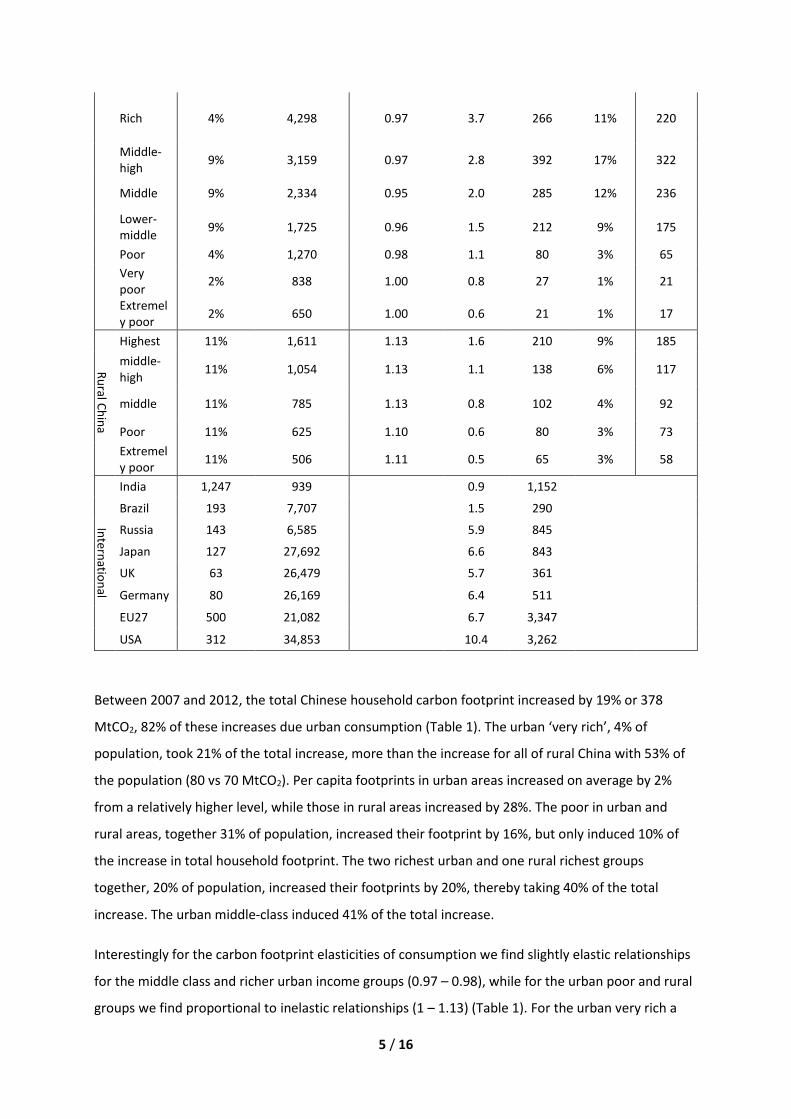
TABLE 1 GOES HERE
Table 1: Household carbon footprints from fossil fuels combustion and cement production, population size and final demand across income groups in China for 2012 and 2007 and for international comparisons for 2011. CF elasticities were calculated using the basic income elasticity approach, where the relative change of each income groups CF/cap from the average CF/cap is divided by the relative change of each income groups expenditure/cap from the average exp/cap in 2012 (for details see method section and SI; US$ at 2011/2012 MER).
Population (million people, in 2012)
Household expenditure per capita
(2011/12 US$ MER)
CF elasticity of consumption
(2012)
CF cap (tCO2, in
2012)
Total CF (Mt CO2, in 2012)
Shares in total CF
(in 2012)
Total CF 2007 (Mt
CO2)
China, total 1,354 1,908 1.00 1.7 2,332 100% 1,954
Urban, total 642 (47%) 2,803 0.97 2.4 1,738 75% 1,429
Rural, total 712 (53%) 916 1.12 0.9 594 25% 525
Urb
an
Ch
in
a Very rich 4.5% 7,237 0.98 6.4 455 19% 374
5 / 16
Rich 4% 4,298 0.97 3.7 266 11% 220
Middle-high
9% 3,159 0.97 2.8 392 17% 322
Middle 9% 2,334 0.95 2.0 285 12% 236
Lower-middle
9% 1,725 0.96 1.5 212 9% 175
Poor 4% 1,270 0.98 1.1 80 3% 65
Very poor
2% 838 1.00 0.8 27 1% 21
Extremely poor
2% 650 1.00 0.6 21 1% 17
Ru
ral Ch
ina
Highest 11% 1,611 1.13 1.6 210 9% 185
middle-high
11% 1,054 1.13 1.1 138 6% 117
middle 11% 785 1.13 0.8 102 4% 92
Poor 11% 625 1.10 0.6 80 3% 73
Extremely poor
11% 506 1.11 0.5 65 3% 58
Intern
ation
al
India 1,247 939 0.9 1,152
Brazil 193 7,707 1.5 290
Russia 143 6,585 5.9 845
Japan 127 27,692 6.6 843
UK 63 26,479 5.7 361
Germany 80 26,169 6.4 511
EU27 500 21,082 6.7 3,347
USA 312 34,853 10.4 3,262
Between 2007 and 2012, the total Chinese household carbon footprint increased by 19% or 378
MtCO2, 82% of these increases due urban consumption (Table 1). The urban ‘very rich’, 4% of
population, took 21% of the total increase, more than the increase for all of rural China with 53% of
the population (80 vs 70 MtCO2). Per capita footprints in urban areas increased on average by 2%
from a relatively higher level, while those in rural areas increased by 28%. The poor in urban and
rural areas, together 31% of population, increased their footprint by 16%, but only induced 10% of
the increase in total household footprint. The two richest urban and one rural richest groups
together, 20% of population, increased their footprints by 20%, thereby taking 40% of the total
increase. The urban middle-class induced 41% of the total increase.
Interestingly for the carbon footprint elasticities of consumption we find slightly elastic relationships
for the middle class and richer urban income groups (0.97 – 0.98), while for the urban poor and rural
groups we find proportional to inelastic relationships (1 – 1.13) (Table 1). For the urban very rich a
6 / 16
1% increase in expenditure would lead to +0.98% in carbon footprints, while +1% increase of
expenditures of the rural poor would lead to +1.11%. . This means that coming out of poverty is
relatively carbon intensive, due to low-quality commercial energy such as coal, first purchases of
appliances and so forth. Richer households tend to use growing incomes for higher quality
commercial energy (electricity, LPG, natural gas) and especially more goods and services, which are
relatively less carbon-intensive. When comparing elasticities for 2007 and 2012, interestingly rural
households become slightly more carbon intensive, while for urban households the carbon footprint
elasticity decreased (see SI).These patterns replicate across countries7,8,19,40, where generally with
rising affluence the marginal carbon intensity of consumption decreases, but larger overall
expenditure still means higher total carbon footprints than less affluent households.
When looking at the contribution of each income group’s consumption pattern to the total Chinese
footprint, it becomes evident that the urban rich and middle class are driving the categories mobility,
goods, and services, while footprints from food and housing are less unequal (Figure 2). For example,
78% of the total footprint of mobility, 74% for goods and 75% for services is due to the urban middle
class and the two rich groups, although these income groups only constitute 35% of the population.
At the same time the urban and rural poor together, which also amount to 31% population only
induce 7% of the mobility related emissions and 10% of the total Chinese carbon footprints from
goods as well as from services.
FIGURE 2 GOES HERE (Single column size?)
Figure 2: Relative distribution of household carbon footprints from fossil fuels and cement, income and population size among 13 income groups in 2012.
Finally we quantify inequality between carbon footprints of Chinese income groups using Lorenz
curves and carbon-footprint-Gini Indices. In a Lorenz curve the cumulative share of population is
plotted against their cumulative footprints, where the Gini Index then quantifies the area under that
curve. We find that CF-Ginis for total and goods footprints are similarly unequally distributed as
household expenditure in 2012 (around 0.4) (Fig. 3a). We find higher inequality for carbon footprints
of services (0.5) and mobility (0.6), while those for food and housing (0.3) are more equally
distributed among the Chinese population. Between 2007 and 2012, national inequality decreased
slightly across all categories (Fig. 3b), except for rural food and housing related carbon footprints,
which is also the major contributor to increasing per capita footprints in rural areas (Fig 3). While
urban inequality did not change significantly (Fig. 3b,c), rural inequality increased (Fig. 3b,d).
FIGURE 3 GOES HERE
Figure 3: Quantifying Inequality - Carbon-footprint-Gini coefficients for 13 Chinese income groups in 2012 and 2007, for carbon emissions from fossil fuels and cement production.
7 / 16
To encourage economic growth, China’s government has enacted policies focusing on increased
domestic consumption as a substitute for its declining growth in investment and exports, while also
announcing an absolute emissions peak for 2030. Recently Chinese emissions growth did slow
down38, largely driven by a stabilisation of coal use13,39. Substantial policy efforts in carbon taxation,
feed in tariffs for renewables and accelerated deployment of renewables and nuclear have been
modelled to achieve this stabilization of Chinese emissions at modest costs until 203026 , while most
of these current Chinese climate policies consider only regional inequality by using differentiated
goals between provinces. But at the same time it is clear that stabilizing the climate at 1.5-2°C will
require unprecedented absolute global reductions of emissions over the next 2-3 decades1,15.
The slight decreases in expenditure inequality between Chinese households, mostly due to a small
catch-up of rural households is triggered by governmental subsidies to rural households’ general
purchase and income tax free policies. But our findings suggest that coming out of poverty is quite
carbon-intensive due to a larger carbon-footprint elasticity of consumption of the poorer income
groups, strongly driven by their dirtier direct energy mix. But much more problematic are growing
carbon footprints of the urban middle-class and the rich, which together induce 69% of the total
Chinese household footprint and rapidly westernise their lifestyles. It has been suggested that
income redistribution in urban China could reduce aggregate carbon footprints while improving living
standards and income inequality20. From the results in Table 1 we can estimate that simply
redistributing expenditure to achieve equality at 1,762$/cap, which is -8% lower than the current
average expenditure, would result in a -1% decrease of total household footprints, due to differential
CF-elasticities. Therefore, social and redistributive policies need to be understood as interacting with
climate and energy policy and with efforts towards enabling sustainable lifestyles for all17,20,32,37.
While Chinese government is making effort to build regional inequalities into climate policies from
production efficiency and technology level approaches (e.g. rich coastal versus poorer inland areas),
this study reveals that there are substantial inequalities within these regions and along income
groups. The CF-Gini could be useful for developing sustainable consumption programs for those
income groups which dominate the footprints of certain consumption areas, or for guiding policy
design in achieving poverty alleviation while reducing emissions and increasing energy efficiency.
Direct emissions from heating with coal or natural gas currently amount to 11% of the total footprint
and 21% of the rural footprint. Some practical policies are designed to alleviate poverty and reduce
emission at same time. For example, Beijing municipality government set up a subsidisation plan to
implement a ‘coal replacement by clean energy programme’ for every rural households in 400
villages surrounding Beijing. By end of 2017, appropriately 4 million tonnes of coal consumption for
residential usage will be saved, which is equivalent to 7 million tonnes of CO2 emissions and 210
8 / 16
thousand tonnes of SO2. The emission reduction effort is same to three years aggregated emission
discharge by 66 thousand taxis in Beijing.
Usually shifting consumer choices is seen as yielding substantial climate mitigation benefits, for
example eating less (red) meat and more vegetarian diets, less to no fossil fuelled mobility, energy-
efficient dwellings and purchasing high(er) quality long-lived goods41,42. Tapping these potentials
requires substantial policy guidelines, careful policy designs and matching infrastructures. Currently
direct mobility emissions from fuels make up only 3% of the total household footprint, most of it by
the rich and urban middle class. But following ‘on the road’ American culture, there are increasingly
demands for cheap 4x4 fleets by Chinese middle class. Domestic car manufacturers are upgrading
production lines to fulfil such demand. Beijing and Shanghai have implemented tailored policy to
limit absolute gasoline fleets and encourage electric vehicles (EVs) purchases with heavy subsidies.
However such policy ignores China’s coal dominating energy mix. China’s gasoline vehicle
replacement programme with EVs is currently not effective. In fact, evidence shows that the CO2
emissions reduction in the petroleum sector is offset by the increase in CO2 emissions in the
electricity sector43. The EV programme can be only effective with significant changes in Chinese
energy mix towards renewables. Therefore, green consumerism alone (even with policy guidelines)
cannot drive the entire production system towards sustainability and more systemic approaches are
necessary to achieve sustainable consumption and production11,44,45. More sustainable urban forms
and spatial planning have been identified as important long-term factor towards facilitating low-
carbon lifestyles, especially in growing cities which are currently expanding their
infrastructures5,6,46,47.
Overall the required long-term transformations towards a net-zero carbon society should be included
into a national discourse about the currently dominant mode of ecological modernization, green
growth and conspicuous consumer lifestyles44. The carbon-intensive lifestyles of the wealthy are
being emulated and serve as role-models, while investments in infrastructure and cities are made.
Based on the CF elasticties (Table 1), a hypothetical scenario of an expenditure catch-up of all
Chinese households to the average urban rich expenditure pattern (i.e. mobility by cars and planes
and living an average 90 m2 per household) can be estimated, resulting in a tripling of the total
Chinese household carbon footprint. A catch-up only to the average urban middle class would
translate into a 58% increase of the total footprint. But in a carbon-constrained post-Paris COP21
future high wellbeing and human development needs to be achieved while rapidly reducing total
emissions1,13. Reducing inequalities but preventing emission intensive lifestyle westernations in
populous developing countries can be a step forward to contribute global climate change mitigation.
Cost-effectively using limited public and private funding for these societal goals will be crucial. Some
9 / 16
countries already achieved a high level of human development (HDI of >0.8) with an average carbon
footprint of 1 ton per capita48–50, highlighting that pathways to livable and potentially more
sustainable societies exist.
Acknowledgements
This work was supported by National Key R&D Program of China (2016YFA0602603 and 2016YFA0602604), the
National Natural Science Foundation of China (41629501, 71521002), Austrian National Science funded project
“MISO – modelling the global metabolic transition” (P27590), the UK Economic and Social Research Council
funded project “Dynamics of Green Growth in European and Chinese Cities” (ES/L016028/1), the UK Natural
Environment Research Council funded project “Integrated assessment of the emission-health-socioeconomics
nexus and air pollution mitigation solutions and interventions in Beijing (NE/N00714X/1) Many thanks go to Jan
Minx, Fridolin Krausmann and Julia K. Steinberger for their feedback on the manuscript, to Glen Peters for
support with the global emissions dataset for the GTAP-MRIO and to Prof Liu Yu for his feedback on the
concordances to bridge the GTAP-MRIO and the Chinese national IOTs classifications.
Supplementary Materials
See additional file
Author contributions
D.W. and D.G. designed the research, performed calculations and discussed the results. D.W. wrote
the paper. D.G., Z.L., J.M. and B.W. collected data and contributed to writing the paper.
References
1. Friedlingstein, P. et al. Persistent growth of CO2 emissions and implications for reaching climate
targets. Nat. Geosci. 7, 709–715 (2014).
2. Carson, R. T. The Environmental Kuznets Curve: Seeking Empirical Regularity and Theoretical
Structure. Rev. Environ. Econ. Policy 4, 3–23 (2010).
3. Liu, Z. et al. Targeted opportunities to address the climate–trade dilemma in China. Nat. Clim.
Change 6, 201–206 (2015).
4. Hoekstra, A. Y. & Wiedmann, T. O. Humanity’s unsustainable environmental footprint. Science
344, 1114–1117 (2014).
10 / 16
5. Feng, K. & Hubacek, K. Carbon implications of China’s urbanization. Energy Ecol. Environ. 1, 39–
44 (2016).
6. Ottelin, J., Heinonen, J. & Junnila, S. New Energy Efficient Housing Has Reduced Carbon
Footprints in Outer but Not in Inner Urban Areas. Environ. Sci. Technol. 49, 9574–9583 (2015).
7. Wiedenhofer, D., Lenzen, M. & Steinberger, J. K. Energy requirements of consumption: Urban
form, climatic and socio-economic factors, rebounds and their policy implications. Energy Policy
63, 696–707 (2013).
8. Liu, L.-C., Wu, G., Wang, J.-N. & Wei, Y.-M. China’s carbon emissions from urban and rural
households during 1992–2007. J. Clean. Prod. 19, 1754–1762 (2011).
9. Chakravarty, S. et al. Sharing global CO2 emission reductions among one billion high emitters.
Proc. Natl. Acad. Sci. 106, 11884–11888 (2009).
10. Chancel, L. & Piketty, T. Carbon and inequality: from Kyoto to Paris. Trends in global inequality of
carbon emissions (1998-2013) & prospects for an equitable adaptation fund. (2015).
11. Di Giulio, A. & Fuchs, D. Sustainable Consumption Corridors: Concept, Objections, and
Responses. GAIA - Ecol. Perspect. Sci. Soc. 23, 184–192 (2014).
12. Grubler, A. & Pachauri, S. Problems with burden-sharing proposal among one billion high
emitters. Proc. Natl. Acad. Sci. 106, E122–E123 (2009).
13. Jackson, R. B. et al. Reaching peak emissions. Nat. Clim. Change 6, 7–10 (2015).
14. Spangenberg, J. China in the anthropocene: Culprit, victim or last best hope for a global
ecological civilisation? BioRisk 9, 1–37 (2014).
15. Peters, G. P., Andrew, R. M., Solomon, S. & Friedlingstein, P. Measuring a fair and ambitious
climate agreement using cumulative emissions. Environ. Res. Lett. 10, 105004 (2015).
16. World Bank. World Development Indicators (WDI) Database. (2016). at
<data.worldbank.org/indicator>. (2016).
17. Xie, Y. & Zhou, X. Income inequality in today’s China. Proc. Natl. Acad. Sci. (2014).
doi:10.1073/pnas.1403158111
11 / 16
18. Fan, J.-L. et al. Residential carbon emission evolutions in urban–rural divided China: An end-use
and behavior analysis. Sustain. Dev. Energy Water Environ. Syst. 101, 323–332 (2013).
19. Zhao, X., Li, N. & Ma, C. Residential energy consumption in urban China: A decomposition
analysis. Energy Policy 41, 644–653 (2012).
20. Golley, J. & Meng, X. Income inequality and carbon dioxide emissions: The case of Chinese urban
households. Energy Econ. 34, 1864–1872 (2012).
21. Knight, J. Inequality in China An Overview. (The World Bank, 2013).
22. Liu, L.-C., Wu, G., Wang, J.-N. & Wei, Y.-M. China’s carbon emissions from urban and rural
households during 1992–2007. J. Clean. Prod. 19, 1754–1762 (2011).
23. Minx, J. C. et al. A ‘Carbonizing Dragon’: China’s Fast Growing CO 2 Emissions Revisited. Environ.
Sci. Technol. 45, 9144–9153 (2011).
24. Antal, M. & Van Den Bergh, J. C. J. M. Green growth and climate change: conceptual and
empirical considerations. Clim. Policy 16, 165–177 (2016).
25. Liu, Z. et al. Energy policy: A low-carbon road map for China. Nature 500, 143–145 (2013).
26. Zhang, X., Karplus, V. J., Qi, T., Zhang, D. & He, J. Carbon emissions in China: How far can new
efforts bend the curve? Energy Econ. 54, 388–395 (2016).
27. Akenji, L. Consumer scapegoatism and limits to green consumerism. J. Clean. Prod. 63, 13–23
(2014).
28. Fuchs, D. et al. Power: the missing element in sustainable consumption and absolute reductions
research and action. J. Clean. Prod. (2015). doi:10.1016/j.jclepro.2015.02.006
29. Lorek, S. & Spangenberg, J. H. Sustainable consumption within a sustainable economy – beyond
green growth and green economies. J. Clean. Prod. 63, 33–44 (2014).
30. Groot, L. Carbon Lorenz curves. Resour. Energy Econ. 32, 45–64 (2010).
31. Teng, F., He, J., Pan, X. & Zhang, C. Metric of Carbon Equity: Carbon Gini Index Based on
Historical Cumulative Emission per Capita. Adv. Clim. Change Res. 2, 134–140 (2011).
12 / 16
32. Duarte, R., Mainar, A. & Sánchez-Chóliz, J. Social groups and CO2 emissions in Spanish
households. Energy Policy 44, 441–450 (2012).
33. Baiocchi, G., Minx, J. & Hubacek, K. The Impact of Social Factors and Consumer Behavior on
Carbon Dioxide Emissions in the United Kingdom: A Regression Based on Input−Output and
Geodemographic Consumer Segmentation Data. J. Ind. Ecol. 14, 50–72 (2010).
34. López, L. A., Arce, G., Morenate, M. & Monsalve, F. Assessing the Inequality of Spanish
Households through the Carbon Footprint: The 21st Century Great Recession Effect: Inequality
and Carbon Footprint of Spain. J. Ind. Ecol. (2016). doi:10.1111/jiec.12466
35. Weber, C. L. & Matthews, H. S. Quantifying the global and distributional aspects of American
household carbon footprint. Ecol. Econ. 66, 379–391 (2008).
36. Kerkhof, A. C., Benders, R. M. J. & Moll, H. C. Determinants of variation in household CO2
emissions between and within countries. Energy Policy 37, 1509–1517 (2009).
37. Xu, X., Han, L. & Lv, X. Household carbon inequality in urban China, its sources and determinants.
Ecol. Econ. 128, 77–86 (2016).
38. Liu, Z. et al. Reduced carbon emission estimates from fossil fuel combustion and cement
production in China. Nature 524, 335–338 (2015).
39. Korsbakken, J. I., Peters, G. P. & Andrew, R. M. Uncertainties around reductions in China’s coal
use and CO2 emissions. Nat. Clim. Change (2016). doi:10.1038/nclimate2963
40. Ottelin, J., Heinonen, J. & Junnila, S. Greenhouse gas emissions from flying can offset the gain
from reduced driving in dense urban areas. J. Transp. Geogr. 41, 1–9 (2014).
41. Girod, B., van Vuuren, D. P. & Hertwich, E. G. Climate policy through changing consumption
choices: Options and obstacles for reducing greenhouse gas emissions. Glob. Environ. Change 25,
5–15 (2014).
42. Girod, B., Vuuren, D. P. van & Hertwich, E. G. Global climate targets and future consumption
level: an evaluation of the required GHG intensity. Environ. Res. Lett. 8, 14016 (2013).
13 / 16
43. Hofmann, J., Guan, D., Chalvatzis, K. & Huo, H. Assessment of electrical vehicles as a successful
driver for reducing CO2 emissions in China. Appl. Energy (2016).
doi:10.1016/j.apenergy.2016.06.042
44. Lorek, S. & Spangenberg, J. H. Sustainable consumption within a sustainable economy – beyond
green growth and green economies. Spec. Vol. Sustain. Prod. Consum. Livelihoods Glob. Reg. Res.
Perspect. 63, 33–44 (2014).
45. Akenji, L. Consumer scapegoatism and limits to green consumerism. Spec. Vol. Sustain. Prod.
Consum. Livelihoods Glob. Reg. Res. Perspect. 63, 13–23 (2014).
46. Creutzig, F., Baiocchi, G., Bierkandt, R., Pichler, P.-P. & Seto, K. C. Global typology of urban
energy use and potentials for an urbanization mitigation wedge. Proc. Natl. Acad. Sci. 112, 6283–
6288 (2015).
47. Ramaswami, A., Russell, A. G., Culligan, P. J., Sharma, K. R. & Kumar, E. Meta-principles for
developing smart, sustainable, and healthy cities. Science 352, 940–943 (2016).
48. Steinberger, J. K., Timmons Roberts, J., Peters, G. P. & Baiocchi, G. Pathways of human
development and carbon emissions embodied in trade. Nat. Clim. Change 2, 81–85 (2012).
49. Lamb, W. F. et al. Transitions in pathways of human development and carbon emissions. Environ.
Res. Lett. 9, 14011 (2014).
50. Jorgenson, A. K. & Givens, J. The Changing Effect of Economic Development on the Consumption-
Based Carbon Intensity of Well-Being, 1990–2008. PLOS ONE 10, e0123920 (2015).
14 / 16
Methods
We quantify the household carbon footprints of 13 Chinese income groups (5 rural and 8 urban) for
2012 and 2007, using a detailed Chinese Environmentally Extended Input-Output model (IOT) and a
global Multi-Regional Input-Output Model derived from the GTAP database (MRIO). The Chinese IOT
has 135 sectors in producers prices52 and is extended by China’s sectoral CO2 emissions from fossil
fuel combustion and cement production, each corrected for the latest published estimates on coal
carbon contents and energy use, which significantly altered the previously available official data39,53.
Household consumption patterns for eight urban and five rural income groups are derived by
disaggregating the urban and rural household final demand vectors in the Chinese IOTs with data on
the respective consumption structures from the China Urban Lifestyle and Price Yearbooks54. These
list average incomes and consumption patterns per income group, discerning 8 major classes of
expenditure items and 58 sector specific items, which were mapped to the 135 sectors of the
Chinese IOTs. In particular, i) we convert all 58 consumption categories into percentage to total per
capita consumption; ii) we produce a concordance matrix to map the 58 sector specific items with
135 IOT sectors; iii) we derive 8 income group urban household consumption in 135 sectors IOT
standard. We repeat the same process and utilise income-grouped household expenditure data
provided from Chinese Rural Statistics to disaggregate the rural household average consumption into
5 income groups.
All international upstream emissions were calculated via an MRIO derived from the GTAP database
for 2011 (140 countries x 57 sectors) and 2007 (129 countries x 57 sectors)55. International emissions
of fossil fuels and cement production by sector are derived from the GTAP emissions database and
corrected with the latest revised Chinese emissions statistics39,53. This is important because
households directly consume imports and the Chinese economy requires imported intermediate
inputs to produce domestic final output, which constitutes an important international inter-industry
feedback56. The limitations of this study are firstly, that non-CO2 greenhouse gas emissions are not
included due to lack of available sector level data for China. Secondly, Input-Output Analysis
generally only considers the annual emissions (flows) within the same year, which means that
cumulative emissions (stocks) required to build existing infrastructure and buildings are not
accounted for – which can be seen as an issue especially for housing related footprints, which are
currently driven by electricity, natural gas and household appliances. More generally this means that
the consumption of capital is currently not endogenized in our model, as this is an ongoing issue for
IO analysis in general (see SI for a longer discussion on the methodological limitations). The
15 / 16
concordances between the MRIO and the Chinese IOT are derived from the GTAP documentation
(see SI).
Carbon footprint results for 135 Chinese and 57 international sectors were aggregated to five major
categories of consumption: housing, mobility, food, goods and services (SI). Emissions from direct
household energy use of coal, natural gas and electricity are allocated to the category housing, oil
emissions to mobility. Due to data constraints in the GTAP-MRIO direct energy use for non-Chinese
households cannot be completely allocated and was kept separate (see Figure 1 and SI).
Quantifying Inequality via Carbon-Footprint Ginis
The consumption-based carbon-footprint-Gini coefficient presented herein is based on the well-
known Gini-coefficient, which is derived from Lorenz curves, initially proposed by Lorenz in 1907 and
widely used to measure inequality7,10,17,30,31. The original Lorenz curve plots population shares against
income shares, where the area below that curve is defined as Gini coefficient, ranging from 0 to 1. A
straight 45° line in the Lorenz curves would indicate perfect equality, similarly a Gini coefficient of 0
indicates perfect equality and 1 perfect inequality. In this paper, we present a consumption-based
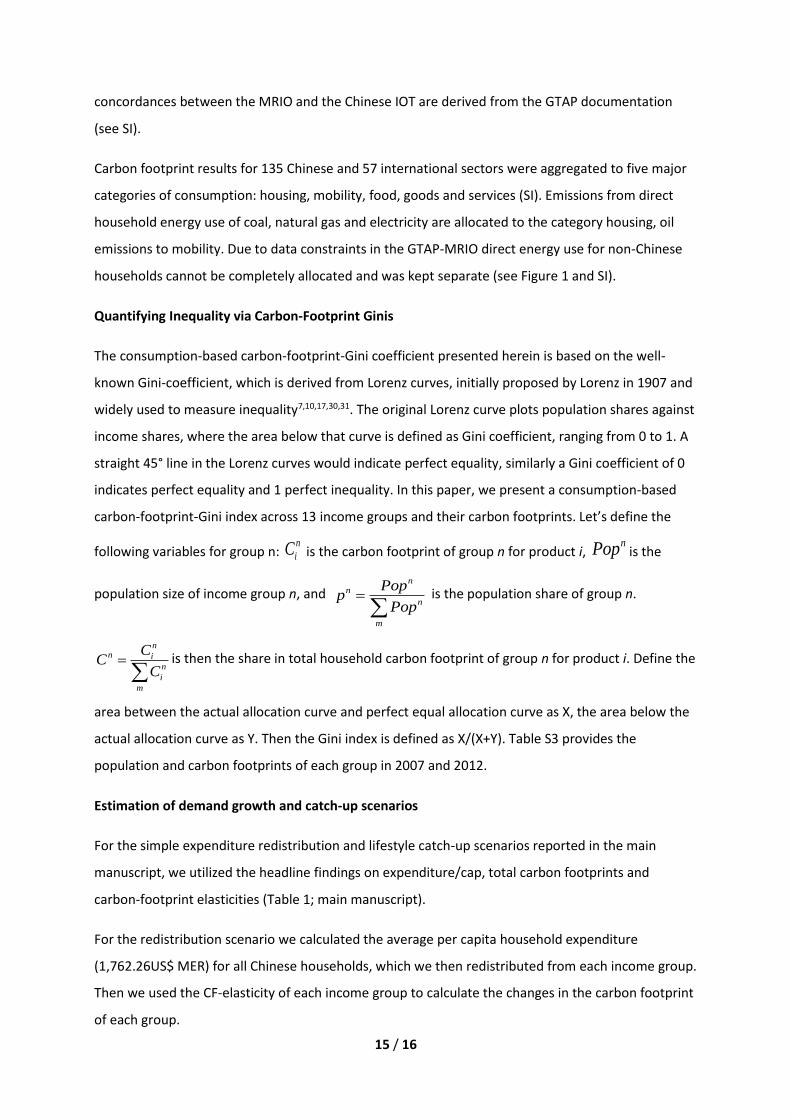
carbon-footprint-Gini index across 13 income groups and their carbon footprints. Let’s define the
following variables for group n: n
iC is the carbon footprint of group n for product i, nPop is the
population size of income group n, and n
n
n
m
Popp
Pop
is the population share of group n.
nn i
n
i
m
CC
C
is then the share in total household carbon footprint of group n for product i. Define the
area between the actual allocation curve and perfect equal allocation curve as X, the area below the
actual allocation curve as Y. Then the Gini index is defined as X/(X+Y). Table S3 provides the
population and carbon footprints of each group in 2007 and 2012.
Estimation of demand growth and catch-up scenarios
For the simple expenditure redistribution and lifestyle catch-up scenarios reported in the main
manuscript, we utilized the headline findings on expenditure/cap, total carbon footprints and
carbon-footprint elasticities (Table 1; main manuscript).
For the redistribution scenario we calculated the average per capita household expenditure
(1,762.26US$ MER) for all Chinese households, which we then redistributed from each income group.
Then we used the CF-elasticity of each income group to calculate the changes in the carbon footprint
of each group.
16 / 16
For the lifestyle catch-up scenarios we used two reference points. Firstly, the average expenditure
per capita from the urban rich groups (5,768 US$) and secondly the average expenditure per capita
of the three urban middle-class groups (2,406 US$). For all income groups below these two reference
points we used each income groups’ CF-elasticity to calculate the additional carbon footprints
resulting from such a catch-up of expenditures. For both scenarios we also used the CF-elasticities of
the two catch-up reference points for all additional expenditures, which yields only marginally lower
additional total household carbon footprints. In the main manuscript we report numbers based on
each groups’ own CF-elasticity.
Literature
51. NBS. Input-Output Table of China, 2012 and 2007. (National Bureau of Statistics, Statistical Press,
2015).
52. NBS. Energy Statistical Yearbook of China fourth revision; 2012 and 2007. (Statistical Press,
2016).
53. NBS. China Urban Life and Price Yearbook 2011 and 2007. (National Bureau of Statistics,
Statistical Press, 2012).
54. Narayanan, B., Aguiar, A. & McDougall, R. Global Trade, Assistance, and Production: The GTAP 9
Data Base. (Center for Global Trade Analysis, Purdue University, 2015).
55. Su, B. & Ang, B. W. Multi-region input–output analysis of CO2 emissions embodied in trade: The
feedback effects. Ecol. Econ. 71, 42–53 (2011).