Embed Size (px)
Citation preview

(UN)EMPLOYMENT, YOUTH AND EDUCATION
Can it help explain the current mitigated growth of unemployment
(and does it affect inequality) ?
Wiemer Salverda
7 July 2010LLAKES
International Conference London
www.uva-aias.net

2
0. Summary & lay out 1
The current increase in the unemployment rate seems significantly smaller than warranted by the depth of the financial crisis
An important question is whether this is due to a changing functioning of labour markets
Particularly relevant for today’s meeting is the potential contribution of a changing youth labour market in conjunction with expanding educational participation
3
0. Summary & lay out 2
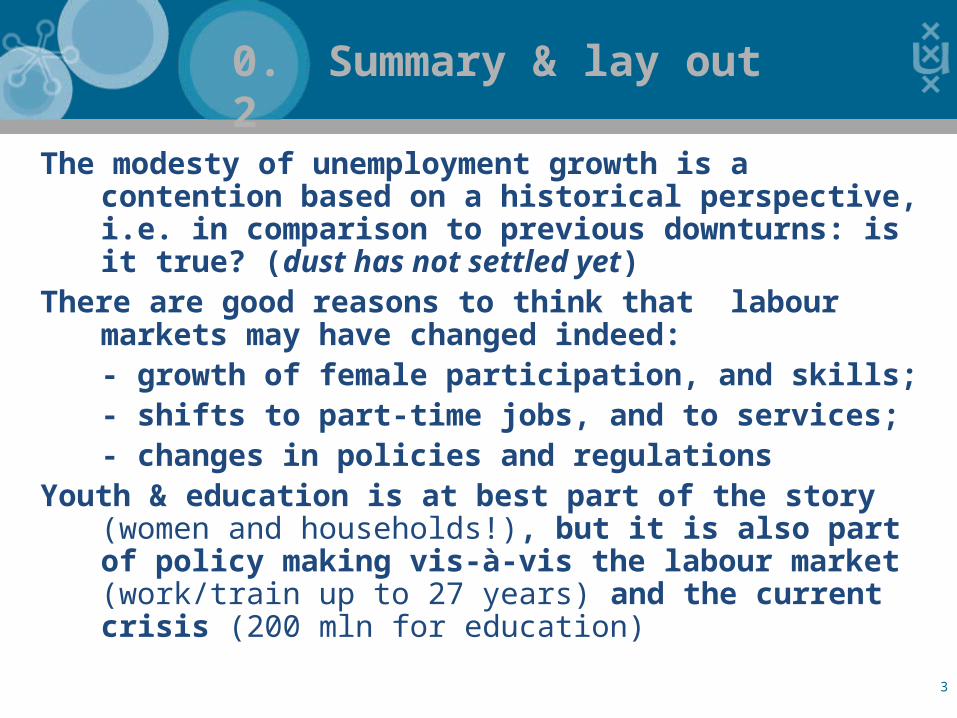
The modesty of unemployment growth is a contention based on a historical perspective, i.e. in comparison to previous downturns: is it true? (dust has not settled yet)
There are good reasons to think that labour markets may have changed indeed:- growth of female participation, and skills;- shifts to part-time jobs, and to services;- changes in policies and regulations
Youth & education is at best part of the story (women and households!), but it is also part of policy making vis-à-vis the labour market (work/train up to 27 years) and the current crisis (200 mln for education)

4
0. Summary & lay out 3
1) Comparison of downturns since 1970 & labour-market effects[delineation & measurement are not trivial]
2) Youth labour market:within this market & relative to the restand in conjunction with education
3) International comparison
Focus of 1) and 2) is the Netherlands [familiar & illuminating] with forays into international comparisons sub 3) [also not trivial]

5
– Choice of a downturn indicator: - volumes of GDP (short-lived),- GDP/capita (over time and cross-country),- investment (closer to behaviour), or - unemployment rate (closer to labour-market effects) ?
– Measurement of downturn duration:- decline only (= peak-to-trough), or - all that remains below initial level (= inclusive of recovery “full-period”) ?
------------------------– International data source: OECD, Economic
Outlook– Quarterly data: within-crisis detail, most up to
date
1. Comparison 1

6
Timing: GDP, GDP/capita, investment, unemployment%
1. Comparison 2
1. 1971Q2-1977Q3(29)
2. 1979Q3-1985Q2(24)
3. 1992Q1-1995Q3(15)
4. 2000Q1-2007Q4(32)
5. 2008Q3-(2009Q4)(6+)

7
Investment changes over the downturns by nature of the time focus
Quarterly averages, NLD (%)
1. Comparison 3
1. 1970s
2. 1980s
3. 1990s
4. 2000s
5. Now
Full-period How many Q?
-0.029
-0.024
-0.315
-0.132
-3.56+
Peak-to-trough Down/up in Q?
-0.9 20/9
-1.813/11
-1.110/5
-1.712/20
-3.56/0
First 6 quartiles
-2.5 -1.8 -1.5 -1.0 -3.5
Speediest year Start in Q?
-3.71
-3.17
-2.45
-3.39
-4.62

8
Other economic variables, changes over the first 6 quartiles (currently available): widespread effects
Quarterly averages, NLD (%)
1. Comparison 4
1. 1970s
2. 1980s
3. 1990s
4. 2000s
5. Now
Prices 2.0 1.7 0.6 1.1 -0.0
Consumption
1.0 0.1 0.2 0.6 -0.5
Imports 0.6 -0.6 -0.1 2.0 -1.5
Exports 1.9 -0.2 0.5 2.0 -1.4
Balance (pcpt)
0.3 -0.2 0.4 -0.2 0.4
Savings /NNI(pcpt) (N.Acc.)
n.a. n.a. -0.1 -0.1 -1.1

9
Labour variables, changes over the first 6 quartiles: going low and high
Quarterly averages, NLD (%)
1. Comparison 5
1. 1970s
2. 1980s
3. 1990s
4. 2000s
5. Now
Productivity 1.4 0.1 0.0 0.1 -0.5
Real wages 1.8 -0.2 0.4 0.0 0.8
Real unit labour costs
0.1
-0.0 0.2 -0.1 1.4

10
Labour-market variables, changes over the first 6 quartiles: also deep (1970 relates to productivity growth)
Quarterly averages, NLD (pcpt)
1. Comparison 7
1. 1970s
2. 1980s
3. 1990s
4. 2000s
5. Now
U-rate 0.22 0.14 0.18 -0.11 0.22
UPOP 0.15 0.10 0.14 -0.08 0.17
EPOP -0.30 -0.10 0.04 0.25 -0.26
EPOP-FTE -0.64 -0.16 0.08 0.27 -0.24

11
Over the downturns the employment FTE-volume falls, but relative to GDP/capita much less this time
First 6-quartile changes, NLD (%)
1. Comparison 8
-5.4
-1.7
-7.7
-5.6
3.8
-10
-8
-6
-4
-2
0
2
4
6
1-1970s 2-1980s 3-1990s 4-2000s 5-now 5 as 1-4 5 as 2-4
GDP/capita EPOP-FTE Difference simulations
12
1. Comparison conclusions
– For the future a prolonged and relatively deep downturn cannot be ruled out
– Differences to previous downturns are intense and are broad: declining investment, savings, trade and productivity, risk of deflation - extending much beyond (un)employment
– (Un)employment effects are as significant as before and modest only relative to the extent of the current downturn
13
2. Youth 1
– Strong overall employment growth together with significant demographic changes in employment over recent decades
– Particular shifts for youth: part-time explosion, rapid flexibility growth
– Radical change in educational participation
14
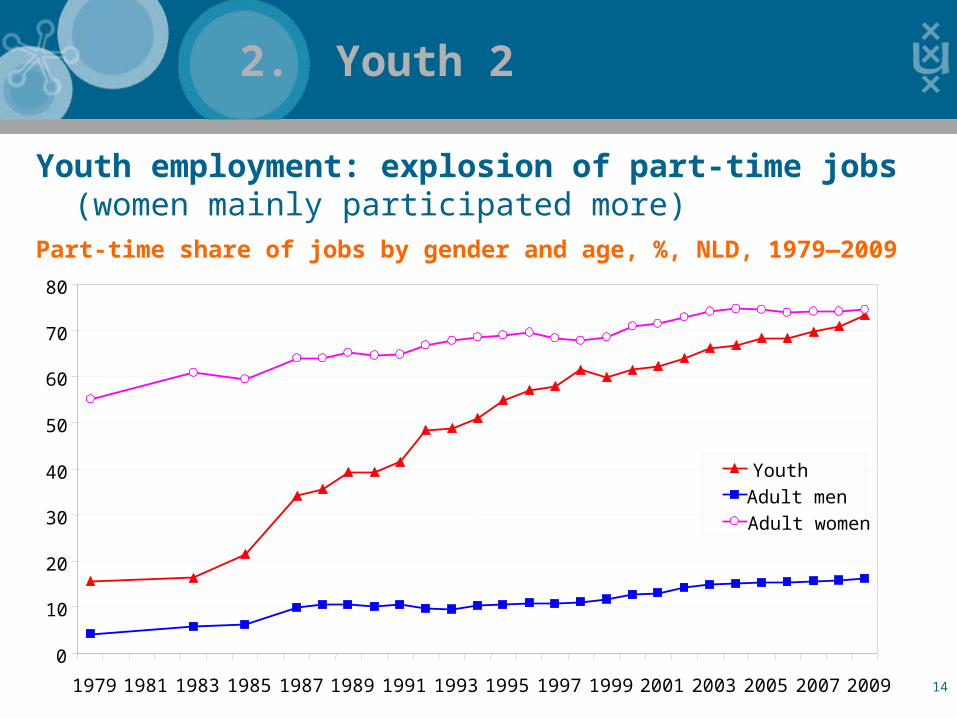
Youth employment: explosion of part-time jobs (women mainly participated more)
Part-time share of jobs by gender and age, %, NLD, 1979—2009
2. Youth 2
0
10
20
30
40
50
60
70
80
1979 1981 1983 1985 1987 1989 1991 1993 1995 1997 1999 2001 2003 2005 2007 2009
Youth
Adult men
Adult women

15
The explosion is in small jobs, now 40% of all jobs; without part-time growth youth EPOP had declined
Youth head-count EPOP by working hours, %, NLD, 1987—2009
2. Youth 3
0
10
20
30
40
50
60
70
80
1987 1989 1991 1993 1995 1997 1999 2001 2003 2005 2007 2009
<12
12-19
20-34
35+

16
Important youth role in overall changes 1987--2009: all small jobs, may flexible jobs, strong FT decline
Employment change by age, weekly hours and contract type, x1000, NLD
2. Youth 4
343111 61
-396
119345
-183
317 375
1392
350
2434
838
1429
-1000
-500
0
500
1000
1500
2000
2500
3000
<12
12-1
9
20-3
4 35
+tot
al
flexib
le
perm
anen
t
15-24 15-64

17
Part-time employment and low pay now virtually overlap (and, 4065% youth); unchanged for full-time
Incidence of low pay among part-time and full-time, %, NLD, 1979—2009
2. Youth 5
5
10
15
20
25
30
1970 1975 1980 1985 1990 1995 2000 2005
Allen + 7%
Full-time + 0%
Part-time +10%24%
70%
uren-gebaseerd (+5%)
18
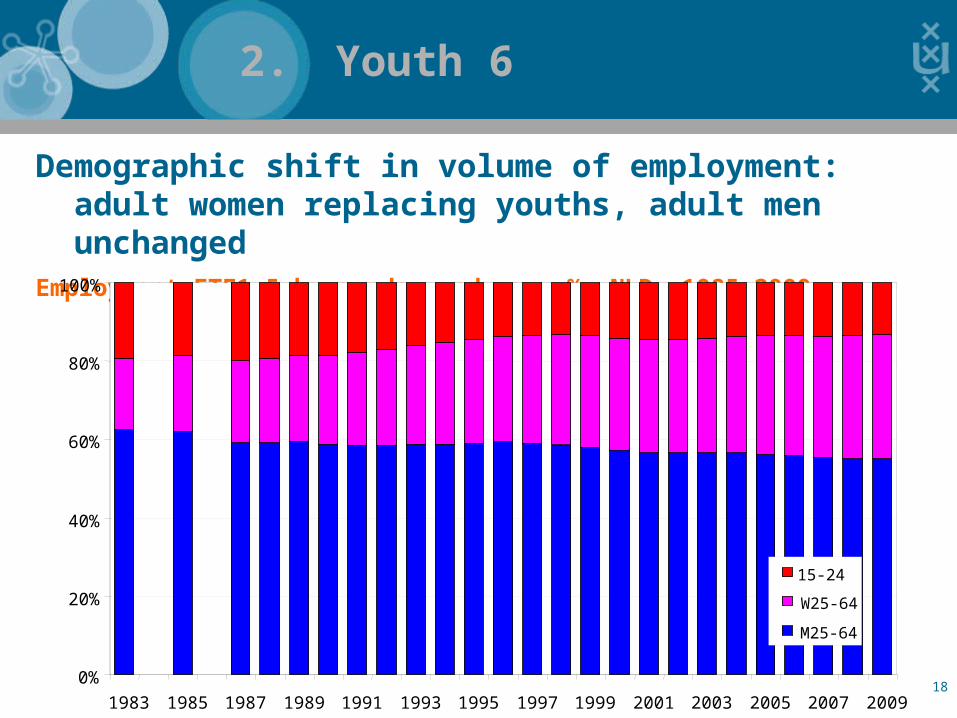
Demographic shift in volume of employment: adult women replacing youths, adult men unchanged
Employment FTE1,5 by gender and age, %, NLD, 1985—2009
2. Youth 6
0%
20%
40%
60%
80%
100%
1983 1985 1987 1989 1991 1993 1995 1997 1999 2001 2003 2005 2007 2009
15-24
W25-64
M25-64

19
Full-time equivalent youth employment rate has actually declined, full-time jobs hit strongly
Youth hours-count EPOP by working hours, %, NLD, 1987—2009
2. Youth 7
0
10
20
30
40
50
60
70
80
1987 1989 1991 1993 1995 1997 1999 2001 2003 2005 2007 2009
<12
12-19
20-34
35+

20
Youth employment now largely (2/3rds) overlaps with participation in education
Youth population by activity, 1998-2007, NLD (% of youth)
2. Youth 8
29 2822 21 21 20 22 23 24 22
32 3541 42 42 43 42 41 42 45
28 28 28 28 29 26 25 2424 23
6 4 3 3 3 5 6 6 4 45 5 6 6 6 7 6 6 5 5
1998 1999 2000 2001 2002 2003 2004 2005 2006 2007
NEET
Unemp
Emp
OverlapEmp-Edu
EDU

21
Small jobs are very important (60%) for the educational overlap, and vice-versa (96%)
Employment/Education overlap by hours, x1000, 15 24, NLD, 2001 2009
2. Youth 9
0
100
200
300
400
500
600
700
800
900
1000
2002 2003 2004 2005 2006 2007 2008 2009
35+
20-34
12-20
<12

22
Employment growth diverges depending on educational participation
Annual FTE change (%), employed youths, NLD, 2003-2009
2. Youth 10
-6.4 -6.3 -6.0
1.4 1.7
-0.8
-7.2-8.0
-6.0
-4.0
-2.0
0.0
2.0
4.0
6.0
8.0
2003 2004 2005 2006 2007 2008 2009
In education Not in education

23
Dotcom and financial crisis: employment effects are strongly diverging between full-time and part-time
Employed by age and full/part-time, NLD, peak quartile = 100
2. Youth 11
75
100
125
1999
Q04
2000
Q02
2000
Q04
2001
Q02
2001
Q04
2002
Q02
2002
Q04
2003
Q02
2003
Q04
2004
Q02
2004
Q04
2005
Q02
2005
Q04
2006
Q02
2006
Q04
2007
Q2
2007
Q4
2008
Q2
2008
Q4
2009
Q2
2009
Q4
25-64 PT
15-24 PT
25-64 FT
15-24 FT

24
Youth employment: more hours sought than supplied, longer hours than in jobs, fluctuating in full-time
Unemployed by hours of work sought, x1000, 15—24, NLD, 1996—2009
2. Youth 12
0
20
40
60
80
100
120
1996
1997
1998
1999
2000
2001
voor
revis
ie
2001
na re
visie
2002
2003
2004
2005
2006
2007
2008
2009
12-20
20-35
35+

25
Youth employment: more hours sought than supplied, bring both on a FTE basis
Average hours unemployed and employed youth, NLD, 1996—2009
2. Youth 13
15
20
25
30
35
1996
1997
1998
1999
2000
2001
voor
revi
sie
2001
na re
visie
2002
2003
2004
2005
2006
2007
2008
2009
Employed
Unemployed

26
2. Youth conclusions
– Clearly there is a longer-time (FT) employment problem for youth
– Educational participation has become essential to youth employment, and by its overlap with employment it is hiding unemployment problems
– Thus its contribution to mitigating the labour-market effects of the current crisis is not so much that they withdraw in education and but that they continue working for much fewer hours.
– A growing discrepancy of job seeking to job supply
27
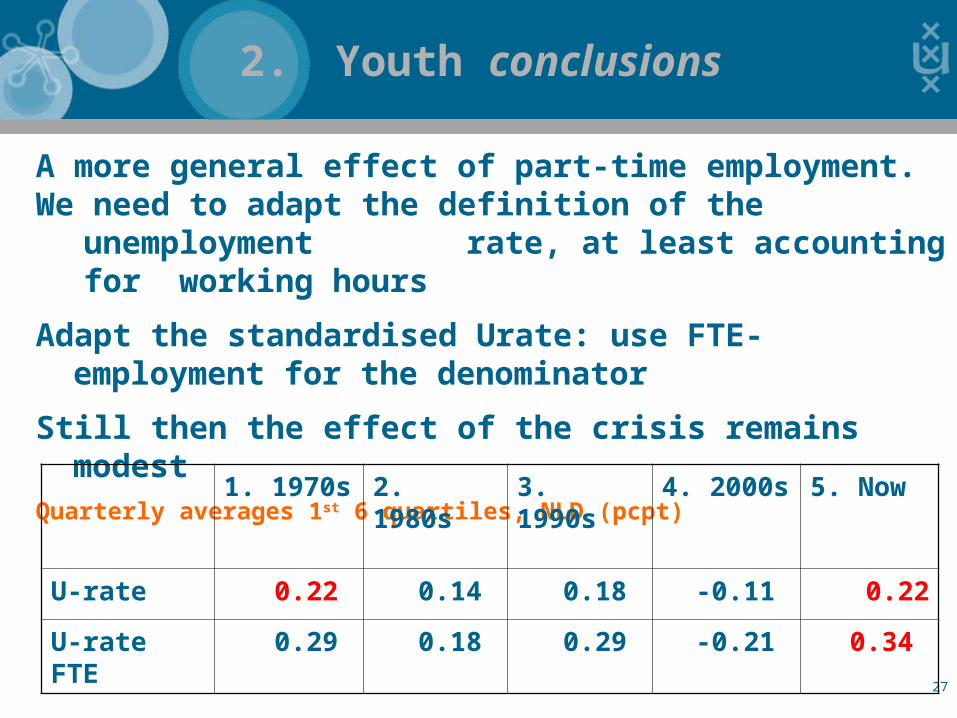
A more general effect of part-time employment.We need to adapt the definition of the
unemployment rate, at least accounting for working hours
Adapt the standardised Urate: use FTE-employment forthe denominator
Still then the effect of the crisis remains modestQuarterly averages 1st 6 quartiles, NLD (pcpt)
2. Youth conclusions
1. 1970s
2. 1980s
3. 1990s
4. 2000s
5. Now
U-rate 0.22 0.14 0.18 -0.11 0.22
U-rate FTE
0.29 0.18 0.29 -0.21 0.34

28
3. International 1
Youth overlap is much larger in the Netherlands and Denmark
Youth population by activity, 2007, 14 countries (% of youth)
56
23
38 35
57
39
51 52
2231
4738 39
23
13
44
2723
3
17
8 4
4523
633 28
25
15 2118
27 2122
2421
23
3329
1215
28
66
7 65 8
8
7
45
6 9 1010
10 6 10 9 13 14 1017
5 8 12 8 914
0
10
20
30
40
50
60
70
80
90
100
BEL DNK DEU IRL GRC ESP FRA ITA NLD AUT PRT FIN SWE GBR
NEET
Unemp
Emp 14.9
OverlapEmp-Edu
EDU
29
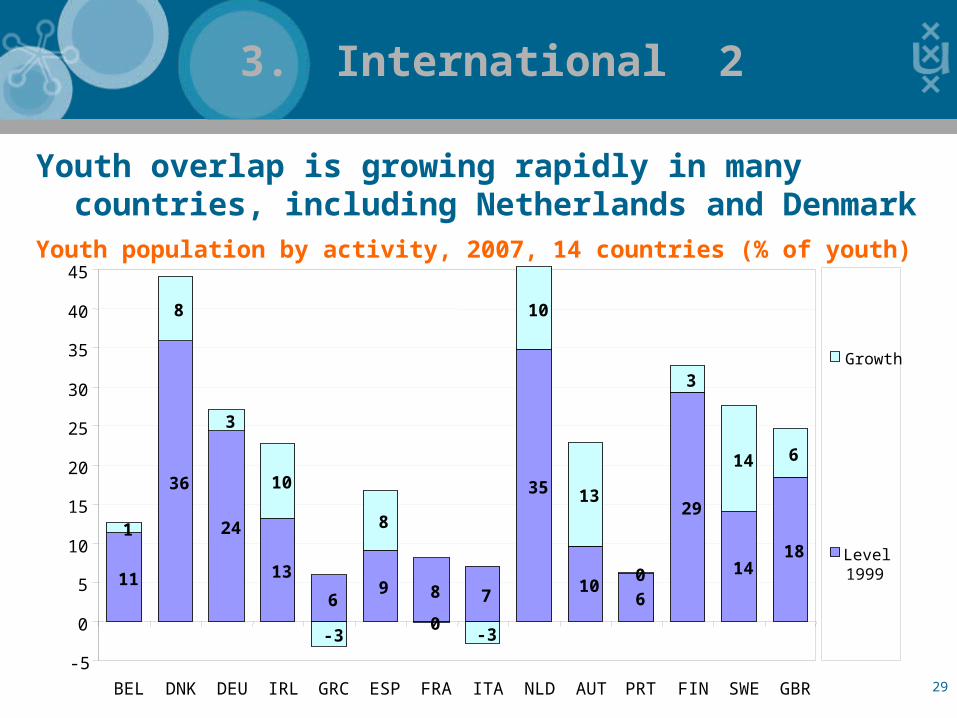
3. International 2
Youth overlap is growing rapidly in many countries, including Netherlands and Denmark
Youth population by activity, 2007, 14 countries (% of youth)
11
36
24
13
69 8 7
35
106
29
1418
1
8
3
10
-3
8
0-3
10
13
0
3
14 6
-5
0
5
10
15
20
25
30
35
40
45
BEL DNK DEU IRL GRC ESP FRA ITA NLD AUT PRT FIN SWE GBR
Growth
Level1999

30
Women and youth trading places in jobs volume FTE1,5-Employment shares by age and gender, international, 1987-
2009
3. International 3
-15
-10
-5
0
5
10
15
20
EU15 BEL DNK DEU IRL GRC ESP FRA ITA NLD AUT PRT FIN SWE UK
M 25-64
W 25-64
Youth

31
Negative effects on youth employment everywhere albeit with significant differences
FTE1,5 employment-population rates, divergence of youth to M25-49, international (peak quartile = 100)
3. International 4
-35
-30
-25
-20
-15
-10
-5
0
5
10
15
20AUT
EU15
BEL
DNK
DEU
GRC
ESP
FRA
ITA
NLD
PRT
SWE
UK
IRL
FIN

32
Swedish EPOPs suffered and never fully restored, and youth bore the brunt, in contrast with Japan
Employment-population rates, 1998-2007 (%)
3. International 5
Sweden Japan
35
40
45
50
55
60
65
70
75
80
85
90
95
1971 1977 1983 1989 1995 2001 2007
15-24 15-64
25-54 55-64
35
40
45
50
55
60
65
70
75
80
85
90
95
1971 1977 1983 1989 1995 2001 2007
15-24 15-64
25-54 55-64
33
4. Conclusions
In the end, do we want all youths to remain in education ?
Youth are likely to pay a dramatic bill; think about intergenerational effects of inequality
For crisis management look beyond the financial markets to include labour-market effects, esp. for youths:Sweden (rapid restoration of banks and stock market but permanent employment loss) vs Japan (never fully restored financial market but also no marked employment deterioration)