Embed Size (px)
DESCRIPTION
Unemployment and Inflation i.e. two evils of the economy will be discussed. Component Parts GDP. Consumption Investment Government Spending Exports- Imports (Net Exports) C+I+G+(X-M) = GDP. GDP 1007 to 2012 Q3. GDP 2007 to 2010 – Non-revised. Unemployment Rate 2011 to 2012. - PowerPoint PPT Presentation
Citation preview
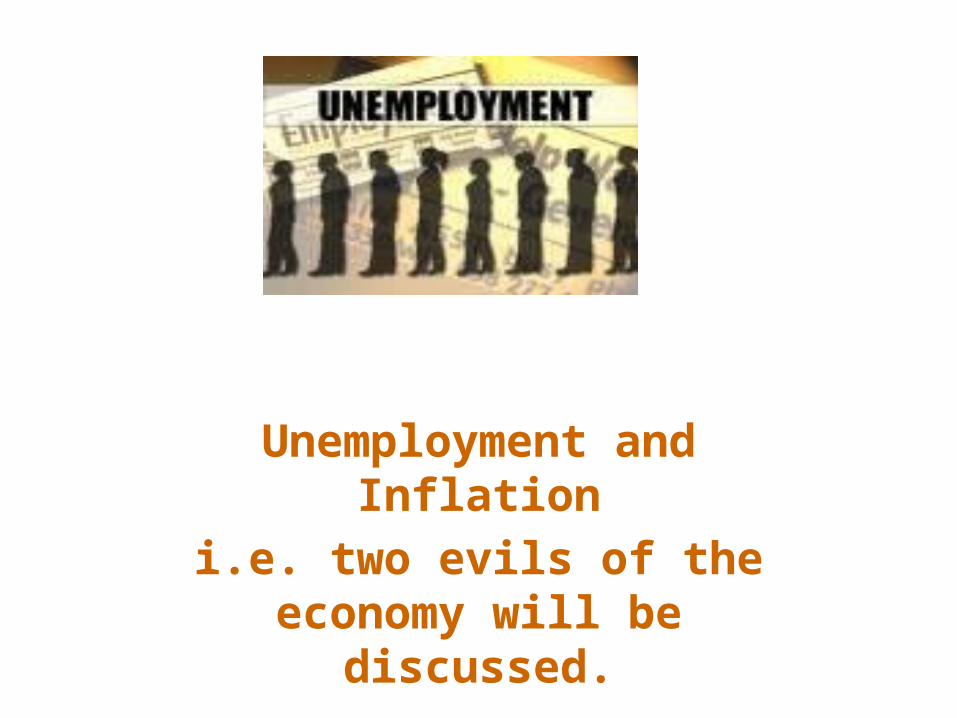
Unemployment and Inflationi.e. two evils of the economy will
be discussed.

Component Parts GDP
ConsumptionInvestment
Government SpendingExports- Imports (Net Exports)
C+I+G+(X-M) = GDP
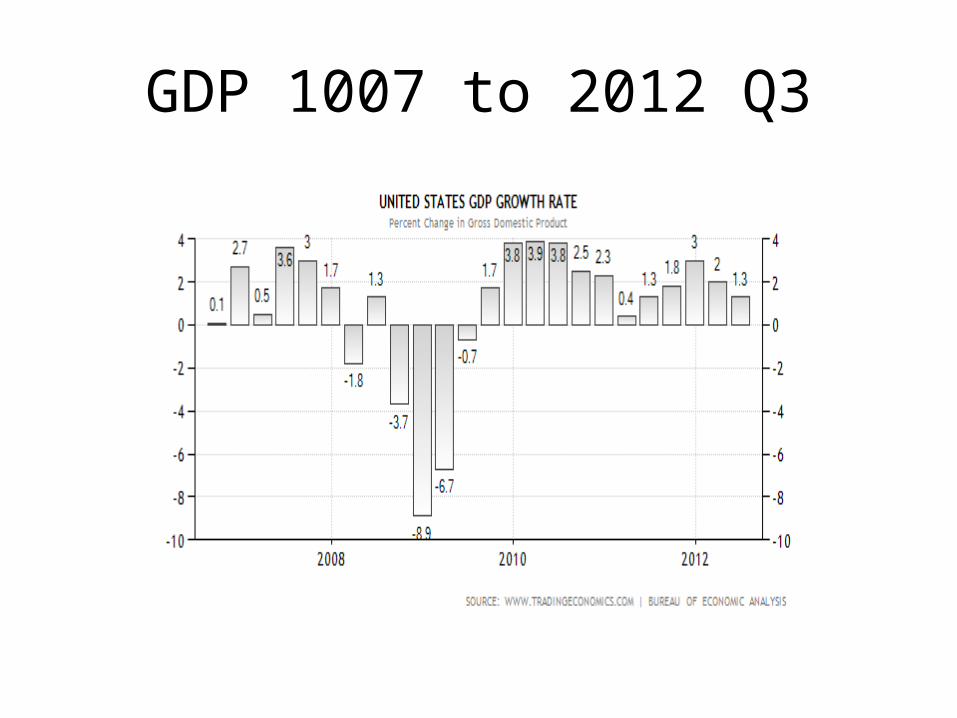
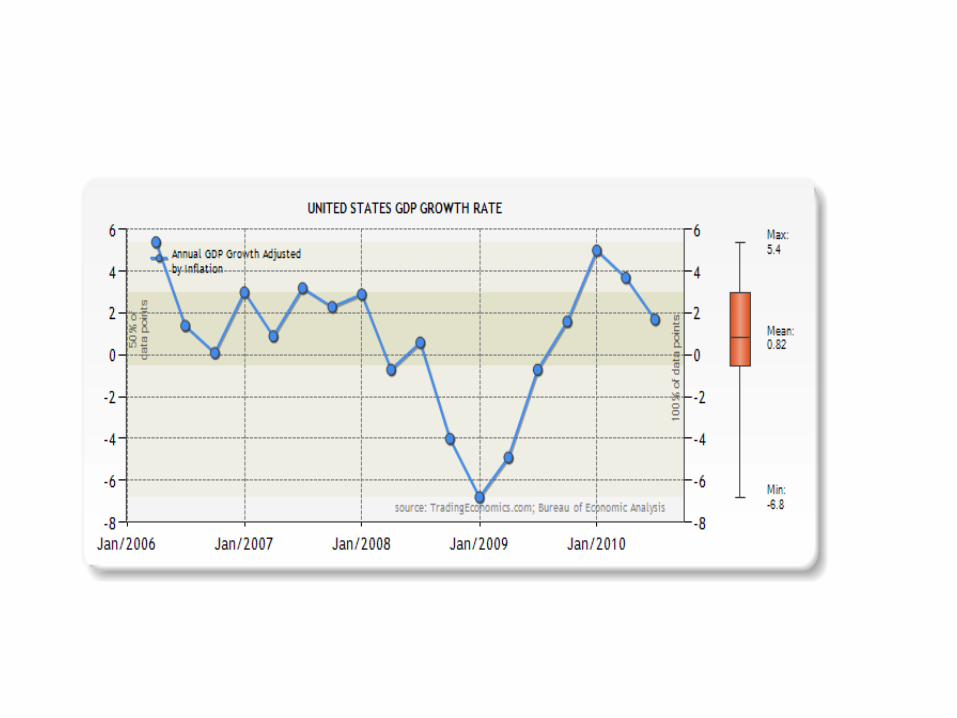
GDP 1007 to 2012 Q3

GDP 2007 to 2010 – Non-revised
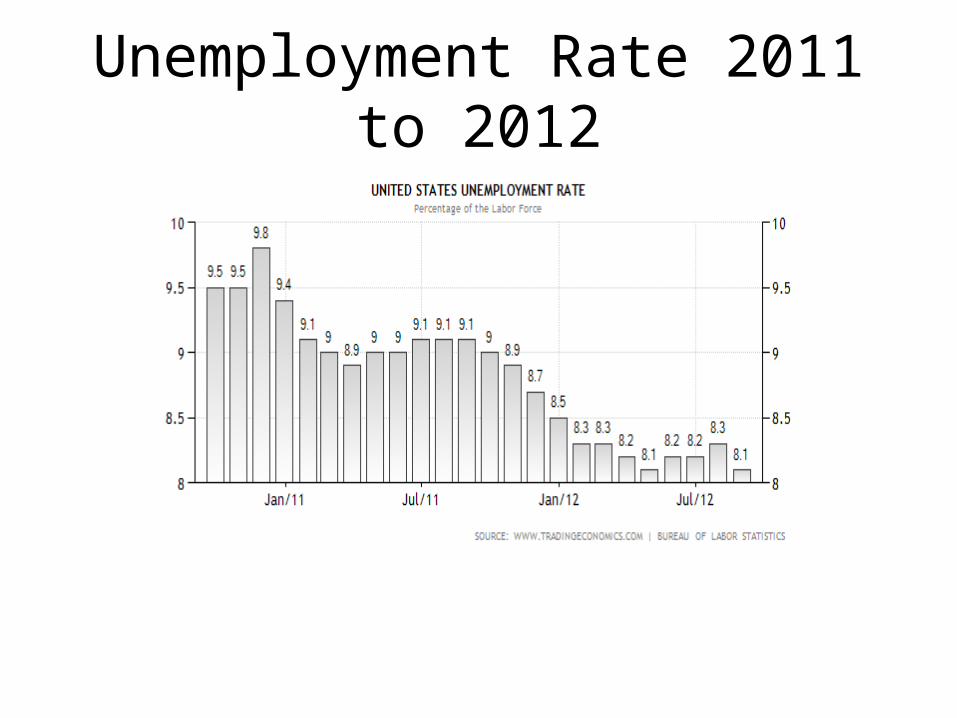
Unemployment Rate 2011 to 2012
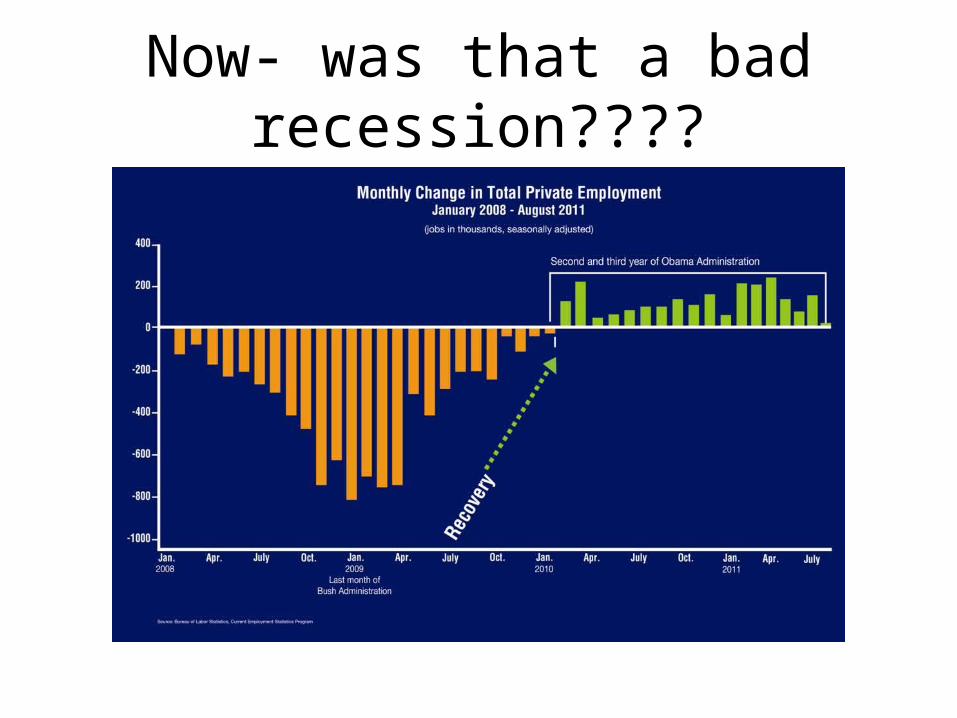
Now- was that a bad recession????

Why does growth matter?
Allows wages and incomes to rise.
Standard of living increases
Takes the pressure of scarce resources… (why?)
Main Sources of GrowthTwo ways that society can increase its real
output and income:1) increase inputs of resources2) increase productivity of those inputs
BLS Latest Numbers

Macroeconomic Problems
High inflation rateHigh unemployment rateHigh interest ratesLow economic growth or stagnation

Macroeconomic PoliciesFiscal Policy deals with
changes in government expenditures and/or taxes. to achieve particular macroeconomic goals.
Monetary Policy deals with. changes in the money supply, or the rate of growth of the money supply, to achieve particular macroeconomic goals.
Different Views of How the Economy Works-Stable-Unstable
The economy is inherently stable and self-regulating.-Classical
The economy is inherently unstable and requires intervention to correct problems.-Keynesian

Macro deals with entire economySubject matter includes:
Macroeconomic problems – high unemployment
Macroeconomics theories – government spending
Macroeconomics policies- use fiscal policy Different view on how the economy works-
self-correcting, government stimulus

The Idealized Course of Business Fluctuations
Consensus among Economists says swings due to:
Changes in REAL levels of output and employment brought about by changes in levels of TOTAL SPENDING.
Spending
Businesses no longer produce at current level
Output, employment and income fall
In reverse… the opposite results.

What are component parts of GDP?
?

Important economic fact:
As the economy gets close to FULL EMPLOYMENT
It is more difficult to obtain further gains in REAL OUTPUT.
Continued increasing levels of spending bring about INFLATION

LRAS
AD
SRASPRICE
LEVEL
GDP
QF

What will we focus on?
• This will focuses on economic growth, the business cycle, unemployment and inflation.– When is a person “unemployed”?– What are the costs of unemployment?– -When will money not buy as much?

Unemployment since 1990

Current Unemployment Rate today is????????
8.1%

The Labor Force• Labor force: all persons age 16 and over who
are either employed or actively seeking work.– Out of the labor force: those not working and not
actively seeking employment.
Totalpopulation
Out of thelabor force
Labor force
Employed
Unemployed
6-22

Bureau Labor Statistics determines perimeters for unemployment.
Persons over 16 are considered employed IF:
They worked at all for pay or profit even if for an hour
Worked 15 hours or more w/out pay in a family-operated enterprise.
Have a job which they did not work during (survey week) due to illness, vacation, industrial disputes, bad weather, time off or personal reasons.

How is unemployment measured?
• U.S. Census Bureau surveys about 60,000 households a month to determine how many people are actually unemployed. Done by random calling.
• This translates into approximately 110,000 individuals, a large sample compared to public opinion surveys which usually cover fewer than 2,000 people.

Measuring Unemployment (participation rate)
• A person is counted as unemployed if he or she is not working but is actively seeking work.
• Unemployment rate: the proportion of the labor force that is unemployed:
14,825,000 2010 unemployment rate = = 9.6% 153,889,000
Number of unemployed peopleUnemployment rate = Labor force
6-25

Exercise
• Calculate the unemployment rate.– #in labor force = 200,000– #unemployed = 10,000– Unemployment rate = (10,000/200,000) x 100 = 5%
Number of unemployed peopleUnemployment rate = Labor force
6-26

The Labor Force
• The labor force comprises about half the population.
• The size of the labor force has more than doubled since 1960 due to population growth.
• The labor force participation rate increased rapidly due to the increasing numbers of women joining the labor force.
6-27
BLS Continued
Persons are considered unemployed IF: (during the survey week)
Do not have a job Are available for work Have actively looked & looked for
work during past four weeks (this requirement is very weak…)
Reason for unemployment
• How long a person remains unemployed is affected by the nature of the joblessness.– Job leavers– Job losers– Re-entrants– New entrants

Demographics of Unemployment
• The unemployment rate is higher for– Men than women.– Blacks and Hispanics than whites.– Less educated people than higher-educated
people.– Teenagers than people older than them.
6-30

What happens if you can’t find work…….
• If unemployment persists… workers often give-up looking. • Discouraged workers are not counted as part of the
unemployment problem after they give up looking for a job.• Some people are forced to take any job available which
means…no longer unemployed, but now“underemployed.”

How could one be underemployed?
Underemployment exists when people seeking full-time paid employment, work only part time, or are employed at jobs below their capability.
Underemployed workers represent labor resources that are not being fully utilized.
The Human Costs of Unemployment
• Loss of income.• Loss of confidence.• Social stress.• Declining health.
6-33

Defining Full Employment
• Full employment is not the same as zero unemployment.
• There are four categories of unemployment.– Seasonal unemployment.– Fictional unemployment.– Structural unemployment.– Cyclical unemployment.
• At full employment, these can exist except cyclical unemployment.
6-34

Unemployment Cont.
Seasonal unemployment is the unemployment due to seasonal changes in employment or labor supply. What would be an example?
At the end of each season, thousands of workers must go searching for new jobs, experiencing seasonal unemployment in the process.

Three basic kinds of unemployment:
1. Frictional Unemployment• Frictional unemployment is the brief periods of
unemployment experienced by people moving between jobs or into the labor market.
• Frictional unemployment differs from other unemployment in three ways:
• Demand is there• Frictionally unemployed have the skills required• Job search relatively short

3 Kinds of Unemployment Cont.
• 2. Structural Unemployment• Structural unemployment is the unemployment caused by a
mismatch between the skills (or location) of job seekers and the requirements (or location) of available jobs.
Periods between jobs will be lengthened when the unemployed lack the skills that employers require.

3 Kinds of Unemployment Cont.
• 3. Cyclical Unemployment• Cyclical unemployment is the unemployment
attributable to the lack of job vacancies – i.e., to an inadequate level of aggregate demand.
• Cyclical unemployment occurs when there are simply not enough jobs to go around.

Source: U.S. Department of Labor, Bureau of Labor Statistics
More Than a Century of Unemployment

OKUN’S Law
• Okun’s Law• Arthur Okun quantified the relationship between the shortfall
in real output and unemployment.
• High unemployment in 1992 left the U.S. $240 billion short of its production possibilities — a loss of $920 of goods and services for every American.
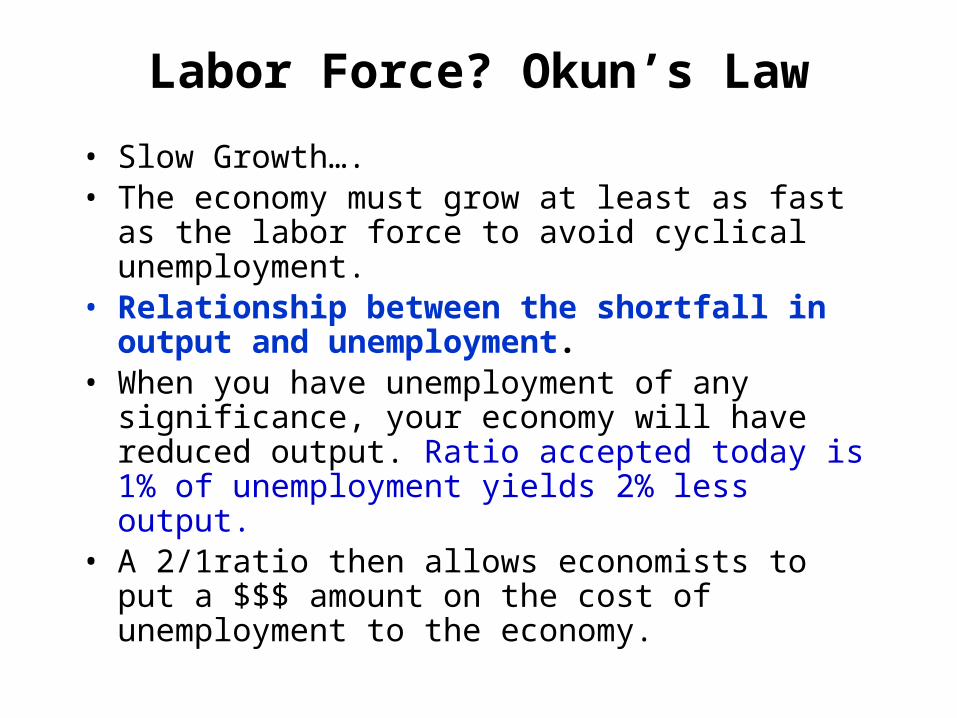
Labor Force? Okun’s Law
• Slow Growth….• The economy must grow at least as fast as the labor force
to avoid cyclical unemployment.• Relationship between the shortfall in output and
unemployment.• When you have unemployment of any significance, your
economy will have reduced output. Ratio accepted today is 1% of unemployment yields 2% less output.
• A 2/1ratio then allows economists to put a $$$ amount on the cost of unemployment to the economy.

Think about this!
Unemployment = 5% (NARU)Unemployment = 8% (x 2 = 16% less
production)Unemployment = 25% (depression era x 2) =
50% less production!Today (2012) 8.1 x 2 = 16.2%

So… what is full employment?
Full employment is not the same as zero unemployment.The economy strives to reach its potential which means
that full employment is essential.When the actual rate of unemployment exceeds the natural
rate, the actual output of the economy will fall below its potential.
Resources are underutilized (inside production possibility curve.)

Full Employment
• The condition that exists when the unemployment rate is equal to the natural unemployment rate.
• Full productive capacity has been
• Reached.

Image Cylinder= Economy…
Businesses, factories, economynot working at full capacity
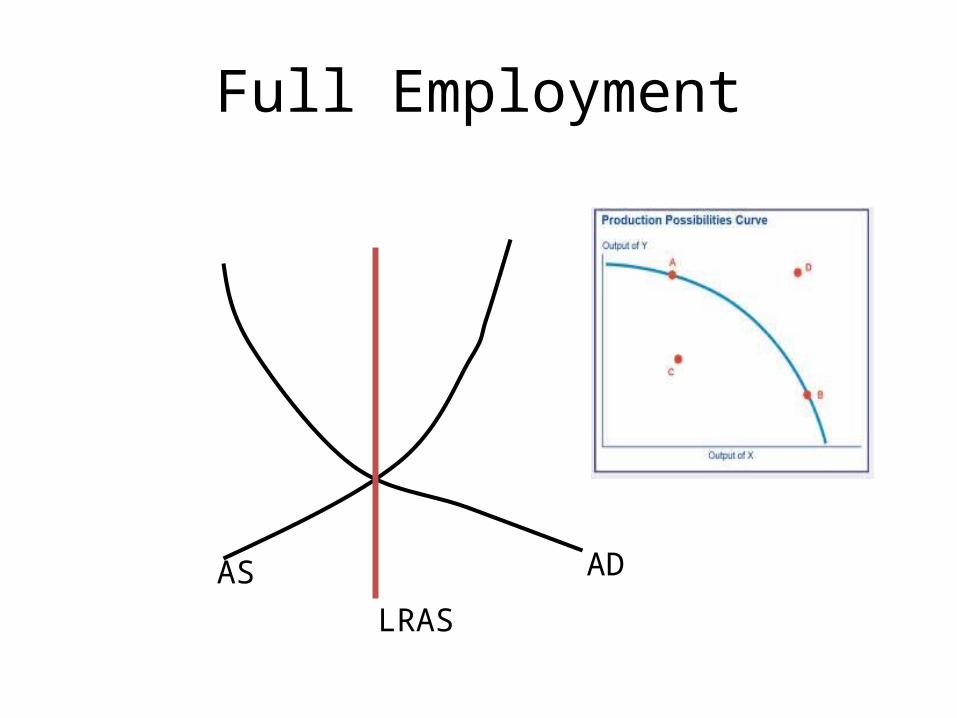
Full Employment
AS AD
LRAS

Full Employment Act of 1946
• The Full-Employment Goal
• In the Employment Act of 1946, Congress committed the federal government to pursue a goal of “maximum” employment.
• Congress didn’t specify what the rate of unemployment should be.
Congress creates confusion
First attempt to define “full employment” came about 1960- Council of Advisors decided that full employment meant “watching prices” …..
Rising prices they said would signal that full employment was being reached.*** believed inverse relationship unemployment/inflation
In 1970-80 Full employment potential was considered overly optimistic.
Unemployment rates stayed far above 4% even when the economy expanded.
Inflation began to accelerate at higher levels of unemployment.

Confusion Continued• The redefinition of full employment goal needed to be
addressed.• Needed to realize more youth and women in the labor
force• Needed to acknowledge the increased transfer payments• Needed to acknowledge the structural changes in demand
(for such things as technology and trade) old industries were not in such demand (steel, textiles, auto)\
• Most economists say 5% today• (6% is on the way…. In my opinion)

Humphrey-Hawkins Act of 1978
• This Act was passed to require the Federal Reserve to maintain a 4% rate of unemployment without inflation while holding the inflation to a goal of 3% by implementing monetary policy where needed.
• Fiscal policy might undo this law, but it is still a focus of the Fed and the Fed has to report to Congress twice a year on the health of the American economy.

Natural Rate of UnemploymentNARU
NARU = the difference between full employment and 100% employment.
A level of unemployment that will not trigger inflation. i.e. this figure will not bid up wages.
The natural rate of unemployment is not a temporary high or low… it is a rate that is sustainable into the future.

Depression Unemployment
• Our greatest failure occurred during the Great Depression, when as much as one-fourth of the labor force was unemployed.
The Historical Record• Unemployment rates fell dramatically during World War II
— the civilian unemployment rate reached a rock bottom 1.2 percent.
• Since 1950, unemployment rate has fluctuated from a low of 2.8 percent during the Korean War (1953) to a high of 10.8 percent during the 1981-82 recession.
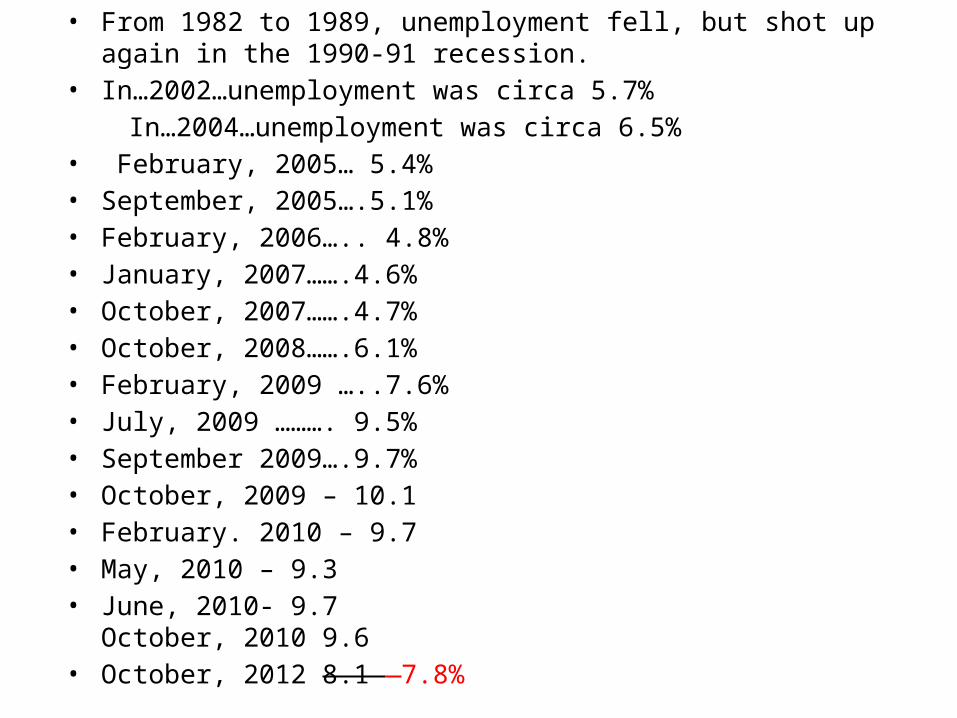
• From 1982 to 1989, unemployment fell, but shot up again in the 1990-91 recession.
• In…2002…unemployment was circa 5.7% In…2004…unemployment was circa 6.5%• February, 2005… 5.4% • September, 2005….5.1%• February, 2006….. 4.8%• January, 2007…….4.6%• October, 2007…….4.7%• October, 2008…….6.1%• February, 2009 …..7.6%• July, 2009 ………. 9.5%• September 2009….9.7%• October, 2009 – 10.1• February. 2010 – 9.7• May, 2010 – 9.3• June, 2010- 9.7
October, 2010 9.6• October, 2012 8.1 7.8%

New Jobs• The new jobs of tomorrow will require increasing levels of
education and skill.• And, new type skills no doubt. Old Skills• As the skills gap widens, structural unemployment increases.• The skills gap is the gap between skills required for emerging
jobs and the skills of workers.
Monster – What’s out there?