Embed Size (px)
Citation preview

Undocumented Immigrants’ State & Local Tax Contributions
Lisa Christensen Gee Matthew Gardner
Meg Wiehe
Updated February 2016
About The Institute on Taxation & Economic Policy
The Institute on Taxation and Economic Policy (ITEP) is a non-profit, non-partisan research organization that works on federal, state, and local tax policy issues. ITEP’s mission is to ensure that elected officials, the media, and the general public have access to accurate, timely, and straightfor-ward information that allows them to understand the effects of current and proposed tax policies. ITEP’s work focuses particularly on issues of tax fairness and sustainability.
Acknowledgments
ITEP extends special thanks to David Dyssegaard Kallick at the Fiscal Policy Institute, Michael Leachman at the Center on Budget and Policy Priorities, Jeanne Batalova at the Migration Policy Institute and Tanya Broder and Kamal Essaheb at the National Immigration Law Center for their guidance on this report.
THE INSTITUTE ON TAXATION & ECONOMIC POLICY1616 P Street, NW Suite 200, Washington, DC 20036
Tel: 202.299.1066 www.itep.org
1 Institute on Taxation and Economic Policy I February 2016
Public debates over federal immigration reform often suffer from insufficient and inaccurate information about the tax contributions of undocumented immigrants particularly at the state level. The truth is that undocumented immigrants living in the United States pay billions of dollars each year in state and local taxes. Further, these tax contributions would increase significantly if all undocumented immigrants cur-rently living in the United States were granted a pathway to citizenship as part of a comprehensive immi-gration reform.
Accurate information about the tax contributions of undocumented immigrants is needed now more than ever. Congress has yet to pass comprehensive immigration reform legislation. President Obama took executive action in 2012 and announced his intention to take action in 2014 to grant relief to eligible individuals who came to the United States as children (DACA) and to eligible parents of children who are citizens or lawful permanent residents (DAPA). The 2014 executive actions are facing review by the Supreme Court in the spring of 2016. And immigration is a leading issue among the 2016 presidential candidates.
To better inform the ongoing debates on immigration policy reform, this report provides state-by-state and national estimates on the current state and local tax contributions of the 11 million undocumented immigrants living in the United States as of 2013, the increase in contributions if all these taxpayers were granted legal status as part of comprehensive reform, and the increase in contributions of the more than 5 million undocumented immigrants who could be directly affected by President Obama’s 2012 and 2014 executive actions.1
Key Findings:
• Undocumented immigrants contribute significantly to state and local taxes, collectively paying an estimated $11.64 billion a year.2 Contributions range from almost $2.2 million in Montana with an estimated undocumented population of 4,000 to more than $3.1 billion in California, home to more than 3 million undocumented immigrants.
• Undocumented immigrants nationwide pay on average an estimated 8 percent of their incomes in state and local taxes (this is their effective state and local tax rate). To put this in perspective, the top 1 percent of taxpayers pay an average nationwide effective tax rate of just 5.4 percent.3
1 Migration Policy Institute (MPI) analysis of U.S. Census Bureau data from the 2009-2013 ACS pooled, and the 2008 Survey of Income and Program Participa-
tion (SIPP) by Colin Hammar and James Bachmeier of Temple University and Jennifer Van Hook of Pennsylvania State University, Population Research Insti-
tute. 2 See the methodology section for more information on the calculation of estimated undocumented immigrant state and local tax payments. 3 Institute on Taxation and Economic Policy, Who Pays? A Distributional Analysis of the Tax Systems in All 50 States, January 2015. Available: www.whopays.org
Undocumented Immigrants’ State & Local Tax Contributions 2
• Granting legal status to all undocumented immigrants in the United States as part of a comprehensive immigration reform and allowing them to work legally would increase their state and local tax contri-butions by an estimated $2.1 billion a year. Their nationwide effective state and local tax rate would increase to 8.6 percent.
• The state and local tax contributions of the undocumented immigrants who could be directly impacted by President Obama’s 2012 and 2014 executive actions would increase by an estimated $805 million a year once fully in place. The effective state and local tax rate for this population would increase from 8.1 to 8.6 percent. State and local revenue gains from the executive actions are smaller than gains from granting legal status to all undocumented immigrants because the actions (if upheld) would only affect around 46 percent of the undocumented population and the actions do not grant a full pathway to law-ful permanent residence or citizenship.
Undocumented Immigrants Pay State and Local Taxes: Current Contributions
Like other people living and working in the United States, undocumented immigrants pay state and lo-cal taxes. They pay sales and excise taxes when they purchase goods and services (for example, on utili-ties, clothing and gasoline). They pay property taxes directly on their homes or indirectly as renters. Many undocumented immigrants also pay state income taxes. The best evidence suggests that at least 50 percent of undocumented immigrant households currently file income tax returns using Individual Tax Identifica-tion Numbers (ITINs), and many who do not file income tax returns still have taxes deducted from their paychecks. 4
Collectively, undocumented immigrants in the United States pay an estimated total of $11.64 billion in state and local taxes a year (see Table 1 for state-by-state estimates). This includes more than $6.9 billion in sales and excise taxes, $3.6 billion in property taxes, and just under $1.1 billion in personal income taxes.
Another way to measure the state and local taxes that undocumented immigrants pay is through their effec-tive tax rate, which is the share of total income paid in taxes. The effective tax rate is useful for more accurate state-to-state comparisons because it accounts for differences between states’ tax structures and population size. Undocumented immigrants’ nationwide average effective tax rate is an estimated 8 percent. To put this in perspective, the top 1 percent of taxpayers pay an average nationwide effective tax rate of just 5.4 percent.5
4 See this report’s methodology section for more information about current personal income tax compliance. 5 Institute on Taxation and Economic Policy (see footnote 3).

Granting Legal Status to All Undocumented Immigrants Would Boost Their State and Local Tax Contributions
Creating a pathway to citizenship for the 11 million undocumented immigrants living in the United States and allowing them to work here legally would boost their current state and local tax contributions by more than $2.1 billion a year (See Table 1). Personal income tax collections would increase by more than $1 bil-lion a year. Sales and excise taxes would increase by $695 million, and property taxes would grow by $360 million. As a result, the overall state and local taxes paid by undocumented immigrants as a share of their income would increase from 8 percent to 8.6 percent.
3 Institute on Taxation and Economic Policy I February 2016
StateCurrent State and Local
TaxesState and Local Taxes if
Granted Full Legal StatusTax Change State
Current State and Local Taxes
State and Local Taxes if Granted Full Legal Status
Tax Change
Alabama $63,783,000 $81,984,000 +$18,201,000 Montana $2,207,000 $3,047,000 +$840,000
Alaska $3,512,000 $3,863,000 +$351,000 Nebraska $42,096,000 $49,529,000 +$7,433,000
Arizona $231,450,000 $273,902,000 +$42,452,000 Nevada $91,035,000 $100,138,000 +$9,103,000
Arkansas $58,605,000 $71,934,000 +$13,329,000 New Hampshire $8,205,000 $9,076,000 +$871,000
California $3,170,401,000 $3,619,437,000 +$449,036,000 New Jersey $590,302,000 $667,608,000 +$77,306,000
Colorado $134,582,000 $170,450,000 +$35,868,000 New Mexico $67,999,000 $76,022,000 +$8,023,000
Connecticut $136,233,000 $157,772,000 +$21,539,000 New York $1,108,625,000 $1,355,008,000 +$246,383,000
Delaware $11,966,000 $17,244,000 +$5,278,000 North Carolina $275,840,000 $368,514,000 +$92,674,000
Dist. of Col. $27,083,000 $33,157,000 +$6,074,000 North Dakota $3,759,000 $4,311,000 +$552,000
Florida $588,086,000 $646,894,000 +$58,808,000 Ohio $84,857,000 $110,595,000 +$25,738,000
Georgia $358,753,000 $464,430,000 +$105,677,000 Oklahoma $77,268,000 $94,278,000 +$17,010,000
Hawaii $30,231,000 $39,881,000 +$9,650,000 Oregon $78,169,000 $114,882,000 +$36,713,000
Idaho $26,248,000 $31,468,000 +$5,220,000 Pennsylvania $139,404,000 $190,931,000 +$51,527,000
Illinois $743,288,000 $897,781,000 +$154,493,000 Rhode Island $33,438,000 $40,442,000 +$7,004,000
Indiana $89,253,000 $116,970,000 +$27,717,000 South Carolina $67,697,000 $86,085,000 +$18,388,000
Iowa $37,381,000 $46,292,000 +$8,911,000 South Dakota $4,252,000 $4,677,000 +$425,000
Kansas $69,278,000 $80,435,000 +$11,157,000 Tennessee $105,277,000 $115,836,000 +$10,559,000
Kentucky $37,368,000 $53,352,000 +$15,984,000 Texas $1,542,397,000 $1,696,637,000 +$154,240,000
Louisiana $61,060,000 $74,726,000 +$13,666,000 Utah $67,102,000 $87,109,000 +$20,007,000
Maine $4,344,000 $5,483,000 +$1,139,000 Vermont $3,918,000 $4,543,000 +$625,000
Maryland $308,055,000 $393,669,000 +$85,614,000 Virginia $245,857,000 $324,148,000 +$78,291,000
Massachusetts $201,369,000 $262,080,000 +$60,711,000 Washington $292,169,000 $321,385,000 +$29,216,000
Michigan $83,833,000 $109,845,000 +$26,012,000 West Virginia $4,204,000 $5,596,000 +$1,392,000
Minnesota $77,066,000 $94,713,000 +$17,647,000 Wisconsin $80,863,000 $98,333,000 +$17,470,000
Mississippi $21,872,000 $26,930,000 +$5,058,000 Wyoming $3,625,000 $3,987,000 +$362,000
Missouri $48,273,000 $62,690,000 +$14,417,000 All States $11,643,936,000 $13,770,107,000 +$2,126,171,000
Table 1: Undocumented Immigrants' State and Local Tax ContributionsCurrent vs. Full Legal Status for All Undocumented Immigrants

Undocumented Immigrants’ State & Local Tax Contributions 4
The most significant revenue gain (50 percent) would come from the personal income tax, due to both in-creased earnings and full compliance with the tax code.6 Multiple studies have shown that legal immigrants have higher wages than undocumented immigrants, thus gaining legal status could lead to a boost in wages. The wage boost is in part due to better job opportunities that would be made available to workers with legal status and also in part to an increase in higher-level skills and better training. Most comprehensive reform measures to date have included strong incentives or requirements for undocumented immigrants granted legal status to fully comply with tax law.
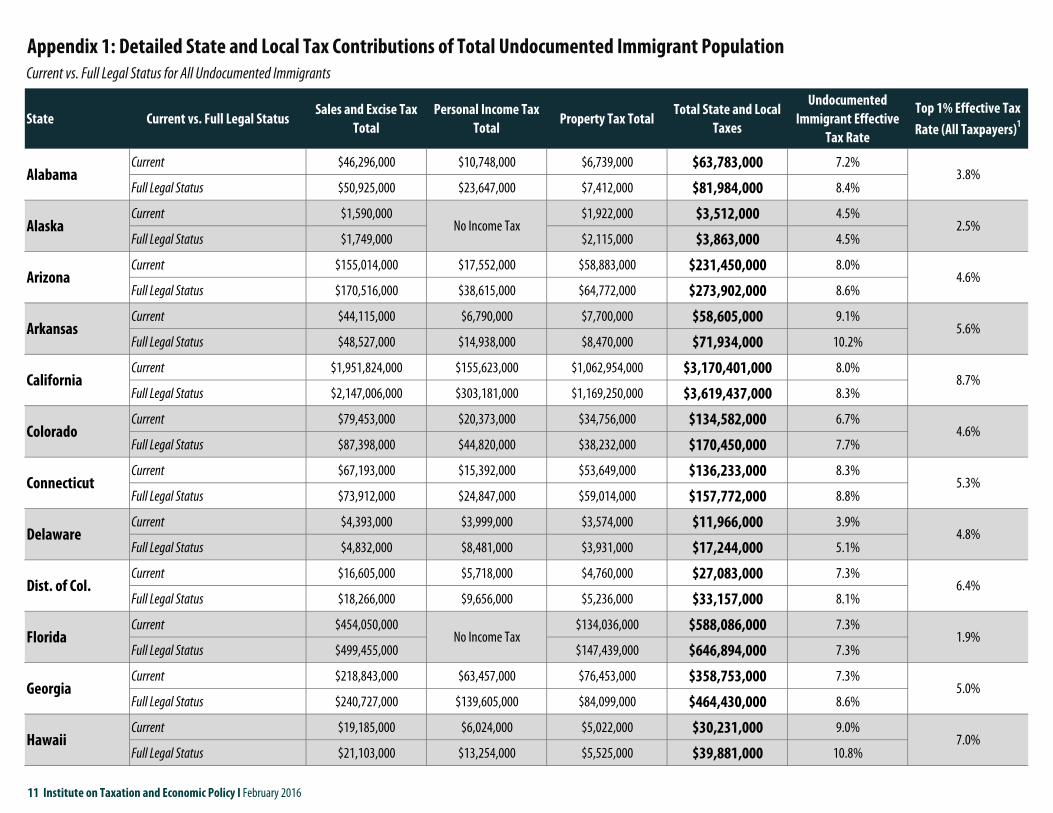
See Appendix 1 for state-by-state estimates of the current and post-reform state and local tax contri-butions of the total undocumented immigrant population. The appendix includes effective tax rates and totals for personal income, property, and sales and excise taxes.
President Obama’s Executive Actions Would Increase State and Local Tax Revenues
President Obama took executive actions in 2012 and 2014 to provide temporary relief from deportation and grant work permits to eligible undocumented immigrants. Under the Deferred Action for Childhood Arrivals (DACA) program, this relief was made available to up to 1.2 million eligible undocumented immi-grants who came to the country as children. Under the 2014 executive action, President Obama expanded DACA by another 275,000 undocumented immigrants and announced the Deferred Action for Parents of Americans and Lawful Permanent Residents (DAPA) program, which would allow 3.6 million eligible undocumented parents to apply for relief from deportation and for work authorization.7 Pending Supreme Court review of the 2014 executive action, more than 5 million undocumented immigrants could benefit from these executive actions, amounting to about 46 percent of the total population of undocumented im-migrants living in the United States.
If fully implemented, granting temporary immigration relief to these 5 million undocumented immigrants through DACA and DAPA would boost their current state and local tax contributions by more than $805 million (See Table 2). Personal income tax collections would increase by $442 million a year. Sales and ex-cise taxes would increase by $239 million, and property taxes would grow by $123 million. As a result, the overall state and local taxes paid by this population as a share of their income would increase from 8.1 per-cent to 8.6 percent. The most significant revenue gain (55 percent) would come from the personal income tax, due to both increased earnings and full compliance with the tax code. Since the undocumented immi-grants who would benefit from the executive actions would be allowed to apply for a three-year renewable
6 See this report’s methodology for a detailed description of wage boost and tax compliance assumptions applied to the change in state and local tax contributions post-
reform. 7 Migration Policy Institute (see footnote 1).

work permit, some amount of wage boost could be expected. Due to the mandates of the executive actions and the strong incentives undocumented immigrants have for compliance with the tax laws, it is also logical to assume full tax compliance for this impacted population (see the methodology section for more infor-mation).
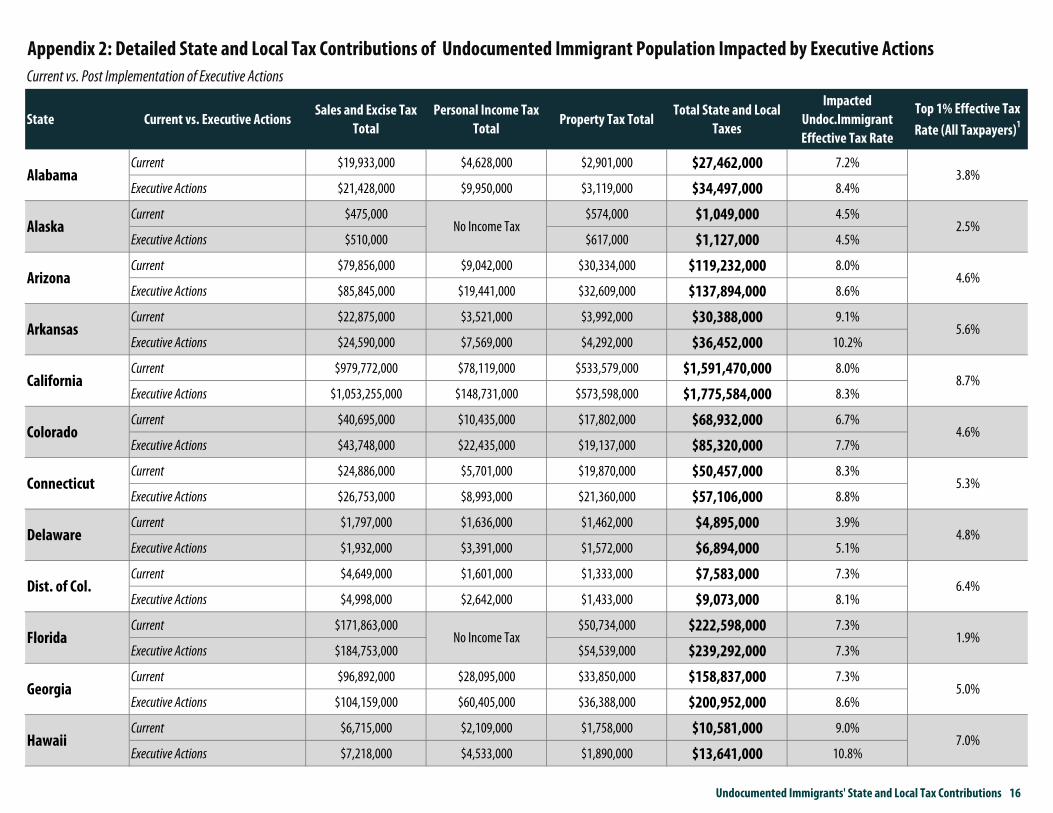
See Appendix 2 for state-by-state estimates of the current and post-reform state and local tax contri-butions of the 5 million undocumented immigrants directly affected by President Obama’s execu-tive actions. The appendix includes effective tax rates and totals for personal income, property, and sales and excise taxes.
5 Institute on Taxation and Economic Policy I February 2016
StateCurrent State and Local
Taxes
Taxes Under Full Implementation of Exec.
ActionsTax Change State
Current State and Local Taxes
Taxes Under Full Implementation of Exec.
ActionsTax Change
Alabama $27,462,000 $34,497,000 +$7,035,000 Montana $659,000 $889,000 +$230,000
Alaska $1,049,000 $1,127,000 +$78,000 Nebraska $20,479,000 $23,548,000 +$3,069,000
Arizona $119,232,000 $137,894,000 +$18,662,000 Nevada $43,538,000 $46,804,000 +$3,266,000
Arkansas $30,388,000 $36,452,000 +$6,064,000 New Hampshire $2,450,000 $2,648,000 +$198,000
California $1,591,470,000 $1,775,584,000 +$184,114,000 New Jersey $227,307,000 $251,232,000 +$23,925,000
Colorado $68,932,000 $85,320,000 +$16,388,000 New Mexico $34,971,000 $38,209,000 +$3,238,000
Connecticut $50,457,000 $57,106,000 +$6,649,000 New York $421,968,000 $504,025,000 +$82,057,000
Delaware $4,895,000 $6,894,000 +$1,999,000 North Carolina $122,595,000 $160,062,000 +$37,467,000
Dist. of Col. $7,583,000 $9,073,000 +$1,490,000 North Dakota $1,122,000 $1,258,000 +$136,000
Florida $222,598,000 $239,292,000 +$16,694,000 Ohio $34,761,000 $44,274,000 +$9,513,000
Georgia $158,837,000 $200,952,000 +$42,115,000 Oklahoma $35,736,000 $42,613,000 +$6,877,000
Hawaii $10,581,000 $13,641,000 +$3,060,000 Oregon $40,104,000 $57,600,000 +$17,496,000
Idaho $15,241,000 $17,856,000 +$2,615,000 Pennsylvania $52,277,000 $69,972,000 +$17,695,000
Illinois $373,792,000 $441,224,000 +$67,432,000 Rhode Island $13,584,000 $16,056,000 +$2,472,000
Indiana $41,267,000 $52,854,000 +$11,587,000 South Carolina $27,352,000 $33,991,000 +$6,639,000
Iowa $17,175,000 $20,786,000 +$3,611,000 South Dakota $1,269,000 $1,365,000 +$96,000
Kansas $35,172,000 $39,908,000 +$4,736,000 Tennessee $43,349,000 $46,613,000 +$3,264,000
Kentucky $14,947,000 $20,856,000 +$5,909,000 Texas $785,948,000 $844,894,000 +$58,946,000
Louisiana $18,318,000 $21,908,000 +$3,590,000 Utah $36,992,000 $46,930,000 +$9,938,000
Maine $1,297,000 $1,600,000 +$303,000 Vermont $1,170,000 $1,325,000 +$155,000
Maryland $107,092,000 $133,744,000 +$26,652,000 Virginia $89,583,000 $115,426,000 +$25,843,000
Massachusetts $70,751,000 $89,989,000 +$19,238,000 Washington $143,220,000 $153,961,000 +$10,741,000
Michigan $35,434,000 $45,374,000 +$9,940,000 West Virginia $1,255,000 $1,633,000 +$378,000
Minnesota $36,155,000 $43,424,000 +$7,269,000 Wisconsin $37,239,000 $44,256,000 +$7,017,000
Mississippi $7,571,000 $9,110,000 +$1,539,000 Wyoming $1,082,000 $1,163,000 +$81,000
Missouri $21,172,000 $26,871,000 +$5,699,000 All States $5,308,882,000 $6,114,086,000 +$805,204,000
Current vs. Post Implementation of Executive ActionsTable 2: State and Local Tax Contributions of Undocumented Immigrant Population Impacted by Executive Actions
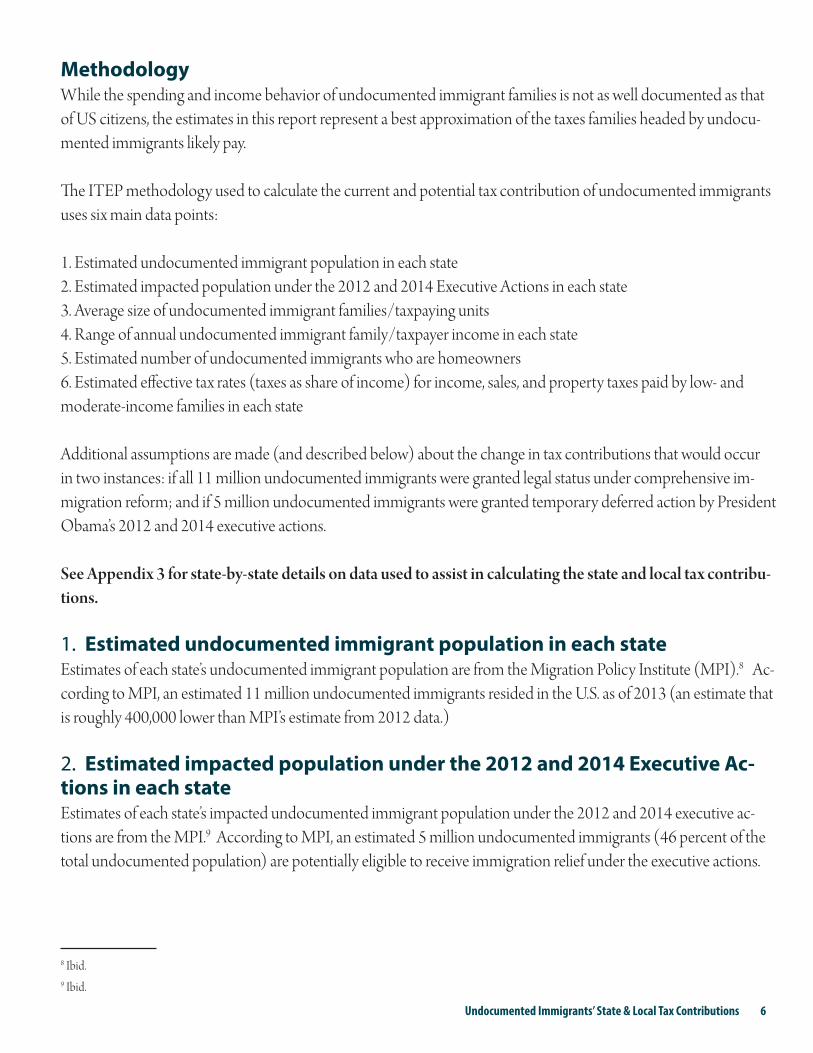
MethodologyWhile the spending and income behavior of undocumented immigrant families is not as well documented as that of US citizens, the estimates in this report represent a best approximation of the taxes families headed by undocu-mented immigrants likely pay.
The ITEP methodology used to calculate the current and potential tax contribution of undocumented immigrants uses six main data points:
1. Estimated undocumented immigrant population in each state2. Estimated impacted population under the 2012 and 2014 Executive Actions in each state3. Average size of undocumented immigrant families/taxpaying units4. Range of annual undocumented immigrant family/taxpayer income in each state5. Estimated number of undocumented immigrants who are homeowners6. Estimated effective tax rates (taxes as share of income) for income, sales, and property taxes paid by low- and moderate-income families in each state
Additional assumptions are made (and described below) about the change in tax contributions that would occur in two instances: if all 11 million undocumented immigrants were granted legal status under comprehensive im-migration reform; and if 5 million undocumented immigrants were granted temporary deferred action by President Obama’s 2012 and 2014 executive actions.
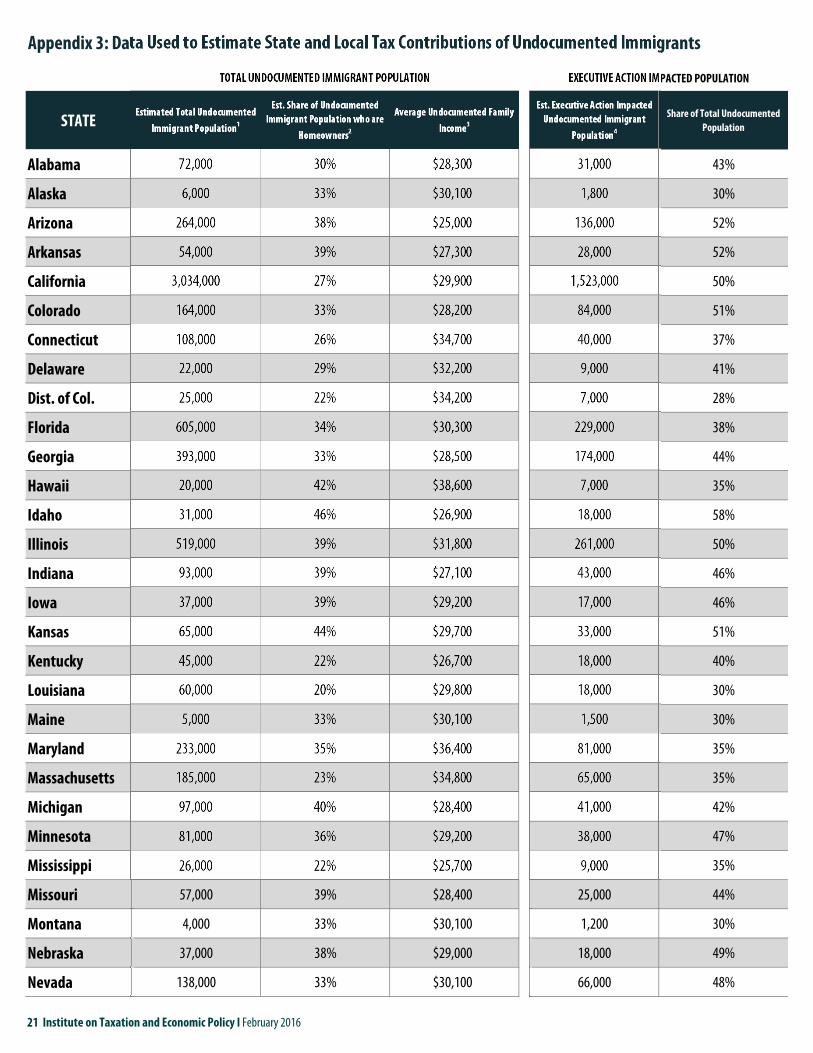
See Appendix 3 for state-by-state details on data used to assist in calculating the state and local tax contribu-tions.
1. Estimated undocumented immigrant population in each stateEstimates of each state’s undocumented immigrant population are from the Migration Policy Institute (MPI).8 Ac-cording to MPI, an estimated 11 million undocumented immigrants resided in the U.S. as of 2013 (an estimate that is roughly 400,000 lower than MPI’s estimate from 2012 data.)
2. Estimated impacted population under the 2012 and 2014 Executive Ac-tions in each stateEstimates of each state’s impacted undocumented immigrant population under the 2012 and 2014 executive ac-tions are from the MPI.9 According to MPI, an estimated 5 million undocumented immigrants (46 percent of the total undocumented population) are potentially eligible to receive immigration relief under the executive actions.
8 Ibid. 9 Ibid.
Undocumented Immigrants’ State & Local Tax Contributions 6

3. Average size of undocumented immigrant families/taxpaying unitsThe Pew Research Center calculated a nationwide estimate of the number of people per undocumented immigrant family. The most recent estimate, 2.29, is used to find an estimated number of undocumented families, or taxpaying units, by state.10 ITEP divided population estimates for each state (total and affected populations) by the average family size to find an estimated number of undocumented families/taxpaying units living in each state and the num-ber of families/taxpaying units impacted by the 2012 and 2014 executive actions.
4. Range of annual undocumented immigrant family/taxpayer income in each stateEstimates of the income distribution of undocumented families are from MPI data on the number of undocu-mented families in five discrete income groups.11 ITEP used the midpoint of the income ranges in each group as an estimate of average income within each group and multiplied by the number of families/taxpaying units in each group to calculate aggregate income in these groups.
5. Estimated number of undocumented immigrants who are homeownersITEP used MPI data on undocumented families’ homeownership rates for each state. We then calculated separate property tax incidence analyses for homeowners and renters in each state. Applying the homeowner effective tax rates to the homeowner population and the renter tax rates to the renter population yielded a combined property tax estimate for all undocumented families in each state.12
6. Estimated effective tax rates (taxes as share of income) for income, sales, and property taxes paid by low- and moderate-income families in each state13
ITEP’s microsimulation computer model is a sophisticated program that applies the state and local tax laws in each state (including income, sales, excise and property tax laws) to a statistically valid database of tax returns to generate estimates of the effective tax rates paid by taxpayers at various income levels under state and local tax law in place as of December 31, 2014. In January of 2015, ITEP released the 5th edition of Who Pays? which estimates the effect of the state and local tax laws as of January 2015 on taxpayers at 2012 income levels. This report applies effective tax rates calculated in the 2015 Who Pays? report to the undocumented population with one exception. The effective tax rates in five states: California, Maine, Massachusetts, New Jersey, and Rhode Island were slightly modified for the analysis to include the enactment or enhancement of state EITCs in 2015 (this change applies only to the analysis post-reform for both granting legal status to all undocumented immigrants and under the executive actions and does not impact the current tax contributions).
10 Passel and Cohn, Unauthorized Immigrant Population, National and State Trends, 2010, Pew Research Center, Feb. 1, 2011. 11 Migration Policy Institute (see footnote 1). 12 Ibid. 13 Institute on Taxation and Economic Policy (see footnote 3).
7 Institute on Taxation and Economic Policy I February 2016

The following assumptions were made to calculate the sales, property, and income taxes of the undocumented im-migration population:
• Sales tax: Sales taxes are collected by retailers every time a purchase is made on a taxable good or service. It is reasonable to assume that undocumented immigrants pay sales tax at similar rates to U.S. citizens and legal immigrants with similar incomes. This analysis adjusts the estimated annual incomes for each state downward by 10 percent for purposes of calculating the sales tax paid to account for remittances. Research shows that undocumented immigrants send about 10 percent of their income to families in their countries of origin, so this portion of undocumented taxpayers’ income is unavailable for taxable consumption.14
• Property tax: The first step in calculating property taxes was to identify the share of undocumented immigrant families who are homeowners or renters in each state. This analysis used state-by-state data from the MPI to estimate homeownership rates for undocumented immigrants in each state. The model assumes that for renters, half of the cost of the property tax paid initially by owners of rental properties is passed through to renters.
• Income tax: Various studies have estimated between 50 and 75 percent of undocumented immigrants cur-rently pay personal income taxes using either false social security (SSN) or individual tax identification (ITIN) numbers.15 This analysis assumes a 50 percent compliance rate for current taxes and 100 percent post-reform (for both granting legal status to all undocumented immigrants and under the executive actions).
Undocumented immigrants are currently ineligible to receive the federal Earned Income Tax Credit (EITC) and state versions of the credit because they lack the legal authority to work in the U.S. Accordingly, the impact of state EITCs has been removed from the current personal income tax estimates. This has the effect of increas-ing the effective income tax rates paid by these undocumented taxpayers under current law.
Additional indicators used to make calculations for anticipated state and local tax changes if legal status is granted as part of comprehensive immigration reform or under the executive actions:
• Wage boost: This study assumes that having the authority to work legally in the United States would increase undocumented immigrants’ wages and thus increase the taxes paid by those same immigrants, based on re-search by the Fiscal Policy Institute. Examining a number of studies on immigrant wages, this research consis-tently found that legal immigrants had higher wages than undocumented immigrants and gaining legal
14 See, for example, Manuel Orozco, Remittances to Latin America and the Caribbean: Issues and Perspectives on Development, Report Commissioned by the Organization of American
States, September 2004.15 See among others: Feinleib, Joel and David Warner, The Impact of Immigration on Social Security and the National Economy, Social Security Advisory Board, Issue Brief No. 1, Decem-
ber 2005 (Available at www.ssab.gov/brief-1-immigration.pdf ); Singer, Paula and Linda Dodd-Major, Identification Numbers and U.S. Government Compliance Initiatives, Tax Analysts
Special Report, 2004; and Cornelius, Wayne and Jessica Lewis, Impacts of Border Enforcement on Mexican Migration: The View from Sending Communities, La Jolla, Calif.: University of
California at San Diego, Center for Comparative Immigration Studies, 2007.
Undocumented Immigrants’ State & Local Tax Contributions 8

status could boost wages anywhere between 6 and 15 percent.16 A Congressional Budget Office report on the economic impact of immigration reformestimated the eventual wage boost to be 12 percent.17 An analysis from the Center for American Progress estimates that the 5 million workers who would directly benefit from the president’s action will see a wagepremium of 8.5 percent. 18 This study assumes a conservative estimate of a 10 percent wage hike under granting legal status to all 11 million undocumented immigrants and a 7.5 percent wage hike under the terms of the president’s executive actions since the work status would only be temporary. An increase in income would also contribute to a slight increase in the sales, property, and income tax payments of the currently undocumented immigrant population.
• Personal income tax compliance: As explained above, current estimates of undocumented immigrants’ income tax compliance rates range from 50 to 75 percent. To calculate the anticipated income tax gain from allowing undocumented immigrants to work in the U.S. legally (under full legal status or the executive actions), this analysis assumes full compliance with state personal income tax laws post-reform given the strong incen-tives for tax compliance likely to be included in a comprehensive reform measure. It is important to note that the same tax rules and provisions that apply to the general population will apply to undocumented immigrants filing income taxes.
• Earned Income Tax Credit eligibility: Post-reform (for both granting legal status to all undocumented immi-grants via comprehensive reform and under the executive actions), the study assumes that working immigrants granted the legal right to live and work in the U.S. and who are otherwise eligible for the EITC will claim the credit.
This analysis also assumes that working immigrants meeting EITC eligibility criteria and granted the legal right to work under comprehensive immigration reform and the executive actions will claim the state versions of the credit. The states with permanent EITCs included in this report are: California, Colorado, Connecticut, District of Columbia, Delaware, Iowa, Illinois, Indiana, Kansas, Louisiana, Massachusetts, Maryland, Maine, Michigan, Minnesota, Nebraska, New Jersey, New Mexico, New York, Ohio, Oklahoma, Oregon, Rhode Island, Virginia, Vermont, and Wisconsin. This study includes the impact of the newly enacted EITC in California and improve-ments made to EITCs in Maine, Massachusetts, New Jersey, and Rhode Island since the publication of the 2015 report.
16 Kallick, David Dyssegaard, Three Ways Immigration Reform Would Make the Economy More Productive, Fiscal Policy Institute, June 4, 2013 (see Appendix A: A Review of the
Literature on Legalization and Earnings). Available at: http://fiscalpolicy.org/wp-content/uploads/2013/06/3-ways-reform-would-improve-productivity.pdf. See also this report’s
methodology section for more information on the wage effects of granting legal status to the entire undocumented population as well as the wage effects on those affected by the
president’s executive actions.17 Congressional Budget Office, Cost Estimate for S. 744 (Border Security, Economic Opportunity, and Immigration Modernization Act), June 2013. Available at: http://cbo.gov/sites/
default/files/cbofiles/attachments/s744.pdf18 Oakford, Patrick and Philip E. Wolgin, The Economic and Fiscal Benefits of Deferred Action, 2014, Center for American Progress. Available at: https://www.americanprogress.org/
issues/immigration/news/2014/11/21/102041/the-economic-and-fiscal-benefits-of-deferred-action/
9 Institute on Taxation and Economic Policy I February 2016

Changes from ITEP’s April 2015 Undocumented Immigrants’ State & Local Tax Contributions Report
The analysis presented in this report is an update to an ITEP report published in 2015. The 2016 report uses 2013 estimates on the undocumented immigrant population (size, income, homeownership, and population impacted by the executive actions) whereas the 2015 report used 2012 data. Most notably, the number of undocumented immigrants declined by more than 400,000 between 2012 and 2013, a decade-long trend that has been well docu-mented amongst numerous researchers. The decline in the undocumented immigrant population and subsequently lower aggregate income led to a small drop in the total amount of state and local taxes undocumented immigrants pay in this study compared to the 2015 study.
Undocumented Immigrants’ State & Local Tax Contributions 10
Current $46,296,000 $10,748,000 $6,739,000 $63,783,000 7.2%
Full Legal Status $50,925,000 $23,647,000 $7,412,000 $81,984,000 8.4%
Current $1,590,000 $1,922,000 $3,512,000 4.5%
Full Legal Status $1,749,000 $2,115,000 $3,863,000 4.5%
Current $155,014,000 $17,552,000 $58,883,000 $231,450,000 8.0%
Full Legal Status $170,516,000 $38,615,000 $64,772,000 $273,902,000 8.6%
Current $44,115,000 $6,790,000 $7,700,000 $58,605,000 9.1%
Full Legal Status $48,527,000 $14,938,000 $8,470,000 $71,934,000 10.2%
Current $1,951,824,000 $155,623,000 $1,062,954,000 $3,170,401,000 8.0%
Full Legal Status $2,147,006,000 $303,181,000 $1,169,250,000 $3,619,437,000 8.3%
Current $79,453,000 $20,373,000 $34,756,000 $134,582,000 6.7%
Full Legal Status $87,398,000 $44,820,000 $38,232,000 $170,450,000 7.7%
Current $67,193,000 $15,392,000 $53,649,000 $136,233,000 8.3%
Full Legal Status $73,912,000 $24,847,000 $59,014,000 $157,772,000 8.8%
Current $4,393,000 $3,999,000 $3,574,000 $11,966,000 3.9%
Full Legal Status $4,832,000 $8,481,000 $3,931,000 $17,244,000 5.1%
Current $16,605,000 $5,718,000 $4,760,000 $27,083,000 7.3%
Full Legal Status $18,266,000 $9,656,000 $5,236,000 $33,157,000 8.1%
Current $454,050,000 $134,036,000 $588,086,000 7.3%
Full Legal Status $499,455,000 $147,439,000 $646,894,000 7.3%
Current $218,843,000 $63,457,000 $76,453,000 $358,753,000 7.3%
Full Legal Status $240,727,000 $139,605,000 $84,099,000 $464,430,000 8.6%
Current $19,185,000 $6,024,000 $5,022,000 $30,231,000 9.0%
Full Legal Status $21,103,000 $13,254,000 $5,525,000 $39,881,000 10.8%
Appendix 1: Detailed State and Local Tax Contributions of Total Undocumented Immigrant PopulationCurrent vs. Full Legal Status for All Undocumented Immigrants
Sales and Excise Tax Total
Personal Income Tax Total
Property Tax TotalTotal State and Local
Taxes
Undocumented Immigrant Effective
Tax Rate
Top 1% Effective Tax Rate (All Taxpayers)1State Current vs. Full Legal Status
Alabama 3.8%
Alaska No Income Tax 2.5%
Arizona 4.6%
Arkansas 5.6%
California 8.7%
Colorado 4.6%
Connecticut 5.3%
Delaware 4.8%
Dist. of Col. 6.4%
Florida No Income Tax 1.9%
Georgia 5.0%
Hawaii 7.0%
11 Institute on Taxation and Economic Policy I February 2016

Appendix 1: Detailed State and Local Tax Contributions of Total Undocumented Immigrant PopulationCurrent vs. Full Legal Status for All Undocumented Immigrants
Sales and Excise Tax Total
Personal Income Tax Total
Property Tax TotalTotal State and Local
Taxes
Undocumented Immigrant Effective
Tax Rate
Top 1% Effective Tax Rate (All Taxpayers)1State Current vs. Full Legal Status
Current $15,537,000 $2,359,000 $8,352,000 $26,248,000 7.2%
Full Legal Status $17,091,000 $5,191,000 $9,187,000 $31,468,000 7.8%
Current $344,326,000 $93,465,000 $305,497,000 $743,288,000 10.3%
Full Legal Status $378,759,000 $182,975,000 $336,047,000 $897,781,000 11.3%
Current $53,794,000 $19,145,000 $16,314,000 $89,253,000 8.1%
Full Legal Status $59,173,000 $39,852,000 $17,945,000 $116,970,000 9.7%
Current $21,709,000 $6,019,000 $9,653,000 $37,381,000 7.9%
Full Legal Status $23,880,000 $11,793,000 $10,619,000 $46,292,000 8.9%
Current $43,982,000 $6,541,000 $18,755,000 $69,278,000 8.2%
Full Legal Status $48,381,000 $11,424,000 $20,630,000 $80,435,000 8.7%
Current $20,981,000 $11,134,000 $5,253,000 $37,368,000 7.1%
Full Legal Status $23,079,000 $24,495,000 $5,778,000 $53,352,000 9.2%
Current $46,877,000 $7,678,000 $6,505,000 $61,060,000 7.8%
Full Legal Status $51,565,000 $16,006,000 $7,156,000 $74,726,000 8.7%
Current $2,568,000 $665,000 $1,111,000 $4,344,000 6.6%
Full Legal Status $2,825,000 $1,436,000 $1,222,000 $5,483,000 7.6%
Current $153,958,000 $71,017,000 $83,079,000 $308,055,000 8.3%
Full Legal Status $169,354,000 $132,927,000 $91,387,000 $393,669,000 9.7%
Current $87,506,000 $45,589,000 $68,274,000 $201,369,000 7.2%
Full Legal Status $96,256,000 $90,722,000 $75,101,000 $262,080,000 8.5%
Current $45,416,000 $17,681,000 $20,736,000 $83,833,000 7.0%
Full Legal Status $49,958,000 $37,078,000 $22,809,000 $109,845,000 8.3%
Current $45,493,000 $13,387,000 $18,186,000 $77,066,000 7.5%
Full Legal Status $50,042,000 $24,667,000 $20,005,000 $94,713,000 8.3%
Idaho 6.4%
Illinois 4.6%
Indiana 5.2%
Maryland 6.7%
Massachusetts 4.9%
Michigan 5.1%
Iowa 6.0%
Kansas 3.6%
Kentucky 6.0%
Louisiana 4.2%
Maine 7.5%
Minnesota 7.5%
Undocumented Immigrants' State and Local Tax Contributions 12

Appendix 1: Detailed State and Local Tax Contributions of Total Undocumented Immigrant PopulationCurrent vs. Full Legal Status for All Undocumented Immigrants
Sales and Excise Tax Total
Personal Income Tax Total
Property Tax TotalTotal State and Local
Taxes
Undocumented Immigrant Effective
Tax Rate
Top 1% Effective Tax Rate (All Taxpayers)1State Current vs. Full Legal Status
Current $16,666,000 $2,610,000 $2,595,000 $21,872,000 7.5%
Full Legal Status $18,333,000 $5,743,000 $2,855,000 $26,930,000 8.4%
Current $28,068,000 $8,718,000 $11,487,000 $48,273,000 6.8%
Full Legal Status $30,875,000 $19,180,000 $12,635,000 $62,690,000 8.1%
Current $663,000 $563,000 $981,000 $2,207,000 4.2%
Full Legal Status $730,000 $1,238,000 $1,079,000 $3,047,000 5.3%
Current $22,831,000 $4,048,000 $15,216,000 $42,096,000 9.0%
Full Legal Status $25,114,000 $7,677,000 $16,738,000 $49,529,000 9.6%
Current $69,387,000 $21,648,000 $91,035,000 5.0%
Full Legal Status $76,326,000 $23,812,000 $100,138,000 5.0%
Current $2,172,000 $5,987,000 $8,205,000 6.3%
Full Legal Status $2,390,000 $6,586,000 $9,076,000 6.3%
Current $267,243,000 $49,370,000 $273,688,000 $590,302,000 7.7%
Full Legal Status $293,968,000 $72,583,000 $301,057,000 $667,608,000 7.9%
Current $50,204,000 $3,950,000 $13,846,000 $67,999,000 9.2%
Full Legal Status $55,224,000 $5,568,000 $15,230,000 $76,022,000 9.3%
Current $568,456,000 $182,416,000 $357,754,000 $1,108,625,000 8.9%
Full Legal Status $625,301,000 $336,177,000 $393,529,000 $1,355,008,000 9.9%
Current $162,322,000 $59,173,000 $54,345,000 $275,840,000 6.8%
Full Legal Status $178,554,000 $130,181,000 $59,779,000 $368,514,000 8.3%
Current $2,903,000 $161,000 $695,000 $3,759,000 7.2%
Full Legal Status $3,194,000 $353,000 $764,000 $4,311,000 7.5%
Current $47,519,000 $15,684,000 $21,654,000 $84,857,000 8.0%
Full Legal Status $52,271,000 $34,505,000 $23,819,000 $110,595,000 9.5%
8.1%
North Carolina 5.3%
North Dakota 3.0%
Ohio 5.5%
New York
Mississippi 5.3%
Missouri
New Jersey 7.1%
New Mexico 4.8%
5.5%
Montana 4.7%
Nebraska 6.3%
Nevada No Income Tax 1.4%
New Hampshire No Income Tax on Wages 2.6%
13 Institute on Taxation and Economic Policy I February 2016

Appendix 1: Detailed State and Local Tax Contributions of Total Undocumented Immigrant PopulationCurrent vs. Full Legal Status for All Undocumented Immigrants
Sales and Excise Tax Total
Personal Income Tax Total
Property Tax TotalTotal State and Local
Taxes
Undocumented Immigrant Effective
Tax Rate
Top 1% Effective Tax Rate (All Taxpayers)1State Current vs. Full Legal Status
Current $52,790,000 $9,693,000 $14,785,000 $77,268,000 7.8%
Full Legal Status $58,069,000 $19,945,000 $16,264,000 $94,278,000 8.7%
Current $14,868,000 $28,340,000 $34,962,000 $78,169,000 5.6%
Full Legal Status $16,354,000 $60,070,000 $38,458,000 $114,882,000 7.4%
Current $66,902,000 $34,169,000 $38,333,000 $139,404,000 7.5%
Full Legal Status $73,592,000 $75,172,000 $42,166,000 $190,931,000 9.3%
Current $18,286,000 $4,081,000 $11,071,000 $33,438,000 7.6%
Full Legal Status $20,115,000 $8,149,000 $12,179,000 $40,442,000 8.4%
Current $43,861,000 $10,563,000 $13,274,000 $67,697,000 5.5%
Full Legal Status $48,247,000 $23,238,000 $14,601,000 $86,085,000 6.4%
Current $3,391,000 $861,000 $4,252,000 8.1%
Full Legal Status $3,730,000 $947,000 $4,677,000 8.1%
Current $88,060,000 $17,188,000 $105,277,000 7.7%
Full Legal Status $96,866,000 $18,907,000 $115,836,000 7.7%
Current $1,047,664,000 $494,733,000 $1,542,397,000 8.7%
Full Legal Status $1,152,431,000 $544,206,000 $1,696,637,000 8.7%
Current $39,131,000 $12,088,000 $15,883,000 $67,102,000 6.9%
Full Legal Status $43,044,000 $26,594,000 $17,471,000 $87,109,000 8.1%
Current $1,990,000 $426,000 $1,502,000 $3,918,000 7.5%
Full Legal Status $2,189,000 $701,000 $1,652,000 $4,543,000 7.9%
Current $124,534,000 $56,756,000 $64,567,000 $245,857,000 6.5%
Full Legal Status $136,988,000 $116,137,000 $71,024,000 $324,148,000 7.8%
Current $223,135,000 $69,034,000 $292,169,000 10.8%
Full Legal Status $245,448,000 $75,937,000 $321,385,000 10.8%
7.7%
Tennessee
Virginia 5.1%
Washington No Income Tax 2.4%
No Income Tax on Wages 3.0%
Texas No Income Tax 2.9%
Utah 4.8%
Vermont
Oklahoma 4.3%
Oregon 6.5%
Pennsylvania 4.2%
Rhode Island 6.3%
South Carolina 4.5%
South Dakota No Income Tax 1.8%
Undocumented Immigrants' State and Local Tax Contributions 14

Appendix 1: Detailed State and Local Tax Contributions of Total Undocumented Immigrant PopulationCurrent vs. Full Legal Status for All Undocumented Immigrants
Sales and Excise Tax Total
Personal Income Tax Total
Property Tax TotalTotal State and Local
Taxes
Undocumented Immigrant Effective
Tax Rate
Top 1% Effective Tax Rate (All Taxpayers)1State Current vs. Full Legal Status
Current $2,895,000 $883,000 $426,000 $4,204,000 6.4%
Full Legal Status $3,184,000 $1,944,000 $468,000 $5,596,000 7.8%
Current $41,762,000 $11,098,000 $28,002,000 $80,863,000 8.2%
Full Legal Status $45,938,000 $21,593,000 $30,802,000 $98,333,000 9.1%
Current $2,936,000 $688,000 $3,625,000 5.5%
Full Legal Status $3,230,000 $757,000 $3,987,000 5.5%
Current $6,951,347,000 $1,095,221,000 $3,597,367,000 $11,643,936,000 8.0%
Full Legal Status $7,646,482,000 $2,166,521,000 $3,957,104,000 $13,770,107,000 8.6%
Change +$695,135,000 +$1,071,300,000 +$359,737,000 +$2,126,171,000
% Total Change 33% 50% 17%
1 Institute on Taxation and Economic Policy, A Distributional Analysis of the Tax Systems in All Fifty States, 5th Edition, January 2015. www.whopays.org
All States
5.4%
West Virginia 6.5%
Wisconsin 6.2%
Wyoming No Income Tax 1.2%
15 Institute on Taxation and Economic Policy I February 2016
Current $19,933,000 $4,628,000 $2,901,000 $27,462,000 7.2%
Executive Actions $21,428,000 $9,950,000 $3,119,000 $34,497,000 8.4%
Current $475,000 $574,000 $1,049,000 4.5%
Executive Actions $510,000 $617,000 $1,127,000 4.5%
Current $79,856,000 $9,042,000 $30,334,000 $119,232,000 8.0%
Executive Actions $85,845,000 $19,441,000 $32,609,000 $137,894,000 8.6%
Current $22,875,000 $3,521,000 $3,992,000 $30,388,000 9.1%
Executive Actions $24,590,000 $7,569,000 $4,292,000 $36,452,000 10.2%
Current $979,772,000 $78,119,000 $533,579,000 $1,591,470,000 8.0%
Executive Actions $1,053,255,000 $148,731,000 $573,598,000 $1,775,584,000 8.3%
Current $40,695,000 $10,435,000 $17,802,000 $68,932,000 6.7%
Executive Actions $43,748,000 $22,435,000 $19,137,000 $85,320,000 7.7%
Current $24,886,000 $5,701,000 $19,870,000 $50,457,000 8.3%
Executive Actions $26,753,000 $8,993,000 $21,360,000 $57,106,000 8.8%
Current $1,797,000 $1,636,000 $1,462,000 $4,895,000 3.9%
Executive Actions $1,932,000 $3,391,000 $1,572,000 $6,894,000 5.1%
Current $4,649,000 $1,601,000 $1,333,000 $7,583,000 7.3%
Executive Actions $4,998,000 $2,642,000 $1,433,000 $9,073,000 8.1%
Current $171,863,000 $50,734,000 $222,598,000 7.3%
Executive Actions $184,753,000 $54,539,000 $239,292,000 7.3%
Current $96,892,000 $28,095,000 $33,850,000 $158,837,000 7.3%
Executive Actions $104,159,000 $60,405,000 $36,388,000 $200,952,000 8.6%
Current $6,715,000 $2,109,000 $1,758,000 $10,581,000 9.0%
Executive Actions $7,218,000 $4,533,000 $1,890,000 $13,641,000 10.8%
Appendix 2: Detailed State and Local Tax Contributions of Undocumented Immigrant Population Impacted by Executive ActionsCurrent vs. Post Implementation of Executive Actions
Sales and Excise Tax Total
Personal Income Tax Total
Property Tax TotalTotal State and Local
Taxes
Impacted Undoc.Immigrant Effective Tax Rate
Top 1% Effective Tax Rate (All Taxpayers)1State Current vs. Executive Actions
Alabama 3.8%
Alaska No Income Tax 2.5%
Arizona 4.6%
Arkansas 5.6%
California 8.7%
Colorado 4.6%
Connecticut 5.3%
Delaware 4.8%
Dist. of Col. 6.4%
Florida No Income Tax 1.9%
Georgia 5.0%
Hawaii 7.0%
Undocumented Immigrants' State and Local Tax Contributions 16

Appendix 2: Detailed State and Local Tax Contributions of Undocumented Immigrant Population Impacted by Executive ActionsCurrent vs. Post Implementation of Executive Actions
Sales and Excise Tax Total
Personal Income Tax Total
Property Tax TotalTotal State and Local
Taxes
Impacted Undoc.Immigrant Effective Tax Rate
Top 1% Effective Tax Rate (All Taxpayers)1State Current vs. Executive Actions
Current $9,021,000 $1,370,000 $4,849,000 $15,241,000 7.2%
Executive Actions $9,698,000 $2,945,000 $5,213,000 $17,856,000 7.8%
Current $173,158,000 $47,002,000 $153,631,000 $373,792,000 10.3%
Executive Actions $186,145,000 $89,925,000 $165,154,000 $441,224,000 11.3%
Current $24,872,000 $8,852,000 $7,543,000 $41,267,000 8.1%
Executive Actions $26,738,000 $18,007,000 $8,109,000 $52,854,000 9.7%
Current $9,974,000 $2,765,000 $4,435,000 $17,175,000 7.9%
Executive Actions $10,723,000 $5,295,000 $4,768,000 $20,786,000 8.9%
Current $22,330,000 $3,321,000 $9,522,000 $35,172,000 8.2%
Executive Actions $24,004,000 $5,668,000 $10,236,000 $39,908,000 8.7%
Current $8,392,000 $4,454,000 $2,101,000 $14,947,000 7.1%
Executive Actions $9,022,000 $9,575,000 $2,259,000 $20,856,000 9.2%
Current $14,063,000 $2,303,000 $1,952,000 $18,318,000 7.8%
Executive Actions $15,118,000 $4,693,000 $2,098,000 $21,908,000 8.7%
Current $767,000 $199,000 $332,000 $1,297,000 6.6%
Executive Actions $824,000 $419,000 $357,000 $1,600,000 7.6%
Current $53,522,000 $24,688,000 $28,882,000 $107,092,000 8.3%
Executive Actions $57,536,000 $45,160,000 $31,048,000 $133,744,000 9.7%
Current $30,745,000 $16,018,000 $23,988,000 $70,751,000 7.2%
Executive Actions $33,051,000 $31,151,000 $25,787,000 $89,989,000 8.5%
Current $19,197,000 $7,473,000 $8,765,000 $35,434,000 7.0%
Executive Actions $20,636,000 $15,316,000 $9,422,000 $45,374,000 8.3%
Current $21,342,000 $6,281,000 $8,532,000 $36,155,000 7.5%
Executive Actions $22,943,000 $11,309,000 $9,172,000 $43,424,000 8.3%
Idaho 6.4%
Illinois 4.6%
Indiana 5.2%
Maryland 6.7%
Massachusetts 4.9%
Michigan 5.1%
Iowa 6.0%
Kansas 3.6%
Kentucky 6.0%
Louisiana 4.2%
Maine 7.5%
Minnesota 7.5%
17 Institute on Taxation and Economic Policy I February 2016

Appendix 2: Detailed State and Local Tax Contributions of Undocumented Immigrant Population Impacted by Executive ActionsCurrent vs. Post Implementation of Executive Actions
Sales and Excise Tax Total
Personal Income Tax Total
Property Tax TotalTotal State and Local
Taxes
Impacted Undoc.Immigrant Effective Tax Rate
Top 1% Effective Tax Rate (All Taxpayers)1State Current vs. Executive Actions
Current $5,769,000 $904,000 $898,000 $7,571,000 7.5%
Executive Actions $6,202,000 $1,943,000 $966,000 $9,110,000 8.4%
Current $12,310,000 $3,824,000 $5,038,000 $21,172,000 6.8%
Executive Actions $13,234,000 $8,221,000 $5,416,000 $26,871,000 8.1%
Current $198,000 $168,000 $293,000 $659,000 4.2%
Executive Actions $213,000 $361,000 $315,000 $889,000 5.3%
Current $11,107,000 $1,969,000 $7,402,000 $20,479,000 9.0%
Executive Actions $11,940,000 $3,650,000 $7,958,000 $23,548,000 9.6%
Current $33,185,000 $10,353,000 $43,538,000 5.0%
Executive Actions $35,674,000 $11,130,000 $46,804,000 5.0%
Current $649,000 $1,788,000 $2,450,000 6.3%
Executive Actions $697,000 $1,922,000 $2,648,000 6.3%
Current $102,907,000 $19,011,000 $105,389,000 $227,307,000 7.7%
Executive Actions $110,625,000 $27,314,000 $113,293,000 $251,232,000 7.9%
Current $25,819,000 $2,031,000 $7,121,000 $34,971,000 9.2%
Executive Actions $27,755,000 $2,798,000 $7,655,000 $38,209,000 9.3%
Current $216,367,000 $69,432,000 $136,169,000 $421,968,000 8.9%
Executive Actions $232,595,000 $125,049,000 $146,382,000 $504,025,000 9.9%
Current $72,143,000 $26,299,000 $24,153,000 $122,595,000 6.8%
Executive Actions $77,554,000 $56,543,000 $25,965,000 $160,062,000 8.3%
Current $867,000 $48,000 $207,000 $1,122,000 7.2%
Executive Actions $932,000 $103,000 $223,000 $1,258,000 7.5%
Current $19,466,000 $6,425,000 $8,870,000 $34,761,000 8.0%
Executive Actions $20,925,000 $13,813,000 $9,535,000 $44,274,000 9.5%
8.1%
North Carolina 5.3%
North Dakota 3.0%
Ohio 5.5%
New York
Mississippi 5.3%
Missouri
New Jersey 7.1%
New Mexico 4.8%
5.5%
Montana 4.7%
Nebraska 6.3%
Nevada No Income Tax 1.4%
New Hampshire No Income Tax on Wages 2.6%
Undocumented Immigrants' State and Local Tax Contributions 18

Appendix 2: Detailed State and Local Tax Contributions of Undocumented Immigrant Population Impacted by Executive ActionsCurrent vs. Post Implementation of Executive Actions
Sales and Excise Tax Total
Personal Income Tax Total
Property Tax TotalTotal State and Local
Taxes
Impacted Undoc.Immigrant Effective Tax Rate
Top 1% Effective Tax Rate (All Taxpayers)1State Current vs. Executive Actions
Current $24,416,000 $4,483,000 $6,838,000 $35,736,000 7.8%
Executive Actions $26,247,000 $9,015,000 $7,351,000 $42,613,000 8.7%
Current $7,628,000 $14,540,000 $17,937,000 $40,104,000 5.6%
Executive Actions $8,200,000 $30,118,000 $19,282,000 $57,600,000 7.4%
Current $25,088,000 $12,813,000 $14,375,000 $52,277,000 7.5%
Executive Actions $26,970,000 $27,549,000 $15,453,000 $69,972,000 9.3%
Current $7,429,000 $1,658,000 $4,498,000 $13,584,000 7.6%
Executive Actions $7,986,000 $3,235,000 $4,835,000 $16,056,000 8.4%
Current $17,721,000 $4,268,000 $5,363,000 $27,352,000 5.5%
Executive Actions $19,051,000 $9,176,000 $5,765,000 $33,991,000 6.4%
Current $1,012,000 $257,000 $1,269,000 8.1%
Executive Actions $1,088,000 $276,000 $1,365,000 8.1%
Current $36,260,000 $7,078,000 $43,349,000 7.7%
Executive Actions $38,979,000 $7,608,000 $46,613,000 7.7%
Current $533,851,000 $252,097,000 $785,948,000 8.7%
Executive Actions $573,890,000 $271,005,000 $844,894,000 8.7%
Current $21,572,000 $6,664,000 $8,756,000 $36,992,000 6.9%
Executive Actions $23,190,000 $14,328,000 $9,413,000 $46,930,000 8.1%
Current $594,000 $127,000 $448,000 $1,170,000 7.5%
Executive Actions $639,000 $205,000 $482,000 $1,325,000 7.9%
Current $45,377,000 $20,680,000 $23,527,000 $89,583,000 6.5%
Executive Actions $48,780,000 $41,355,000 $25,291,000 $115,426,000 7.8%
Current $109,380,000 $33,840,000 $143,220,000 10.8%
Executive Actions $117,583,000 $36,378,000 $153,961,000 10.8%
7.7%
Tennessee
Virginia 5.1%
Washington No Income Tax 2.4%
No Income Tax on Wages 3.0%
Texas No Income Tax 2.9%
Utah 4.8%
Vermont
Oklahoma 4.3%
Oregon 6.5%
Pennsylvania 4.2%
Rhode Island 6.3%
South Carolina 4.5%
South Dakota No Income Tax 1.8%
19 Institute on Taxation and Economic Policy I February 2016

Appendix 2: Detailed State and Local Tax Contributions of Undocumented Immigrant Population Impacted by Executive ActionsCurrent vs. Post Implementation of Executive Actions
Sales and Excise Tax Total
Personal Income Tax Total
Property Tax TotalTotal State and Local
Taxes
Impacted Undoc.Immigrant Effective Tax Rate
Top 1% Effective Tax Rate (All Taxpayers)1State Current vs. Executive Actions
Current $864,000 $264,000 $127,000 $1,255,000 6.4%
Executive Actions $929,000 $567,000 $137,000 $1,633,000 7.8%
Current $19,232,000 $5,111,000 $12,896,000 $37,239,000 8.2%
Executive Actions $20,675,000 $9,718,000 $13,863,000 $44,256,000 9.1%
Current $877,000 $205,000 $1,082,000 5.5%
Executive Actions $942,000 $221,000 $1,163,000 5.5%
Current $3,189,881,000 $470,356,000 $1,648,645,000 $5,308,882,000 8.1%
Executive Actions $3,429,122,000 $912,671,000 $1,772,293,000 $6,114,086,000 8.6%
Change +$239,241,000 +$442,315,000 +$123,648,000 +$805,204,000
% Total Change 30% 55% 15%
1 Institute on Taxation and Economic Policy, A Distributional Analysis of the Tax Systems in All Fifty States, 5th Edition, January 2015. www.whopays.org
All States
5.4%
West Virginia 6.5%
Wisconsin 6.2%
Wyoming No Income Tax 1.2%
Undocumented Immigrants' State and Local Tax Contributions 20
STATE Estimated Total Undocumented Immigrant Population1
Est. Share of Undocumented Immigrant Population who are
Homeowners2
Average Undocumented Family Income3
Est. Executive Action Impacted Undocumented Immigrant
Population4
Share of Total Undocumented Population
Alabama 72,000 30% $28,300 31,000 43%
Alaska 6,000 33% $30,100 1,800 30%
Arizona 264,000 38% $25,000 136,000 52%
Arkansas 54,000 39% $27,300 28,000 52%
California 3,034,000 27% $29,900 1,523,000 50%
Colorado 164,000 33% $28,200 84,000 51%
Connecticut 108,000 26% $34,700 40,000 37%
Delaware 22,000 29% $32,200 9,000 41%
Dist. of Col. 25,000 22% $34,200 7,000 28%
Florida 605,000 34% $30,300 229,000 38%
Georgia 393,000 33% $28,500 174,000 44%
Hawaii 20,000 42% $38,600 7,000 35%
Idaho 31,000 46% $26,900 18,000 58%
Illinois 519,000 39% $31,800 261,000 50%
Indiana 93,000 39% $27,100 43,000 46%
Iowa 37,000 39% $29,200 17,000 46%
Kansas 65,000 44% $29,700 33,000 51%
Kentucky 45,000 22% $26,700 18,000 40%
Louisiana 60,000 20% $29,800 18,000 30%
Maine 5,000 33% $30,100 1,500 30%
Maryland 233,000 35% $36,400 81,000 35%
Massachusetts 185,000 23% $34,800 65,000 35%
Michigan 97,000 40% $28,400 41,000 42%
Minnesota 81,000 36% $29,200 38,000 47%
Mississippi 26,000 22% $25,700 9,000 35%
Missouri 57,000 39% $28,400 25,000 44%
Montana 4,000 33% $30,100 1,200 30%
Nebraska 37,000 38% $29,000 18,000 49%
Nevada 138,000 33% $30,100 66,000 48%
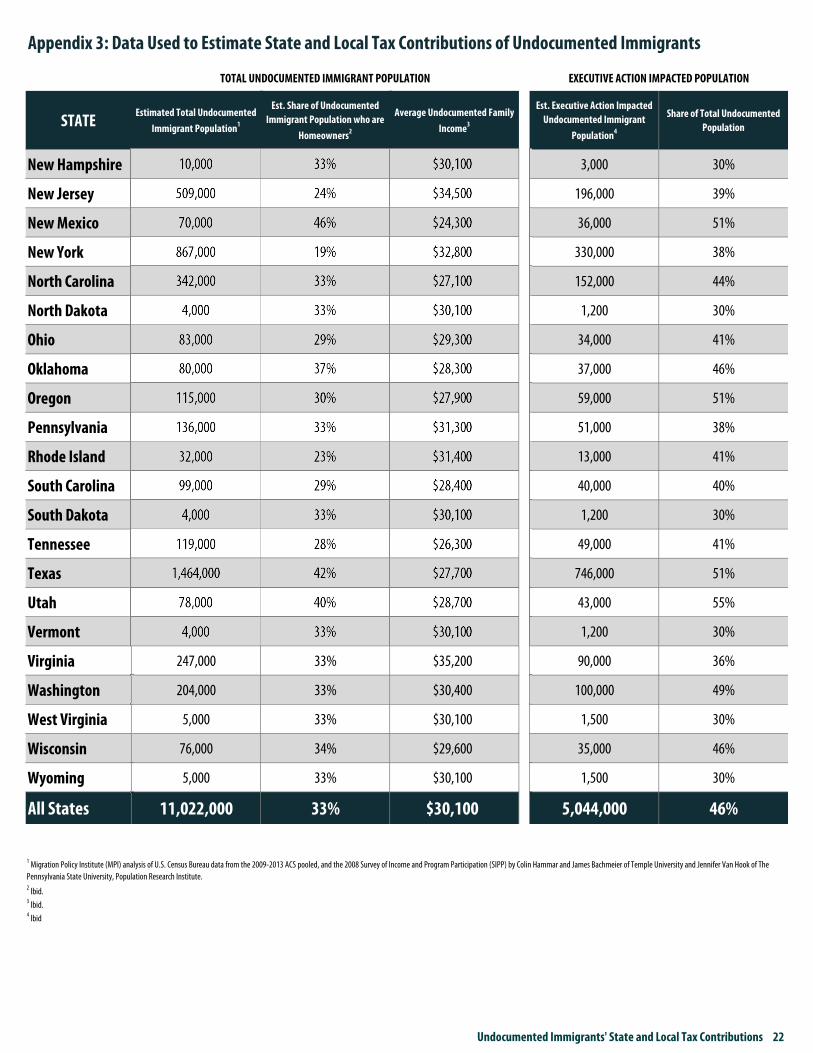
Appendix 3: Data Used to Estimate State and Local Tax Contributions of Undocumented Immigrants
EXECUTIVE ACTION IMPACTED POPULATIONTOTAL UNDOCUMENTED IMMIGRANT POPULATION
21 Institute on Taxation and Economic Policy I February 2016
STATE Estimated Total Undocumented Immigrant Population1
Est. Share of Undocumented Immigrant Population who are
Homeowners2
Average Undocumented Family Income3
Est. Executive Action Impacted Undocumented Immigrant
Population4
Share of Total Undocumented Population
Appendix 3: Data Used to Estimate State and Local Tax Contributions of Undocumented Immigrants
EXECUTIVE ACTION IMPACTED POPULATIONTOTAL UNDOCUMENTED IMMIGRANT POPULATION
New Hampshire 10,000 33% $30,100 3,000 30%
New Jersey 509,000 24% $34,500 196,000 39%
New Mexico 70,000 46% $24,300 36,000 51%
New York 867,000 19% $32,800 330,000 38%
North Carolina 342,000 33% $27,100 152,000 44%
North Dakota 4,000 33% $30,100 1,200 30%
Ohio 83,000 29% $29,300 34,000 41%
Oklahoma 80,000 37% $28,300 37,000 46%
Oregon 115,000 30% $27,900 59,000 51%
Pennsylvania 136,000 33% $31,300 51,000 38%
Rhode Island 32,000 23% $31,400 13,000 41%
South Carolina 99,000 29% $28,400 40,000 40%
South Dakota 4,000 33% $30,100 1,200 30%
Tennessee 119,000 28% $26,300 49,000 41%
Texas 1,464,000 42% $27,700 746,000 51%
Utah 78,000 40% $28,700 43,000 55%
Vermont 4,000 33% $30,100 1,200 30%
Virginia 247,000 33% $35,200 90,000 36%
Washington 204,000 33% $30,400 100,000 49%
West Virginia 5,000 33% $30,100 1,500 30%
Wisconsin 76,000 34% $29,600 35,000 46%
Wyoming 5,000 33% $30,100 1,500 30%
All States 11,022,000 33% $30,100 5,044,000 46%
2 Ibid.3 Ibid.4 Ibid
1 Migration Policy Institute (MPI) analysis of U.S. Census Bureau data from the 2009-2013 ACS pooled, and the 2008 Survey of Income and Program Participation (SIPP) by Colin Hammar and James Bachmeier of Temple University and Jennifer Van Hook of The Pennsylvania State University, Population Research Institute.
Undocumented Immigrants' State and Local Tax Contributions 22