Embed Size (px)
Citation preview
Water Resources Outreach Center (WROC) Project Number: IQP-PPM-20D2
Understanding Water Usage at Worcester Polytechnic Institute
An Interactive Qualifying Project
Submitted to the Faculty of
WORCESTER POLYTECHNIC INSTITUTE
in partial fulfillment of the requirements for the Degree of Bachelor of Science
Date: May 13, 2020
Submitted by:
Alan Curiel
Jean-Philippe Pierre Ellis Lenihan
Shangjin Zhong
Advised by: Professor Paul Mathisen, PhD, Worcester Polytechnic Institute
Key words: Sponsoring Agencies:
1. Water WPI Office of Sustainability
2. Usage WPI Facilities Office
3. WPI
Sponsoring Agencies:
WPI Office of Sustainability WPI Facilities Office
Water Resource Outreach Center Worcester Polytechnic Institute
This report represents the work of WPI undergraduate students submitted to the faculty as evidence of completion of a degree requirement. WPI routinely publishes these reports on its web site without editorial or peer review. For more information about
the projects program at WPI, see http://www.wpi.edu/academics/ugradstudies/project-learning.html

1
Abstract
Worcester Polytechnic Institute (WPI)’s water usage has increased since 2014. The goal of this project was to assess WPI’s water usage and recommend ways to decrease it. To achieve this, we analyzed WPI’s water usage data, focusing on heavily consuming buildings through interviews and water use estimates. We also sent out surveys about students’ water use. Our study suggested that despite the fact that students generally consider water conservation important, they use a significant amount of water in residential halls. We recommended social and technological changes WPI can implement, and a plan for future water conservation. These changes included influencing students to conserve more water through signs and competitions, replacing fixtures, and installing new meters.

2
Authorship
Draft outlines of each chapter were formed by the entire team simultaneously. The introduction was written and edited by all team members simultaneously. All other sections of the report were divided up to be written individually by team members and then edited simultaneously by the entire team.
3
Acknowledgements
We would like to thank our sponsors in the Facilities Office and Office of Sustainability, William Spratt and Elizabeth Tomazewski, for providing us with insight and information on WPI’s water usage. We would like to thank our advisor, Paul Mathisen, for guiding us through this project as well as providing us information as a member of the Office of Sustainability. We would also like to thank William Grudzinski, who gave us valuable information that allowed us to complete this project. We also thank all the staff members associated with WPI who gave us useful information, such as those from the Facilities Office, Athletic Department, and Dining Services. Finally, we thank all the students and faculty who responded to our survey.
4
Table of Contents Abstract 1 Executive Summary 5 1. Introduction 9 2. Background 11
2.1 Typical Uses of Water in Universities 11 2.2 Importance of Water Conservation 13 2.3 WPI and Worcester, MA 14 2.4 Stakeholders 15 2.5 Water Conservation at WPI 15 2.6 “Water Sustainability at Worcester Polytechnic Institute” 17 2.7 “Restroom Water Reduction Potential at University Of Illinois at Chicago” 18 2.8 Summary 19
3. Methodology 20 3.1 Objective 1: Analysis of WPI’s Water Usage Data 20 3.2 Objective 2: Reasons for High Water Usage 22 3.3 Objective 3: Recommendations 23
4. Results and Findings 25 4.1 Water Conservation Attitudes and Awareness 25 4.2 Water Usage of the WPI Campus 25 4.3 Water Usage of Specific Buildings on the WPI Campus 27 4.4 Summary 38
5. Summary and Recommendations 39 5.1 Key Findings 39 5.2 Next Steps 39 5.3 Recommendations for Behavioral Change 41 5.4 Technological Recommendations 41 5.5 Recommended Sustainability Plan for Water Conservation 43
6. Conclusion 45 References 46 Appendices 50
Appendix A. Student Survey Questions 50 Appendix B. Interview Questions 55 Appendix C. List of Figures 56 Appendix D. Estimation Procedures 67 Appendix E. Estimation Tables 70 Appendix F. Comparison of Water Usage to other Universities 73
5
Executive Summary Introduction
Water is a core part of life; it is used for drinking, cooking, plumbing, and mechanical systems. This makes water conservation a critical aspect of living sustainably. Therefore, the Office of Sustainability at Worcester Polytechnic Institute (WPI) is working to reduce water usage on campus. However, WPI’s water usage has increased since 2014, and the cost of providing water has risen with it.
The intent of this project was to find probable causes of WPI’s increase in water usage and help the university to create a more water-sustainable campus. Accordingly, our project’s goal was to assess WPI’s overall domestic water usage in order to recommend means of decreasing the institution's water consumption. To meet our goal, our objectives were to:
1. Analyze WPI’s overall water usage data by building and area. 2. Determine the reason why certain WPI areas or buildings have a high water
usage. 3. Make recommendations to reduce water usage on campus.
Our intent was to provide a foundation that our sponsors or another IQP team can use to
promote a long-term decrease in WPI’s water usage. To satisfy these objectives, our approach included the use of data analysis, interviews, and surveys. We started by analyzing WPI’s water data in order to identify the buildings on campus that most heavily consumed water. This analysis consisted of analyzing how WPI’s water usage changed on a yearly basis, and then finding the ten heaviest water consumers for each year. From the buildings which were found to be the heaviest water consumers, we selected five of them for closer investigation. We searched for patterns or sudden changes in their water usage by analyzing their water usage on yearly and monthly bases. Then, we conducted interviews to find probable reasons for any such changes and determine what appliances in the buildings consumed the most water. To gain more insight about students’ attitudes towards water conservation and how much water they used from showers, faucets and toilets, we sent out surveys to students asking them about this information. We also attempted to determine the extent to which student behavior affected WPI’s water consumption by estimating the amount of water students used in the buildings we selected based on survey responses. Finally, using the data we gathered from data analysis, interviews, and surveys, we formed recommendations to reduce WPI’s water usage that can be applied to any building on campus, not only the five we looked at.
We approached this project using the heaviest water users on campus as a basis for assessing and addressing water problems. Findings We made the following key findings during our project:
● WPI’s water usage has undergone a net increase since 2015. The five buildings we decided to investigate more closely were Boynton Hall, Daniels Hall, Founders Hall, Project Center, and the Recreation Center.
6
Survey responses lead to the following findings:
● Students generally find water conservation important and make efforts to conserve water. About 93% of respondents found water conservation at least “moderately important”, and approximately 76% tried at least “a little” to conserve water.
● On average, upperclassmen are more aware of WPI’s conservation efforts and try harder to conserve water than first-year students.
● Students shower in their residence for 14.5 minutes on average, which almost doubly exceeds the average American shower length of 8.2 minutes.
● Students and faculty are most aware of water conservation strategies in the Recreation Center, which displays its sustainability efforts throughout the building using signs.
We obtained the following findings from interviews:
● We found that the installation of low-flow shower heads led to a decrease in Daniels Hall’s water usage.
● The Rec Center previously used water from rainwater cisterns for its cooling tower, but switched to using city water instead. This led to a significant increase in its water consumption.
We gained the following findings from our estimates:
● Students’ water usage makes up a significant amount of residential halls’ water consumption. According to our estimates, they used about 40% of Daniels Hall’s water and more than 90% of Founders Hall’s water.
● Shower flow rates showed to be a significant factor in student water consumption. We estimated that students use over 90% of Founders Hall’s water if the showers have a flow rate of 2.5 gpm. If the flow rate is decreased to 1.5 gpm, students use about 76% of Founders Hall’s water instead, assuming all other factors remain the same.
● Approximately 7%-14% of Washburn Shops’ water consumption was due to restroom usage. We were not able to estimate how much water was used by laboratory equipment before the end of our project.
Recommendations
Our recommendations are based on our findings on WPI’s water usage and the heaviest water consumers on campus. Our findings suggest that both water-using appliances on campus and the behavior of WPI’s population contribute to water consumption. Therefore, we have provided technological recommendations, recommendations to promote behavioral change, and a sustainability plan for implementing and promoting future water conservation efforts. Some of our strongest recommendations are outlined below.
● Low-flow shower heads in all residential buildings. We recommend this because our findings showed that they helped to decrease Daniels Hall’s water usage, and that shower head flow rate could be a significant factor in water used by students at Founders Hall.
7
● More Signage. Because survey respondents were more aware of the Rec Center’s water conservation strategies, we recommend putting up more signs related to water use and conservation. These signs would inform students of both WPI’s water conservation efforts and of how they can reduce water use as individuals.
● Obtain removable, easy to install, and accurate meters to be used for cooling towers and all mechanical systems. During our project, it became evident that numerous systems on campus influenced water usage, but we weren’t able to determine precisely how much water they used. For this reason, we recommend using removable, easy to install, and accurate meters to gauge their water consumption. These meters can be used to find how much water certain systems use, as long as there are easily accessible pipes connected to them. We also recommend conducting a further investigation on how much water these systems consume.
● Keep a record of all water using appliances and their flow rates. We also recommend recording all water-using fixtures on campus and their flow rates for future water conservation efforts. By recording them, their information is organized together in one place. This aids future water conservation efforts by providing information that can be quickly accessed and used to identify opportunities for water conservation. This record should be updated yearly by contacting lab professors on their water-using equipment and the Facilities Office on any changes to fixtures.
● A water sustainability plan. Water overuse would always be a problem if regular and future actions are not taken to keep water conservation sustainable. One of our deliverables was a sustainability plan to guide WPI’s water conservation through the next five years.
Conclusion
Ultimately, we hope that the recommendations and plan we suggested are the start of better water management for WPI. Because this was a student-led project which recommended ways students could influence water conservation at WPI, we also believe that this project will lead to students having an increasing role in campus sustainability. If the plans we suggested are carried out, the implications of this project will also make it easier for WPI to plan and carry out water conservation efforts in the future. Keeping records of all water-conserving appliances and their flow rates would contribute to quicker analyses of WPI’s water usage.
We also believe that other universities and any large facilities seeking to conserve more water will benefit from the findings and recommendations from this project. For example, our findings concerning buildings renovated before flow rate regulations took effect would be beneficial to facilities with older fixtures trying to reduce their water consumption. Our findings regarding cooling systems would also be relevant to facilities with more efficient fixtures that are trying to reduce their water usage.
Our project also provides further benefit to WPI by raising questions for further research. We analyzed and addressed WPI’s water problems using its heaviest water users as a basis. Further research could involve doing the same for other buildings on campus. The buildings could also be more closely analyzed by physically inspecting fixtures. We were not able to do so ourselves because WPI’s campus was closed during this project. In addition, the precise amount of water used by cooling towers compared to the total water used by the buildings they are installed in is still unknown because of a lack of metering for them. This project was also unable

8
to determine the amount of water used by laboratory equipment. This could be beneficial to investigate more closely, considering that restroom usage didn’t make up a significant amount of the water used by Washburn Shops, a building containing laboratories. During this project, we also didn’t have access to all water-using mechanisms on campus, so further research on the water used by any machinery not mentioned in this project would also be useful. Finally, since costs are of importance to our sponsors when implementing sustainability efforts, it would be worth analyzing how much money WPI would save by conserving water through the recommendations we made.
9
1. Introduction It is a scientific fact that if one does not consume water, one will die. That statement
holds true for not only humans, but for every living organism on earth. That is reason enough for water to be a valuable resource that should be conserved. It is in our best interest to sustain water not only for our continued survival, but also for personal and environmental benefits. Those who conserve water leave a larger water supply available for later use and spend less money on water bills (AWWA, 2017). Decreasing water usage also leads to reduced water supply development and less energy consumption during water production (AWWA, 2017). Conserving water used by restroom facilities leads to lower wastewater flows and consequently, less wastewater discharges from wastewater treatment plants. This decrease in wastewater discharges leads to a decrease in the disruption of aquatic ecosystems (Wakelin, Colloff, & Kookana, 2008). In short, water conservation is a crucial issue concerning our survival and the environment’s wellbeing. It personally benefits us by lowering water bills, providing us with more reliable water supplies, and also makes the environment more sustainable.
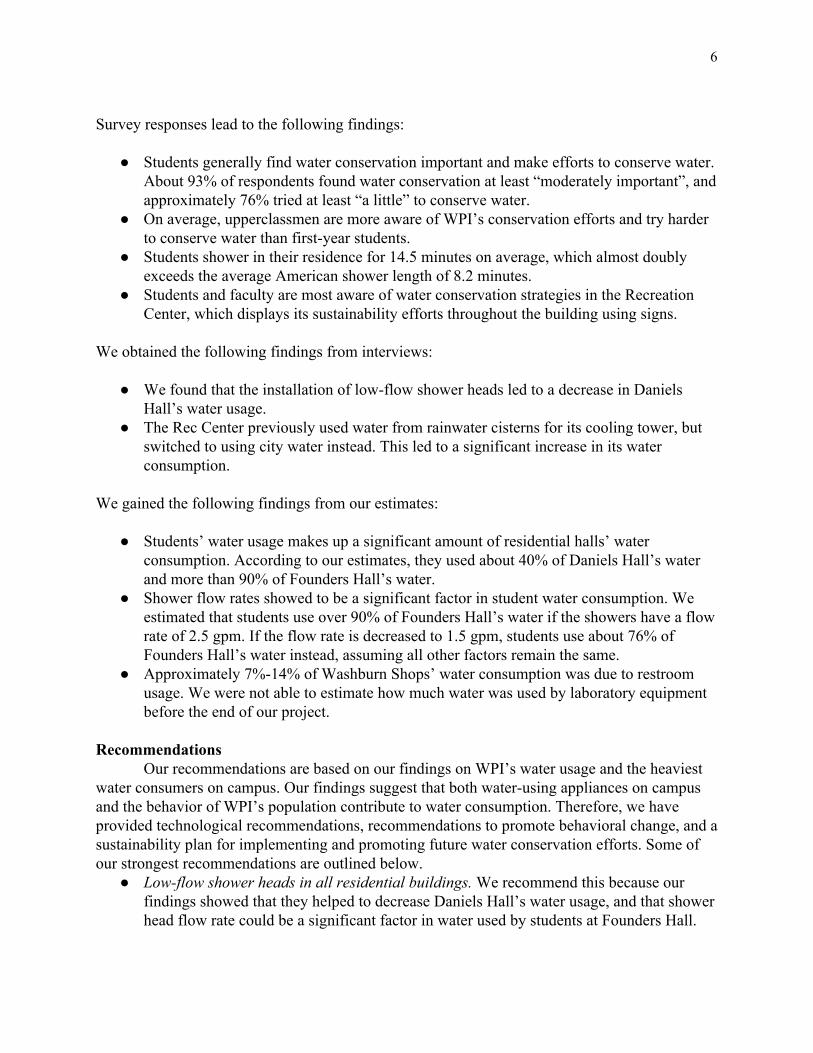
Students and staff at WPI collectively consume water for a number of reasons. They may use water for taking showers, washing dishes, cooking, drinking, and laboratory uses. WPI’s yearly water usage is approximately 6,000 gallons of water per full time equivalent (FTE) , and 1
the institution spends around $600,000 per year on water (Facilities Office, n.d.). When comparing WPI’s water usage to that of Dartmouth College in Figure 1.1, we found that although Dartmouth had a larger campus size and a similarly sized student population, its water usage per FTE was lower than WPI’s (Dartmouth Sustainability, 2019) (Dartmouth College, n.d.).
Figure 1.1: A bar chart comparing WPI’s water usage per student with that of Dartmouth and Princeton’s
1The definition of a full time equivalent varies from university to university. At WPI, one full time equivalent is either one full time student, one full-time faculty member, two part time students, or two part-time faculty members .

10
If WPI’s water usage can be lowered by just 100 gallons per each of WPI’s 5,600 full-time equivalent students (WPI Institutional Research, 2020), the university could save up to 560,000 gallons of water per year. This would help WPI spend less on water utilities and also assist it in furthering its sustainability goals by helping the institution conserve more water. In order to reduce WPI’s water usage, as well as lower utility costs and create an opportunity for WPI to emerge as a leader in university sustainability, its Facilities Office and Office of Sustainability seek to reduce the institution’s water usage.
Since water scarcity is an issue concerning the entire world, WPI isn’t alone in desiring to decrease its water use. Because of the benefits of water conservation, communities often make efforts to reduce or find means of reducing their water consumption. The University of Illinois at Chicago (UIC) conducted a study to detect whether the campus could decrease its water usage, which led to an unexpected revelation that most of the university’s water-using fixtures exceeded federal efficiency regulations. The study also estimated that a single building on campus could save almost $29,000 from using new fixtures (Khan, Moliski, Yoshida, & Klein-Banai, 2016). This study’s findings showed the critical role fixture efficiency plays in building’s water usage and the importance of checking fixtures.
In the past, WPI has also made efforts to reduce water usage. From September 2016 to May 2017, the city of Worcester experienced a drought (Augustus, 2017). To combat the drought, WPI’s Facilities Office conserved water by irrigating the grass less frequently, which successfully lowered the campus’s water consumption. WPI also saw a strategy for water conservation through Eco-reps , who educated students on their water usage and promoted water 2
conservation. The Eco-reps program succeeded in influencing some students’ behavior, but did not have a large enough outreach to influence all the students at WPI (Facilities Office, n.d.). Since 2007, WPI has also been designing new buildings so that they meet LEED certification (Worcester Polytechnic Institute, n.d.c). Despite these efforts to decrease water usage, WPI’s overall water usage has recently increased. WPI’s Sustainability Plan strove to decrease water usage per FTE by 25%, but it has instead increased by 15.5% since 2014 with no clear cause (Office of Sustainability, n.d.).
To find probable causes of WPI’s increase in water usage, help the Facilities Office and Office of Sustainability create a more water-sustainable campus, and reduce water costs, our project’s goal was to assess WPI’s overall domestic water usage in order to recommend means of decreasing the institution's water consumption. To meet our goal, our objectives were to: 1. Analyze WPI’s overall water usage data by building and area. 2. Determine the reason why certain WPI areas or buildings have a high water usage. 3. Make recommendations to reduce water usage on campus. We planned to achieve these objectives in the hopes that our recommendations to cause a long-term decrease in WPI’s water usage would be implemented. The approach included analyzing WPI’s data to determine key buildings to investigate, conducting interviews about the nature of these buildings’ water usage, surveying students about their attitudes and water use behaviors, and estimating the nature of key buildings’ water usage. Our approach could be used by other facilities to reduce their water usage.
The results of these findings are included in this report. Background information is included in chapter 2 and the details of these methods can be found in Chapter 3. Chapter 4 summarizes the findings and our final recommendations are included in Chapter 5
2 Eco-Reps was a WPI program in which student representatives worked with student groups over the campus to raise awareness of energy and water conservation.

11
2. Background This chapter is intended to provide sufficient background information for readers to
understand the importance of our project and to understand its context, specifically how water usage and conservation applies to universities. First, we will explain the importance of water conservation and the site of this project. Then, we will describe the stakeholders of this project and water consumption in the context of universities. The chapter then examines past water conservation efforts at WPI, followed by case studies of projects similar to this one.
2.1 Typical Uses of Water in Universities
Universities, like the rest of the world, need water. Universities consume water not only to sustain students’ and staff’s standard of living, but also to support the climate control systems around the campus. In this section, we will introduce why and how water is an important natural resource for universities. 2.1.1 Residence Hall and Restroom Water Usage
Residence halls, unlike other buildings on college campuses, have students living in them. This means that their water usage will be different from other buildings that are not inhabited. Students living in dormitories use water for daily life. This includes but is not limited to bathing, cooking, cleaning, restroom facilities, and drinking. Usually, a residence hall would have water fountains to supply the drinking needs of students throughout the year. According to a study by the Centers for Disease Control and Prevention (CDC), American adults drink 0.30 gallon of water everyday on average (Drewnowski A, Rehm CD, Constant F, 2013). This number is little compared to the water students use in bathrooms. People consume 2.5 gallons of water on average while brushing their teeth and washing their hands (Phila.gov, n.d.). In America, the greatest consumer of water is the shower, where water usage is 17.2 gallons per shower on average, and most Americans take just under one shower per day (Gammon, 2014). Another key water consumer is the toilet. If counted by the federal standard, in which the flow rate is set to 1.6 gallon per flush, a single person would consume 9.6 to 12.8 gallons of water just when using the toilet (Phila.gov, n.d.). However, college students are not required to use the toilets only when they are in their dorm; the number of times they use the toilet in the dorm is unknown and varies from person to person.
Some residence halls incorporate services which consume a great deal of water, such as dining and laundry. As most of the residence halls do not have an independent water meter for dining services, the dining services’ water usage is usually estimated. Depending on the size of cafeterias, the water usage for dining facilities could be counted for from 6.67% to 41.60% of the buildings’ total water usage (Nathan W. Arnett, 2010). On the other hand, laundry facilities also contribute to the water consumption of residence buildings. By the standard of Environmental Protection Agency (EPA), a typical washing machine would use less than 40 gallons of water per load. Based on personal habits, a college student would consume 1.33 gallons to 5.71 gallons of water per day or 40 gallons to 171.3 gallons per month for laundry (Jasmine Barnes, 2020). 2.1.2 Water Usage in Heating and Cooling Systems
Water plays an important role in heating and cooling systems not just in university buildings, but in most buildings. Heating systems often use a boiler to heat water, then pipe the
12
hot water to a heat exchanger (such as a radiator) to heat rooms or buildings. In cooling systems, air conditioning units employ a similar mechanic: they chill water, then pipe the chilled water to a certain location to cool the area. Despite water’s role in these systems, they don’t actually consume water; it flows back to the boiler or chiller (ASHRAE, 2016).
One cooling system that is built in larger facilities such as college campuses and also consumes water is the cooling tower. Similarly to chillers and boilers, water in a cooling tower system cycles between heat exchangers and the tower. Warm water travels to the cooling tower from heat exchangers and the cooling tower cools it through evaporation. To increase the evaporation rate at this stage, the cooling tower transfers the water through grating for it to form smaller droplets, and also blows air over the water (Peters, 2018). Evaporated water exits the tower at the top of the tower, while cool water collects at the bottom and is transferred back to heat exchangers. For continued operation of a cooling tower, one has to regularly replace water lost from evaporation, which is the cause of cooling towers’ water consumption (Brain, Bryant, & Elliott, 2011).
It is common for individual households to contain their own cooling systems and heating systems. This is known as central heating or air conditioning. Larger facilities such as university campuses use a different kind of heating and cooling system. Rather than having a central heating system in each building, they use a district system. A district system heats or cools the water at a single facility, then distributes it to each building. In each building, the water travels through heat exchangers or a separate heating and cooling system (Sarbu & Sebarchievici, 2017). After doing so, it travels back to the heating or cooling facility. District systems are more popular in larger facilities because they decrease the total machinery needed to heat and cool all buildings. This leads to less staff necessary for maintenance and more available space per building (ASHRAE, 2016). 2.1.3 Recreation Center-specific Water Usage
Similar to other buildings, recreation centers’ water usage consists of restrooms, water fountains, and climate control systems. Yet, a recreation center also contains showers for cleaning oneself after a workout or a practice, and sometimes, they contain a pool as well.
Pools are heavy water users for the sheer amount of water they require and maintain. Pools continuously have water coming in and out to keep the water clean and free of bacteria. This operates as a closed system. Dirty water is removed from the pool by an impeller, is filtered and treated, and returns to the pool. It is also common for this system to have a heater to keep the pool water warm (Giovanisci, 2020).
Pools can lose water either from evaporation (Department of Land Resource Management, n.d.) or from people bringing water out with them when exiting the pool (Facilities Office, n.d.). The larger the pool and the higher the temperature, the greater the water loss is (Department of Land Resource Management, n.d.). 2.1.4 Laboratory-specific Water Usage
Laboratories have their own specific uses for water, and numerous WPI buildings contain them. Not only do they require plumbing and climate control like regular buildings, but they also require cooling systems for equipment, sterilization methods, and purified water. Some large sources of water wastage in the lab are not turning water-using machines off, the single-pass cooling system, and filtering water.
13
Laboratories tend to have many water-using machines that do not get turned off after use. When these machines are not turned off, some amount of water is still flowing even if the machine is not being actively used (United States Environmental Protection Agency, 2005). This can quickly add up to a large amount of water wastage.
One huge source of water wastage in the lab is the single-pass cooling system. In this kind of cooling system, water passes through a piece of equipment in order to cool the equipment by transferring heat to the water. CAT scanners and air conditioners utilize this type of cooling process. The water used in this process goes directly to the sewer (United States Environmental Protection Agency, 2005).
Biology and chemistry labs also require filtered or purified water, free of the minerals and particles found in tap water. The water to be purified enters a system which two streams exit from: a filtered stream and a stream containing a mix of pure water and particles. The stream with the particles either flows through the system many times to extract as much pure water as possible, or is simply released to the sewer (United States Environmental Protection Agency, 2005). In general, the more pure the water is, the more water that was wasted in the process of preparing it.
To conserve water usage in laboratories, researchers and other users of laboratories must be aware of all these forms of water usage and act accordingly. It is good practice to turn off all lab equipment and water valves when they are not being used. Systems that reuse water are preferred over those that use a single-pass cooling system. If a single-pass cooling system is necessary, the water used can be reused for irrigation or heating processes. The unfiltered stream generated while creating purified water can also be used for irrigation if it does not have too high a mineral concentration (United States Environmental Protection Agency 2005).
Condensate is a good opportunity for water sustainability in labs. Condensate is the liquid that forms when humid air is cooled and dried. Labs often have to dehumidify their air, so in theory, the condensate formed from this dehumidification can be extracted and used for any non-potable application. Because condensate does not contain many minerals, it can be used as deionized (DI) water. It can also be used in water-based processes, such as cooling towers, and potentially irrigation (United States Environmental Protection Agency 2005). 2.2 Importance of Water Conservation
Water conservation affects the entire world, from a global to an individual scale. Globally, the world needs water to maintain the environment. The ecosystem is disrupted when large amounts of water are taken from ponds and lakes for human use (AWWA, 2017). If humans use too much water, water supply is not sufficient for wildlife. It is also important to have an available water source that can be used during droughts (AWWA, 2017). As population increases, demand for water also increases, but the natural water supply is “running out”, according to a NASA’s study (Frankel, 2015), due to the effect of climate change. In short, water conservation is necessary to ensure a sufficient supply of water for not only the environment, but for humankind as well.
Water conservation is also important because of its role in energy conservation. Water conservation and energy conservation are inherently linked to each other. Energy conservation leads to water conservation because less energy use means less water used in power plants and cooling systems. Conversely, water conservation saves energy. Energy is needed to treat water so that it can be used in plumbing systems and to deliver water to homes, businesses, and more. The
14
amount of energy required to supply water varies depending on the water source, water quality, how far the water is going, intended use of the water, and the geographical location. Energy consumption related to water usage in a municipality can be as much as 30-40% of their energy bill (Copeland & Carter, 2017).
Energy is not only linked to water being supplied, but also to wastewater management. Delivering sewer water to a wastewater plant takes energy, and treating this water before releasing it to the environment consumes great amounts of energy. At wastewater plants, energy is the second-most costly item after labor (Copeland & Carter, 2017).
Water conservation also impacts humans and society. Using less water results in lower water and sewer bills. Sometimes, water conservation plans are necessary in order to obtain a loan, grant, or permit (AWWA, 2017). Institutions that adopt water conservation strategies set an example for other institutions. For example, installing an experimental low-flow showerhead could reduce water usage. Most institutions might be unsure about implementing them because they do not know if the cost of implementation is worth the water that will be saved. Some institutions may decide to implement them, and then they may find that they are very successful at conserving water. The institutions that were uncertain at first would now be more likely to adopt the low-flow showerheads, because they know how successful they are. 2.3 WPI and Worcester, MA
Worcester Polytechnic Institute (WPI) is a private university that focuses on Sciences, Technology, Engineering, and Mathematics (STEM) fields. Both undergraduate and graduate students live on and off campus. WPI’s buildings generally fall into three categories: residential, academic, and administrative. The institute currently has ten on-campus residential halls and apartments; they are Daniels Hall, East Hall, Ellsworth Apartments, Faraday Hall, Fuller Apartments, Institute Hall, Messenger Hall, Morgan Hall, Sanford Riley Hall, and Stoddard Complex. WPI also has on-campus graduate housing. WPI’s 12 academic buildings are Alden Memorial, Atwater Kent, Fuller Labs, Gordon Library, Goddard Hall, Higgins Labs, Kaven Hall, Olin Hall, Salisbury Labs, Stratton Hall, Washburn Laboratories, and Gateway Park. Several other buildings are used for administrative purposes such as Boynton Hall, Bartlett Center, and the Project Center. In addition to these, WPI contains multipurpose buildings such as the Sports and Recreation Center, the Campus Center, and Harrington Auditorium.
WPI is located in Worcester, a city in the center of Massachusetts. Home to nine colleges (City of Worcester, 2020), it is the second most populated city in Massachusetts with an estimated population of 185,877 (United States Census Bureau, 2019) at the time of writing. The weather varies throughout the seasons, with the temperature in the summer months, from 1982-2012 coming at averages of 64.9°F, 70.2°F, and 68.4°F in June, July, and August respectively (Climate-Data.org, n.d.). Though the city does not get as hot as southern states, Worcester comes with its fair share of weather-induced problems. One example is the recent drought in 2016, when the city had to supplement its lack of water from Boston’s water supplier (Augustus, 2017).
To lower water spending and achieve its sustainability goals, WPI would like to reduce its water usage. According to the WPI Office of Sustainability’s website, WPI used 44 million gallons of water in 2018, which is 6400 gallons per FTE (Worcester Polytechnic Institute, n.d.b). WPI roughly spends over $600,000 a year on water alone (Facilities Office, n.d.). The WPI Facilities Office is aware of all these matters and wishes for this situation to improve.
15
2.4 Stakeholders
WPI has many groups of people who need water from academic uses to living needs. As a leader in innovation, the campus would benefit if the institute consumes less water. The Facilities Office is one of the many stakeholders in this project, along with WPI students, the Office of Sustainability, and the city of Worcester. In this section, we will discuss those affected by our project. 2.4.1 WPI Students
Students are the primary users of water across WPI, as they live on campus and make up the largest part of WPI’s population. According to WPI’s enrollment data, there were 6894 students in total attending WPI in fall 2019 (WPI Institutional Research, 2020). The university must ensure that students have access to the water they need, while also being aware of how much water they consume. Because of the great number of students using water, conservation through behavioral change relies heavily on their actions. Thus, influencing students’ water consumption behavior could significantly reduce water usage on campus.
2.4.2 The WPI Facilities Office and Office of Sustainability
The WPI Facilities Office is in charge of keeping the campus safe, clean, and well maintained (Worcester Polytechnic Institute, n.d.a). They do everything related to maintenance on campus, from tracking energy and water data to ensuring campus roads and walkways are salted during snowfall. For the past couple of years, they have focused on lowering energy consumption costs (Facilities Office, n.d.). Now that they have significantly lowered the yearly energy costs on campus, they wish to focus on water. The Facilities Office would like to ensure that all those on the WPI campus are getting an adequate amount of water in a financially effective way and without overusing the water available. The efforts to lower water use across campus help the campus save money and use water more sustainably.
WPI’s Office of Sustainability plans, organizes and coordinates sustainability efforts on campus in regards to administration, academics, and facilities. It also produces sustainability plans and uses them to guide sustainability initiatives. In addition, the Office of Sustainability conducts efforts to promote sustainability among WPI students such as providing support to sustainability-related student groups. The Office of Sustainability does all of these things to further WPI’s sustainability goals, reducing campus water consumption being one of them (Worcester Polytechnic Institute, n.d.b).
2.4.3 The City of Worcester
WPI is not its own isolated community; it is another water user in the city of Worcester. WPI’s efforts to reduce water will help lower the city’s overall water usage and may even set an example for the other eight colleges (City of Worcester, 2020) in Worcester. 2.5 Water Conservation at WPI
WPI has experienced a 15.5% increase in water consumption since 2014 as the campus size has been continually growing by about 10% since 2015, despite the Sustainability Plan that aimed to decrease the amount of water usage by 25% per FTE (Office of sustainability, n.d.).
16
WPI has taken several approaches to remove obstacles to water sustainability, and we will describe each of them.
2.5.1 Water Cistern
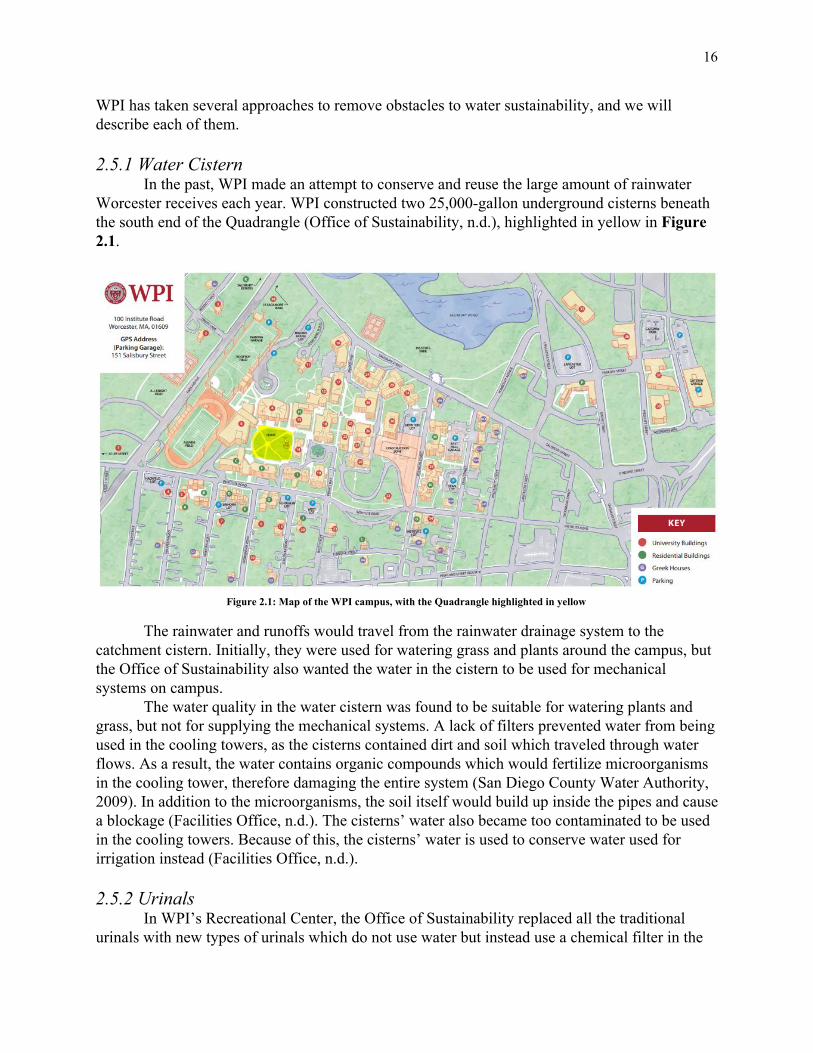
In the past, WPI made an attempt to conserve and reuse the large amount of rainwater Worcester receives each year. WPI constructed two 25,000-gallon underground cisterns beneath the south end of the Quadrangle (Office of Sustainability, n.d.), highlighted in yellow in Figure 2.1.
Figure 2.1: Map of the WPI campus, with the Quadrangle highlighted in yellow
The rainwater and runoffs would travel from the rainwater drainage system to the catchment cistern. Initially, they were used for watering grass and plants around the campus, but the Office of Sustainability also wanted the water in the cistern to be used for mechanical systems on campus.
The water quality in the water cistern was found to be suitable for watering plants and grass, but not for supplying the mechanical systems. A lack of filters prevented water from being used in the cooling towers, as the cisterns contained dirt and soil which traveled through water flows. As a result, the water contains organic compounds which would fertilize microorganisms in the cooling tower, therefore damaging the entire system (San Diego County Water Authority, 2009). In addition to the microorganisms, the soil itself would build up inside the pipes and cause a blockage (Facilities Office, n.d.). The cisterns’ water also became too contaminated to be used in the cooling towers. Because of this, the cisterns’ water is used to conserve water used for irrigation instead (Facilities Office, n.d.). 2.5.2 Urinals
In WPI’s Recreational Center, the Office of Sustainability replaced all the traditional urinals with new types of urinals which do not use water but instead use a chemical filter in the
17
pipe to clean up the waste. Consuming no water, the new urinal would save one gallon per flush compared to a standard urinal (EPA, 2013).
The intention for using waterless urinals was to save water, but the Sustainability Office soon identified a drawback after the urinals were put into service. The purpose of saving water is not only to increase sustainability, but also to save costs. Despite the urinals’ water saving potential, WPI was not able to implement them across the entire campus because they were found to have high maintenance costs.
2.5.3 Shower Heads
One way to reduce the water students consume while showering is to trace back to where water flows out of during a shower: the shower head. Limiting the amount of water sprayed out from the shower head would reduce the amount of water used per minute. Low-flow shower heads have a lower flow rate of water compared to standard ones and use 50%-70% less water without reducing shower time.
At WPI, the low flow shower head has been installed throughout the entire campus (Facilities Office, n.d.). This approach saves water at WPI and is the only one that does not incur maintenance fees, making it the most effective water consumption effort among the ones we have discussed. WPI plans to install the low-flow shower head in all future buildings.
2.5.4 Behavioral Changes
The Office of Sustainability has not only implemented technological changes in an attempt to reduce water consumption, but has also promoted behavioral change. The Office of Sustainability cooperated with student representatives to promote water conservation and general sustainability in residence halls. Student representatives encouraged students to spend less time in the shower and turn off the sink when brushing their teeth (Facilities Office, n.d.). In addition, the Office of Sustainability created a pamphlet targeted toward students detailing many ways to conserve water, conserve energy, and reduce emissions in different aspects of life. 2.5.5 Eco-Reps
During Worcester’s drought in 2016-2017, student representatives raised awareness to the student body about their water usage. The Facilities Office also changed their water-using habits, such as cutting and watering the grass less frequently. These efforts by the students and the Facilities Office were found to successfully decrease WPI’s water consumption (Facilities Office, n.d.). 2.6 “Water Sustainability at Worcester Polytechnic Institute”
In 2014, the “Water Sustainability at Worcester Polytechnic Institute” interdisciplinary qualifying project (IQP) was conducted at WPI. According to its project document, its goal was to “reduce the amount of water consumed by Worcester Polytechnic Institute through both behavioral and technological changes” (Couitt, Preucil, & Wong, 2014), which is very similar to the goal of this project. Thus, it would be sensible to use this project as a case study and note its successes and shortcomings.
This project involved a water audit of select WPI buildings. First, the project group obtained and analyzed WPI’s water billing history for the last seven years. Then, the project

18
group selected a set of buildings to inspect for comparison to other buildings with similar intended uses. These buildings were Olin Hall, Gateway Park, Salisbury Labs, Daniels Hall, and East Hall. For each of these buildings, the group took note of the models and flow rates of its interior and exterior water fixtures to compare their efficiencies to those of newer fixtures. They then analyzed WPI’s billing history data to find patterns in buildings’ water consumption (Couitt, Preucil, & Wong, 2014).
One of the project team’s major findings was a campus-wide trend in water consumption. Water usage levels significantly dropped from 2006 to 2008, which was found to be due to a decision to implement closed water cooling systems in place of open ones. They also found that generally, water usage was higher during the school year, and was lower during breaks. This trend was not observed in Olin Hall and Goddard Hall; they were found to have higher water usage during summer months and lower water usage during the school year. It would be expected for them to follow the trend because they are academic and lab buildings respectively for chemistry and physics that are primarily used by students. The project group was not able to determine a cause for this. Gateway Park was found to consume the most water on campus, and also proved difficult to determine its causes of heavy consumption. This was because its water usage data were rounded and relatively less precise than those for other buildings (Couitt, Preucil, & Wong, 2014).
In conclusion, this IQP project is relevant to ours for the following reasons. The downwards trend due to a transition to closed water cooling systems underscores the significance of closed water systems to water conservation. Should we find any open water systems in campus machinery, it gives us reason to suggest using closed water systems instead. In addition, Goddard Hall and Olin Hall have water usage trends that could be something to look out for during our data analysis and could be further investigated if necessary. Finally, the difficulties caused by Gateway Park’s rounded data serve as a reminder to validate data prior to its use to ensure its usefulness.
2.7 “Restroom Water Reduction Potential at University Of Illinois at Chicago”
The University of Illinois at Chicago (UIC) is an American university located in the city of Chicago that was founded in 1982. The university is the largest in the Chicago metropolitan area, with 33,390 students in total and 2817 faculty members at the time of writing (University of Illinois at Chicago, 2020).
In 2015, UIC’s Office of Sustainability conducted a water audit in order to determine potential for water conservation at the university and to decrease water costs in light of recent and projected future water price increases. The buildings selected for audit differed in intended purpose, age, renovations and daily traffic. The water audit focused on three types of fixtures in each building: faucets, urinals and toilets. The audit compared the fixtures’ water usage levels to those mandated by two standards: federal standards for water consumption and Environmental Protection Agency (EPA) standards for sustainability (Khan, Moliski, Yoshida, & Klein-Banai, 2016).
The water audit used numerous methods to measure the fixtures’ water usage levels. It collected faucets’ flow rates by placing a flow bag (a plastic bag used to measure flow rate) under a faucet for a certain amount of time. The volume of water in the bag after the time limit
19
was used to calculate the flow rate. The audit collected the flow rate of a toilet or urinal by measuring the amount of time for a toilet to completely flush, then inputting the time into a water auditing software that would use it to calculate the fixture’s gallons per flush (Khan, Moliski, Yoshida, & Klein-Banai, 2016).
The audit then analyzed the average water usage of each building selected. It was found that in most buildings, fixtures’ water consumption exceeded federal and EPA standards. The audit estimated the yearly water costs and water consumption of the university’s current fixtures and newer fixtures and compared them. The audit estimated that UIC’s Student Center East building would save $28,808.82 and 3,780,685 gallons of water from using new fixtures (Khan, Moliski, Yoshida, & Klein-Banai, 2016).
This case study is relevant to this project because it provides insights into methods that can be used to estimate the water usage levels of a building’s fixtures. It also illustrates the importance of using metrics to show the impact of newer fixtures on water costs and water consumption. The audit’s water savings and utility cost savings calculations convincingly showed UIC’s potential to save costs and conserve water.
2.8 Summary
Based on the knowledge and research, water is precious and it’s demand is increasing. Hence, we are looking into possibilities of conserving water. With the research, we recognize how water is taking part in all the departments and people in the institute, including students, facility offices and the city of Worcester. We moved on to researching insights on WPI’s previous attempts to reduce its water consumption. Understanding how and why these attempts were successful and unsuccessful helped us form our recommendations. Water conservation is not a new issue for the university; taking a look at similar projects assisted us with formulating this project’s methods. With research on the nature of water use in universities and background information of the institute, we will not only formulate but also tailor our recommendations seamlessly to fit WPI’s context.
20
3. Methodology The goal of our project was to assess WPI’s overall domestic water usage in order to
recommend means of decreasing the institution's water consumption. To achieve this goal, we sought to accomplish the following objectives:
1. Analyze WPI’s overall water usage data by building and area. 2. Determine the reason why certain WPI areas or buildings have a high water usage. 3. Make recommendations to reduce water usage on campus.
The methods we used to achieve these objectives are outlined below.
3.1 Objective 1: Analysis of WPI’s Water Usage Data
We planned to analyze WPI’s water data in order to gain a better understanding of the details of WPI’s water usage as well as the water consumption levels of its buildings relative to each other. This assisted us in assessing WPI’s water usage and determining the areas and buildings on campus that used the most water.
We analyzed WPI’s raw water usage data, which we obtained from the WPI Facilities Office. In particular, for the fiscal years 2015 to 2019 , we analyzed WPI’s yearly total water 3
usage and the water usage levels of the buildings on campus which consumed the most water. We chose these years because the data remained fairly consistent during these years compared to others. Other years had repeated labels for different buildings, which made it difficult to determine specific buildings each label was for.
3.1.1 WPI’s Overall Water Usage
The first measurement we calculated was the total campus water usage of every fiscal year from 2015 to 2019. Once we obtained and calculated the total values for water in, sewer, and total consumption , we created a line graph to visualize the yearly total data; the y-axis 4
represented the amount of water usage in 100 cubic feet, and the x-axis represented the year. That way, we could see if any significant changes have occurred in the campus’s yearly water usage.
For each year, we also prepared line graphs of the entire campus’s monthly water usage. Each plot in the line graph displays WPI’s water usage during each month in a given year. We prepared these graphs in order to assess WPI’s water consumption and find trends in WPI’s monthly water usage. In addition, we prepared bar charts of the percentage change of WPI’s yearly total water usage. We did this not only to determine whether WPI’s water usage was increasing or decreasing, but also to understand how much it changed each year. 3.1.2 Finding and Analyzing Heavy Consumers
We also wanted to find the greatest contributors to WPI’s water usage. Therefore, we obtained every building's total water consumption for each year and sorted them from highest to
3 Each of WPI’s fiscal years starts and ends in mid-June, so the fiscal year 2015 would last from mid-June of 2014 to mid-June of 2015, and the fiscal month of July would start mid-June and end mid-July. 4 WPI’s water is billed for the water that comes in and water that exits to sewer, separately. Total consumption combines the amount of water with sewer.
21
lowest. Then we created a bar chart for every year to show the top ten highest water users. This was helpful because it gave us a good idea of the types of buildings that use the most water and in turn, the buildings we can focus on to form our recommendations. To determine the heaviest water consuming buildings on campus, we tallied the number of times each building appeared in the graphs showing the top ten water consumers on campus. We then sorted the buildings in descending order by their tally. We selected the heaviest consumers by taking the first ten buildings from this sorted order.
After determining heaviest consumers, we proceeded to analyze their data further. We wanted to not only specify the water consumption tendencies of the consumers and the time period of inconsistencies, but also compare the tendencies of each year’s data for the purpose of perceiving consistencies. To meet the requirement, we plotted line graphs of heavy users’ monthly total water usage for fiscal years from 2015 to 2019, with 5 lines in each graph and 10 graphs in total. We would also use the resulting plots to assist further research on three pivotal pieces of information: when the water consumption becomes high, the amount of overused water; and ultimately, the causes of its overuse.
To further assess the heavily consuming buildings’ water consumption, we prepared bar charts displaying the percentage change of each building’s water usage. We did this in order to determine how much the building’s consumption has changed year by year.
3.1.3 Categorial Analysis
We also analyzed the data by organizing the buildings by category. These categories were academic buildings, office buildings, main undergraduate housing, graduate housing, miscellaneous student-use buildings, miscellaneous housing, other properties, and the sprinklers for 1 Drury Lane and Faraday Hall. This was intended to determine which types of buildings use the most water, to assess the yearly total water usage of each building relative to similar buildings, and to provide Facilities with an overview of how much water each building type uses.
A line graph of the yearly total water usage from 2015 to 2019 was made for each category (except the sprinklers), with each line representing one building. Next, the total water usage for each category for each year was summed and plotted together on a line graph.
For each sprinkler, a line graph was plotted showing the sprinkler’s water usage and the water usage of the building it is for. We did this to determine how much water the sprinklers used compared to their respective buildings. In addition to total water usage for undergraduate housing, a graph for water usage per student was made. The purpose of this was to estimate how much water is used per student in each building and see which students use more water. This was done by dividing the total water usage of each building by its maximum occupancy. This does not take dining services or heating/cooling systems into consideration, but we kept that in mind when looking at the graph.
3.1.4 Data Validation
In an attempt to validate the data we obtained, we compared it to other colleges’ data to see how much it deviated from theirs. We produced bar graphs which compared WPI’s average water usage per FTE to that of Princeton University and Dartmouth College. Both have a larger campus size and Princeton has a larger student body. We expected that both campuses would have a water use per FTE that was close to WPI’s. We also compared the average yearly water
22
usage measurements of WPI’s athletic buildings and Michigan State University’s athletic buildings using bar charts. The graphs can be found in Appendix F.
3.1.5 Challenges in Analysis
Although we attempted to analyze the data comprehensively, our data analysis was still subject to limitations. There was often inconsistent reporting of the monthly data by location, especially in the earlier years. Some buildings’ data were also more rounded than data for other buildings. Also, the data was counted on a monthly basis, preventing us from knowing how much water was used on specific days, which could lead to inaccurate interpretations of the data. For example, the water usage data in a specific month could appear to be low, but nobody knows whether leaks or equipment failures happened during that month since some water overuse problems could be fixed in one or two days. A month’s usage could also seem to be abnormal due to the water usage of a specific day. For example, family weekends, ceremonies, and student activities would affect water usage and occur irregularly. As a result, it would be more difficult both for us and our sponsors to find out the date of an incident to specify the causes of irregularities in data. 3.2 Objective 2: Reasons for High Water Usage
We wanted to effectively pinpoint the possible causes of high water usage in WPI locations so that we could give better recommendations to reduce water usage on campus. We conducted interviews with employees at each site as well as surveys for students to collect information that can be used to determine means of decreasing water usage.
Because of time constraints, we narrowed down the heavy users to five buildings: Project Center, Recreation Center, Boynton Hall, Daniels Hall and Founders Hall. We chose the Project Center and Boynton Hall because of their unusually high water usage considering the type of building they are; they are both office buildings. We chose the Recreation Center because it is one of the heaviest water consumers on campus, despite having water-conserving appliances. We chose Daniels Hall and Founders Hall because they are both high water-using residence halls. For these locations, we requested information about their fixtures from the Facilities Office and the Office of Sustainability.
For each of these 5 buildings, we attempted to estimate how much normal water usage would be. This consisted of estimating the number of people who use the building’s water facilities such as restrooms and water fountains, then using our knowledge of the buildings’ water fixtures (or requesting information if necessary) to estimate how much water they would use. For restrooms, this estimate was formed from the assumption that a certain percentage of students use a water fixture (faucets, toilets or showers) a certain number of times. We used this estimate to compare how much the building’s actual water usage is to a supposedly normal level of water usage. A similar estimate was made for water fountain usage. To have a more accurate estimate of water usage regarding students’ behaviors and effects of machinery, we conducted surveys and interviews for students and staff. 3.2.1 Surveys
For residence halls and the Recreation Center, we conducted student surveys on bathroom use behaviors, fixture use behaviors, and student attitudes towards water conservation.

23
This was intended to gain an estimate of the influence student behavior has on these buildings’ water usage and whether it correlates with student attitudes. Findings on correlations between student attitudes and behaviors assisted us in forming recommendations by providing us with data concerning students’ willingness for conserving water. Information on bathroom use may be intimate to students; as a result, it is possible that it would cause them distress if survey responses were publicly available or could be connected to them. We mitigated this risk by anonymizing survey responses. Surveys did not request any information that could have connected the response to the student. The survey also requested students for their explicit consent before receiving survey responses from them, letting them know how their response data will be handled and the risks of responding to the survey (Berg, Bruce L, 2007). We also refrained from displaying survey responses in our project report or in any other publicly available form. The questions for student surveys can be found in Appendix A.
3.2.2 Interviews
For Founders Hall, we tried to determine the amount of water used by dining services by interviewing the managerial staff of that building’s dining services. The purpose of this interview was to learn what water fixtures the dining services use and to gain an estimate of the amount and causes of their water consumption. This assisted us in estimating how much water dining services use. To learn more about WPI’s other buildings, we interviewed a contact in Facilities. We found these interviewees through snowball sampling, starting by asking our sponsors for contacts.
For these interviews, we used semi-structured interviews because they allowed us to ask a specific set of questions in order to gain certain information about a building’s water usage, while enabling us to ask for more details about interviewees’ answers if necessary (Berg, Bruce L, 2007). Since these interviews were meant to examine heavily consuming buildings more closely, we asked the interviewees about any findings from the first objective’s data analysis. We kept track of the names of our interviewees to make it easier to organize interview responses. In addition, we obtained written consent before beginning to interview them. Because we were unable to meet with them physically, this consent was in the form of a document emailed to our interviewees, which they consented to via email. The interview questions for dining services staff can be found in Appendix B.1. 3.3 Objective 3: Recommendations
Based on our research, we made recommendations to reduce WPI’s water usage as a deliverable, and in hopes that they will be adopted in order to improve WPI’s water management. To assist in ensuring a long-term decrease in WPI’s water consumption, we delivered these recommendations in the form of a plan to implement them. These recommendations varied depending on our findings from the usage data and interviews. We suggested both technological changes and social changes that would influence water usage behaviors of WPI’s population.
We suggested technological changes for our findings that revealed that fixture efficiency, usage, or malfunction led to increased water consumption. In suggesting such changes, we were mindful of costs to the university in implementing them. We gave stronger recommendations for changes that cost less to implement.
24
Students and faculty behavior is another leading factor in water conservation on campus. Like our technological recommendations, recommendations for behavioral changes were based on our findings, influenced by what we learned about the WPI population’s water usage. We used responses about students’ attitudes towards water conservation to guide our recommendations. For example, if students didn’t understand the importance of water conservation, we could suggest changes that would educate them about its importance. If students aren’t trying to conserve more water or don’t consider the issue important, we could suggest changes that would motivate them to conserve more water. Our recommendations tried to convey the environmental impact of water overuse to WPI’s population, because effects related to environmental health are more effective than cost related effects in influencing conservation behavior (Asensio & Delmas, 2016)(Peterson et. al. 2015).
We also considered trying to influence behavior by trying to emphasize the losses of not conserving water, conveying messages from and through sources viewers would perceive as credible, and trying to ensure viewers receive information interpersonally. According to a study at the University of California, using sources that viewers find credible, emphasizing loss, and using interpersonal mediums to transmit information increases the likelihood of lasting conservation behavior (Costanzo, Archer, Aronson, & Pettigrew, 1986). We also based our recommendations on other efforts to change behavior for conservation purposes, past behavioral changes implemented at WPI, and the success of those changes.
After preparing our suggestions, we turned to the Facilities Office and Office of Sustainability to inquire their thoughts on our proposed recommendations. If they did not approve of them or thought that something should have been added, we adjusted them accordingly. The end goal of this objective was the deliverables of this project, which were the recommendations themselves and a plan to implement these recommendations. Some of these recommendations were to install low-flow shower heads in residential halls, to separately meter water-using systems such as cooling towers, install more signage in residential halls informing students of ways to reduce their water usage, and to organize programs to encourage students to conserve more water in their residential halls. The findings of our project which influenced these recommendations are covered in the next section.

25
4. Results and Findings In this section, we cover the findings that resulted from our analysis of WPI’s water
usage. We started by taking a general assessment of the campus’s water usage as a whole, and then we attempted to find which categories of buildings were using the most water on campus. After that, we determined and took a close look at the buildings on campus that most heavily consumed water in order to find out reasons for their high water usage, using data analysis, interviews, and surveys. The information we gained from this investigation is outlined in this chapter. 4.1 Water Conservation Attitudes and Awareness
The survey we distributed to part of the WPI population provided us with insight on how students and staff feel about water conservation. We also learned how aware they are of various different conservation efforts by WPI.
According to the results, Respondents generally care about water conservation and try to conserve water. Ninety-three percent of respondents find water conservation to be at least moderately important, and about 76% of respondents make a moderate or small effort to conserve water. We also found that perceived effort differed between upperclassmen and first-year students. The average rating given for perceived effort by upperclassmen was 3.05/5, while that for first-year students was 2.73/5, which suggests upperclassmen make more of an effort to conserve water.
Upperclassmen were also more aware of WPI conservation efforts than first-year students were. 83.3% of upperclassmen respondents were aware of at least one of WPI’s conservation efforts, while only 62.5% of first-year respondents knew about any efforts. 22.26% of respondents were unaware of any of WPI’s water conservation strategies. The most unpopular of these was Faraday Hall’s water conserving sprinklers: 6.4% of respondents were aware of them, and only 4.8% of the building’s own residents knew about them. The water conservation strategies respondents were most familiar with were those implemented in the Recreation Center, likely because of the signage throughout the building that displays its strategies. 4.2 Water Usage of the WPI Campus
Despite decreases in water usage in the fiscal years 2017 and 2019, WPI’s water usage has experienced a net increase since 2015. WPI’s total yearly water usage is shown in Figure 4.1.
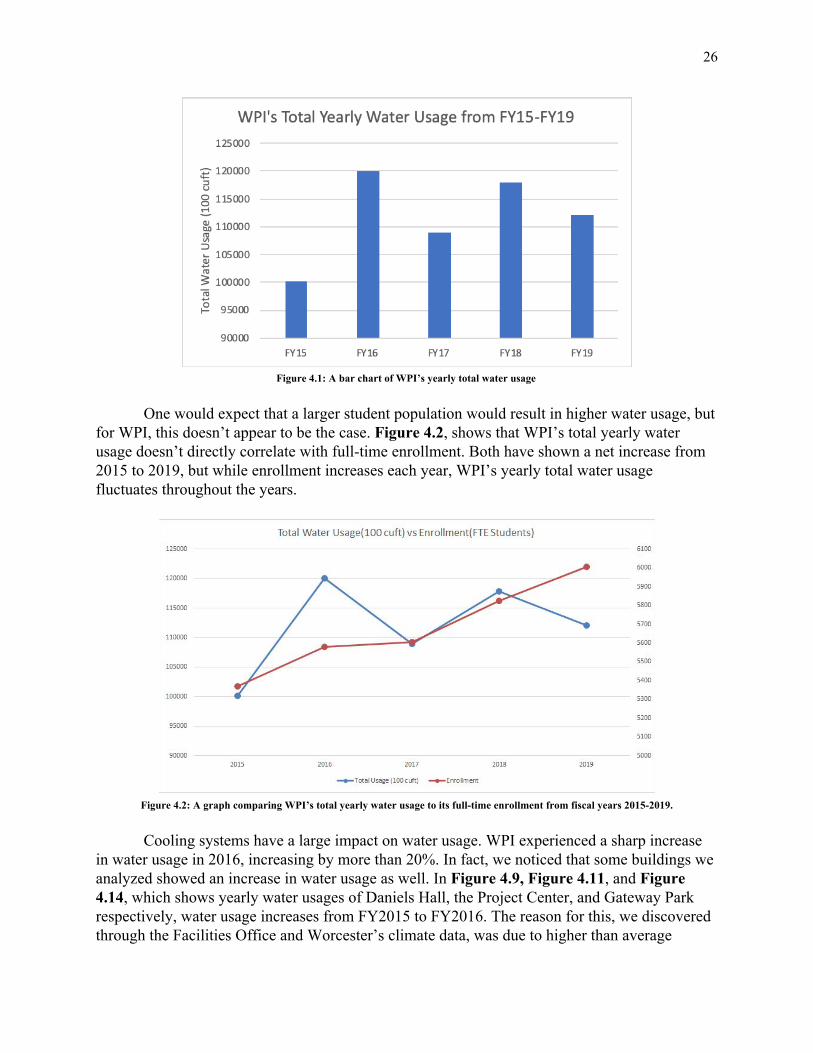
26
Figure 4.1: A bar chart of WPI’s yearly total water usage
One would expect that a larger student population would result in higher water usage, but
for WPI, this doesn’t appear to be the case. Figure 4.2, shows that WPI’s total yearly water usage doesn’t directly correlate with full-time enrollment. Both have shown a net increase from 2015 to 2019, but while enrollment increases each year, WPI’s yearly total water usage fluctuates throughout the years.
Figure 4.2: A graph comparing WPI’s total yearly water usage to its full-time enrollment from fiscal years 2015-2019.
Cooling systems have a large impact on water usage. WPI experienced a sharp increase
in water usage in 2016, increasing by more than 20%. In fact, we noticed that some buildings we analyzed showed an increase in water usage as well. In Figure 4.9, Figure 4.11, and Figure 4.14, which shows yearly water usages of Daniels Hall, the Project Center, and Gateway Park respectively, water usage increases from FY2015 to FY2016. The reason for this, we discovered through the Facilities Office and Worcester’s climate data, was due to higher than average

27
temperatures during that fiscal year (U.S. Climate Data, n.d.), leading to a higher level of operation by cooling systems. This finding conveyed the influence of WPI’s cooling systems on its water usage.
Overall, WPI uses more water during academic terms and less water during breaks. It appears that the most water on campus is used at the start of the school year, and the least amount of water is used during winter break. This is because, as shown by Figure 4.3, water usage tends to peak in September and is at its lowest in January. (It is important to remember that due to the times meters are read at, these months actually represent mid-August to mid-September and mid-December to mid-January, respectively.)
Figure 4.3: A line graph displaying WPI’s total monthly water usage for fiscal years 2015-2019
4.3 Water Usage of Specific Buildings on the WPI Campus
As part of our analysis, we attempted to find which buildings on campus used the most water on average. To do this, we found the top ten water consumers for each year and tallied the amount of times each building appeared in one of them. An example of the graphs used to carry this out is shown in Figure 4.4.
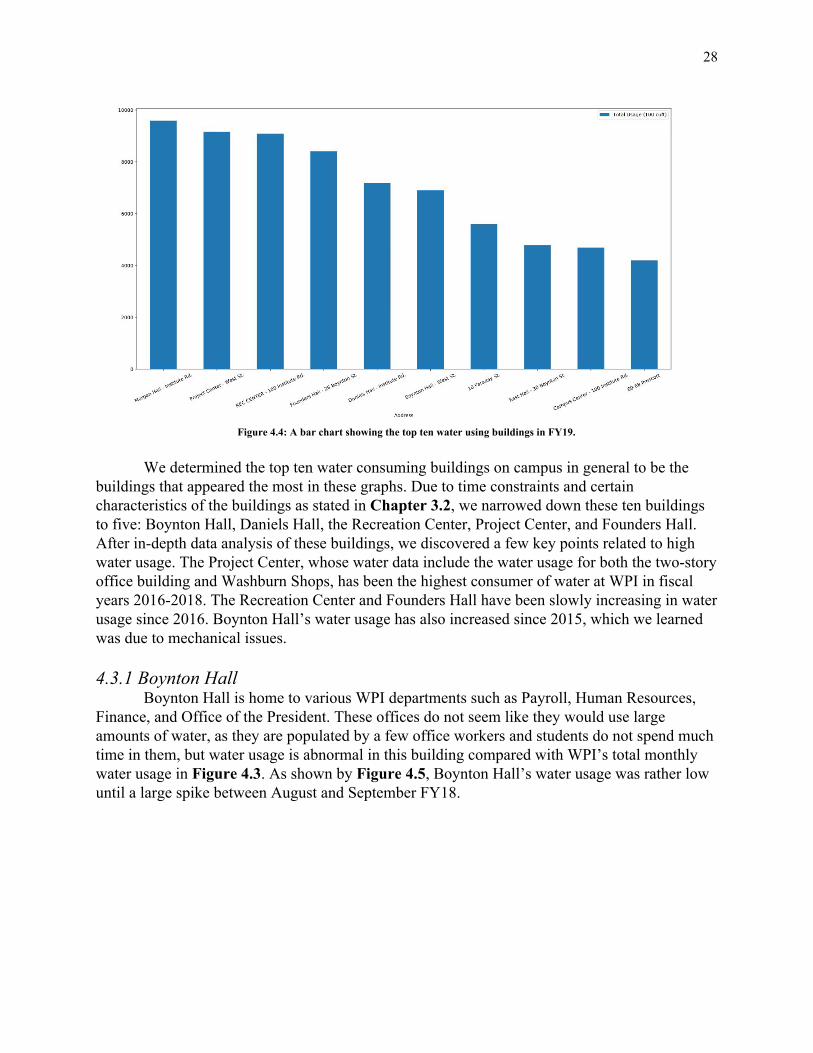
28
Figure 4.4: A bar chart showing the top ten water using buildings in FY19.
We determined the top ten water consuming buildings on campus in general to be the
buildings that appeared the most in these graphs. Due to time constraints and certain characteristics of the buildings as stated in Chapter 3.2, we narrowed down these ten buildings to five: Boynton Hall, Daniels Hall, the Recreation Center, Project Center, and Founders Hall. After in-depth data analysis of these buildings, we discovered a few key points related to high water usage. The Project Center, whose water data include the water usage for both the two-story office building and Washburn Shops, has been the highest consumer of water at WPI in fiscal years 2016-2018. The Recreation Center and Founders Hall have been slowly increasing in water usage since 2016. Boynton Hall’s water usage has also increased since 2015, which we learned was due to mechanical issues. 4.3.1 Boynton Hall
Boynton Hall is home to various WPI departments such as Payroll, Human Resources, Finance, and Office of the President. These offices do not seem like they would use large amounts of water, as they are populated by a few office workers and students do not spend much time in them, but water usage is abnormal in this building compared with WPI’s total monthly water usage in Figure 4.3. As shown by Figure 4.5, Boynton Hall’s water usage was rather low until a large spike between August and September FY18.

29
Figure 4.5: A line graph of Boynton Hall’s monthly water usage for fiscal years 2015-2019
Through our interviews, we learned that Boynton Hall’s apparent spike in usage was
because of two things: replacing the water meter and leaks. The old water meter was not reading correctly, and therefore the data that it recorded was lower than the actual water usage. Boynton Hall, being an old building, also has problems with leaks. Ideally, these leaky fixtures would be replaced with new ones, but it is currently more cost-effective to fix the old ones. Despite these leaks being fixed a few years ago, Boynton Hall’s water usage has continued to increase from FY18 to FY19, as seen by the yellow and magenta lines in Figure 4.5. We were unable to find a reason for this.
According to our estimates of water use due to restroom usage by employees in Boynton Hall, restroom usage makes up approximately 80% of Boynton Hall’s average monthly water usage. This estimate was made under the assumption that Boynton Hall’s water fixtures were older and had higher flow rates as a result, since the building was last renovated in 1978 (Worcester Polytechnic Institute, 2010), which was before the 1994 regulations on flow rates (Sharp, 1991). 4.3.2 Sports and Recreational Center
The Sports and Recreational Center is a multi-functional building composed of a fitness center, a swimming pool, and offices for staff and coaches. Water usage is complex in this building as it is affected by a combination of students’ behavior in restrooms and showers, the water supply system for the pool and rowing stations, and cooling and heating systems for the entire building. During the recent five years, we found that the water usage slightly increased
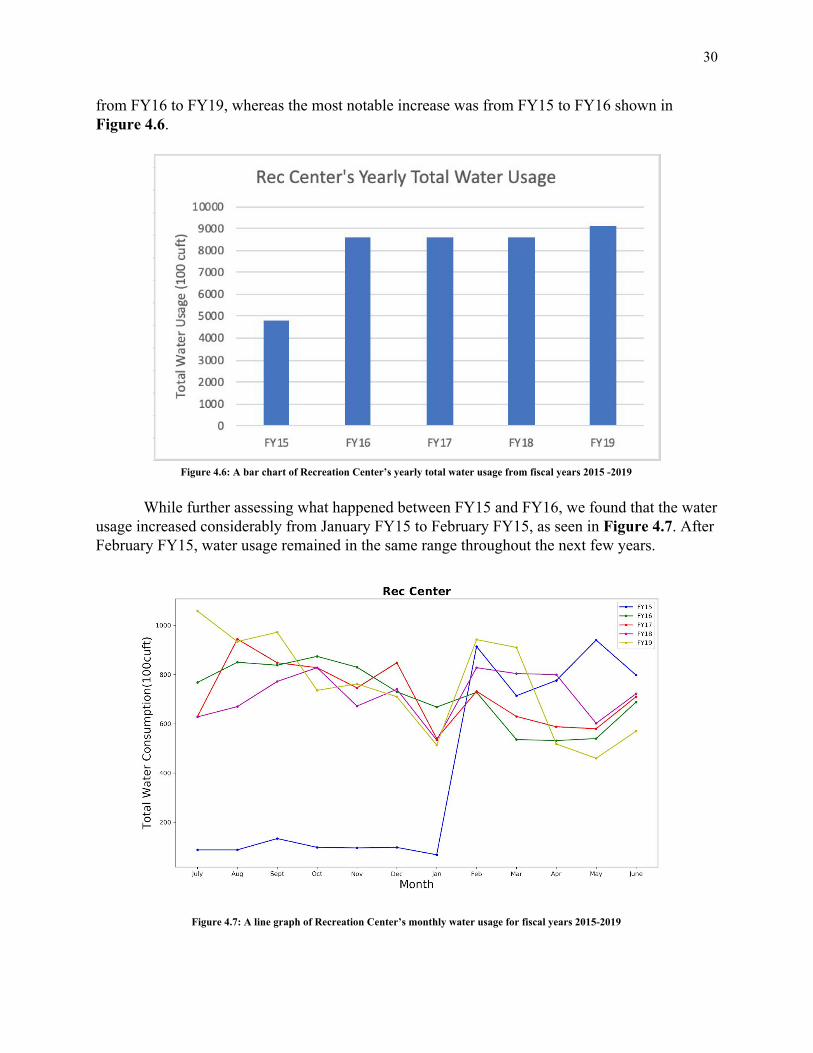
30
from FY16 to FY19, whereas the most notable increase was from FY15 to FY16 shown in Figure 4.6.
Figure 4.6: A bar chart of Recreation Center’s yearly total water usage from fiscal years 2015 -2019
While further assessing what happened between FY15 and FY16, we found that the water
usage increased considerably from January FY15 to February FY15, as seen in Figure 4.7. After February FY15, water usage remained in the same range throughout the next few years.
Figure 4.7: A line graph of Recreation Center’s monthly water usage for fiscal years 2015-2019

31
When we requested information about the causes of this increase from Facilities Office staff, we were told that around the time of the Recreation Center’s water usage increase, WPI stopped using the rainwater cisterns for the Recreation Center’s cooling tower. This showed the great amount of water that was saved by the rainwater cisterns before they were used for irrigation instead.
Our estimates of student water usage in the Recreation Center suggest that about 55% of the Recreation Center’s monthly water usage is used by student facilities (restrooms, showers, and water bubblers) during academic terms and about 11% is used by maintenance of the pool. Thus, only about 34% of the Recreation Center’s monthly water usage is used by its cooling towers and rowing stations. This seems to contradict the data we received; this is due to these percentages being rough estimates based on survey responses.
Another finding from our survey was that students do not shower in the Recreation Center as much as they do in their residence; 78.74% of respondents that use the Recreation Center said they did not shower there, and those that did shower there showered 3 times per week on average. The water fountains also were not used often by students: on average, they drank from water fountains once per week. The water refillers at the Recreation Center saw more usage, as 80.71% of Recreation Center users refilled water bottles at least once a week. 4.3.3 Residence Halls
The residential halls at WPI show varying levels of water usage per student from building to building. Figure 4.8 shows that the three residential buildings that consistently use the most water per student are Morgan Hall, Daniels Hall, and Founders Hall.
Figure 4.8: A line graph showing each undergraduate residence hall’s yearly water usage per student living there.
*assuming maximum capacity
About half of the respondents to our survey were students living on campus. Regarding
restroom and fixture usage, 85.40% of respondents living on campus wash their hands for 20 seconds or less, and 95.67% take 30 minutes or less to shower. On average, students showered in

32
their residence for 14.5 minutes, which is almost double of the average American showering time of 7.8 minutes (DeOreo, Mayer, Dzięgielewski, & Kiefer, 2016). 4.3.3.1 Daniels Hall
Daniels Hall is one of the largest residential halls in terms of water consumption per student, similar to Morgan Hall as seen above in Figure 4.8. We chose to focus on this building because, as Figure 4.8 shows, its water usage per student was greater than or equal to that of Morgan Hall’s for a few of the years studied. This is unusual, given the fact that Morgan Hall has more water usage potential due to its dining services. Figure 4.9 shows that Daniels has slightly lowered its water usage since 2015. During our interviews with Facilities Office staff, we were told that this decrease can partially be credited to the installation of low-flow shower heads in the building.
Figure 4.9: A bar chart of Daniels Hall’s yearly total water usage from fiscal years 2015 -2019
According to our estimations, students’ use of toilets, faucets, showers, and washing
machines in Daniels Hall make up about 44% of Daniels Hall’s water consumption per year. We were told from interviews that Daniels Hall contained two water heaters: one which ran continuously, and another that was used for backup. Therefore, we estimate that these water heaters and other mechanical systems in Daniels Hall make up the remaining 56% of Daniels Hall’s water consumption. 4.3.3.2 Founders Hall
Founders Hall is an undergraduate residence hall capable of housing up to 291 students and contains a small dining hall, called the Goat’s Head restaurant. We chose to look more closely at this building because its water usage has increased from 2016 to 2019, shown in Figure 4.10.
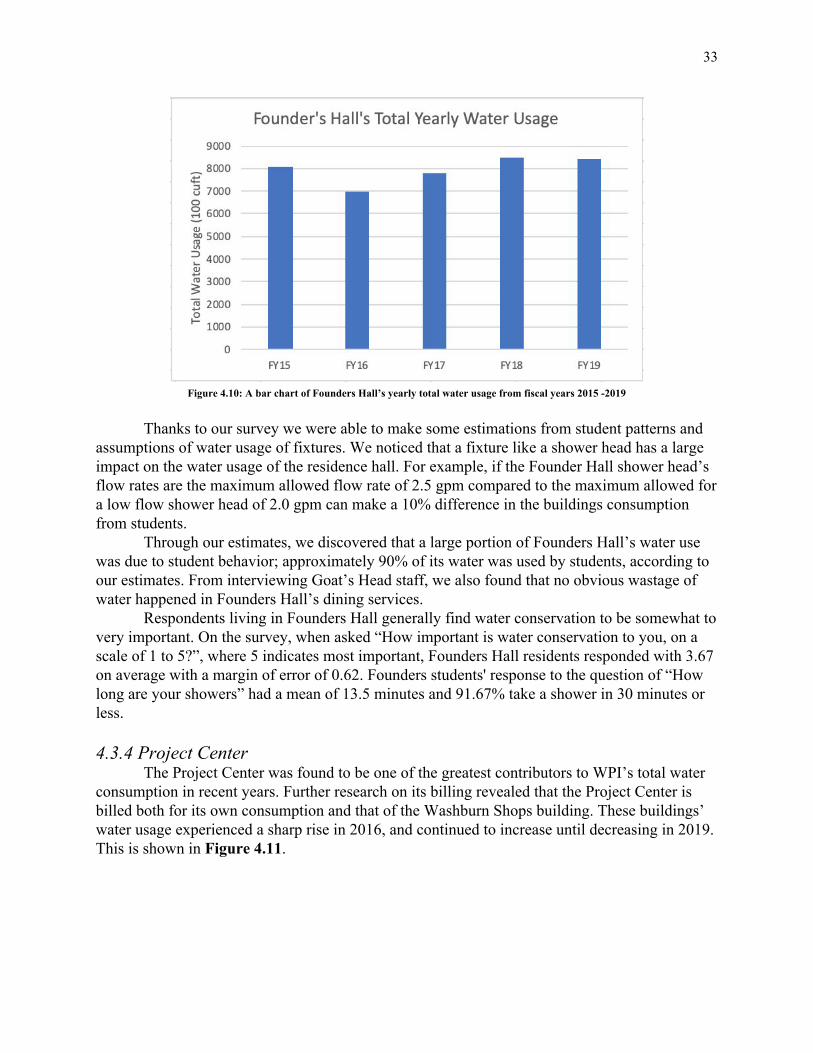
33
Figure 4.10: A bar chart of Founders Hall’s yearly total water usage from fiscal years 2015 -2019
Thanks to our survey we were able to make some estimations from student patterns and
assumptions of water usage of fixtures. We noticed that a fixture like a shower head has a large impact on the water usage of the residence hall. For example, if the Founder Hall shower head’s flow rates are the maximum allowed flow rate of 2.5 gpm compared to the maximum allowed for a low flow shower head of 2.0 gpm can make a 10% difference in the buildings consumption from students.
Through our estimates, we discovered that a large portion of Founders Hall’s water use was due to student behavior; approximately 90% of its water was used by students, according to our estimates. From interviewing Goat’s Head staff, we also found that no obvious wastage of water happened in Founders Hall’s dining services.
Respondents living in Founders Hall generally find water conservation to be somewhat to very important. On the survey, when asked “How important is water conservation to you, on a scale of 1 to 5?”, where 5 indicates most important, Founders Hall residents responded with 3.67 on average with a margin of error of 0.62. Founders students' response to the question of “How long are your showers” had a mean of 13.5 minutes and 91.67% take a shower in 30 minutes or less. 4.3.4 Project Center
The Project Center was found to be one of the greatest contributors to WPI’s total water consumption in recent years. Further research on its billing revealed that the Project Center is billed both for its own consumption and that of the Washburn Shops building. These buildings’ water usage experienced a sharp rise in 2016, and continued to increase until decreasing in 2019. This is shown in Figure 4.11.
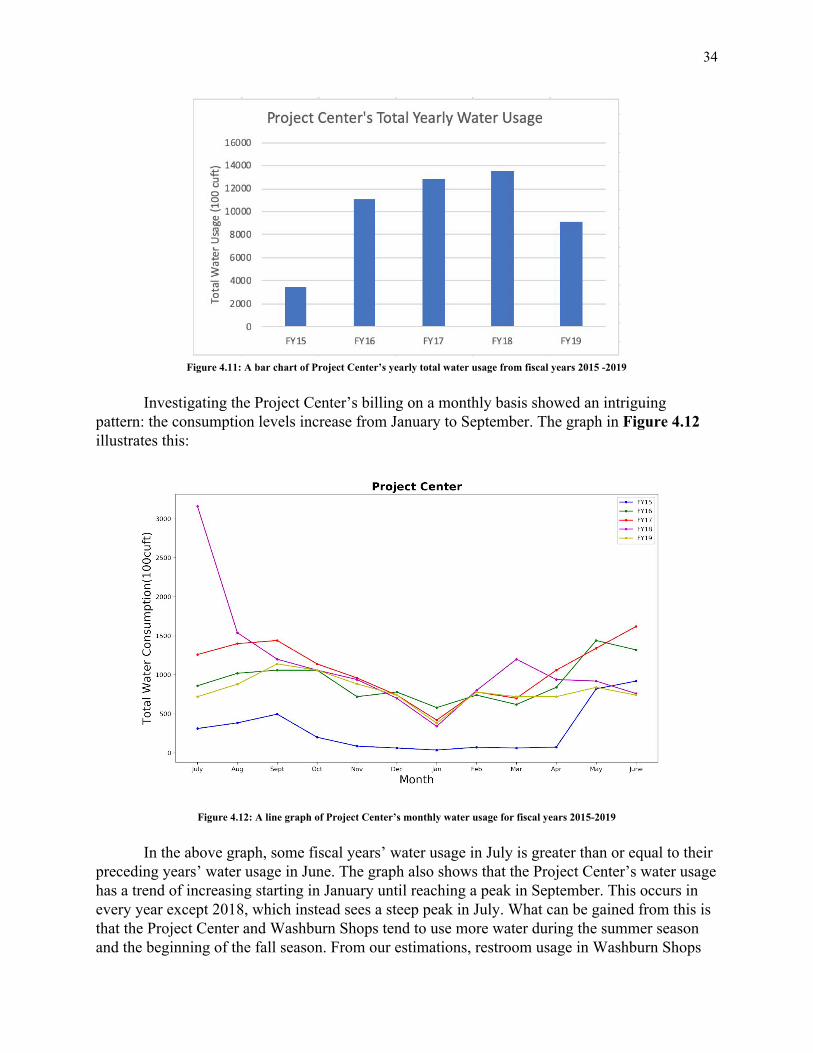
34
Figure 4.11: A bar chart of Project Center’s yearly total water usage from fiscal years 2015 -2019
Investigating the Project Center’s billing on a monthly basis showed an intriguing
pattern: the consumption levels increase from January to September. The graph in Figure 4.12 illustrates this:
Figure 4.12: A line graph of Project Center’s monthly water usage for fiscal years 2015-2019
In the above graph, some fiscal years’ water usage in July is greater than or equal to their
preceding years’ water usage in June. The graph also shows that the Project Center’s water usage has a trend of increasing starting in January until reaching a peak in September. This occurs in every year except 2018, which instead sees a steep peak in July. What can be gained from this is that the Project Center and Washburn Shops tend to use more water during the summer season and the beginning of the fall season. From our estimations, restroom usage in Washburn Shops

35
did not contribute much to the total water usage billed to these buildings. Our estimations found that on a yearly basis restroom usage makes up between 7%-14% of water consumption on average in Washburn Shops and the Project Center. We were told by Facilities Office staff that Washburn’s other water using appliances consisted of a cooling tower and laboratory equipment. We were not able to gain detailed information about the amount of water consumed by Washburn’s laboratory equipment, as our potential interviewees did not respond to us before the end of this project.
4.3.5 Other Buildings
Apart from our chosen five buildings, we also did some data analysis of all the buildings on campus. Figure 4.13 shows that academic buildings, undergraduate housing, and other buildings on campus used by students (such as the Recreation Center and the Campus Center) use the majority of WPI’s water, while other buildings use minimal water in comparison. This makes sense because they have the majority of interaction with the student population, which is the largest group on campus. Other buildings like faculty buildings interact with less people which in turn uses less water.
Figure 4.13: A line graph of each building’s total yearly water usage from fiscal years 2015-2019, categorized by type
4.3.5.1 Gateway Park Even though Gateway Park is in our top ten water users, its water usage has been
decreasing since FY 2016 (Figure 4.14) and has often used less water than residential halls. We decided that Gateway Park did not need our intervention, and instead chose other heavy water-using buildings to look at whose water usage increased or stayed the same in order to produce a more significant impact. We were told by Facilities Office staff that changes in tenants in Gateway Park could have caused this.

36
Figure 4.14: A bar chart of Gateway Park’s yearly total water usage from fiscal years 2015 -2019
4.3.5.2 Bartlett Center
The Bartlett Center experienced a spike in water usage by about 400% in FY 2019, as seen in Figure 4.15. We do not know the cause of this. We chose not to include it in our chosen five because, even with the spike, it is not a significant contributor to the campus’s water usage.
Figure 4.15: A bar chart of Bartlett Center’s yearly total water usage from fiscal years 2015-2019
4.3.5.3 Sprinklers
Most of WPI’s water data does not have sprinklers billed separately from their corresponding buildings. The sprinklers for the president’s house, 1 Drury Lane, and Faraday Hall, however, are billed separately, so we were able to view how much water these two sprinklers use. The sprinkler for 1 Drury Lane was found to consistently use more water than the

37
building itself, as seen in Figure 14.6. The large dip in FY17 is likely due to less frequent operation of the sprinkler during the Worcester drought that year.
Figure 4.16: A line graph comparing the yearly total water usage of 1 Drury Lane and its sprinkler for fiscal years 2015-2019
Even though Faraday Hall has water-conserving sprinklers, the sprinklers still consume a
great amount of water on a yearly basis, illustrated in Figure 4.17. Its yearly water consumption is greater than that of WPI’s smaller office buildings. A graph illustrating the yearly consumption of WPI’s various office buildings can be found in Appendix C, Figure C.4.
Figure 4.17: A line graph comparing the yearly total water usage of Faraday Hall and its sprinkler for fiscal years 2015-2019

38
4.4 Summary and Limitations
To summarize, our main findings from this project are as follows. WPI’s water usage has increased since 2015, but it is not correlated with enrollment. The most water is used on campus during the beginning of the school year, and the least is used during winter break. In general, buildings that students use the most often are likely to use the most water, except Washburn Shops and the Project Center. Washburn Shops and the Project Center together are one of the highest water users on campus. Given the nature of the buildings, it is likely that Washburn uses most of this water. Our estimates suggested that water utility usage played a significant role in the usage of residential buildings and Boynton Hall. In other buildings’ estimations, water utility usage by the building population did not make up much of the building’s total usage on average. Our surveys showed that students in general found water conservation important and tried to conserve it.
We have considered limitations which could affect the results and alternative actions that we could have taken regarding the data analysis. Some significant water usage problems could have occurred in the buildings other than the five buildings that we selected. Although preliminary data analysis for non-heaviest users reveals some of the problems, in-depth data analysis for all water-consuming buildings might be adequate to uncover and resolve all water usage problems. In addition, we were not able to enter any buildings to inspect the fixtures ourselves. WPI’s campus was closed as part of a safety response to a pandemic, and students were not allowed on campus.
There were also limitations in our surveys. As with all surveys, the views conveyed by the sample size of our surveys might not reflect the views and behaviors of the entire population. The survey would become more accurate on water usage behavior as we receive more survey results. It is also possible that students could have given inaccurate or biased accounts of their water usage or opinions of water conservation.
In addition, our interviews were subject to limitations as well. When one gains interviewees by asking someone about potential interviewees, one limits the pool of potential interviewees to those known by the person that they asked. The information we gained from interviews could also have been subject to interviewees’ personal opinions or biases. The information gained from interviews could have also been inaccurate if the interviewees themselves did not have accurate knowledge in certain areas. Also, we were not able to obtain all information planned from interviews as some potential interviewees did not contact us before the end of the project.
Our estimations were also subject to limitations. When information on fixtures’ flow rates was not available, they were based on assumptions about flow rates with respect to the building’s age. The estimates were also based on assumptions on behavior about fixture usage in restrooms, which could have been incorrect or greatly varied from person to person. In some cases, these behavioral assumptions were also estimated from survey responses.
39
5. Summary and Recommendations The analyses in this project provided a set of key findings as detailed in Chapter 4. These
findings provided information on WPI’s water usage and the heaviest water consumers on campus. From these findings, we were able to develop a set of recommendations of ways to reduce WPI’s water usage, the final objective and the deliverable of this project. In this chapter, we summarize the key findings and resulting recommendations. We more strongly recommend actions that cost less to implement and directly address the problems underscored by our key findings. Our findings suggest that both water-using appliances on campus and the behavior of WPI’s population contribute to water consumption. Therefore, we have provided technological recommendations, recommendations to promote behavioral change and a sustainability plan for implementing and promoting future water conservation efforts. 5.1 Key Findings
As outlined in the previous chapter, we made the following key findings during our project:
● Overall we found that in WPI, water usage will increase if the temperature rises as the HVAC system has a large impact on the water usage.
● The HVAC system in the Recreation Center used less than one third of the buildings’ total water usage.
● The Recreation Center previously used water from rainwater cisterns for its cooling tower, but switched to using city water instead. This led to a significant increase in its water consumption.
● From interviews, we found that the installation of low-flow shower heads led to a decrease in Daniels Hall’s water usage.
● Survey respondents were most aware of water conservation strategies in the Recreation Center, which displays its sustainability efforts throughout the building using signs.
● Our estimates of water used by students suggested that their usage made up a significant amount of residential halls’ water consumption.
● Our estimates suggested that restroom usage made up a small amount of Washburn Shops’ water consumption. We were not able to estimate how much water was used by laboratory equipment before the end of our project.
● The responses to our surveys showed that students generally find water conservation important and make efforts to conserve water.
● Our survey responses suggest that on average, upperclassmen are more aware of WPI’s conservation efforts and try harder to conserve water than first-year students.
● Survey respondents shower in their residence for a duration that’s almost double the average American shower duration.
5.2 Next Steps
Because of time constraints and being unable to physically be on WPI’s campus during this project, we were unable to carry out some actions. This section details the next steps that we believe should be carried out by the Facilities and Sustainability Offices or a future IQP team.
40
5.2.1 Further Research into Fixtures We were unable to determine the water consumption rates of mechanical systems,
heating systems, and cooling systems before the end of this project. Given that water usage by students and faculty in Washburn Shops doesn’t make up a significant amount of the building’s water consumption, it would be beneficial to find and record how much water these systems use in order to make attempts to reduce their water usage.
Additionally, it is a good idea to take a closer look at the fixtures of buildings that were constructed or last renovated before the 1994 regulations on the flow rates of faucets, toilets and showerheads (Sharp, 1991). This can be done by requesting records of their flow rates, or manually calculating flow rates if these are not available. If the fixtures in these buildings exceed federal regulations, they would be replaced with newer fixtures. Such buildings’ fixtures most likely have higher flow rates since they would have been manufactured before the regulations took effect. WPI would most benefit from this by focusing on residential buildings, since our findings suggest that a considerable amount of their consumption is due to students’ use of restroom fixtures. Boynton Hall and Washburn Shops should also be prioritized, since they both use a significant amount of water on campus and were last renovated before 1994. 5.2.2 Audit of Water-using Fixtures
In addition to further research on WPI’s fixtures, the Facilities Office could compile and keep records of all water-using appliances in each building and their rates of water usage, which the Office of Sustainability could access as needed. We suggest this because fixtures in some buildings might use more water than those in other buildings. Knowing what water-using appliances exist on campus and their rates of water usage makes it easier to find sources of water usage and to decrease water usage.
Water-using laboratory equipment could have made up a significant amount of Washburn Shops’ water consumption, but we were not able to obtain information about it due to time constraints. To gain information about water-using laboratory equipment for future use, there could be an audit of lab equipment at the end of every academic year. The Facilities Office can carry out this audit by contacting laboratory staff to obtain information about lab equipment water usage rates. Doing this will make it easier to make future estimations about the amount of water used by laboratory equipment. To keep records of appliances up to date, we suggest another audit of fixture changes at the end of every year as well. To achieve this, the Facilities Office can report to the Sustainability Office on a yearly basis about whether any fixtures have been replaced so that records can be updated. The Facilities Office can also post this information on its website. 5.2.3 A Platform for Feedback for Students and Faculties
In our survey, we allowed respondents to write comments on their water usage and conservation. Upon receiving responses, we realized that it would be helpful if students could easily make anonymous suggestions and comments to the Office of Sustainability, as many left the survey with useful information from distinct perspectives. In addition to good ideas, students also left complaints regarding the current and newly upgraded fixtures. Knowing students’ feelings about current sustainability efforts and ideas about new efforts would assist the Office of Sustainability in forming new sustainability efforts or adjusting current ones. In addition, it is possible to implement such a platform without spending too much time or money. The Office of
41
Sustainability can implement this by creating a survey that collects a comment from its respondent. It can use Qualtrics to do this, a service already available to WPI staff. The survey can be easily distributed through signage or emails. 5.3 Recommendations for Behavioral Change 5.3.1 Dorm Competitions
As an awareness raising effort, the Sustainability Office could organize a program to encourage residential students to use less water. We are proposing a program each semester which challenges students to use less water than their hall’s average usage by a certain percentage. The average usage can be calculated using the previous year’s water billings. If students successfully reduce their water usage by at least that amount by the end of the semester, all floors receive a prize, such as pizza. From our survey responses, students generally find water conservation at least “moderately important” and try at least “a little” to conserve water. They would be likely to be willing to try harder to conserve water, and offering a prize makes it more likely that they will. 5.3.2 Signs and Posters
Students were more aware of the water conservation strategies in the Recreation Center than they were of other ones, and the Recreation Center displays its water conservation strategies using signs. To raise the awareness of WPI water conservation efforts, WPI needs more visualizations or signages of water conservation efforts at WPI like the ones at the Recreation Center. First year students at WPI were less aware of WPI’s water conservation strategies and made less effort than upperclassmen to conserve water. Increased signage about WPI’s water conservation can help to increase their awareness and better promote water conservation among students.
Addressing students’ water use behaviors is also important, given that our survey responses showed that students’ showers last longer than the average American’s. The Sustainability Office can use signs to deal with this problem as well. Other signs can include ones indicating the amount of water that WPI and WPI residential halls consume and how an individual can lower their water usage, such as shortening shower durations. 5.3.3 Eco-reps
In previous years, the Sustainability Office organized the Eco-Reps program. It saw some success, but didn’t achieve enough outreach. The Sustainability Office already meets with leaders of student sustainability groups. Therefore, they could ask student sustainability leaders to use their own clubs to organize and carry out the Eco-Reps program jointly with the Sustainability Office. Given that the program led to a noticeable decrease in water usage in the past, it would be sensible to revisit it. 5.4 Technological Recommendations 5.4.1 Low-flow Shower Heads
Our estimate of students’ water use in Founders Hall shows that students make up 99.98% of its average monthly water usage if shower heads are operating at 2.5 gallons per
42
minute. This decreases to 72% if shower heads are instead operating at 1.5 gallons per minute, assuming that other factors such as shower time remain the same. Daniels Hall, which experienced a net decrease in water since FY15, recently implemented low-flow shower heads. Because of this, we recommend installing low flow shower heads in all residential halls, or, if there is not enough time and/or money to do so, install low flow shower heads in Founders Hall. While it is unlikely that students actually use almost 100% of Founders Hall’s water, our estimates show the likelihood that students use a significant amount of water in Founders Hall and the importance of flow rates in decreasing water usage. 5.4.2 Sprinkler Management
Some of our findings indicated that sprinkler malfunction can lead to significant water consumption. One comment from the survey indicated concern over the fact that the sprinklers tend to turn on right after or during rainfall, despite that they are equipped with moisture sensors. As stated in chapter 4.2.5, sprinkler systems of an office could be used almost as much as an office building on a regular basis. For this reason, sprinklers and their sensors should be regularly inspected for correct functioning if this is not already being done. Although we did not know about the other sprinklers’ data as the rest of the sprinklers were not billed separately from their respective buildings, it would still be useful to inspect those sprinklers as well. 5.4.3 Additional Water Meters
Some of our key findings underscored that cooling towers can use a considerable amount of water. The Recreation Center’s water usage spiked by more than 1500% after it started using city water instead of rainwater to supply its cooling tower. Washburn Shops also contains a cooling tower and, according to our estimates, restroom usage does not make up a large amount of its water consumption. However, we were unable to precisely determine how much water cooling towers used because most buildings only have one meter for an entire buildings’ water usage and others have one for sprinklers and one for the building. For this reason, we suggest locating removable, easily installable, realtime water meters for certain pipes such as those connected to cooling towers, assuming pipes are both available in the buildings and easily accessible. The use of these meters will allow the Facilities Office to more accurately determine specific portions of a building’s water consumption, making it easier to find which portions use the most water. 5.4.4 Quad Cisterns
We suggest a budget for filtering and chemically treating water supplied to the quad rainwater cisterns so that they can be used for the Recreation Center’s cooling tower once again. This is not a prioritized recommendation, considering that WPI suspended the reuse of the cisterns’ water for the cooling system due to the high costs of maintaining the water treatment system. However, this might also be a good project for future students who want to make a large impact. We suggest this because of the increase in the Recreation Center’s water usage after Facilities stopped using rainwater from the cisterns for cooling. This led to a change from about 480,000 cubic feet to about 860,000, an increase by 78%. The increase makes up at least 40% of the Recreation Center’s current average water usage. This implies that the cisterns saved a significant amount of the Rec Center’s water. Since the costs of replacing filters for the cisterns were too high for them to be used for the cooling tower, we suggest requesting the funds to do so

43
from the university so that it can be budgeted. A cost-benefit analysis can be conducted beforehand to determine whether using the cisterns for the cooling tower would be beneficial.
5.5 Recommended Sustainability Plan for Water Conservation
To better ensure a long-term decrease in WPI’s water usage, we recommend a plan for water conservation on campus that is outlined below. The plan outlines actions to be carried out on a yearly basis and actions to implement our recommendations over a 5 year period. 5.5.1 Yearly Actions
- Comparing the recorded water usage data to water bills to prevent typographical errors. - Request information about fixture changes from the Facilities Office to update existing
fixture records. - Analyze water usage data to see if any changes have occurred since the previous year,
either positive or negative. Pay special attention after fixture changes to ensure that the fixture changes brought about a decrease in water usage.
- Request information about water-using equipment from laboratory staff so that records can be updated.
- Inspect campus sprinklers to ensure correct function and fix all malfunctioning sprinklers. 5.5.2 For the Next 5 Years Year 1:
- Implement signage/posters informing students of WPI’s water conservation strategies. - Implement signage/posters on how much water WPI uses and how to reduce it (including
shortening shower duration) in residential halls. - Obtain, compile and record information about fixtures and their flow rates in all campus
buildings, requesting this information from the Facilities Office. Keep them together in a file.
- Start checking the flow rates of the fixtures in buildings that have been last renovated before 1994. We believe Boynton Hall and Washburn Shops would be good examples of buildings to start with, considering that both buildings heavily consume water compared to other buildings. Replace the fixtures with newer ones if their flow rates exceed regulations.
- Form plan to implement water conservation competitions in residential halls. Year 2:
- Continue checking older buildings’ fixture flow rates and replacing the fixtures if they exceed federal regulations.
- Replace all shower heads in residential buildings with low-flow shower heads if this has not been done already. We suggest prioritizing Founders Hall and the oldest residential buildings.
- Start planning to inspect mechanical systems in heavy water-consuming buildings. - Execute plan to implement water conservation competitions in residential halls. - Hold a water conservation competition and track the result

44
Year 3: - Inspect the mechanical systems and heating/cooling systems in the heavily-consuming
buildings we identified. This can either be done by the Facilities Office or by an IQP team.
- Continue checking older buildings’ fixture flow rates and replacing the fixtures if they exceed federal regulations.
- Meet with student sustainability leaders to request that they manage the Eco-Reps program.
Year 4:
- Continue checking older buildings’ fixture flow rates and replacing the fixtures if they exceed federal regulations.
- Perform cost-benefit analysis of replacing filters for the quad rainwater system. Year 5:
- If time and budget allows, install filters for the quad cisterns.
45
6. Conclusion This project provided an assessment of WPI’s overall domestic water usage and
recommended solutions and a plan for decreasing the institution's water consumption. Ultimately, we hope that the recommendations and plan we suggested lay a foundation for better water management for WPI. Because this was a student-led project which recommended ways students could influence water conservation at WPI, we also believe that this project will lead to students having an increasing role in campus sustainability. If the plans we suggested are carried out, the implications of this project will also make it easier for WPI to plan and carry out water conservation efforts in the future. Keeping records of all water-conserving appliances and their flow rates would contribute to quicker analyses of WPI’s water usage.
We also believe that other universities and any large facilities seeking to conserve more water will benefit from the findings and recommendations from this project. For example, our findings concerning buildings renovated before flow rate regulations took effect would be beneficial to facilities with older fixtures trying to reduce their water consumption. Our findings regarding cooling systems would also be relevant to facilities with more efficient fixtures that are trying to reduce their water usage.
Our project also provides further benefit to WPI by raising questions for further research. The precise amount of water used by cooling towers compared to the total water used by the buildings they are installed in is still unknown because of a lack of metering for them. This project was also unable to determine the amount of water used by laboratory equipment. This could be beneficial to investigate more closely, considering that restroom usage didn’t make up a significant amount of the water used by Washburn Shops, a building containing laboratories. During this project, we also didn’t have access to all water-using mechanisms on campus, so further research on the water used by any machinery not mentioned in this project would also be useful. Finally, since costs are of importance to our sponsors when implementing sustainability efforts, it would be worth analyzing how much money WPI would save by conserving water through the recommendations we made.
46
References American Society of Heating, Refrigerating and Air-Conditioning Engineers, Inc. (2016).
2016 ASHRAE handbook - heating, ventilating, and air-conditioning systems and equipment (I-P edition) American Society of Heating, Refrigerating and Air-Conditioning Engineers, Inc. (ASHRAE).
Anthony, T., Chloe, M., Feinstein, J., & Gantz, S.Residential buildings
. (). Retrieved from https://www.chapman.edu/campus-services/sustainability/_files/environmental-audit/pdfs/pdfs2014/residentialbuildings.pdf
Arnett, N. (2010). Michigan state university water supply and consumption report
Asensio, O. I., & Delmas, M. A. (2016). The dynamics of behavior change: Evidence from energy conservation doi:https://doi.org/10.1016/j.jebo.2016.03.012
Augustus, E. M. (2017). Drought in worcester declared over. Retrieved from http://www.worcesterma.gov/announcements/drought-in-worcester-declared-over
AWWA. (2017). Water conservation programs - A planning manual - manual of water supply practices M52 (2nd edition) American Water Works Association AWWA.
Berg, Bruce L. (Bruce Lawrence). (2007). Qualitative research methods for the social sciences (6th ed.). Boston: Pearson/Allyn & Bacon.
Brain, M., Bryant, C. W. & Elliott, S. (2011). How air conditioners work: Chilled-water and cooling-tower AC units
. Retrieved from https://home.howstuffworks.com/ac4.htm
City of Worcester.Colleges & universities | city of worcester, MA. Retrieved from http://www.worcesterma.gov/colleges-universities
Climate-Data.org.Worcester climate. Retrieved from https://en.climate-data.org/north-america/united-states-of-america/massachusetts/worcester-1738/
Copeland, C., & Carter, N. T. (2017). Energy-water nexus: The water sector’s energy use. Retrieved from https://fas.org/sgp/crs/misc/R43200.pdf
Costanzo, M., Archer, D., Aronson, E., & Pettigrew, T. (1986). Energy conservation behavior: The difficult path from information to action. American Psychologist, 41(5), 521-528. doi:10.1037/0003-066X.41.5.521
Couitt, S., Preucil, C., & Wong, A. (2014). Water sustainability at worcester polytechnic institute
Dartmouth College. (n.d.). History and traditions

47
. Retrieved from https://home.dartmouth.edu/life-community/explore-green/history-traditions
Dartmouth Sustainability. (2019). Water. Retrieved from https://public.tableau.com/profile/dartmouth.sustainability.data.hub#!/vizhome/WaterDartmouth/WATERDARTMOUTH
DeOreo, W., Mayer, P., Dziegielewski, B., & Kiefer, J. (2016). Residential end uses of water, version 2
. (). Retrieved from https://www.circleofblue.org/wp-content/uploads/2016/04/WRF_REU2016.pdf
Department of Land Resource Management.Swimming pools & water use. Retrieved from https://denr.nt.gov.au/__data/assets/pdf_file/0005/269330/WaterResNT_Factsheet_Swimming-Pools-CA.pdf
Drewnowski A, Rehm CD, Constant F. (2013). Water and beverage consumption among children age 4-13y in the united states: Analyses of 2005–2010 NHANES data. Nutr J,
EPA. (2013). Urinal. Retrieved from https://www.epa.gov/watersense/urinals
Facilities Office. (n.d.). Facilities office
Gammon, J. (2014). United states of bad hygiene and habits. Retrieved from https://today.yougov.com/topics/lifestyle/articles-reports/2014/07/14/united-states-bad-hygiene
Khan, S., Moliski, J., Yoshida, K., & Klein-Banai, C. (2016). Restroom water reduction potential at an urban university. Sustainability: The Journal of Record, 9(6), 295-304. doi:10.1089/sus.2016.29073.sk
Matt Giovanisci. (2020). Parts of a pool: Essential knowledge for pool care. Retrieved from https://www.swimuniversity.com/parts-of-pool/
Office of Sustainability.Campus operations. Retrieved from https://www.wpi.edu/offices/sustainability/campus-operations
Office of Sustainability. (2016). Living sustainably on the WPI campus
Peters, M. J. (2018). 3 types of cooling systems and how they work
. Retrieved from https://sensorex.com/blog/2018/02/21/how-cooling-towers-work/
Petersen, J. E., Frantz, C. M., Shammin, M. R., Yanisch, T. M., Tincknell, E., & Myers, N. (2015). Electricity and water conservation on college and university campuses in response to national competitions among dormitories: Quantifying relationships between behavior, conservation strategies and psychological metrics. PLoS ONE, 10 Retrieved from

48
https://link.gale.com/apps/doc/A437664529/PPPC?u=mlin_c_worpoly&sid=PPPC&xid=1fc6fc3d
phila.gov.Gallons used per person per day. Retrieved from https://www.phila.gov/water/educationoutreach/Documents/Homewateruse_IG5.pdf
Princeton Office of Sustainability. (2014). Highlights of sustainability at princeton
San Diego County Water Authority. (2009). Technical information for cooling towers . (). San Diego, CA: Retrieved from https://www.sdcwa.org/sites/default/files/files/water-management/recycled/techinfo-cooling-towers.pdf
Sarbu, I., & Sebarchievici, C. (2017). In Sarbu I., Sebarchievici C.(Eds.), Chapter 5 - solar water and space-heating systems Academic Press. doi:https://doi.org/10.1016/B978-0-12-811662-3.00005-0
Energy policy act of 1992
, (1991). Retrieved from https://www.congress.gov/bill/102nd-congress/house-bill/776/text/enr
Sustainability Office, Worcester Polytechnic Institute.Sustainable WPI. Retrieved from https://www.wpi.edu/offices/sustainability/sustainable-wpi
Todd C. Frankel. (2015). New NASA data show how the world is running out of water. Retrieved from https://www.washingtonpost.com/news/wonk/wp/2015/06/16/new-nasa-studies-show-how-the-world-is-running-out-of-water/
U.S. Climate Data. (n.d.). Climate worcester - massachusetts and weather averages in worcester
. Retrieved from https://www.usclimatedata.com/climate/worcester/massachusetts/united-states/usma0502
United States Census Bureau. (2019). QuickFacts: Worcester city, massachusetts. Retrieved from https://www.census.gov/quickfacts/worcestercitymassachusetts
United States Environmental Protection Agency. (2005). Laboratories for the 21st century: Best practices. Retrieved from https://www.nrel.gov/docs/fy05osti/36743.pdf
University of Illinois at Chicago. (2020). About
. Retrieved from https://uic.edu/about
Wakelin, S. A., Colloff, M. J., & Kookana, R. S. (2008). Effect of wastewater treatment plant effluent on microbial function and community structure in the sediment of a

49
freshwater stream with variable seasonal flow. Applied and Environmental Microbiology, 74(9), 2659-2668. doi:10.1128/AEM.02348-07
Worcester Polytechnic Institute. (a). Facilities office. Retrieved from https://www.wpi.edu/offices/facilities-office
Worcester Polytechnic Institute. (b). Sustainability. Retrieved from https://www.wpi.edu/offices/sustainability
Worcester Polytechnic Institute. (c). Trades services. Retrieved from https://www.wpi.edu/offices/facilities/trades-services
Worcester Polytechnic Institute. (2010). WPI tech bible
Worcester Polytechnic Institute. (2012). WPI sustainability plan
. Worcester, MA, 01609: Worcester Polytechnic Institute.
WPI Athletics.Sports & recreation center. Retrieved from athletics.wpi.edu
WPI Athletics. (2020).
WPI Institutional Research. (2020). Enrollment. Retrieved from https://public.tableau.com/profile/wpi.institutional.research#!/vizhome/Enrollment_15718046316670/Story1
WPI Office of Sustainability.Sustainable WPI. Retrieved from https://www.wpi.edu/offices/sustainability/sustainable-wpi
50
Appendices Appendix A. Student Survey Questions The following survey is part of a Water Resource Outreach Center (WROC) IQP to find ways of reducing water usage at WPI. This survey aims to collect information about students' water usage in residential buildings & Recreation Center as well as their feelings about water conservation. We plan to use the responses to this survey to gauge how WPI's water usage may be affected by student behavior, and to gain an understanding of students' knowledge and attitudes towards water conservation. Responses to this survey are anonymized, meaning that no personal information will be stored along with survey responses. In addition, we will not display survey responses in any publicly available form. This survey contains 6-17 questions. Estimate time to complete: 1-3 mins. Before continuing to take this survey, please check the box below as a form of consent for us to use your response for the purposes of this project. ⌧By checking this box, I agree for my responses to be used for estimating students' water consumption and student attitudes towards water conservation. I know that my responses will be anonymous. How important is water conservation to you, on a scale of 1 to 5? 1 represents little importance, while 5 represents great importance.
● 1 - It is not important to me ● 2- It is barely important to me ● 3 - It is somewhat important to me ● 4 - It is very important to me ● 5 - It is extremely important to me
How much of an effort do you make to conserve water, on a scale of 1 to 5? 1 represents a small amount of effort, while 5 represents a great amount of effort.
● 1 - I don’t think about it ● 2 - I try a little ● 3 - I make a moderate effort ● 4 - I make a great effort ● 5 - I make every effort
51
We would like to gain a better understanding of student water usage behavior in buildings with high water consumption. We have identified the Recreation Center as one of these buildings. The following questions relate to water usage in the Recreation Center. Do you go to the Recreation Center for exercise/team practices/PE classes?
● Yes, for exercise and/or practice ● Yes, for gym class only ● No
Do you participate as part of sports team at WPI?
● Yes ● No
How often do you shwer in the Recreation Center?
● More than 6 times a week ● 6 times a week ● 5 times a week ● 4 times a week ● 3 times a week ● 2 times a week ● Once per week ● Less than once per week ● I don't shower in the Recreation Center
For how long do you shower in the Recreation Center?
● 1-5 minutes ● 5-10 minutes ● 10-30 minutes ● 30 minutes to an hour ● Longer than an hour
How often do you use the restroom facilities at the Recreation Center?
● More than 6 times a week ● 6 times a week ● 5 times a week ● 4 times a week ● 3 times a week ● 2 times a week ● Once per week ● Less than once per week ● Never
How often do you refill water bottles while at the Recreation Center?
● More than 6 times a week ● 6 times a week ● 5 times a week

52
● 4 times a week ● 3 times a week ● 2 times a week ● Once per week ● Less than once per week ● Never
If you do not refill water bottles, how many times do you drink from the water fountain?
● More than 6 times a week ● 6 times a week ● 5 times a week ● 4 times a week ● 3 times a week ● 2 times a week ● Once per week ● Less than once per week ● Never
If there are any more details about your water usage in the Recreation Center, please tell us below. ______________________________________________________________________________________________________________________________________________________________________________________________________________________________ We have also found that residential buildings use a significant amount of water on campus. The following questions relate to water usage in residential buildings. Please state your residence from A to C term this year.
● I lived on campus ● I lived off campus in a fraternity/sorority ● I lived off campus in an apartment/other living arrangement
If you live on campus, where do you live?
● Daniels Hall ● Morgan Hall ● Riley Hall ● Institute Hall ● Stoddard Complex ● Founders’ Hall ● East Hall ● Messenger Hall ● Fuller Apartments ● Ellsworth Apartments ● Faraday Hall
53
● Salisbury Estates ● Other
How many times do you use the restroom in your residence each day?
● Less than 2 ● 2-4 ● 4-6 ● More than 6
If you live off campus, how many times do you use the restroom on campus each day?
● Less than 2 ● 2-4 ● 4-6 ● More than 6
How long does it usually take for you to wash your hands?
● 10 seconds ● 20 seconds ● 30 seconds ● Shorter than 10 seconds ● Longer than 30 seconds
Approximately how long are your showers?
● 5 minutes or less ● 5-10 minutes ● 10-30 minutes ● 30-50 minutes ● More than 50 minutes
How many times do you shower in your residence per week?
● 7 days a week ● 5-6 days a week ● 3-4 days a week ● 1-2 days a week ● Less than 1 day a week
Do you have any further comments or details that could help us better understand your water usage? If so, please list them here. ______________________________________________________________________________________________________________________________________________________________________________________________________________________________ Of the following water conservation efforts made by WPI, please indicate the ones you are aware of.

54
● Low-flow shower heads installed in Recreation Center and other buildings ● Water conserving toilets, faucets or showers in Recreation Center restrooms ● Collection system to reuse rainwater for irrigation in the Quad ● Water conserving irrigation at Faraday Hall ● Ensuring new construction is LEED-certifiable
Do you have any other suggestions or concerns about water use at WPI that you would like to share? If so, please list them here. ______________________________________________________________________________________________________________________________________________________________________________________________________________________________
55
Appendix B. Interview Questions B.1 Dining Staff Member
1. What fixtures or machinery of Founders Hall’s dining services use water? 2. When does each of these fixtures or machinery get used the most? 3. Do you have any information about the amount of water used by each fixture (such as a
flow rate, or rate of water consumption)? a. If not, who would? Would we be able to receive this information?
4. Which fixtures do you predict would consume the most water? 5. Could we get the model number of said fixtures? 6. Are there any measures in place in the kitchen to conserve water? 7. Is the amount of drinks or amount of water taken from the soda machine recorded, if so
would we be able to receive that information? 8. Does the kitchen have its own bathroom(s)?
a. How often is it used? 9. How much of an influence do students have on the Goat’s Head’s water usage? 10. Do you have a record of how many students use Goats Head?
B.2 WPI Facilities Chief Engineer
1. Why did the Recreation Center spike in water usage in February FY15? 2. Do you know of any potential contacts we can interview about the water usage of:
a. Washburn Shops/Project Center b. Daniel’s Hall c. Founder’s Hall d. Recreation Center
3. Does the Recreation Center have any water-using fixtures other than the 3rd/4th floor locker rooms/bathrooms, water fountains, and the pool?
4. How much do you think it would cost to fix the leaks in Boynton Hall? 5. Do you know which building's water data the power plant’s connected to? 6. Gateway Hall’s water usage has been consistently decreasing since FY2015. Do you
know any possible reasons why? 7. Does WPI use a district heating system, or do any buildings have their own central
heating? 8. Does the power plant have a cooling tower?
a. Do any of the power plant’s heating and cooling systems consume water? i. If so, do you have any model info for the machinery?
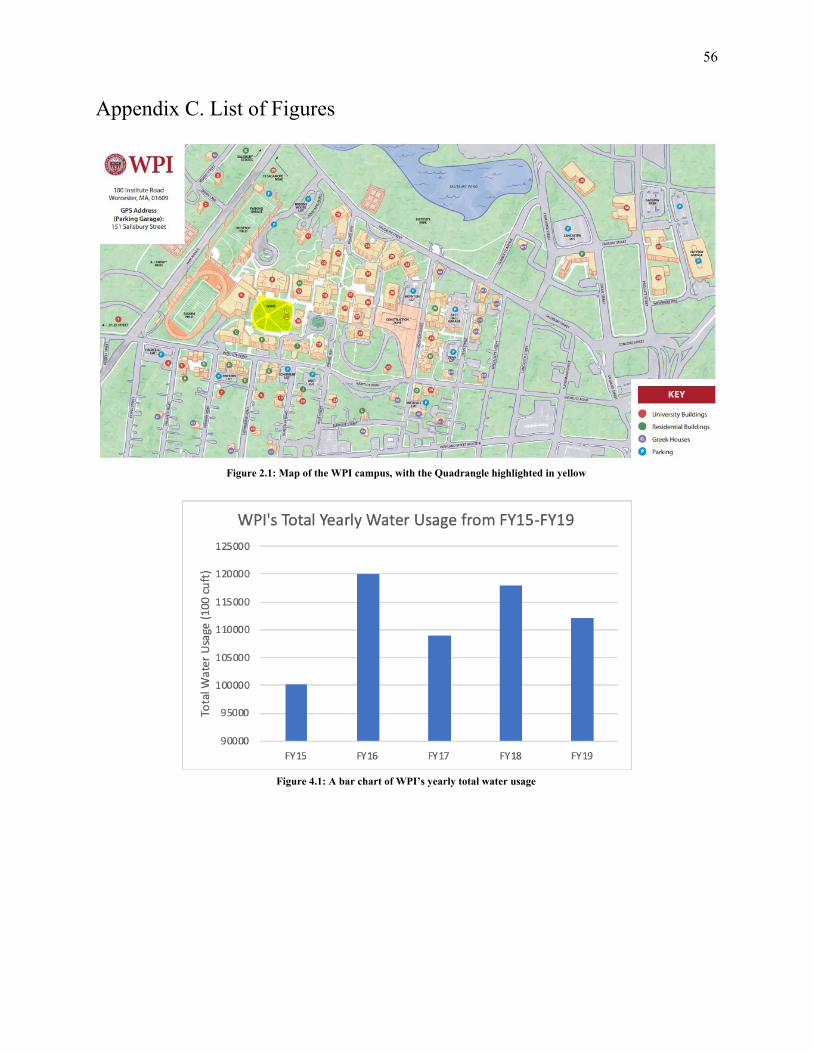
56
Appendix C. List of Figures
Figure 2.1: Map of the WPI campus, with the Quadrangle highlighted in yellow
Figure 4.1: A bar chart of WPI’s yearly total water usage

57
Figure 4.2: A graph comparing WPI’s total yearly water usage to its full-time enrollment from fiscal years 2015-2019.
Figure 4.3: A line graph displaying WPI’s total monthly water usage for fiscal years 2015-2019
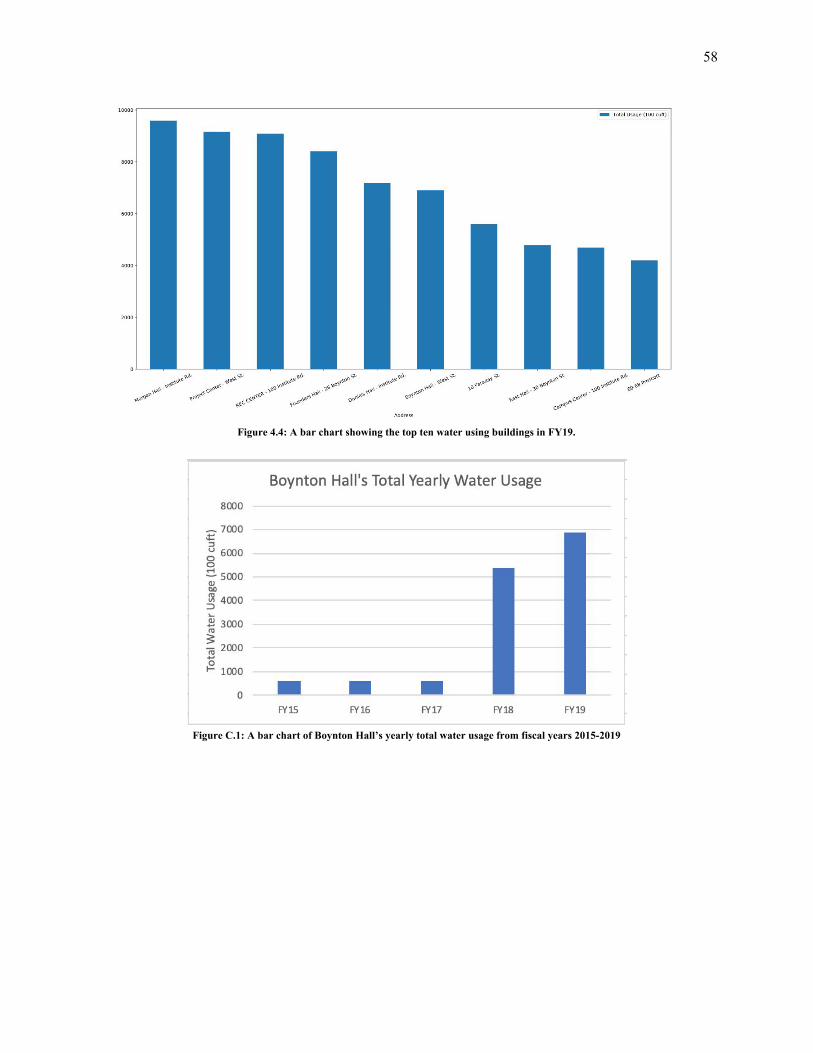
58
Figure 4.4: A bar chart showing the top ten water using buildings in FY19.
Figure C.1: A bar chart of Boynton Hall’s yearly total water usage from fiscal years 2015-2019

59
Figure 4.5: A line graph of Boynton Hall’s monthly water usage for fiscal years 2015-2019
Figure 4.6: A bar chart of Recreation Center’s yearly total water usage from fiscal years 2015 -2019
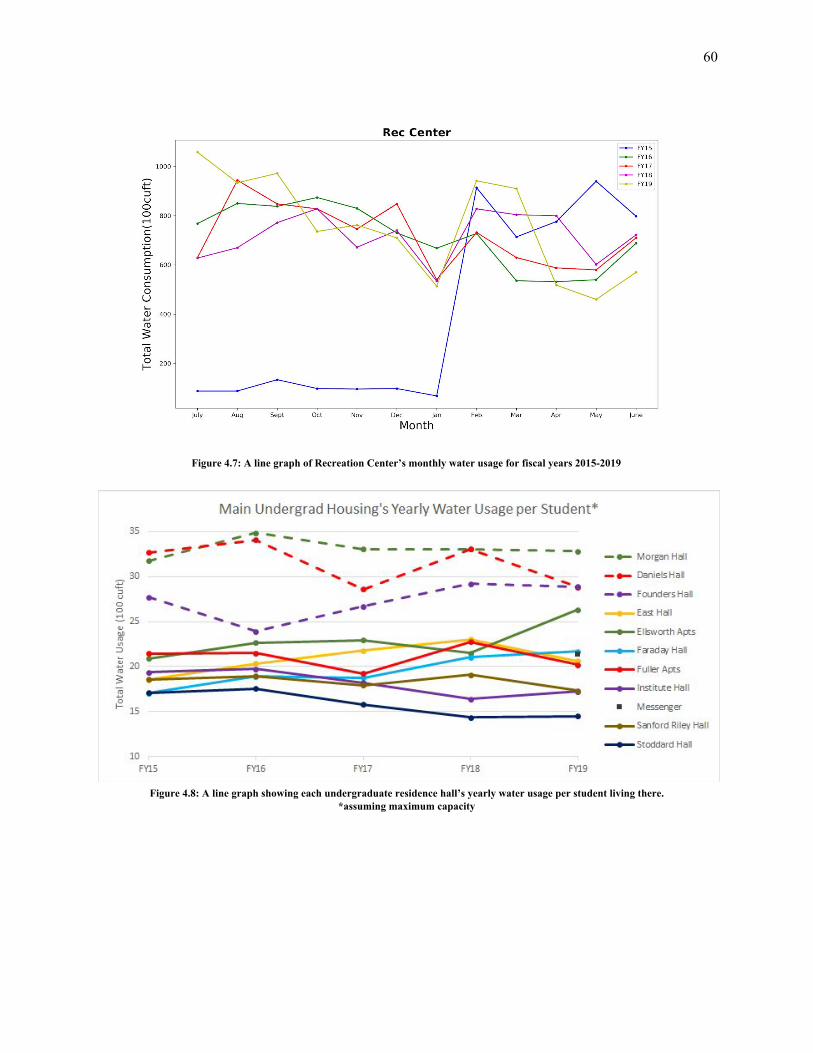
60
Figure 4.7: A line graph of Recreation Center’s monthly water usage for fiscal years 2015-2019
Figure 4.8: A line graph showing each undergraduate residence hall’s yearly water usage per student living there.
*assuming maximum capacity

61
Figure 4.9: A bar chart of Daniels Hall’s yearly total water usage from fiscal years 2015 -2019
Figure C.2: A line graph of Daniels Hall’s monthly water usage for fiscal years 2015-2019

62
Figure 4.10: A bar chart of Founders Hall’s yearly total water usage from fiscal years 2015 -2019
Figure C.3: A line graph of Founders Hall’s monthly water usage for fiscal years 2015-2019
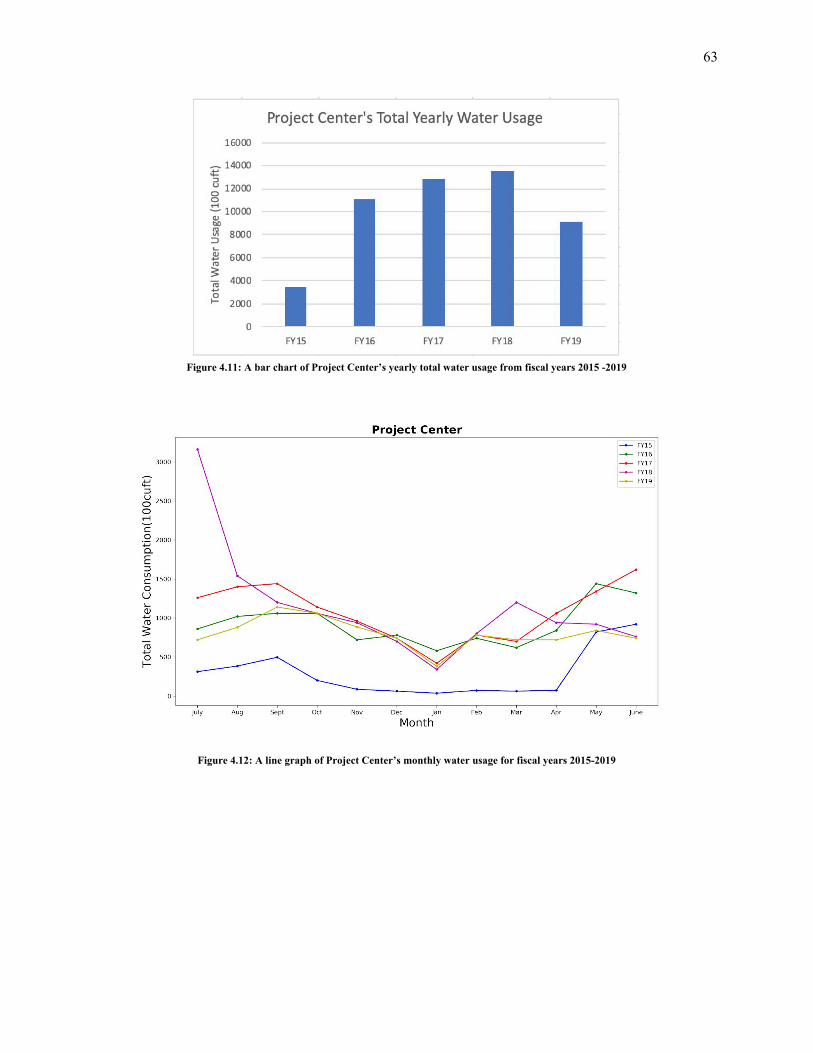
63
Figure 4.11: A bar chart of Project Center’s yearly total water usage from fiscal years 2015 -2019
Figure 4.12: A line graph of Project Center’s monthly water usage for fiscal years 2015-2019

64
Figure 4.13: A line graph of each building’s total yearly water usage from fiscal years 2015-2019, categorized by type
Figure 4.14: A bar chart of Gateway Park’s yearly total water usage from fiscal years 2015 -2019

65
Figure 4.15: A bar chart of Bartlett Center’s yearly total water usage from fiscal years 2015-2019
Figure 4.16: A line graph comparing the yearly total water usage of 1 Drury Lane and its sprinkler for fiscal years 2015-2019
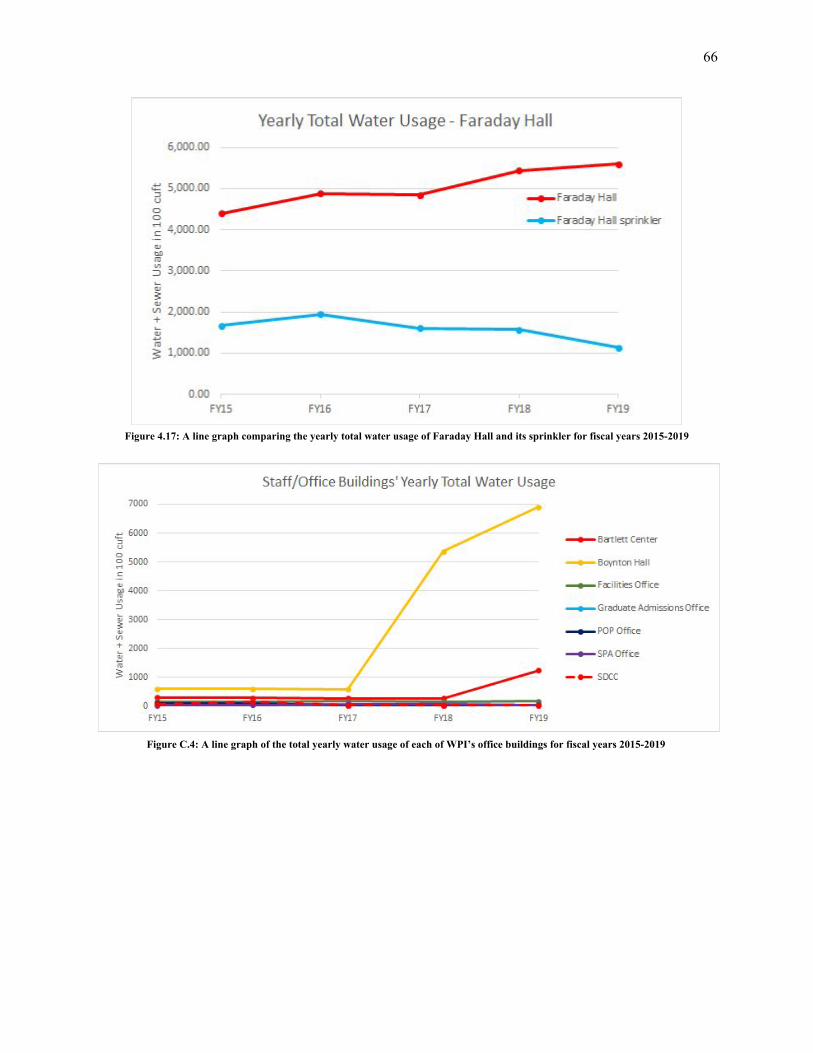
66
Figure 4.17: A line graph comparing the yearly total water usage of Faraday Hall and its sprinkler for fiscal years 2015-2019
Figure C.4: A line graph of the total yearly water usage of each of WPI’s office buildings for fiscal years 2015-2019

67
Appendix D. Estimation Procedures D.1 Washburn Shops and the Project Center We made the estimation based on the following assumptions:
● Students use the bathroom in Washburn between classes. We assumed certain percentages of the classrooms’ total occupancy used the bathrooms. These percentages were 10%, 20%, 30%, 40%, and 50%.
● Because the building was renovated before faucet and toilet flow rate regulations, we assumed 3.6 gallons per flush for toilets and 3 gallons per minute for a faucet’s flow rate (No average for older faucets could be found. We decided to use 3 gpm because the building was last renovated before 1994 and 3 gpm it is slightly more than the flow rate mandated by federal law, which is 2.2 gpm.)
● Classes ran from 8AM-5PM, and each class was an hour long. This means students from the classes would be coming into the bathroom 9 times per day.
● Each person used the toilet and washed their hands each time they used the restroom. ● Faculty were present in the building every working day of the year. They used the
Washburn’s restroom 4 times per day (People use the restroom about 6-7 times per day on average. We assumed that they used the bathroom 7 times per day and used Washburn’s restroom half of the times.)
● Each person washed their hands for 20 seconds (We used this because in our survey results, students washed their hands for 20 seconds on average.)
● Bathroom water usage by students per day = (flow rate of faucet * average handwashing time * percentage of students * 9) + (gallons per flush * percentage of students * 9)
● Faculty water usage per day = (flow rate of faucet * average handwashing time * number of faculty in building * 4) + (gallons per flush * number of faculty in building * 4)
D.2 Daniels Hall We made the estimation based on the following assumptions:
● Daniels Hall had maximum occupancy. ● Each resident’s handwashing duration, shower duration, showers per week, restroom use
frequency were the average amounts from survey responses. ● The toilets’, faucets’, and shower heads’ flow rates were those mandated by federal
regulations. ● Students used the restrooms and showers at the same frequency each week. ● We could not find an average for the number of loads of clothes each week and the
frequency at which people wash their clothes. Therefore, we assumed each student had 2 loads of clothes each week and washed their clothes once per week.
● Showers water usage per week = (shower gpm * average shower time * average showers per week * occupancy of building)
● Restrooms water usage per day = (faucet gpm * average handwashing time * average restroom trips per day * occupancy of building) + (toilet gpm * average restroom trips per day * occupancy of building)
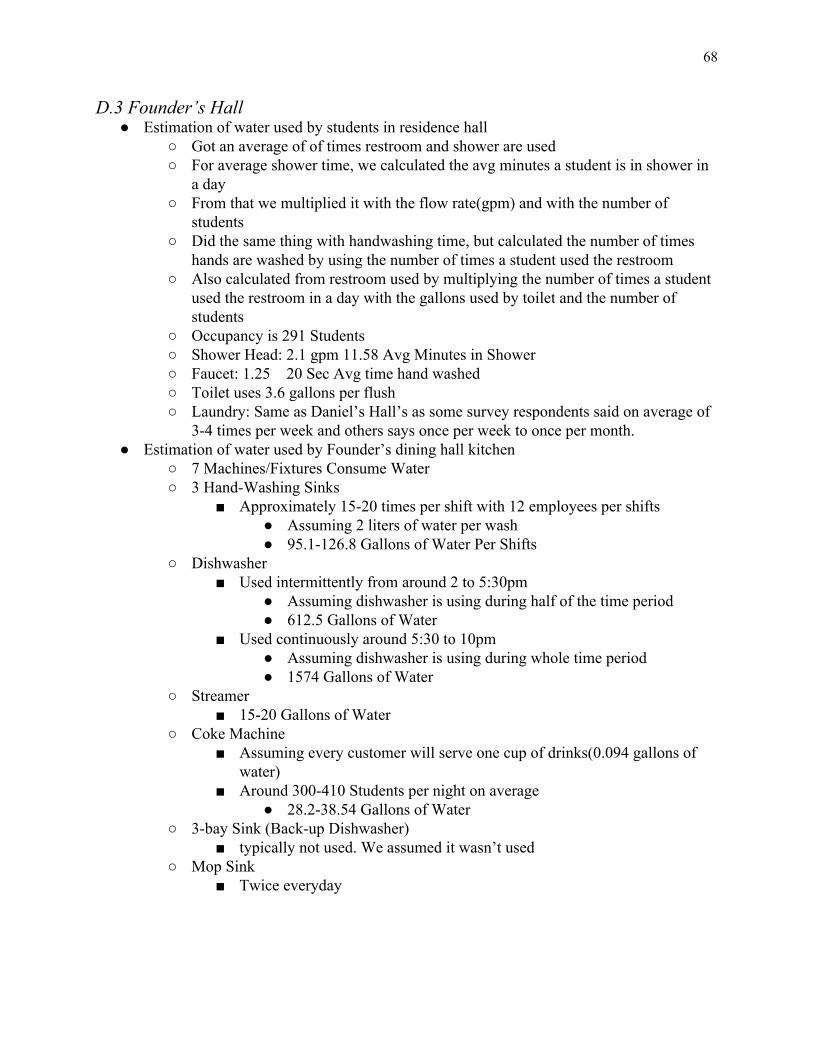
68
D.3 Founder’s Hall ● Estimation of water used by students in residence hall
○ Got an average of of times restroom and shower are used ○ For average shower time, we calculated the avg minutes a student is in shower in
a day ○ From that we multiplied it with the flow rate(gpm) and with the number of
students ○ Did the same thing with handwashing time, but calculated the number of times
hands are washed by using the number of times a student used the restroom ○ Also calculated from restroom used by multiplying the number of times a student
used the restroom in a day with the gallons used by toilet and the number of students
○ Occupancy is 291 Students ○ Shower Head: 2.1 gpm 11.58 Avg Minutes in Shower ○ Faucet: 1.25 20 Sec Avg time hand washed ○ Toilet uses 3.6 gallons per flush ○ Laundry: Same as Daniel’s Hall’s as some survey respondents said on average of
3-4 times per week and others says once per week to once per month. ● Estimation of water used by Founder’s dining hall kitchen
○ 7 Machines/Fixtures Consume Water ○ 3 Hand-Washing Sinks
■ Approximately 15-20 times per shift with 12 employees per shifts ● Assuming 2 liters of water per wash ● 95.1-126.8 Gallons of Water Per Shifts
○ Dishwasher ■ Used intermittently from around 2 to 5:30pm
● Assuming dishwasher is using during half of the time period ● 612.5 Gallons of Water
■ Used continuously around 5:30 to 10pm ● Assuming dishwasher is using during whole time period ● 1574 Gallons of Water
○ Streamer ■ 15-20 Gallons of Water
○ Coke Machine ■ Assuming every customer will serve one cup of drinks(0.094 gallons of
water) ■ Around 300-410 Students per night on average
● 28.2-38.54 Gallons of Water ○ 3-bay Sink (Back-up Dishwasher)
■ typically not used. We assumed it wasn’t used ○ Mop Sink
■ Twice everyday
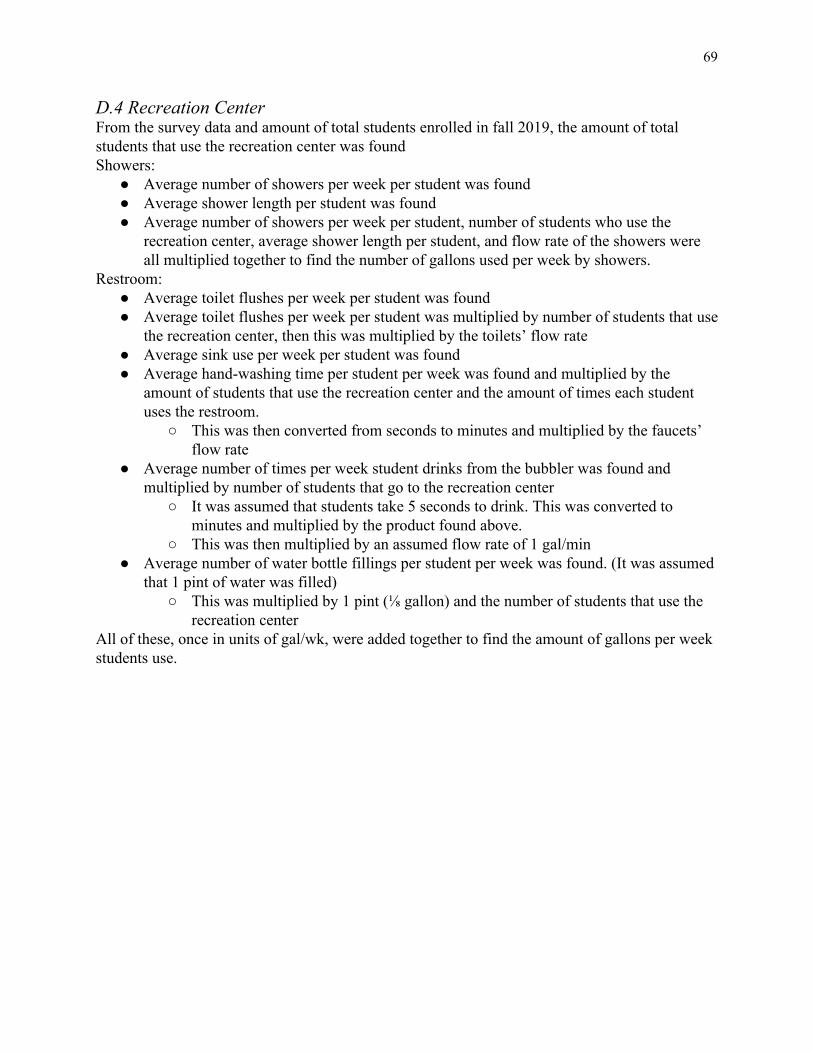
69
D.4 Recreation Center From the survey data and amount of total students enrolled in fall 2019, the amount of total students that use the recreation center was found Showers:
● Average number of showers per week per student was found ● Average shower length per student was found ● Average number of showers per week per student, number of students who use the
recreation center, average shower length per student, and flow rate of the showers were all multiplied together to find the number of gallons used per week by showers.
Restroom: ● Average toilet flushes per week per student was found ● Average toilet flushes per week per student was multiplied by number of students that use
the recreation center, then this was multiplied by the toilets’ flow rate ● Average sink use per week per student was found ● Average hand-washing time per student per week was found and multiplied by the
amount of students that use the recreation center and the amount of times each student uses the restroom.
○ This was then converted from seconds to minutes and multiplied by the faucets’ flow rate
● Average number of times per week student drinks from the bubbler was found and multiplied by number of students that go to the recreation center
○ It was assumed that students take 5 seconds to drink. This was converted to minutes and multiplied by the product found above.
○ This was then multiplied by an assumed flow rate of 1 gal/min ● Average number of water bottle fillings per student per week was found. (It was assumed
that 1 pint of water was filled) ○ This was multiplied by 1 pint (⅛ gallon) and the number of students that use the
recreation center All of these, once in units of gal/wk, were added together to find the amount of gallons per week students use.
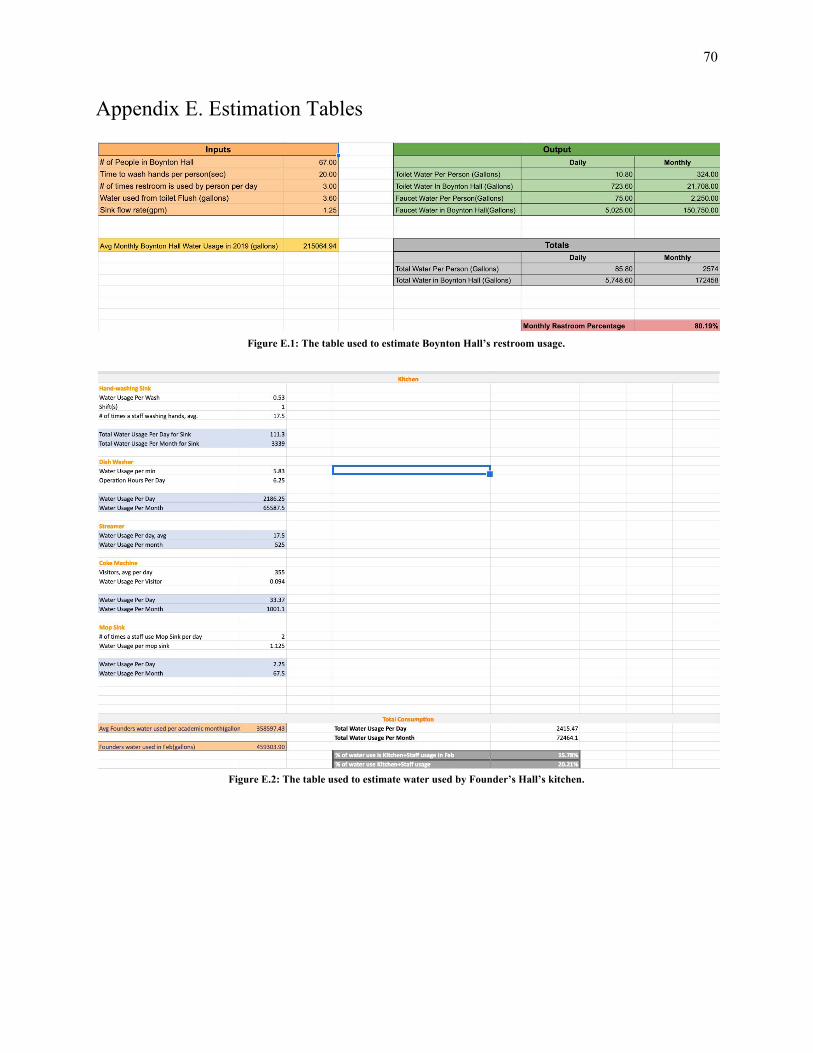
70
Appendix E. Estimation Tables
Figure E.1: The table used to estimate Boynton Hall’s restroom usage.
Figure E.2: The table used to estimate water used by Founder’s Hall’s kitchen.
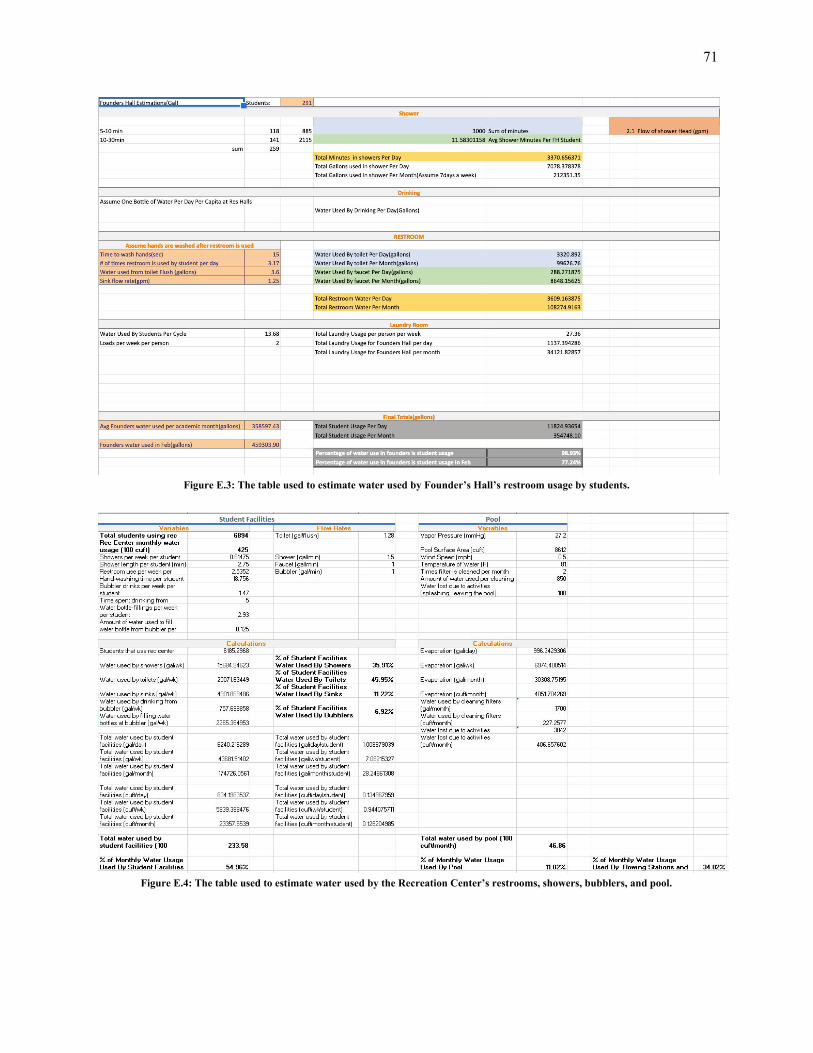
71
Figure E.3: The table used to estimate water used by Founder’s Hall’s restroom usage by students.
Figure E.4: The table used to estimate water used by the Recreation Center’s restrooms, showers, bubblers, and pool.

72
Figure E.5: The table used to estimate water used by students and faculty in Washburn Shops.
Figure E.6: The table used to estimate water used by students in Daniels Hall.

73
Appendix F. Comparison of Water Usage to other Universities
Figure F.1: A bar chart comparing WPI’s water usage per student with that of Dartmouth and Princeton’s
Figure F.2: A bar chart comparing the water usage of WPI’s athletic building and MSU’s athletic buildings
Water data for Dartmouth College was retrieved from: https://public.tableau.com/profile/dartmouth.sustainability.data.hub#!/vizhome/WaterDartmouth/WATERDARTMOUTH (Dartmouth Sustainability, 2019)

74
Water data for Princeton University was retrieved from: https://sustain.princeton.edu/sites/g/files/toruqf176/files/2019-12/Sustainability%20Highlights%20Brochure_2014.pdf (Princeton Office of Sustainability, 2014) Water data for Michigan State University was retrieved from: https://d.lib.msu.edu/etd/878/datastream/OBJ/view (Arnett, 2010)